Article

Morphology, Mineralogy, and Chemistry of Atmospheric Aerosols Nearby an Active Mining Area: Aljustrel Mine (SW Portugal)

1
Department of Earth Sciences, University of Coimbra, 3004-531 Coimbra, Portugal
2
Department of Physics, University of Beira Interior, 6201-001 Covilhã, Portugal
3
Institute Dom Luiz (IDL), University of Lisbon, 1250-096 Lisbon, Portugal
4
Atmospheric Optics Group, University of Valladolid, 47011 Valladolid, Spain
5
Centre for Earth, Space Research of the University of Coimbra, 3004-531 Coimbra, Portugal
*
Author to whom correspondence should be addressed.
Atmosphere 2021, 12(3), 333; https://doi.org/10.3390/atmos12030333
Submission received: 30 January 2021 / Revised: 20 February 2021 / Accepted: 26 February 2021 / Published: 5 March 2021
(This article belongs to the Special Issue Optical and Electron Microscopy for Particulate Matter)

Abstract

:
Mining activities increase contaminant levels in the environment, so it is crucial to study the particulate matter in these areas to understand the impacts on nearby urban areas and populations. This work was conducted close to the active mine of Aljustrel (Portugal), where black dust deposition is evident. PM10 samples were collected in two periods: 10–17 July and 1–10 November of 2018. Two different techniques were used: SEM-EDX for the individual characterization of the aerosols and ICP-MS to quantify the elemental concentration of 11 elements (Ca, Na, Fe, Mn, As, Cd, Cu, Sb, Pb, and Zn). In this region, the observed PM10 mass concentration was 20 to 47 µg m −3 (July) and 4 to 23 µg m−3 (November), which is lower than the limit of 50 μg m−3 established in the European Directive. The individual characterization of 2006 particles by SEM-EDX shows oxides (17%) and sulfides (10%), while Na, Si, Fe, S, Al, and Cu are the elements with the most representativeness in all the analyzed particles. The ICP-MS results indicate that the daily elemental concentration in the samples collected in July is higher than November, and only As exceeds the limit established for European legislation.

1. Introduction

Atmospheric particles have diverse natural and anthropogenic sources. Mining activities related to the extraction and processing of sulfides have a high potential risk to the environment and human health because the dust produced in these activities may contain high, dangerous levels of metals and metalloids, which may travel long distances [1]. Therefore, it is imperative to understand how the particulate material (PM) influences nearby rural and urban areas.
Mining areas have severe environmental impacts due to large mine waste dumps, soil and water pollution, and dust emissions [2]. Dust emissions in mine sites are generally associated with different operations: drilling and blasting, loading and dumping, draglines, crushing and preparation, conveyors, haulage roads, and storages piles [3]. Normally, most of these operations produce coarse dust, but fine and ultrafine particles can also be emitted (smelting and slag dumps) [1]. This contamination does not only occur when the mines are active. Abandoned areas without frequent remediation or rehabilitation also represent a danger due to their accumulated pollutants on the mine waste deposits or contaminated soils [4,5,6,7]. These pollutants can be further dispersed by wind erosion, which is a very rapid transport (hours or days) since air masses have a faster rate [5,8]. Contaminant concentration and particle size influence the magnitude of the mining impact. Coarse particles are generally associated with short transport, while fine particles can travel long distances [1]. However, contaminant composition and concentration also influence their dispersion.
Human health in mining areas is also compromised via the inhalation, ingestion, and dermal contact of particles with significantly elevated levels of one or more contaminants, such as Hg, Pb, As, and Cr [1,5]. Coarse and fine particles resulting from the resuspension of mine waste or from actual operations can be deposited in different parts of the respiratory system and absorbed into the bloodstream depending on their bioavailability [8]. Some trace elements contained in these atmospheric particles are highly toxic, non-biodegradable, and bioaccumulative. Besides these particles, some geogenic minerals are also known to have health implications, such as quartz, clay, and carbonate [9]. Consequently, the continuous exposure of the people that work in mining areas or live nearby can generate health problems in the short or long-term.
At the Aljustrel village, over the years, the mining industry increased the heavy metal concentrations in different systems, such as soils (As, Ba, Cd, Pb, Hg, Zn), sediments from water (Pb, Zn, Cu, As, Sb, Fe, P, Cr, V) and surface waters (Fe, Al, Mn, Co, Cu, As, Sb, Ni) [10,11,12], which led to the classification of this region as having a high potential for environmental hazards [10,13]. Furthermore, an ore processing plant has released dust that settles on pavements, ceilings, windowsills, and plant leaves, forming a black layer on all surfaces, especially in the summer, which has caused concern in the population. Unfortunately, no information is available about atmospheric particles here. For this reason, we decided to conduct a study to contribute with details on PM characterization in this active mining area. Therefore, the present work objectives were: (1) individual characterization of PM10, (2) quantification of the potential toxic elements (PTE), and (3) ascertaining the mining industry (old and actual) contribution.

2. Study Area

Aljustrel village, located in the Beja district (SW of Portugal), has a Mediterranean hot summer (Csa) climate, with mean temperatures of 17 °C (49 °C in summer) and an annual mean precipitation of 450 mm [14]. In 2011, the village had about 9300 inhabitants (INE, 2012), with a density of 20 km−2. The mining industry is the main local activity, and all the others are small factories and workshops. Agriculture and livestock are other activities developed in this region. Beja is the nearest town (NE), located about 31 km away (as the crow flies).
Aljustrel mine is one of the active mining complexes of the Iberian Pyrite Belt (IPB) (Figure 1). The IPB is a metallogenic province hosting the largest concentration of volcanogenic massive sulfide (VMS) deposits in the world [15]. The Volcanic Sedimentary Complex (VSC) in its lower part is mainly composed of shales, volcanogenic sedimentary rocks, rhyolites, rhyodacites, dacites, basalts, dolerites, and the volcanogenic massive sulfide deposits, which may be covered by a jasper/chert layer, while the upper part is composed of black, purple and other shales and volcanogenic/volcanoclastic rocks with associated Mn-oxide mineralization [16]. The VSC unit is covered by the Baixo Alentejo Flysch Group (BAFG), a turbiditic sedimentary sequence with sandstone, conglomerate, and limestone lenses.
In the Aljustrel region, six orebodies (>200 Mt) are identified: Moinho, Feitais, Estação, Gavião, Algares, and S. João [15]. Their mineralogy is predominantly pyrite (FeS2), with minor concentrations of sphalerite (ZnS), chalcopyrite (CuFeS2), galena (PbS), tetrahedrite ((Cu,Fe)12Sb4S13)), arsenopyrite (FeAsS), bornite (Cu5FeS4), pyrrhotite ((Fe1-XS [X = 0–0.17])), cassiterite (SnO2) and sulfosalts [13]. Here, the mining activity goes back to the Roman era, where the Algares and S. João masses were exploited for copper and minor silver production. In the 19th century, Algares, Feitais, and Moinho were exploited at the surface and underground galleries to produce pyrite, roasted pyrite concentrates, and copper. During this time, some small Mn-Fe mines were active to produce pyrolusite concentrates. This extensive exploitation produced a significant environmental impact due to the high amounts of tailings (vol. 5 Mt) distributed on the surface and exposed to the weather (Figure 1), which promoted their oxidation and mobilization to soils and waters. For this reason, in 2005, EDM started a rehabilitation program that has already been concluded [14]. Nowadays, the mining is underground and the works are developed at the Feitais and Moinho orebodies, which are constrained by the environmental normative imposed by the EU and National Portuguese Legislation. However, at the time this study was carried out, the ore processing plant was not yet fully sealed, allowing the release of dust.

3. Materials and Methods

3.1. Sampling Collection

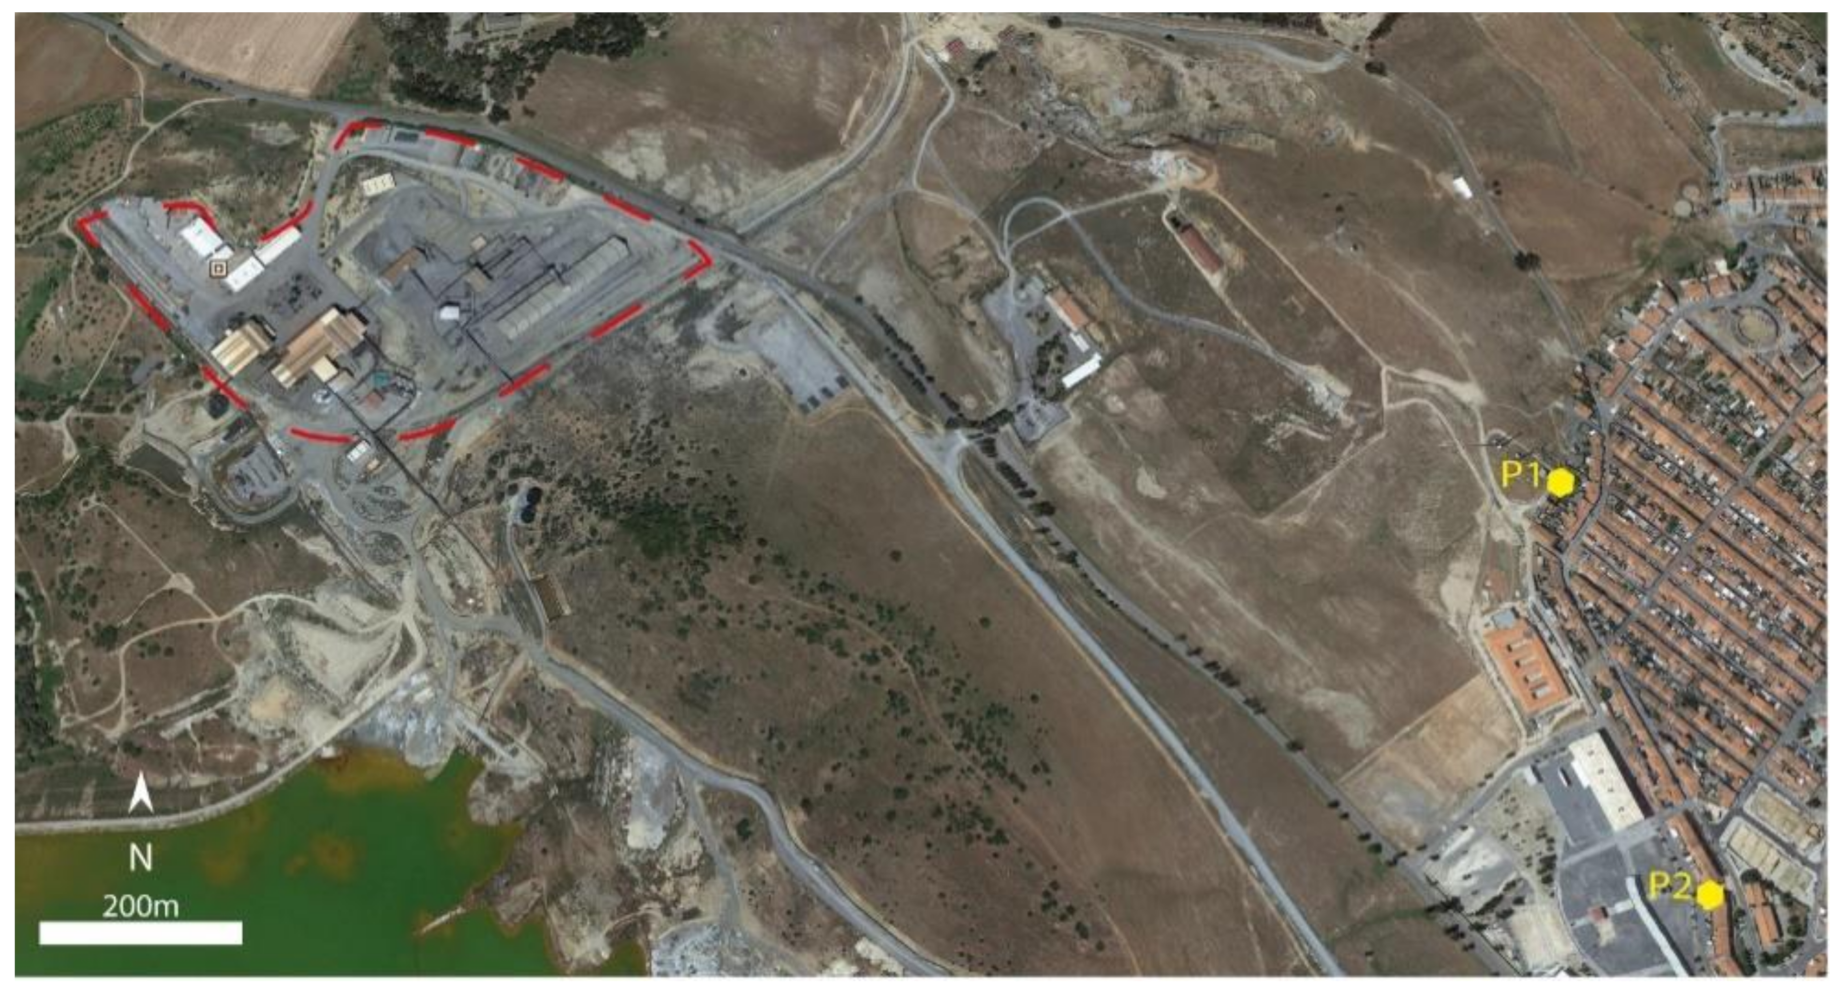
Nowadays, exploitation and first crushing are underground, then the material is transported underground to the processing plant located at the surface for other crushing and the production of the ore concentrates. The rejected materials are kept underground, and the tailing muds are deposited at dams and always kept underwater. Finally, the ore concentrates are transported from the processing plant by covered trucks for exportation. Therefore, the two points of sampling selected were at the SE of the ore processing plant, the presumable source of anthropogenic emissions, which is located at about 1500 m W-NW of the village (Figure 2). Atmospheric particles were collected during two periods of 2018: 10 to 17 July and 1 to 10 November. At each sampling point, a filtering air unit prepared to capture PM10 was used. The particles were collected through an inlet protected with a metal screen designed to exclude insects, and carried out 2 m above the house roof. This collector system uses a filter-based technique, in which each particle is continuously deposited onto a filter at a known flow rate controlled by a rotameter and a gas meter. PM10 samples were collected for 24 h and using polycarbonate and quartz fiber filters alternately.
A gravimetric method was used to estimate the daily PM10 mass, which consists of weighing the filter before and after sampling using an electronic microbalance (sensitivity ±0.0001 g) at least three times. Previously, the filters were equilibrated in a silica gel desiccator for 48 h to eliminate the humidity effect. Then, mass concentration was obtained according to the following equation [17]:
PM10(µm m−3) = [(fwpiwp)/V] × 106,
where fwp is the final weight of the filter, iwp is the initial weight of the filter and V is the total air volume.

3.2. Meteorological Data and Backward Trajectories Air Mass Analysis

The meteorological data—temperature, wind speed, precipitation, and humidity—were recorded daily from the Roxo dam (Aljustrel) and Alvalade weather station (Santiago do Cacém). Air mass intrusions and desert dust events are factors that can influence the particle type detected in some regions. Therefore, a study of satellite images of MODIS [18] from the Iberian Peninsula and the HYSPLIT trajectory model provided by NOAA [19,20] were used to verify the occurrence of desert dust events and the origins of the air masses. Satellite images were extracted for each day and the HYSPLIT model was conducted for the sampling periods.

3.3. SEM-EDX Analysis

PM10 samples collected in polycarbonate filters (Millipore, 0.2 µm size pore, 25 mm) were analyzed by electronic microscopy using a VP SEM HITACHI S—3400N coupled with an EDX system (Bruker XFlash® 5010, with a detection limit of 1000 ppm) at the Electron Microscopy Laboratory of Optics Center of the University of Beira Interior. ESPRIT FEATURE software was used to perform a semi-automated routine that allowed information about size, shape, and chemical composition for each particle detected. The samples were cut in half, mounted with a carbon double-face tape on the aluminum stubs, and coated with a thin film of gold (Au) to make them electrically conductive. In each filter, 300 randomly selected particles were analyzed. The elements analyzed were C, O, Na, Mg, Al, Si, S, Cl, K, Ca, Ti, Mn, Fe, Cu, Zn, As, Ba, and Pb. The SEM was operated in high vacuum mode, with an accelerating voltage of 20 kV and a beam current of 50 uA. Images were obtained in backscattered electron mode (BSE) and at a working distance of 5–6 mm, while the elemental analysis was at a working distance of 10–11 mm [21].

3.4. ICP-MS Analysis

The concentration of potentially toxic elements (PTE) was measured using an ICP-MS Thermo X Series at the Central Laboratory of Analysis of the University of Aveiro. A total of 11 chemical elements were analyzed—Na, Ca, Mn, Fe, Cu, Zn, As, Mo, Cd, Sb, and Pb. The samples collected in quartz fiber filters (Millipore, 25 mm) were prepared according to EPA Method 29, where each one was digested with 6 mL concentrated HNO3 and 3 mL concentrated HF. Digestion was carried out in a microwave, ramping 10 min at 140 °C and a baseline of 15 min at 140 °C. A blank filter and a standard sample, created through the spike method, were also analyzed. The precision is 10% for Na, Ca, Mn and Fe and 15% for the other elements.

4. Results and Discussion

4.1. PM Mass Concentration

In Aljustrel, the PM10 mass concentration during the first and second sampling periods was 20 to 47 µg m−3 and 4 to 23 µg m−3, respectively. To control the air quality, the limit established for PM10 concentration in the European Directive [22] is 50 μg m−3 for a 24 h period. This limit is not exceeded when compared to the PM10 mass concentration in the study area. The results also indicate that the mass concentration during the first period (July) was higher than the second (November), and this discrepancy can be assigned to the meteorological conditions verified at the time of sampling (Table 1). In July, the weather was warm and dry, with an average temperature of 30.3 °C, while in November, the weather was colder and windier (5.8 km h−1 to 11.5 km h−1), with four days of rain. The predominant wind direction was from S to SW in the second campaign.

4.2. Individual Characterization of PM10

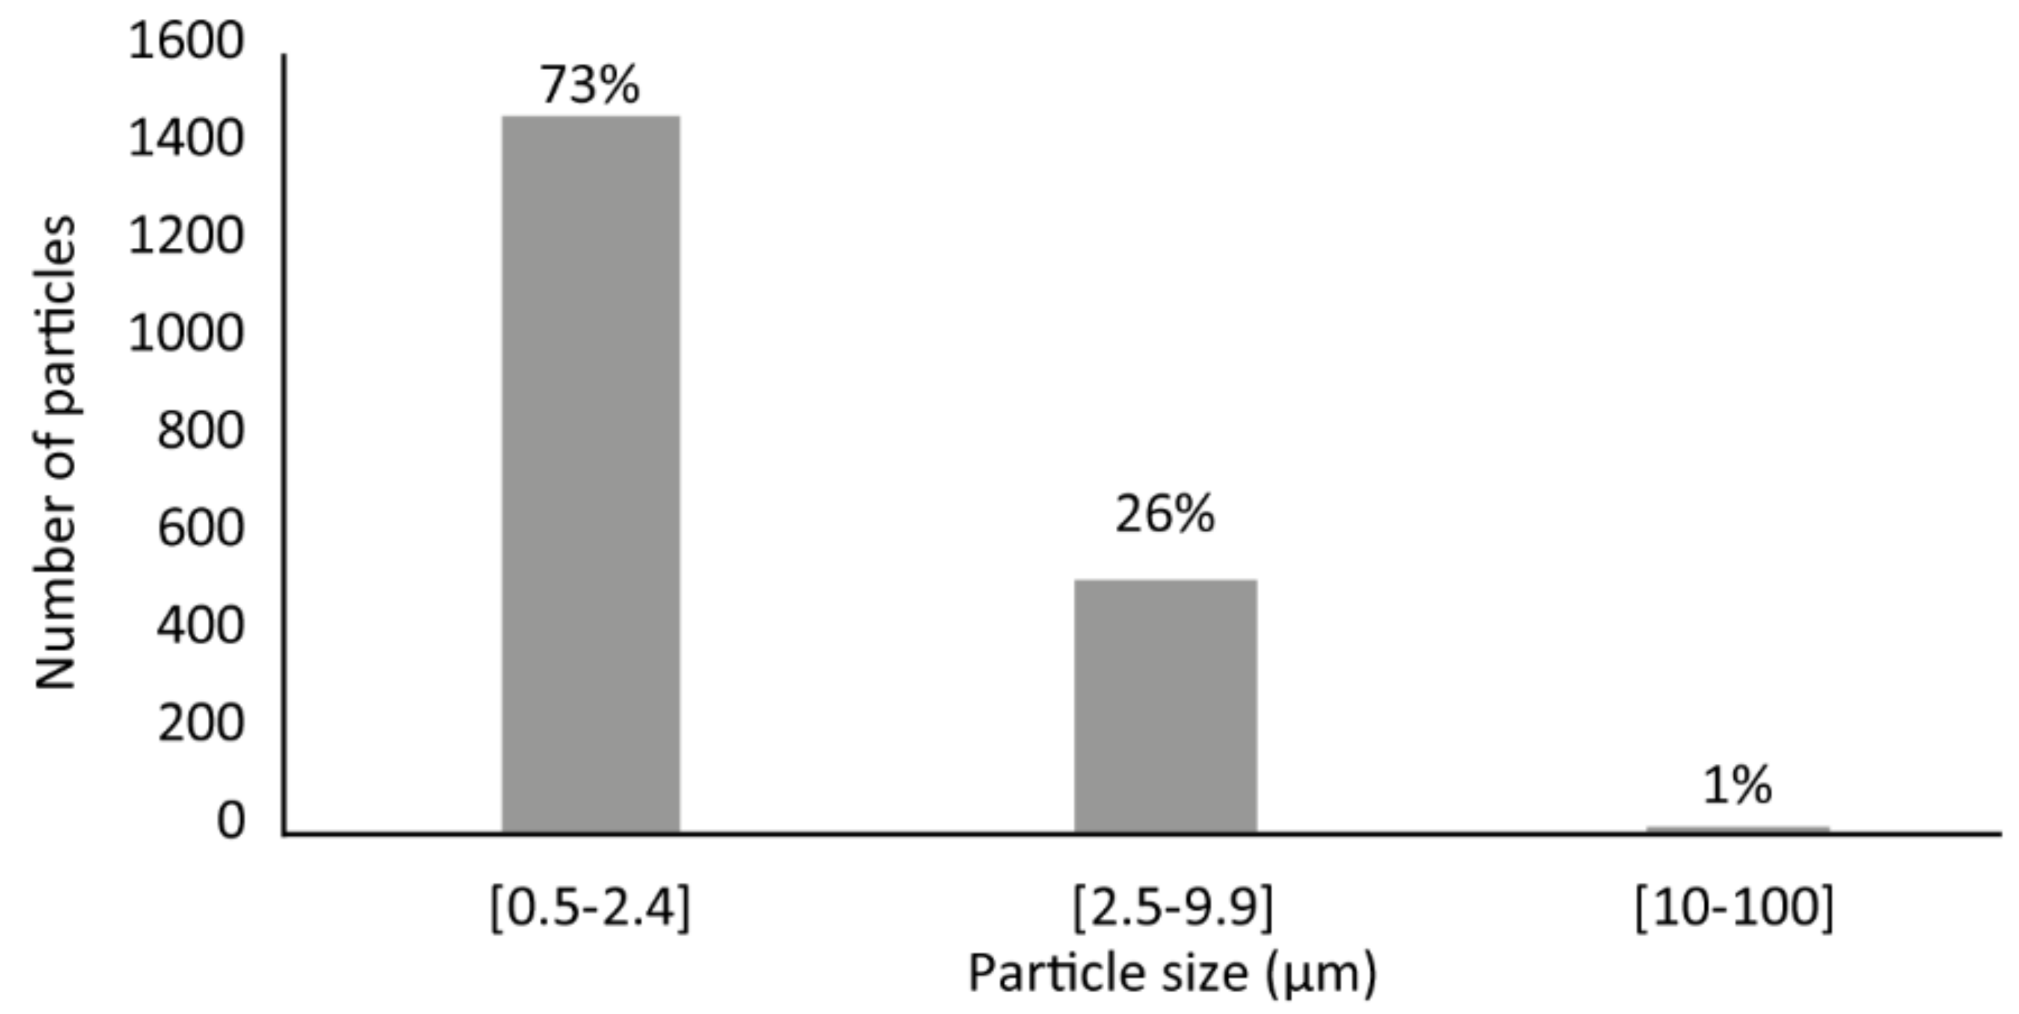
Based on the individual characterization of the PM10 analyzed using SEM-EDX, it was possible to describe the size distribution, classify each particle, and infer its source. A total of 2006 particles (on nine filters) were analyzed, and their size distribution shows (Figure 3) that 73% of these particles have a size range between 0.5 and 2.4 µm, 26% are between 2.5 and 9.9 µm, and only 1% are between 10 and 100 µm, with an error of 10% for particles larger than 1 µm and an error slightly higher for smaller particles (<1 µm). The particle size was calculated based on the equivalent diameter, which corresponds to the diameter of a circle with the same particle area. It should be noted that the collected system is prepared for PM10 based on the Stokes diameter, which is why particles with a size greater than 10 µm have been analyzed.
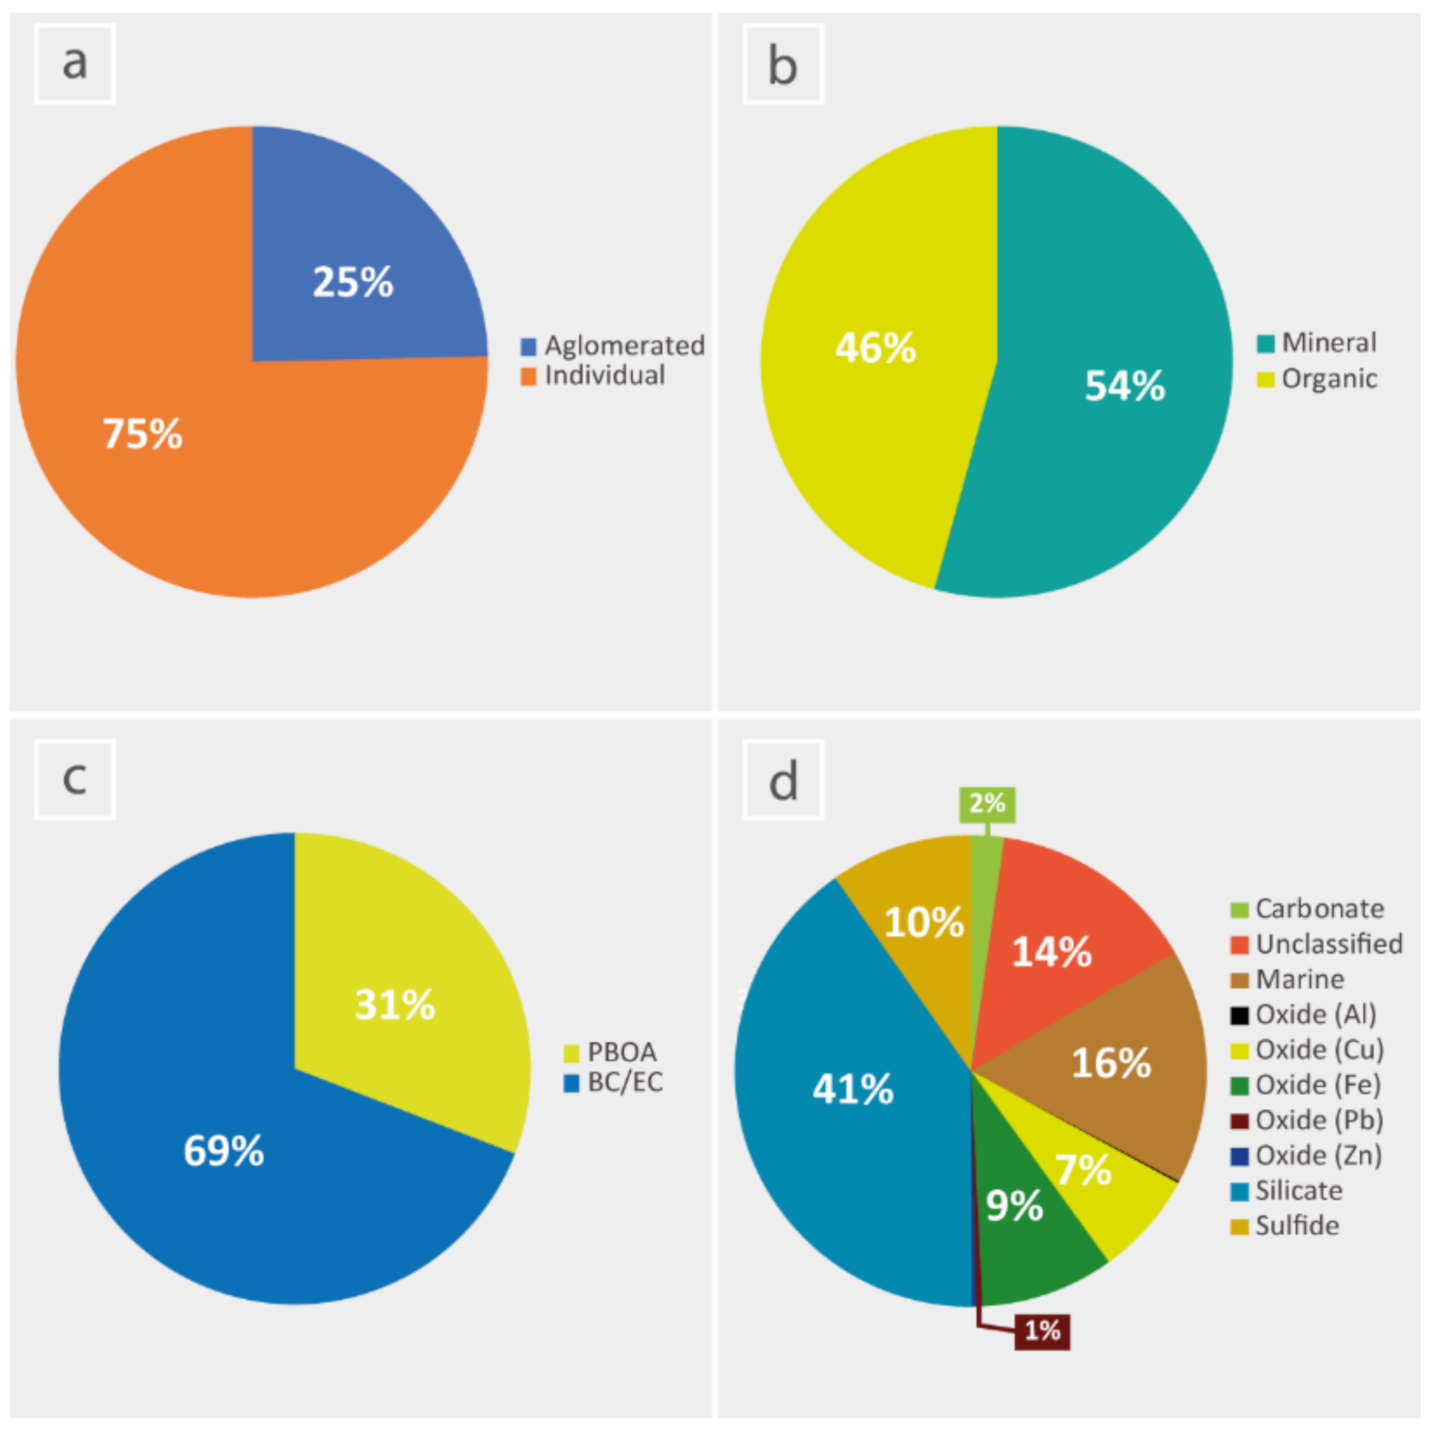
The methodology used to identify all particle classes analyzed considers the elemental chemical composition and the particle morphology. Based on the element atomic %, the particles can be classified into organic (C > 80%), bio-genic (C + O > 75% and 1% > Na, Mg, P, K, Ca, Fe, Si, Al, Cl < 10%), silicates (9% > Si < 60%), sulfides (15% > S < 40%, 3% > Fe < 30%, 3% > Cu < 30%, and O > 50%), oxides (50% > O < 80%, 3% > Fe < 40%, 3% > Cu < 40%) and carbonates (Ca > 2%). According to the SEM image and EDX data, the groups defined were agglomerated particles (25%) and individual particles (75%) that were divided into organic particles (46%) with the biogenic and combustion particles, and the inorganic particles (54%) (Figure 4), which are generally mineral particles.
  • Organic particles:
Primary Biogenic Organic Aerosols (PBOAs) are biological particles that include microorganisms (viruses, bacteria, and fungi) and fragments of plants or animals (spores, pollen, animal matter, and plant debris) [9,25]. These particles have specific morphologies and have been recognized with a size ranging from 0.5 to 19 µm. PBOAs are abundant in C and O, but other essential traces can be found such as Na, Mg, K, P, Si, Fe, Cl, Al, and Ca (Figure 5a) [26]. Emissions of these particles are related to soils, leaf abrasions, agricultural activities, biomass burning, and animal or human shedding [25]. The organic-rich particles as carbonaceous particles are generated from non-combusted hydrocarbons and vehicular origin [9]. These particles can have different morphologies, which depend on the type of fuels, burning conditions, and atmospheric processes [26]: single sphere particles of carbon (tarball) or aggregates of ultrafine spheres (soot) [17]. These combustion particles are rich in C and can have S and K in minor concentrations. In this study, as shown in Figure 5b, the combustion particle aggregates have a size above 2.5 µm and represent 69% of the total organic particles identified.
  • Inorganic particles:
Inorganic particles are mineral particulate aerosols derived from soils, sediments, weathered rock surfaces, and sea emissions. In this area, the PM10 analyzed showed silicates, carbonates, sulfides, oxides, and marine aerosols. The silicate particles (41% of the total inorganic group) contain a high concentration of Si, Al, and O and a minor concentration of Na, Mg, Ca, Mg, K, Ti, and Fe. Some minerals were identified as quartz, feldspar, albite, and mica. Most of the silicate particles showed irregular shapes, but some regular shapes (lamellar, quadrangular, and circular) were observed (Figure 5c). Their size is between 0.5 and 18 µm, though most of them are above 2.5 µm. The common source is crustal through wind erosion [26]. Only 2% of the total inorganic particles were identified as carbonate particles, as particles rich in Ca with a size ranging from 0.5 to 6 µm. These particles were irregular shapes and were identified as calcite (CaCO3) (Figure 5d). Silicate and carbonate particles had the same source since they are a common constituent of the soil [27], similar to the oxides and sulfides. Although, in this case, they have an anthropogenic origin once they are the materials explored. Fe, Al, Cu, Pb, and Zn oxides were observed in the PM10 sample analysis. The oxide particles (Figure 5e) with an abundance of 17% have irregular shapes and are mostly smaller than 2.5 µm (size range between 0.5 and 5 µm). However, the iron oxide may also be associated with the wind erosion of soils [26] or traffic emissions [9]. Sulfide particles (10% of the total inorganic group) (Figure 5f) present a high concentration of S associated with Fe, Cu, Zn, As, and Pb. The size of sulfide particles varied, ranging from 0.5 to 5 µm. Their morphology varies from irregular to cubic, and it was possible to identify some minerals such as pyrite (FeS2), sphalerite (ZnS), chalcopyrite (CuFeS2), and galena (PbS), exactly the minerals present on the exploited ore. Therefore, these particles present in the air may be connected to old or recent mining operations. Finally, some cubic crystals of salt were identified (Figure 5g), which are related to marine emissions. Composed predominantly of NaCl, they can also have Mg, Ca, and K [28,29]. Their size was between 0.5 and 9 µm, with cubic, spherical, and irregular shapes. The presence of these can be explained by the relative proximity to the Atlantic Ocean.

4.3. Concentration of PTE

The ICP-MS analysis allowed us to characterize the air levels of potentially toxic elements (PTE). Table 2 shows the results obtained for the first and last day of the first campaign and all the days of the second. In general, the highest levels were found in the first campaign (July), which may be associated with the different meteorological conditions current among sampling periods. Ca, Mo, Cd, and Sb are the elements that were not detected in some samples.
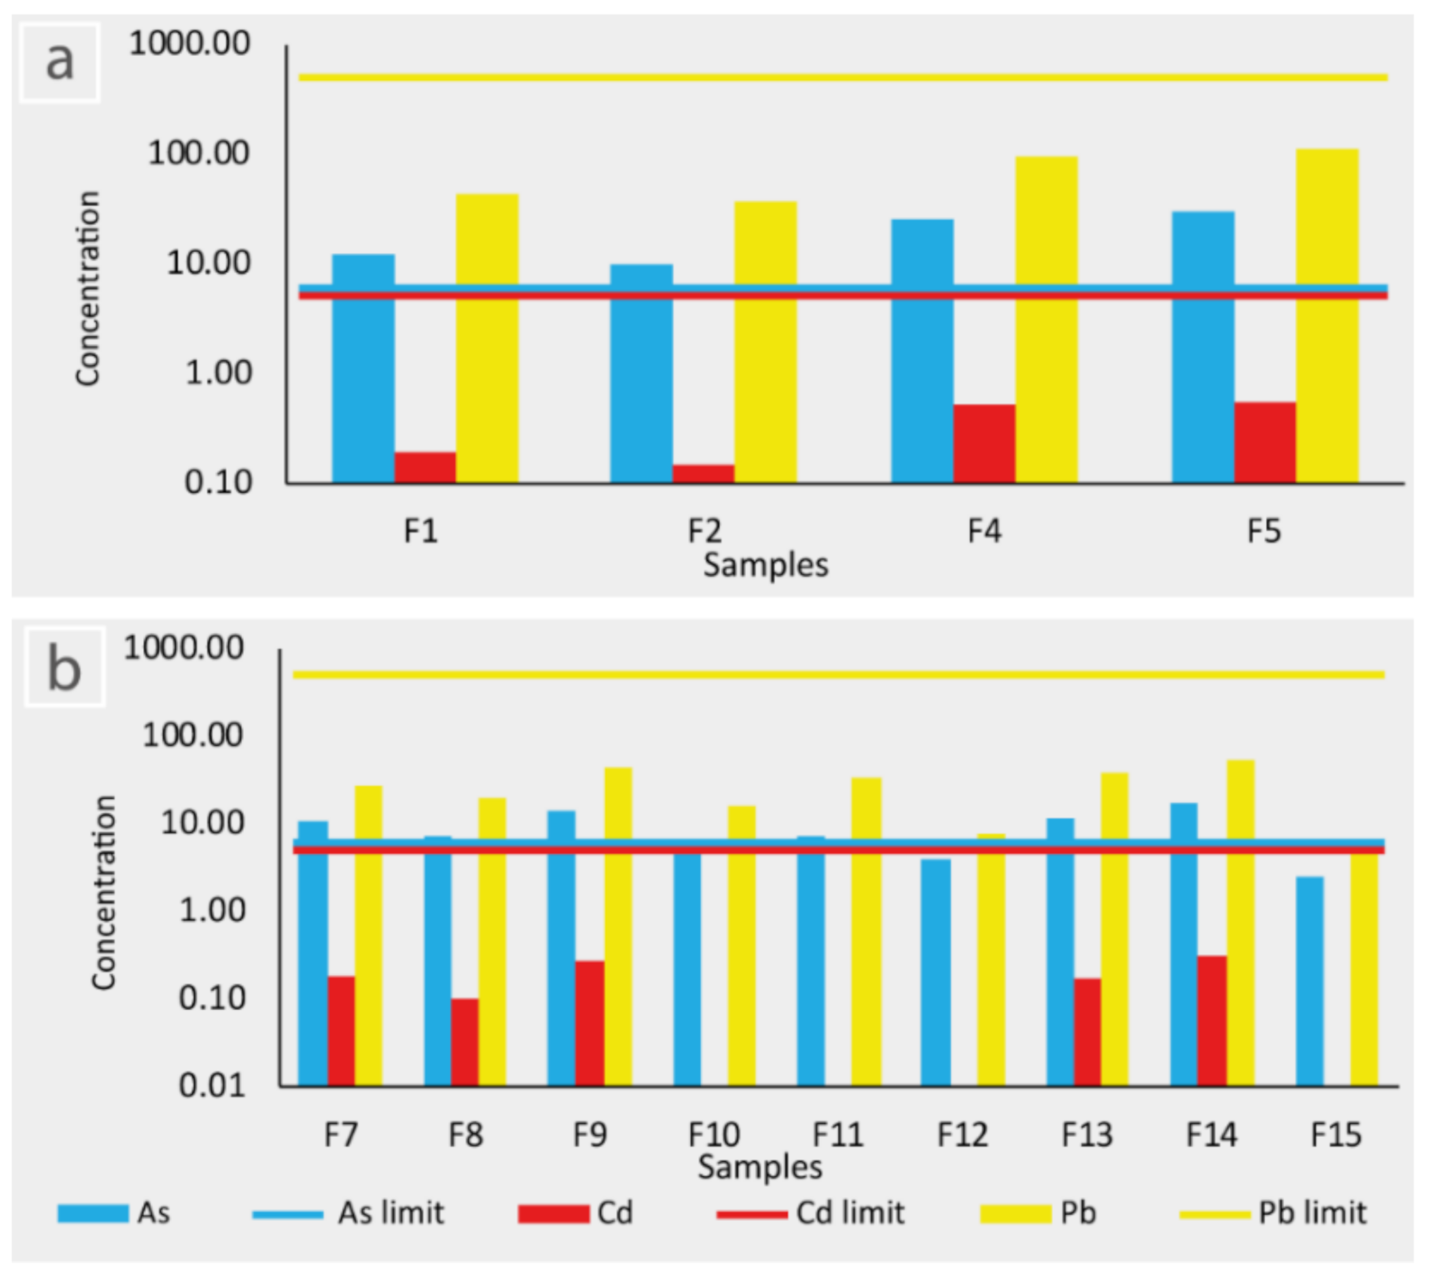
Some atmospheric pollutants such as Pb, As, and Cd are also a significant parameter to control the air quality. According to the European legislation [22] for the ambient air quality and cleaner air for Europe, the limit level for Pb is 0.5 µg m−3 for a calendar year. However, in the Portuguese legislation [30], the As and Cd limit levels defined are 6 ng m−3 and 5 ng m−3, respectively. So, comparing the daily concentrations obtained in Aljustrel with the legal limits, only As exceeds them (Figure 6).
When comparing the mean levels of PTE obtained in Aljustrel with those obtained in the Rio Tinto mine (IPB mine in the Spain sector) [31], the Zn, Cu, Mn, Fe, Cd, As, and Pb concentrations are higher in Aljustrel than Rio Tinto (Table 3). This difference can be explained by the sampling time and methodologies used in each study. However, another important fact is that the Rio Tinto mine was inactive, so the dust origin is the particle resuspension of the exhausted mining tailings. At Aljustrel, besides the resuspension from the old mining sites which have not yet been rehabilitated, the mine is active and, although most of the mine operations are underground, the ore processing plant is located at the surface. Other studies have shown the influence of mining activity, especially in the emissions of As, Cu, and Pb, as a source of air pollution [32,33].

4.4. Source Apportionment

Since each particle type can be associated with one or more sources, a statistical study was conducted to define them. Therefore, the elemental chemical composition data were subjected to Principal Component Analysis (PCA) to distinguish the sources [6,13,34,35]. The software used was ANDAD 7.1, developed by the Instituto Superior Técnico (Portugal). In the first test, all the data were used (n = 2006), and no significant associations were shown due to the very low variability of the data. According to Pereira and Sousa (1988) [36], the variables or insignificant data that do not identify trends can be rejected, with the right justification for the study case. In this specific case, all the data (particles) with zeros in most of the variables and variables (chemical elements) without meaning were excluded (such as C and Au or secondary constituents of mineral classes). The atomic % log10 was calculated to obtain a comparable element concentration between particles. Then, the second test was performed with a total of 1836 data. Five significant components were extracted (72% of the total variance of the data), which have eigenvalues >1 and stabilization on the scree plot. Only values ±0.5 were used to define the factors extracted (Table 4 and Figure 7).
The first factor (PC1) is determined by O, Al, Si, and Fe, which explain 22.6% of the total variability. PC1 indicates that the geochemical composition of the aerosols is essentially geogenic and related to natural processes, as most of the crushing, which releases silica dust, is performed underground. PC2 represents 15.22% of the total variance and is composed of As and Pb variables. The third and fourth components (CP3 and CP4) are defined by S-Fe and Cu-Zn, which contain 13.69% and 10.55% of the total variance, respectively. These components—CP2 to CP4—show the association with the mineral geochemistry present in exploited orebodies (pyrite, spherite, chalcopyrite, galena, arsenopyrite), suggesting the influence of the anthropogenic activities developed in Aljustrel. It should be noted that the tailings are always kept submerged; therefore, they are not a source of dust and there is no smelter, which could be a source of As and Pb. Finally, the fifth component (CP5) with 10.14% of the total variability is defined by Mn. This factor may be correlated to the vestige of older Mn-deposits exploited in this area.
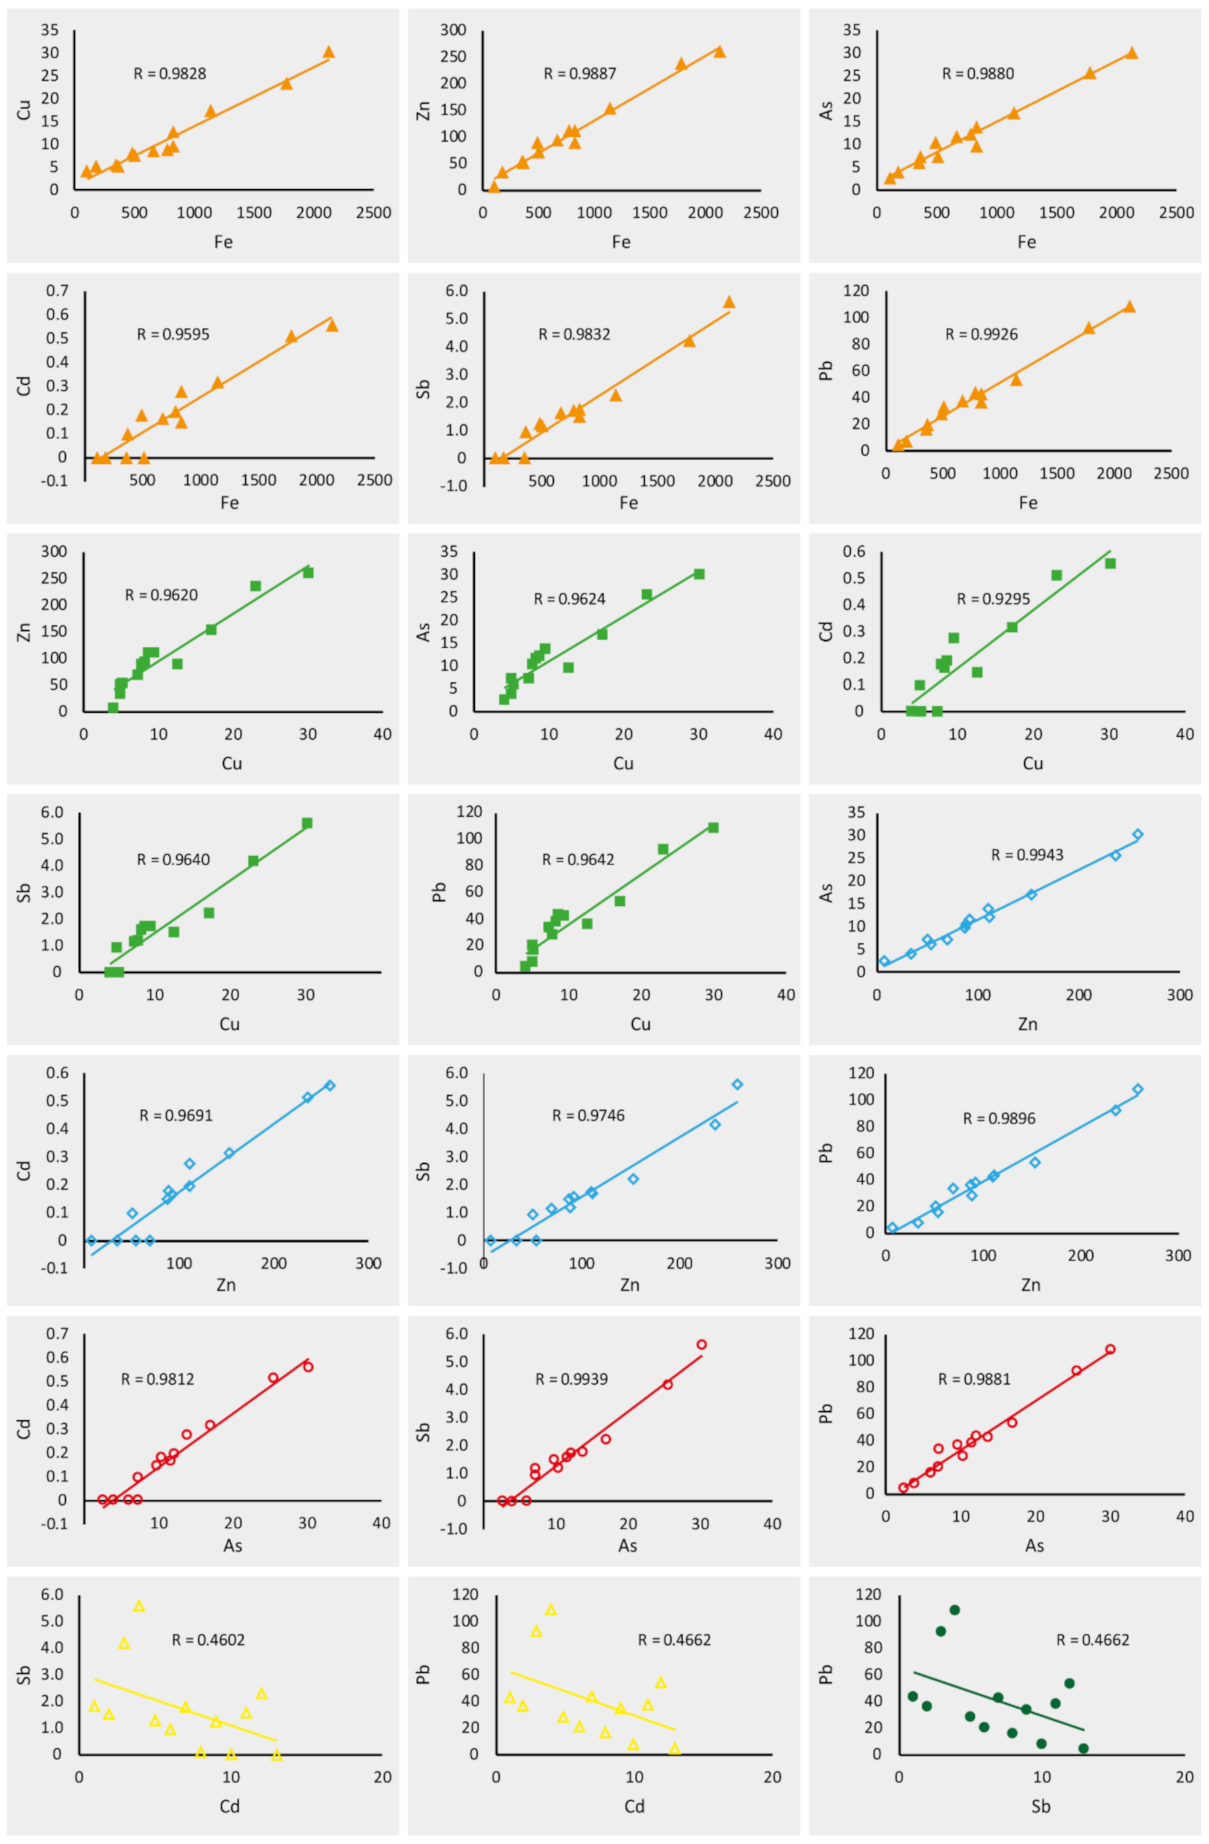
The statistical correlation between elements analyzed by ICP-MS shows a highly significant positive correlation (r > 0.8) between Fe, Cu, Zn, As, Cd, Sb, and Pb (Table 5, Figure 8), and a non-correlation with the other elements. This positive correlation between these specific elements reveals the influences of mining activities on the type of particle analyzed, since those elements correspond to the typical mineralogy of the exploited orebodies. Additionally, a dust sample from the thin black layer, which normally covers the outdoor surfaces, was scraped from a roof for an X-ray diffraction analysis at the Geochemical and X-ray Laboratory of the Earth Sciences Department (University of Coimbra). The mineralogy identified was pyrite, quartz, galena, calcite, illite, chlorite, sphalerite, and chalcopyrite, showing again that the sulfides source must be the ore processing plant, while the other minerals may be derived from resuspension soil particles.
These statistical results show that the atmospheric particles analyzed have both a natural and an anthropic source. Therefore, satellite images are used to identify the influence of natural processes and show that no desert dust events happened during our collection periods (Figure S9a,b, in the supplementary material). The backward trajectory models were used to understand the origin of the air masses, which are predominantly maritime (arctic and polar cold) for the first campaign and mainly continental (arctic and polar cold) for the second [37] (Figure S9a,b, in the supplementary material). This analysis suggests that, in this area, the PM type and concentration were influenced by local or regional sources, conforming to the individual characterization of the particles analyzed and statistical results.

5. Conclusions

The goal of this work was to characterize the PM10 samples collected near the mining area of Aljustrel. PM10 analysis by SEM-EDX allowed us to identify the different types of particles and associate them with probable sources. Considering the particle types identified—PBOA, BC/EC, marine aerosols, silicates, oxides, sulfides, and carbonates—the PM10 has both a natural and an anthropic influence. Natural particles are mainly associated with the remobilization of unconsolidated soils or sediments by the wind (silicates and carbonates), marine air masses (marine aerosols), and pollination events (PBOA), while the anthropogenic particles are related to local traffic goods transport or to mining operations (sulfides and oxides), as there is no burning of fossil fuels in the region. In this case, the sulfides may be emitted by the ore processing plant and the oxides may be resuspended from the contaminated soil or abandoned mining land not yet rehabilitated. Iron, copper, zinc, arsenic, cadmium, antimony, and lead have strong and positive correlations, indicating a relation between the atmospheric particles and the ore processed. PTE concentration in the air obtained by ICP-MS shows higher concentrations in July than in November, which is attributed to the typical climate of Aljustrel, but for particle level we cannot draw conclusions about the variation in the composition according to seasonality because the study was too short.
In sum, the evidence of the impact of mining activity (old or actual) on the air quality is significant and explained by the correlation between the chemical elements (S, Fe, Cu, Zn, and Pb) or particle type (pyrite, sphalerite, chalcopyrite, and galena) and the geochemistry of the exploited orebodies. Even though As exceeds the legal limits for air control and quality, the presence of mineral particles rich in silicon, oxides, and sulfides is evident and continuous exposure to these particles can lead to changes in the environment or even in the health of the resident population. This work was the first study developed in Aljustrel about atmospheric aerosols and shows a strong relationship between the PM10 analyzed and the exploited ore. Although the sampling period was short, it is evident that the old or recent mining operations have implications for the air quality of Aljustrel. It must also be said that the mining company has already taken measures in 2020 to stop the release of dust from the processing plant to the atmosphere.

Supplementary Materials

The following are available online at https://www.mdpi.com/2073-4433/12/3/333/s1, Figure S9a: Satellite images from the Iberian Peninsula and HYSPLIT trajectory model for each day of the first campaign [18,38], and Figure S9b: Satellite images from the Iberian Peninsula and HYSPLIT trajectory model for each day of the second campaign [18,38].

Author Contributions

Conceptualization and methodology A.B., S.M. and M.M.V.G.S.; software, A.B.; validation, S.M. and M.M.V.G.S.; formal analysis, A.B.; investigation, A.B.; writing—original draft preparation, A.B.; writing—review and editing, S.M. and M.M.V.G.S.; supervision, S.M. and M.M.V.G.S.; project administration, V.C. and Á.d.F.; funding acquisition, V.C. and Á.d.F. All authors have read and agreed to the published version of the manuscript.

Funding

The ICP-MS analysis was supported by the Centre for Earth and Space Research (CITEU) of the University of Coimbra. The funding by Junta de Castilla y León (grant no. VA227P20) is also acknowledged.

Institutional Review Board Statement

Not applicable.

Informed Consent Statement

Not applicable.

Data Availability Statement

The data presented in this study are available on request from the corresponding authors.

Acknowledgments

The authors are grateful to Ana Paula Gomes (University of Beira Interior) for guidance and advice with SEM-EDX, Esther Coz (CIEMAT) for the help with the ESPRIT FEATURE software, Paula Carvalho (MARE) for help with ANDAD software, and Earth Sciences Department of the University of Coimbra for X-ray diffraction analysis.

Conflicts of Interest

The authors declare no conflict of interest.

References

  1. Csavina, J.; Field, J.; Taylor, M.P.; Gao, S.; Landázuri, A.; Betterton, E.A.; Sáez, A.E. A review on the importance of metals and metalloids in atmospheric dust and aerosol from mining operations. Sci. Total Environ. 2012, 433, 58–73. [Google Scholar] [CrossRef] [Green Version]
  2. Dudka, S.; Adriano, D.C. Environmental impacts of metal ore mining and processing: A review. J. Environ. Qual. 1997, 26, 590–602. [Google Scholar] [CrossRef]
  3. Petavratzi, E.; Kingman, S.; Lowndes, I. Particulates from mining operations: A review of sources, effects and regulations. Miner. Eng. 2005, 18, 1183–1199. [Google Scholar] [CrossRef]
  4. Pinto, M.M.S.C.; Silva, M.M.V.G.; Neiva, A.M.R. Pollution of water and stream sediments associated with the Vale De Abrutiga uranium mine, Central Portugal. Mine Water Environ. 2004, 23, 66–75. [Google Scholar] [CrossRef] [Green Version]
  5. Castillo, S.; de la Rosa, J.D.; Sánchez de la Campa, A.M.; González-Castanedo, Y.; Fernández-Caliani, J.C.; Gonzalez, I.; Romero, A. Contribution of mine wastes to atmospheric metal deposition in the surrounding area of an abandoned heavily polluted mining district (Rio Tinto mines, Spain). Sci. Total Environ. 2013, 449, 363–372. [Google Scholar] [CrossRef] [PubMed]
  6. Silva, M.M.V.G.; Lopes, S.P.; Gomes, E.C. Geochemistry and behavior of REE in stream sediments close to an old Sn-W mine, Ribeira, Northeast Portugal. Chem. Erde Geochem. 2014, 74, 545–555. [Google Scholar] [CrossRef]
  7. Carvalho, P.C.; Neiva, A.M.; Silva, M.M.; Santos, A.C. Human health risks in an old gold mining area with circum-neutral drainage, central Portugal. Environ. Geochem. Health 2017, 39, 43–62. [Google Scholar] [CrossRef]
  8. Sanchez-Bisquert, D.; Peñas-Castejón, J.M.; Garcia-Fernandez, G. The impact of atmospheric dust deposition and trace elements levels on the villages surrounding the former mining areas in a semi-arid environment (SE Spain). Atmos. Environ. 2017, 152, 256–269. [Google Scholar] [CrossRef]
  9. Iordanidis, A.; Buckman, J.; Triantafyllou, A.G.; Asvesta, A. ESEM-EDX characterisation of airborne particles from an industrialised area of northern Greece. Environ. Geochem. Health 2008, 30, 391–405. [Google Scholar] [CrossRef] [PubMed]
  10. Matos, J.; Martins, L.P. Reabilitação ambiental de áreas mineiras do sector português da Faixa Piritosa Ibérica: Estado da arte e perspectivas futuras. Boletín Geol. Min. 2006, 117, 289–304. [Google Scholar]
  11. Luís, A.T.; Teixeira, P.; Almeida, S.F.P.; Ector, L.; Matos, J.X.; Ferreira da Silva, E.A. Impact of Acid Mine Drainage (AMD) on Water Quality, Stream Sediments and Periphytic Diatom Communities in the Surrounding Streams of Aljustrel Mining Area (Portugal). Water Air Soil Pollut. 2009, 200, 147–167. [Google Scholar] [CrossRef]
  12. Candeias, C.; Ferreira da Silva, E.; Salgueiro, A.R.; Pereira, H.G.; Reis, A.P.; Patinha, C.; Matos, J.X.; Ávila, P.H. Assessment of the soil contamination by potentially toxic elements in Aljustrel mining area in order to implement soil reclamation strategies. Land Degrad. Dev. 2011, 22, 565–585. [Google Scholar] [CrossRef] [Green Version]
  13. Candeias, C.; Ferreira da Silva, E.; Salgueiro, A.R.; Pereira, H.G.; Reis, A.P.; Patinha, C.; Matos, J.X.; Ávila, P.H. The use of multivariate statistical analysis of geochemical data for assessing the spatial distribution of soil contamination by potentially toxic elements in the Aljustrel mining area (Iberian Pyrite Belt, Portugal). Environ. Earth Sci. 2011, 62, 1461–1479. [Google Scholar] [CrossRef]
  14. Luís, A.T.; Grande, J.A.; Durães, N.; Dávila, J.M.; Santisteban, M.; Almeida, S.F.P.; Sarmiento, A.M.; Torre, M.L.; Fortes, J.C.; Silva, E.-F. Biogeochemical characterization of surface waters in the Aljustrel mining area (South Portugal). Environ. Geochem. Health 2019, 41, 1909–1921. [Google Scholar] [CrossRef]
  15. Barriga, F.; Fyfe, W. Multi-phase water-rhyolite interaction and ore fluid generation at Aljustrel, Portugal. Mineral. Deposita 1997, 33, 188–207. [Google Scholar] [CrossRef]
  16. Inverno, C.; Diez-Montes, A.; Rosa, C.; García-Crespo, J.; Matos, J.; García-Lobón, J.L.; Carvalho, J.; Bellido, F.; Castello-Branco, J.M.; Ayala, C.; et al. Introduction and geological setting of the Iberian Pyrite Belt. In 3D, 4D and Predictive Modelling of Major Mineral Belts in Europe. Mineral Resource Reviews; Weihed, P., Ed.; Springer: Cham, Switzerland; Berlin, Germany, 2015; pp. 191–208. [Google Scholar] [CrossRef]
  17. Bharti, S.K.; Kumar, D.; Anand, S.; Poonam; Barman, S.C.; Kumar, N. Characterization and morphological analysis of individual aerosol of PM10 in urban area of Lucknow, India. Micron 2017, 103, 90–98. [Google Scholar] [CrossRef]
  18. NASA-EOSDIS Worldview. Available online: https://worldview.earthdata.nasa.gov/ (accessed on 28 January 2021).
  19. Stein, A.F.; Draxler, R.R.; Rolph, G.D.; Stunder, B.J.B.; Cohen, M.D.; Ngan, F. NOAA’s HYSPLIT atmospheric transport and dispersion modeling system. Bull. Am. Meteor. Soc. 2015, 96, 2059–2077. [Google Scholar] [CrossRef]
  20. Rolph, G.; Stein, A.; Stunder, B. Real-time Environmental Applications and Display sYstem: READY. Environ. Model. Softw. 2017, 95, 210–228. [Google Scholar] [CrossRef]
  21. Willis, R.; Blanchard, F.; Conner, T. Guidelines for the Application of SEM/EDX Analytical Techniques to Particulate Matter Samples; Environmental Protection Agency: Washington, DC, USA, 2002; (/EPA/600/R-02/070). [Google Scholar]
  22. Directive 2008/50/EC of the European Parliament and of the Council of 21 May 2008 on Ambient Air Quality and Cleaner Air for Europe. JO L 152 de 11.6.2008. pp. 1–44. Available online: http://data.europa.eu/eli/dir/2008/50/oj (accessed on 28 January 2021).
  23. Portal Regante. Available online: https://regante.edia.pt/suporteaatividade/meteorologia/SitePages/Home.aspx (accessed on 16 July 2018).
  24. IPMA. Available online: https://www.ipma.pt/pt/otempo/obs.superficie/# (accessed on 10 November 2018).
  25. Coz, E.; Artinano, B.; Clark, L.M.; Hernandez, M.; Robinson, A.L.; Casuccio, G.S.; Lersch, T.L.; Pandis, S. Characterization of fine primary biogenic organic aerosol in an urban area in the northeastern United States. Atmos. Environ. 2010, 44, 3952–3962. [Google Scholar] [CrossRef]
  26. Pachauri, T.; Singla, V.; Satsangi, A.; Lakhani, A.; Kumari, K.M. SEM-EDX Characterization of Individual Coarse Particles in Agra, India. Aerosol Air Qual. Res. 2013, 13, 523–536. [Google Scholar] [CrossRef]
  27. Cong, Z.; Kang, S.; Dong, S.; Liu, X.; Qin, D. Elemental and individual particle analysis of atmospheric aerosols from high Himalayas. Environ. Monit. Assess. 2010, 160, 323. [Google Scholar] [CrossRef] [PubMed]
  28. Li, W.; Shao, L.; Zhang, D.; Ro, C.-U.; Hu, M.; Bi, X.; Geng, H.; Matsuki, A.; Niu, H.; Chen, J. A review of single aerosol particle studies in the atmosphere of East Asia: Morphology, mixing state, source, and heterogeneous reactions. J. Clean. Prod. 2016, 112, 1330–1349. [Google Scholar] [CrossRef]
  29. Tomasi, C.; Fuzzi, S.; Kokhanovsky, A. Atmospheric Aerosols: Life Cycles and Effects on Air Quality and Climate; John Wiley & Sons: Hoboken, NJ, USA, 2017. [Google Scholar]
  30. Decree-Law 47/2017, 10 May 2017. Republic Diary No. 90/2017, Series I of 2017-05-10. Available online: https://data.dre.pt/eli/dec-lei/47/2017/05/10/p/dre/pt/html (accessed on 28 January 2021).
  31. Sánchez de la Campa, A.M.; de la Rosa, J.D.; Fernández-Caliani, J.C.; González-Castanedo, Y. Impact of abandoned mine waste on atmospheric respirable particulate matter in the historic mining district of Rio Tinto (Iberian Pyrite Belt). Environ. Res. 2011, 111, 1018–1023. [Google Scholar] [CrossRef]
  32. Sánchez de la Campa, A.M.; Sanchez-Rodas, D.; Marquez, G.; Romero, E.; Jesús, D. 2009–2017 trends of PM10 in the legendary Riotinto mining district of SW Spain. Atmos. Res. 2020, 238, 104878. [Google Scholar] [CrossRef]
  33. Sánchez de la Campa, A.M.; Sánchez-Rodas, D.; Castanedo, Y.G.; Jesús, D. Geochemical anomalies of toxic elements and arsenic speciation in airborne particles from Cu mining and smelting activities: Influence on air quality. J. Hazard. Mater. 2015, 291, 18–27. [Google Scholar] [CrossRef] [PubMed]
  34. Lu, X.; Wang, L.; Li, L.Y.; Lei, K.; Huang, L.; Kang, D. Multivariate statistical analysis of heavy metals in street dust of Baoji, NW China. J. Hazard. Mater. 2010, 173, 744–749. [Google Scholar] [CrossRef] [PubMed]
  35. Doabi, S.A.; Afyuni, M.; Karami, M. Multivariate statistical analysis of heavy metals contamination in atmospheric dust of Kermanshah province, Western Iran, during the spring and summer 2013. J. Geochem. Explor. 2017, 180, 61–70. [Google Scholar] [CrossRef]
  36. Pereira, H.G.; Sousa, A.J. Análise de dados para tratamento de quadros multidimencionais; Centro de Geo-Sistemas, 1988; (Support texts of the Intensive Data Analysis course: 1988–2002). [Google Scholar]
  37. Toledano, C.; Cachorro, V.E.; De Frutos, A.M.; Torres, B.; Berjón, A.; Sorribas, M.; Stone, R.S. Airmass Classification and Analysis of Aerosol Types at El Arenosillo (Spain). J. Appl. Meteorol. Climatol. 2009, 48, 962–981. [Google Scholar] [CrossRef]
  38. HISPLIT-Hybrid Single–Particle Lagrangian Integrated Trajectory Model. Available online: http://ready.arl.noaa.gov/HYSPLIT.php (accessed on 30 November 2018).
Figure 1. Simplified map of impacted areas in the Aljustrel mine, with the geological setting of the Iberian Pyrite Belt (IPB) in the upper right corner of the figure (adapted from [13,14]).
Atmosphere 12 00333 g001
Figure 2. Localization of the ore processing plant of the Aljustrel mine (red line) and the sampling points: P1 and P2 at a distance of 1.2 km and 1.44 km, respectively (source: Google Earth).
Atmosphere 12 00333 g002
Figure 3. Size distribution of the atmospheric particles detected in the SEM—EDX analysis.
Atmosphere 12 00333 g003
Figure 4. Graphical representation of all the groups defined for the PM10 analyzed by SEM-EDX: (a) the first classification level, (b) individual group classification, (c) organic group sub-classes, and (d) mineral group sub-classes.
Atmosphere 12 00333 g004
Figure 5. Examples of all the types of atmospheric particles identified: (a) biogenic particle (b) soot; (c) silicate particles; (d) carbonate particle—calcite; (e) Fe-oxide particle; (f) sulfide particle—sphalerite and (g) marine particle.
Atmosphere 12 00333 g005
Figure 6. Comparison of As, Cd, and Pb concentrations with their legal limits: (a) first and (b) second campaign.
Atmosphere 12 00333 g006
Figure 7. Representation of all the factorial plans and identification of group associations: (a) PC1/PC2, (b) PC1/PC3, (c) PC1/PC4, and (d) PC1/PC5.
Atmosphere 12 00333 g007
Figure 8. Representation of the chemical elements with significant correlation.
Atmosphere 12 00333 g008
Table 1. Meteorological data collected during the two campaigns carried out in Aljustrel.
DateTemperature
(°C)
Precipitation
(mm)
Wind
(Km h−1)
Humidity
(%)
MeanMaxMinMeanMeanMaxMeanMaxMin
SpeedDirectionSpeedDirection
1st Campaign [23]10 July 2018---29.117.402.9------------------
11 July 2018---28.117.802.9------------------
12 July 2018---25.915.701.9------------------
13 July 2018---27.513.702.2------------------
14 July 2018---26.815.402.2------------------
15 July 2018---24.91503.1------------------
16 July 2018 29.713.10.12.3------------------
2nd Campaign [24]1 November 201813.118.89.10.06.8N27.4 8610054
2 November 201816.019.211.30.47.9NW25.9E8710074
3 November 201814.81910.60.05.8N22.7E8610069
4 November 201814.617.512.74.17.9SW41.8SE839963
5 November 201812.016.47.80.010.8W42.1E819850
6 November 201812.118.26.30.07.9S32.4SE8710054
7 November 201814.419.18.93.46.8W31.7S8310050
8 November 201812.519.67.51.27.9SW47.5E8910057
9 November 201812.118.65.90.06.5S28.1SE8510057
10 November 201816.520.110.10.911.5SW46.4S8910068
Table 2. Results of concentrations of the chemical elements analyzed by ICP-MS.
ConcentrationNaCaMnFeCuZnAsMoCdSbPbVolume
(µg filter−1)(ng m−3)(µg filter−1)(ng m−3)(µg filter−1)(ng m−3)(µg filter−1)(ng m−3)(µg filter−1)(ng m−3)(µg filter−1)(ng m−3)(µg filter−1)(ng m−3)(µg filter−1)(ng m−3)(µg filter−1)(ng m−3)(µg filter−1)(ng m−3)(µg filter−1)(ng m−3)(m−3)
Detection limit
(l.d.) (µg L−1)
0.80.80.0020.20.030.030.030.030.0040.0080.008
July CampaignF110.8260.9427169.1290.337.97332.2777.9930.368.6984.6111.1420.512.0810.030.7250.0080.1930.0711.7151.79243.29741.39
F215.8383.72832777.1710.5413.11534.2830.6010.5212.6293.687.4320.49.715<l.d.<l.d.0.0060.1460.0621.5061.49236.23641.18
F419.8481.799601459.9960.8119.7173.21781.1950.9523.1179.7236.0331.0525.550.030.730.0210.5110.1724.1853.79292.27241.1
F511.8285.10315362.4190.5914.25588.22131.0241.2530.20210.7258.5261.2530.2020.030.7250.0230.5560.2325.6054.492108.53241.39
November CampaignF721.8553.01914355.150.5814.71319.2487.0620.317.8643.588.7870.4110.4010.082.0290.0070.1780.0481.2181.09227.70239.42
F87.8187.505<l.d.<l.d.0.194.56715.2365.3930.215.0482.150.4820.37.212<l.d.<l.d.0.0040.0960.0390.9380.8322041.6
F93.690.309<l.d.<l.d.0.317.77733.2832.8530.389.5334.4110.3780.5513.7970.030.7530.0110.2760.071.7561.69242.44539.86
F102.7180.0484266.7380.1812.0035.3353.4280.085.3350.853.3480.096.0020.074.66800<l.d.<l.d.0.24216.13815
F1118.8449.47<l.d.<l.d.0.194.54321.2506.850.317.4112.969.3330.37.17200<l.d.<l.d.0.0481.1481.39233.2841.83
F127.8437.5397392.6630.126.7313.2179.5030.095.0490.633.6570.073.9270.084.48800<l.d.<l.d.0.1327.40417.83
F1323.8562.595000.225.228.2666.6040.358.2733.992.190.4911.583<l.d.<l.d.0.0070.1650.0681.6071.59237.63242.3
F1482.82008.19815363.8041.0324.98147.21144.770.7117.226.3152.7980.716.978<l.d.<l.d.0.0130.3150.0922.2312.19253.16441.23
F1518.8427.448000.12.2744.7106.8620.184.0930.36.8210.112.5010000<l.d.<l.d.0.1924.36543.98
Min---90---0---2---107---4---7---3---0---0---0---4---
Máx---2008---1460---25---2131---30---259---30---5---1---6---109---
<l.d.—values below the detection limit.
Table 3. Comparison of the Zn, Cu, Mn, Fe, Cd, As, and Pb concentrations (ng m−3) in the PM10 samples between Aljustrel (Portugal) and Rio Tinto (Spain) of IPB [31].
LocalZnCuMnFeCdAsPb
Aljustrel103.9211.1110.60781.860.2012.0940.19
Rio Tinto28.206.308.58370.000.131.265.18
Table 4. Results of principal component analysis (PCA) of data from chemical composition of PM10 analyzed in SEM-EDX.
VariablesPC1PC2PC3PC4PC5
O0.833−0.066−0.0870.174−0.151
Al0.695−0.222−0.240−0.2290.070
Si0.767−0.233−0.401−0.122−0.022
S0.3730.3270.685−0.0880.154
Mn0.064−0.1480.0480.3940.670
Fe0.5460.2570.526−0.0030.217
Cu0.2010.0640.2340.641−0.613
Zn0.0710.4820.092−0.502−0.224
As0.0600.770−0.388−0.0050.022
Pb0.0670.625−0.4240.3590.198
Eigenvalue2.261.521.371.051.01
Total variance (%)22.6015.2213.6910.5210.14
Cumulative Variance (%)22.6037.8251.5162.0372.17
n = 1836 of the total particles analyzed in SEM-EDX.
Table 5. Correlation matrix from chemical elements of PM10 analyzed by ICP-MS.
NaCaMnFeCuZnAsMoCdSbPb
Na1.000
Ca0.1191.000
Mn0.6440.6571.000
Fe0.1620.5580.6321.000
Cu0.2290.5710.6630.9831.000
Zn0.1880.5690.6680.9890.9621.000
As0.1630.5150.6290.9880.9620.9941.000
Mo−0.2210.0820.021−0.299−0.263−0.248−0.2751.000
Cd0.1820.5350.6440.9590.9300.9690.981−0.3141.000
Sb0.0980.4790.5310.9830.9640.9750.984−0.3610.9551.000
Pb0.1190.5240.5780.9930.9640.9900.988−0.3190.9520.9911.000
Note: for an n = 13 and p = 95% we have ρ = 0.5529. The values in bold are significant.
Publisher’s Note: MDPI stays neutral with regard to jurisdictional claims in published maps and institutional affiliations.