Article

Carbonaceous Aerosol in Polar Areas: First Results and Improvements of the Sampling Strategies

1
National Institute for Nuclear Physics (INFN)–Florence Division, V. G. Sansone 1, 50019 Sesto Fiorentino (FI), Italy
2
Department of Chemistry “Ugo Schiff”, University of Florence, V. della Lastruccia 3, 50019 Sesto Fiorentino (FI), Italy
3
Institute of Polar Sciences, ISP-CNR, University of Venice, V. Torino 155, 30172 Venice-Mestre, Italy
4
Department of Physics and Astronomy, University of Florence, V. G. Sansone 1, 50019 Sesto Fiorentino (FI), Italy
5
CNR-ISAC, Via Gobetti 101, 40129 Bologna, Italy
6
Finnish Meteorological Institute, Air Quality Research, Erik Palmenin aukio 1, P.O. Box 503, FI-00101 Helsinki, Finland
7
Department of Environmental Sciences, Informatics & Statistics (DAIS), Università Ca’ Foscari, Dorsoduro 2137, 30123 Venice, Italy
*
Author to whom correspondence should be addressed.
Atmosphere 2021, 12(3), 320; https://doi.org/10.3390/atmos12030320
Submission received: 28 December 2020 / Revised: 28 January 2021 / Accepted: 23 February 2021 / Published: 28 February 2021

Abstract

:
While more and more studies are being conducted on carbonaceous fractions—organic carbon (OC) and elemental carbon (EC)—in urban areas, there are still too few studies about these species and their effects in polar areas due to their very low concentrations; further, studies in the literature report only data from intensive campaigns, limited in time. We present here for the first time EC–OC concentration long-time data records from the sea-level sampling site of Ny-Ålesund, in the High Arctic (5 years), and from Dome C, in the East Antarctic Plateau (1 year). Regarding the Arctic, the median (and the interquartile range (IQR)) mass concentrations for the years 2011–2015 are 352 (IQR: 283–475) ng/m3 for OC and 4.8 (IQR: 4.6–17.4) ng/m3 for EC, which is responsible for only 3% of total carbon (TC). From both the concentration data sets and the variation of the average monthly concentrations, the influence of the Arctic haze on EC and OC concentrations is evident. Summer may be interested by high concentration episodes mainly due to long-range transport (e.g., from wide wildfires in the Northern Hemisphere, as happened in 2015). The average ratio of EC/OC for the summer period is 0.05, ranging from 0.02 to 0.10, and indicates a clean environment with prevailing biogenic (or biomass burning) sources, as well as aged, highly oxidized aerosol from long-range transport. Contribution from ship emission is not evident, but this result may be due to the sampling time resolution. In Antarctica, a 1 year-around data set from December 2016 to February 2018 is shown, which does not present a clear seasonal trend. The OC median (and IQR) value is 78 (64–106) ng/m3; for EC, it is 0.9 (0.6–2.4) ng/m3, weighing for 3% on TC values. The EC/OC ratio mean value is 0.20, with a range of 0.06–0.35. Due to the low EC and OC concentrations in polar areas, correction for the blank is far more important than in campaigns carried out in other regions, largely affecting uncertainties in measured concentrations. Through the years, we have thus developed a new sampling strategy that is presented here for the first time: samplers were modified in order to collect a larger amount of particulates on a small surface, enhancing the capability of the analytical method since the thermo-optical analyzer is sensitive to carbonaceous aerosol areal density. Further, we have recently coupled such modified samplers with a sampling strategy that makes a more reliable blank correction of every single sample possible.

1. Introduction

In recent years, increasing attention has been paid on the study of carbonaceous aerosols, constituted by organic carbon (OC) and elemental carbon (EC). These compounds, indeed, play a major role in influencing the Earth’s radiation budget and climate: they scatter sunlight directly back into space (direct effect [1,2]) and can modify the size of cloud particles, changing how the clouds reflect and absorb sunlight (indirect effect [3,4]).
Due to the increasing anthropogenic emission of aerosols since the industrial revolution, they also have an impact on global climate change. However, the effects of concentration, composition, and dynamics of aerosols on climate are not one-way and excessively uncertain [5].
The Polar Regions are particularly affected by climatic and environmental changes as a consequence of the present global warming. For this reason, it is more and more compelling to improve the knowledge about the processes responsible for the observed past, through the interpretation of chemical stratigraphies stored in the ice cores, and present changes, investigating the atmospheric concentrations of greenhouse gases and aerosols.
Carbon fraction can be split into elemental carbon (EC) and organic carbon (OC); the sum of these two components is called total carbon (TC). EC and black carbon (BC) are strictly related but not directly comparable as they are defined (and measured) according to different properties; namely, EC is the most inert carbonaceous fraction in combustion following defined protocols, and BC is defined according to its optical (absorbing) properties (e.g., [6,7]).
OC is a mixture of hydrocarbons and oxygen compounds, and it can belong to both primary and secondary aerosol: primary OC is usually produced by combustion processes, while secondary OC is originated by condensation reaction of particles, chemical and physical adsorption of gases on aerosol particle surface, and transformations of volatile compounds. The investigation of OC is important because it increases in hygroscopicity during transport, and this is very important in the cloud–aerosol interaction [8]. The EC fraction is mostly composed of primary particulates and is produced by combustion of fossil combustibles, fuels, or biomasses. The investigation of this fraction is crucial because of its effects on human health [9,10,11] and its impact on surface albedo in snow-covered regions. Several studies [12,13,14,15,16,17] have demonstrated that EC and dark aerosols, such as dark dust, reduce snow-covered surface albedo with a consequent increase of ice melting. It has been recognized as a driver of global warming [18,19].
The quantification of OC and EC deposited on a filter is usually accomplished by exploiting their different thermal and optical properties (thermal-optical analysis (TOA) techniques). Nevertheless, OC and EC are among the most uncertain measurements with respect to sampling and analysis [20,21,22], as there is no analysis protocol approved by all the scientific community. Several protocols have been proposed during the years, and comparison among them has been published, which may help in choosing the most suited one depending on the sampling site and campaign characteristics [7,23,24]. Further, when low concentrations are expected, special attention has to be paid to blank levels and contaminations.
Numerous studies are present in both the Arctic and Antarctica about BC (e.g., [25,26,27,28,29,30,31,32,33,34,35,36,37,38,39,40]). Instead, works about EC and OC in polar areas are very rare, and all of them are focused on short campaigns of a few months (e.g., [8,37,41,42,43].
Concentrations of carbonaceous species are higher in the Northern Hemisphere than in the Southern Hemisphere [33]; however, because of limited data and a major lack of observations at high southern latitudes, it has been difficult to temporally compare concentrations measured at the two Polar Regions.
To fill this gap of long-time data series on aerosol chemical composition (and especially EC and OC records that are of interest in this work), two observatories have been set up, in the Arctic and in Antarctica. These laboratories (described in detail in the following section) are equipped with a number of aerosol samplers in order to gain information on a number of chemical species (such as elements, ions, metals, and carbonaceous components) and other properties (e.g., number size distribution and optical properties) under the joint effort of a pool of research groups from different Italian universities and research institutions. To the best of our knowledge, in the present work, we present for the first time long-time data series of EC and OC data obtained from the sea-level observatory of Ny-Ålesund, in the High Arctic (data for the years 2011 to 2015), and from Dome C, in the East Antarctic Plateau (from December 2016 to February 2018). Once the rest of the chemical analysis will be available, all the records will be joined to get a comprehensive picture of aerosol chemical composition for a better understanding of the main sources, transport, and transformation processes of atmospheric aerosol delivered to both the High Arctic and the Antarctic Plateau.
Further, our experience with the sampling and analysis of these first data series brought us to develop innovative methodological strategies for sampling, which are here presented for the first time. Such improvements will allow us to get more reliable data and decrease uncertainties associated with data.

2. Sampling

2.1. Sampling Sites

Samplings were conducted at two opposite sites, one located in the Arctic, namely, Ny-Ålesund, Svalbard Islands, and one in Dome C, in the Antarctic Plateau.
Ny-Ålesund (78°56’ N, 11°56’ E), in the High Arctic, is a village located in the Svalbard archipelago, by Kongsfjorden (Figure 1). In this location, a facility for atmospheric studies was set up in 2010 at Gruvebadet, located in a favorable position in terms of dominant winds (east–west, along the fjord), for the possible contamination induced by human activities taking place at the village. The Gruvebadet atmospheric laboratory is located at about 50 m a.s.l., while the previously established (and still running) Zeppelin Station is at about 500 m a.s.l.: the two stations allow the study of differences in aerosol properties connected to the boundary level. Although quite warm for the High Arctic due to the warm West Spitsbergen Current, Ny-Ålesund can be considered a representative of low troposphere in the Arctic at regional scale [44,45,46,47]. Further, the site is experiencing very fast warming, which may lead to its conversion into an Atlantic site (instead of an Arctic site) in a decade and is therefore an ideal site for studying climate changes.
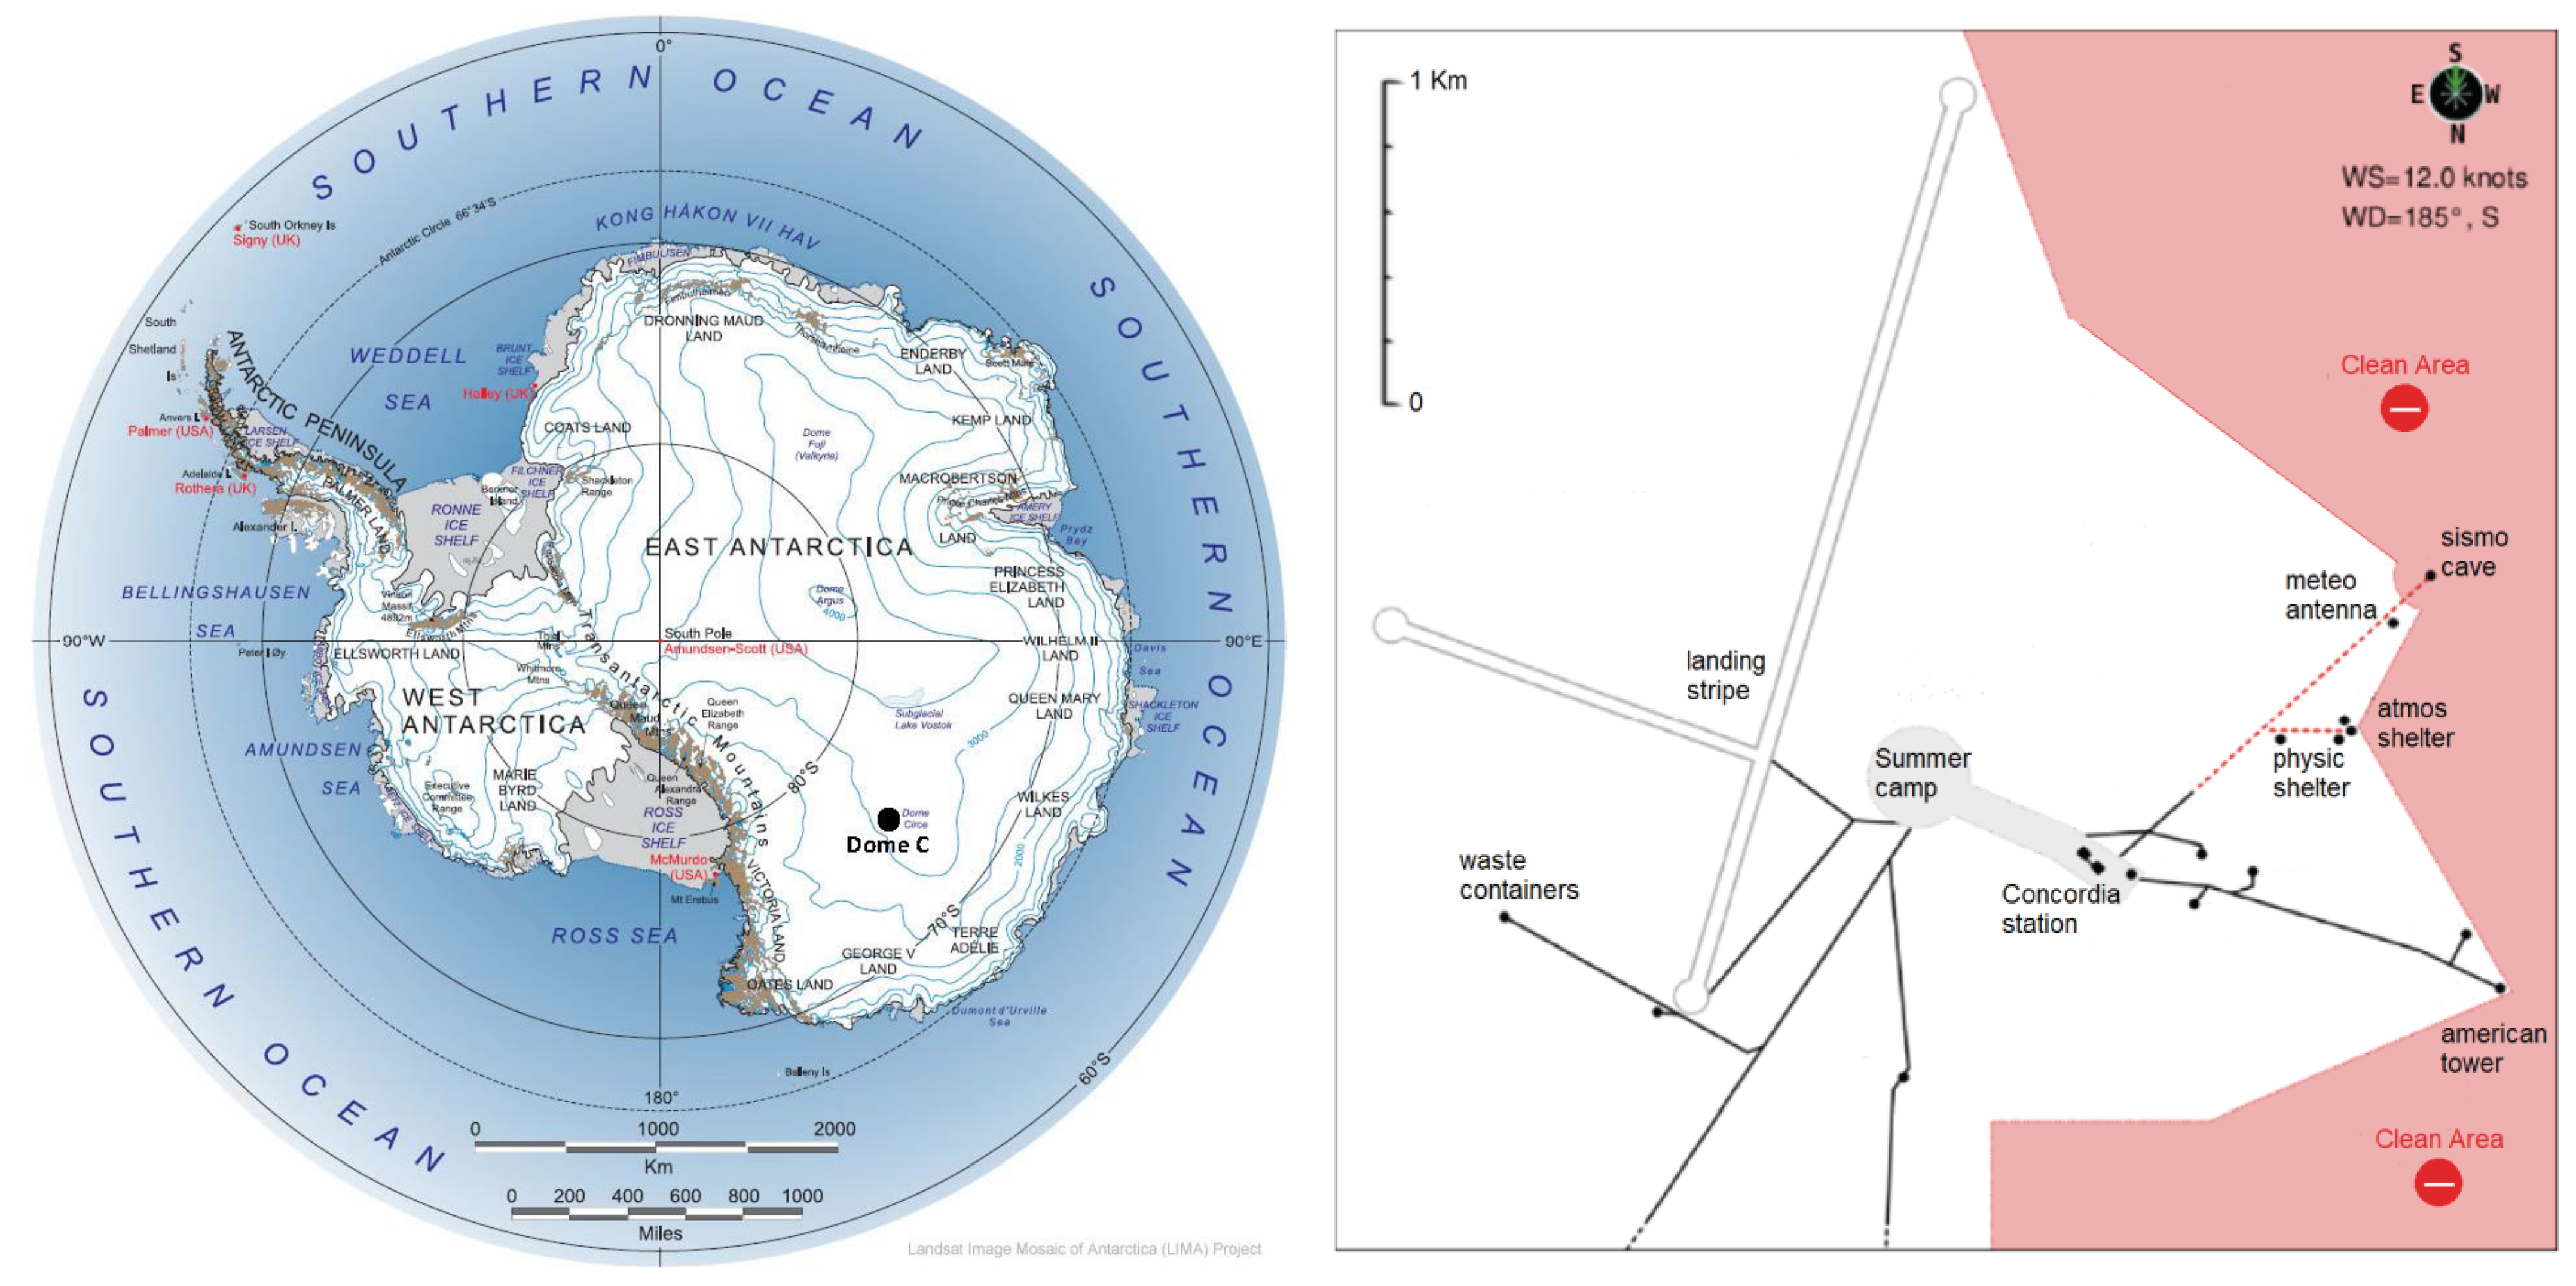
Dome C (75°06′ S, 123°21′ E) is located at 3233 m a.s.l. on the East Antarctic Plateau, south of the Indian Ocean, about 1100 km from the coastline (Figure 2). Placed on top of a large dome with a negligible slope, Dome C is not affected by the typical intense katabatic winds observed in Antarctica. The ice cap has a thickness of 3250 ± 25 m, a mean annual temperature of −53° C, and a mean annual accumulation rate of some tens of mm of equivalent water (corresponding to about 7.4 cm of snow) per year at the surface [48]. This small accumulation rate is due to the very low humidity in the atmosphere.
Samples were collected in the framework of the PNRA’s (Programma Nazionale di Ricerca in Antartide) project LTCPAA (Long-Term Measurements of Chemical and Physical properties of Atmospheric Aerosols at Dome C).

2.2. Sampling Instrumentation and Substrata

Aerosol samplers are located inside the shelter ATMOS, located 700 m southwest far from Concordia Station, the main base, in a devoted area called “clean area.” It is located upwind with respect to the dominant winds to avoid/minimize the risk of a possible contamination from the evacuation fumes of power units of the station and anthropic activity at Concordia Station. Anyway, in order to further decrease this possible contamination risk, a meteorological trigger is connected to the instrument, stopping the samplings when wind direction is from the station and/or when the wind intensity is very low (below 0.5 m/s), causing stagnating conditions of the pollutants in the surrounding area. This device started to work around May 2017, so some data before that date could be affected by contamination coming from the station.
While the Dome C observatory is operated through all the year (although with a reduction of activities during the colder seasons), the Gruvebadet atmospheric laboratory was operative only during spring and summer (roughly March to September) until 2015; since then, the opening season has been extended, and nowadays, some measurements are running all over the year.
Aerosol samplings for EC and OC determination were accomplished in both sites by a low-volume Tecora Echo PM device equipped with a PM10 sampling head (able to select particles characterized by an aerodynamic equivalent diameter (a.e.d.) lower than 10 μm) operating at a flow of 38.33 L/min (2.3 m3/h) and loaded with quartz fiber filters.
CHM Chem Lab Group (Barcelona, Spain) quartz filters with a diameter of 47 mm were used for aerosol sampling in both sites, Advantec MFS Inc. (California, USA) quartz filters with a diameter of 47 mm in the Arctic for a period in 2015. In the latter site, samplings were performed on a 4-day basis up to 2014 (corresponding to 220 m3 of air passing through the filter). From then on, they have been performed daily on 47 mm diameter filters (first months of the campaign) and on 25 mm diameter filters (corresponding to 55 m3 of air passing through the filter); in Antarctica, samplings have been performed on 25 mm diameter filters, integrating over 8 days (corresponding to 440 m3 of air passing through the filter), since the beginning of the campaign. Blank filters had been periodically collected until the procedure was changed to the innovative one described in Section 4.1. More details on the sampling schedule may be found in Section 4.2, while the method is described in the following section.

3. The Thermal-Optical Analysis

The analysis of EC–OC samples was carried out by using a thermal-optical analyzer by Sunset Laboratory Inc. (USA): the instrument quantifies EC, OC, and TC based on the combustion of the sample according to a pre-established thermal protocol, exploiting different combustion conditions (oxidizing/inert), monitoring the thermal-optical transmittance (TOT).
With more detail, the analysis is performed on a punch of a known area (in our case, 1.5 cm2) from a sample collected on a quartz fiber filter, and it consists of three different steps: one for organic carbon (OC), one for elemental carbon (EC), and the last one for internal calibration.
In the first step, the instrument works in a pure helium atmosphere under increasing temperature (up to 870° C), so the organic compounds (OC) desorb from the filter and are delivered by the carrier gas in the near oxidizer oven, where they are oxidized catalytically to carbon dioxide (CO2) by manganese dioxide (MnO2). Then the produced CO2 reaches another reaction chamber (methanator), where, with hydrogen (H2) and nickel (Ni) catalyst, it is converted into methane (CH4). During the second heating step, elemental carbon (EC) and pyrolyzed carbon (occurred in the first step by incomplete combustion) are oxidized to carbon dioxide (CO2) by a mixture of gas made of helium (He) and oxygen (O2) (10%) at higher temperatures (up to 890° C); thus, these carbonaceous vapors are converted into methane (CH4) and then measured by a flame ionization detector (FID), as well as the one produced in the first step. The third step is an internal instrument calibration; at the end of every measurement, a fixed volume of calibration gas, methane (CH4) in helium (He) (5%), after travelling the whole path as the gases from the unknown sample, is measured by FID to correct every measurement from little variation, improving the stability and repeatability of the instruments.
As the charring of OC (the so-called pyrolytic carbon (PC)), occurring during the first step by incomplete combustion, may cause an incorrect quantification of the amount of OC and EC on each sample, the instrument is equipped with a laser and a detector continuously measuring the transmittance of the filter [49,50,51]: the splitting point between OC and EC is reached when the transmittance, after the decrease due to charring, regains the initial value, indeed allowing for a more accurate estimate of the measured quantities rather than relying on the only thermal behavior.
Thermal-optical analysis (TOA) is currently considered by the European Committee for Standardization (CEN) as the reference methodology for measuring atmospheric particulate EC and OC deposited on filters. Nonetheless, a literature review [23] listed several critical factors that characterize the many thermal protocols available for this kind of analysis methodology (e.g., NIOSH-like, IMPROVE_A, and EUSAAR_2). Several intercomparisons showed that it is not possible to evaluate the “best” thermal-optical protocol, but that the most suitable one should be selected for each campaign as a function of various parameters, such as dominant sources in the area of investigation, especially considering biomass burning emissions. Various studies report, indeed, that different thermal protocols agree very well on the determination of total carbon (TC), which is the sum of OC and EC (e.g., [52]), but the measurement of EC differs by a factor of 2–10, as a function of the dominant aerosol sources in the sampling area and of the optical property measured for charring correction, namely, transmittance or reflectance [52,53,54,55,56,57,58].
The study [7] compared the three most used protocols, NIOSH-870 [59], IMPROVE_A [60], and EUSAAR_2 [61], correlating EC concentrations measured on untreated and washed samples (where the water-soluble organic compounds that may enhance the charring process during the OC thermal evolution, strongly affecting and complicating the EC quantification, are removed) in order to find the best protocol considering different sampling origins. The result revealed that there was a better agreement between EC measured on washed and untreated samples using the NIOSH-870 protocol, and so there was a minor influence of pyrolytic carbon on EC. For this evidence (and references therein), the protocol NIOSH-870 (Quartz of the National Institute for Occupational Safety and Health) was chosen as the best protocol for this particular work as the amount of EC especially in polar samples is very low.
A complete calibration curve (covering the whole concentration range of the samples) is carried out periodically, measuring standard solutions of sucrose at five different concentrations (0.5, 1, 2, 4, and 4.2 μg/μL): a small volume (10 μL) of each solution is dripped, using an Eppendorf pipette, on a blank filter and then analyzed as the unknown samples.

4. Improvements in the Sampling Strategies

4.1. Analytical Performance and Blank Levels

Although the samples collected in the Arctic may be relatively loaded (especially during advection of polluted air masses or related to biomass burning events), EC and OC concentrations were expected to be generally very low. Therefore, when dedicated samplings were started in the Gruvebadet atmospheric laboratory in 2010, special attention was paid to choose a sampling time allowing for collecting enough material for the analysis and minimizing contaminations (during handling, sampling, shipment, and analysis of the samples). Nevertheless, the experience gained during the first sampling years led us to improve the sampling strategy. The know-how, acquired in 6 years in the Arctic measurements, allowed us to optimize the determination of the carbonaceous components in Antarctica.
The observed OC campaign blank levels were quite variable, spanning in the range of 0.5 to 3.0 μg/cm2 (when 47 mm diameter quartz fiber CHM Chem Lab Group filters were used, and occasionally getting values as high as 4.0–4.5 μg/cm2 when Advantec MFS Inc. (California, USA) filters were used in the Arctic, for a short period due to unavailability of the other filters). On the contrary, EC blank levels were found for the majority of measurements below the detection limit declared by the instrument manufacturer (0.2 μg/cm2).
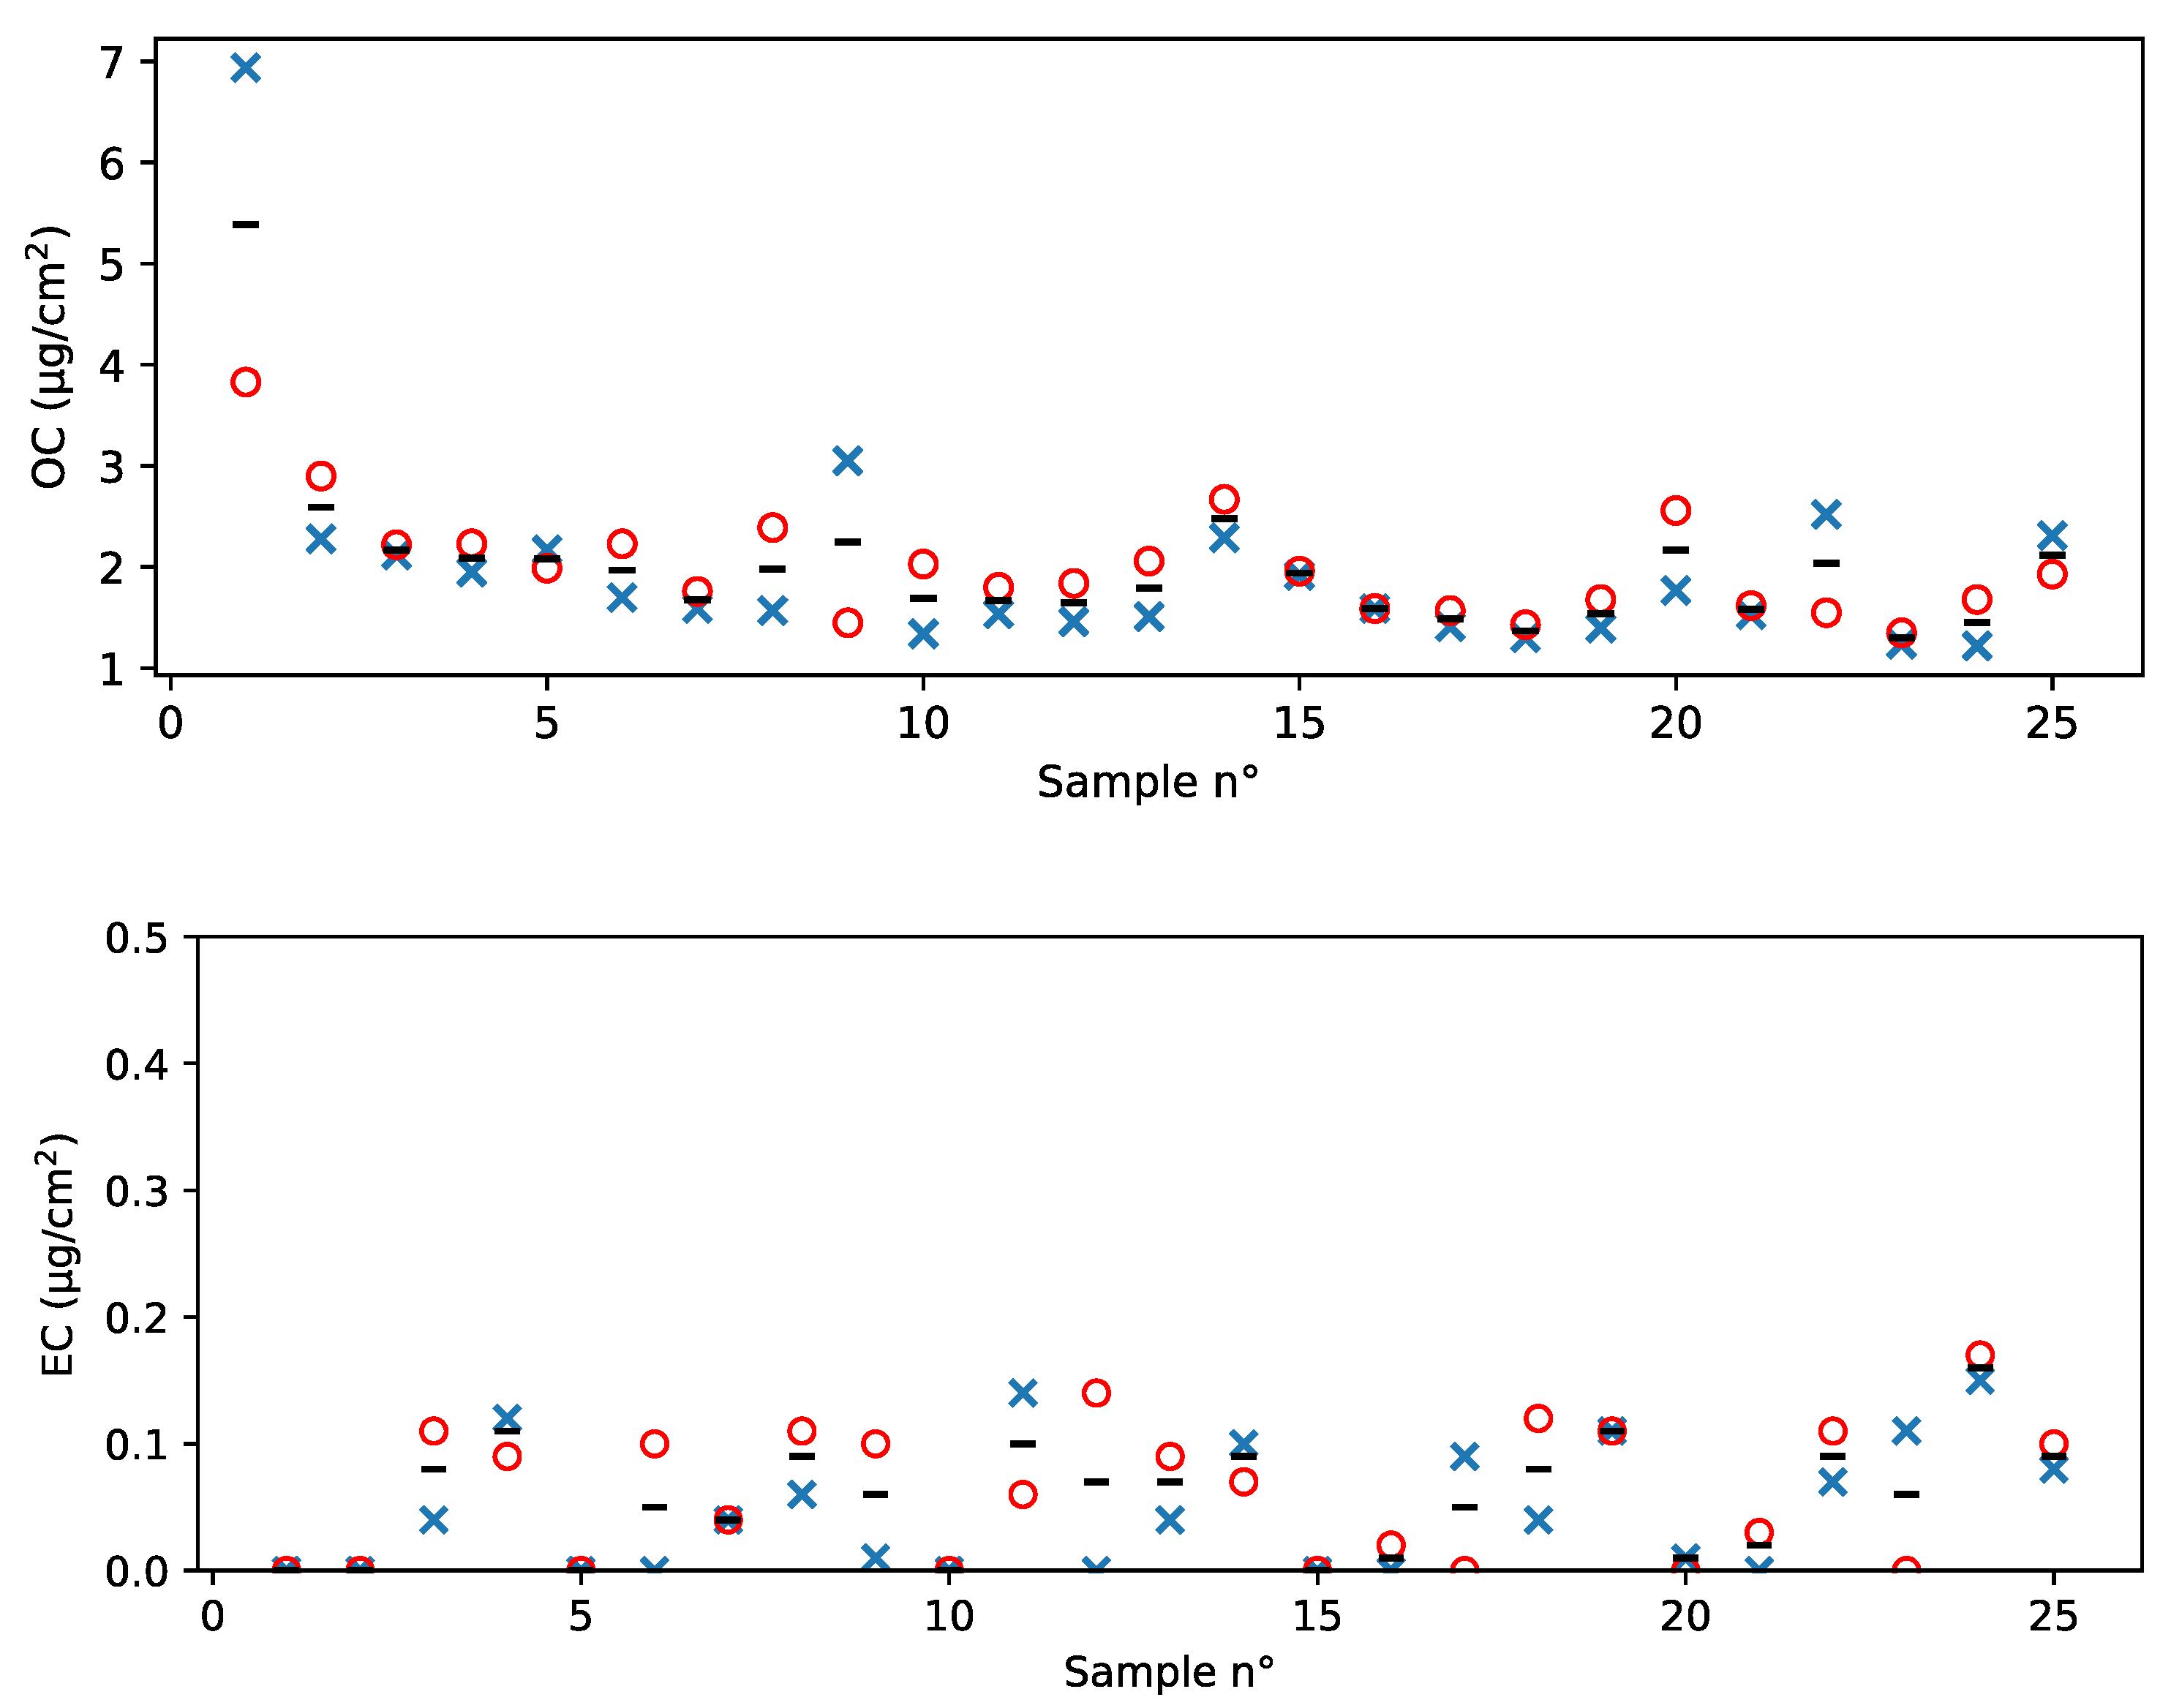
In order to deepen the understanding of blank variability, a whole box of 47 mm diameter quartz fiber CHM Chem Lab Group filters was analyzed in the laboratory, for a total of 25 filters. This set of filters is of the same type as the ones used during the campaign, but it did not undergo shipping or handling during sampling. Two punches of every filter were analyzed, and then for every filter, a mean value was calculated (Figure 3). For OC, measured values span from 1.2 to 3.1 μg/cm2 (1.88 ± 0.45 μg/cm2 on average, with the uncertainty evaluated as standard deviation) when the first filter of the box is excluded, as it turned out to be highly contaminated and inhomogeneous (5.4 μg/cm2 on average); results on blank levels and contamination of the first filter agree with findings already published in the literature [23]. As for EC, blank levels were found to be under the aforementioned detection limit declared by the instrument manufacturer (0.06 ± 0.05 μg/cm2).
The measured values were used to estimate the method detection limit (MDL), calculated as three times the standard deviation of all the blank filters in the package box but the one on top of the pile [62]. MDLs are reported in Table 1, expressed as both µg/cm2 and ng/m3 in the sampling conditions applied in the two sites (see the following sections).
For EC, the estimated MDL agrees with the order of magnitude declared by the manufacturer (0.2 μg/cm2); for OC, the estimated MDL points to the fact that blank variability is an issue to be carefully taken into account as it exceeds by a large factor the instrument MDL, and this is especially important in remote area campaigns. Among the most likely causes of contamination for OC on filters are the production process (possibly using plastic devices to stamp and to cut the filters), the storage (usually done by plastic boxes), and the adsorption of gaseous organic species from the atmosphere during the storage itself and/or handling and shipping.
Indeed, the analyzed box differs from the campaign blanks as filters were neither shipped to the observatories nor handled in the therein dedicated laminar flow boxes. The measured levels for this filter box are in the range experienced during the campaigns; although absolute blank levels do differ, the variability experienced in every single campaign was of the same order of magnitude as the one observed for this “test box,” so the MDL in Table 1 may be considered representative of the whole data set. It is useful to point out that the difference in blank levels is not surprising, as differences among different batches/boxes, although of the same type, are known to be frequent [23].

4.2. Innovative Sampling Strategies

With the procedure of sampling in the Arctic based on a 4-day standard low-volume sampling (200 m3, 47 mm diameter), 100 ng/m3 of OC produces a deposit of roughly 1.7 μg/cm2. As concentrations of tens to few hundreds of ng/m3 of OC are more than likely in the Arctic, these values appear to be very close to the MDL, actually exactly of the same order of magnitude. Further, the variability of the blanks (even in the same batch/box) is such that it may relevantly increase the uncertainty on the absolute values and may mask OC concentration variations with a physical meaning. Indeed, these considerations apply even more to the Antarctic samples, as concentrations in Antarctica are far lower than those found in the Arctic.
Therefore, we have developed a new sampling method aiming at (A) increasing the signal-to-noise ratio of the samples, which is increasing the OC areal density on the sample as this is the quantity the thermo-optical analyzer is sensitive to, and (B) having a better estimate of the blank value for every single sample in order to get rid of the blank variability noise, which is high with respect to the concentrations we want to measure.
Air samplers were modified with the introduction of especially designed inlet reducers and filter holders in order to be able to use 25 mm diameter filters and to collect the aerosol on a deposit with a 20 mm diameter. Keeping the sampling air volume constant, the switch from 47 mm to 25 mm diameter filters increases the areal density by a factor 3.8. This gain may be used to decrease the sampling time from 4 days to 1 day, keeping the same areal densities, or to enhance the signal with respect to the blank, keeping the same sampling time. The reduced deposit area was chosen in order to be able to use the pump of the instrument (minimizing the interventions on the sampler) and to have a deposit where a rectangular 1.5 cm2 punch can be cut. In principle, the thermal-optical analyzer accepts punches of 1 or 1.5 cm2. Nevertheless, rigorously speaking, the quantity to which the analyzer is sensitive is the carbon areal density multiplied for the punch area; therefore, decreasing the punch size by one-third requires a further increase of the density by one-third. Thus, the chosen deposit size is the best compromise, as a further reduction does not result in a better sensitivity of the instrument due to the necessity of reducing the punch size and would also be technically difficult to reach with the operating pumping systems.
The reductions for the inlets were especially designed and realized at the INFN–Florence with special attention to avoiding leaks and abrupt changes of the flow line, where particles may have an impact, in order to minimize aerosol losses. Reductions were realized for the Tecora low-volume samplers Echo PM and Skypost.
As concerns the blank value estimate, a special procedure was set up to get a reliable blank value for every single collected sample. Although the samplers with the inlet reduction work with 25 mm diameter filters, the sampling stations are provided with 47 mm diameter quartz filters. The operator punches out of them a 25 mm diameter filter just before loading it in the sampler and keeps the remaining “corona” in a separate petri slide. When the punch is taken decentralized, on the remaining “corona,” it is still possible to collect up to two 1.5 cm2 rectangular punches suitable for the thermal-optical analyzer. After sampling, both samples and correlated blank “coronas” are sent to the laboratory for the analysis.
The inlet reductions are in use in the Arctic since 2015, and in Antarctica since the beginning. The new procedure for blank evaluation is operative in both sites since 2017.
The use of inlet reductions made it possible to switch from a 4-day sampling time to daily resolution in the Arctic for all of 2015 so that most of the chemical species (ions, elements, and carbonaceous components) are measured with the same resolution (suitable to follow meteorological variations and/or changes in the air mass pathways). In Antarctica, the sampling resolution has been fixed to 8 days since the beginning.
In Table 1, MDLs are converted to ng/m3 for all the sampling conditions used. In the Arctic and in Antarctica, when comparing the MDLs for daily samples (55 m3 sampling volume) on 47 mm and 25 mm filters, the use of reducers clearly results in an improvement of MDLs by almost a factor 4.

5. Results from Polar Samples

Besides methodological results, in this work, we present the data sets of EC and OC for the years 2011–2015 in the Arctic and from December 2016 to February 2018 for Antarctica. All the areal concentration values were corrected for the blank values measured on campaign blank filters; concentrations in the air for EC and OC were obtained by multiplication by the aerosol deposit area and by division by the sampled air volume. All the values below the MDL were substituted with their MDL/2 (i.e., corrected for their sampled air volume). Lastly, all the clearly contaminated samples, identified as characterized by sampling anomalies in the sampling notes or as single spikes not associated with particular facts or events, were removed from the data sets (for a total of four samples in Antarctica and three in the Arctic).
Uncertainties on the areal densities (µg/cm2) are calculated as the root sum square of the uncertainty on the blank values ( O C u n c , b l a n k 2 ) and the error of the instrument on the sample measurement ( O C u n c , m e a s 2 ). To take account of uncertainties on sampling, calibration standards, and handling, a further 5% uncertainty is added, following the approach already assessed in [63]. In summary, uncertainties are therefore calculated according the following expressions in Equations (1) and (2):
O C u n c = ( O C u n c , m e a s 2 + O C u n c , b l a n k 2 ) 1 2 + 0.05 · [ O C ]
E C u n c = ( E C u n c , m e a s 2 + E C u n c , b l a n k 2 ) 1 2 + 0.05 · [ E C ]
To get the uncertainties in air concentrations, these values undergo the same operations of the data set values, so they are multiplied for the whole area of the aerosol deposit on the filter and divided for the sampled air volume.

5.1. Arctic

Regarding the Arctic, the data set from 2011 to 2015 is presented. The sampling time and resolution are summarized in detail in Table 2, together with the means, the standard deviations, and the ranges of every component for every year.
The sampler devoted to the analysis of the EC–OC fraction was placed in the Gruvebadet atmospheric laboratory since 2011, running with a 4-day time resolution for the first 4 years (2011–2014); in the year 2015, the sampling strategy was modified as reported in Section 4.1. The time resolution was moved to a daily resolution since February 2015. As for the filter diameter, due to a shipment delay, initially, as well as in previous years, filters with a diameter of 47 mm were used; then starting 6 June, filters with a 25 mm diameter were used.
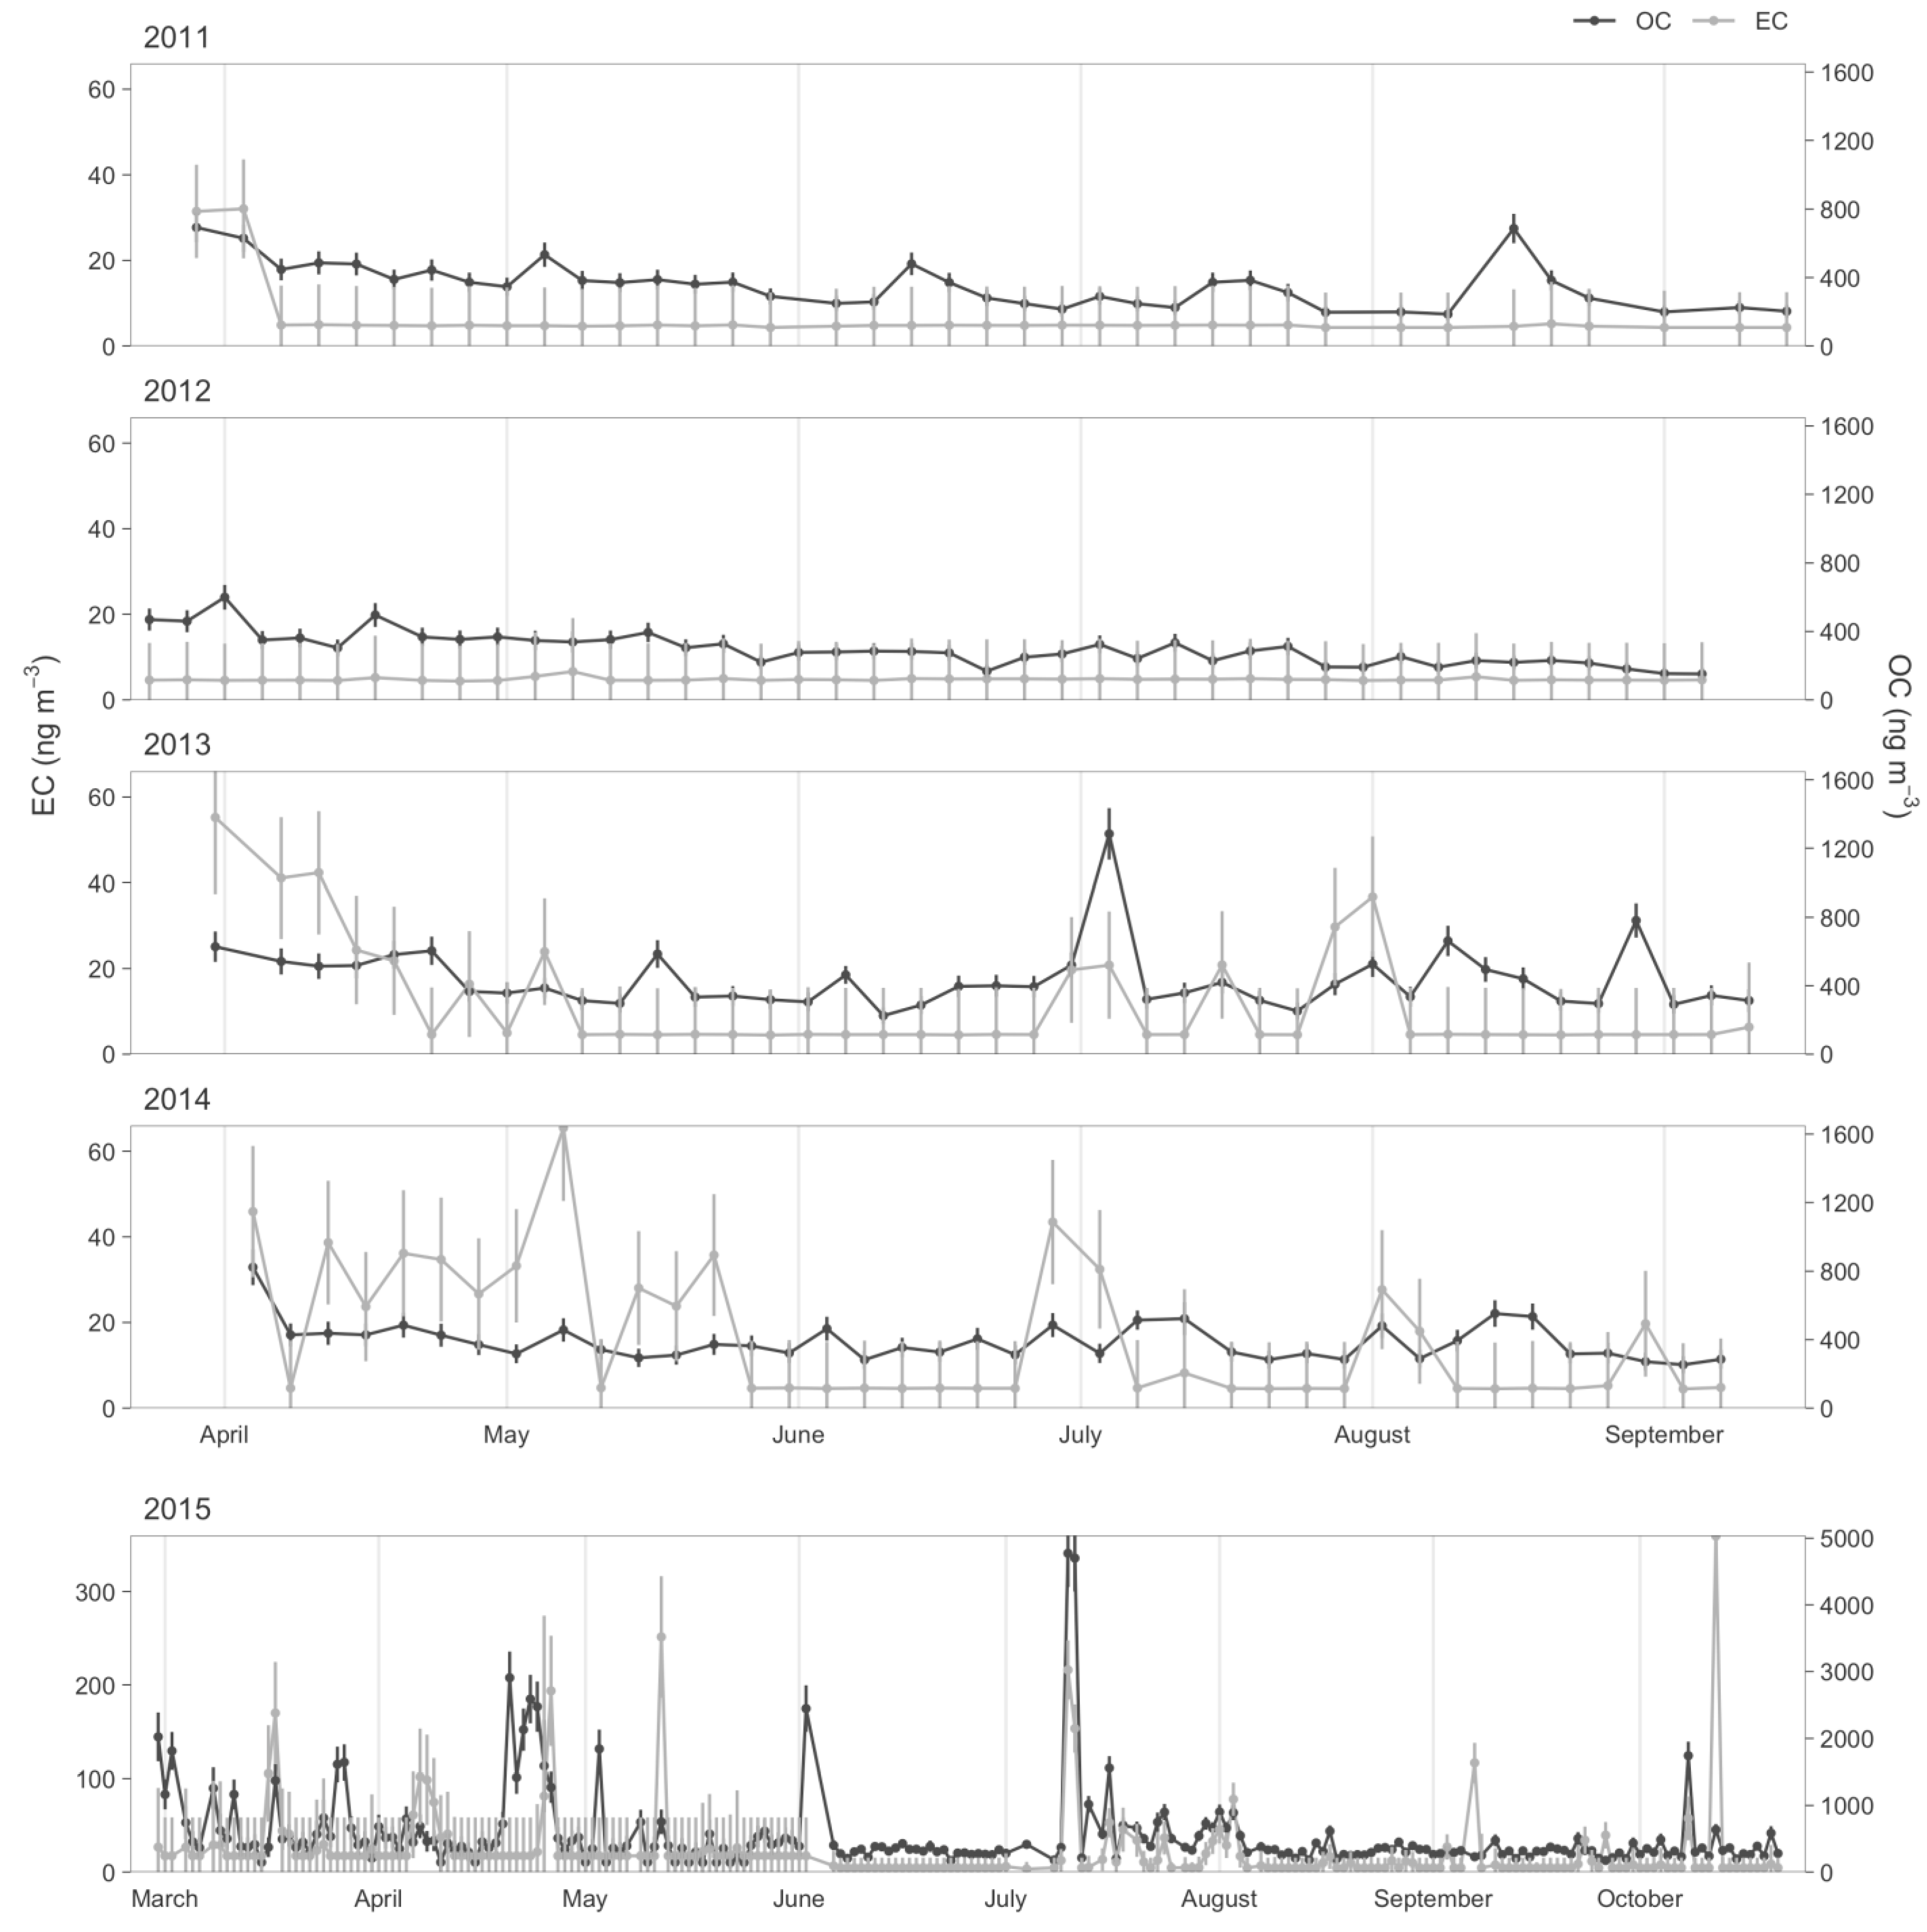
EC and OC time series are reported in Figure 4. As clearly shown, the use of a daily resolution (instead of a 4-day sampling) with the same filters highly increases the uncertainties; the use of the sampler inlet reducer allows a full compensation for such effect (in fact, as previously mentioned, the use of 25 mm diameter filters increases areal densities by roughly a factor 4), together with a clear decrease of the MDL value, especially visible for EC.
The EC and OC time series show a large variability during the study period, as expected for a site influenced by virtually no local source but several long-range transport and intrusion episodes.
The mean and the standard deviation mass concentrations for all the years together are 470 ± 477 ng/m3 for OC and 16 ± 32 ng/m3 for EC, which is responsible for only 3% of TC mass, since most values are below the detection limit.
As previously mentioned, numerous studies (e.g., [25,26,27,28,29,37,38,39,40,64,65,66]) were conducted about BC since the 1990s in some Arctic stations, and only few about OC/EC (e.g., [8,33,41]). All the measurements conducted at the Zeppelin Observatory (11.9° E, 78.9° N), located 478 meters above sea level on Mt. Zeppelin, just outside Ny-Ålesund (see Figure 1 on the right), reported a visible seasonal trend with a large load of carbonaceous fractions during the well-known Arctic haze, which is the phenomenon of a tropospheric brown haze due to the transport to high latitudes and the accumulation of anthropogenic pollutants from midlatitude industrialized areas [25,27,29,37,67,68]. In particular, during this phenomenon (January–March), Winiger et al [37] found a mean concentration of 710 ± 230 ngC/m3 with a range of 250 to 990 ngC/m3 of OC (without a blank correction of the values) and 230 ± 120 ngC/m3 with a range of 50 to 500 ngC/m3 of EC. The mean values found in our work are lower or of the same order of magnitude (from 371 to 829 for the month of April) for OC and one or two orders of magnitude less for EC, compared with the ones reported by [37]. This can be ascribed to the fact that our samplings catch only the last part of the Arctic haze period; further, as regards OC, our values are corrected for the blank value, which, as previously mentioned, accounts for about 10%–30% (with higher values in clean days). At last, the Zeppelin Station is higher in altitude compared with the Gruvebadet atmospheric laboratory, so they are characterized by different circulation dynamics of chemical compounds [25,69].
Anyway, in line with these studies, a sort of seasonal trend for OC is distinguished in this work, starting with higher concentrations in March–April, being the end of the Arctic haze, and then decreasing more and more going through the summer. Nevertheless, high-concentration episodes may quite frequently occur during the summer mainly due to the coincidence between wide wildfires in the Northern Hemisphere and meteorological conditions favoring the transport to higher latitudes. EC seems to follow the same trend, but it is less visible since the majority of the values are under the detection limit, while some high spikes present in the years 2013, 2014, and 2015 are of the same order of magnitude of those present during the end of the Arctic haze (most of them, as previously mentioned, due to big biomass burning episodes). These trends are clear in Figure 5a and Figure 6a, where monthly averages are reported for OC and EC, respectively, as boxplots (as only very few or no days of sampling are available for the months of March, such data appear aggregated to the April ones).
As regards the year 2015, several episodes with high OC concentrations were recorded. The highest ones, with a daily OC concentration of almost 5 μg/m3, were in mid-July, when also EC shows a big contribution (Figure 5b and Figure 6b): such episode was due to an intense wildfire that occurred in Canada, whose plume was transported by air masses, reaching Ny-Ålesund around 10 July [70], bringing a huge amount of different chemical species, including EC and OC.
For the summer period, July in particular, it will be more and more important and interesting to also study the increase in Arctic activities and emissions of shipping routes due to the melting of Arctic sea ice, opening to new possibilities and to extension of the period of shipping, besides using the existing routes [71,72,73,74,75]. More and more studies are focusing their attention on this new problem in Ny-Ålesund [25,76,77,78], which requires more investigations in the future.
A study [41] explored the chemical compositions of some aerosol samples collected during July 2012 with a sampler located at the Chinese Arctic “Yellow River Station” in Ny-Ålesund. For this year, the comparison is not shown since the EC concentrations of 2012, here presented, are under the detection limit, even though the sampling resolution is comparable. This fact can suggest that there were local sources in the village (such as vehicular transport, although very limited; cooking; and/or events of short-range transport from the harbor) impacting the Chinese Station, but not reaching Gruvebadet.
Analyzing in detail the average ratio of EC/OC of the data sets presented in this work for the months of June, July, and August, this value is found to be 0.05, ranging from 0.02 to 0.10. The typical ratios coming from heavy-duty diesel ships and vehicles can range from 0.2 to 2.4 [43,79]. Therefore, for Gruvebadet, a dominant contribution from ships or vehicles is not detectable in these months/years. Only in September 2015, we found some higher ratios up to 0.57. As more sources contribute to OC and EC, the ship/vehicle emissions may not be clearly identified on the basis of the only EC/OC ratio.
Low EC/OC values obviously mean very high OC/EC ratios, with an average of 17 (range 2–62) on days with EC higher than MDL in the whole sampling period, indicating the predominance of biogenic (or biomass burning) emission contributions, together with highly aged and oxidized aerosol due to long-range transport. This can be ascribed to a clean atmosphere with very low EC emissions and/or negligible local sources [80,81]. This is perfectly in line with other studies, which found lower ratios, around 2.0–3.0, for urban sites [80].
In future works, the next step will be joining all the information on the chemical composition and considering the meteorological conditions (temperature, pressure, global radiation, and wind direction and speed), origin of air masses, and variation of aerosol particle total number and volume over the whole measuring period in order to get a more comprehensive understanding of the variability of sources and transport and transformation processes. In this way, it will be possible also to infer possible information on primary and secondary organic carbon.

5.2. Antarctica

Compared with the Arctic, even fewer studies have focused on carbonaceous measurements and almost exclusively on BC. Most of them show the clear seasonal variability of BC, with autumn/winter minima and summer maxima; both coastal or internal sites are considered, with intensive [32,34] or longer campaigns [29,30,35,36].
The extreme meteorological conditions of Dome C (low temperatures, especially during winter; possibly strong winds; and darkness during the polar winter) make the long observation with high-time resolution sampling particularly challenging. The aerosol samples analyzed in this work were collected from 5 December 2016 to 15 January 2018, running with an 8-day time resolution.
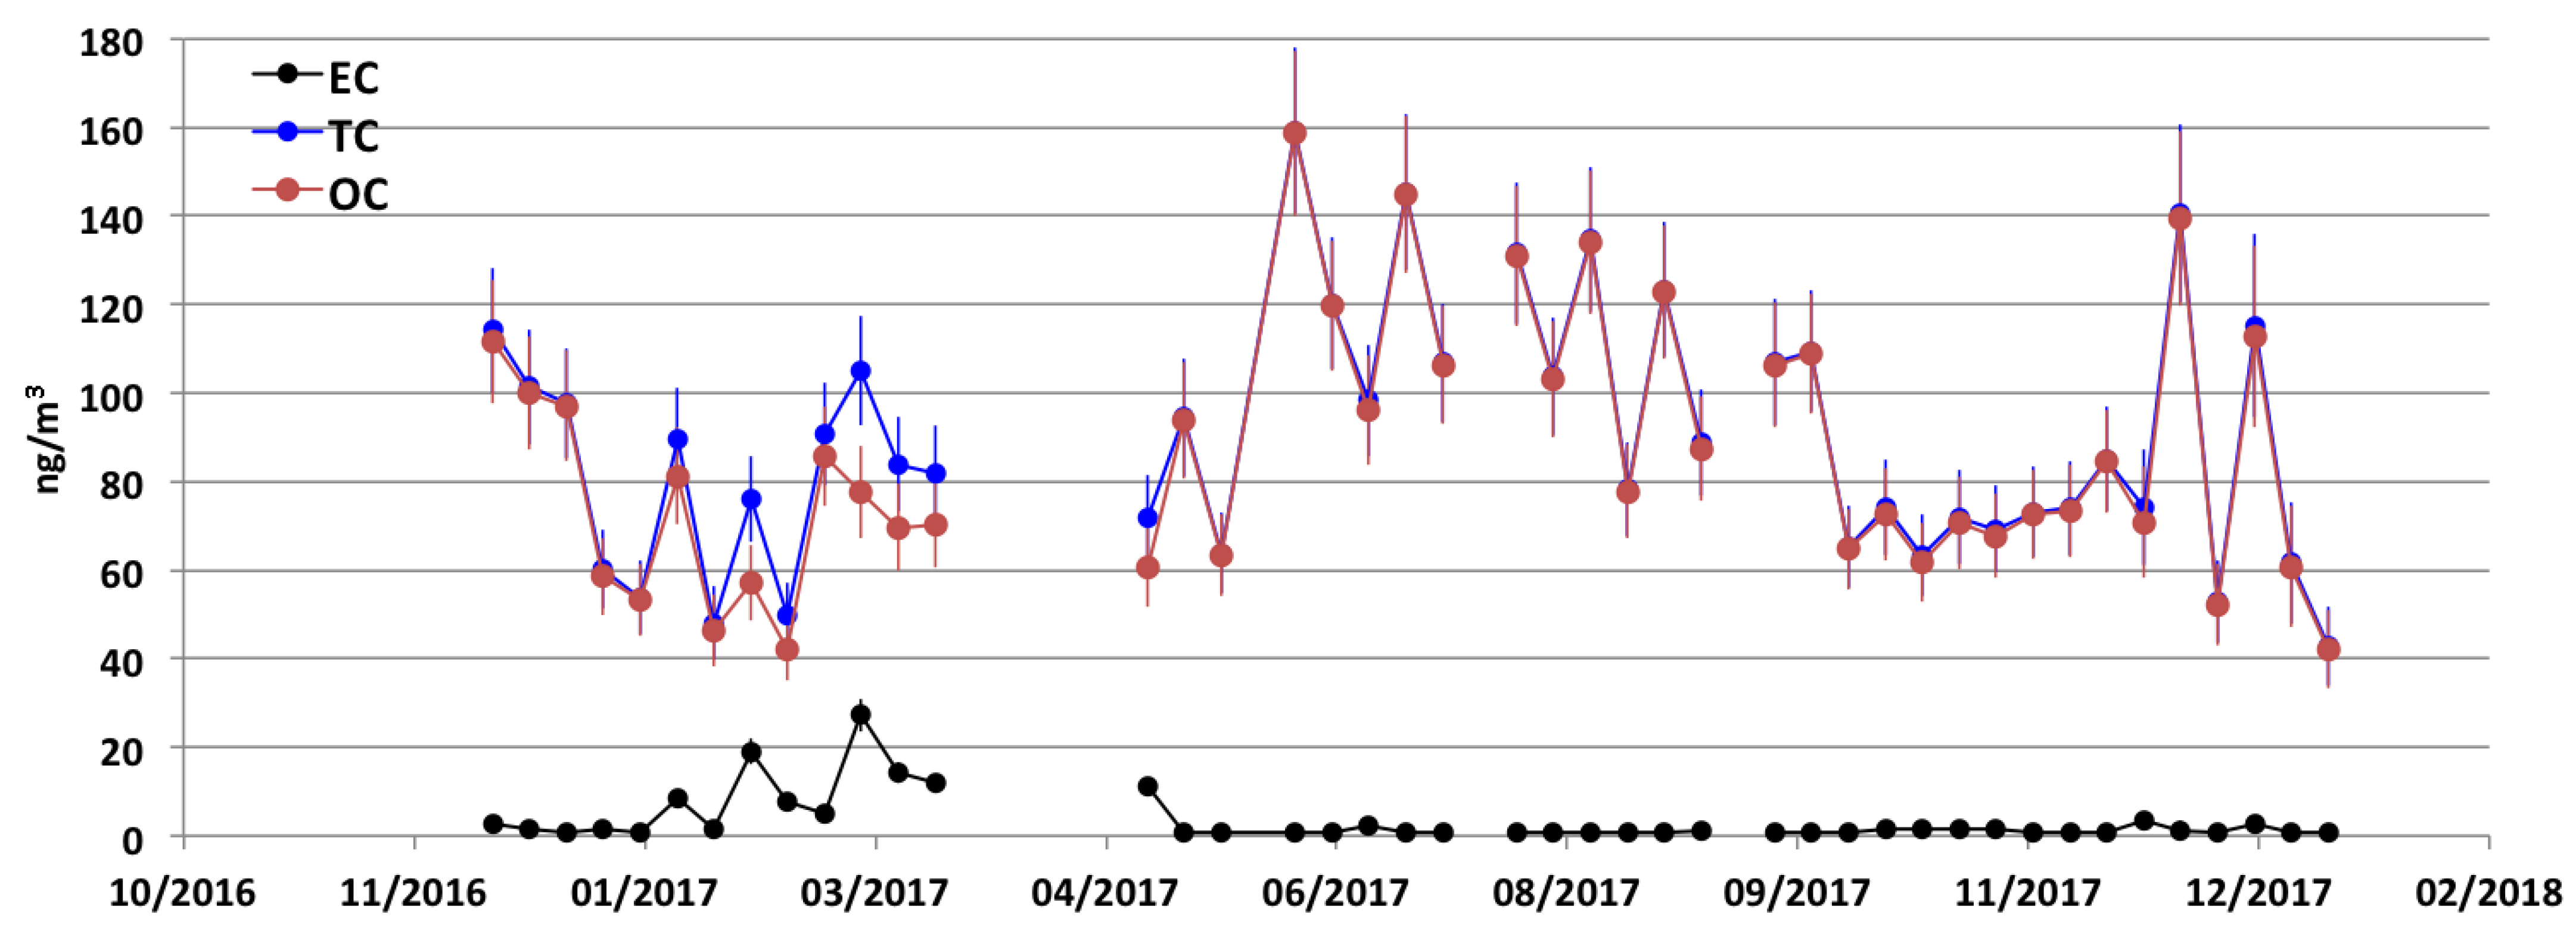
Figure 7 shows the OC and EC concentration data set. OC shows higher values during the two austral summer periods covered by our samples, namely, December 2016–March 2017 and December 2017–February 2018, and during the full polar winter; lower values were recorded during the intermediate seasons. The average value, 86 ± 29 ng/m3, as expected, is far lower than the values found in the Arctic. On the contrary, EC has comparable values, both the mean value, 3.3 ± 5.6 ng/m3, and the minimum and maximum values, ranging from 0.6 to 27.2 ng/m3. In this case, EC weighs for 3% on TC values. As the Arctic, EC has the majority of the data under the MDL, but we observed a big load at the end of the first summer considered and two little spikes during the second summer.
Currently, for both components, it is difficult to recognize visible seasonal trends, but in the future, data for more years will be available and will help in finding possible seasonal patterns for EC–OC in the Antarctic Plateau.
Considering the EC/OC ratio, the mean value found is 0.09, with a range of 0.01–0.35. The higher ratios are found in the month of March, when the summer campaign is already finished. Again, this can be another confirmation of a possible contamination from local pollution coming from the power generator of the station. Together with this, it will be interesting to associate with these data the rest of the chemical analysis and back trajectories to better understand the current sources of atmospheric particulate and gaseous components, their long-range transport processes, their depositional and postdepositional mechanisms, and their chemical transformation.
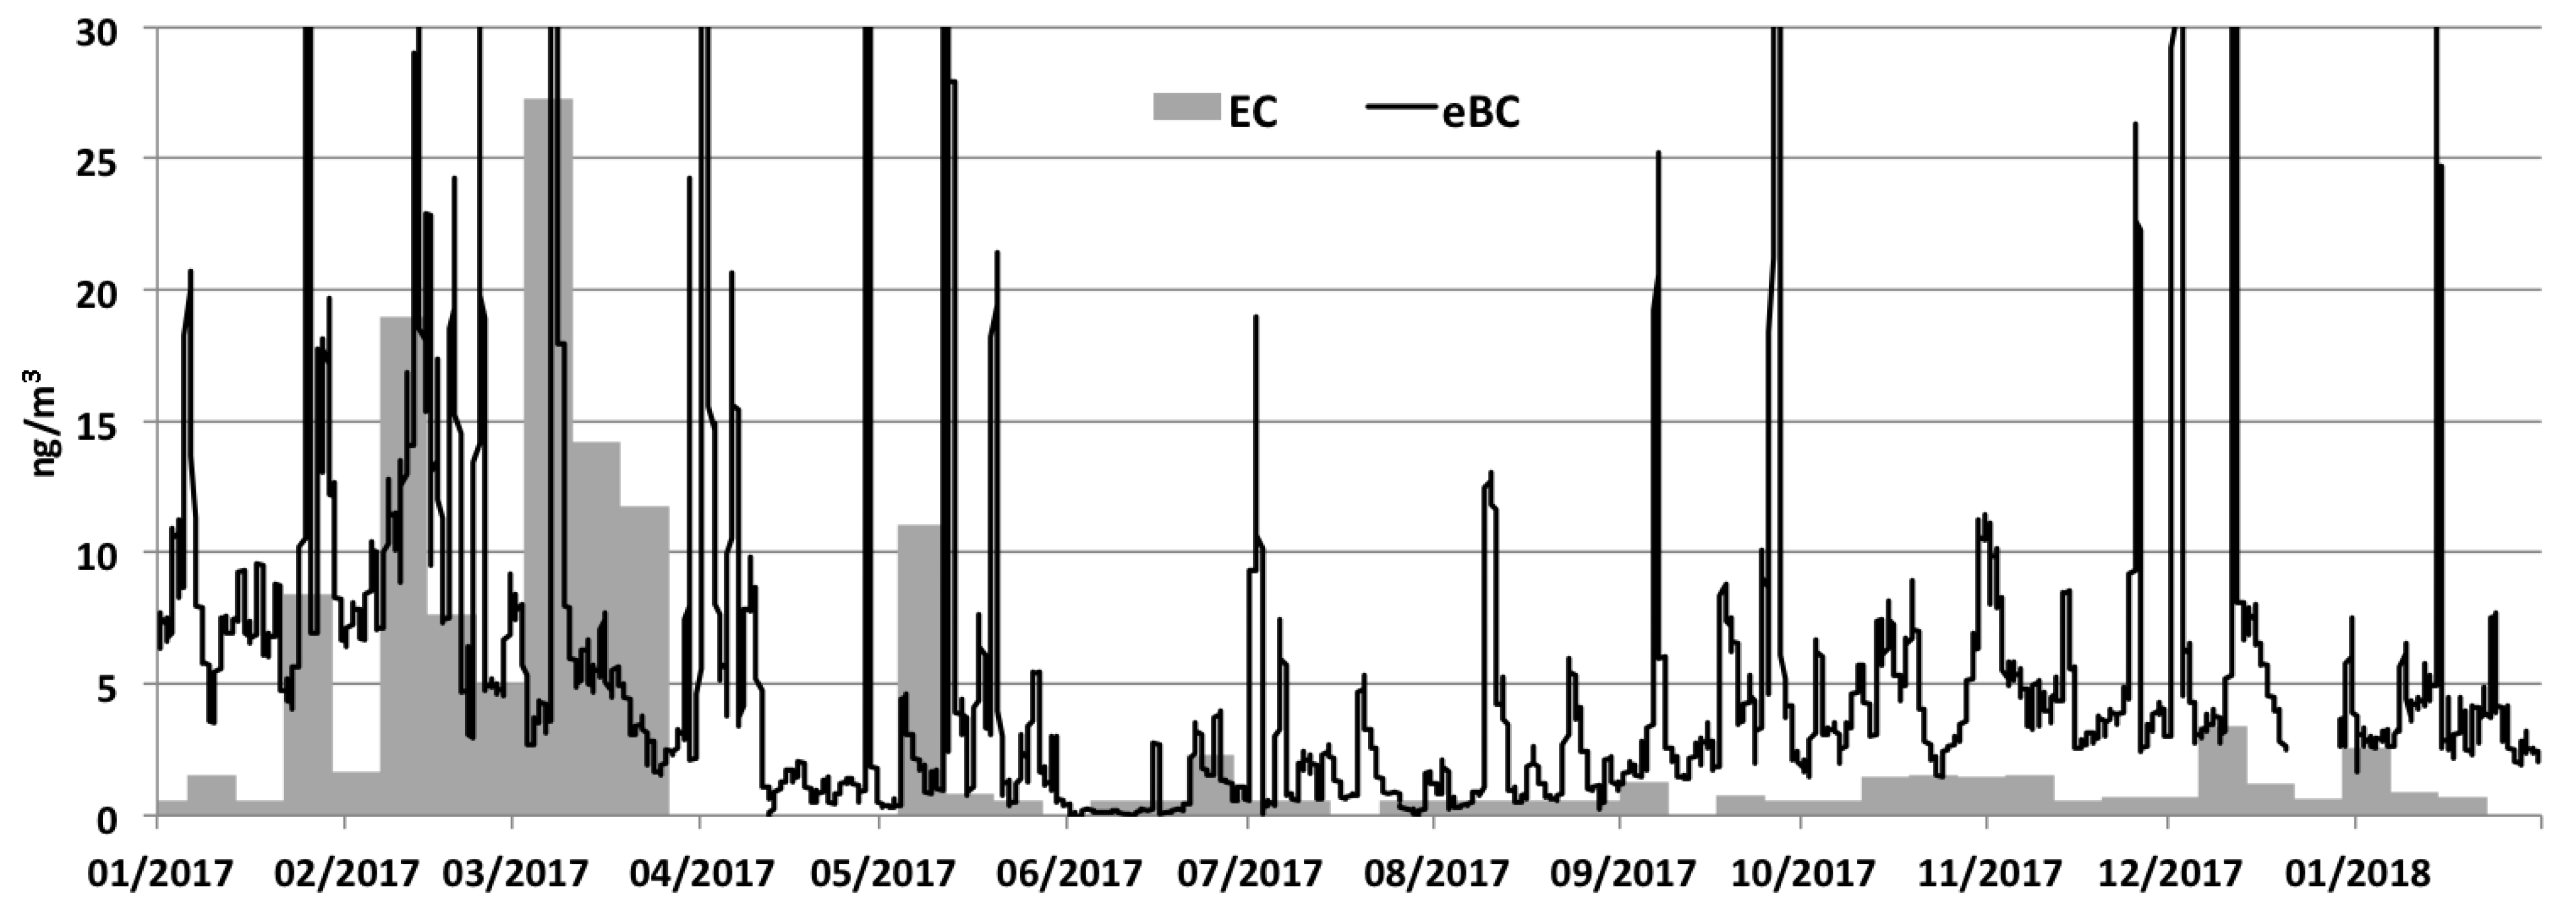
In the frame of the LTCPAA collaboration, we tried to compare EC values with equivalent black carbon (eBC) measurements performed by means of the PSAP (particle soot absorption photometer) instrument, also present at Dome C (Figure 8). The data that we present here have been processed using the formula from [82] with the adjustment [83] without scattering corrections (that will be done further ahead, together with a more extensive study of possible contamination coming from the station). Consequently, the values shown are upper estimates of true eBC concentrations. eBC concentrations were calculated by dividing the absorption coefficient with the mass absorption coefficient (MAC = 7.8 m2 g−1). The absorption coefficients were calculated for each hour.
EC data are generally lower than eBC: as previously mentioned, these values are upper estimates of eBC. Further, eBC data show very high peaks, which, in all likelihood, must be associated with contaminations events, probably due to wind coming from the station. The majority of these peaks are concentrated in the period February–April 2017, where EC values are also the highest. Exactly in that period, the aerosol sampler was not connected to the meteorological trigger, and so these data may also be associated with contamination. Therefore, for this first period, it will be necessary to perform a deeper analysis of the wind data and a consequent correction of the data. Moreover, this fact highlighted the fundamental importance of the meteorological trigger in order to completely avoid any kind of anthropic contamination.

6. Conclusions

In this work, we present for the first time EC–OC concentration long-time data records from two polar sites. The used methodology has been carefully investigated in terms of analytical performances on samples characterized by very low concentration levels of carbonaceous fractions, making the elemental carbon (EC) and organic carbon (OC) determination particularly challenging. In fact, thermal-optical analysis has not been widely used for samples from polar areas so far.
Thus, records of EC and OC concentrations from Ny-Ålesund, High Arctic, for the years 2011–2015, and Dome C, East Antarctic Plateau, for 15 months, from the end of 2016 to the beginning of 2018, are provided here.
In the Arctic, the mean and the standard deviation mass concentrations found for the years 2011–2015 are 470 ± 477 ng/m3 for OC and 16 ± 32 ng/m3 for EC, which is responsible for only 3% of the total carbon (TC). The influence of the Arctic haze is evident for both components, despite the fact that it is at the end of the phenomenon. Then, a slight increase in July is present. The average ratio of EC/OC for the summer period is 0.05, ranging from 0.02 to 0.10, indicating that the possible contribution from ships or vehicles does not dominate over the other sources. The high ratio of OC/EC indicates a clean environment and/or a possible local emission.
In Antarctica, the data sets do not present a clear seasonal trend. The OC average value is 86 ± 29 ng/m3; for EC, it is 3.3 ± 5.6 ng/m3, weighing for 3% of TC values. The EC/OC ratio presents a mean value of 0.2, with a range of 0.06–0.35. Conversely, OC/EC ratios present a large variability, ranging from 2.8 to 17.2.
Finally, a new sampling strategy is presented here for the first time, which allows, on the one hand, for the enhancement of the sensitivity of the technique by collecting a larger fraction of particulate as much as possible on a small surface, and, on the other hand, for the correction of every single sample measured with its own blank value, in order to have a more reliable correction method.
Once the chemical composition of the samples is studied in detail, together with a meteorological analysis, it will be possible to make full use of this data set in order to highlight and quantify the main aerosol sources influencing particulate matter in both the High Arctic and the Antarctic Plateau.

Author Contributions

Conceptualization, R.T., S.B., G.C., L.C.; methodology, M.C., G.C., S.B., R.T., L.C.; validation, R.T., S.B., S.N., F.L., M.S.; measurements, A.A., L.C., R.N., G.P.; formal analysis, L.C., G.C., S.B.; aerosol sampling, L.C., F.G., M.S., A.A., G.C., S.B., E.B.; aerosol sampler modification/strategy, G.C.; data provision, A.V.; writing—original draft preparation, L.C., G.C., R.T., S.B.; writing—review and editing, S.N., P.C., F.L., A.G., E.B., A.V.; supervision, R.T., S.B., G.C.; funding acquisition, R.T., S.B.; project administration, R.T. All authors have read and agreed to the published version of the manuscript.

Funding

In the Arctic, the projects PRIN-20092C7KRC_001 (concluded) and then RIS 3693, “Gruvebadet Atmospheric Laboratory Project (GRUVELAB),” have been based on the collaboration between different Italian and international institutions coordinated by the National Research Council (CNR), first, through the “Dipartimento Scienze del Sistema Terra e Tecnologie per l’Ambiente (DSSTTA)” and currently through the Institute of Polar Science (ISP), which manages the Italian Arctic station “Dirigibile Italia” logistics. In Antarctica, the research was financially supported by the MIUR (Italian Ministry of University and Research) and PNRA (Programma Nazionale di Ricerca in Antartide) through the PNRA 2015/AC3.04 (PNRA 14_00091-Linea A3) Project “Long-Term Measurements of Chemical and Physical Properties of Atmospheric Aerosol at Dome C (LTCPAA).” The project is based on the collaboration between different Italian institutions—University of Florence, University Ca’ Foscari (Venice), University of Genova, CNR-ISAC of Bologna, CNR-IIA of Rome, and INFN—and aims to study the chemical and physical properties of Antarctic atmosphere by the installation of a devoted laboratory.

Data Availability Statement

Data are available upon request to the authors.

Acknowledgments

AV was funded by the Academy of Finland project Antarctic Climate Forcing Aerosol (decision nr. 335845) and by the Business Finland project Black Carbon Footprint (grant nr. 528/31/2019).

Conflicts of Interest

The authors declare no conflict of interest. The funders had no role in the design of the study; in the collection, analyses, or interpretation of data; in the writing of the manuscript; or in the decision to publish the results.

References

  1. Charlson, R.J.; Schwartz, S.E.; Hales, J.M.; Cess, R.D.; Coakley, J.A., Jr.; Hansen, J.E.; Hofmann, D.J. Climate forcing by anthropogenic aerosols. Science 1992, 255, 423–430. [Google Scholar] [CrossRef] [PubMed]
  2. Schulz, M.; Textor, C.; Kinne, S.; Balkanski, Y.; Bauer, S.; Berntsen, T.; Berglen, T.; Boucher, O.; Dentener, F.; Guibert, S.; et al. Radiative forcing by aerosols as derived from the AeroCom present-day and pre-industrial simulations. Atmos. Chem. Phys. Discuss. 2006, 6, 5225–5246. [Google Scholar] [CrossRef] [Green Version]
  3. Schwartz, S.E.; Arnold, F.; Blanchet, J.P.; Gurkee, P.A.; Hofmann, D.J.; Hoppel, W.A.; King, M.D.; Lacis, A.A.; Nakajima, T.; Ogren, J.A.; et al. Group report: Connections between aerosol properties and forcing of climate. In Aerosol Forcing of Climate; Charlson, R.J., Heintzenberg, J., Eds.; John Wiley: New York, NY, USA, 1995; pp. 251–280. [Google Scholar]
  4. Hansen, J.; Sato, M.; Lacis, A.; Ruedy, R. The missing climate forcing. Philos. Trans. R. Soc. B Biol. Sci. 1997, 352, 231–240. [Google Scholar] [CrossRef]
  5. Boucher, O.; Randall, D.; Artaxo, P.; Bretherton, C.; Feingold, G.; Forster, P.; Kerminen, V.M.; Kondo, Y.; Liao, H.; Lohmann, U.; et al. Clouds and Aerosols. In Climate Change the Physical Science Basis. Contribution of Working Group I to the Fifth Assessment Report of the Intergovernmental Panel on Climate Change; Stocker, T.F., Qin, D., Plattner, G.K., Tignor, M., Allen, S.K., Boschung, J., Nauels, A., Xia, Y., Bex, V., Midgley, P.M., Eds.; Cambridge University Press: Cambridge, UK; New York, NY, USA, 2013. [Google Scholar]
  6. Fermo, P.; Piazzalunga, A.; Vecchi, R.; Valli, G.; Ceriani, M. A TGA/FT-IR study for measuring OC and EC in aerosol samples. Atmos. Chem. Phys. Discuss. 2006, 6, 255–266. [Google Scholar] [CrossRef] [Green Version]
  7. Giannoni, M.; Calzolai, G.; Chiari, M.; Cincinelli, A.; Lucarelli, F.; Martellini, T.; Nava, S. A comparison between thermal-optical transmittance elemental carbon measured by different protocols in PM2.5 samples. Sci. Total. Environ. 2016, 571, 195–205. [Google Scholar] [CrossRef] [PubMed]
  8. Barrett, T.E.; Robinson, E.M.; Usenko, S.; Sheesley, R.J. Source Contributions to Wintertime Elemental and Organic Carbon in the Western Arctic Based on Radiocarbon and Tracer Apportionment. Environ. Sci. Technol. 2015, 49, 11631–11639. [Google Scholar] [CrossRef]
  9. Highwood, E.J.; Kinnersley, R.P. When smoke gets in our eyes: The multiple impacts of atmospheric black carbon on climate, air quality and health. Environ. Int. 2006, 32, 560–566. [Google Scholar] [CrossRef]
  10. Adar, S.D.; Kaufman, J.D. Cardiovascular disease and air pollutants: Evaluating and improving epidemio-logical data implicating traffic exposure. Inhal. Toxicol. 2007, 19, 135–149. [Google Scholar] [CrossRef]
  11. Bérubé, K.; Balharry, D.; Sexton, K.; Koshy, L.; Jones, T. Combustion-derived nanoparticles: Mechanisms of pul-monary toxicity. Clin. Exp. Pharmacol. P. 2007, 34, 1044–1050. [Google Scholar] [CrossRef] [Green Version]
  12. Winton, M. Amplified Arctic climate change: What does surface albedo feedback have to do with it? Geophys. Res. Lett. 2006, 33, 3. [Google Scholar] [CrossRef] [Green Version]
  13. Ramanathan, V.; Ramana, M.V.; Roberts, G.; Kim, D.; Corrigan, C.; Chung, C.; Winker, D.M. Warming trends in Asia amplified by brown cloud solar absorption. Nat. Cell Biol. 2007, 448, 575–578. [Google Scholar] [CrossRef]
  14. Rosen, H.; Novakov, T.; Bodhaine, B. Soot in the Arctic. Atmos. Environ. 1981, 15, 1371–1374. [Google Scholar] [CrossRef]
  15. Clarke, A.D.; Noone, K.J. Soot in the Arctic snowpack: A cause for perturbations in radiative transfer. Atmos. Environ. 1985, 19, 2045–2053. [Google Scholar] [CrossRef]
  16. Hansen, J.; Nazarenko, L. Soot climate forcing via snow and ice albedos. Proc. Natl. Acad. Sci. USA 2003, 101, 423–428. [Google Scholar] [CrossRef] [Green Version]
  17. Flanner, M.G.; Zender, C.S.; Randerson, J.T.; Rasch, P.J. Present-day climate forcing and response from black carbon in snow. J. Geophys. Res. Space Phys. 2007, 112, 1202. [Google Scholar] [CrossRef] [Green Version]
  18. Jacobson, M.Z. Strong radiative heating due to the mixing state of black carbon in atmospheric aerosols. Nat. Cell Biol. 2001, 409, 695–697. [Google Scholar] [CrossRef] [PubMed]
  19. Ramanathan, V.; Carmichael, G. Global and regional climate changes due to black carbon. Nat. Geosci. 2008, 1, 221–227. [Google Scholar] [CrossRef]
  20. Huebert, B.J.; Charlson, R.J. Uncertainties in data on organic aerosols. Tellus B Chem. Phys. Meteorol. 2000, 52, 1249–1255. [Google Scholar] [CrossRef] [Green Version]
  21. Jacobson, M.C.; Hansson, H.C.; Noone, K.J.; Charlson, R.J. Organic atmospheric aerosols: Review and state of the science. Rev. Geophys. 2000, 38, 267–294. [Google Scholar] [CrossRef] [Green Version]
  22. Turpin, B.J.; Huntzicker, J.J.; Hering, S.V. Investigation of organic aerosol sampling artifacts in the los angeles basin. Atmos. Environ. 1994, 28, 3061–3071. [Google Scholar] [CrossRef]
  23. Karanasiou, A.; Minguillón, M.C.; Viana, M.; Alastuey, A.; Putaud, J.P.; Maenhaut, W.; Panteliadis, P.; Močnik, G.; Favez, O.; Kuhlbusch, T.A.J. Thermal-optical analysis for the measurement of elemental carbon (EC) and organic carbon (OC) in ambient air a literature review. Atmos. Meas. Tech. Discuss. 2015, 8, 9649–9712. [Google Scholar] [CrossRef] [Green Version]
  24. Panteliadis, P.; Hafkenscheid, T.L.; Cary, B.; Diapouli, E.; Fischer, A.J.; Favez, O.; Inc, S.L.; Viana, M.M.; Hitzenberger, R.; Vecchi, R.; et al. ECOC comparison exercise with identical thermal protocols after temperature offset correction–instrument diagnostics by in-depth evaluation of operational parameters. Atmos. Meas. Tech. 2015, 8, 779–792. [Google Scholar] [CrossRef] [Green Version]
  25. Eleftheriadis, K.; Vratolis, S.; Nyeki, S. Aerosol black carbon in the European Arctic: Measurements at Zeppelin station, Ny-Ålesund, Svalbard from 1998. Geophys. Res. Lett. 2009, 36. [Google Scholar] [CrossRef] [Green Version]
  26. Sharma, S.; Lavoué, D.; Cachier, H.; Barrie, L.A.; Gong, S.L. Long-term trends of the black carbon concentrations in the Canadian Arctic. J. Geophys. Res. Space Phys. 2004, 109. [Google Scholar] [CrossRef]
  27. Sharma, S.; Andrews, E.; Barrie, L.A.; Ogren, J.A.; Lavoué, D. Variations and sources of the equivalent black carbon in the high Arctic revealed by long-term observations at Alert and Barrow: 1989. J. Geophys. Res. Space Phys. 2006, 111. [Google Scholar] [CrossRef]
  28. Sharma, S.; Barrie, L.; Magnusson, E.; Brattström, G.; Leaitch, W.; Steffen, A.; Landsberger, S. A Factor and Trends Analysis of Multidecadal Lower Tropospheric Observations of Arctic Aerosol Composition, Black Carbon, Ozone, and Mercury at Alert, Canada. J. Geophys. Res. Atmos. 2019, 124, 14133–14161. [Google Scholar] [CrossRef] [Green Version]
  29. Bodhaine, B.A. Aerosol absorption measurements at Barrow, Mauna Loa and the south pole. J. Geophys. Res. Space Phys. 1995, 100, 8967–8975. [Google Scholar] [CrossRef]
  30. Hansen, A.D.A.; Bodhaine, B.A.; Dutton, E.G.; Schnell, R.C. Aerosol black carbon measurements at the South Pole: Initial results, 1986. Geophys. Res. Lett. 1988, 15, 1193–1196. [Google Scholar] [CrossRef]
  31. Hansen, A.D.A.; Conway, T.J.; Strele, L.P.; Bodhaine, B.A.; Thoning, K.W.; Tans, P.; Novakov, T. Correlations among combustion effluent species at Barrow, Alaska: Aerosol black carbon, carbon dioxide, and methane. J. Atmos. Chem. 1989, 9, 283–299. [Google Scholar] [CrossRef]
  32. Hansen, A.D.; Lowenthal, D.H.; Chow, J.C.; Watson, J.G. Black carbon aerosol at McMurdo Station, Antarctica. J. Air Waste Manag. Assoc. 2001, 51, 593–600. [Google Scholar] [CrossRef] [Green Version]
  33. Von Schneidemesser, E.; Schauer, J.J.; Hagler, G.S.; Bergin, M.H. Concentrations and sources of carbonaceous aerosol in the atmosphere of Summit, Greenland. Atmos. Environ. 2009, 43, 4155–4162. [Google Scholar] [CrossRef]
  34. Virkkula, A.; Teinilä, K.; Hillamo, R.; Kerminen, V.-M.; Saarikoski, S.; Aurela, M.; Viidanoja, J.; Paatero, J.; Koponen, I.K.; Kulmala, M. Chemical composition of boundary layer aerosol over the Atlantic Ocean and at an Antarctic site. Atmos. Chem. Phys. Discuss. 2006, 6, 3407–3421. [Google Scholar] [CrossRef] [Green Version]
  35. Wolff, E.W.; Cachier, H. Concentrations and seasonal cycle of black carbon in aerosol at a coastal Antarctic station. J. Geophys. Res. Space Phys. 1998, 103, 11033–11041. [Google Scholar] [CrossRef] [Green Version]
  36. Weller, R.; Minikin, A.; Petzold, A.; Wagenbach, D.; Langlo, K.G. Characterization of long-term and seasonal variations of black carbon (BC) concentrations at Neumayer, Antarctica. Atmos. Chem. Phys. Discuss. 2013, 13, 1579–1590. [Google Scholar] [CrossRef] [Green Version]
  37. Winiger, P.; Andersson, A.; Yttri, K.E.; Tunved, P.; Gustafsson, Ö. Isotope-Based Source Apportionment of EC Aerosol Particles during Winter High-Pollution Events at the Zeppelin Observatory, Svalbard. Environ. Sci. Technol. 2015, 49, 11959–11966. [Google Scholar] [CrossRef]
  38. Winiger, P.; Andersson, A.; Eckhardt, S.; Stohl, A.; Gustafsson, Ö. The sources of atmospheric black carbon at a European gateway to the Arctic. Nat. Commun. 2016, 7, 2776. [Google Scholar] [CrossRef]
  39. Ferrero, L.; Cappelletti, D.; Busetto, M.; Mazzola, M.; Lupi, A.; Lanconelli, C.; Becagli, S.; Traversi, R.; Caiazzo, L.; Giardi, F.; et al. Vertical profiles of aerosol and black carbon in the Arctic: A seasonal phenomenology along 2 years (2011–2012) of field campaigns. Atmos. Chem. Phys. Discuss. 2016, 16, 12601–12629. [Google Scholar] [CrossRef] [Green Version]
  40. Spolaor, A.; Barbaro, E.; Mazzola, M.; Viola, A.P.; Lisok, J.; Obleitner, F.; Markowicz, K.M.; Cappelletti, D. Determination of black carbon and nanoparticles along glaciers in the Spitsbergen (Svalbard) region exploiting a mobile platform. Atmos. Environ. 2017, 170, 184–196. [Google Scholar] [CrossRef]
  41. Zhan, J.; Gao, Y.; Li, W.; Chen, L.; Lin, H.; Lin, Q. Effects of ship emissions on summertime aerosols at Ny–Alesund in the Arctic. Atmos. Pollut. Res. 2014, 5, 500–510. [Google Scholar] [CrossRef] [Green Version]
  42. Mazzera, D.M.; Lowenthal, D.H.; Chow, J.C.; Watson, J.G.; Grubĭsíc, V. PM10 measurements at McMurdo Station, Antarctica. Atmos. Environ. 2001, 35, 1891–1902. [Google Scholar] [CrossRef]
  43. Mazzera, D.M.; Lowenthal, D.H.; Chow, J.C.; Watson, J.G. Sources of PM10 and sulfate aerosol at McMurdo station, Antarctica. Chemosphere 2001, 45, 347–356. [Google Scholar] [CrossRef]
  44. Giardi, F.; Becagli, S.; Traversi, R.; Frosini, D.; Severi, M.; Caiazzo, L.; Ancillotti, C.; Cappelletti, D.; Moroni, B.; Grotti, M.; et al. Size distribution and ion composition of aerosol collected at Ny-Ålesund in the spring–summer field campaign. Rend. Lince 2016, 27, 47–58. [Google Scholar] [CrossRef] [Green Version]
  45. Udisti, R.; Becagli, S.; Frosini, D.; Ghedini, C.; Rugi, F.; Severi, M.; Traversi, R.; Zanini, R.; Calzolai, G.; Chiari, M.; et al. Activity and pre-liminary results from the 2011 and 2012 field seasons at Ny-Ålesund. In Research Activity in Ny Ålesund 2011-CNR Editions DTA/14-ISSN 2239–5172; Elsevier: Amsterdam, The Netherlands, 2016; pp. 53–68. [Google Scholar]
  46. Udisti, R.; Bazzano, A.; Becagli, S.; Bolzacchini, E.; Caiazzo, L.; Cappelletti, D.; Ferrero, L.; Frosini, D.; Giardi, F.; Grotti, M.; et al. Sulfate source apportionment in the Ny-Ålesund (Svalbard Islands) Arctic aerosol. Rend. Lince 2016, 27, 85–94. [Google Scholar] [CrossRef]
  47. Maturilli, M.; Herber, A.; Langlo, K.G. Climatology and time series of surface meteorology in Ny-Ålesund, Svalbard. Earth Syst. Sci. Data 2013, 5, 155–163. [Google Scholar] [CrossRef] [Green Version]
  48. Traversi, R.; Becagli, S.; Castellano, E.; Cerri, O.; Morganti, A.; Severi, M.; Udisti, R. Study of Dome C site (East Antartica) variability by comparing chemical stratigraphies. Microchem. J. 2009, 92, 7–14. [Google Scholar] [CrossRef]
  49. Turpin, B.J.; Cary, R.A.; Huntzicker, J.J. An in Situ, Time-Resolved Analyzer for Aerosol Organic and Elemental Carbon. Aerosol Sci. Technol. 1990, 12, 161–171. [Google Scholar] [CrossRef]
  50. Aswini, A.; Hegde, P.; Nair, P.R.; Aryasree, S. Seasonal changes in carbonaceous aerosols over a tropical coastal location in response to meteorological processes. Sci. Total. Environ. 2019, 656, 1261–1279. [Google Scholar] [CrossRef]
  51. Lack, D.A.; Moosmüller, H.; Mcmeeking, G.R.; Chakrabarty, R.K.; Baumgardner, D. Characterizing elemental, equivalent black, and refractory black carbon aerosol particles: A review of techniques, their limitations and uncertainties. Anal. Bioanal. Chem. 2014, 406, 99–122. [Google Scholar] [CrossRef] [PubMed] [Green Version]
  52. Chow, J.C.; Watson, J.G.; Crow, D.; Lowenthal, D.H.; Merrifield, T. Comparison of IMPROVE and NIOSH Carbon Measurements. Aerosol Sci. Technol. 2001, 34, 23–34. [Google Scholar] [CrossRef]
  53. Cheng, Y.; Duan, F.K.; He, K.B.; Zheng, M.; Du, Z.Y.; Ma, Y.L.; Tan, J.H. Intercomparison of Thermal–Optical Methods for the Determination of Organic and Elemental Carbon: Influences of Aerosol Composition and Implications. Environ. Sci. Technol. 2011, 45, 10117–10123. [Google Scholar] [CrossRef] [PubMed]
  54. Schmid, H.; Laskus, L.; Abraham, H.J.; Baltensperger, U.; Lavanchy, V.; Bizjak, M.; Burba, P.; Cachier, H.; Crow, D.; Chow, J.; et al. Results of the “carbon conference” international aerosol carbon round robin test stage I. Atmos. Environ. 2001, 35, 2111–2121. [Google Scholar] [CrossRef]
  55. Schauer, J.J.; Mader, B.T.; Deminter, J.T.; Heidemann, G.; Bae, M.S.; Seinfeld, J.H.; Flagan, R.C.; Cary, R.A.; Smith, D.; Huebert, B.J.; et al. ACE-Asia Intercomparison of a Thermal-Optical Method for the Determination of Particle-Phase Organic and Elemental Carbon. Environ. Sci. Technol. 2003, 37, 993–1001. [Google Scholar] [CrossRef] [PubMed]
  56. Ramachandran, S.; Khlystov, A.Y.; Robinson, A.L. Effect of Peak Inert-Mode Temperature on Elemental Carbon Measured Using Thermal-Optical Analysis. Aerosol Sci. Technol. 2006, 40, 763–780. [Google Scholar] [CrossRef] [Green Version]
  57. Sciare, J.; Oikonomou, K.; Favez, O.; Liakakou, E.; Markaki, Z.; Cachier, H.; Mihalopoulos, N. Long-term measurements of carbonaceous aerosols in the Eastern Mediterranean: Evidence of long-range transport of biomass burning. Atmos. Chem. Phys. Discuss. 2008, 8, 5551–5563. [Google Scholar] [CrossRef] [Green Version]
  58. Piazzalunga, A.; A Belis, C.; Bernardoni, V.; Cazzuli, O.; Fermo, P.; Valli, G.; Vecchi, R. Estimates of wood burning contribution to PM by the macro-tracer method using tailored emission factors. Atmos. Environ. 2011, 45, 6642–6649. [Google Scholar] [CrossRef]
  59. Birch, M.E.; Cary, R.A. Elemental Carbon-Based Method for Monitoring Occupational Exposures to Particulate Diesel Exhaust. Aerosol Sci. Technol. 1996, 25, 221–241. [Google Scholar] [CrossRef]
  60. Chow, J.C.; Watson, J.G.; Pritchett, L.C.; Pierson, W.R.; Frazier, C.A.; Purcell, R.G. The dri thermal/optical reflectance carbon analysis system: Description, evaluation and applications in U.S. Air quality studies. Atmos. Environ. Part A. Gen. Top. 1993, 27, 1185–1201. [Google Scholar] [CrossRef]
  61. Cavalli, F.; Putaud, J.P. Toward a standardized thermal-optical protocol for measuring atmospheric organic and elemental carbon: The EUSAAR protocol. Atmos. Meas. Tech. 2010, 3, 79–89. [Google Scholar] [CrossRef] [Green Version]
  62. Chow, J.C.; Watson, J.G.; Chen, L.W.A.; Chang, M.O.; Robinson, N.F.; Trimble, D.; Kohl, S. The IMPROVE_A Temperature Protocol for Thermal/Optical Carbon Analysis: Maintaining Consistency with a Long-Term Database. J. Air Waste Manag. Assoc. 2007, 57, 1014–1023. [Google Scholar] [CrossRef] [Green Version]
  63. Amato, F.; Alastuey, A.; Karanasiou, A.; Lucarelli, F.; Nava, S.; Calzolai, G.; Severi, M.; Becagli, S.; Gianelle, V.L.; Colombi, C.; et al. AIRUSE-LIFE+: A harmonized PM speciation and source apportionment in five southern European cities. Atmos. Chem. Phys. Discuss. 2016, 16, 3289–3309. [Google Scholar] [CrossRef] [Green Version]
  64. AMAP. The Impact of Black Carbon on Arctic Climate; Quinn, P.K., Stohl, A., Arneth, A., Berntsen, T., Burkhart, J.F., Christensen, J., Flanner, M., Kupiainen, K., Lihavainen, H., Shepherd, M., et al., Eds.; Arctic Monitoring and Assessment Programme (AMAP): Oslo, Norway, 2011; p. 72. [Google Scholar]
  65. AMAP Assessment. Black Carbon and Ozone as Arctic Climate Forcers; Arctic Monitoring and Assessment Programme (AMAP): Oslo, Norway, 2015; Volume 7, p. 116. [Google Scholar]
  66. Nielsen, I.E.; Skov, H.; Massling, A.; Eriksson, A.C.; Osto, D.M.; Junninen, H.; Sarnela, N.; Lange, R.; Collier, S.; Zhang, Q.; et al. Biogenic and anthropogenic sources of aerosols at the High Arctic site Villum Research Station. Atmos. Chem. Phys. Discuss. 2019, 19, 10239–10256. [Google Scholar] [CrossRef] [Green Version]
  67. Joranger, E.; Ottar, B. Air pollution studies in the Norwegian Arctic. Geophys. Res. Lett. 1984, 11, 365–368. [Google Scholar] [CrossRef]
  68. Tunved, P.; Ström, J.; Krejci, R. Arctic aerosol life cycle: Linking aerosol size distributions observed between 2000 and 2010 with air mass transport and precipitation at Zeppelin station, Ny-Ålesund, Svalbard. Atmos. Chem. Phys. Discuss. 2013, 13, 3643–3660. [Google Scholar] [CrossRef] [Green Version]
  69. Lampert, A.; Ström, J.; Ritter, C.; Neuber, R.; Yoon, Y.J.; Chae, N.Y.; Shiobara, M. Inclined lidar observations of boundary layer aerosol particles above the Kongsfjord, Svalbard. Acta Geophys. 2012, 60, 1287–1307. [Google Scholar] [CrossRef] [Green Version]
  70. Moroni, B.; Cappelletti, D.; Crocchianti, S.; Becagli, S.; Caiazzo, L.; Traversi, R.; Udisti, R.; Mazzola, M.; Markowicz, K.; Ritter, C.; et al. Morphochemical characteristics and mixing state of long range transported wildfire particles at Ny-Ålesund (Svalbard Islands). Atmos. Environ. 2017, 156, 135–145. [Google Scholar] [CrossRef]
  71. Paxian, A.; Eyring, V.; Beer, W.; Sausen, R.; Wright, C. Present-Day and Future Global Bottum-Up Ship Emission Inventories Including Polar Routes. Environ. Sci. Technol. 2010, 44, 1333–1339. [Google Scholar] [CrossRef] [PubMed]
  72. Corbett, J.J.; Lack, D.A.; Winebrake, J.J.; Harder, S.; Silberman, J.A.; Gold, M. Arctic shipping emissions inventories and future scenarios. Atmos. Chem. Phys. Discuss. 2010, 10, 9689–9704. [Google Scholar] [CrossRef] [Green Version]
  73. Khon, V.C.; Mokhov, I.I.; Latif, M.; Semenov, V.A.; Park, W. Perspectives of Northern Sea Route and Northwest Passage in the twenty-first century. Clim. Chang. 2009, 100, 757–768. [Google Scholar] [CrossRef]
  74. Boé, J.; Hall, A.; Qu, X. September sea-ice cover in the Arctic Ocean projected to vanish. Nat. Geosci. 2009, 2, 341–343. [Google Scholar] [CrossRef]
  75. Peters, G.P.; Nilssen, T.B.; Lindholt, L.; Eide, M.S.; Glomsrød, S.; Eide, L.I.; Fuglestvedt, J.S.; Bergh, T. Future emissions from shipping and petroleum activities in the Arctic. Atmos. Chem. Phys. Discuss. 2011, 11, 5305–5320. [Google Scholar] [CrossRef] [Green Version]
  76. Eckhardt, S.; Hermansen, O.; Grythe, H.; Fiebig, M.; Stebel, K.; Cassiani, M.; Baecklund, A.; Stohl, A. The influence of cruise ship emissions on air pollution in Svalbard–A harbinger of a more polluted Arctic? Atmos. Chem. Phys. Discuss. 2013, 13, 8401–8409. [Google Scholar] [CrossRef] [Green Version]
  77. Vestreng, V.V.; Kallenborn, R.K.; Okstad, E.O. Norwegian Arctic Climate: Climate Influencing Emissions, Scenarios and Mitigation Options at Svalbard; Climate and Pollution Agency: Oslo, Norway.
  78. Weinbruch, S.; Wiesemann, D.; Ebert, M.; Schütze, K.; Kallenborn, R.; Ström, J. Chemical composition and sources of aerosol particles at Zeppelin Mountain (Ny Ålesund, Svalbard): An electron microscopy study. Atmos. Environ. 2012, 49, 142–150. [Google Scholar] [CrossRef]
  79. Lowenthal, D.H.; Zielinska, B.; Chow, J.C.; Watson, J.G.; Gautam, M.; Ferguson, D.H.; Neuroth, G.R.; Stevens, K.D. Characterization of heavy-duty diesel vehicle emissions. Atmos. Environ. 1994, 28, 731–743. [Google Scholar] [CrossRef]
  80. Na, K.; Sawant, A.A.; Song, C.; Cocker, D.R. Primary and secondary carbonaceous species in the atmosphere of Western Riverside County, California. Atmos. Environ. 2004, 38, 1345–1355. [Google Scholar] [CrossRef]
  81. Krecl, P.; Ström, J.; Johansson, C. Carbon content of atmospheric aerosols in a residential area during the wood combustion season in Sweden. Atmos. Environ. 2007, 41, 6974–6985. [Google Scholar] [CrossRef]
  82. Bond, T.C.; Anderson, T.L.; Campbell, D. Calibration and Intercomparison of Filter-Based Measurements of Visible Light Absorption by Aerosols. Aerosol Sci. Technol. 1999, 30, 582–600. [Google Scholar] [CrossRef]
  83. Ogren, J.A. Comment on “Calibration and Intercomparison of Filter-Based Measurements of Visible Light Absorption by Aerosols.”. Aerosol Sci. Technol. 2010, 44, 589–591. [Google Scholar] [CrossRef] [Green Version]
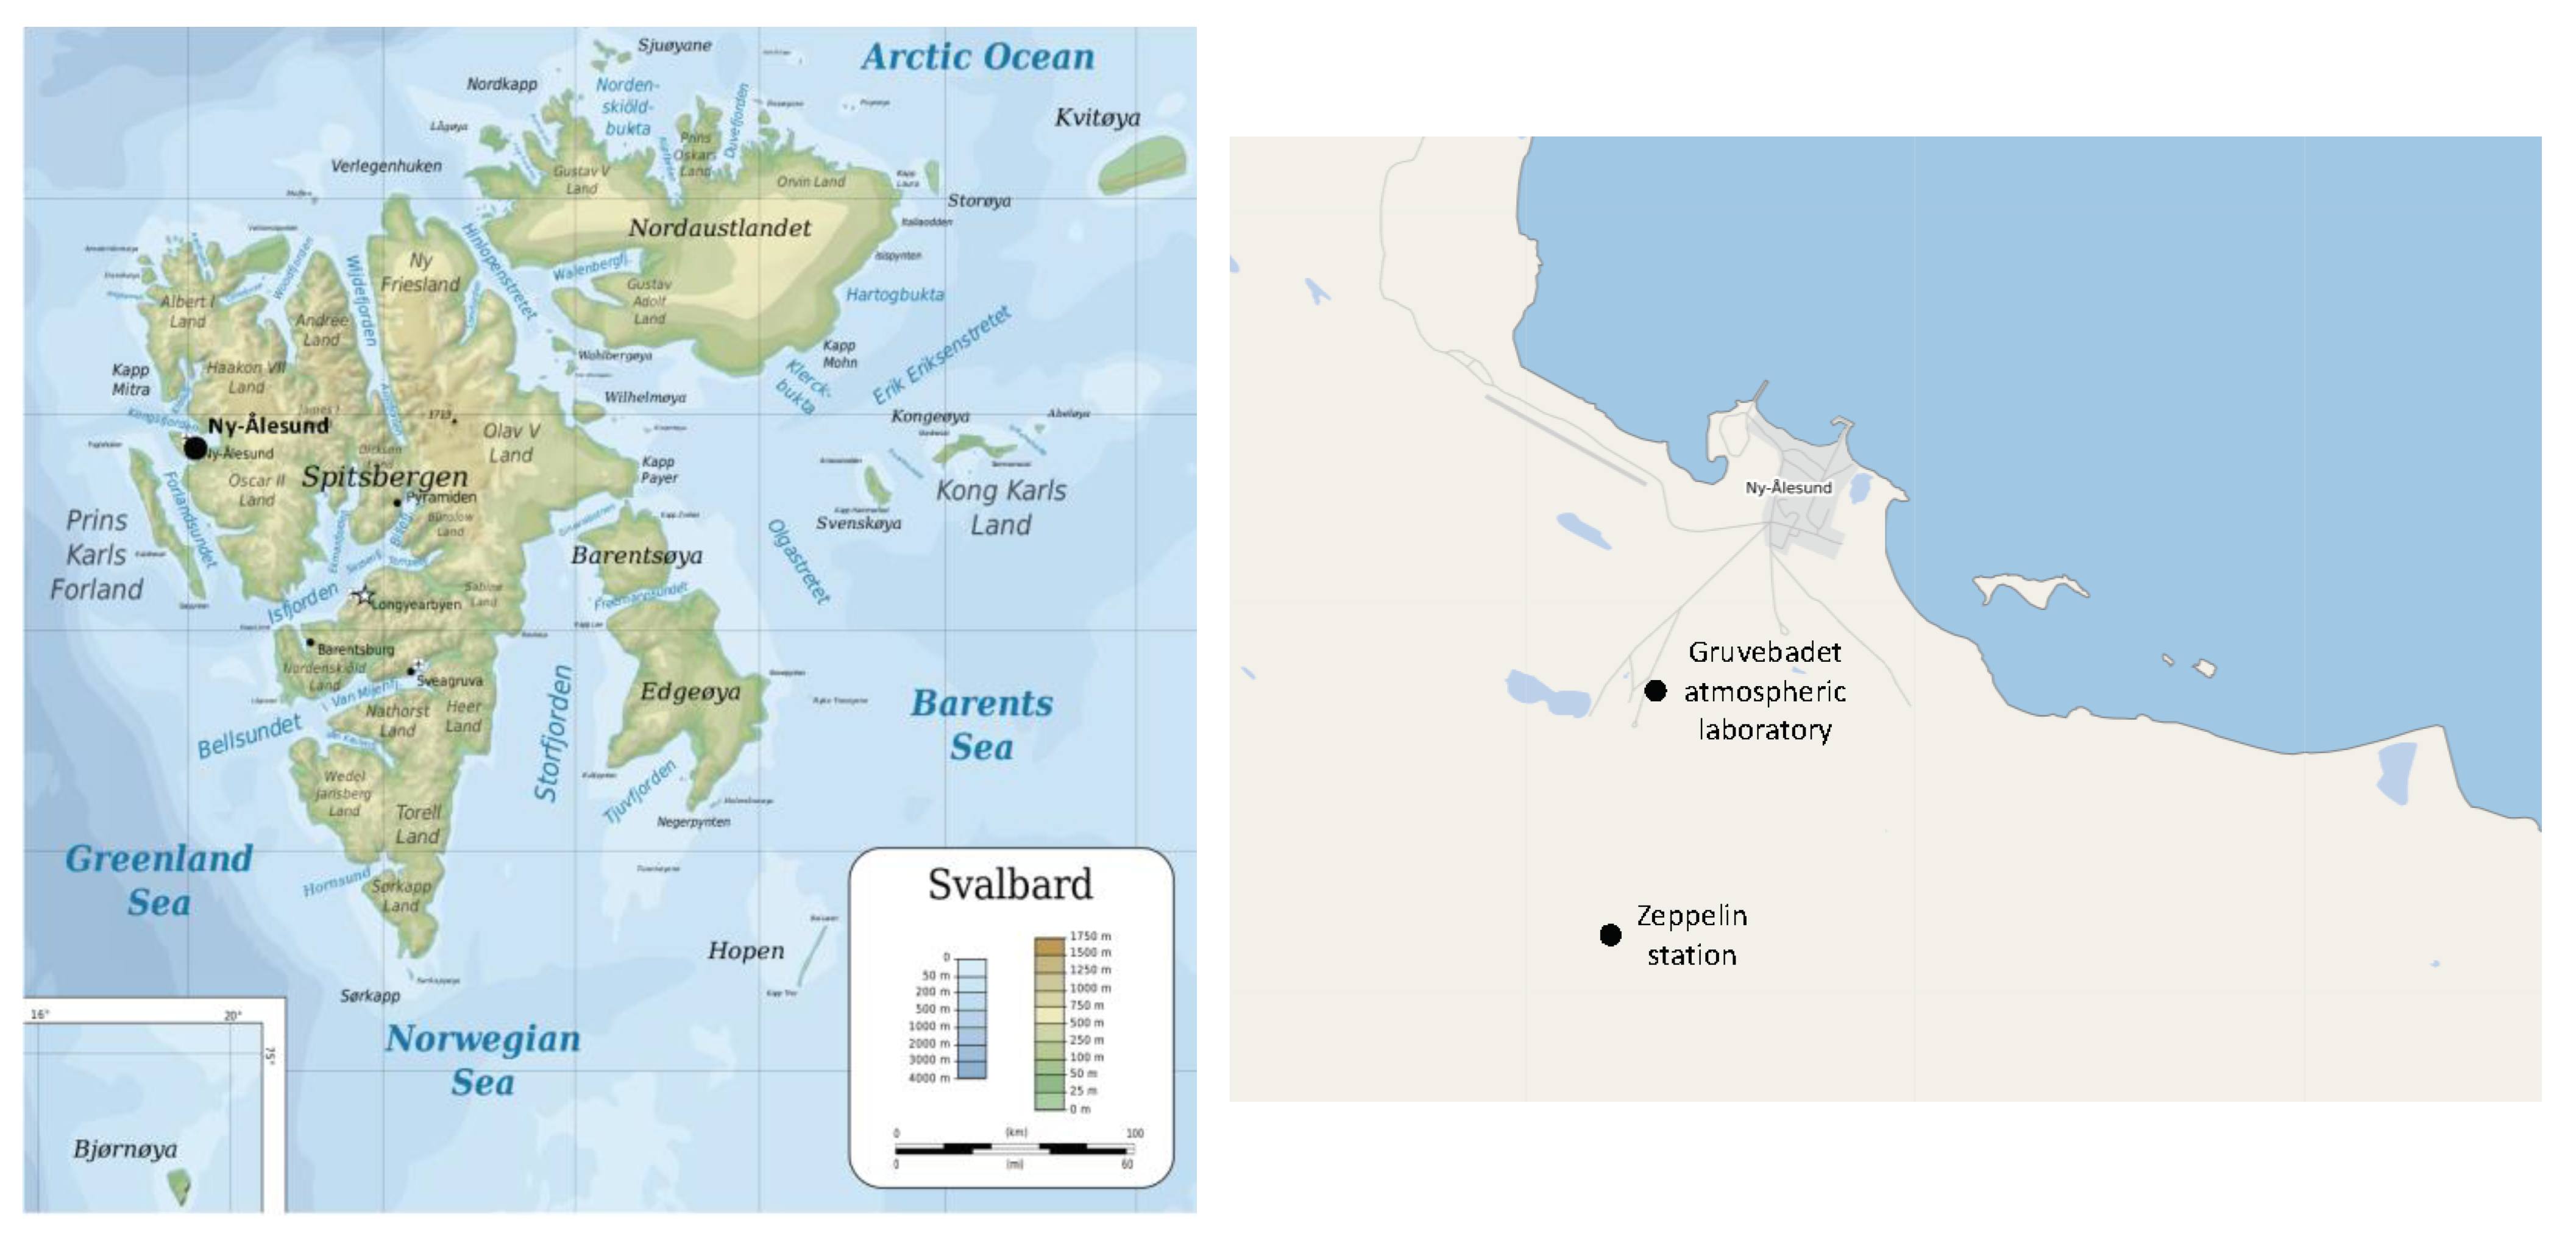
Figure 1. Map of Svalbard Islands on the left. The Gruvebadet atmospheric laboratory (GVB) is located ca. 1 km far from the Ny-Ålesund village (on the right [46]).
Atmosphere 12 00320 g001
Figure 2. Map of Antarctica (left). The ATMOS shelter is located 700 m far from Concordia Station (right).
Atmosphere 12 00320 g002
Figure 3. Organic carbon (OC) (up) and elemental carbon (EC) (down) mean blank values of the 25 filters, together with the two measurements done on each filter. Red circles and blue crosses represent the result of the measures on the two sample punches; black short lines are the average of the two measurements for every filter.
Atmosphere 12 00320 g003
Figure 4. Concentration data sets of OC and EC sampled in Ny-Ålesund during the years 2011–2015. OC and EC are represented in black and grey, respectively. Uncertainties are calculated according to the text. The year 2015 has different axes’ scales because of a longer sampling period and episodes with higher concentrations.
Atmosphere 12 00320 g004
Figure 5. (a) OC variation of average monthly concentrations. Y-axes is represented in log5 to show all the outliers. (b) OC variation of average monthly concentrations for every single year. Whisker plot (a) shows the IQR as a box (divided by a horizontal line representing the median) and the distance 1.5*IQR as whiskers; black circles are the data outliers, that is, the data that do not fall inside the previous categories.
Atmosphere 12 00320 g005
Figure 6. (a) EC variation of average monthly concentrations; for whisker plots, see Figure 5 caption. Five values lie above the chosen scale for clarity of visualization. (b) EC variation of average monthly concentrations for every single year.
Atmosphere 12 00320 g006
Figure 7. Concentration data set of OC, EC, and TC sampled in Dome C from 5 December 2016 to 15 January 2018. TC is represented with blue circles, OC with red circles, and EC with black circles. Error bars are calculated according to the text.
Atmosphere 12 00320 g007
Figure 8. Concentrations of EC and eBC. EC is represented in a grey barplot, showing the lower resolution (8 days) respect to eBC, which is represented by the black line, with a hourly resolution.
Atmosphere 12 00320 g008
Table 1. Analytical performances of the thermal-optical analyzer. Method detection limit (MDL) is expressed in µg/cm2 and ng/m3 in the sampling conditions applied.
MDL (µg/cm2)MDL (ng/m3) MDL (ng/m3) MDL (ng/m3) MDL (ng/m3)
Filter diameter
Sampled air volume
47 mm
200 m3
47 mm
55 m3
25 mm
55 m3
25 mm
400 m3
OC1.3580.3292.177.410.6
EC0.169.434.39.01.2
Table 2. Sampling data for the 2011–2015 campaigns; mean, standard deviation (σ), and range of the carbonaceous components.
Year201120122013201420152011–2015
Sampling time (dd/mm)29/03–14/0923/03–04/0931/03–10/0904/04–07/0928/02–21/10
Sampling resolution4 days4 days4 days4 daysdaily
Diameter of the sampled filter (mm)4747474747 (until 5/06)
25 (from 6/06)
OCMean ± σ
(ng/m3)
354 ± 132296 ± 96435 ± 185386 ± 110544 ± 606
553 ± 465 *
470 ± 477
Range
(ng/m3)
186–692151–599225–1285253–823143–4774
215–2676 *
Median: 352, IQR: 283–475
ECMean ± σ
(ng/m3)
6 ± 65 #12 ± 1316 ± 1622 ± 40
22 ± 23 *
16 ± 32
Range
(ng/m3)
5–32always < MDL4.5 #–554.5 #–653#–360
4 #–95 *
Median: 4.8, IQR: 4.6–17.4
TCMean ± σ
(ng/m3)
360 ± 136301 ± 96447 ± 190403 ± 117566 ± 624
575 ± 477 *
486 ± 492
Range
(ng/m3)
191–724156–604230–1305258–868161–4990
235–2771 *
Median: 360, IQR: 289–493
* Mean + σ and range of the entire year averaged over 4 days; # this value corresponds to the MDL/2 (see text).
Publisher’s Note: MDPI stays neutral with regard to jurisdictional claims in published maps and institutional affiliations.