Abstract
Health risks connected with fine particulate matter (PM2.5) pollutants are well documented; increased risks of asthma, heart attack and heart failure are a few of the effects associated with PM2.5. Accurately forecasting PM2.5 is crucial for state agencies directed to devise State Implementation Plans (SIPS) to deal with National Ambient Air Quality Standards (NAAQS) exceedances. In previous work, we explored the application of multi-temporal data-driven neural networks (NNs) to forecasting PM2.5. Our work showed that under different input conditions, the NN approach achieves higher forecasting scores for local (12 km) resolution when compared to the other Chemical Transport Model forecast models, such as the Community Multi-Scale Air Quality system (CMAQ). Critical to our approach was the inclusion of prior PM2.5 concentrations, retrieved from ground monitoring stations, as part of the input dataset for the NN. The NN approach can provide high-level forecasting accuracy; however, because of the dependency on ground monitoring stations, the forecast coverage is sparse. Here, we extend our previous station-specific efforts by forecasting hourly PM2.5 values that are spatially continuous through the use of a deep neural network (DNN). The DNN approach combines spatial Kriging with additional local source variables to interpolate the measured PM2.5 concentrations across non-station locations. These interpolated PM2.5 values are used as inputs in the original forecasting NN. Cross-validation testing, using all New York State AirNow PM2.5 stations, showed that this forecast approach achieves accurate results, with a regression coefficient (R2) of 0.59, and a root mean square error (RMSE) of 2.22. Additionally, herein we demonstrate the usefulness of this approach on specific temporal events where significant dynamics of PM2.5 were observed; particularly, we show that even bias-corrected CMAQ forecasts do not track these transients and our NN method.
1. Introduction
Exposure to fine particulate matter (PM2.5) has been linked to severe adverse health effects. A study by Pope et al. suggests that exposure to high levels of PM2.5 is an important risk factor for cardiopulmonary and lung cancer mortality [1,2]. Furthermore, increased risks of asthma, heart attack and heart failure have been linked to exposure to high PM2.5 concentrations [3]. Clearly, PM2.5 is an important public health issue, regarding which, the most vulnerable members of the population are the elderly and young children.
Accurately forecasting high pollution events allows local health and air quality agencies to take preventative measures to protect the population. These agencies would be able to advise on safety measures, such as advising the most vulnerable members of the population to stay indoors, encouraging the reduction of emission practices by instituting free public transportation or issuing carpool advisories.
The New York State Department of Environment Conservation (NYSDEC) operates ground stations for monitoring PM2.5 and PM speciation throughout New York State (NYS) [4]. However, surface sampling is expensive and existing networks are limited and sparse. To forecast air quality, the U.S. Environmental Protection Agency (EPA) developed the Models-3 Community Multi-Scale Air Quality system (CMAQ), to provide up to 48 h forecasts. CMAQ has been the standard for modeling air pollution for nearly two decades because of its ability to independently model different pollutants while describing the atmosphere using “first-principles” [5].
While there are many approaches to forecasting air pollution, these approaches mostly fit into two categories: deterministic and statistical. CMAQ is an example of a deterministic model, and it is built to resolve the complex physical and chemical behavior of pollutants in the atmosphere [6]. To achieve perfect accuracy, a deterministic approach requires complete knowledge of pollutant sources and real-time emissions, and the precise descriptions of major chemical reactions in the troposphere [7] coupled to precise forecasts of meteorological state variables and dynamics. CMAQ was developed on 3D Chemical Transport Models (CTMs) that attempt to combine the interactions between meteorology, chemistry and emissions. Due to the complexity of this approach, and the limitations of attaining all pollutant source and emissions, approximations and simplifications are made in the CTMs which lead to biases in the forecasts [8]. Efforts to remove these biases in post processing are currently underway. On the other hand, we could implement data-driven statistical approaches, which are computationally cheaper than the CTMs, since they do not require complete knowledge of pollutant sources or emissions, and under certain conditions, may result in high-level forecasting skill. The main advantage of the deterministic approach is also the weakness of the statistical one. In order to achieve high accuracy with a statistical model, sufficient historical data, under different atmospheric conditions, are required. As mentioned above, ground monitoring stations are sparse. Therefore, while a statistical approach may achieve high accuracy in regions where data are collected, this approach cannot be applied to other regions [9]. In contrast to this, the deterministic approach does not require historical data; however, bias corrections to this approach do, and it was created precisely to produce forecasts for regions where the data are not collected [10]. This is one of the main reasons why regulators, such as the EPA, chose CMAQ, a deterministic approach, when it comes to forecasting air pollution—because accurate pollution levels must be predicted, especially in regions without ground monitoring stations.
In our previous work [11], we made use of a statistical approach using a neural network (NN) to forecast PM2.5 in NYS, and we made a direct comparison to CMAQ. The NN achieved higher forecasting accuracy for the operational resolution (single pixel, 12 km resolution) with R2 = 0.44 and RMSE = 3.09; and R2 = 0.20 and RMSE = 4.58, for the NN and CMAQ, respectively. While the NN is limited to those single-pixel cases, with little spatial coverage, a regional assessment of CMAQ, achieved through spatial averaging in NYS, saw significantly improved forecasting accuracy. These results fit the general blueprints for deterministic versus statistical methodologies. Ultimately, it is our goal to attain the high forecasting accuracy achieved by statistical approaches, but with the full spatial coverage achieved with CTM forecasts.
To do this, we extend our previous work by forecasting PM2.5 concentrations in regions that do not contain ground monitoring sites. We do this by utilizing statistically based machine learning tools to provide suitable interpolation for the prior PM2.5 fields that will then be used as collective inputs in the data-driven, multi-temporal deep neural network (DNN) approach.
Satellite remote sensing is a promising approach with which to fill in the data gaps in surface-level PM2.5. There is a strong relationship between aerosol optical depth (AOD) and PM2.5 concentrations [12,13]. Remote sensing scientists have used this relationship to estimate surface-level PM2.5 from satellite-derived AOD. The approaches range from traditional statistics, such as empirical linear models (R2 = 0.49) [12,13], all the way to sophisticated neural networks, such as deep learning networks (R2 = 0.88) [14]. While these algorithms accurately estimate surface-level PM2.5, the predictions are dependent on satellite retrieval of AOD. Satellite AOD retrieval is limited, in that the measurements are often not continuous. This could be because of cloud cover, or because the satellite is in a low earth orbit, scanning multiple locations. Furthermore, even data filling approaches that utilizer satellite retrieved AOD are not expected to be fully accurate, since many additional underlying parameters, such as planetary boundary height (PBL) and homogeneity differences, make these interpolations less secure. In addition, the lack of AOD retrievals during night-time adds further barriers to deriving full spatial coverage PM2.5 maps.
Our study had a pair of objectives. First, we sought to determine the best method to derive the spatially-continuous hourly PM2.5 concentrations for NYS. Second, by ingesting these full multitemporal PM2.5 maps as part of the required inputs, we assessed the NN technique to demonstrate via cross-validation that the approach can provide accurate next-day forecasting for NYS. This performance was also demonstrated on multiple pollution events observed during 2016, using CMAQ V4.6 and some case studies in July 2018, using CMAQ V5.02, Finally, it should be emphasized that the approach taken here is to assist current regional forecasting infrastructure, which requires next day forecasts to be made available by 5 PM local time. It is within this structure that the performance of the validation approached was assessed. The potential for extending the time to the 48 h forecasts common with CMAQ is not addressed in this paper.
As the goal of this paper is to build upon our previous work, the structure of this paper is organized to address each area of potential improvement: filling the data gaps and creating a more sophisticated neural network.
In Section 2, we address the data gaps in the PM2.5 measurements that are needed as inputs when running the next day forecasting. In this section, we explore multiple spatial interpolation approaches: simple Kriging, regression Kriging using external meteorological (MET) variables and a DNN that uses the ingestion of MET variables along with Kriged PM2.5 data points to optimize PM2.5 spatial maps. The final PM2.5 spatial maps are then used directly in Section 3 for the forecasting process.
In Section 3, we develop a more sophisticated forecasting algorithm. In our previous work, the neural network was developed using the MATLAB Neural Network Toolbox [15]. The main advantage of using a NN from the MATLAB Toolbox is that the NN is already built; therefore, the user only needs to experiment with different input scenarios. While there is some degree of freedom in determining the number of nodes and the width of the network, ultimately, the NN was not designed for our specific problem. In order to achieve optimum results, a NN custom tailored to our particular dataset was required. We used Google’s artificial intelligence language, TensorFlow [16], with the Keras wrapper [17]. In doing so, we have the flexibility to determine the depth and the width of each layer of the network. In addition, we also chose the activation function, optimizer and loss function. To achieve the highest level of forecasting skill from the DNN, numerous variations of the possible parameters to define the network were studied, and optimal thresholds for our region were determined. In Section 4, we present our conclusions. The Appendix A and Appendix B include: detailed descriptions of the site evaluation locations and land type (Table A1 and Table A2) and the detailed topology of the forecast DNN’s used (Figure A1).
Datasets
The core datasets we used in this study included: PM2.5 ground data which was obtained from the EPA’s AirNow network [18], which collects NYSDEC monitoring station measurements in real time. The meteorological data used were downloaded from the NOAA READY Gridded Data Archive [19]. The meteorological data used for both the interpolation DNN and the Forecasting DNN were the 12 km North American Model (NAM) consistent with the model driving the CMAQ model for comparisons. This data available for the full training testing period from 2010–2016 were downloaded from the NOAA READY Gridded archives https://www.ready.noaa.gov/archives.php (accessed on 31 December 2020) [19]. We also made use of High Resolution Rapid Refresh (HRRR) meteorological forecast data, Version 4 (implemented 12 July 2018), with native 3 km resolution, and up to 36 h of forecasts when we tested the forecast DNN for summer 2018, since we required true forecast meteorology. More information about HRRR can be found in [20], and the data can be downloaded from [21]. To remove any potential issues with different spatial resolution, the HRRR MET 3 km datasets were upscaled to 12 km by simple averaging.
Test cases that make direct comparison to CMAQ are referencing CMAQ V4.6, CB05 gas-phase chemistry, with 12 km horizontal resolution, 1200 UTC with added bias corrections. The meteorology model used is the North American Model Non-hydrostatic Multi-scale Model (NAM-NMMB). The station names and locations are listed in Table A2. The data can be accessed from reference [22], and the model description can be found in references [23] and [24]. In this long-term comparison over the entire 2016 year, the CMAQ products were archived in reanalysis mode. Finally, we were also in a position to test the robustness of the DNN forecast approach in summer 2018 when NCEP released an upgraded model of CMAQ, V5.0.2 [23,24] for running in real time and comparisons were made directly with the operational DNN forecasts without any additional retraining.
2. Interpolation for Spatially Continuous PM2.5 Maps
2.1. Interpolation Testing
The goal of spatial interpolation is to fill in the data gaps. The interpolation results were tested with the following cross-validation technique: We remove all of the hourly PM2.5 data for a single observation location from the complete dataset. The removed station is treated as the target location. Using the different interpolation methods, we derive the hourly PM2.5 values at the target location and compare them to the removed dataset of observations, which is the ground truth. There were 20 NYSDEC stations that were used for this analysis. Through an iterative process, each location was removed from the dataset and treated as a target location. Therefore, we were in a position to provide the comparisons for all 20 stations, either independently or as a NYS average statistic.
The AirNow station data used for the interpolation experiments in this article are from the New York State stations listed in Table A1 of the Appendix A, from January 2016, until December 2016. Figure 1 shows the geographical locations of these stations. From this figure, it is clear that ground stations are in fact sparse and limited, creating the data gaps discussed in the introduction. These 20 stations were selected because we set the threshold for the minimum number of data points per station to be 6000.
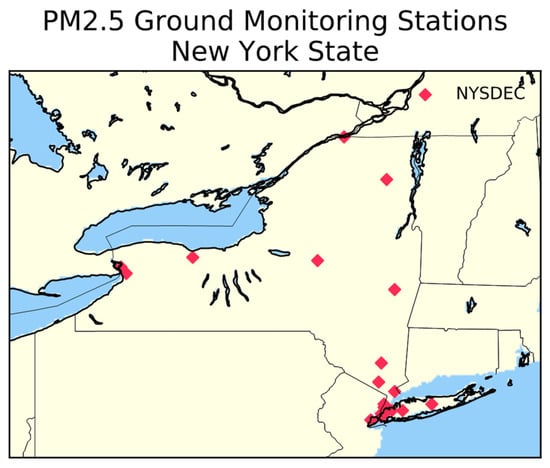
Figure 1.
Locations of the New York State Department of Environment Conservation (NYSDEC) stations.
Although there have been many studies [12,13,14] that show the precision of satellite-derived, surface-level PM2.5, these research efforts are recent, and databases containing the daily average datasets over NYS are not available. To replicate realistic day averaged satellite-derived data, we used the daily average PM2.5 at the target location as measured from the ground monitoring stations.
As McKeen et al. [25] observed, the variabilities in the PM2.5 diurnal cycle are quite similar for both urban and suburban locations and the basic dynamics are dominated by transport that would be less sensitive to local sources, and a form of interpolation amongst the ground stations is a reasonable way to fill the data gaps prior to forecasting.
2.2. Spatial Kriging
2.2.1. Simple Kriging
With entirely accurate satellite predictions of surface-level PM2.5, as discussed in our previous paper [11], determining a regional spatially-averaged diurnal shape factor (DSF) that captures overall temporal dynamics is the best approach to deriving the spatially-continuous hourly values, but these are not available in general. In the meantime, we explore the possibility of filling in the data gaps with a method that, at its core, is satellite-independent, but could use even poor satellite retrieval as an additional component to improve results. This method is spatial Kriging.
Basic interpolation methods, such as linear and cubic, may produce the smoothest results; however, when interpolating PM2.5 concentrations, these methods do not necessarily predict the most accurate intermediate values. Therefore, a more sophisticated interpolation method is required. Studies have found success when using spatial Kriging to fill in PM2.5 data gaps. Sampson et al. [26] achieved a regression score of R2 = 0.88, and Kloog et al. [27] achieved a score of R2 = 0.83. The time scales of these predictions were a yearly average and a daily average, respectively. The time scales for those studies were reasonable, as they focused on the health effects of fine particulate matter in regions that do not contain monitoring stations. The goal was not to forecast. However, for our data-driven approach, we require hourly time resolution. Therefore, we will first explore the use of Kriging on hourly time samples and then we will use machine learning techniques to improve these results.
The spatial Kriging is a gaussian process in which the interpolated values are predicted based on historical covariances. The simple Kriging equation can be seen in (1) below.
The equation calculates the PM2.5 value at the target location, . The values of represent the locations of the stations with the measured results. The weights, , represent proximity of the stations to the target location as a function of the prior covariances between the stations. To derive the weights, we calculate prior covariances between all stations. We evaluate the hourly covariances to determine whether the relationship between stations is different at different points of the diurnal cycle. The covariogram can be seen in Figure 2.
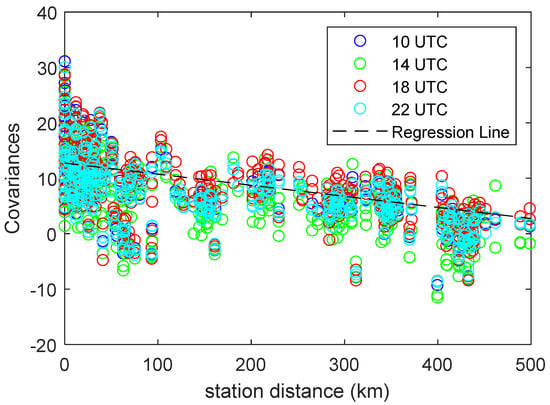
Figure 2.
Covariogram, representing covariance as a function of hour. Although the covariogram was calculated for all 24 h, every fourth hour was plotted for clarity.
From the plot, it is clear that the hourly best fit line converges with the best fit line for the total dataset. Using the relationship of covariance as function of distance, we can derive the weights with Equation (2) using the regression line estimation that smooths out any local mechanisms.
The first matrix on the right side of the equation represents the distances between all of the stations. The second matrix contains the distances between each station and the target location. The covariance is calculated for each point in both matrices using the equation from the line of best fit found in Figure 2. These weights are used in Equation (1) to predict PM2.5 at the target location.
One critical issue is that we might expect diurnal differences in the Kriging process with different spatial covariances occurring due to local dynamics. This may affect the spatial correlation statistics. However, in plotting all the relevant station covariances at different times of the diurnal cycle, we saw very small differences, and those only occurred on very large spatial scales. Therefore, a universal scaling of the covariogram can be used, as seen in Figure 2. In the next sections, this simple Kriging estimator will be used as an input combined with local MET variables at the target location. These inputs will be used to train multiple machine learning approaches in an effort to improve the kriging performance.
2.2.2. Machine Learning Methods
In multiple studies [26,27], local variables, such as land use and AOD, were utilized at the target location to optimize spatial Kriging. In an attempt to improve upon the results of our simple Kriging technique, we explored the use of artificial intelligence to ingest local variables into our interpolation method.
We extracted meteorological data from HRRR. The extracted local source variables included: surface air temperature, surface pressure, planetary boundary layer height, relative humidity and horizontal wind velocity at a height of 10 m. In addition to the meteorological data, we briefly investigated the use of AOD as a possible additional input factor. These predictor inputs were combined with interpolated results from the prior simple Kriging approach, and this input will be referred to as Kriged PM. Through an iterative process, we tested the potential improvements by including these inputs in our algorithm. The different input scenarios can be seen in Table 1.

Table 1.
Variations of inputs tested to improve spatial interpolation.
Within each case, two basic approaches were explored to incorporate the inputs: (1) creating a more sophisticated Kriging algorithm that utilizes the additional variables as input factors—regression Kriging, (2) using artificial intelligence to post process the simple Kriging results with the additional MET variables and satellite AOD–DNN.
Regression Kriging is essentially simple Kriging on the regression residuals of the dependent variable, in our case PM2.5, with the auxiliary variables added as separate spatially dependent degrees of freedom, listed in Table 1 above. This technique is often referred to as Kriging with external drift (KED). Mathematically, the KED is an extension of the basic Kriging formula where the KED weights are calculated using the results of the regression relationship. The equation to calculate the weights with the addition of the auxiliary variable can be seen in (3):
In the equation above, the parameters represent the auxiliary variables that extend the weights from simple Kriging. In the simple Kriging approach, the covariance of each location was calculated using the line of best fit from Figure 2. Here, the parameters must be estimated from the regression residuals. We used a random forest neural network from Scikit machine learning in Python [28] to do so. From manually tuning the random forest, we found that 200 trees optimized the results.
The second approach utilizes artificial intelligence as a regressor to estimate PM2.5 based off of the auxiliary variables themselves, independent of location. Case 1 in Table 1 above, where only the meteorological variables and the AOD are used as predictors (not the Kriged PM), is used as a baseline case to contrast how spatial Kriging improves the results. The goal of this approach is to improve simple Kriging, not replace it. A DNN was created using TensorFlow [16] with a Keras wrapper [17]. Unlike the random forest neural network from the regression Kriging, with TensorFlow we were able to customize almost all the parameters of the neural network. The neural network was built with 5 layers, each with a width of 20 neurons. The activation function was learning by exponential linear units (ELU), the loss function was mean square error and the optimizer was Adamax. A more detailed discussion of these parameters of the DNN can be found in Appendix B.
For both approaches detailed above, regression Kriging versus a DNN, the training used a sample set of the data from January through September 2016. All tests took place in October through December. Testing the neural networks in time periods where there was no training insures the integratory of statistical results.
2.3. Results
2.3.1. Simple Kriging
In Figure 3a, we illustrate a sample interpolation map using simple Kriging. Figure 3b shows the hourly regression results for the entire year of 2016. The regression is shown for each station as a function of mean distance from all other stations. For most stations, there is a high R2 for nearby stations. As can be expected, the R2 values decrease as the target location moves further away from the monitoring stations. This degradation as distance increases motivates the need to ingest local variables at the target site to improve prediction accuracy.
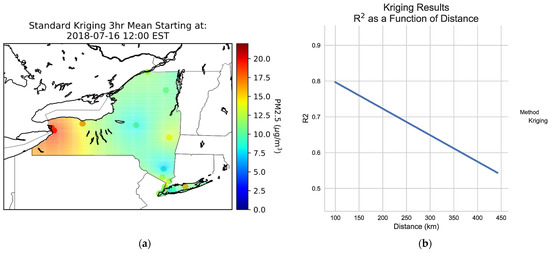
Figure 3.
Simple Kriging: (a) Spatial interpolation over New York State (NYS) using simple Kriging, (b) regression score as a function of mean distance from the target location to all other locations. Regression was calculated from the hourly kriging results for all stations for 2016.
2.3.2. Artificial Intelligence
Introducing local sources to improve the spatial interpolation produced positive results, as can be seen in Figure 4.
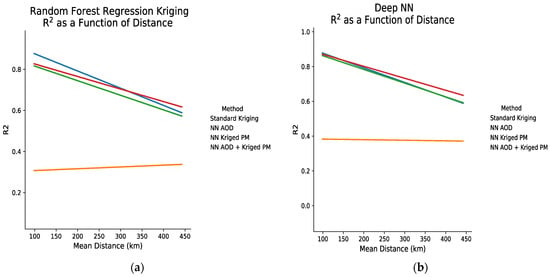
Figure 4.
Incorporating local source variables to potentially improve spatial Kriging. Regression score is plotted as a function of mean distance from the target location to all other locations. Regression was calculated from the hourly kriging results from September through December of 2016. (a) Random forest regression Kriging; (b) deep neural network (DNN) used to post processes simple Kriging results.
For both methods, the use of AOD (obtained from daily NASA MAIAC [29] 1 km product) and metrological inputs as the only predictors (no spatial Kriging) produced by far the worst results, as seen by the low baseline plot. This is most likely due to a lack of training data, and should be ultimately improved with longer term evaluations with hourly GOES-R. It should be noted that despite the lack of continuous AOD values in this dataset, using the available AOD as an additional predictor to the Kriged PM does improve results and its value is seen mainly for very remote areas; the Kriged PM2.5 values have less importance than expected. However, it must be emphasized that the intermittent availability of satellite AOD makes its inclusion unrealistic for operational forecasting in this data-driven approach. Even improved coverage from GOES-16 would provide daytime estimates while our approach uses the full diurnal period to forecast. In addition, while some improvement in interpolation skill was observed, the level was not significant enough to explore reduced coverage scenarios in our forecast data flow. For the other input scenarios, the degradation over distance is slightly improved from the simple Kriging case above. The overall regression score for simple Kriging (over all stations) was R2 = 0.76. Using this result as a baseline, the regression scores from the other methods, including local source variables, can be seen in Table 2.

Table 2.
The interpolation results from different input and method scenarios.
As mentioned above [27] Kloog et al. achieved a regression score, R2 = 0.83 while using spatial Kriging to interpolate the full day average. Our best cases (without AOD) are very close to that (0.80, 0.82), and those were achieved as hourly results. Both the random forest Kriging and the DNN achieved high interpolation accuracy. Even though the DNN produced somewhat better results, because the scores were so close, we decided to further test all three methods (simple Kriging, DNN and random forest) by using the interpolated results as inputs in the neural network forecaster.
The different interpolation methods were tested by using the results as inputs in the forecasting neural network with the same cross-validation testing approach. The target station was removed from the dataset, spatial interpolation was applied to provide the target location with PM2.5 input values, the next day forecast was calculated with these inputs, and the results were compared to the ground station measurements. Each method used the metrological and the Kriged PM values as inputs, these factors will always be available. The results for each method for all target stations aggregated can be seen in Figure 5. The full temporal analysis details of the DNN forecaster which use these preliminary AI interpolations are presented in Section 3.
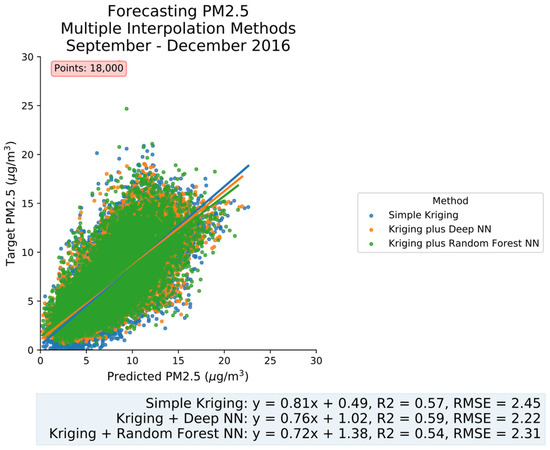
Figure 5.
All spatial methods tested as inputs in the fine particulate matter (PM2.5) neural network forecaster.
In doing our assessment skill tests, the results of the DNN forecaster should be obtained as independently from the training sets as possible. To accomplish this, all forecast results are from 2016, while training of the neural network forecaster was limited to 2011 to 2015. In addition, for each target, all of the PM2.5 inputs were derived through spatial interpolation without data from the target station, showing the accuracy of the forecaster at pixel locations that do not contain an NYSDEC ground monitoring station.
Based on these results and discussion, we determined that the best method for spatial interpolation is simple Kriging with a DNN regressor to ingest local variables and improve accuracy. In Figure 6, we show a sample interpolation map using the DNN approach. The simple Kriging map, Figure 3a, produced relatively smooth values at non-station locations; the station locations are the centers of PM2.5 geometric circles that smoothly bleed into each other. This result is mathematically appropriate but physically non-realistic. The map below, Figure 6, shows how local source variables at non-station locations, produces a map with additional sensitivity between local meteorology and PM2.5. However, as we have seen in Figure 4, the additional improved skill and overall sensitivity for the MET variables is significantly less than the baseline simple kriging estimator, so differences between Figure 3a and Figure 6 are subtle.
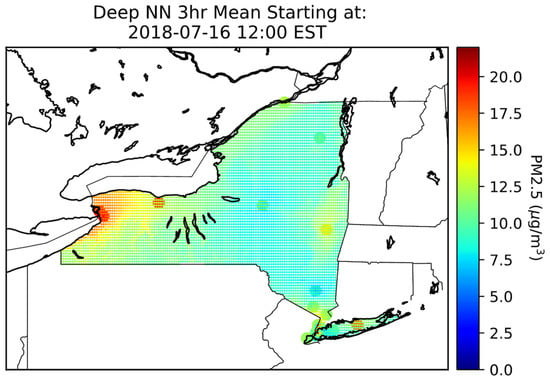
Figure 6.
Spatial interpolation over NYS using a DNN regressor on top of simple Kriging.
3. Transient Testing of the Forecast Deep Neural Network
3.1. Algorithm Structure
In our previous work [11], which focused on single location forecasting, we explored different MET ingestion scenarios to determine if the meteorological forecasts or metrological trends (i.e., 3-h differences between MET values) achieve a higher forecasting score when used as inputs in the DNN. Furthermore, in the original design, two neural networks were built to account for the different emission sources of NYC versus the rest of the state. While training the DNN, we reexamined the possibility of creating a single neural network to provide a complete forecast map for all of NYS. We achieved higher forecasting accuracy when using a single neural network instead of two for different regions. These results are ideal, as the goal is to make an operational forecaster, and a single DNN is easier to implement than two. In addition, we confirmed that there was no additional predictive value in using the MET differential approach.
The flow chart of the DNN forecaster is given in Figure 7. This flow chart is instructive for how the DNN works operationally: we make use of real time data acquisition of all the required MET variables from NARR prior to the 5PM forecast deadline to meet our specified goal, and the forecast inputs come from HRRR.
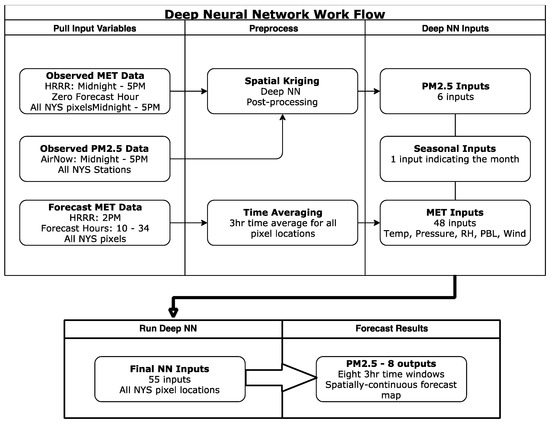
Figure 7.
Workflow of the DNN operational forecaster.
At 5PM EST, all of the input variables are pulled. Both Meteorological observations (needed only for the Kriged PM2.5 obtained from the DNN) and reanalysis runs (2PM reanalysis outputs using next day hours (10–34) for full next day 24-h coverage are pulled from HRRR and PM2.5 observations are pulled from AirNow. Spatial Kriging is applied to the observed PM2.5 and post processed with the observed meteorological data. Three-hour time averaging is applied to all spatial mapped datasets. Spatially resolved PM2.5, along with the forecasted meteorological data and the seasonal time inputs, are ingested into the DNN. The network is executed, and the spatially-continuous forecast is produced as eight 3-h time window estimates (outputs).
In looking over the workflow, we emphasize that only the Forecast MET inputs are used which may appear surprising since prior work had explored the use of using both same-day MET variables and next-day forecasts together and input the dynamic trend (difference) in the meteorology [11]. However, in assessing whether the use of MET trends was an improvement, we show the accumulated results in Figure 8.
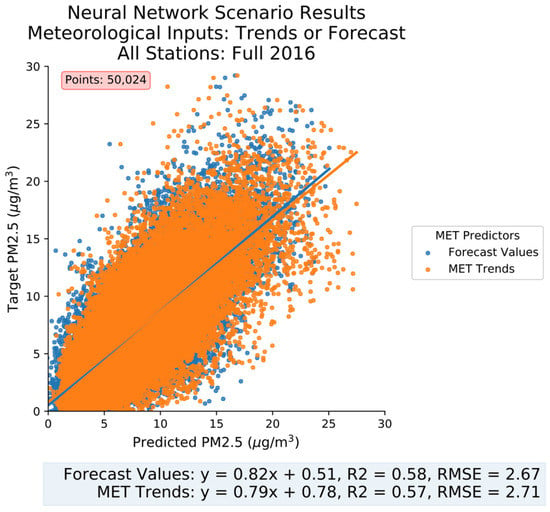
Figure 8.
Regression plot for input scenarios revisited for the DNN.
From here we can see that meteorology forecast inputs produce slightly better forecasting results than meteorological trends. In Table 3, we summarize the forecasting score to compare the best results for all models tested.

Table 3.
Table of forecasting scores for all models tested.
There are a couple of important statistics to point out from this table. While the Standard NN could at some locations produce a higher regression score and lower RMSE than CMAQ, that was just for single-pixel locations. However, the DNN significantly outperformed both CMAQ and the original NN, and the DNN produces spatially-continuous forecasting maps over NYS. The forecasting scores for the pixel locations that were interpolated are also in the table, and they produced slightly higher R2 scores and slightly lower RMSEs than the DNN with observed PM2.5 input values. There are two possible explanations for the higher forecasting score with spatially interpolated inputs than for observed inputs. The first is that the spatially interpolated values had no data gaps. When forecasting the observed inputs, sometimes there were missing data points, and even if the point was not missing, the value itself may have been skewed due to error or physical anomalies. The spatially interpolated dataset was computed with information from all the other stations. Even if a few stations had missing values, or skewed values, there was still a data point recorded at the target location. Secondly, we see from the input scenario results above that both the meteorological trends and meteorological forecasts play an important role in forecasting PM2.5. The spatially interpolated PM2.5 was done using spatial Kriging along with local meteorological variables ingested into the estimation process. Although the interpolated values may not be as accurate as the actual PM2.5 concentration levels, the interpolated values may be better input predictors than the actual concentrations. In a way, using the interpolated PM2.5 values as inputs essentially captures both the meteorological trends and meteorological forecasts.
3.2. Transient Analysis
To highlight the effectiveness of the DNN as a forecaster, we show the time series plot of the forecasted Kriged values for all stations during the months of January and March 2016. These months were chosen because of the volatility in the plots, the rest of the months are plotted in Appendix B Figure A3. In Figure 9, all bold lines represent average values for all stations. In Figure 9a, for January 2016, the shaded zone surrounding the mean values (both measurements and DNN) represent the relevant standard deviations with the DNN results obtained using the same Cross-Validation procedure. Figure 9b is the same as 9a with the addition of the CMAQ results. Only means are compared both for clarity and unavailability of consistent CMAQ error measures.
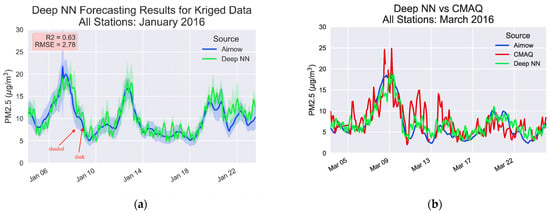
Figure 9.
Time series plot for the DNN forecaster: (a) DNN compared to NYSDEC ground monitoring stations, including resultant mean deviation of all stations due to cross-validation, January 2016; (b) inclusion of the Community Multi-Scale Air Quality system (CMAQ) forecasts (averaged over all stations) for March 2016.
More recent comparisons have been made using the same DNN system (i.e., no retraining) for summer 2018 and this demonstrates that the 2011–2015 training cycle is robust for conditions significantly removed from the training window. In particular, NCEP released an upgraded model of CMAQ, V5.0.2 [23]. This model was tested directly with the operational DNN, and the time series results are given in Figure 10. It can be seen that the DNN follows the trends better than CMAQ. For the short time period, CMAQ (1200 UTC bias corrected) produced a low RMSE score, very similar to the DNN; however, the DNN produced a significantly higher regression score, R2 = 0.43, compared to CMAQ, R2 = 0.28 overall. These CMAQ results are similar to what we have seen above, in that the bias compensation produces a low RMSE but also reduces the R2 value. This plot is further evidence that a DNN data-driven approach may be the best tactic for forecasting PM2.5 in New York State.
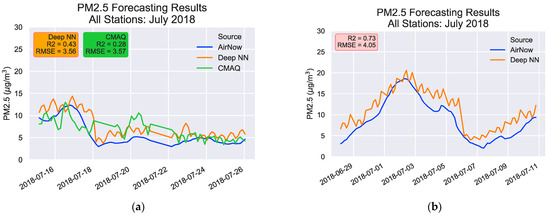
Figure 10.
(a) General background time series of the DNN and the CMAQ model compared to the AirNow ground observations; (b) comparisons made from a more dynamic pollution event centered on 2 July 2018.
To test the system under more dynamic conditions, On 2 July 2018, a relatively high pollution event in New York State was observed. While the DNN was not in operational mode at that point in time because the 36-h HRRR forecast did not become available until 12 July (which is why the test with CMAQ was not possible), we did study this event. Instead of using reanalysis data, we utilized the HRRR zero forecast hour retrievals and the 3 km MET data was upscaled to 12 km to maintain the same conditions which were used under training. While these values are not considered strictly forecasted, this test is important because it shows how the neural network responds in general to a dataset that it was not trained with. Furthermore, it crucial to assess this case because high pollution events are rare and predicting them is one of the main reasons to forecast PM2.5 in the first place. The forecast results can be seen in Figure 11.
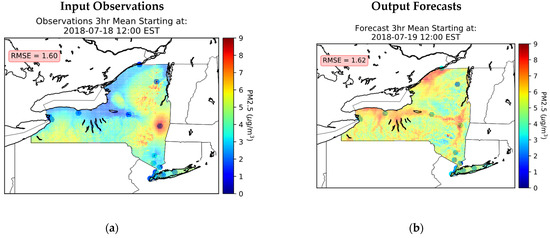
Figure 11.
To demonstrate the ability of the DNN to forecast change, not just react to it, we highlight a case where the spatial patters of PM2.5 concentrations are significantly different in the observation time window compared to the next day forecast: (a) input observations; (b) output forecast. The RMSE value in each plot indicates the regression score for the accuracy of the forecast at that particular time.
The trends in Figure 10 echo all of the results we saw in the 2016 (Figure 9) comparisons. The DNN accurately adjusts to the sharp transition from the low pollution levels to the sudden onset of the high event. Furthermore, the regression score of R2 = 0.73 is extremely high, although larger RMS biases are observed in comparison to 2016 comparisons. This reinforces our argument that lower regression scores can be expected when little volatility exists and the dynamics is dominated by regional production processes, and high scores are achieved when there are intense fluctuations. This is optimum, because predicting the onset of a high volatility cases is exactly the reason why the PM2.5 forecaster was created. It is important to understand that reduction in DNN forecaster performance is to be expected over time as regional chemistry process are modified. For example, SO2 emissions have been significantly reduced, and NH4NO3 plays a more important role in PM2.5 formation and is more sensitive to temperature and relative humidity changes. For this reason, given proper resources, we believe it is important to update the training of the Forecast DNN to include all years prior to the forecast year in question while removing the oldest year providing a representative 5 year dynamic training strategy.
Figure 10b underscores the precision of the DNN forecaster and its ability to respond quickly to the sharp transitions of higher pollution events. Furthermore, as discussed above, CMAQ produced the best results as a regional forecaster, when spatial averaging was done over all New York State and while CMAQ generally follows the trend, the DNN is more precise. However, such “station” comparisons do not give a full representation of the entire DNN forecast image product.
To further show the dynamics of the DNN and that the results are not over-weighted with priors, we highlight a case where the DNN is able to produce a forecast that contains spatial patterns that are significantly different than the spatial patterns at the time of the prior observations. This can be seen in Figure 11, where Figure 11a shows the PM2.5 concentrations from the observation time window, and Figure 11b shows the forecast that is made for a time window 24 h in the future. The different patterns show that the DNN is not just reactive to changes, but, as it is intended to do, can predict them.
4. Conclusions
In our attempt to generate spatially-continuous forecasting maps and make the most use of our prior work [11] to use NN approaches to forecast PM2.5 on a station-to-station basis, we first focused our attention on spatial interpolation of PM2.5 on an hourly timescale as a means to determine the needed PM2.5 input priors for use in the final DNN forecast system.
We explored spatial Kriging as a baseline interpolation approach and found that it is a good preliminary estimator that can be used under basic conditions. To account for cases where meteorological conditions have significant effects, we developed a DNN to ingest local source variables (PM2.5 + MET variables + monthly label (1–12)) to improve simple Kriging. The DNN postprocessing that was applied to simple Kriging resulted in interpolation with a more physical structure, as opposed to a strictly mathematical one. With this DNN, we were able to produce a regression score of R2 = 0.74 using cross-validation testing, which evaluates the predictions of each station using only the physical inputs from the other stations. While these scores are comparable with other studies that utilized spatial Kriging for interpolation [26,27], R2 ≈ 0.83; our results were produced on an hourly time scale; the other studies interpolated results with a minimum of the daily average. The hourly timescale is a crucial development, as it allows us to make use of these interpolated PM2.5 maps as inputs in the data-driven forecast model.
There have been many efforts to accurately forecast PM2.5 with high spatial resolution and large spatial coverage. Traditionally, deterministic approaches had low forecasting skill but high spatial coverage, while statistical efforts had high forecasting skill and low spatial coverage. Interpolation techniques to fill the data gaps, either with satellite-derived PM2.5 or spatial Kriging, have been focused on the health impact of fine particulate matter (not forecasting), and the time resolution of these interpolation techniques is too coarse for use in statistical forecasting methods. We set off to produce a reliable PM2.5 forecasting method that would achieve the high accuracy of statistical approaches, the spatial coverage of deterministic models and low computational cost. Based on the results in this paper, the DNN combined with spatial Kriging achieved this goal, with forecasting regression scores of R2 = 0.59 and RMSE = 2.22 .
We also demonstrated the ability of the system to both account for background PM2.5 dynamics and handle more episodic cases. The system was sufficiently robust that while the training period occurred from 2011–2015, tests done in both summer 2016 and summer 2018 performed well in comparison to CMAQ (V4.6/V5.02).
Finally, we would like to emphasize the differences between this work and preliminary work in [11]. In the prior work, we focused on PM2.5 forecasts at the station level, and as such the PM2.5 priors were always available and did not impose a limitation on the forecast. In this work, because of the extension to full state coverage and filling in the data gaps, we were driven to consider that the PM2.5 priors were obtained from interpolation and that this approach was thoroughly tested using full cross-validation technique. As the forecaster used multiple prior PM2.5 time slices, there was no guarantee these estimated values would lead to stable forecasts, but in fact, the results were comparable or even better, as discussed after Table 2. In our previous work, in order to take into account the different pollution levels of big cities and rural areas, two forecasting NNs were required, with one being for NYC and the other for upstate NY. The DNN architecture here allowed us to remove the need for two different NNs, and we are able to forecast with a single model for many different environments. Although the ultimate system is more complex, we achieved robust results, as testing conditions were completely separated from the testing window.
Efforts to add satellite observations are limited in this scheme, since the priors should be available for both day and night. Recent advances in improving the GOES-16 ABI AOD products by reducing diurnal biases [30] offer some long-term potential in this area.
Author Contributions
Conceptualization, B.G.; Methodology, F.M.; Resources, P.C.; Software, S.L. All authors have read and agreed to the published version of the manuscript.
Funding
We gratefully acknowledge Jeff McQueen (NOAA NWS) for providing the V4.6 CMAQ forecasts. We also would like to acknowledge partial support of this project through a NYSERDA EMEP Fellowship award (S.L.), and NYSERDA agreement number 137482.
Institutional Review Board Statement
Not applicable.
Informed Consent Statement
Not applicable.
Data Availability Statement
Not applicable.
Conflicts of Interest
The authors declare that they have no competing interest.
Appendix A. Datasets

Table A1.
NYSDEC station information.
Table A1.
NYSDEC station information.
| NYSDEC ID | Station Name | Latitude | Longitude | Land Type |
|---|---|---|---|---|
| 360010005 | Albany County Health Dept | 42.64 | −73.75 | Urban |
| 360290005 | Buffalo | 42.88 | −78.81 | Urban |
| 360291014 | Brookside Terrace | 43.00 | −78.90 | Suburban |
| 360310003 | Whiteface Base | 44.39 | −73.86 | Rural |
| 360551007 | Rochester 2 | 43.15 | −77.55 | Urban |
| 360590005 | Eisenhower Park | 40.74 | −73.59 | Suburban |
| 360652001 | Utica Health Dept | 43.10 | −75.23 | Urban |
| 360710002 | Newburgh | 41.50 | −74.01 | Urban |
| 360870005 | Rockland County | 41.18 | −74.03 | Rural |
| 361030009 | Holtsville | 40.83 | −73.06 | Suburban |
| 361192004 | White Plains | 41.05 | −73.76 | Suburban |
| 360050112 | IS 74 | 40.82 | −73.89 | Suburban |
| 360470052 | PS 314 | 40.64 | −74.02 | Urban |
| 360470118 | PS 274 | 40.69 | −73.93 | Suburban |
| 360610115 | Intermediate School 143 | 40.85 | −73.94 | Urban |
| 360610134 | Division Street | 40.71 | −74.00 | Urban |
| 360610135 | CCNY | 40.82 | −73.95 | Urban |
| 360810120 | Maspeth Library | 40.73 | −73.89 | Suburban |
| 360850111 | Freshkills West | 40.58 | −74.20 | Suburban |
| 360337003 | St Regis Mohawk-NY | 44.98 | −74.70 | Rural |

Table A2.
CMAQ grid cell information.
Table A2.
CMAQ grid cell information.
| Name | Abbreviation | Latitude | Longitude | Land Type |
|---|---|---|---|---|
| Amherst | AMHT | 42.99 | −78.77 | Suburban |
| CCNY | CCNY | 40.82 | −73.95 | Urban |
| Holtsville | HOLT | 40.83 | −73.06 | Suburban |
| IS 52 | IS52 | 40.82 | −73.90 | Suburban |
| Loudonville | LOUD | 42.68 | −73.76 | Urban |
| Queens College 2 | QC2 | 40.74 | −73.82 | Suburban |
| Rochester Pri 2 | RCH2 | 43.15 | −77.55 | Urban |
| Rockland County | RCKL | 41.18 | −74.03 | Rural |
| S. Wagner HS | WGHS | 40.60 | −74.13 | Urban |
| White Plains | WHPL | 41.05 | −73.76 | Suburban |
Appendix B. Description of DNN and Station Performance Results
Through interpolation involving spatial Kriging and a DNN, we fill the data gaps to provide inputs for all pixel locations in New York State, allowing for a statistical forecasting approach to have the same spatial coverage as the deterministic methodologies. The next step is to enhance the forecasting neural network. Utilizing Google’s artificial intelligence language, TensorFlow [16], with the Keras wrapper [17], we customize the design of a DNN catering to our specific task of forecasting PM2.5.
Before we get into the details of the neural network, it is important to note that there are many different types of neural networks. When the goal is to forecast, one could use a forecasting neural network, or a regressor utilizing available predictors. The forecaster neural network uses historical data and other predictors, and is continuously training, even when the forecaster is operational. The forecast network learns the trends, and it predicts the desired number of hours ahead. It is necessary to have continuous data for this network. The other approach is a regressor, where one uses predictors that are available today to forecast tomorrow. For this network, it is not necessary to have continuous data, because every forecast is a discreet value. Based off of our results from our previous work, and the precision of the interpolation from the shape factor approach, we decided to implement a regressor neural network as our forecaster. The reason we chose this network is because PM2.5 forecast values are not 8 discrete values, but rather, they are all related to each other through the diurnal cycle. By training the neural network on 8 targets, instead of a single output, we were able to ingest this relationship into the learning process.
Creating the perfect artificial neural network requires optimization of two separate factors: input predictors and neural network design. The MATLAB NN proved that a data-driven approach has the potential to produce highly accurate forecasts. Furthermore, utilizing the premade NN from MATLAB, we were able to separate the two main factors of building a NN, and focus on the input predictors. Now that we have determined what the optimum input predictors are, we focus on the neural network design. To do so, it is important to highlight some of the most important aspects of a neural network.
A neural network is used to learn the relationship between a number of predictors and a predictand. This method is highly effective for complex, non-linear, relationships. The model consists of a number of layers that contain connected neurons. The input layer is the predictors. These neurons are multiplied by different weights and a bias is added. The result is passed to the next layer until finally the output layer is reached, which contains the target values. The neural network is trained, validated, and tested, always updating the weights and the biases in each layer, until the optimum result is reached. The processes of determining whether a neuron should be used or not is through the activation function. The optimizer is the function that changes the values of the weights on each iteration during the training process. The loss function determines what statistical score the neural network attempts to optimize. In addition to choosing all of these statistical backbones for the neural network, the number of layers, and the width for each layer were also chosen.
All structures, activation functions, and optimizers have pros and cons, and there isn’t necessarily a single approach that is superior to others. We highlight the work of Niu et al. [31], to provide evidence for this argument. In their work, Niu et al., test both a multi-layer perceptron (MLP) and an Elman Neural Network (ENN) structure for forecasting PM2.5. Their results show that when MLP is compared directly to ENN, ENN produces better forecasting skill in Guangzhou, China, while MLP achieves higher results in Lanzhou, China. These results inform the necessity to explore all neural network structures when applying a statistical method to a new location.
Our optimum neural network design was determined through an iterative process, in which different activation functions were tested against different optimizers, all while varying the size and depth of the neural network. In the following subsections, we provide details of the configuration of the DNN.
Appendix B.1. Statistical Tools
Learning by Exponential Linear Units [32] was chosen for the activation function. The function is modeled in Equation (A1) below:
One advantage of ELU is that it is non-linear, therefore it is differential, and it could be used to stack layers and create DNNs. Furthermore, there is sparsity in activation. This means that not every neuron will be activated, and that the activated neurons will be more efficient. This is in contrast to activation functions such as Sigmoid of Tanh, where there is a small activation region (between −1 and 1), and almost all neurons are activated. ELU’s have a faster learning rate because the activation can produce negative values, moving the gradient closer to the unit natural gradient, which increases speed. Finally, ELU’s have shown higher classification accuracies than other activation functions when a network has more than 5 layers (our network has 8). More details about ELU can be found in [32].
Adamax was used as the optimizer [33]. While stochastic gradient decent is widely used as the optimizer in neural networks, there is an advantage to using Adamax. Stochastic gradient decent uses a single learning rate for all weights, and this does not change during training. Adamax, on the other hand, has a per-parameter learning rate for each weight, and modifies separately during training. This is advantageous for neural networks with large inputs and for inputs that contain noisy data. More details on Adamax can be found in [33].
We chose the loss function to be the minimization of the Mean Square Error (MSE). This choice was made because low MSE generally results in high forecasting accuracy.
Appendix B.2. Shape of the Neural Network
A neural network is considered “deep” when there are multiple layers between the input and the output. The structure of our NN is classified as an MLP, where every element of a previous layer is connected to every element of the following layer. Varying the width and depth of each layer of the neural network, we arrived at a final shape consisting of 8 dense layers, with widths of 100, 60, 60, 60, 30, 30, 30, and 8 respectively. The neural network architecture can be seen in Figure A1 below. It is clear that this design is significantly more sophisticated than the original neural network built with MATLAB in ref. [11], which only had 1 layer with 10 nodes and is critical when dealing with multiyear data and underlying trends and is robust enough to do forecasting during periods long after the training period ended.
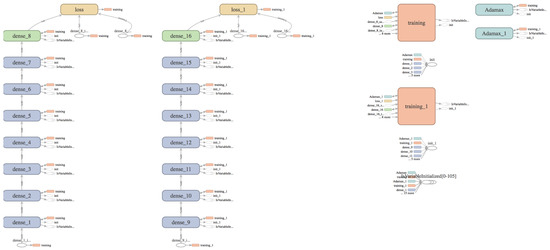
Figure A1.
Architecture of the deep neural network PM2.5 forecaster.
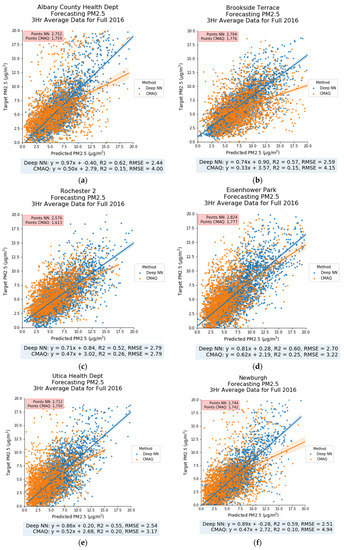
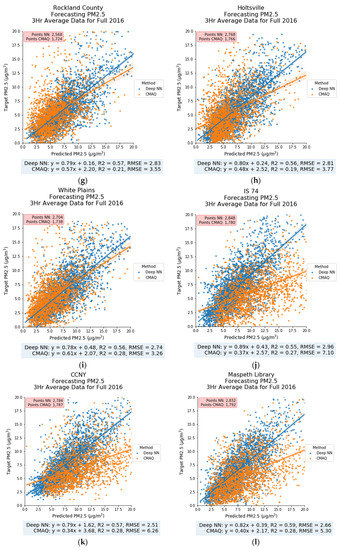
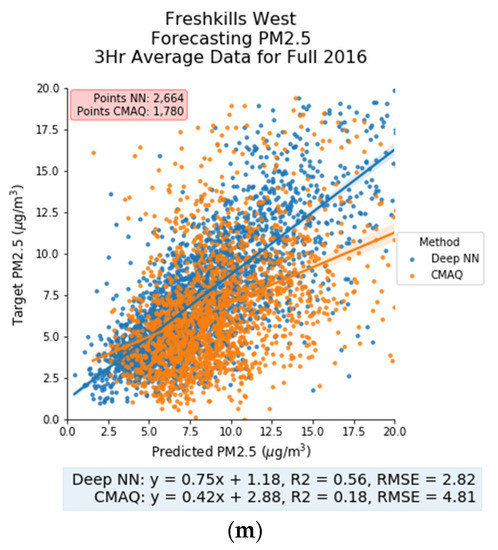
Figure A2.
Regression analysis, deep neural network (a–m). The regression analysis was computed for the comparison between AirNow observations and the various prediction models. The R2 values comparing the models to the observations are plotted in the figures to compare CMAQ to the DNN. The CMAQ model here includes only the bias-corrected, 12:00 UTC zero forecast hour, model. This model was chosen because it generally produces the best forecasting results for CMAQ.
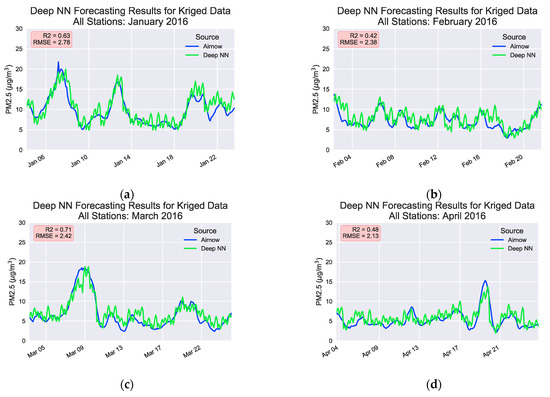
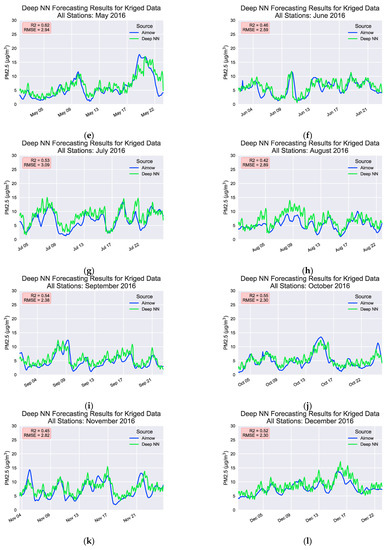
Figure A3.
Time series plot, deep neural network (a–l). To highlight the effectiveness of the DNN as a forecaster, we show the time series plots of the forecasted Kriged values for all stations during year 2016. The dark lines represent average values for all stations, and the shaded lines that surround the dark ones represent the standard deviations between all stations.
References
- Pope, C.A.I.; Dockery, D.W. Health Effects of Fine Particulate Air Pollution: Lines that Connect. J. Air Waste Manag. Assoc. 2006, 56, 709–742. [Google Scholar] [CrossRef]
- Pope Iii, C.A.; Burnett, R.T.; Thun, M.J.; Calle, E.E.; Krewski, D.; Ito, K.; Thurston, G.D. Lung cancer, cardiopulmonary mortality, and long-term exposure to fine particulate air pollution. JMMA 2002, 287, 1132–1141. [Google Scholar] [CrossRef] [PubMed]
- Weber, S.A.; Insaf, T.Z.; Hall, E.S.; Talbot, T.O.; Huff, A.K. Assessing the impact of fine particulate matter (PM 2.5) on respiratory-cardiovascular chronic diseases in the New York City Metropolitan area using Hierarchical Bayesian Model estimates. Environ. Res. 2016, 151, 399–409. [Google Scholar] [CrossRef]
- Rattigan, O.V.; Felton, H.D.; Bae, M.-S.; Schwab, J.J.; Demerjian, K.L. Multi-year hourly PM2.5 carbon measurements in New York: Diurnal, day of week and seasonal patterns. Atmos. Environ. 2010, 44, 2043–2053. [Google Scholar] [CrossRef]
- Byun, D.; Schere, K.L. Review of the Governing Equations, Computational Algorithms, and Other Components of the Models-3 Community Multiscale Air Quality (CMAQ) Modeling System. Appl. Mech. Rev. 2006, 59, 51–77. [Google Scholar] [CrossRef]
- Mohan, M.; Kandya, A.; Yadav, M. An evaluation and comparison of the various statistical and deterministic techniques for forecasting the concentration of criteria air pollutants. Int. J. Environ. Pollut. 2011, 44, 96. [Google Scholar] [CrossRef]
- Feng, X.; Li, Q.; Zhu, Y.; Hou, J.; Jin, L.; Wang, J. Artificial neural networks forecasting of PM2.5 pollution using air mass trajectory based geographic model and wavelet transformation. Atmos. Environ. 2015, 107, 118–128. [Google Scholar] [CrossRef]
- Stern, R.D.; Builtjes, P.; Schaap, M.; Timmermans, R.; Vautard, R.; Hodzic, A.; Memmesheimer, M.; Feldmann, H.; Renner, E.; Wolke, R. A model inter-comparison study focussing on episodes with elevated PM10 concentrations. Atmos. Environ. 2008, 42, 4567–4588. [Google Scholar] [CrossRef]
- Hrust, L.; Klaić, Z.B.; Križan, J.; Antonić, O.; Hercog, P. Neural network forecasting of air pollutants hourly concentrations using optimised temporal averages of meteorological variables and pollutant concentrations. Atmos. Environ. 2009, 43, 5588–5596. [Google Scholar] [CrossRef]
- Zhang, Y.; Bocquet, M.; Mallet, V.; Seigneur, C.; Baklanov, A. Real-time air quality forecasting, part I: History, techniques, and current status. Atmos. Environ. 2012, 60, 632–655. [Google Scholar] [CrossRef]
- Lightstone, S.D.; Moshary, F.; Gross, B. Comparing CMAQ Forecasts with a Neural Network Forecast Model for PM2.5 in New York. Atmosphere 2017, 8, 161. [Google Scholar] [CrossRef]
- Wang, J.; Christopher, S.A. Intercomparison between satellite-derived aerosol optical thickness and PM2.5 mass: Implications for air quality studies. Geophys. Res. Lett. 2003, 30. [Google Scholar] [CrossRef]
- Ma, Z.; Hu, X.; Sayer, A.M.; Levy, R.; Zhang, Q.; Xue, Y.; Tong, S.; Bi, J.; Huang, L.; Liu, Y. Satellite-Based Spatiotemporal Trends in PM2.5 Concentrations: China, 2004–2013. Environ. Health Perspect. 2016, 124, 184–192. [Google Scholar] [CrossRef]
- Li, T.; Shen, H.; Yuan, Q.; Zhang, X.; Zhang, L. Estimating Ground-Level PM2.5 by Fusing Satellite and Station Observations: A Geo-Intelligent Deep Learning Approach. Geophys. Res. Lett. 2017, 44, 11985–11993. [Google Scholar] [CrossRef]
- MATLAB Optimization Toolbox, 2016a. Available online: https://www.mathworks.com/help/gads/options-changes-in-r2016a.html (accessed on 31 December 2020).
- Abadi, M.; Agarwal, A.; Barham, P.; Brevdo, E.; Chen, Z.; Citro, C.; Corrado, G.S.; Davis, A.; Dean, J.; Devin, M.; et al. TensorFlow: Large-Scale Machine Learning on Heterogeneous Systems. arXiv 2016, arXiv:1603.04467. [Google Scholar]
- Chollet, F. Keras. 2015. Available online: https://github.com/fchollet/keras (accessed on 31 December 2020).
- Airnow. 2000. Available online: https://www.airnow.gov/ (accessed on 31 December 2020).
- Available online: https://www.ready.noaa.gov/archives.php (accessed on 31 December 2020).
- Rapid Refresh (RAP). NOAA. Available online: https://rapidrefresh.noaa.gov (accessed on 31 December 2020).
- NOAA Operational Model Archive and Distribution System. Available online: http://nomads.ncep.noaa.gov (accessed on 31 December 2020).
- NOAA. Available online: http://www.emc.ncep.noaa.gov/mmb/aq/sv/grib/ (accessed on 31 December 2020).
- NOAA. Available online: http://www.emc.ncep.noaa.gov/mmb/aq/AQChangelog.html (accessed on 31 December 2020).
- Lee, P.; McQueen, J.; Stajner, I.; Huang, J.; Pan, L.; Tong, D.; Kim, H.; Tang, Y.; Kondragunta, S.; Ruminski, M.; et al. NAQFC developmental forecast guidance for fine particulate matter (PM2.5). Weather Forecast. 2017, 32, 343–360. [Google Scholar] [CrossRef]
- McKeen, S.; Chung, S.H.; Wilczak, J.; Grell, G.; Djalalova, I.; Peckham, S.; Gong, W.; Bouchet, V.; Moffet, R.; Tang, Y.; et al. Evaluation of several PM2.5 forecast models using data collected during the ICARTT/NEAQS 2004 field study. J. Geophys. Res. Atmos. 2007, 112. [Google Scholar] [CrossRef]
- Sampson, P.D.; Richards, M.; Szpiro, A.A.; Bergen, S.; Sheppard, L.; Larson, T.V.; Kaufman, J.D. A regionalized national universal kriging model using Partial Least Squares regression for estimating annual PM2.5 concentrations in epidemiology. Atmos. Environ. 2013, 75, 383–392. [Google Scholar] [CrossRef] [PubMed]
- Kloog, I.; Koutrakis, P.; Coull, B.A.; Lee, H.J.; Schwartz, J. Assessing temporally and spatially resolved PM2.5 exposures for epidemiological studies using satellite aerosol optical depth measurements. Atmos. Environ. 2011, 45, 6267–6275. [Google Scholar] [CrossRef]
- Pedregosa, F.; Varoquaux, G.; Gramfort, A.; Michel, V.; Thirion, B.; Grisel, O.; Blondel, M.; Prettenhofer, P.; Weiss, R.; Dubourg, V.; et al. Scikit-learn: Machine Learning in Python. J. Mach. Learn. Res. 2011, 12, 2825–2830. [Google Scholar]
- NASA. Available online: Ftp://maiac@dataportal.nccs.nasa.gov/DataRelease/NorthAmerica_2000-2016/ (accessed on 17 February 2021).
- Lyapustin, A.; Wang, Y.; Laszlo, I.; Kahn, R.; Korkin, S.; Remer, L.; Levy, R.; Reid, J.S. Multiangle implementation of atmospheric correction (MAIAC): 2. Aerosol algorithm. J. Geophys. Res. Atmos. 2011, 116. [Google Scholar] [CrossRef]
- Niu, M.; Gan, K.; Sun, S.; Li, F. Application of decomposition-ensemble learning paradigm with phase space reconstruction for day-ahead PM2.5 concentration forecasting. J. Environ. Manag. 2017, 196, 110–118. [Google Scholar] [CrossRef] [PubMed]
- Clevert, D.-A.; Unterthiner, T.; Hochreiter, S. Fast and accurate deep network learning by exponential linear units (elus). arXiv 2015, arXiv:1511.07289. [Google Scholar]
- Kingma, D.P.; Ba, J. Adam: A method for stochastic optimization. In Proceedings of the International Conference Learn. Represent, San Diego, CA, USA, 5–8 May 2015. [Google Scholar]
Publisher’s Note: MDPI stays neutral with regard to jurisdictional claims in published maps and institutional affiliations. |
© 2021 by the authors. Licensee MDPI, Basel, Switzerland. This article is an open access article distributed under the terms and conditions of the Creative Commons Attribution (CC BY) license (http://creativecommons.org/licenses/by/4.0/).