1. Introduction
The contribution of the agriculture sector to economic development and the generation of household incomes will depend on its productivity [
1], which will in turn depend on land use and associated investments [
2]. A valuable contribution to the design of future rural labor and land-use policies would be to forecast land allocations and the accompanying impacts on labor demand in response to climate changes and to gauge the potential flexibility of agricultural decision-makers to adapt land uses to mitigate or even perhaps take advantage of such changes. This concern over anticipating the possible costs and benefits of future farm production changes (or a lack thereof) due to potential climate changes is particularly acute in lower- and middle-income countries, where, relative to in richer economies, agriculture is often disproportionately important in employment, income generation and, often, foreign exchange earnings [
3]. Regardless of the level of economic development, in most countries, agriculture will be the sector of the national economy most directly exposed to future climate variations [
4]. Various authors have emphasized that agriculture is both the most heavily studied sector in the economics literature on climate change, and also the most controversial in terms of the magnitude of the potential impact estimates [
4,
5,
6,
7,
8]. One factor contributing to the divergence in impact estimates is the complexity of the interactions between climate and crop growth, involving temperature, precipitation, carbon dioxide fertilization, water requirements, pests, weeds and ozone [
9]. In short, the potential effects of climate change on agricultural production are complex, nonlinear and multidimensional [
10,
11,
12].
In this paper, we present an analysis of the expected impacts on agricultural land and labor use in Chile of projected climate-change scenarios in 2040 and 2070. The approach we took in this study was to model farmers’ land allocations as a consequence of individual-level decisions. These decisions were based on the estimated relative profitability of each activity in specific agroclimatic zones under a given climate-change scenario. Land and labor are allocated to various activities, including field crops and plantation crops (such as wine grapes and fruits), pastures (for dairy and other animal activities) and forestry. As the climate changes, farmers will adapt their resource use to what they perceive to be the most profitable activity, given market prices and whatever credit, water and other input constraints that they face.
In the case of Chile specifically, the primary agriculture and food processing sectors are well-integrated and together represent an important contribution to employment and export earnings. Primary, farm-level production has accounted for a decreasing share of national GDP in national accounts, but, due to the labor intensity of Chile’s crop mix, primary production plays a much larger role than its value-added share both in terms of direct employment and as the base on which a large and dynamic food sector has evolved and currently thrives [
13]. Official government statistics show that the primary production of the agriculture and forestry sectors currently accounts for approximately 3% of Chile’s GDP, but also, agriculture employs, annually, approximately 12% of the total national workforce [
14]. Furthermore, primary agriculture contributes significantly to downstream activities [
14], and primary and processed agricultural and forestry products contribute significantly to national exports, representing about 15% to 20% of Chile’s annual merchandise export earnings (updated statistics may be found at Ref [
15]). Given the prominence of the food system in national income generation and employment in Chile, as in other middle-income countries with large export-oriented agrifood sectors, the likely impacts in the event that projected climate changes occur have elicited considerable interest among policymakers and private sector actors. According to the Fourth Assessment Report of the Intergovernmental Panel on Climate Change [
16], over the last 50 years, central Chile has experienced reduced precipitation, and most Chilean glaciers are shrinking in volume at an accelerated rate [
17]. The IPCC (Intergovernmental Panel on Climate Change) report also projects, among other impacts, that climate change is likely to affect the agriculture sector by leading to the salinization and desertification of agricultural lands in northern and central Chile. Such changes could have significant welfare implications.
This paper reports the results of a model of agricultural land allocations and labor use in Chile under alternative climate-change scenarios, as anticipated by locally scaled simulations based on the Hadley Center’s Precis model [
18]. This study contributes to the literature regarding the impacts on the agriculture sector by developing a practical economic model of farmer-decision-based changes to land allocation among 25 different activities (field crops, fruits, pasture-based activities and forestry plantation) for 2040 and 2070 under two climate regimes of differing severity. For the purposes of simulation, we adopted the assumption that farmers make long-run decisions prior to the realization of a particular climate scenario, and, as is the case for similar long-term simulation models, the land-use projections were limited by the ceteris paribus assumption that other factors (e.g., international prices, macroeconomic policies, etc.) except climate remain roughly unchanged in the future. Despite this limitation, our approach to projecting future impacts on land use and net income in agriculture in the context of climate change contributes to the methodological toolset for analyses in the case where simulations from optimization-based programming models (for example, [
19,
20]) require considerably more production-level data than are currently available in less-developed countries. While hedonic land-price models [
21,
22] are methodologically similar to the econometric approach taken in this present study, they typically do not address the details of land allocations to specific crops, and for those analyses that do address the details of input use, the modeling demands a considerable amount of land- and input-price data matched to local weather and climate data [
23].
The modeling effort was based on changes in relative net incomes per hectare of different land-use activities at the municipality level (352 comunas). These net-income changes, using the most up-to-date data available from the last agricultural census, rely on estimates of per-hectare yield changes, conditioned on the cost structure of each currently observed and potential land-use activity associated with specific agroclimatic zones. The variation of relative net incomes by activity will depend on zone- and crop-specific changes to yields, allowing for similarly specific cost structures. The simulations presented in this study were based on two long-term scenarios of greenhouse gas emissions and associated temperature and precipitation outcomes at a 25 km grid scale [
18]. The yield change estimates were based on model-simulated projections by agronomic experts that consider, among other factors, possible restrictions of water availability. We took yield projections as a basic input for the relative net-income estimates, which were a function of output and input prices and estimated cost parameters as reflected in detailed farm budgets. The sensitivities to relative net-income changes of land allocations among various activities were estimated using historical market price data and from county-level land-use and yield data derived from the 1997 and 2007 national agricultural census. These estimates of the sensitivity of land allocations to changes in relative net incomes per hectare were used to simulate the allocation of land in each scenario and period. The resulting allocations were combined with technical coefficients of labor use to determine the demand for workers in each municipality. An important finding is that, for Chile, in general, the impact of anticipated climate change on total land use for the broad categories of activities is relatively small due, in large part, to the ability of decision-makers to adapt to changing climate conditions by adjusting their portfolios of activities within each locality. These results underline the importance for welfare considerations and resilience to climate changes of farmer adaptability and the mitigation effects of land-use responses.
In the following section, we present the basic methodology for simulating land allocations, based on the projected yield changes under the two climate-change scenarios, for 30- and 60-year horizons. Additionally discussed are the data sources for the current land use, projected yields, prices and costs, and the estimation of the parameters that reflect the sensitivity of land allocations to changes in the relative profits of the various activities. The third section presents the simulation results in detail, and the concluding section discusses some implications and suggestions for refinements of the approach and future lines of inquiry.
2. Materials and Methods: Modeling Agricultural Land Allocations and Labor Use
This section presents a model of land allocations at the municipal level driven by expected relative net incomes per hectare. In brief, the expected net incomes were constructed from average per-hectare yields, average output prices and per-hectare production cost estimates. The sensitivities of cropland allocations (in hectares) to relative net-income changes were estimated using historical price, yield and cost data and data on land allocations at the municipal level derived from the Chilean Agricultural Census (1997 and 2007; the census also records the production levels of field crops, although not of plantation crops; the 2007 agricultural census is the last currently available). The projections of the average per-hectare yields under the hypothesized climate conditions were then used to calculate the projected expected net incomes (holding prices constant), which in turn yielded projections of land allocations to specific crops within municipalities under future climate scenarios. The projected land allocations and yields were then linked to projected labor demand at the municipal level via estimates of crop-specific labor requirements.
This is an econometric approach and stands in contrast to deriving simulations from programming models [
24,
25,
26], which require considerably more production-level data (and resources) than are currently available in Chile. Other studies of the economic impacts of climate change on the agricultural sector have been based on hedonic land-price models [
27,
28,
29]. Such studies are methodologically akin to the econometric approach taken in this present study, although they do not address the details of land allocations to specific crops. Unfortunately, they also require a significant amount of land-price data matched to local weather and climate data, resources yet unavailable in a coherent form for econometric work in Chile as they are in the United States and other developed countries. The reader should note the ceteris paribus nature of the land allocation simulations: per-hectare crop productivity was altered only by projected climatic changes and variations in water availability; the total amount of agricultural and forestry land remained constant at the municipal level; the real prices of tradable goods were unchanged. For non-tradable goods, however, prices depend on national production levels. The prices of non-tradable goods were projected for each scenario based on estimated price flexibilities (inverse demands) applied to projected production levels. One should note that this simulation approach to projecting the consequences for land use of possible climate regimes must also set aside many possible changes to factors that might determine the state of land allocations and rural labor demand in the relatively distant future. For example, we must take as given the state of the political regime and so also set aside changes to government policy that would directly influence land allocations, such as policies aiming to protect farmland and forests from residential development or changes in zoning policies due to population pressures that might shift land to residential use (see, for example, [
30]).
The per-hectare labor requirements and cost estimates were based on standardized crop budgets generated by Agrogestión (Fundación Chile), the Ministry of Agriculture, and the Department of Agriculture Economics at the Catholic University of Chile [
31]. These standardized budgets represent realistic field-level information for 1997 and 2007 regarding the expected yields and input costs for each crop and region (nominal prices converted to CLP in December 2007). In some municipalities, the regional-level yields are unlikely to apply, and [
32] was the source of the yields in such cases (The present study began with a previously developed methodology that was based on the construction of a municipality-level yield index giving the municipality’s yield relative to a maximum yield for the specific crop in a region [
32]. In the present study, these municipal yields were estimated by adjusting the expected yields given by the crop budget for the region by this index. More details and the list of specific municipalities for which these indices apply are available from the authors upon request.). For future climate scenarios, the expected yield performance for each crop was estimated using agronomic simulation models by [
33], which also accounted for water availability constraints [
32]. The yields were projected for the twelve crops in the study under four climate-change scenarios based on the IPCC’s A2 (severe) and B2 (moderate) emission projections for 2040 and 2070 (These scenarios are based on climate model projections based on the global climate Hadley Centre Coupled Model, version 3 (HadCM3), and are as follows: a “severe” scenario (A2) and a “moderate” scenario (B2). The A2 scenario considers a high level of emission of greenhouse gases (GHG), while the B2 scenario considers a lower level of GHG emissions. Both climate-change scenarios were evaluated for the years 2040 and 2070. Thus, there were four scenarios: A240, A270, B240 and B270. For each, the economic impact of climate change was estimated. The Second National Communication to the UNFCCC (United Nations Framework Convention on Climate Change) Chile [
33] has been extended to include the effects of water restrictions on the supply of irrigation water as a result of projected hydrological changes associated with climate changes.). The crops considered were ten fruits (e.g., peaches, apples, oranges and grapes), vines, eight irrigated and rainfed field crops (e.g., beans, corn, potatoes, sugarbeets and wheat), two forestry plantation crops (radiata pine and eucalyptus), two categories of pasture (natural and improved), alfalfa and fallow land. The pasture activities for the calculation of the net incomes for the two pastureland categories were hay, forage and grazing for dairy and other animals, overwhelmingly, beef cattle. The production costs per hectare for each crop or pasture activity were based on a fixed cost and a variable cost per unit yield. The variable costs were specific for each region based on the crop budgets, but fixed costs for a given crop were taken to be common across regions (The variable costs depend on region-specific soil fertility, climate and other factors manageable, in part, by altering input use. The fixed costs for specific crops are primarily due to technical packages common across regions such as tractors and harvesting equipment, labor in management time, and other factors necessary for production but uncorrelated with final yield levels.). The expected prices used to estimate the net-income levels for each census period corresponded to the ten-year average annual national prices for the periods prior to each crop in 1997 and in 2007 (the prices received by the farmer were taken by the Ref. [
34]). In the case of the two forest species, the annual net income corresponded to the annualized equivalent of one full planting-to-harvest rotation.
The modeling approach was conducted in two stages of cropland allocations among various crops at the level of each municipality. First, based on relative net incomes of individual crops within the municipality, land was allocated to four basic activities: forestry, pastures, fruit plantations and annual field crops. These aggregates would roughly correspond to distinct longer-term strategies regarding land and irrigation infrastructure, the scale and organization of the business model, and other hard-to-reverse investments. In the second step, given the allocation to a basic activity, land was then allocated to particular crops. For example, given a first-stage allocation decision for, say, forestry, there was a second-stage allocation between radiata pine and eucalyptus. For the case of annual field crop production, there was an intermediate stage of allocation between rainfed wheat and corn, and irrigated crops.
For the purposes of simulation, we adopted the assumption that farmer decisions are long term in nature, made prior to the realization of a particular climate scenario and based on a known, prior climate state. To be explicit, for the projection of land use in 2040, we used the relative profits of crops as “observed” based on the yield estimates of [
33] for the climate in 2020. While the land allocations might be optimal given the conditions of 2020, due to inertia in adopting new investments and production strategies, they are unlikely to be optimal once the climate state is revealed in 2040. The climate projection for 2040 would determine both the realized profits and quantities of labor demanded in 2040. For both the moderate and severe climate projections for 2040, therefore, the land allocations would not differ, although the yield outcomes would, producing differing profits and employment levels for the two scenarios. For the longer-term projection of land use in 2070, we used the relative profits of crops as “observed” by farmers based on the specific climate projection in 2040. Again, the climate projection for 2070 would determine both the realized profits and employment in 2070. The moderate and severe climate projections for 2070 would, therefore, be contingent on the climate scenario for 2040, and the land allocations would differ.
The econometric estimation of this land-use model was based on a logistic specification of the shares of a given level of agricultural and forestry land in a municipality that were apportioned to the various uses at each stage of allocation. The proportion of land under cultivation in municipality
c allocated to use
i,
, is a function of the relative net incomes of the various crops and other explanatory variables specific to the location,
, and takes the general multinomial logistic form:
where
J represents the set of relevant activities and
represents crop-specific parameters, common across communities. We estimated these parameters via a system of relative shares, using the activity indexed
i = 1 as a reference crop:
Given the estimated parameters,
, one can simulate the relative shares of each species or group of species for a future hypothetical climate scenario,
H, using appropriate relative net incomes,
:
The simulated share of the reference activity is derived from the sum of shares over the number of activities,
K:
In the first allocation step, the index
i takes the four broad activities, annual crops, fruit plantation, forestry and pastures. In the next step, the index
i represents the specific species within each group. Given the total amount of agricultural and forestry land in a municipality,
, the amount of land allocated to species
j within crop group
g,
, is the simple product of shares:
Turning to the explanatory variables,
, in the above share equations, we used data on crop and input prices, yields and input use to calculate the net incomes,
, per hectare for each species from expected gross income less costs (evaluated in terms of real prices based on 2007 Chilean pesos):
where
represents the observable per-unit output price of crop
i,
represents the per-hectare yields of the crop, and
represents a vector of the input prices associated with the vector of the units of inputs,
. The values reported below were based on real price and cost data and the last agricultural census year of 2007 and using the yield estimates of [
33] for the climate in 2020. The initial income calculations were in CLP (Chilean Pesos) for the year 2007 but then converted into USD at the 2007 exchange rate. The net incomes in future scenarios are expressed in 2007 dollars, and the changes to incomes are in real terms. The allocation of land for one species in the community, c, depends on the net income of all the competing crop activities. Within a crop group, the share of rainfed wheat, for example, would depend on its net income in relation to that of irrigated wheat, and irrigated and rainfed corn, potatoes and several other crops. The basic regression equation takes the form:
In the first allocation stage across the four crop groups (annual crops, fruit, forest and pasture), the net income of each group was calculated as a weighted sum of the net income of the specific crops within the group. For example, the net income from annual crops in community c,
, is the sum of the net income of rainfed wheat, weighted by its share in the group’s total net income, plus the net income of corn, weighted by its share, and so on across all the annual crops:
where
represents the net income associated with a specific annual crop (wheat, corn, etc.) and
represents the activity I’s share of total net income generated by all annual crops in community c.
3. Results and Discussion
3.1. Aggregate Cropland Changes under Four Climate-Change Scenarios
There are four scenarios of interest deriving from the Hadley Centre Coupled Model: two moderate climate-change scenarios, one for the year 2040 (B240) and the other for 2070 (B270), and two severe-change scenarios, one for 2040 (A240) and the other for 2070 (A270). The land allocations in 2040 under the moderate and severe scenarios (B240 and A240) will be similar, because land allocations are based on the expected profitabilities of activities for 2040, using the 2020 climate state as the initial base of comparison in farmer decisions, and prior to the realization of the as-yet-unknown future climate state, either moderate or severe. Note that while the land allocations are similar, the net incomes under the two scenarios should differ, because they depend on differing, realized per-hectare yields under the two different climate regimes. The assumption that the land allocations should be similar is supported by noting that investments in production systems are based on future expected conditions and made before the climate state is realized; they are not immediate but require planning and time to mature. Farm system investments—such as land preparation (e.g., grading and leveling and the development of pastures), irrigation systems (particularly important in Chile), fruit orchards, vine plantations, and farmer investments in learning by doing—are often unrecoverable fixed costs (sometimes referred to as asset fixity in agriculture [
27,
28]), creating inertia in land-use changes.
Table 1 shows the projected land use at the national level for the four broad activities and crops under these four scenarios and a baseline that represents the latest detailed land allocations available from the agricultural census. The land devoted to annual crops declines by 7 percent relative to the baseline under the 2040 climate scenarios, from 508,000 hectares to approximately 470,000 hectares. In the 2070 climate scenarios, the land of annual crops declines relative to the baseline by less than one percent in the severe scenario but
increases slightly by over 4 percent in the moderate. Fruit plantations also decline by 7 percent in the 2040 scenarios but
increase by 6 percent in 2070 under the severe scenario and by 14 percent under the moderate. These increases are due to alterations in the geographic distribution of crop activities in response to the projected yield impacts of climate changes. As will be presented in more detail below, in terms of specific activities, table grapes—the most important Chilean export crop—show significant losses of land under all the scenarios, but, by contrast, avocado plantations are projected to expand geographically under all the scenarios.
The results show that pastures and forage lands as a whole decline across all the scenarios. In percentage terms, these changes are relatively minor at the national level, although in absolute terms, they are far higher than the changes in annual crops and fruits. The decline in pastures (and their related activities such as dairy) is due to the decrease in natural grassland area, while managed (improved) pastures are projected to increase. Forestry land is expected to increase by approximately 2 to 3 percent under all the climate-change scenarios. In the near term, forestry land in 2040 is projected to increase by nearly 83,000 hectares (3 percent) over the baseline. This increase is driven by an increase in the area devoted to eucalyptus that more than offsets a decline in area planted with radiata pine.
Comparing sectoral developments, one can see that in the nearer term, the annual crops and fruits show a decline in land area, while pastures and forage and forest plantations increase in land area. In the longer term, by 2070, there is a recuperation in land planted with field crops and fruits, although the areas planted remain lower than at the baseline. The surface of pastures and forage by 2070 falls below the baseline. The forestry sector will become increasingly important.
The net income for each activity and climate-change scenario is presented in
Table 2. Note that for the case of pastures, the net incomes include the activities dependent on pasture, such as dairy and cattle. Because the yields will differ under the differing scenarios, in 2040, profits will also differ depending on the scenario, moderate or severe. In the aggregate, the forestry and agriculture sectors will suffer losses in net income in both the shorter and longer terms in the severe climate-change scenarios (A240 and A270). Net revenues will decrease by 5 percent in 2040 from the baseline, a result significantly larger than that obtained by [
29]. By 2070, the loss reaches 14 percent relative to the baseline. More optimistically, in the more moderate climate-change scenario (B240 and B270), there is, in terms of real prices, a slight
increase in income over the baseline.
When analyzing the results by category, one observes that the crops and forestry revenues increase in all the scenarios, because there is expected, in general, a relative shift toward these crops as a way to mitigate the negative impacts on other crops. The same behavior occurs in pastures and forage in the shorter term in the severe-change scenario (A240) but reversing in the longer term (A270). Notably, the profits generated in the fruit category are the most affected by the climate-change scenarios. In the longer term, under the severe-change scenario (A270), the net revenues from all fruit are expected to decline by 76 percent, while the moderate-change scenario will produce a decline of 31 percent. The income deriving from the fruit crop category is so notably impacted because the productivity in the sector is more sensitive to climate conditions plus the effect of water stress, and due to farmers shifting to less negatively impacted activities.
3.2. Aggregate Farm Labor Demand Changes under Four Scenarios
Table 3 shows the total quantity of agricultural labor demanded across all the municipalities by major agricultural activity under the four climate scenarios considered. Given the widespread use of seasonal and part-time employment in agriculture, the quantity of labor demanded was translated into year-employment equivalents; that is, total labor utilized was converted into an equivalent count of full-time workers employed during a year and working a 44 h week. Note that the quantity of labor demanded depends on per-hectare technical requirements that are also sensitive to yields. In the case of pasture activities, the labor requirements were based on all the farm activities linked to pastures, such as dairy and cattle production. As seen in
Table 3, the results show that, in the aggregate, the number of employee-years decreased in all the climate-change scenarios. The most notable decline in the quantity of labor demanded—18 percent—is in the case of the severe scenario for 2070 (A270). Notably, however, the labor demand associated with field crops remains stable across the climate scenarios and, in fact, increases slightly in both the moderate and severe scenarios in 2070 (B270 and A270) by about 1 percent in comparison with the baseline. This increase is primarily due to increased relative field crop productivity, which leads to, in the aggregate, a switching of land allocations to field crops, which then implies a higher total quantity of labor demanded by producers in this activity. By contrast, the quantity of labor demanded by fruit producers
decreases under all the climate scenarios, again because of farm reallocations of land from fruits to other less-labor-intensive activities due to the overall climate-related productivity declines of fruit relative to other crops (in part due to fruit being more sensitive to water restrictions). There is also a decrease in the total labor use associated with the pasture–forage activity across all the climate-change scenarios. In the case of the forestry sector, the quantity of labor demanded will increase, due to the overall expansion of this activity as land shifts from other crops, in particular pastures.
3.3. A Closer Look at the Impacts on Three Specific Crops
To examine in more detail the geographic diversity of the impacts of climate change, this section presents in greater detail the impacts on three important crops: (1) rainfed, dry-land wheat, which is the traditional crop of many small-scale, low-income farmers; (2) table grapes, an almost iconic Chilean export fruit crop (sufficiently important as an income generator to be explicitly included as a line item in national accounts); and (3) avocados, another high-valued export crop, which has shown, in recent years, large-scale expansion in many municipalities. We present the results for ten “regions”, which are political zones corresponding to between 15,000 and 75,000 square kilometers (As a reference for the reader more familiar with North America, Massachusetts has a land area of 27,363 km2. We excluded three regions in the extreme arid north and two in the extreme south. Note that we used data based on pre-2015 regional definitions; recently, the government has created a new region from the northern third of the Bio-Bio region.). One advantage of using Chilean regions is that they are stacked vertically from the arid north to the cooler, rainfed south, along the length of the narrow country, making a comparison of their climates intuitively easier and allowing a straightforward comparison to the west coast of North America, from south to north, with similar climate and crop patterns.
Wheat is grown predominantly in the central part of Chile, where the land and climate conditions, importantly, rainfall levels, tend to make the crop relatively more profitable. To the north, the arid conditions and soils are less suitable for the profitability of extensive field crops, and to the south, the terrain and climate favor pastures and forestry.
Table 4 reports the areas under rainfed wheat by climate-change scenario and region.
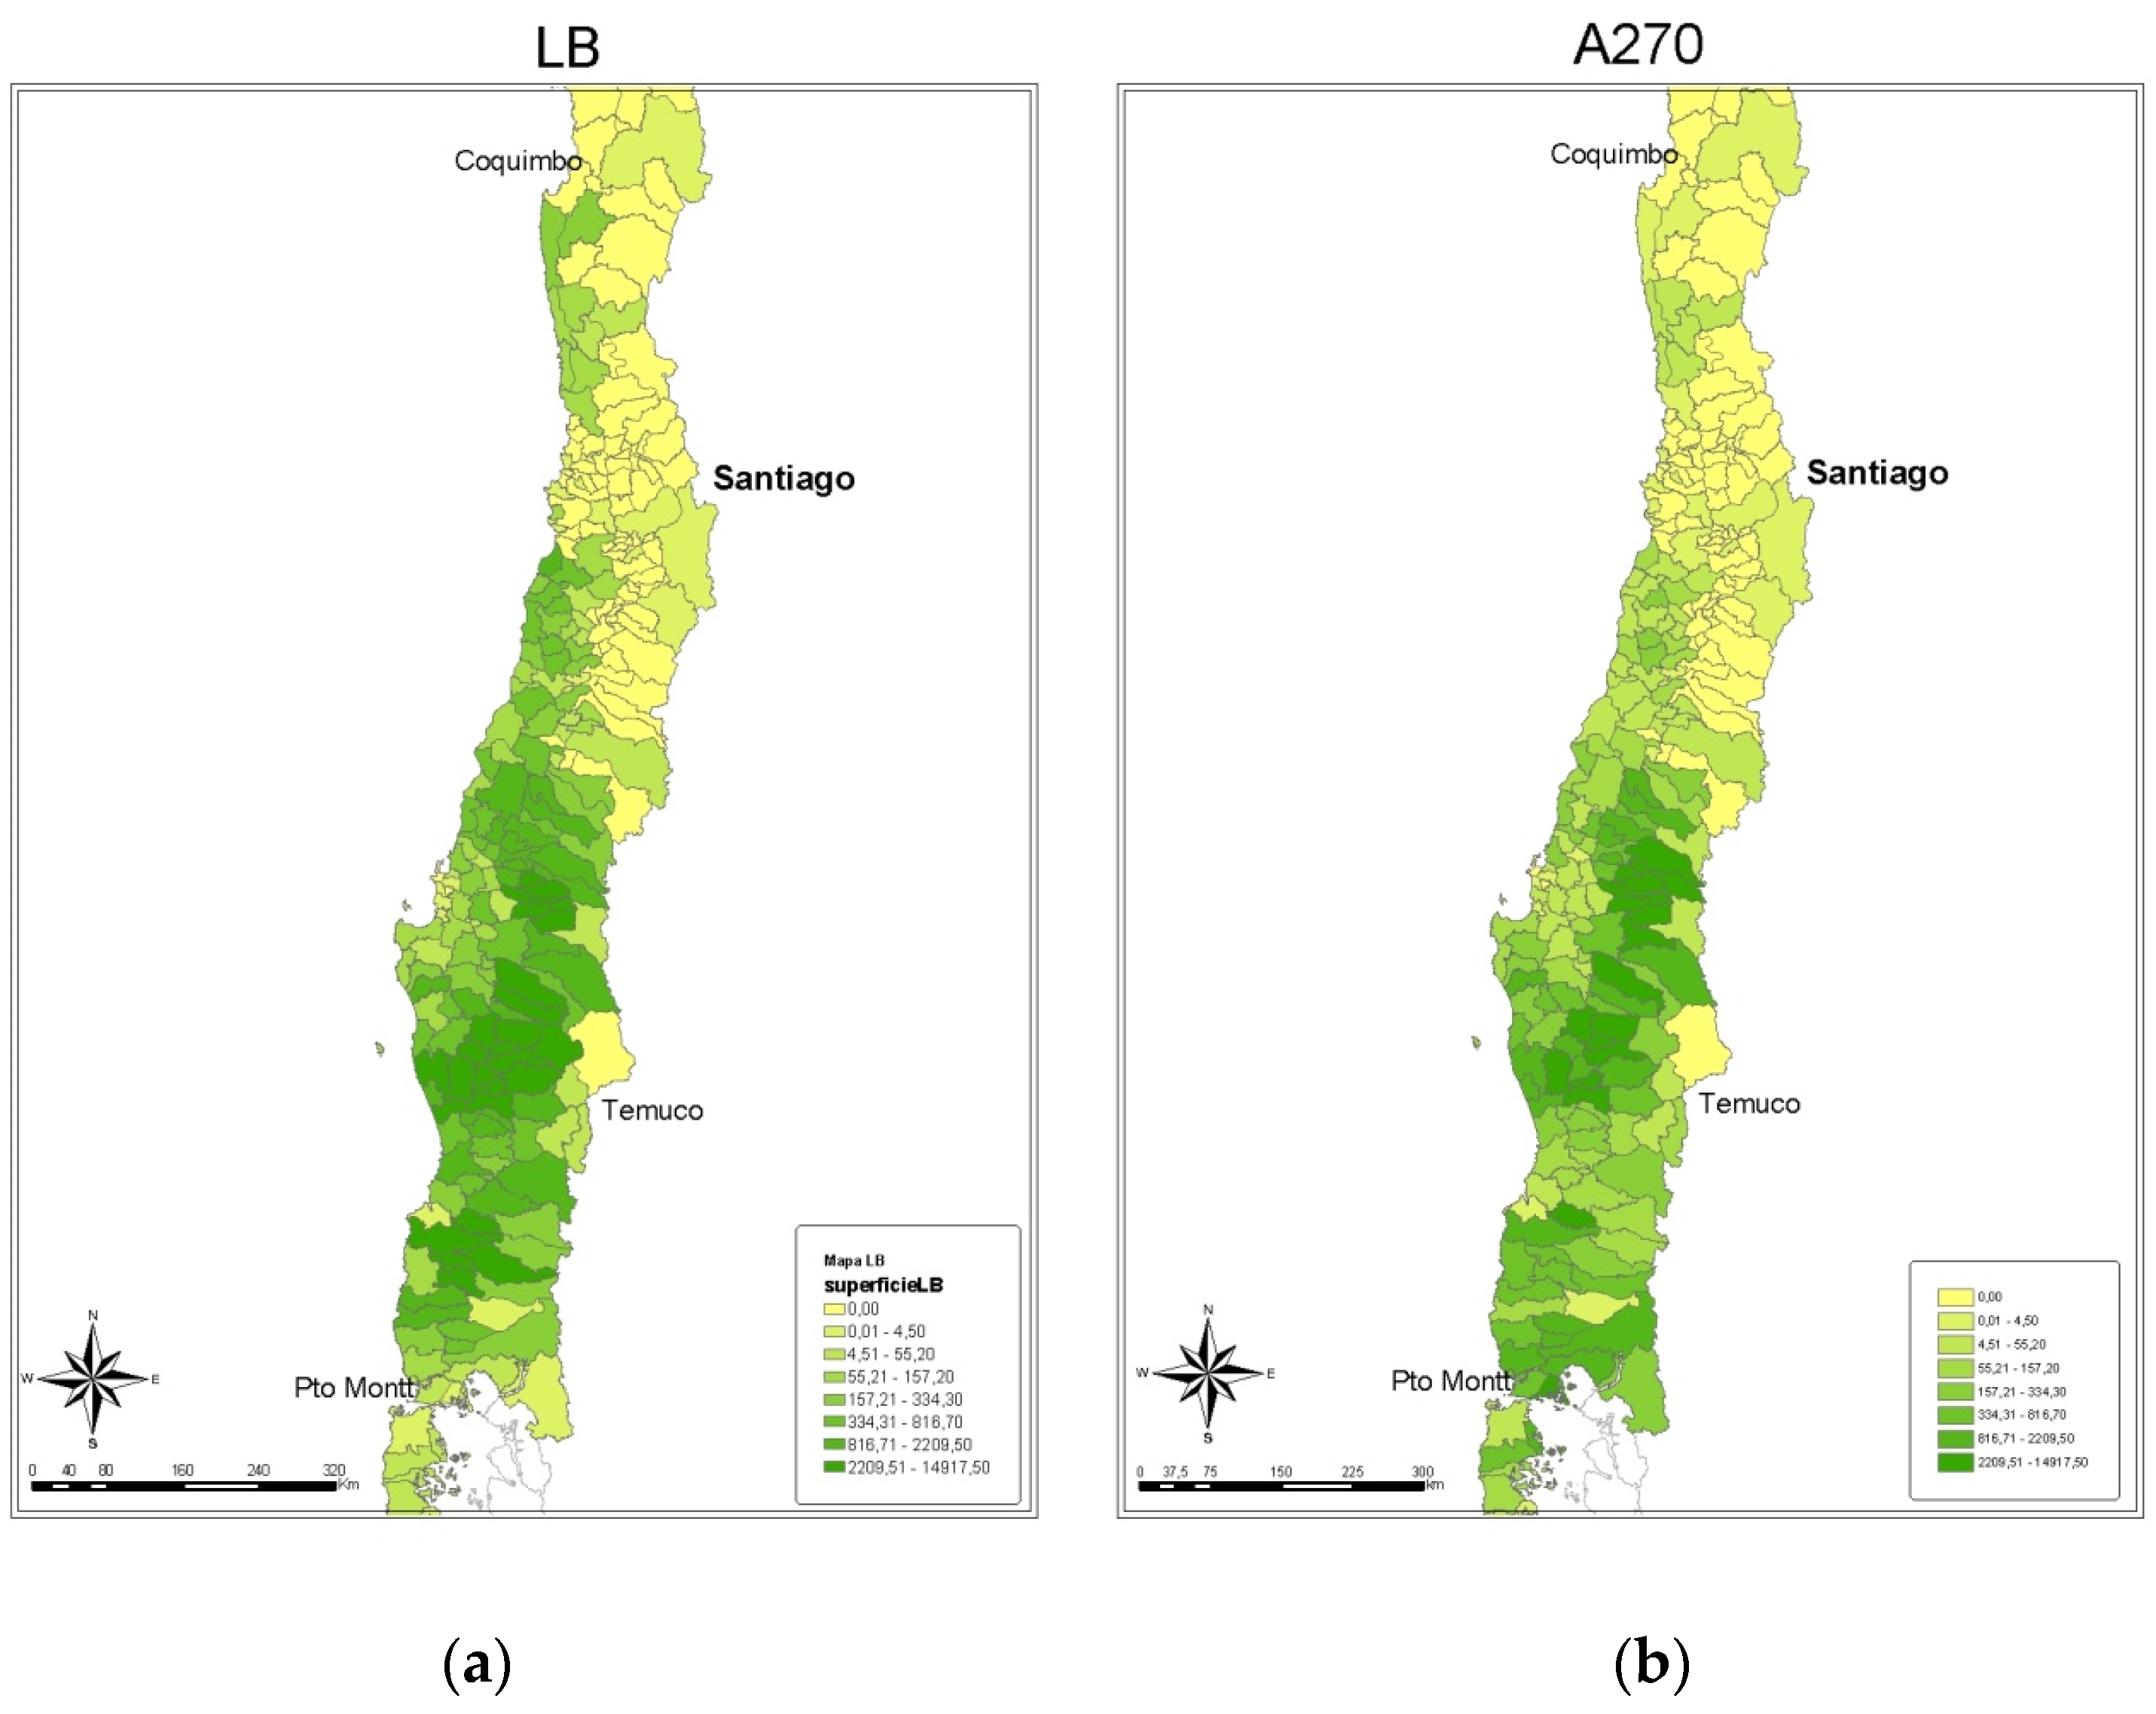
Figure 1 represents these changes at the municipality level and clearly illustrates the projected southward shift in climate conditions in terms of the proportion of land dedicated to wheat from the baseline levels (LB) in census year 2007 and 2070 under the most severe climate-change scenario (A270).
One observes that the surface area declines in total for all the climate-change scenarios, with decreases ranging from 31 percent for the two scenarios for 2040 (A240 and B240) to 17 percent for the moderate scenario in 2070 (B270). In the northern regions (Coquimbo, Valparaiso, Metropolitana, O’Higgins and Maule), where water is comparatively scarcer and field crops less profitable, as the arid zones shift southward, there are relatively large proportional decreases in land under the crop from a small base under all the climate scenarios. This is particularly the case in the severe climate-change scenario in 2070 (A270), where some decreases in wheat land reach over 90 percent (see, also,
Figure 1). In the regions where wheat is currently concentrated (Bío Bío, La Araucanía and Los Ríos), the largest declines in land use are observed in the shorter run by 2040, but there is, later, a partial recuperation of wheat area by 2070. To underline the southward shift of climate, note that the southernmost region considered here (Los Lagos) shows an increase in land with rainfed wheat by 2070, increasing by over 40 percent under the most severe climate-change scenario and more than doubling in the case of the moderate scenario.
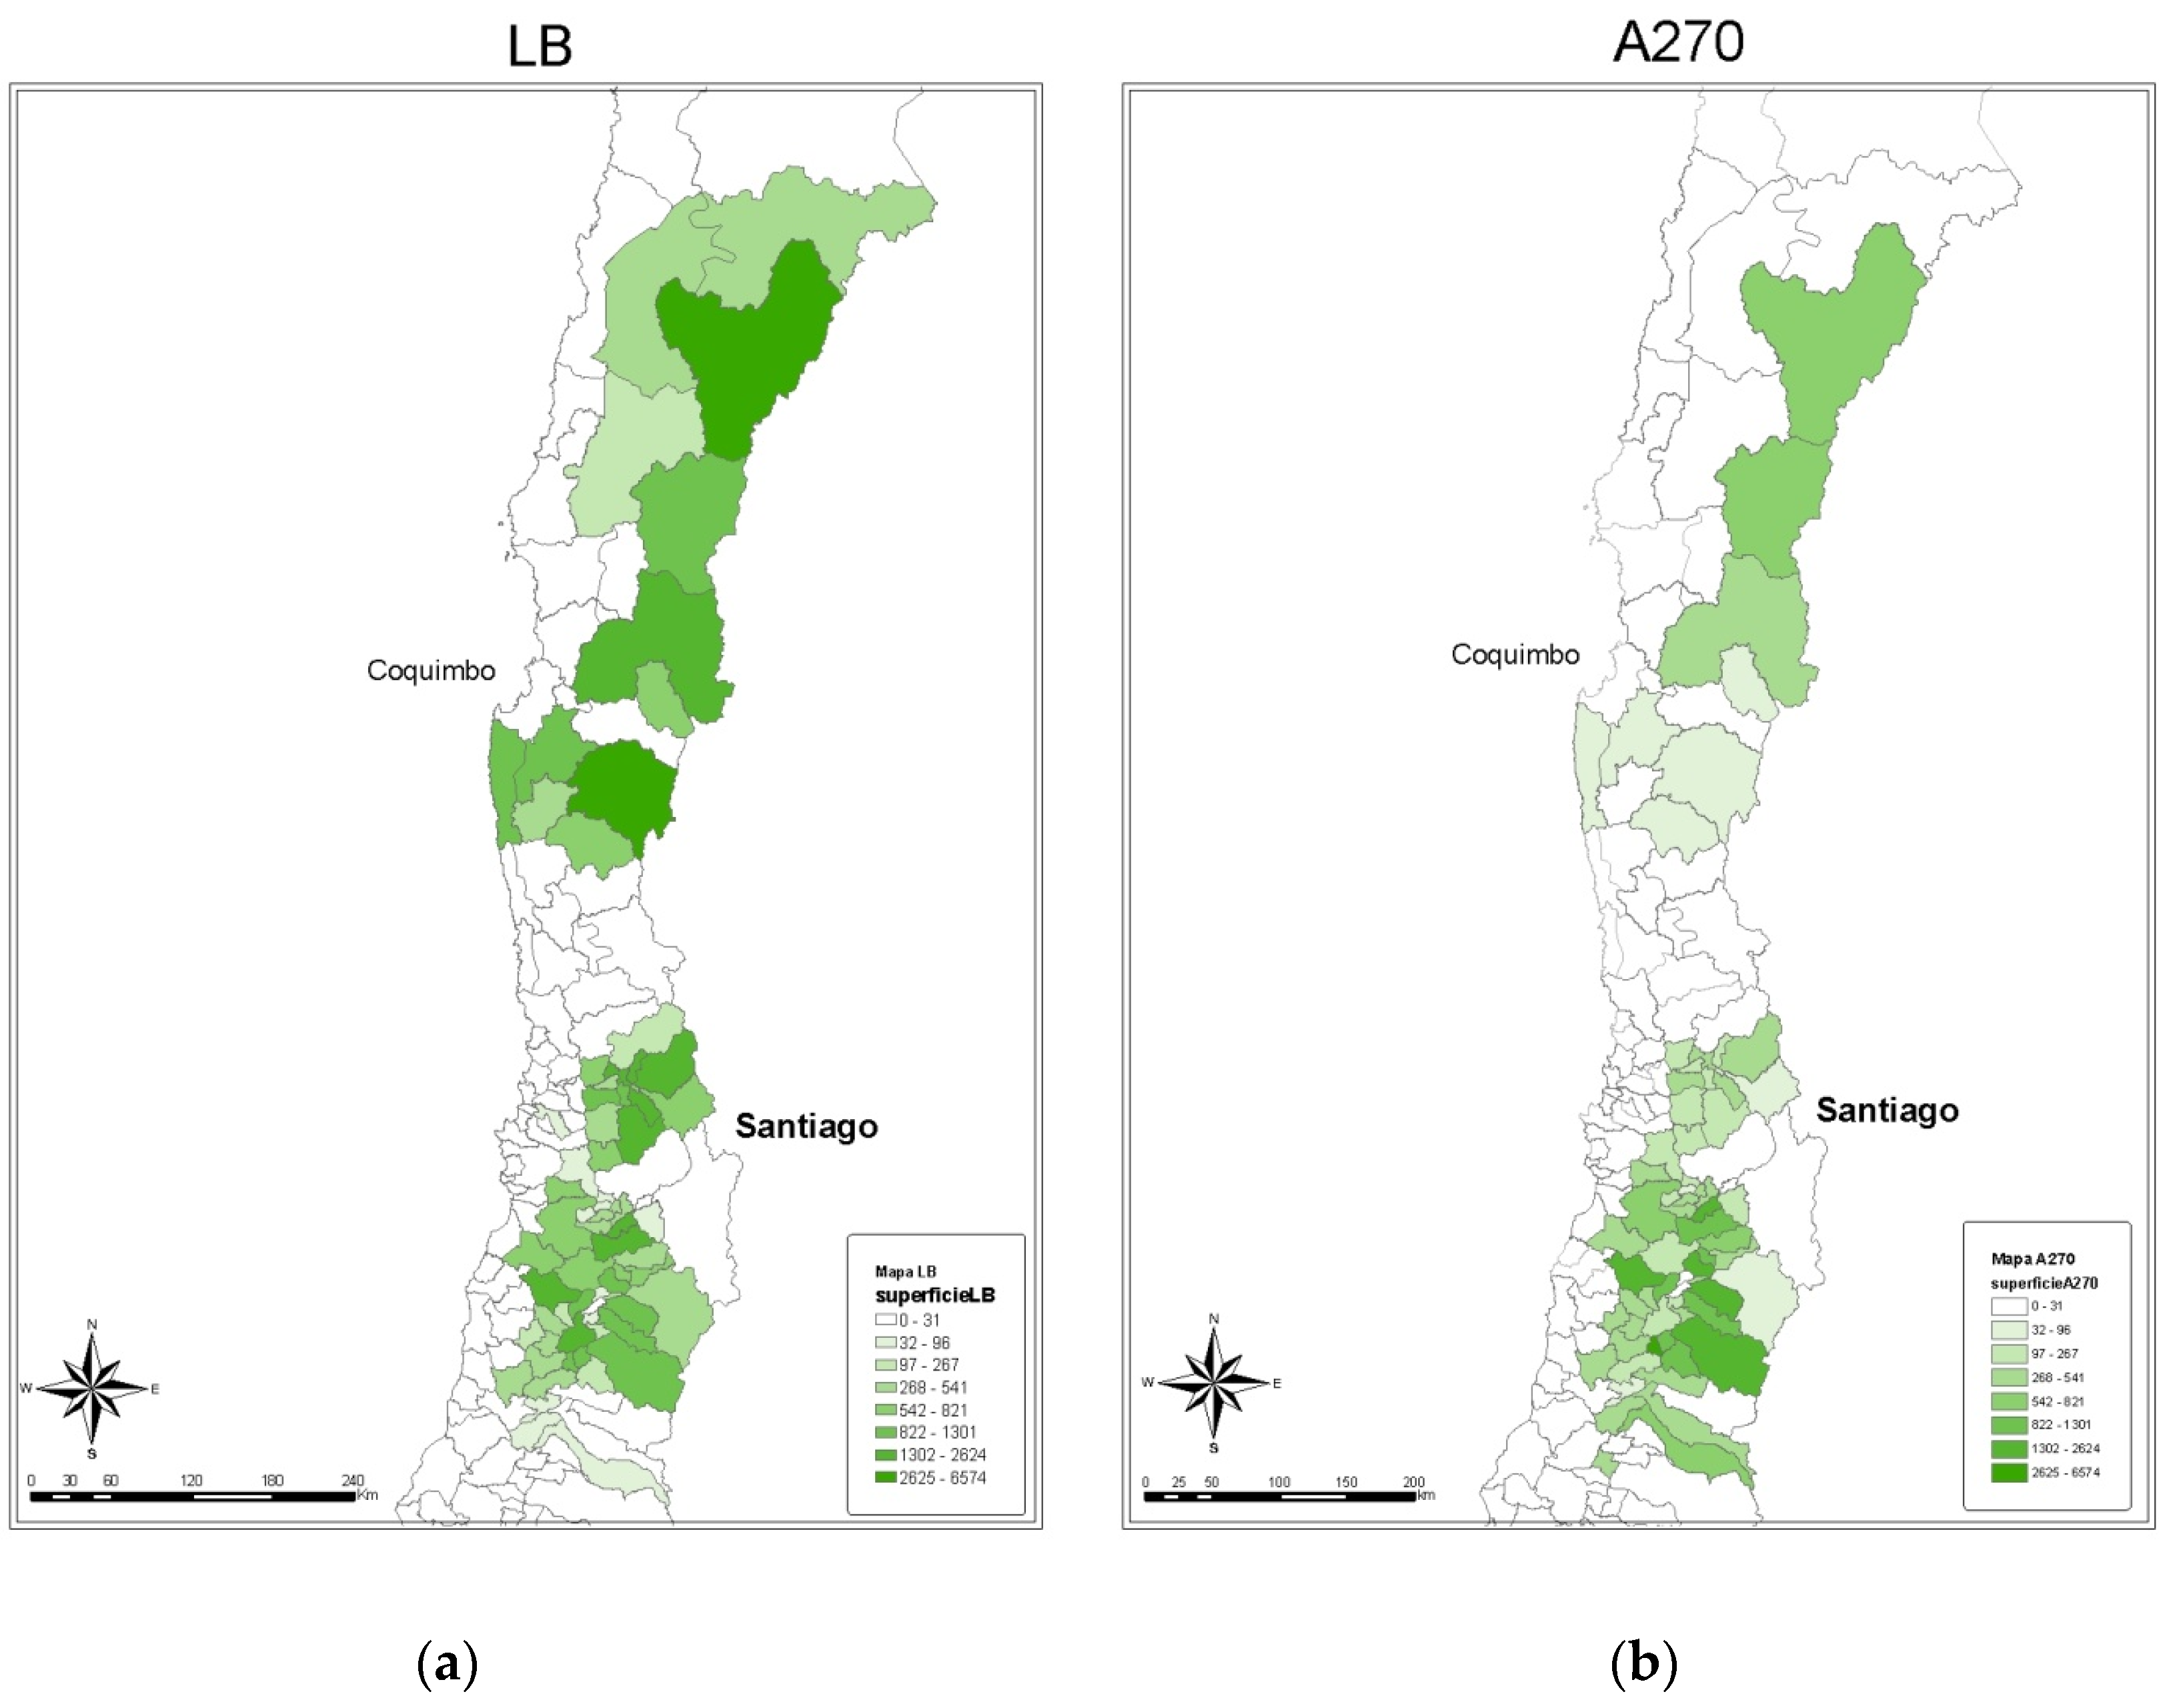
In the case of table grapes, a high-valued, export-oriented crop that requires relatively intensive labor and water use, climate change is expected to have important impacts. The land area with table grapes is projected to decline in the order of 21 and 47 percent, depending on the severity of the climate-change scenario (see
Table 5). As
Figure 2 illustrates, using municipality-level results and comparing the patterns of land planted at the baseline and in the severe climate-change scenarios, there would be a significant geographic shift in table grape activity. Although accompanied by a reduction in the total area, this geographic shift in area planted with table grapes reflects a mitigation and substitution effect as landowners in the more arid north, the traditional grape-growing zone, shift to alternative crops, especially those crops less affected by the increasing scarcity of water in the northern geographic zones. As in the case of wheat, table grapes move from the deteriorating climate-growing conditions in the northern zones toward the south, where the agroclimatic conditions for grapes, at least in relative terms, would improve.
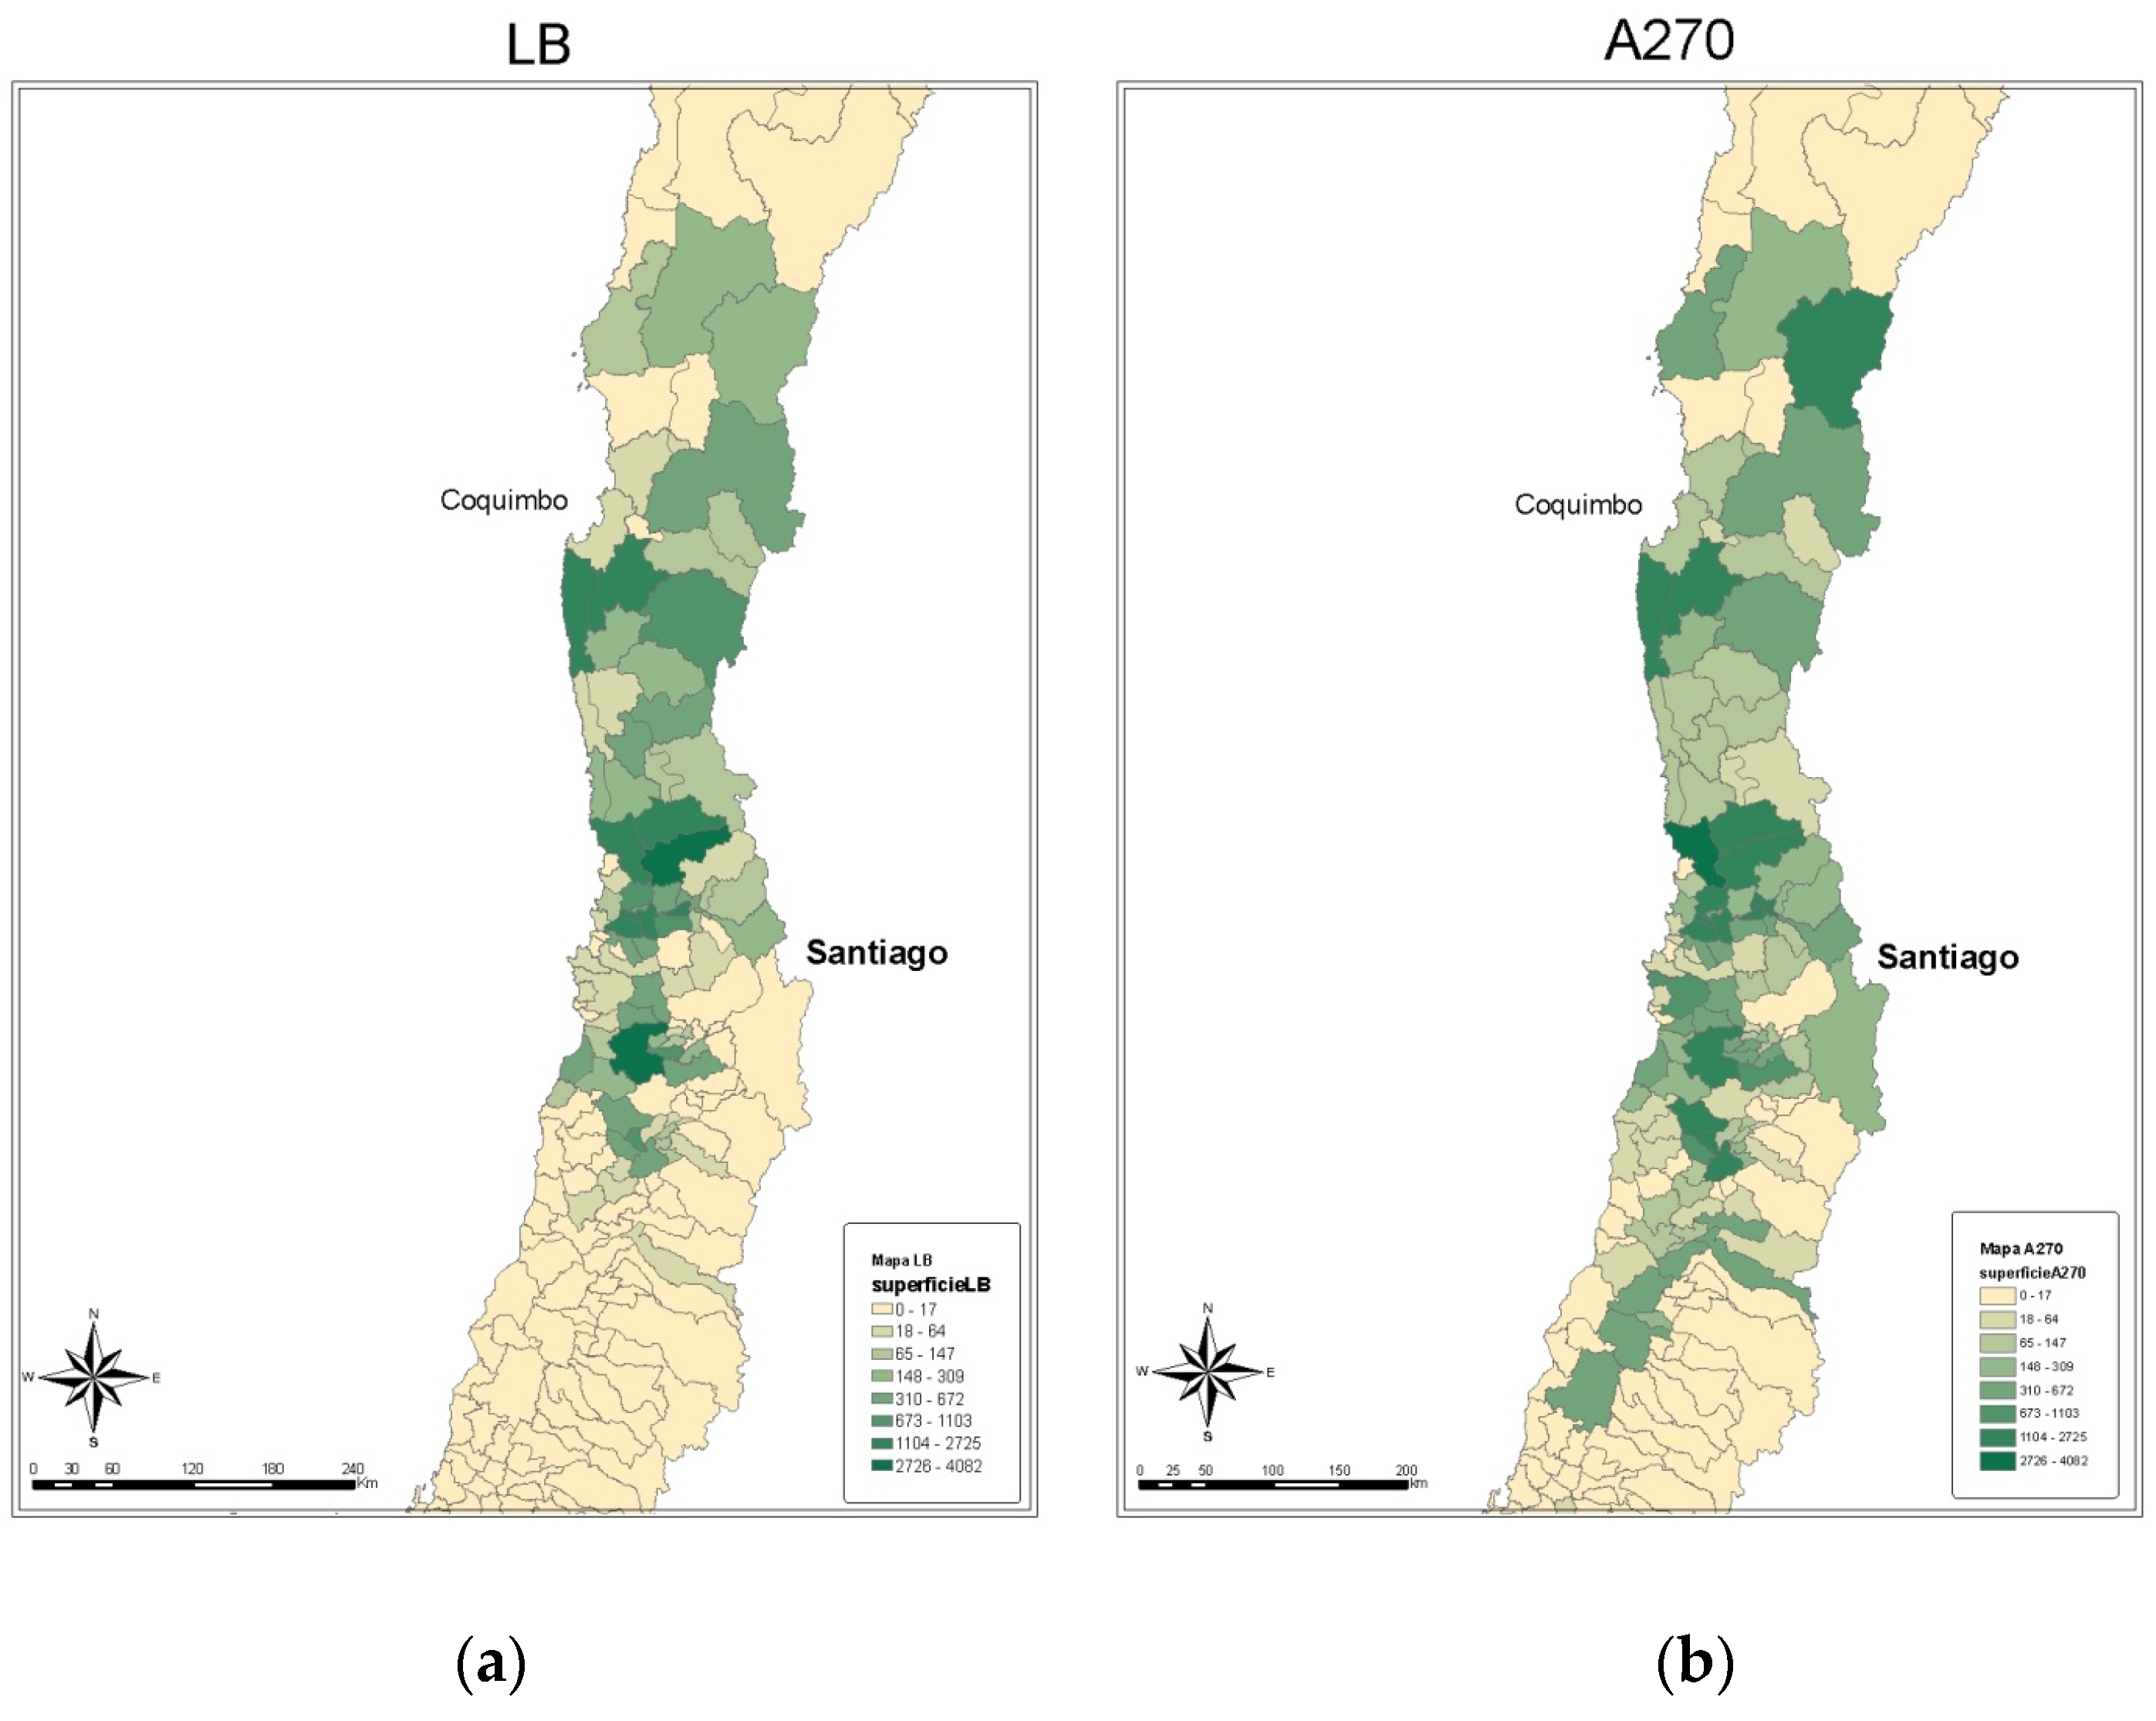
The likely effects on the cultivation of avocados of potential climate changes present a case in interesting contrast to the effects on land use dedicated to wheat and table grapes. Due to the combined effects of the direct influence of climate change on avocado yields at the municipal level and of the mitigation/substitution actions of farmers responding to changes in the relative profitability of crops, the total, national area planted with avocados increases in all the climate-change scenarios (see
Table 6). From the baseline, the observed hectares planted with avocados concentrated in the central zone of the country expand both northward and southward (see
Figure 3).
In the shorter term, by the year 2040, the increase in land dedicated to avocados amounts to 7 percent relative to the baseline. In the longer term, by the year 2070, the avocado land area planted increases from almost 40,000 hectares at the baseline to almost 50,000 hectares in the most severe climate-change scenario. Under a moderate climate-change scenario, longer-term avocado plantings expand even more, to 56,000 hectares. This overall and geographically extensive increase in the plantations of avocado demonstrates the offsetting or mitigating effects of adaptation and land-use substitution on general farmer and worker welfare as measured by the levels of profits and employment.
An important finding of this study is that, for Chile, in general, the impact of anticipated climate change on the total land use for the broad categories of activities is relatively small. The basic reasons for this comparatively minor change in total farmland and forestry plantations are two. First, decision-makers adapt to changing climate conditions by adjusting their portfolios of activities within each locality. Second, given the north–south orientation of Chile, there is a shift in agroclimatic zones, which, while altering local crop patterns, nevertheless tends to preserve, in part, the overall composition of production. In the case of specific crops, and more so for specific localities, the changes are more noteworthy. Water availability, especially in the form of irrigation, varies from the arid north to the rainfed south and is one of the important determinants of projected yield changes that drive the profitability of land allocations. The total land use for field crops declines slightly in the most severe change scenario over the course of approximately sixty years. Over the same horizon, the land with field crops would increase by over four percent in the moderate climate-change scenario. For the southern, temperate regions, which are currently cooler and with a greater emphasis on rainfed pastures and grains, the results show the largest increases in land devoted to field crops under the moderate- and severe-change scenarios. The more arid region to the north, particularly around the capital city of Santiago, experiences notable reductions, especially in the land devoted to field crops.
More importantly with respect to employment, the most significant increase in land is in plantation forestry, less intensive in labor use. The land devoted to fruits, such as table and wine grapes, iconic Chilean export crops, declines slightly under the most severe scenario, due to the deterioration in the growing conditions of the northern zones presently most apt for this activity. Under the moderate-change scenario, however, the land area devoted to fruit increases by slightly over 5 percent, because the principal region where fruits are presently grown is not impacted severely, and, in fact, other, southern zones become more apt for fruit production. In terms of total agricultural net-income generation for producers, the severe climate-change scenario would lead to slight declines, but the moderate climate-change scenario would increase income. These results underline the importance for welfare considerations of farmer adaptability and the mitigation effects of land-use responses. Nevertheless, the total labor demand falls due to the change in the composition of production toward less labor-intensive crops.
Few studies have attempted to estimate the economic effects of climate change on Chilean agriculture. Most of the previous studies have done so in the context of larger, multi-country, regional models [
21,
34]; other analyses have focused on specific geographical areas within the country [
19,
20,
35], making any comparison between results difficult even without taking into account other methodological approaches and differences in data sources. Two studies are somewhat comparable to the present analysis. Using a sample of individual farmers, Gonzalez et al. [
36] estimated a Ricardian model of self-reported land values as a function of weather variables and farmer characteristics. Without incorporating any climate-model-based projections, their results are limited to simulating discrete temperature and precipitation changes. For example, they estimated that a 2.5 °C increase in mean temperature and a 10 percent decrease in precipitation would increase land values by 40 percent for medium and large farmers and have almost no effect for small farmers (The González et al. results are based on a geographically heterogenous cross-section variation of current climate data that are correlated with existing land values. Currently, warmer, drier zones in Chile are associated with fruits and wines and with higher net incomes and, consequently, higher land values.). Ponce et al. [
29] used similar data for climate and yields as in the present analysis, but did not consider potential reductions in irrigation. Their modeling efforts were based on a programming approach, relying on parameter calibration to a specific date rather than an econometric estimation using observable relative profits and land uses. Using an optimization algorithm for land allocations, [
29] found an overall reduction of 2.7 percent in net income at the national level under the severe A2 climate scenario for 2040, with most of the income reduction happening in the northern regions. This is in contrast to the larger net-income loss estimate in the present study of 5 percent.
4. Conclusions
An overall conclusion from the impact projections discussed above is that the aggregate impacts of anticipated climate change on Chilean agriculture activities will likely be relatively small. These comparatively minor changes in total farmland and forestry plantations are due to the flexibility, at least in the longer term, of farmers and landowners to adapt to changing climate conditions by adjusting their portfolios of activities. More peculiarly to Chile, perhaps, climate changes are projected to shift agroclimatic zones in a way that moves southward the climate conditions beneficial for activities currently more concentrated in the north. This north–south shift will alter local crop patterns but will tend to preserve, in part, the overall composition of production. In terms of farmer welfare, the ability to mitigate the negative effects of climate change (and, perhaps, to take advantage in some geographic areas) leads to only moderate negative impacts on net-income generation. Our results highlight the importance of farmer adaptability and the mitigation effects of land-use responses for overall welfare in the rural sector.
In the case of Chile, the total impacts on agriculture of climate change at the national level appear to be moderate in terms of aggregate changes to the allocations of land and farmer net revenues. There are significant changes at the regional, subnational level, but given the north–south diversity of agroclimatic zones and the ability of farmers to switch activities in the longer run, the overall impacts are small. We should note, however, that our simulation results cannot reflect the full range of possible changes at the level of communities and individual farmer households. While farmer responses in some geographic areas will offset, to some degree, in the aggregate, the losses that occur in other areas, policymakers should keep in mind that these spatial redistributions would have important local welfare consequences, especially if the adaptive capacity is uneven between different types of farmers and workers. In this sense, to properly assess the impact of climate change on agriculture, future analysis should examine in more detail how the different strata of the population linked to the agricultural sector will be affected by climate change [
20]. Additionally, future research could further develop this model to explore the implication of using the nexus between land, water use, and food security for policy recommendations [
37,
38,
39].
The results presented in this paper are based on the information regarding crop production available today. Based on our projections, we can say that climate change will likely bring some losses to various communities linked to agriculture in Chile, but we cannot rule out that it may also lead to opportunities that we are unable to anticipate given the current data. Although it is well beyond our present modeling effort, which took the relative prices of crops as a given, it is also possible, and in fact likely, that climate change will induce changes in agricultural production in other regions of the world. Such larger-scale changes would create a new set of comparative advantages for individual countries and regions at a subnational level, leading to an entirely different set of product prices for farmers. Taking advantage of new opportunities in favored sectors and agroclimatic zones will require investments appropriate to local climates. However, it is likely there will be sectors and zones where policymakers would have to consider the introduction of means to mitigate not only the anticipated adverse effects of climate change, as addressed in this present paper, but also unanticipated effects in changing international markets.
For the purposes of simulation, we adopted the assumption that farmer decisions are long term in nature, made prior to the realization of a particular climate scenario and based on a known, prior climate state. Future work should address this decision model to allow a more dynamic process of climate adaptation. When available, cost data from farm surveys should be preferred to activity budgets. As is the case for all long-term simulation models, the land-use projection model presented here is limited by the ceteris paribus nature of the analysis. All possible future changes cannot be anticipated. International prices will change, technologies will change, trade agreements will come and go, and other natural and political shocks will undoubtedly influence relative profitabilities. Moreover, it is unlikely that the climate projections, on which our relative net incomes are based, will be either of the two hypothetical regimes defined by climate experts and used here. In addition, future work should also attempt to incorporate a political–economic model of possible land policy changes to explore the extent to which agricultural and forest land use might change as a result of farmland protection programs and land conversion projects undertaken as part of local land-use planning policy.


