Article

Quantifying the Northward Spread of Ticks (Ixodida) as Climate Warms in Northern Russia

by
Leonid N. Vladimirov
1,
Grigory N. Machakhtyrov
1,
Varvara A. Machakhtyrova
1,
Albertus S. Louw
2,
Netrananda Sahu
3,
Ali P. Yunus
4 and
Ram Avtar
2,5,*
1
Yakut Scientific Research Institute of Agriculture, Yakutsk 677001, Russia
2
Graduate School of Environmental Science, Hokkaido University, Sapporo 060-0810, Japan
3
Department of Geography, Delhi School of Economics, University of Delhi, Delhi 110007, India
4
Center for Climate Change Adaptation, National Institute for Environmental Studies, Tsukuba 305-8506, Japan
5
Faculty of Environmental Earth Science, Hokkaido University, Sapporo 060-0810, Japan
*
Author to whom correspondence should be addressed.
Atmosphere 2021, 12(2), 233; https://doi.org/10.3390/atmos12020233
Submission received: 3 December 2020 / Revised: 1 February 2021 / Accepted: 4 February 2021 / Published: 8 February 2021
(This article belongs to the Section Climatology)

Abstract

:
Climate change is affecting human health worldwide. In particular, changes to local and global climate parameters influence vector and water-borne diseases like malaria, dengue fever, and tick-borne encephalitis. The Republic of Sakha in northern Russia is no exception. Long-term trends of increasing annual temperatures and thawing permafrost have corresponded with the northward range expansion of tick-species in the Republic. Indigenous communities living in these remote areas may be severely affected by human and livestock diseases introduced by disease vectors like ticks. To better understand the risk of vector-borne diseases in Sakha, we aimed to describe the increase and spatial spread of tick-bite cases in the Republic. Between 2000 and 2018, the frequency of tick bite cases increased 40-fold. At the start of the period, only isolated cases were reported in southern districts, but by 2018, tick bites had been reported in 21 districts in the Republic. This trend coincides with a noticeable increase in the average annual temperature in the region since the 2000s by an average of 1 °C. Maps illustrate the northward spread of tick-bite cases. A negative binomial regression model was used to correlate the increase in cases with a number of climate parameters. Tick bite case frequency per district was significantly explained by average annual temperature, average temperature in the coldest month of the year, the observation year, as well as Selyaninov’s hydrothermal coefficient. These findings contribute to the growing literature that describe the relationship between tick abundance and spread in Northern Latitudes and changes in temperatures and moisture. Future studies might use these and similar results to map and identify areas at risk of infestation by ticks, as climates continue to change in Sakha.

1. Introduction

The Arctic and neighboring northern regions are among the areas where climate change and its effects are predicted and have been felt most strongly [1,2]. These dramatic changes have sparked concern about the possible impacts of climate change on the economies, public health, and traditional way of life in the cold northern regions [3,4]. In response, a number of studies were conducted to identify and address the issues faced by northern communities [5]. From these, it became apparent that traditional communities in the cold north were among the most vulnerable to the effects of changing climate. There is a need for research to quantify and predict the effects that changing climate will have on different components of society in these areas [5]. In particular, the effect of changing climatic conditions on the spread of vector-borne diseases among northern communities [6].
The Republic of Sakha (or, Yakutia) in far north-eastern Russia is one of the regions where society is vulnerable to the effects of climate change [4,6]. Sakha is characterized by a severely cold climate and low population density, with 40% of the Republic lying above the Arctic Circle. Permafrost covers about 60% of the territory of central and 70% of north-eastern Sakha [7]. The area is inhabited mainly by indigenous communities whose livelihoods are still traditional farming—breeding of reindeer, native cattle, and horses, as well as hunting, fishing, and gathering of berries and herbs [8]. Climate change in Sakha has included rising annual air temperatures of between 0.3 °C and 0.6 °C per decade since 1966, with higher temperatures, especially during winter. Rainfall has also, on average, increased in this time period [9]. The consequences of these changes include melting of permafrost [10,11,12], increased flooding [4], and a northward shift in the distribution of taiga and temperate forest ecosystems [13]. Communities living in these areas, whose way of life depends closely on nature, are among the most directly affected by the changing conditions [5,6].
The changes in temperature, rainfall, and permafrost boundaries are allowing the northward range expansion of numerous species, including those that are disease vectors. These are, for example, mosquitoes, ticks, rats, and pathogenic microorganisms that survive in the warming habitat. Recently, the range of the tick species Ixodus ricinus has been moving northward and toward higher altitudes in Sweden, Norway, and Germany in response to milder winters [14], and their presence was also reported in Iceland [15]. In the Arctic, the presence of ticks on seabirds was observed to be directly linked to Arctic winter temperatures [16]. In the United States of America (USA) and Canada, the tick species Ixodes scapularis and Ixodes pacificus have been moving northward [17]. This is considered the reason for increases in the geographic extent of Lyme disease in those areas. In Europe, the recent increases in Lyme disease, tick-borne encephalitis, and other tick-borne infections have been linked to the warming climate and expanding tick ranges [14,18]. However, the interplay between climate change and the prevalence of vector-borne diseases are difficult to accurately establish since diseases are also influenced by multiple non-climatic factors like the state of public health care, economic conditions, etc. [14]. For example, Sumilo et al. [19] observed that large variability in the spread of tick-borne encephalitis in the Baltics could not be explained only by climate warming trends. Complex factors could influence the upsurge of vector-borne disease. For example, changes in recreational culture might increase people’s exposure to ticks, and could lead to increased tick bite cases irrespective of changes to tick abundance. Increased public awareness about climate change issues and the recently associated risks of tick-borne diseases in northern latitudes might also inflate the number of people that will report tick bites.
The influence of meteorological variables on the life-cycle of ticks is well described. The abundance and host-seeking behavior of Ixodida tick species are largely influenced by temperature and humidity [17,20]. The abundance of adult taiga ticks (Ixodes persulcatus) in the area of St Petersburg has best been explained by annual sum of temperatures above 5 °C, annual sum of daily precipitation above 5 mm, and Selyaninov’s hydrothermal coefficient (HTC) [21]. Selyaninov’s HTC is an indicator of the provision of moisture through precipitation during the temperate months of the year [22]. Temperature and moisture during the summer season, when ticks are more active, are known to influence the developmental rates and host-seeking activity of ticks. Harsh freezing conditions in winter are considered to constrain the distribution of ticks, since nymphs and larvae die when exposed to low temperatures for extended periods of time. However, minimum temperature thresholds vary between tick life-stages and species. Temperature also influences the length of the developmental cycle, which can range from two years in temperate regions up to seven years in cold habitats [17,20]. Moreover, the host-seeking behavior of adult ticks is inhibited by low temperature, when ticks go into diapause [17]. The above-mentioned relationship between temperatures and tick activity can explain the recently observed northward spread of ticks in various regions, as cold climates become more temperate.
Changing tick distributions, increased cases of tick bites, and tick-borne diseases observed in other northern regions should be a cause of concern for communities in Sakha since climate trends here are similar to the other affected regions. In Siberia, the majority of reported tick bites are from Taiga ticks (Ixodes persulcatus), but cases from other species like Dermacentor nutalli are reported [23]. About 25% of I. persulcutus collected in this region were infected by pathogens, including B. burgdorferi (the cause of Lyme disease), TBEV, and A. phagocytophylum, which causes anaplasmosis in livestock [23]. The presence of new disease vectors can expose communities and their native livestock to novel pathogens against which they have no resistance and for which counter-measures are not yet in place. New tick-borne diseases might be a threat to traditional reindeer and cattle husbandry—an important economic activity among communities in rural Yakutia [6,8].
In light of the mentioned points, this study aimed to quantify recent changes in the frequency and distribution of human tick-bite cases in Sakha. We correlate the annual tick-bite frequency per district (Administrative level 2) with meteorological variables of temperature and precipitation that have previously been identified to influence tick abundance. Quantifying which variables are contributing to the spread and increase of tick bite cases might contribute to understanding future tick-bite risks in different parts of the Republic, as the climate continues to change. Quantitative results can assist various stakeholders, including public health and agricultural entities, to adopt appropriate strategies to deal with emerging disease-related challenges. Finally, the large study area and long study period offers insight into the spread of Ixodida ticks in relation to climate changes at a regional scale [24].

2. Data and Methods

2.1. Study Area

The Republic of Sakha, also known as Yakutia (Figure 1) is considered one of the coldest populated regions of the world, with very low temperatures in winter reaching −50 °C and lower. The towns Oymyakon and Verkhoyansk (Figure 1) are the coldest inhabited places on earth, with minimum recorded temperatures below −67 °C [25]. However, in recent years there has been a rise in the average annual temperature, which is currently registered everywhere in the world and in Russia. So, in regions of the Republic, temperatures of −60 °C and lower are becoming rarer, and in the central areas in winter-time, temperatures of −50 °C and lower are also becoming less common. Along with this, abnormally high temperatures in the summer period are often recorded, which are not usual for this region, reaching the level of 34 °C and higher, as well as the recording of changes in the average monthly temperature in the off-season periods [9].

2.2. Data

Data for the incidence of tick bites on humans were obtained from the Republic of Sakha’s Federal Service for Surveillance on Consumer Rights Protection and Human Wellbeing (Rospotrebnadzor). We had access to total reported cases in the republic for the period 2000 to 2018, but district-level case data only between 2006 and 2018. The data is compiled annually by the health authority according to reports of tick bites from clinics in each district. The official state institution Rospotrebnadzor in the Republic of Sakha (Yakutia) compiles data from all the districts. The dataset does not distinguish tick species, but Taiga ticks (Ixodes persulcatus) are reported to be the most commonly encountered species [23].
Meteorological data from six weather stations (Figure 1) was provided by the Yakut Department of Hydrometeorology and Environmental Monitoring. For the final analysis, we considered only the annual average temperature measured at each station between 1961 and 2018. Four of the weather stations were located in central Sakha, in the cities of Yakutsk and Pokrovsk, and the villages Churapcha and Amga. The remaining two stations were in northern Sakha, in Verkhoyansk and Oymyakon.
We supplemented the weather station data with climate data from the ERA5 Climate Reanalysis Datasets [26], provided by the Copernicus Climate Data Store, and accessible through Google Earth Engine [27]. From the ERA5-Land monthly averaged—ECMWF climate reanalysis dataset, we extracted the monthly average ground temperatures at a resolution of 0.1 arc degrees. We used the Google Earth Engine platform to query and spatially aggregate the data into averages for each district (administrative level 2) in the Republic of Sakha. Additionally, we obtained daily air temperature and total daily precipitation between 2016 and 2018 at a resolution of 0.25 Arc Degrees from the ERA5 Daily Aggregated Climate Reanalysis. We spatially averaged the data to the district level.

2.3. Statistical Analysis

The data analysis was conducted initially in Microsoft Excel [28], but the final analysis was done with R 4.0.3 [29]. Figures were produced with the package ggplot2 [30]. Analysis and mapping of spatial data was done with the R packages sf and tmap, respectively [31,32]. Functions for generalized model fitting were obtained from the package MASS [33]. To describe long-term air temperature trends in Yakutia, we fit linear regression models to the annual average temperature data. We grouped together temperature observations from stations in the colder northern Yakutia (Verkhoyansk and Oymyakon), and we grouped together observations from the four weather stations in central Yakutia (Yakutsk, Pokrovsk, Churapcha, and Amga). This was to separately investigate the trend in colder northern and warmer central regions. We produced scatter plots and fitted regression lines using ggplot2.
To quantify the relationship between climate variables and the number of reported tick bite cases, we used a negative binomial regression model with a log-link function. We chose this model since our response variable counts data that showed over-dispersion. Our response variable was the number of tick bite cases reported per district per year. We considered the following predictor variables, all evaluated at the district level:
  • Average Annual Temperature (°C).
  • Accumulated daily temperatures on days with an average temperature above 5 °C; this serves as a proxy for the warmth and length of the summer season, when ticks are most active.
  • Average temperature in the hottest month of the year; this is also a proxy for the intensity of the warm season.
  • Average temperature in the coldest month; the harshness of the winter might influence tick larvae survival and might dictate the presence of host species.
  • The observation year (2006–2018); to account/control for possible non-climatic factors that change with time and influence the number of reported tick bite cases. These could include changing population behavior, or medical reporting quality.
  • Selyaninov’s Hydrothermal Coefficient; previous studies observed that Taiga tick abundance in Russia was well explained by this coefficient. It is defined as the sum of daily precipitation (mm) on days with average temperature above 5 °C, divided by the sum of daily average temperatures on the days with temperatures above 5 °C, then multiplied by 10.
h t c = d a y s p r e c i p i t a t i o n d a y s t e m p e r a t u r e × 10 for   d a y s   where   t e m p e r a t u r e > 5   ° C
In the model, we included all the variables as covariates, and systematically removed non-significant variables, until all remaining variables were significant, and the lowest AIC was obtained. However, collinearity between predictor variables could result in the significance of individual covariates to be misreported [34]. For example, correlation between the annual average temperature and temperature in the coldest month could result in one of the two being reported as ‘non-significant’ in a regression model that includes both as covariates. To account for this effect, we also fit separate models for each climate variable and year. We included a year as a covariate in each model to control for non-climatic factors that could be affecting tick bite reports independently of climate change. We then compared the models with the Akaike Information Criterion (AIC). We also considered, but rejected, models with other error distributions. Linear regression was inappropriate due to data being counts. Poisson regression was considered, but rejected due to over-dispersion in the response variable violating the assumptions of the Poisson regression model. Generalized linear mixed models were considered, to investigate the presence of random effects introduced by the observation year or district. However, the complex nature of these models resulted in non-convergence issues when multiple predictor variables and non-normal error distributions were considered. For this reason, we selected the negative binomial regression model as described above.

3. Results

3.1. Climate Trends

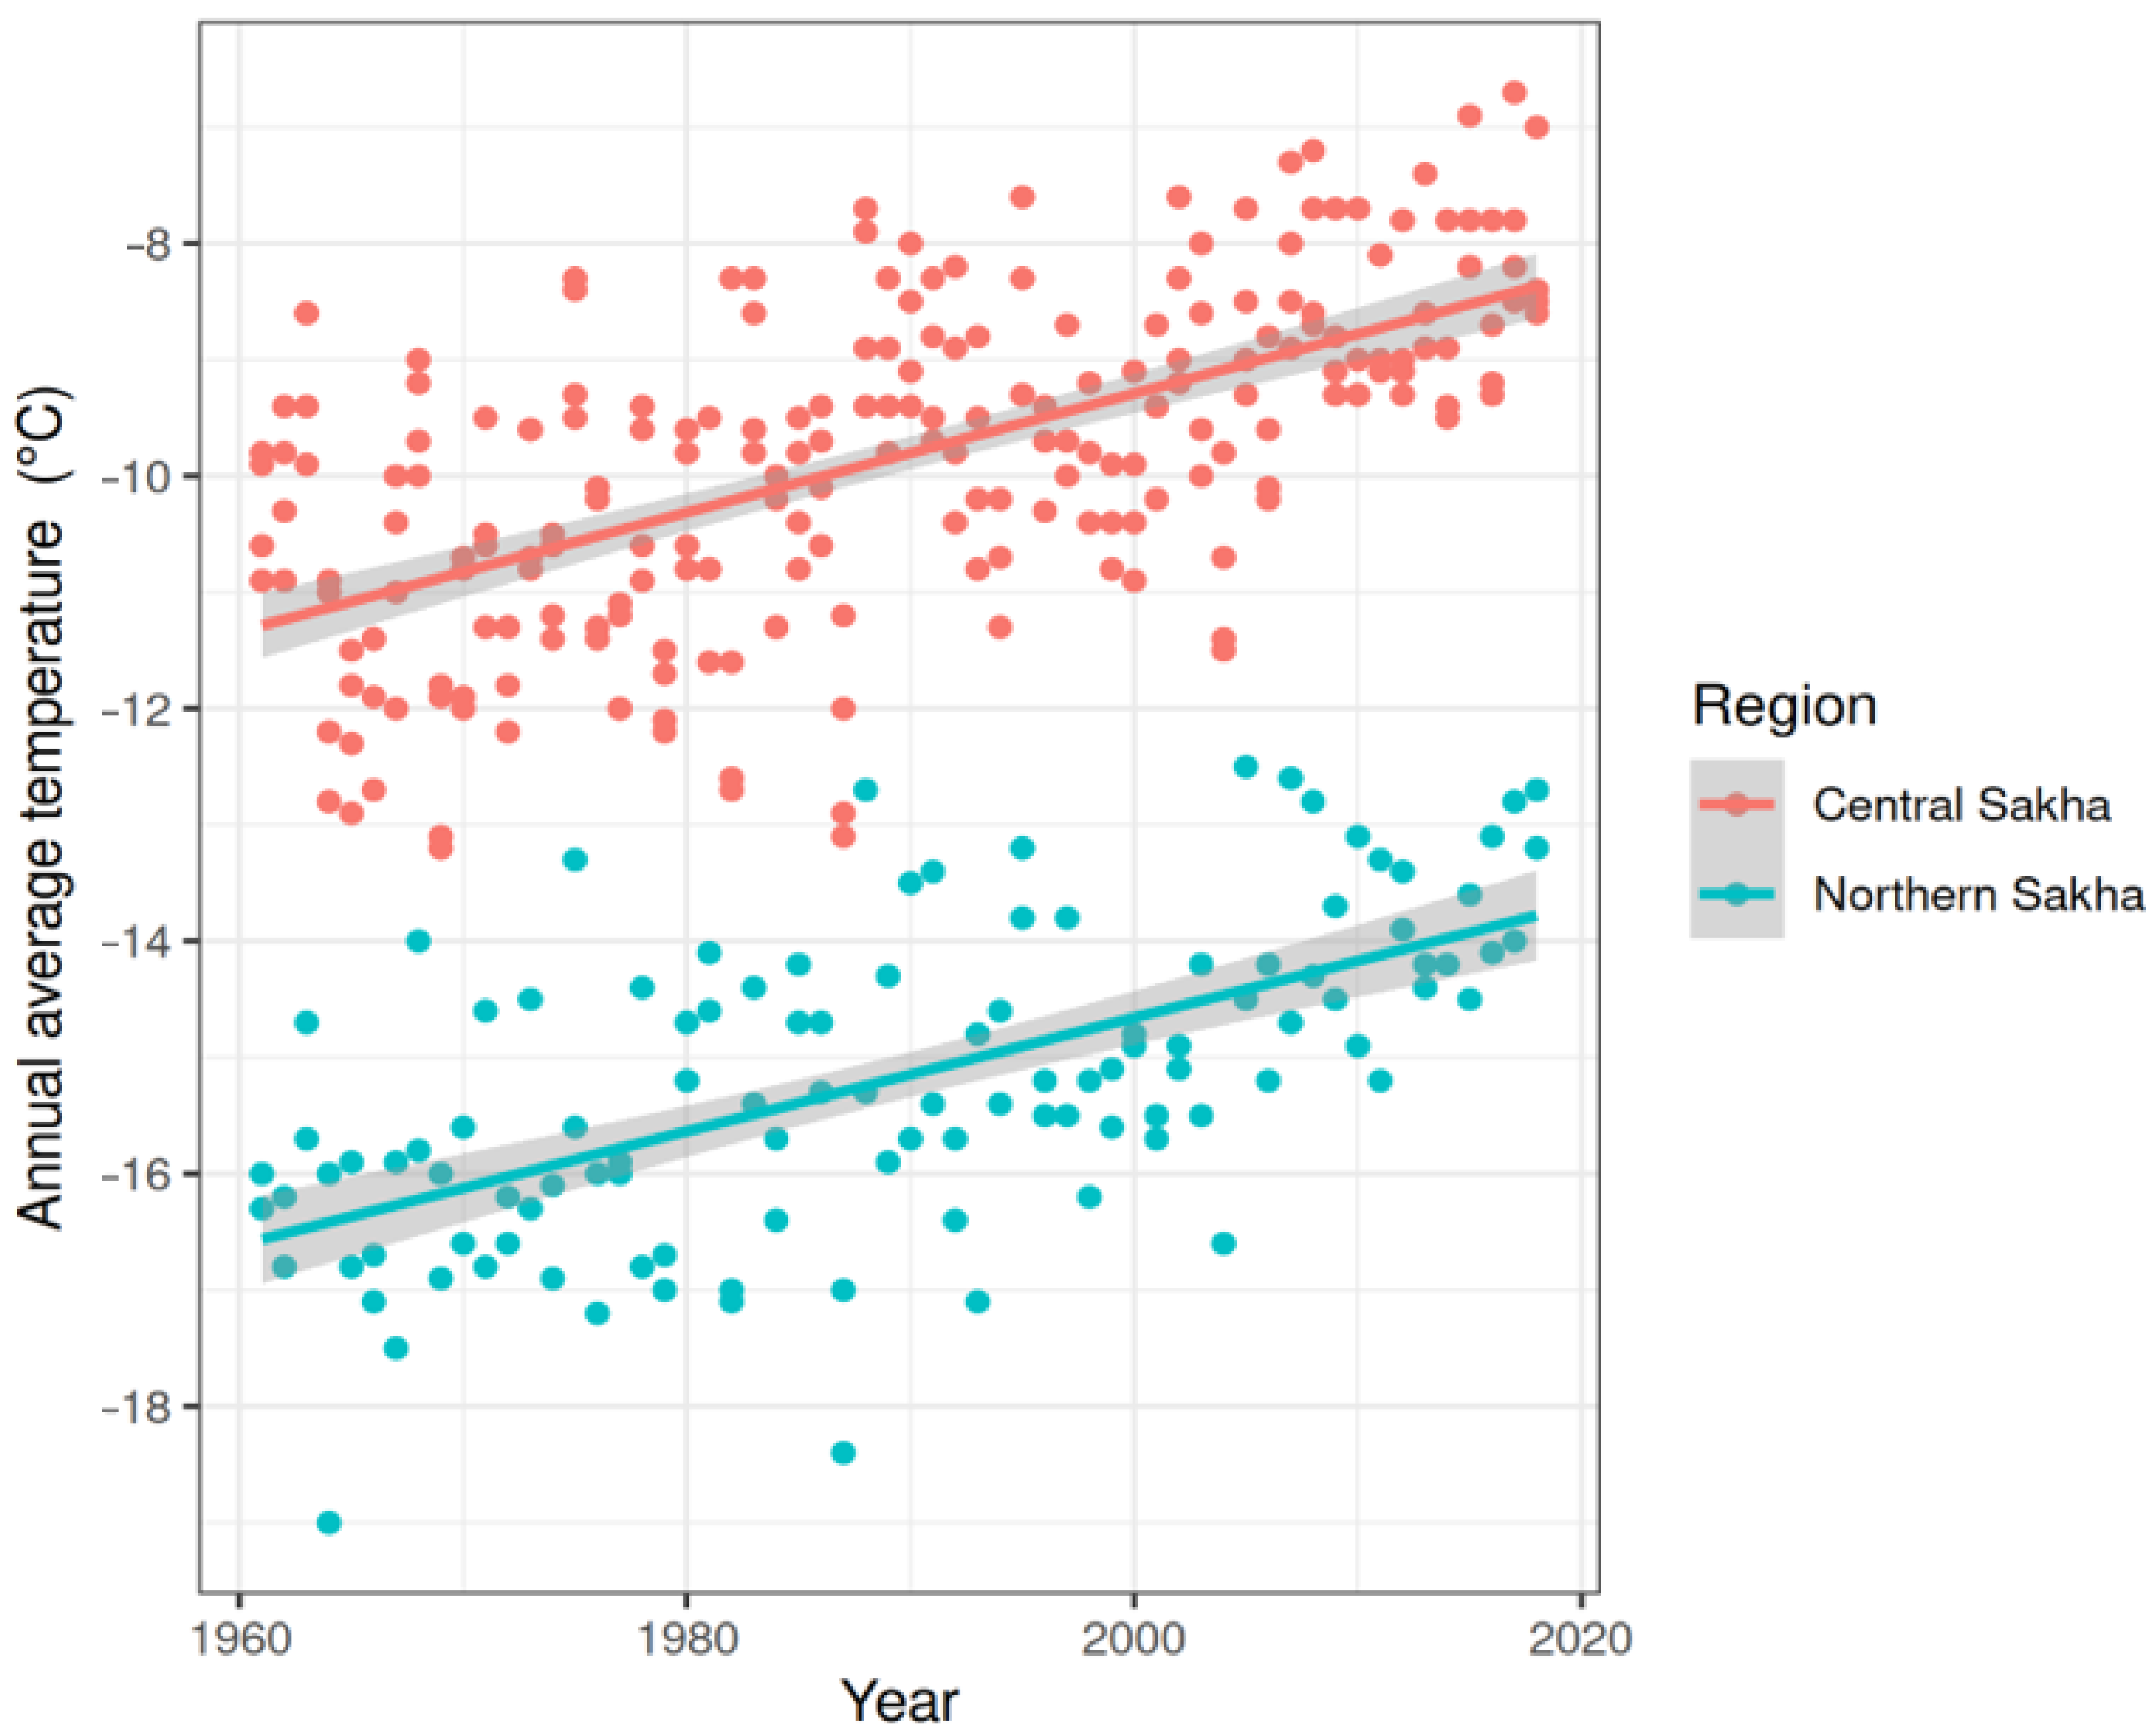
During the considered period of observations from 1961 to 2018, we observed a significant positive upward trend in annual average temperatures at the weather stations in both central and northern Sakha (Figure 2). The temperature increased on average by 0.058 °C per year at the central stations, and 0.049 °C per year at the northern stations.
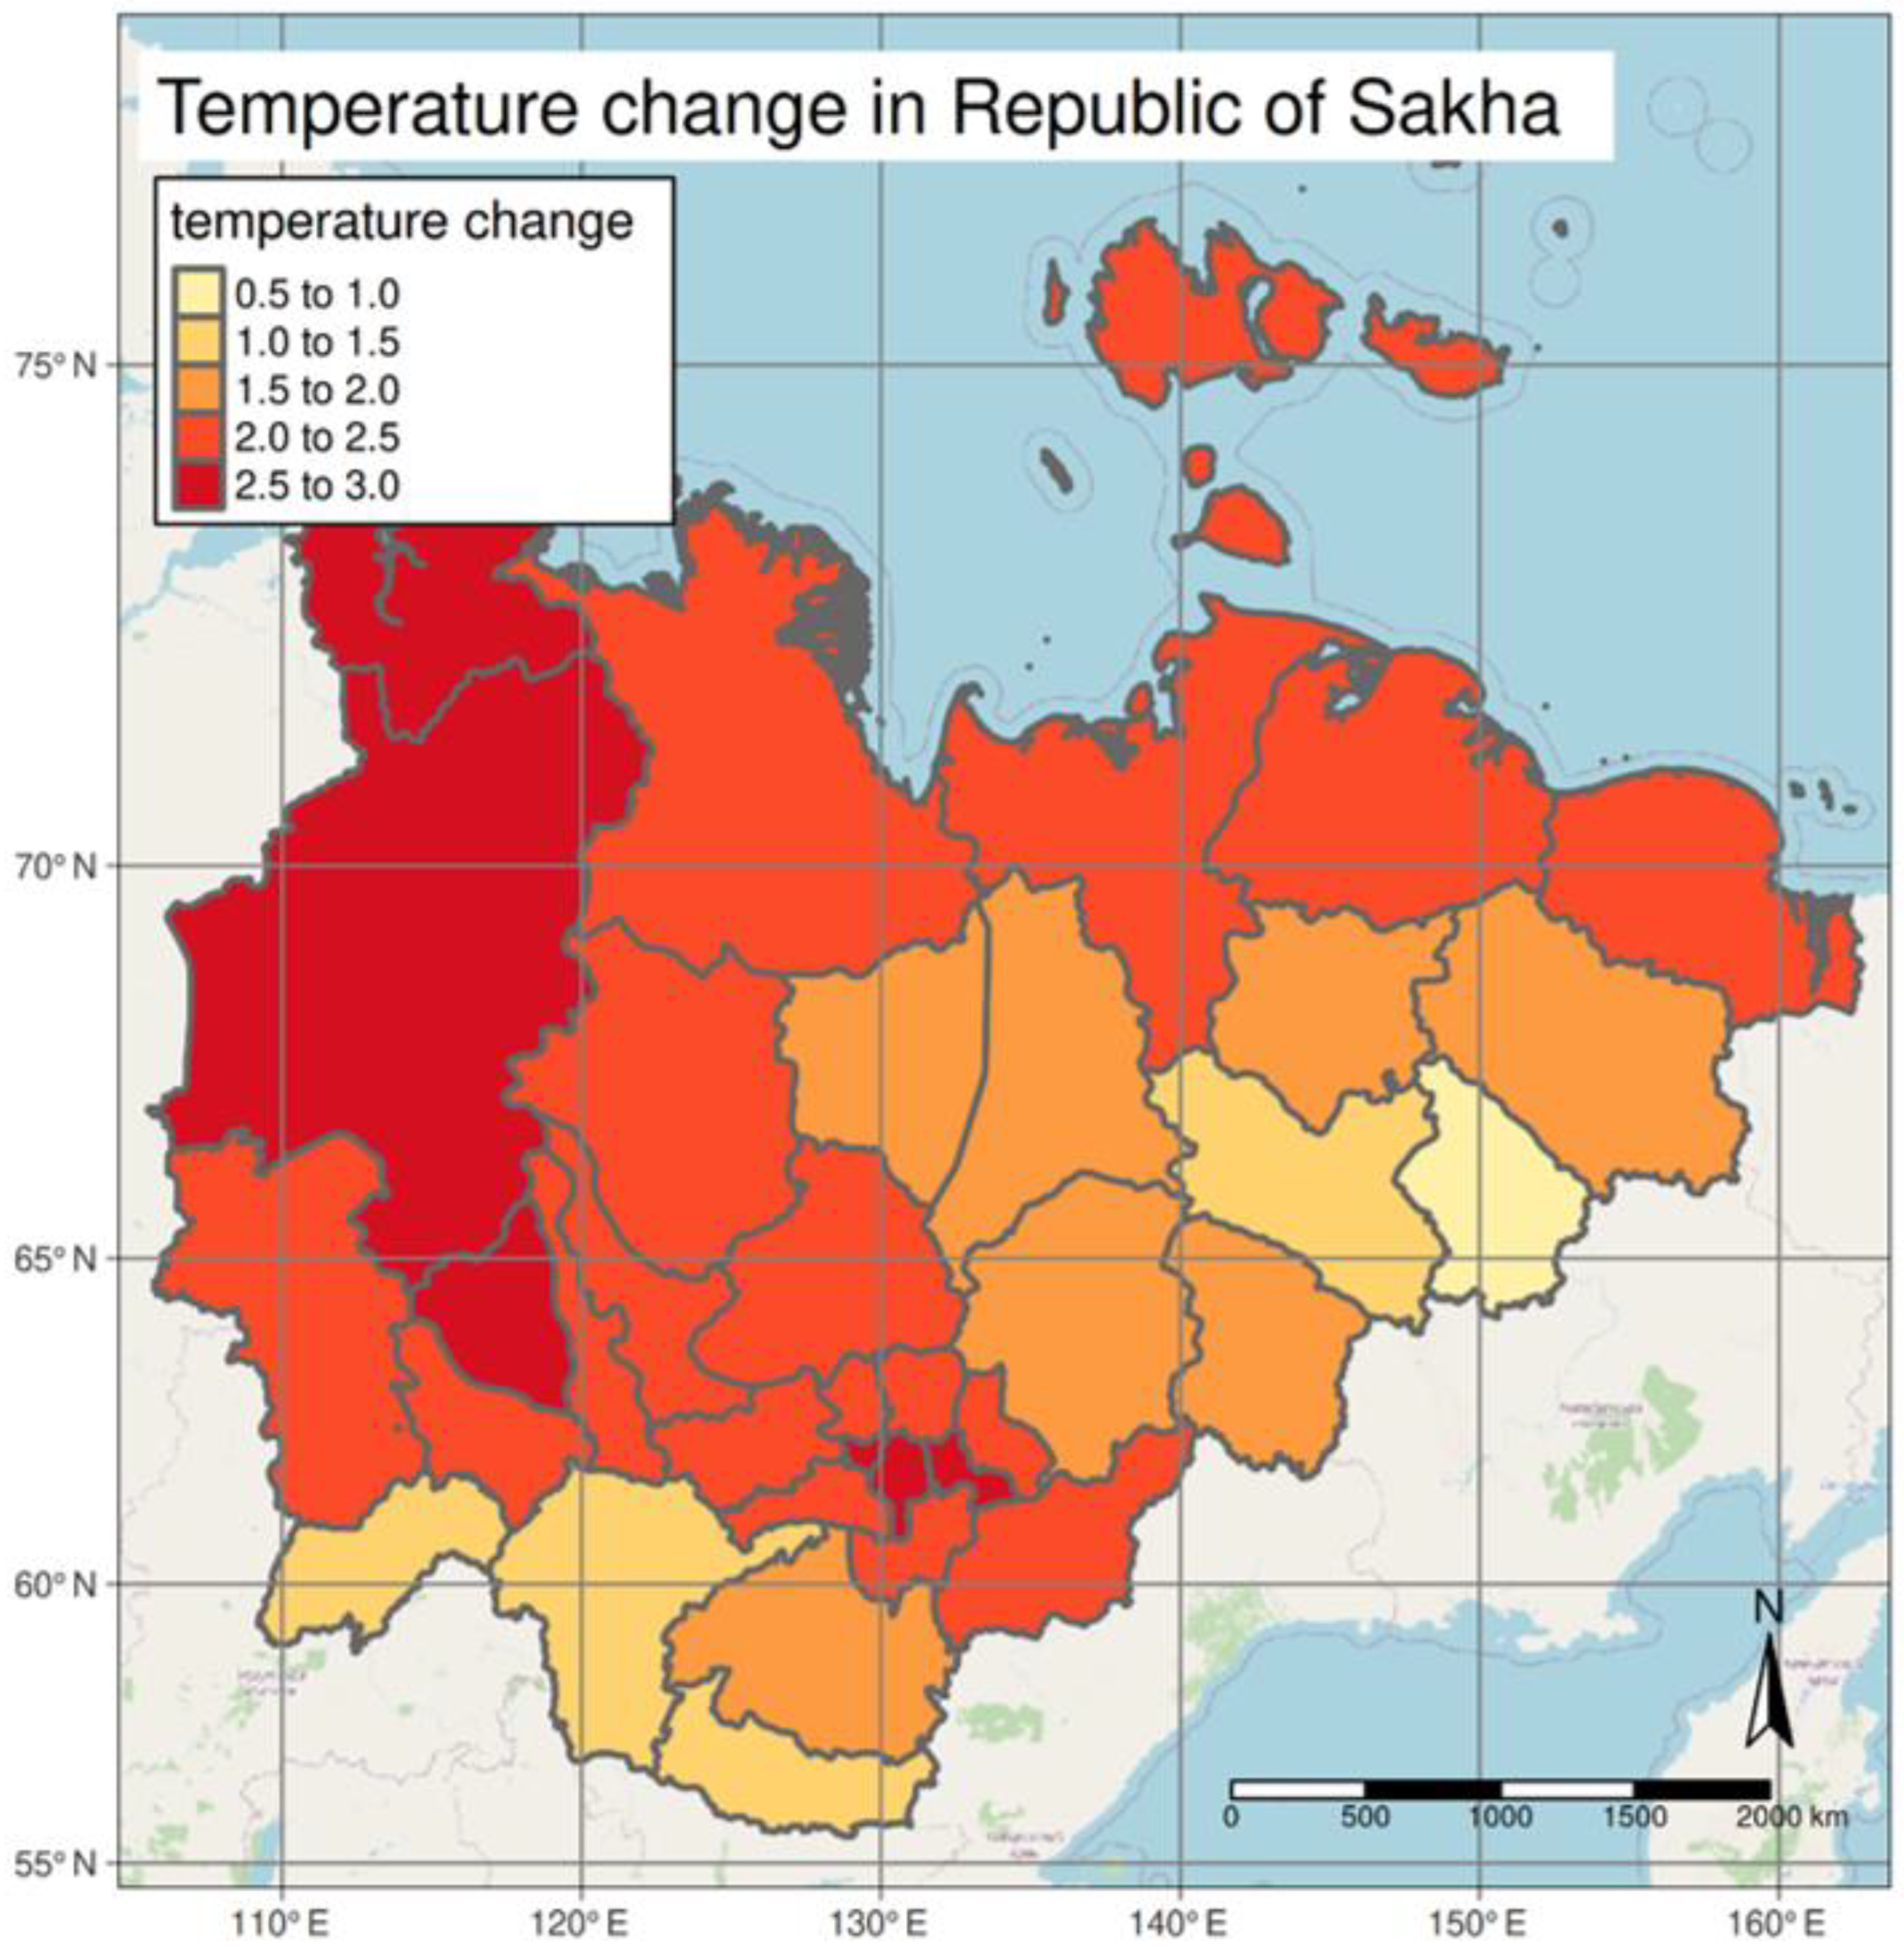
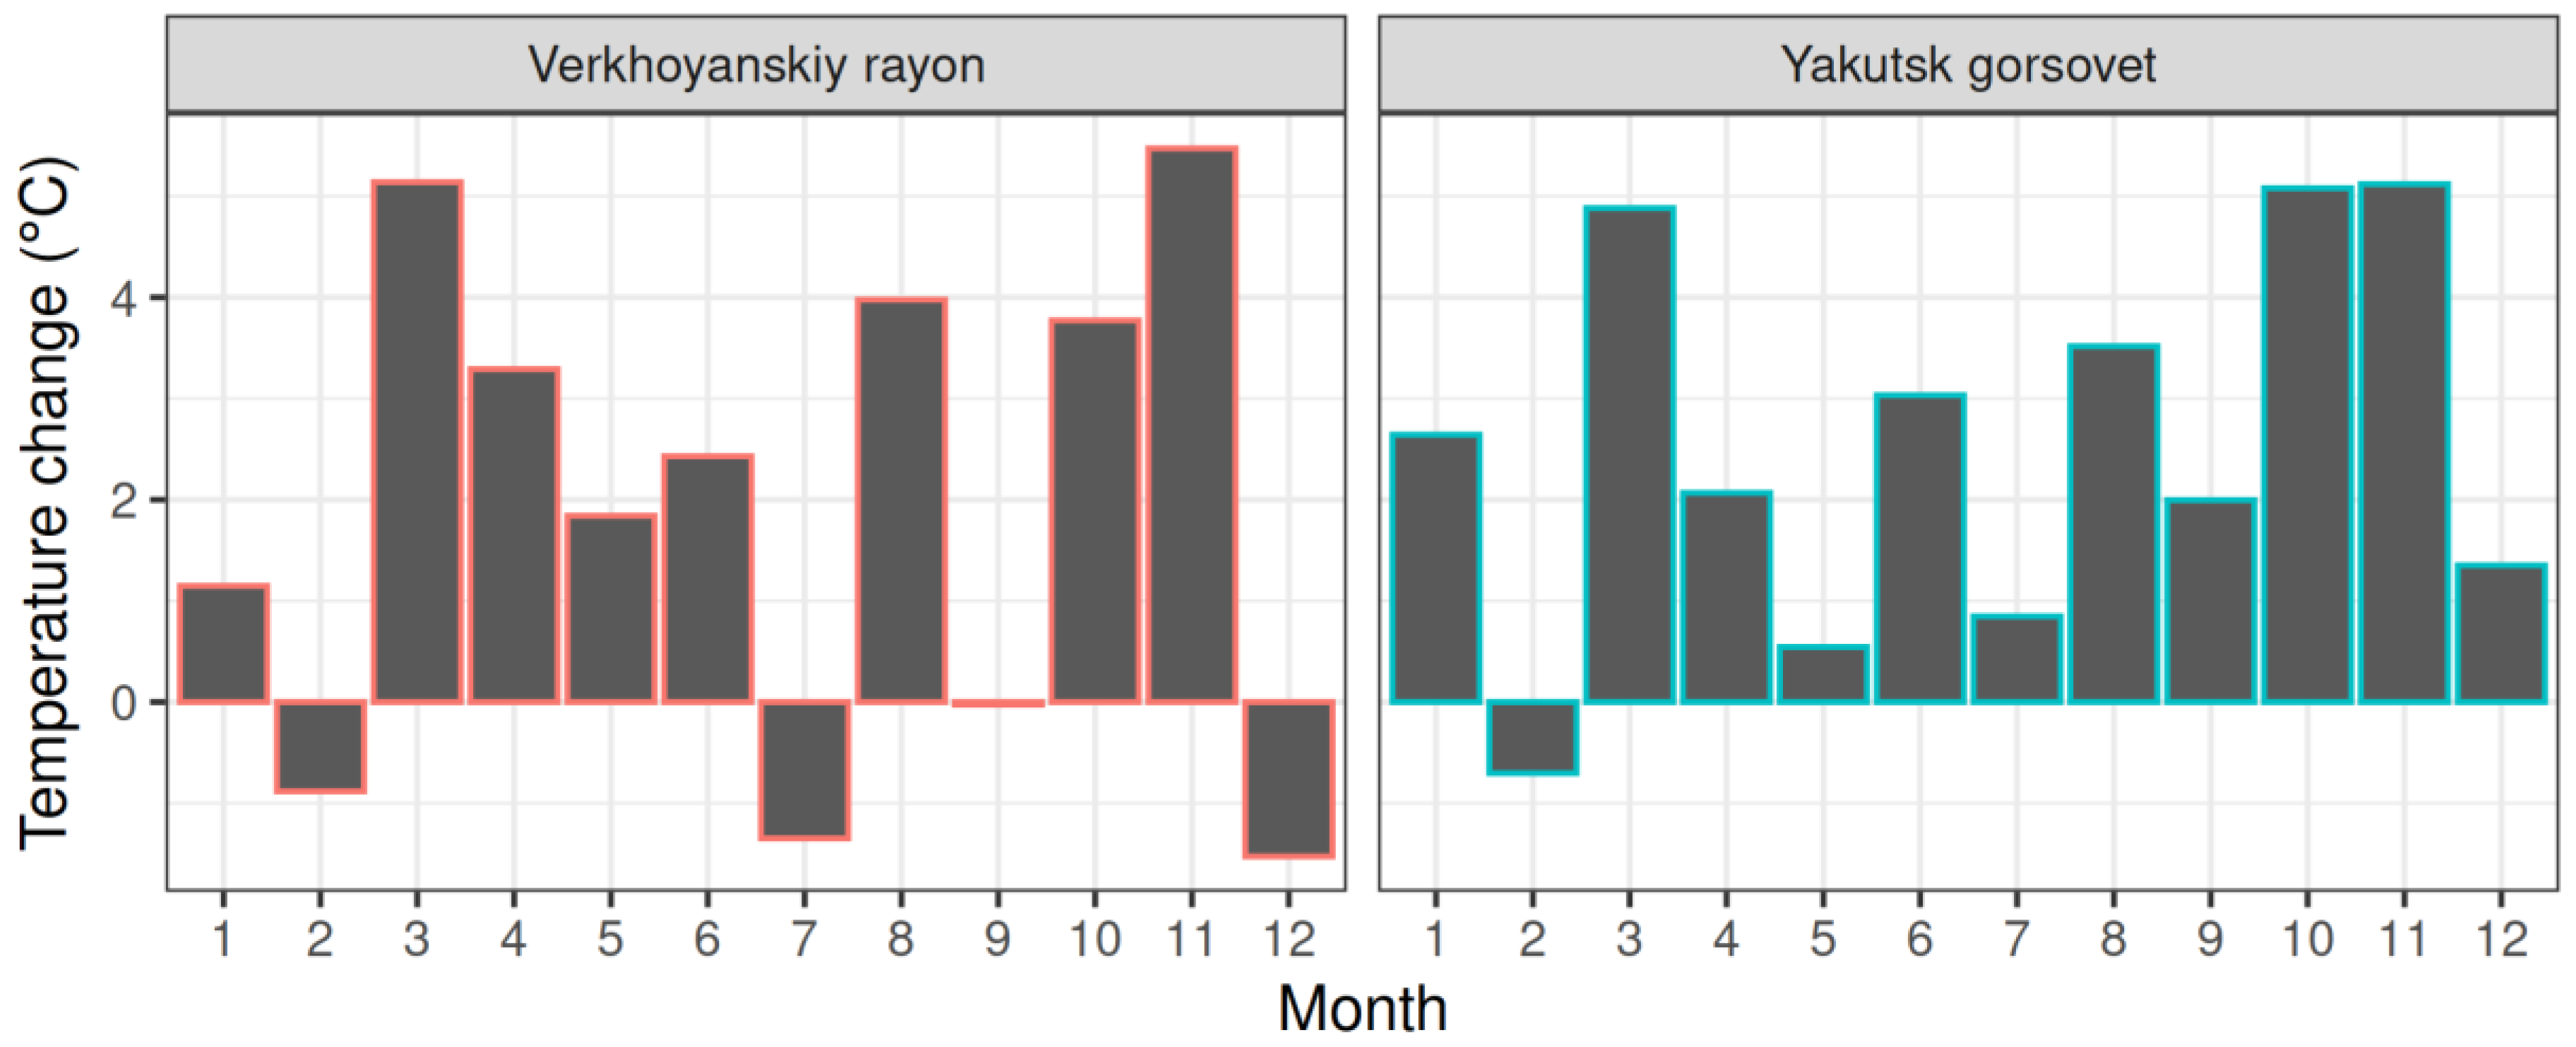
Figure 3 shows the increase in temperatures at the district level between the periods 1981–1982 and 2017–2018. The largest increase was in the north-western regions of the republic with increase of up to 3 °C, but average temperatures increased in all the districts. For long term (1980s to 2018) changes in monthly temperatures, we report values only for two districts, Yakutsk gorsovet and Verkhoyanski gorsovet (Figure 4). The location of the central towns in these districts are shown in Figure 1. In Verkhoyanskiy, spring temperatures increased by between 3 °C and 4 °C, but winter temperatures did not increase. In Yakutsk gorsovet, average temperatures increased in all months except February.

3.2. Tick Bite Results

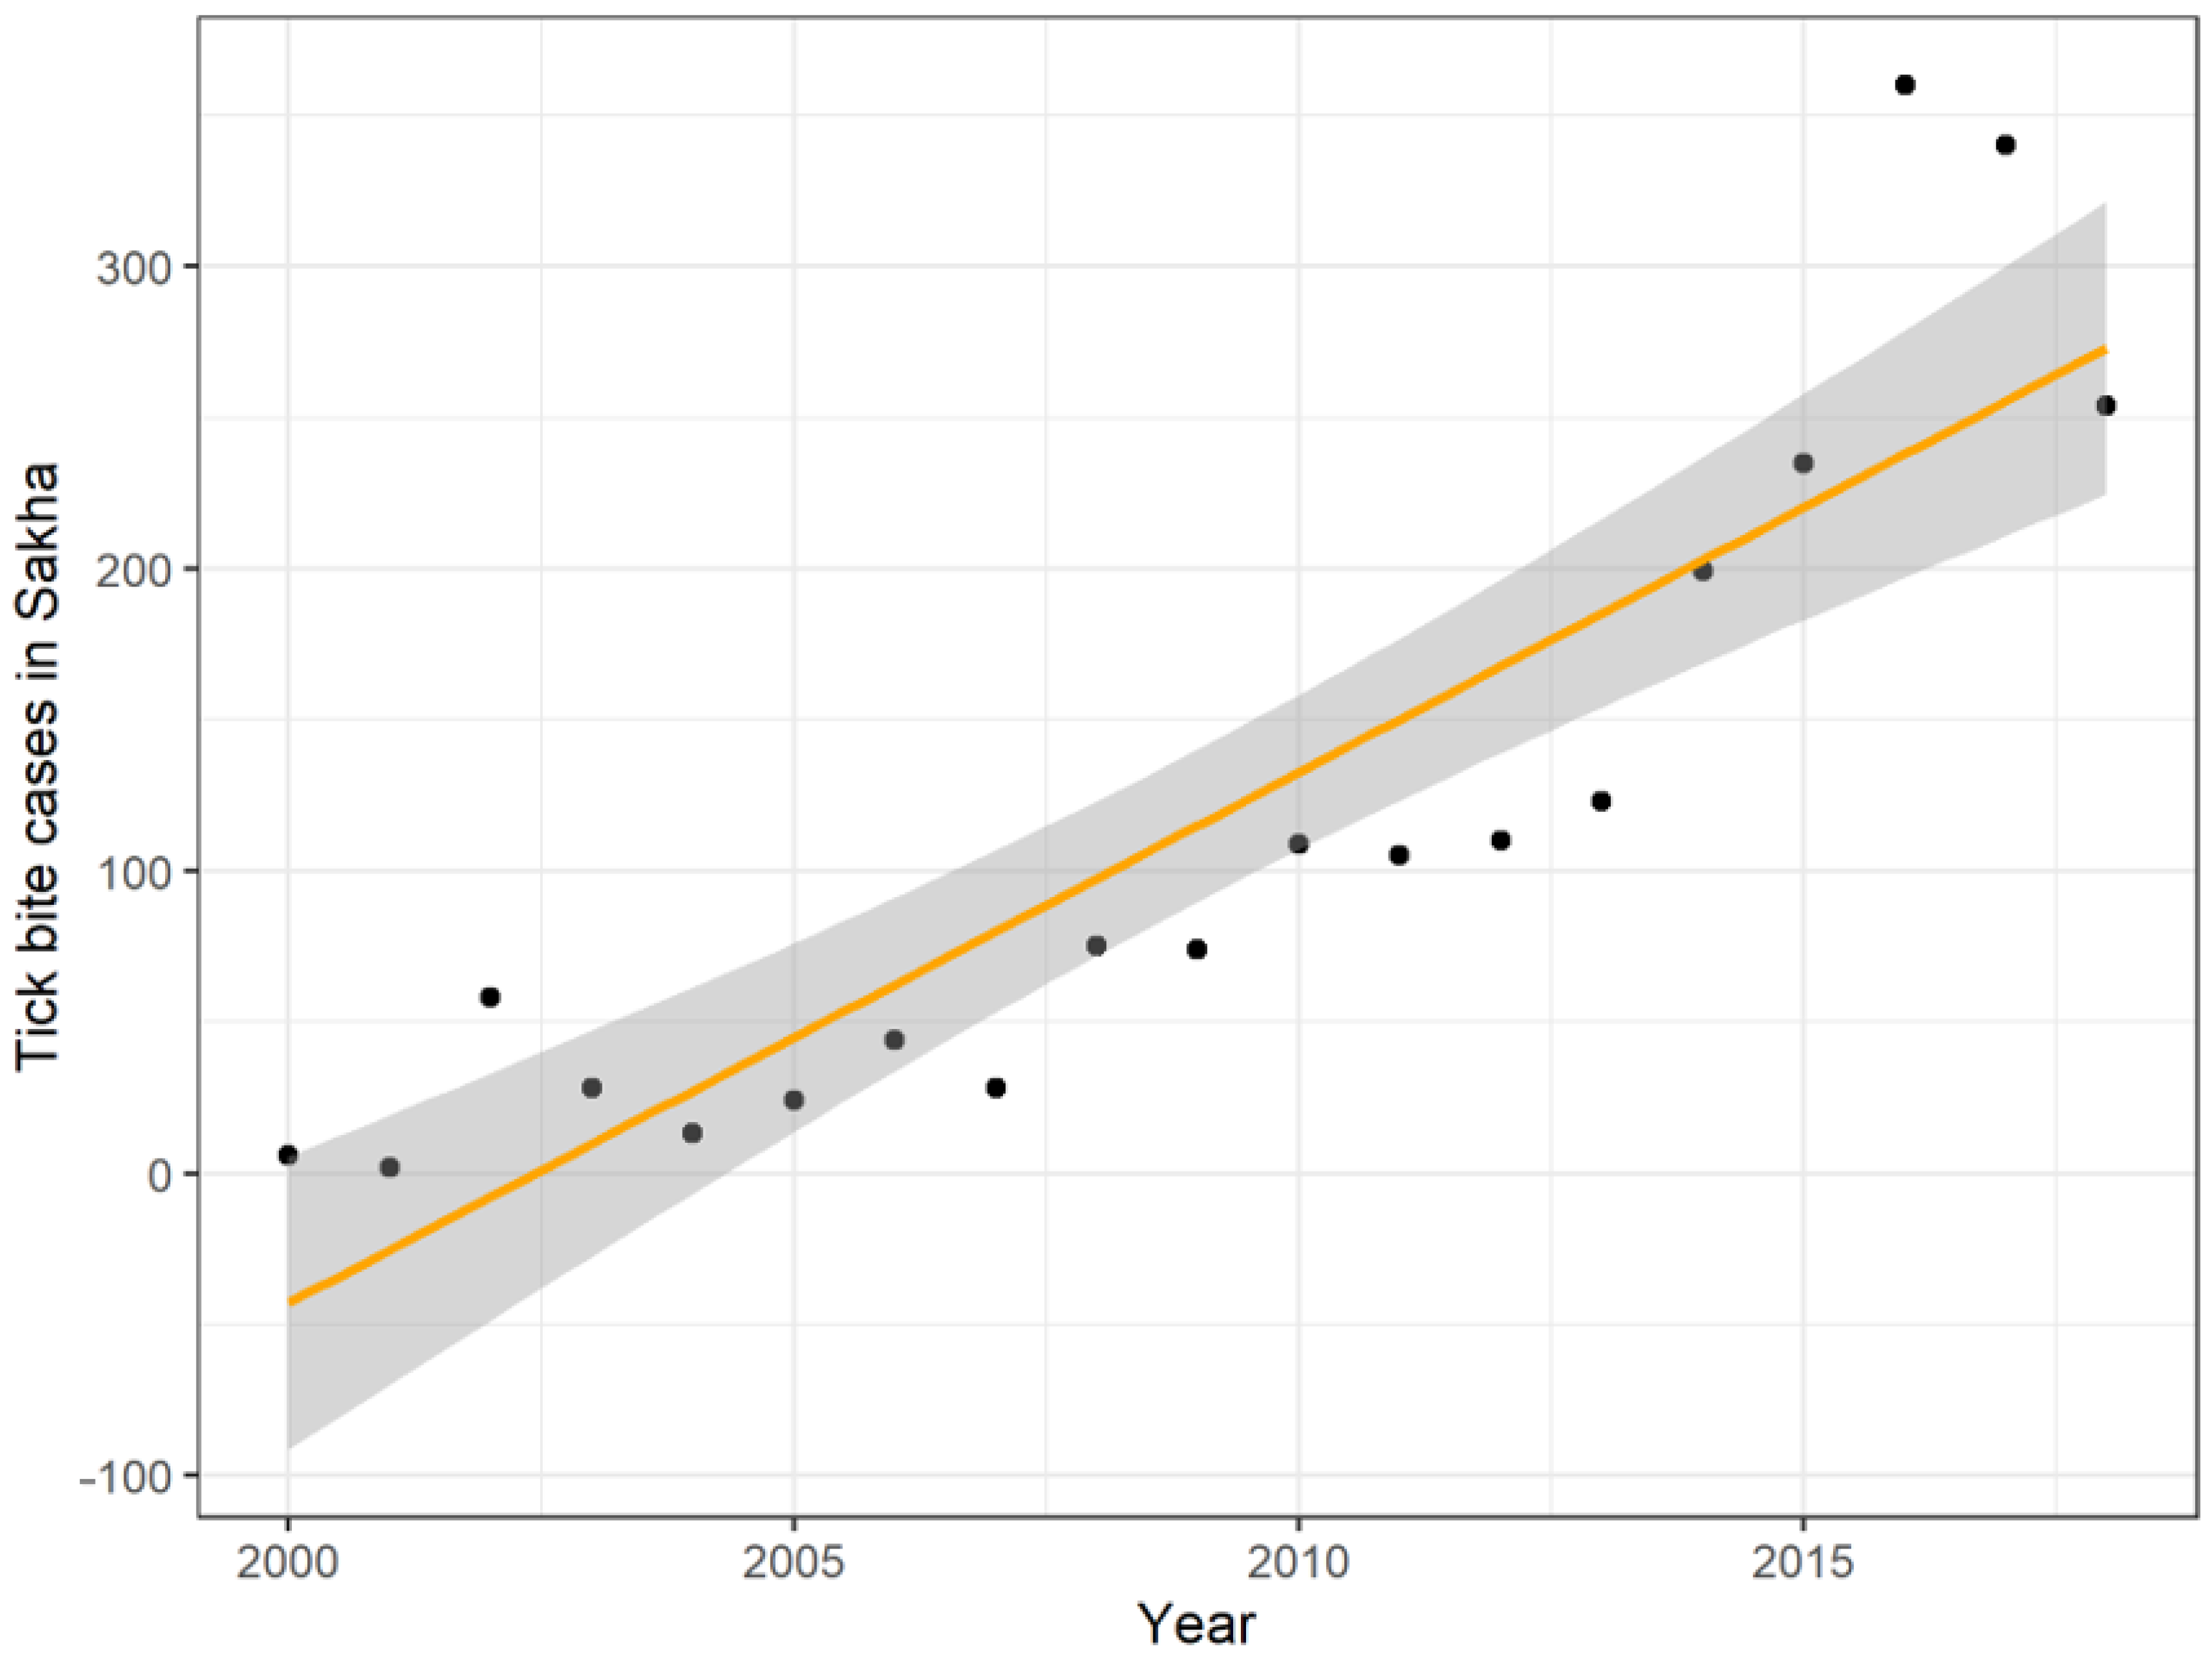
Aggregated at the republic level, the number of reported tick bite cases increased rapidly between 2000 and 2018 (Figure 1). A simple trend line reports an increase of 17.5 tick bite cases per year.

3.3. Spatial Distribution of Tick Bite Cases

In the year 2000, only isolated cases of tick bite reports on humans were recorded in Yakutia (Figure 5), but by 2006, bites were registered in 6 districts of the Republic (Table 1; Figure 6). In 2012 and 2013, attacks were reported in 14 regions of the Republic, including not only the southern, but also the central regions. In 2015–2016, tick bites were recorded in 18 districts of the Republic. For the first time, a case was also reported in Verkhoyanskiy—north of the polar circle. By 2018, tick bite cases had been recorded in 21 different districts (Table 1). The cases showed a northward movement, as can be seen on the map in Figure 7.

3.4. Model Results

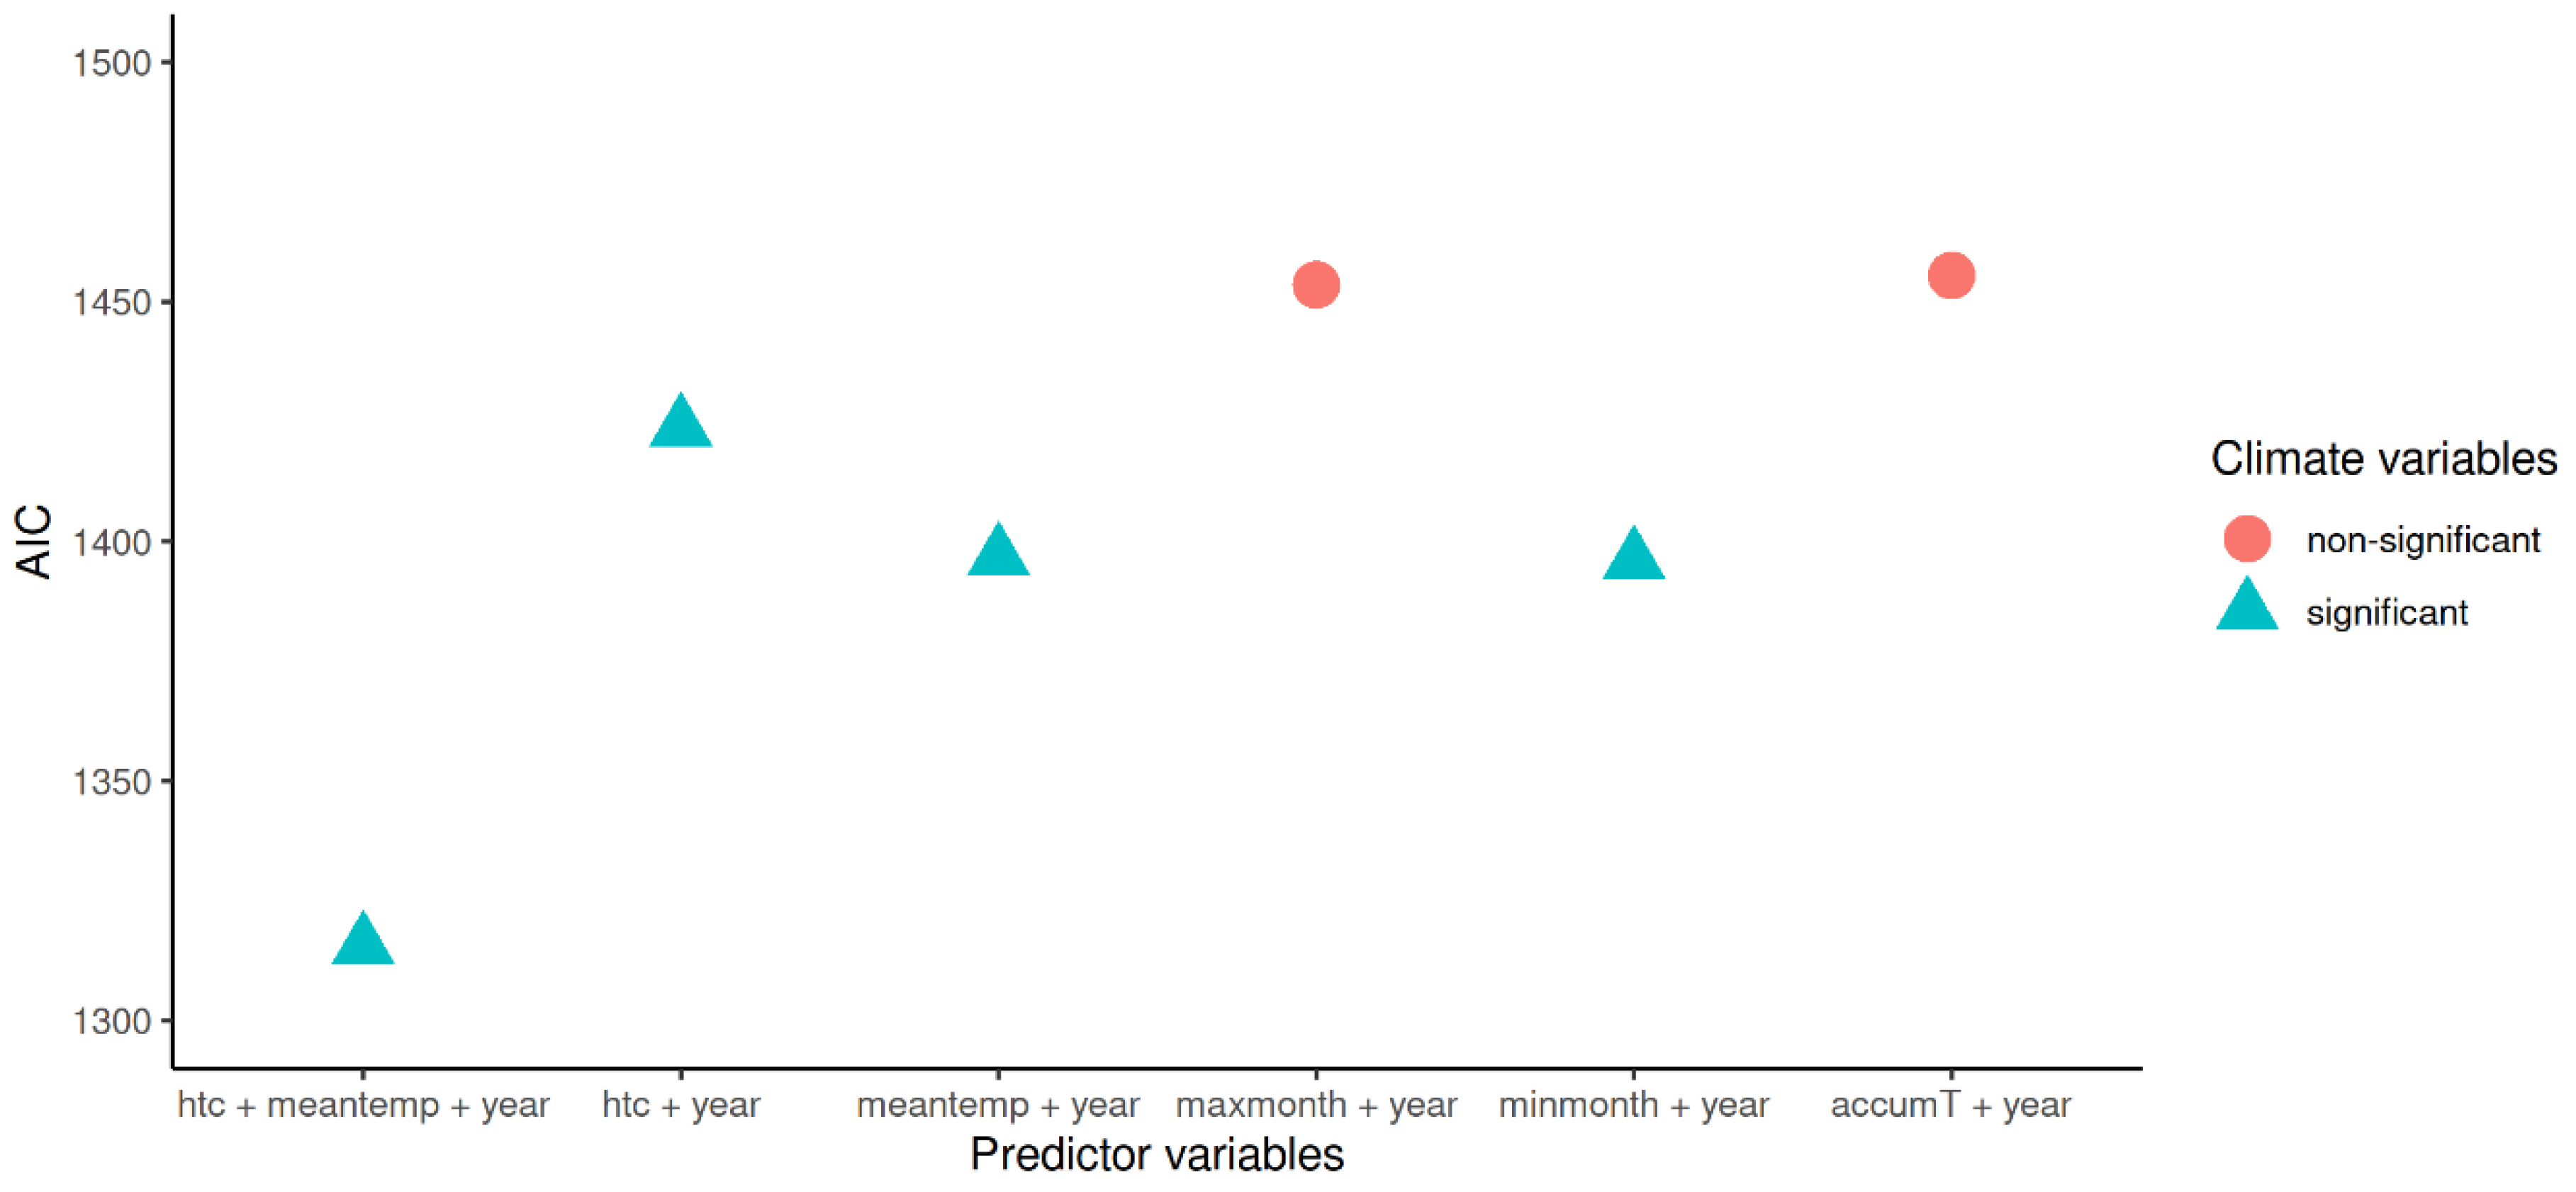
In the negative binomial regression models where each climate variable was considered separately, we found that all climate variables significantly explained the number of reported tick bite cases, except for the two variables that described the climate conditions during Summer, namely average temperature in the hottest month of the year and accumulated daily temperatures above 5 °C (Figure 6). The other four predictor variables, namely, average annual temperature, temperature in the coldest month, Selyaninov’s hydrothermal coefficient, and observation year were highly significant (p < 0.01). A model that included both average annual temperature and Selyaninov’s HTC fit the data the best, and had the lowest AIC (Figure 6). For this model, coefficient estimates and 95% confidence intervals are shown in Table 2. Shown estimates and intervals are transformed to show true response (i.e., to transform back from the log-response used in the negative binomial model).
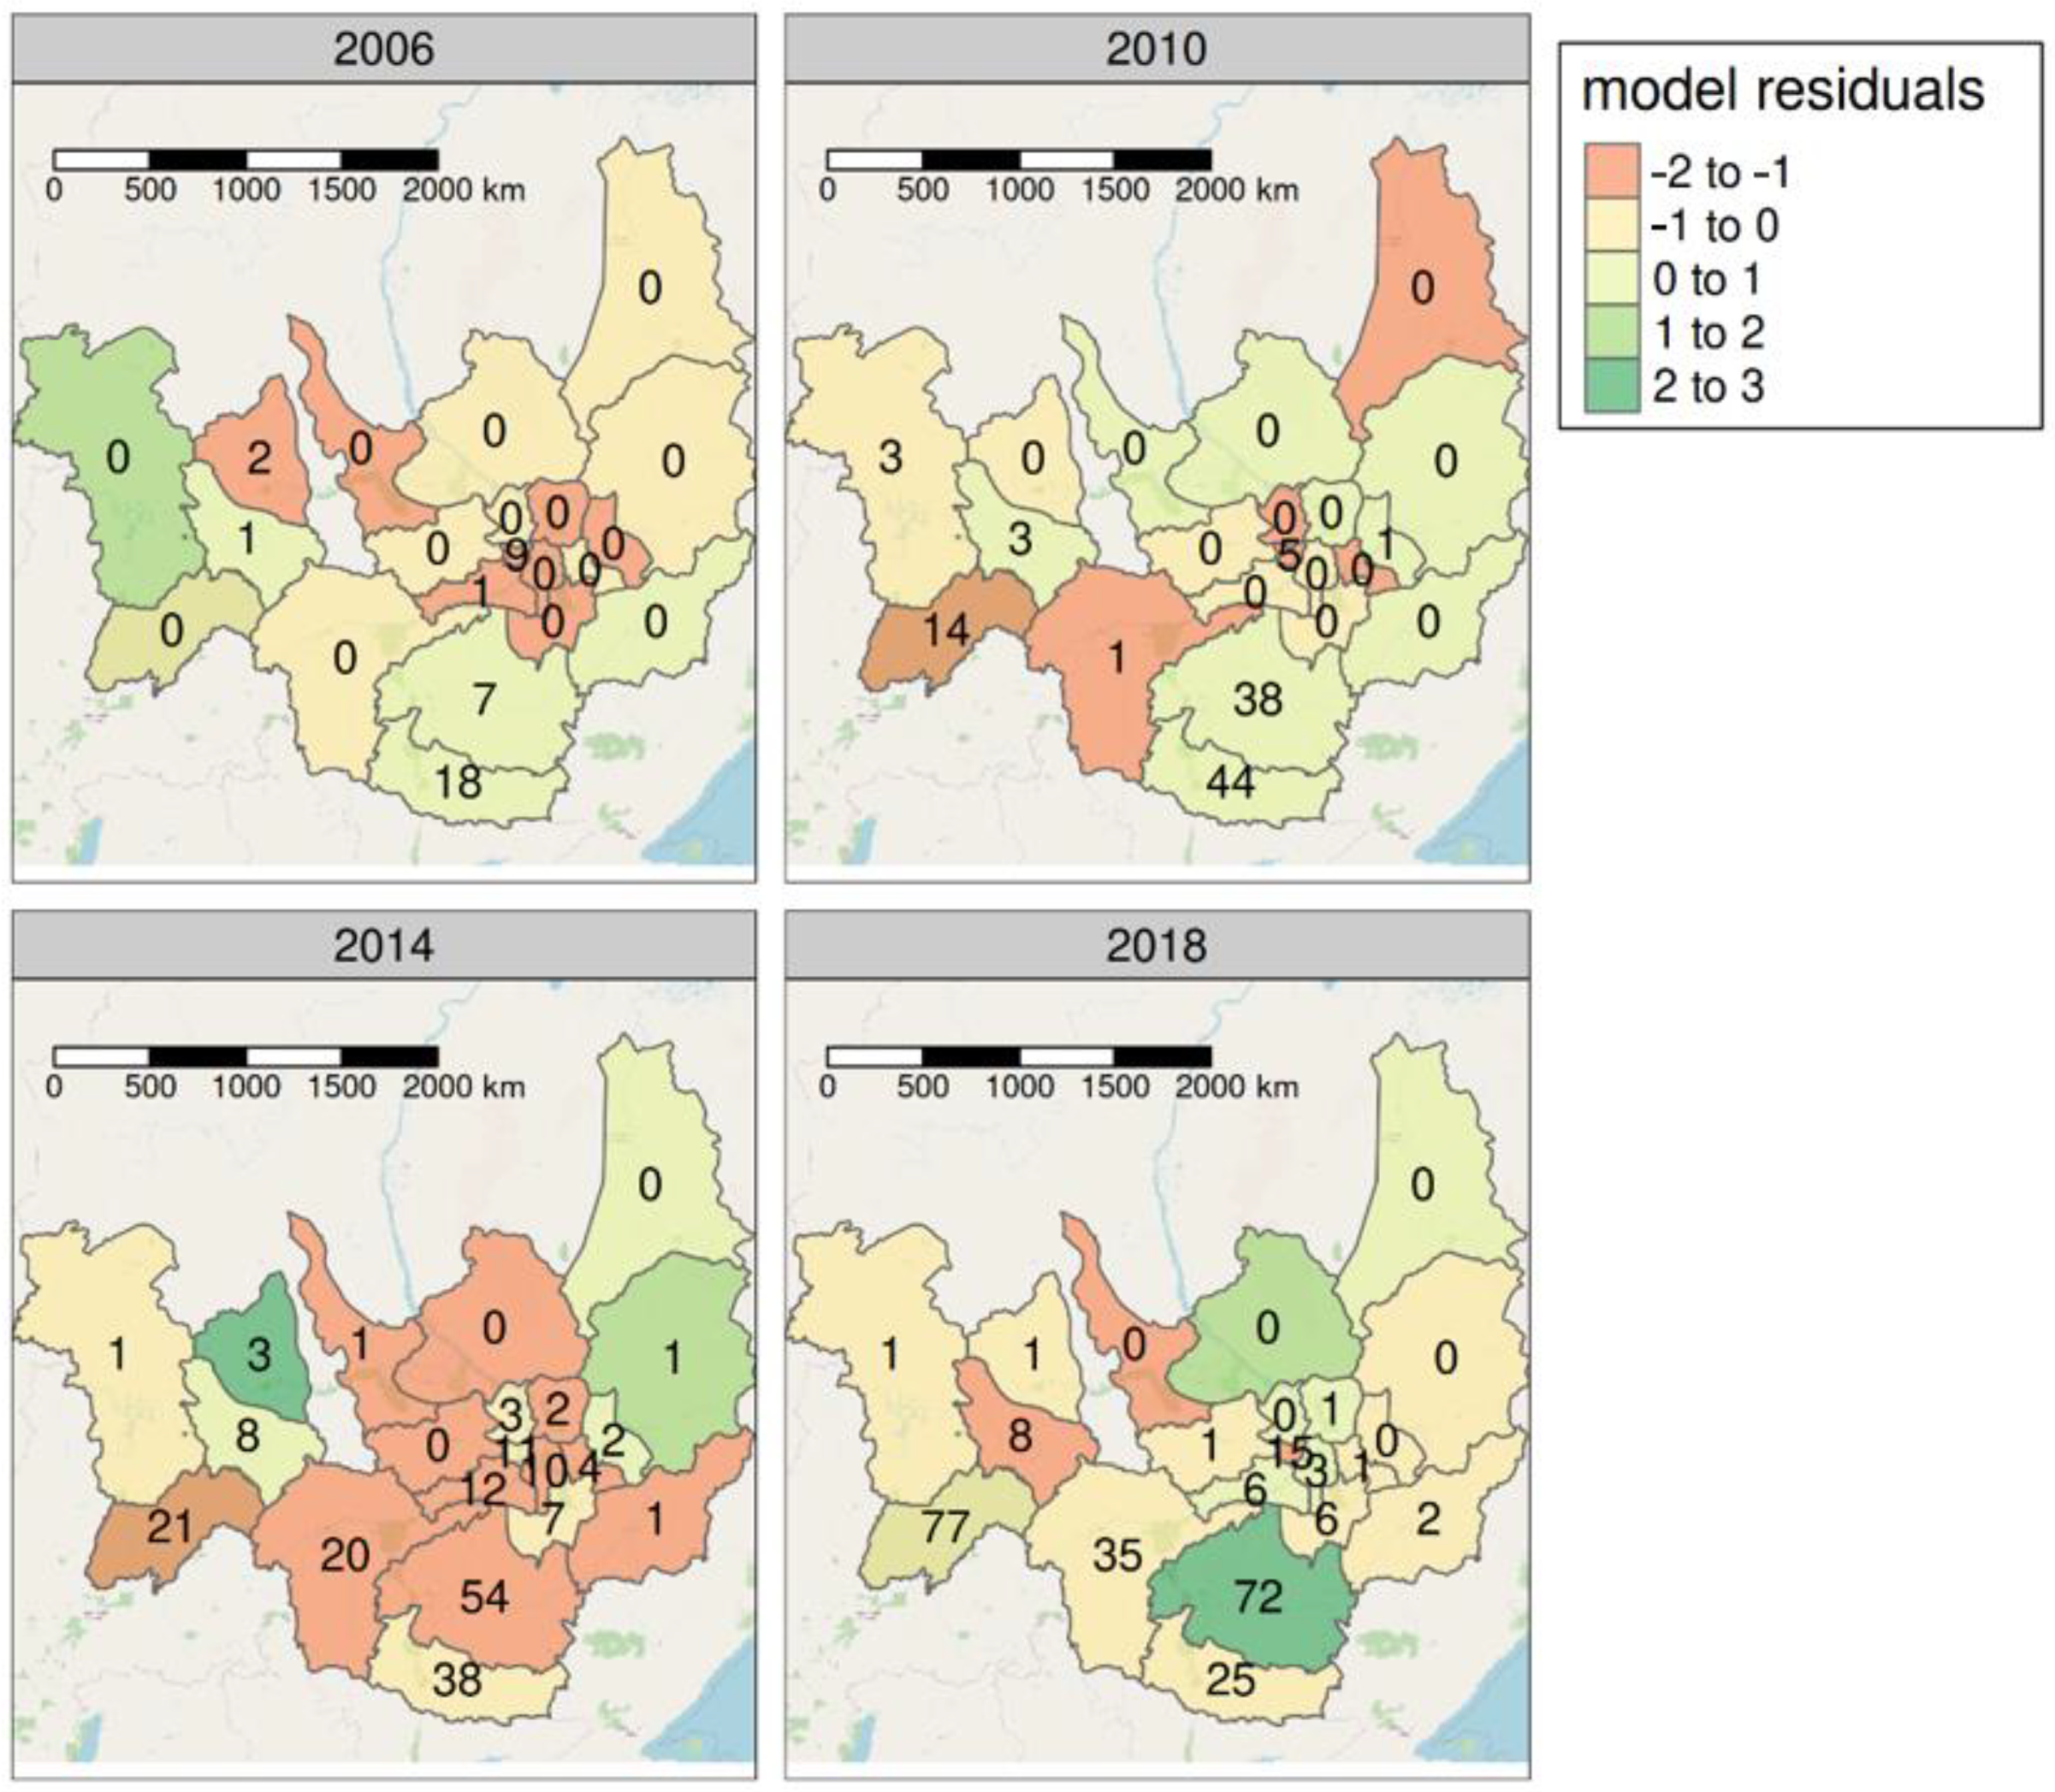
Figure 7 shows maps of the best fitting model’s residuals at 4 year intervals between 2006 and 2018. This was the model with year, average annual temperature and Selyaninov’s HTC as predictor variables. The maps suggest no persistent spatial pattern in the residuals that would indicate some important but unaccounted for spatial driver of tick bite cases.

4. Discussion

Global warming is often cited as one of the important factors contributing to the range of expansion of ticks (order Ixodida) to the northern latitudes [4,24,35]. In the Republic of Sakha, temperature increases are particularly noticeable in both the central and northern regions (Figure 2 and Figure 4). We observed an increase of about 0.5 °C per decade between the 1960′s and 2018. Other sources describe similar patterns in the Russian Arctic and also Sakha [1,4,9]. The frequency of tick-bite cases in Sakha has increased with the increase of temperature (Figure 5, Table 1). According to our regression model results, average annual temperature in a district was significantly and positively correlated to the frequency of tick bites in the district. However, it is known that tick activity and abundance is in particular influenced by temperatures and moisture during the warm season, since tick host seeking activity, survival, and developmental rates are closely related to the conditions in the summer when they are most active [20]. In correspondence with this, Opisova et al. [21] found that taiga tick activity was, among multiple meteorological predictor variables, best explained by temperature and precipitation in the periods of the year when temperatures reached above 5 °C. In contrast to this, however, our model reported that the sum of daily temperatures above 5 °C was not significant. The average temperature in the warmest month of the year, which was anticipated to relate to tick host-seeking activity in summer, was also not significant in our model. The only significant ‘season specific’ predictor variable was Selyaninov’s hydrothermal coefficient. This corresponds to the earlier findings by Opisova et al. [21]. Selyaninov’s HTC gives a measure of the precipitation in the warm part of the year. This suggests that increased summer precipitation should increase tick abundance. According to Gorkohov and Fedorov [9], patterns of changing precipitation are spatially variable in Sakha, with precipitation decreasing in the tundra landscapes, but increasing in 70% of the republic. The harshness of the winter is considered to be a constraining factor for the distribution of ticks, since nymph and larvae survival might reduce when winter temperatures drop below certain thresholds. Moreover, harsh winters might constrain the distribution of possible host species like deer [17]. Our analysis showed a significant relationship between average temperature in the coldest month of the year and tick bite frequency. More temperate winters might, over a number of years, enable host species to settle and tick populations to become established in new areas. Model predictions suggest a northward shift in the distribution of several Russian forest species in accordance with changing climate [36]. However, at the scale of one year, tick bite cases in an area are mostly related to tick host-seeking activity in the warm season [17,36], which is not largely influenced by the winter temperature variations. Host-seeking success at this time might be influenced by humidity. How frequently ticks need to return to water sources to rehydrate is dependent on local humidity, thus low humidity might reduce the time that ticks have to search for hosts [17]. In this study, we did not include a measure of humidity as a predictor variable of tick-bite frequency. Although Selyaninov’s HTC gives a measure of moisture availability in the habitat, more explicit humidity variables like saturation deficit or relative humidity should be incorporated in the future.
The number of reported tick bite cases are potentially affected by multiple other non-climatic factors and need not directly relate to the abundance of ticks within an area. In recent years, there have been much public concern and focus in literature about the increased prevalence of tick-borne infections like Lyme disease and Encephalitis, and their association with climate changes. However, Sumilo et al. [19] observed that increased tick-borne diseases in the Baltics could not only be attributed to changing climate. There can be multiple complex factors and interactions that affect exposure to vectors and their diseases, including changes in socio-economic and public health conditions and improved reporting [14]. We attempted to account for the effect of non-climatic factors by also including observation as an explanatory variable in our model. However, when we controlled for observation year, variation in the climate variables remained statistically significant predictors of tick bite frequency in districts. One non-climatic factor that will have a certain influence on cases, but that we did not consider, is exposure due to population size. In our analysis, the negative binomial model did not converge when population size of the district was included as an exposure/offset term. This may be due to the added complexity, in an already complex model formulation. Therefore, we only considered the number of observed cases, irrespective of local population size. In Table 2, we do, however, report cases per 100,000 population in each district. Due to the sparse population of most of Yakutia, inclusion of population size inflated the magnitude of tick-bite increase, except for the most densely populated districts like Yakutsk gorsovet—home to the capital city Yakutsk.
The range shift of ticks to the north is noted in many countries, including other regions of the Russian Federation. In Sweden and Norway for the period of 1994–2008 the tick boundary has moved more than 200 km to the north along the Baltic coast [18]. In the mountains in the north of the Czech Republic, where the temperature has increased by 1.4 °C in four decades, ticks appeared at an altitude of 1300 m above sea level [37]. In Russia, a marked expansion of I. persulcatus ticks to the north occurred in the Arkhangelsk region and the Republic of Komi [38,39]. In recent years, in particular, the spread of tick populations to the northern territories of Yakutia has been observed [5,35]. In 2008, an outbreak of pyroplasmosis (babesiosis) was recorded for the first time among domestic reindeer in Central Yakutia. The outbreak was further complicated by the parasitic diseases. At the same time, a high mortality rate among the adult reindeer population was noted: Up to 30% at the “Tomtor” site, and up to 70% at the educational-production facilities of the Yakut State Agricultural Academy. It was established that the causative agent of the disease was Babesia bovis, and the parasite was transmitted by Ixodes ricinus ticks.
These reported cases of novel tick-borne disease outbreaks, coupled with the described pattern of northward spread of tick bite cases point again to the risk of infectious disease spread among livestock and communities in the near Arctic regions, as mentioned and predicted in recent years [4,5,6]. Therefore, it is necessary to expand ongoing research on integrated monitoring of ongoing climate change and forecasting its possible impact on traditional industries in the North. The climate variables that influence tick abundance can be used to map areas in the republic where risk of tick bites will become higher in the near future due to climate change. Similar tick-bite risk maps have been made in other areas, by considering remote sensing based indicators of possible tick abundance [40] and citizen science based reports of exposure to ticks [41]. Risk maps, informed by these climate variables, can help local authorities to identify areas where farmers should be supported and made aware of the current and future risks of tick-borne diseases in their livestock.

5. Conclusions

The warming climate in the Republic of Sakha corresponds with the increase of disease vectors in the region. We observed a clear northward spread and a general increase in reported tick bite cases in Sakha. Between 2000 and 2018, cases increased 40-fold. Additionally, cases were initially noted only in southern districts but by 2018 twenty-one districts had been affected, including Verkhoyanskiy—which is above the Arctic Circle. Our negative binomial regression model predicts that winter temperature, annual temperature, and Selyaninov’s hydrothermal coefficient are significantly and positively related to increases in tick-bite frequency in the Republic. We suggest that public health entities as well as agricultural organizations in the Republic of Sakha should continue to monitor the spread of tick-borne diseases, and consider possible interventions to reduce its impact on local health and livestock farming.

Author Contributions

Conceptualization, L.N.V., G.N.M. and V.A.M.; methodology, R.A., A.S.L., N.S. and V.A.M.; software, R.A. and A.S.L.; formal analysis, A.S.L., N.S., A.P.Y. and V.A.M.; resources, L.N.V., G.N.M. and V.A.M.; data curation, L.N.V., G.N.M. and V.A.M.; writing—original draft preparation, L.N.V., G.N.M., V.A.M., A.S.L., R.A. and N.S.; writing—review and editing, L.N.V., G.N.M., V.A.M., A.S.L., R.A., A.P.Y. and N.S.; funding acquisition, L.N.V., A.P.Y. and R.A. All authors have read and agreed to the published version of the manuscript.

Funding

The publication fee was supported by the Human Resource Development Platform for Japan-Russia Economic Cooperation and Personnel Exchange (HaRP) project, Hokkaido University, Japan.

Data Availability Statement

The datasets generated in the current study are available from the corresponding author on request.

Acknowledgments

The authors are thankful to Yakut Scientific Research Institute of Agriculture for providing research facilities and Yakut Department of Hydrometeorology and Republic of Sakha’s Federal Service for Surveillance on Consumer Rights Protection and Human Wellbeing for providing meteorological and tick bites data, respectively. We would like to thank Haruka Komiyama for supporting the translation. HaRP secretariat to coordinate meetings and research between Hokkaido University, Japan and Yakut Scientific Research Institute of Agriculture, Yakutia and Hirose grant to partially support our activities.

Conflicts of Interest

The authors declare no conflict of interest.

References and Note

  1. McBean, G.; Alekseev, G.; Chen, D.; Forland, E.; Fyfe, J.; Groisman, P.Y.; King, R.; Melling, H.; Vose, R.; Whitfield, P.H. Arctic climate: Past and present. In Arctic Climate Impact Assessment Overview Report; Cambridge University Press: Cambridge, UK, 2005; pp. 21–60. [Google Scholar]
  2. Box, J.E.; Colgan, W.T.; Christensen, T.R.; Schmidt, N.M.; Lund, M.; Parmentier, F.-J.W.; Brown, R.; Bhatt, U.S.; Euskirchen, E.S.; Romanovsky, V.E.; et al. Key indicators of Arctic climate change: 1971–2017. Environ. Res. Lett. 2019, 14, 045010. [Google Scholar] [CrossRef]
  3. Arctic Climate Impact Assessment (ACIA). ACIA Overview Report; Cambridge University Press: Cambridge, UK, 2005; p. 1020. [Google Scholar]
  4. Revich, B.; Tokarevich, N.; Parkinson, A.J. Climate change and zoonotic infections in the Russian Arctic. Int. J. Circumpolar Health 2012, 71, 18792. [Google Scholar] [CrossRef]
  5. Parkinson, A.J.; Berner, J. Climate change and impacts on human health in the Arctic: An international workshop on emerging threats and the response of Arctic communities to climate change. Int. J. Circumpolar Health 2009, 68, 84–91. [Google Scholar] [CrossRef] [PubMed] [Green Version]
  6. Huber, I.; Potapova, K.; Ammosova, E.; Beyer, W.; Blagodatskiy, S.; Desyatkin, R.; Hoelzle, L.E.; Ignateva, M.; Kokolova, L.; Lemke, S.; et al. Symposium report: Emerging threats for human health—Impact of socioeconomic and climate change on zoonotic diseases in the Republic of Sakha (Yakutia), Russia. Int. J. Circumpolar Health 2020, 79, 1715698. [Google Scholar] [CrossRef] [Green Version]
  7. Gavriliev, P.P.; Ugarov, I.S. The response of ice-rich permafrost in Central Yakutia to climate warming. Криосфера Земли 2009, 13, 24–30. [Google Scholar]
  8. The Editors of Encyclopaedia Britannica Sakha. Encyclopaedia Britannica; Encyclopaedia Britannica, Inc.: Chicago, IL, USA, 2013; Available online: https://www.britannica.com/place/Sakha-republic-Russia (accessed on 8 November 2020).
  9. Gorokhov, A.N.; Fedorov, A.N. Current trends in climate change in Yakutia. Geogr. Nat. Resour. 2018, 39, 153–161. [Google Scholar] [CrossRef]
  10. Кокорин, А.О.; Карелин, Д.В.; Стеценко, А.В. Воздействие Изменения Климата На Российскую Арктику: Анализ и Пути Решения Проблемы; WWF Russia: Moscow, Russian, 2008. [Google Scholar]
  11. Loiko, S.V.; Lim, A.G.; Manasypov, R.M.; Shirokova, L.S.; Istigechev, G.I.; Kuzmina, D.M.; Kulizhsky, S.P.; Vorobyev, S.N.; Pokrovsky, O.S.; Raudina, T.V. Permafrost thaw and climate warming may decrease the CO2, carbon, and metal concentration in peat soil waters of the Western Siberia Lowland. Sci. Total Environ. 2018, 634, 1004–1023. [Google Scholar]
  12. Ding, Y.; Zhang, S.; Zhao, L.; Li, Z.; Kang, S. Global warming weakening the inherent stability of glaciers and permafrost. Sci. Bull. 2019, 64, 245–253. [Google Scholar] [CrossRef] [Green Version]
  13. Hari, P.; Kulmala, L. (Eds.) MicroForest. In Boreal Forest and Climate Change; Springer: Dordrecht, The Netherlands, 2008; pp. 433–478. ISBN 978-1-4020-8718-9. [Google Scholar]
  14. Semenza, J.C.; Suk, J.E. Vector-borne diseases and climate change: A European perspective. FEMS Microbiol. Lett. 2018, 365, fnx224. [Google Scholar] [CrossRef] [PubMed]
  15. Alfredsson, M.; Olafsson, E.; Eydal, M.; Unnsteinsdottir, E.R.; Hansford, K.; Wint, W.; Alexander, N.; Medlock, J.M. Surveillance of ixodes ricinus ticks (Acari: Ixodidae) in Iceland. Parasit. Vectors 2017, 10, 466. [Google Scholar] [CrossRef] [PubMed] [Green Version]
  16. Descamps, S. Winter temperature affects the prevalence of ticks in an Arctic seabird. PLoS ONE 2013, 8, e65374. [Google Scholar] [CrossRef] [Green Version]
  17. Eisen, R.J.; Eisen, L.; Ogden, N.H.; Beard, C.B. Linkages of weather and climate with Ixodes scapularis and Ixodes pacificus (Acari: Ixodidae), enzootic transmission of Borrelia burgdorferi, and Lyme disease in North America. J. Med. Entomol. 2016, 53, 250–261. [Google Scholar] [CrossRef] [PubMed] [Green Version]
  18. Jaenson, T.G.; Hjertqvist, M.; Bergström, T.; Lundkvist, Å. Why is tick-borne encephalitis increasing? A review of the key factors causing the increasing incidence of human TBE in Sweden. Parasit. Vectors 2012, 5, 184. [Google Scholar] [CrossRef] [Green Version]
  19. Sumilo, D.; Asokliene, L.; Bormane, A.; Vasilenko, V.; Golovljova, I.; Randolph, S.E. Climate change cannot explain the upsurge of tick-borne encephalitis in the Baltics. PLoS ONE 2007, 2, e500. [Google Scholar] [CrossRef] [Green Version]
  20. Grigoryeva, L.; Stanyukovich, M. Life cycle of the taiga tick Ixodes persulcatus (Acari: Ixodidae) in the north-west of Russia. Exp. Appl. Acarol. 2016, 69. [Google Scholar] [CrossRef]
  21. Osipova, T.N.; Grigoryeva, L.A.; Samoylova, E.P.; Shapar, A.O.; Bychkova, E.M. The influence of meteorological factors on the activity of adult taiga ticks (Ixodes persulcatus Sch., Ixodinae) in St. Petersburg and its environs. Entomol. Rev. 2017, 97, 554–563. [Google Scholar] [CrossRef]
  22. Selyaninov, G.L. About the agricultural evaluation of the climate. TrudyGGO 1928, 20, 177–185. [Google Scholar]
  23. Khasnatinov, M.; Liapunov, A.; Manzarova, E.; Liapunova, N.; Solovarov, I.; Salchak, V.; Danchinova, G. The species diversity of ticks that attack human hosts in Eastern Siberia (Russian Federation) and prevalence of tick-borne pathogens. Int. J. Infect. Dis. 2019, 79, 137. [Google Scholar] [CrossRef]
  24. Eisen, L. Climate change and tick-borne diseases: A research field in need of long-term empirical field studies. Int. J. Med. Microbiol. 2008, 298, 12–18. [Google Scholar] [CrossRef]
  25. Stjpanova, N.A. On the lowest temperatures on Earth. Mon. Weather Rev. 1958, 86, 6–10. [Google Scholar] [CrossRef]
  26. Sabater, M. ERA5-Land Monthly Averaged Data from 1981 to Present. Available online: https://cds.climate.copernicus.eu/cdsapp#!/dataset/10.24381/cds.68d2bb30?tab=overview (accessed on 19 January 2021).
  27. Gorelick, N.; Hancher, M.; Dixon, M.; Ilyushchenko, S.; Thau, D.; Moore, R. Google Earth engine: Planetary-scale geospatial analysis for everyone. Remote Sens. Environ. 2017, 202, 18–27. [Google Scholar] [CrossRef]
  28. Microsoft Corporation Microsoft Excel. 2018.
  29. R Core Team. R: A Language and Environment for Statistical Computing; R Foundation for Statistical Computing: Vienna, Austria, 2020. [Google Scholar]
  30. Wickham, H. Ggplot2: Elegant Graphics for Data Analysis; Springer: New York, NY, USA, 2016; ISBN 978-3-319-24277-4. [Google Scholar]
  31. Pebesma, E. Simple features for R: Standardized support for spatial vector data. R J. 2018, 10, 439–446. [Google Scholar] [CrossRef] [Green Version]
  32. Tennekes, M. Tmap: Thematic maps in R. J. Stat. Softw. 2018, 84, 1–39. [Google Scholar] [CrossRef] [Green Version]
  33. Venables, W.N.; Ripley, B.D. Modern Applied Statistics with S, 4th ed.; Springer: New York, NY, USA, 2002. [Google Scholar]
  34. Allen, M.P. (Ed.) The problem of multicollinearity. In Understanding Regression Analysis; Springer: Boston, MA, USA, 1997; pp. 176–180. ISBN 978-0-585-25657-3. [Google Scholar]
  35. Hueffer, K.; Parkinson, A.J.; Gerlach, R.; Berner, J. Zoonotic infections in Alaska: Disease prevalence, potential impact of climate change and recommended actions for earlier disease detection, research, prevention and control. Int. J. Circumpolar Health 2013, 72, 19562. [Google Scholar] [CrossRef] [PubMed]
  36. Noce, S.; Caporaso, L.; Santini, M. Climate change and geographic ranges: The implications for Russian forests. Front. Ecol. Evol. 2019, 7, 57. [Google Scholar] [CrossRef] [Green Version]
  37. Piesman, J. Transmission of Lyme disease spirochetes (Borrelia burgdorferi). Exp. Appl. Acarol. 1989, 7, 71–80. [Google Scholar] [CrossRef]
  38. Тикунова, Н.В.; Власов, В.В.; Рар, В.А.; Ткачев, С.Е. Клещи, которые нас кусают. Наука Из Первых Рук 2019, 85, 32–51. [Google Scholar]
  39. Tokarevich, N.K.; Tronin, A.A.; Blinova, O.V.; Buzinov, R.V.; Boltenkov, V.P.; Yurasova, E.D.; Nurse, J. The impact of climate change on the expansion of Ixodes persulcatus habitat and the incidence of tick-borne encephalitis in the north of European Russia. Glob. Health Action 2011, 4, 8448. [Google Scholar] [CrossRef]
  40. Beck, L.R.; Lobitz, B.M.; Wood, B.L. Remote sensing and human health: New sensors and new opportunities. Emerg. Infect. Dis. 2000, 6, 217–227. [Google Scholar] [CrossRef] [PubMed] [Green Version]
  41. Garcia-Marti, I.; Zurita-Milla, R.; Harms, M.G.; Swart, A. Using volunteered observations to map human exposure to ticks. Sci. Rep. 2018, 8, 15435. [Google Scholar] [CrossRef]
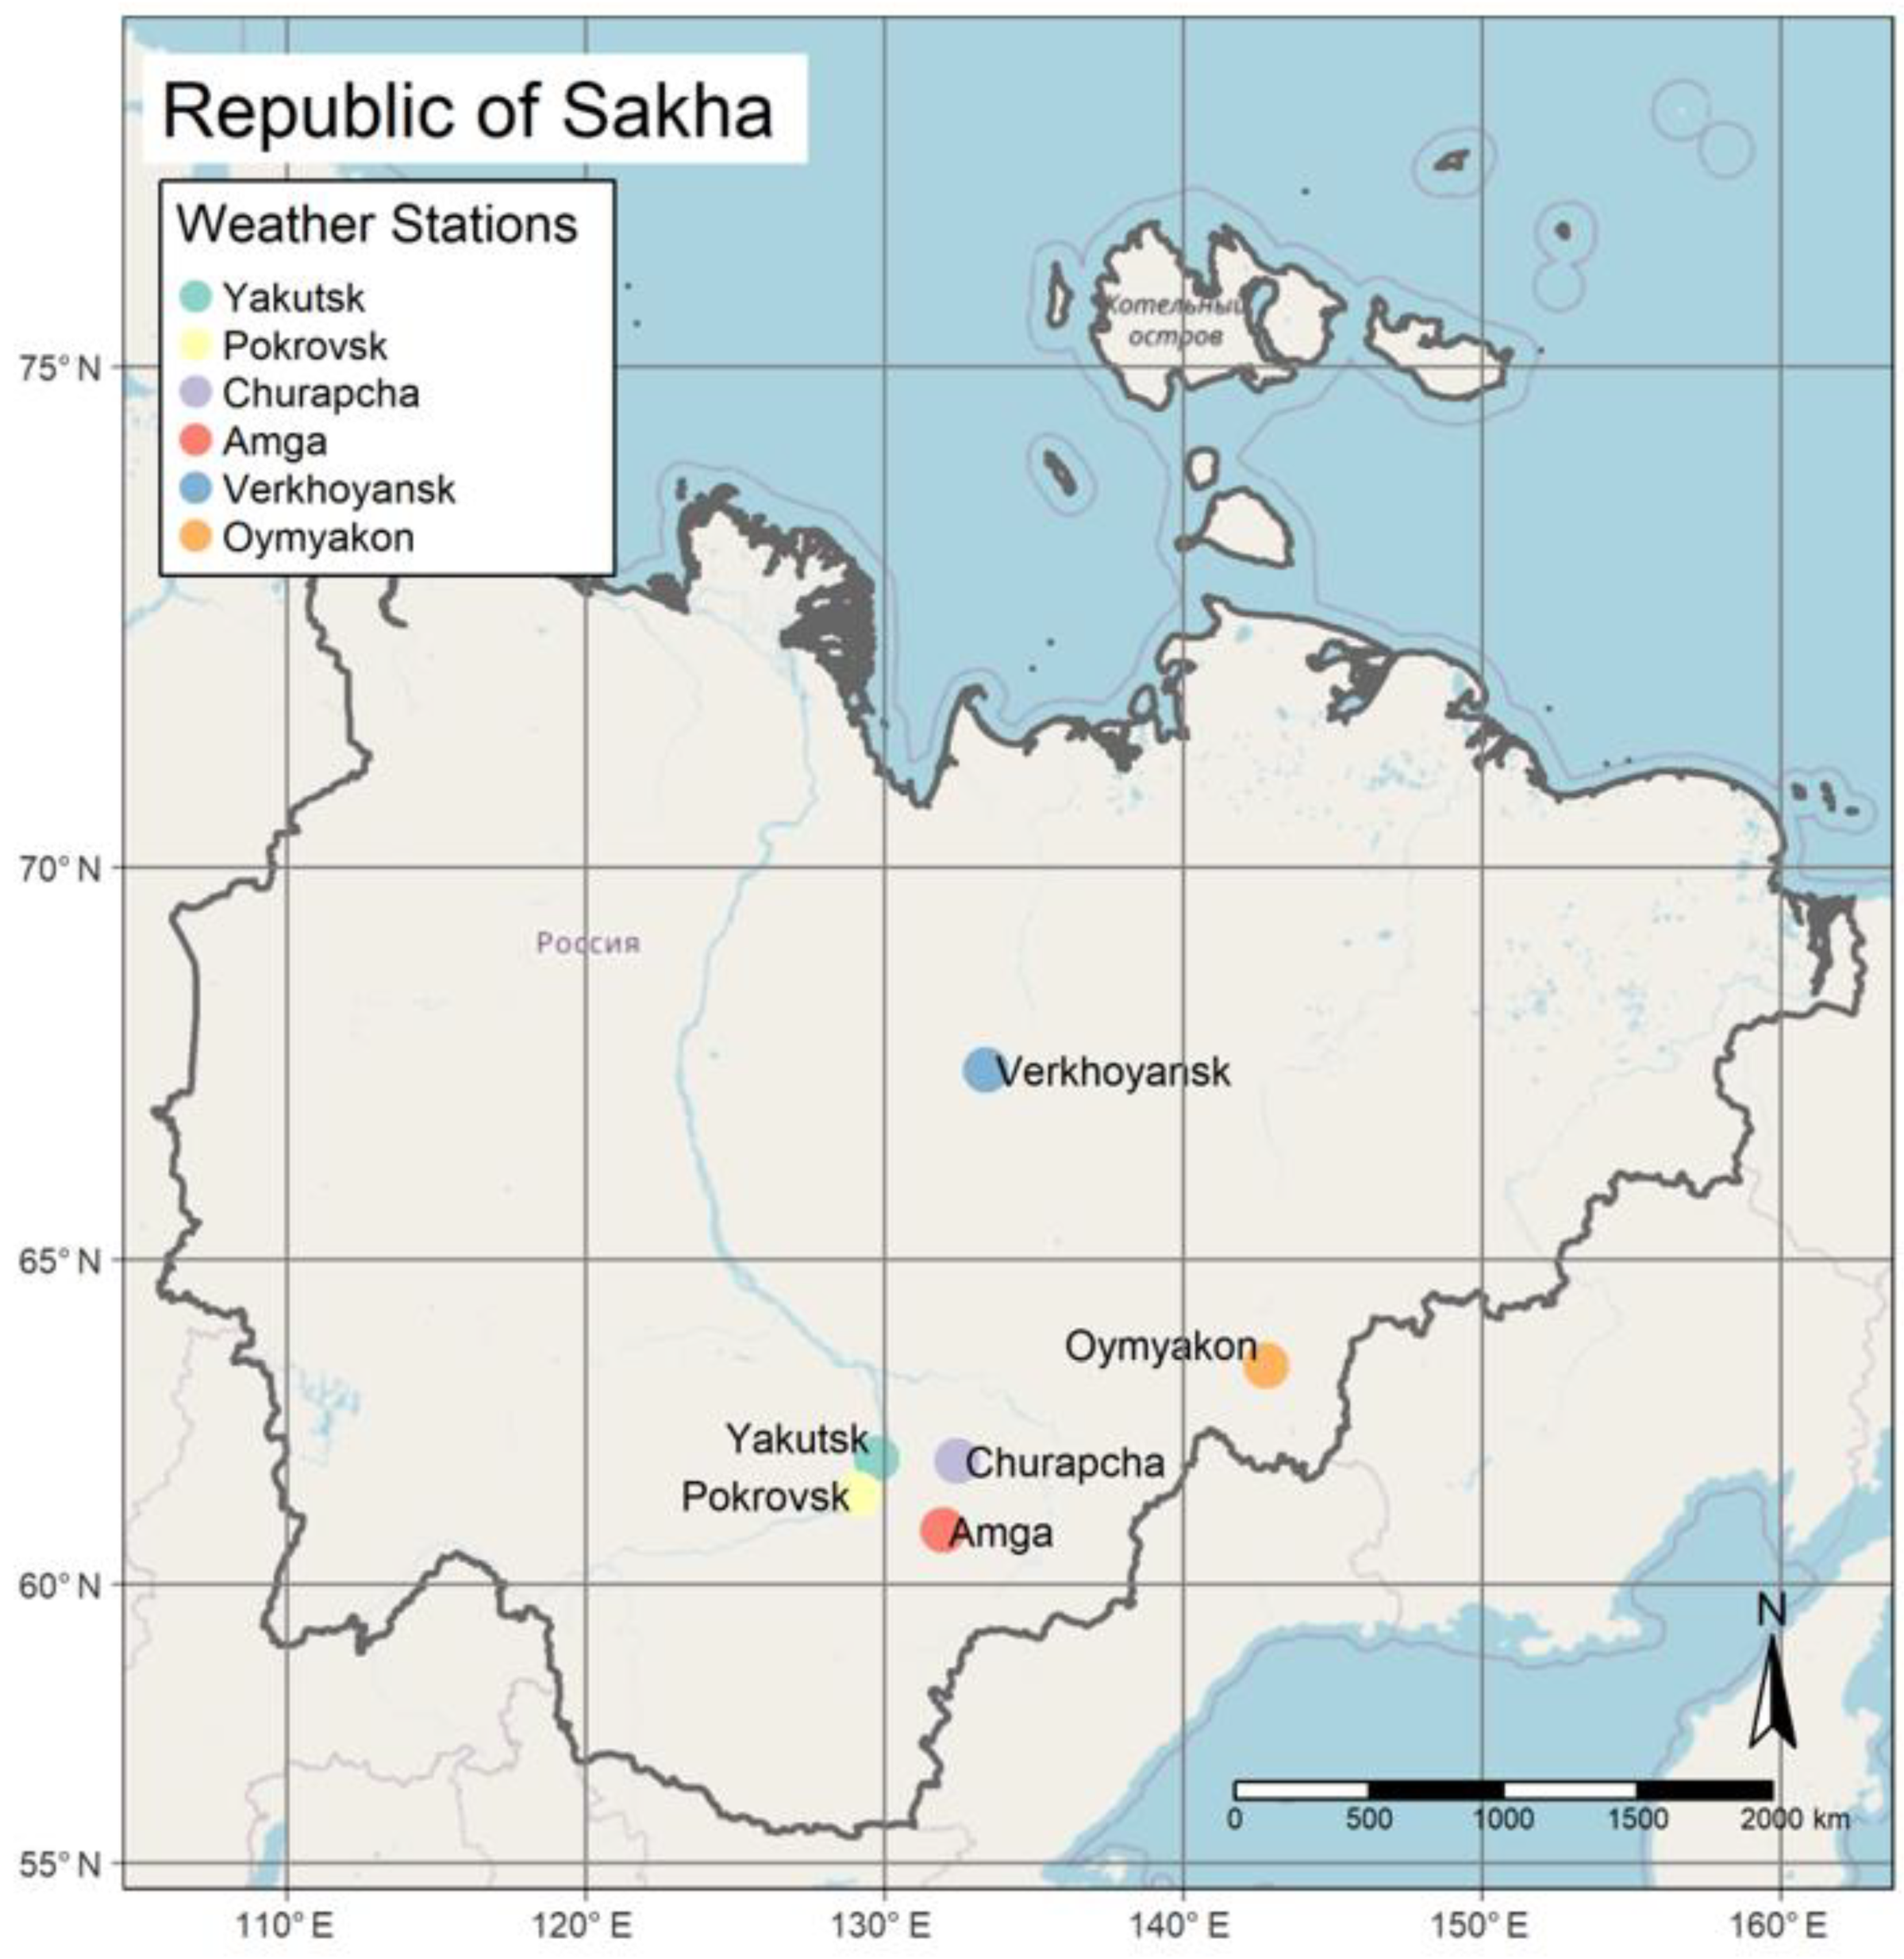
Figure 1. Map of the study area, Republic of Sakha in the Russian Federation. Filled circles indicate locations of the weather stations from which meteorological data was obtained.
Atmosphere 12 00233 g001
Figure 2. Time-series of the annual average temperature between 1961 and 2018, observed at 4 weather stations in central Sakha (red) and 2 weather stations in northern Sakha (blue). Solid lines are fitted linear regression lines, with 95% confidence intervals.
Atmosphere 12 00233 g002
Figure 3. The difference in the average temperature (°C) between 1981–1982 and 2017–2018, for districts in the Republic of Sakha. Temperature was data obtained from ERA5 Climate Reanalysis. Darker red denotes a larger temperature increase.
Atmosphere 12 00233 g003
Figure 4. Changes in monthly temperature between 1981–1982 and 2017–2018, for the districts Verkhoyanskiy rayon and Yakutsk gorsovet in the Republic of Sakha.
Atmosphere 12 00233 g004
Figure 5. Scatter plot showing the increase in reported tick bite cases between 2000 and 2018 in the Republic of Sakha. The orange line and filled region show a linear regression line and 95% confidence interval. The regression line predicts an increase of 17.5 tick bites per year.
Atmosphere 12 00233 g005
Figure 6. Comparison between negative binomial models with different combinations of predictor variables (on x-axis), and number of tick bite cases as a response variable. The y-axis shows the model fit (Akaike’s Information Criterion). Red circles indicate models where the climate variables were non-significant.
Atmosphere 12 00233 g006
Figure 7. Polygons are districts in Sakha. Red color means the model over estimated the number of cases, green color means the model underestimated the number of cases. The numbers in the polygons are the number of observed tick bite cases in the corresponding year.
Atmosphere 12 00233 g007
Table 1. Regions of the Republic of Sakha (Yakutia), where tick bites were registered for the period between 2006 and 2018. In each cell, the number of cases are reported, with cases per 100,000 shown below it (according to Rospotrebnadzor of the Republic of Sakha).
Name of DistrictYears
2006200720082009201020112012201320142015201620172018
Yakutsk city9
3.8
3
1.2
2
0.8
8
3.0
5
1.8
11
4..1
13
4.7
23
8.0
11
3.7
21
7.0
33
10.9
33
10.7
15
4.7
Aldansky7
29.2
5
20.9
7
29.4
14
32.5
38
89.1
29
68.2
19
44.5
32
75.8
54
129.7
60
146.2
102
252.3
75
188.2
72
187.3
Neryungrinsky18
20.2
8
9.1
40
40.0
25
29.0
44
53.2
29
35.1
18
22.2
13
16.2
38
48.4
23
29.8
64
84.2
26
34.7
25
33.8
Suntarsky1
3.9
3
11.7
3
11.9
6
23.6
3
11.9
2
7.96
10
40.5
3
12.3
8
33.2
3
12.6
28
117.8
12
50.6
8
33.9
Khangalassky1
5.7
-2
5.8
3
8.8
-2
5.9
5
15.0
5
15.3
12
37.0
15
46.3
6
18.6
14
43.2
6
18.4
Nyurbinsky2
7.9
----2
7.9
4
16.0
1
4.1
3
12.2
-5
20.6
5
20.7
1
4.2
Lensky-6
15.6
12
30.4
11
28.3
14
35.2
18
45.4
19
48.1
25
64.1
21
54.6
24
63.3
35
93.6
79
211.6
77
207.7
Mirninsky-2
2.4
-1
2.3
3
3.9
2
2.6
1
1.4
4
5.6
1
1.4
4
5.6
9
12.5
1
1.4
1
1.3
Megino-Kangalassky-1
3.2
-----1
3.3
10
32.8
11
36.0
1
3.3
9
29.2
3
9.7
Olyokminsky--3
11.1
1
4.0
1
3.7
3
11.2
16
60.8
8
30.8
20
195.0
14
55.0
45
177.6
26
103.4
35
140.6
Tattinsky--1
5.9
-1
5.8
1
5.8
-3
18.3
2
42.3
9
54.9
5
30.6
5
30.6
-
Amginsky--2
11.6
3
18.7
--1
5.9
-7
41.9
26
155.9
9
5.4
19
113.6
6
35.9
Kobyaysky--1
7.3
2
15.2
-1
7.3
1
7.5
--2
15.5
-1
7.9
-
Gorny--1
8.7
---1
8.6
---2
16.8
1
8.4
1
8.4
Tomponsky--1
6.9
-----1
7.4
2
14.8
-3
23.0
-
Churapchinsky-----2
9.8
1
4.9
3
14.6
4
19.4
16
77.5
10
48.3
15
70.9
1
4.7
Ust-Maysky-----3
35.1
--1
12.9
2
26.2
3
40.8
8
109.7
2
26.8
Vilyuysky------1
4.0
1
4.0
1
4.1
1
4.1
1
4.0
1
3.9
-
Namsky-------1
4.3
3
12.8
1
4.2
1
4.1
3
12.3
-
Ust-Aldansky--------2
9.5
1
4.8
-4
19.2
1
4.8
Verkhoyansky----------1
8.8
--
Total in the Republic of Sakha44
4.6
28
2.9
75
7.8
74
7.7
109
11.4
105
11.0
110
11.5
123
12.9
199
20.8
235
24.6
360
37.5
340
35.3
254
26.3
Table 2. Estimates and confidence interval for predictor variables in negative binomial regression model with number of tick bite cases as response variable. All included parameters are significant at p < 0.01. All values are exponentiated to reflect true response.
Model ParameterEstimate2.5%97.5%
Intercept4.75 × 10−1761.55 × 10−2193.84 × 10−133
Average temperature (annual)1.751.591.93
Selyaninov’s HTC3.422.624.54
Year1.221.171.29
Publisher’s Note: MDPI stays neutral with regard to jurisdictional claims in published maps and institutional affiliations.