Article

Nitrous Oxide Emission from Grazing Is Low across a Gradient of Plant Functional Diversity and Soil Conditions

1
Grass and Forage Science/Organic Agriculture, Christian Albrechts University, 24118 Kiel, Germany
2
Council for Scientific and Industrial Research (CSIR), Animal Research Institute, Achimota, P.O. Box AH20 Accra, Ghana
3
Grass Based Dairy Systems, Animal Production Systems Group, Wageningen University (WUR), 6708 PB Wageningen, The Netherlands
4
Department of Agroecology, Aarhus University, 8830 Tjele, Denmark
*
Author to whom correspondence should be addressed.
Atmosphere 2021, 12(2), 223; https://doi.org/10.3390/atmos12020223
Submission received: 24 December 2020 / Revised: 30 January 2021 / Accepted: 3 February 2021 / Published: 6 February 2021
(This article belongs to the Section Air Quality)

Abstract

:
Nitrous oxide (N2O) emissions from pastures can vary significantly depending on soil and environmental conditions, nitrogen (N) input, as well as the plant’s ability to take up the N. We tested the hypothesis that legume-based N sources are characterized by significantly lower emission factors than mineral N based dairy systems. Therefore, this study monitored N2O emissions for a minimum of 100 days and up to two growing seasons across a gradient of plant species diversity. Emissions were measured from both grazed pastures and a controlled application of urine and dung using the static chamber method. About 90% of the simulated experiments’ accumulated N2O emissions occurred during the first 60–75 days. The average accumulated N2O emissions were 0.11, 0.87, 0.99, and 0.21 kg ha−1 for control, dung, urine patches, and grazed pastures, respectively. The N uptake efficiency at the excreta patch scale was about 70% for both dung and urine. The highest N2O-N emission factor was less than half compared with the IPCC default (0.3 vs. 0.77), suggesting an overestimation of N2O-N emissions from organically managed pastures in temperate climates. Plant diversity showed no significant effect on N2O emission. However, functional groups were significant (p < 0.05). We concluded that legume-containing pasture systems without a fertilizer addition generally appear capable of utilizing nitrogen inputs from excreta patches efficiently, resulting in low N2O emissions.

1. Introduction

Agriculture is susceptible to climate change, as global food systems are threatened by an increased risk of intra- and inter-annual yield variability due to the less predictable growing conditions [1]. In addition, it is a contributor to climate change by greenhouse gas (GHG) emissions. Among the GHGs, nitrous oxide (N2O) is about 265 times stronger in terms of the global warming potential compared with CO2 [2], as it destroys the ozone layer in the troposphere [3]. The N2O in the atmosphere is increasing linearly at a rate of 0.26% per year [4] and was estimated for the period 2007–2016 to be about 17.0 Tg N year−1 [5]. Agricultural soils are the foremost important contributor to the global anthropogenic N2O emissions (about 3.8 Tg N year−1) due to the mineral or organic fertilizer application [5]. Similarly, pastures emit N2O, as grazing animals return high loads of N (200 to 2000 kg ha−1 year−1) in urine and dung patches [6], which exceed the use capacity of grasslands. The excess N results in losses via leaching, volatilization, and N2O emissions [7]. Accordingly, pastures account for 86% of the net global N2O emissions from grasslands, and almost 2/3 of these are resulting from animal excretion [8].
Generally, N2O emissions from pastures are dependent on soil type, climate, N input, the sward composition, and grazing management [7,9]. Particularly, soil moisture and ambient temperature influence N2O emission significantly by modulating the microbial activity and transport of gases in soil [10,11]. Furthermore, soil moisture affects nitrification and denitrification processes [11,12]. Among the management factors, the N fertilizer application plays an important role [13]. External N additions might increase N losses from the ecosystems [14] due to the potential N oversupply and the relatively fast N mineralization beyond plants’ uptake rate. The external N fertilization use is restricted in organic production systems. Consequently, N2O emissions are elevated in conventional production systems using high N–fertilizers per area [15], compared to legume-containing grassland swards [16].
Generally, the use of diverse pastures containing forage legumes is a promising strategy for the sustainable intensification of livestock production in northwest Europe [17]. Multispecies pastures of different functional traits (particularly grasses and legumes) have the potential to provide ecological services, including the provision of primary productivity with fewer nutrient inputs due to the improved niche complementarity and inter-species facilitation, resulting in “overyielding” effects compared to monocultures [18]. Legumes derived nitrogen has the additional advantage, where it provides a continuous and hence more synchronized N flow to meet the plants’ requirements, thus reducing the N2O emission intensity [19]. The additional inclusion of herb species in the pastures can further increase both above and belowground biomass by increasing the share of deep-rooted non-leguminous species [20]. Besides, herbs, such as Plantago lanceolate, may reduce N2O emission losses from grazed grasslands [7,21]. Some plant species, such as Plantago lanceolata, may a the soil N cycling processes through root exudation of secondary plant metabolites, including biological nitrification inhibitors [21,22]. However, the soil-environment interaction effect might affect the degree to which plants mediate N cycling [23], and the potential of these species in mixtures is not yet fully understood [19]. Therefore, there is high uncertainty regarding the effects of the botanical composition of pastures on the GHG balance [24].
In accordance, recent studies [25,26,27,28,29,30] have reported low N2O-N emission factors (EFs) for urine and dung patches in improved grazing management systems, compelling the Intergovernmental Panel on Climate Change (IPCC) to revise the IPCC [31] default emission factor from 2 to 0.77% for wet temperate climates [32]. In this study, we assessed the applicability of the revised default N2O EF [32] to an organic dairy farm located on a sandy loam soil in northern Germany. Accordingly, we measured the N2O emission from three mixed grasslands differing in diversity, under real and simulated grazing conditions. To simulate the highest possible N2O emissions, we also measured N2O emission from an irrigated binary mixture. We explored the potential drivers of N2O emission at the site to better understand the factors affecting N dynamics to inform the development of site-specific mitigation strategies. Accordingly, we hypothesized that (i) grassland diversity affects N2O emission from pastures under grazing stress, (ii) botanical, environmental factors determine N2O emission from soils, and (iii) N2O EF for cow excreta deposited on irrigated pastures is lower for systems with the legume as a sole N source compared with the IPCC default.

2. Materials and Methods

2.1. Site Characteristics

The experiments were conducted from 2018 to early 2020 at the organic research farm Lindhof (54°27′ N, 9°57′ E; elevation 27 m above sea level) in northern Germany. The soils at the site belong to the Eutric Luvisol soil class [33], with a mean pH of 6.4. The soil texture comprised 13% clay, 26% silt, and 61% sand in the 0–30 cm soil depth, soil bulk density of 1.56 g cm−3, 1.45 mg kg−1 of NH4-N, 1.13 mg kg−1 of NO3-N, total N of 0.12%, and organic carbon of 2.2% (Appendix A, Table A1). The study was located in a region of high grazing intensity due to the well-distributed precipitation across the year. The long-term (1981–2019) mean temperature and annual precipitation of the site are 9.7 °C and 859 mm, respectively.
The grasslands consisted of a binary (prwc), a tertiary (prwrc), and a multispecies (prwrch)-sward, with two to three different functional groups (grasses, legumes, non-legume herbs). As previously reported by Loges et al. [34], the seed mixtures used were a binary mixture of 24 kg ha−1 perennial ryegrass (Lolium perenne PR) + 4 kg ha−1 white clover (Trifolium repens, WC) (PR + WC = prwc), a tertiary mixture of 24 kg ha−1 PR+ 2 kg ha−1 WC + 6 kg ha−1 red clover (Trifolium pratense, RC) (PR + WC + RC = prwrc), and a multispecies mixture of 16 kg ha−1 PR+ 1.5 kg ha−1 WC + 3 kg ha−1 RC that additionally contained herbs (1 kg ha−1 ribwort plantain (Plantago lanceolata) + 2 kg ha−1 of each chicory (Cichorium intybus), sheep’s burnet (Sanguisorba minor), caraway (Carum carvi), and 5 kg ha−1 birdsfoot trefoil (Lotus corniculatus) (PR + WC + RC + herbs = prwrch).
Previously, the site was used for arable cropping in a 5-year crop rotation until 1993 when it was converted to “Bio-land” (prohibiting the use of chemical fertilizers and pesticides) and subsequently managed as grassland (grass-clover mixtures). The grassland was managed in a mixed system (1–2 silage cuts followed by 3–4 grazing cycles by cattle). Two years before the start of the experiment, the site was ploughed to establish the pastures. They were managed organically and without any external nutrient input. Therefore, the legumes were the primary source of nitrogen supply.

2.2. Environmental Conditions

Weather parameters, including daily precipitation and soil temperature, were obtained from a meteorological station located within a 70 m radius of the experimental area. The daily maximum and minimum air temperature, daily precipitation, and water-filled pore space (WFPS) in the soils during the studies are shown in Figure 1. The mean annual temperature at the site was similar for 2018 and 2019 (10.3 °C) but 6% higher than the long-term average (LTA, 1981–2019). The mean soil temperature was relatively higher in summer compared with spring or autumn in both 2018 and 2019. In both experimental years, soil temperature following excreta deposition was a little below 10 °C in spring but rose quickly and was between 18–20 °C during summer excreta application, and decreased to about 15 °C during autumn excreta applications (Figure 1). Precipitation was 25% lower (647.4 vs. 859.2 mm) and 7% higher (922.4 vs. 859.2 mm) for 2018 and 2019, respectively, compared with the LTA. Whereas the spring of both 2018 and 2019 had 1.6–2 times higher precipitation relative to the LTA, their summers and autumn of 2018 had reduced (20–40%) precipitation compared with the LTA. WFPS ranged between 21.3–71.4% (mean ± SD; 43.5 ± 16.0) in the simulated grazing plots following the excreta deposition in 2018. Accordingly, the urine and dung patches experienced different environmental conditions after each excreta application event (Figure 1). Therefore, WFPS ranged between 58.2–86.8% (mean ± SD = 77.8 ± 7.7%) across seasons following the excreta application (Figure 1). Consequently, the mean WFPS was about 1.6 times higher for the irrigated pastures compared with the non-irrigated.

2.3. Experiments

Three experiments were conducted to test the hypotheses set out for the study. Experiment one was set up to quantify the N2O emission from the three diverse pastures (prwc, prwrc, and prwrch) under grazing stress. The measurements spanned the period of April 2018 to January 2020. The second experiment was simulated grazing trial which also started in 2018. Therefore, cow urine and dung with a known amount of N were applied to the three diverse pastures to establish their response to the N2O emission and to calculate the N2O emission factors (EF). The third experiment was also a simulated grazing trial established in April 2019 and was meant to establish the N2O EF under good soil moisture conditions (which the study site is known for), as 2018 was unusually dry. For this, only the binary mixture (prwc) was used. The pasture was irrigated using the sprinkler method to simulate rain at least a day before gas sampling each week, depending on the WFPS (i.e., when WFPS fell below 60%), to maintain adequate soil moisture for pasture growth and denitrification. The summary of the experiments, including the specific hypotheses, study design, and measurements are shown in Table 1.

2.3.1. Urine and Dung Collection, Handling, and Application

We collected dung and urine from dairy cows kept under confinement systems (fed conserved fodder and concentrates) to ensure an almost constant N content of dung and urine throughout the year. The urine and dung specimens were collected immediately after morning milking (~05:00 h). Urine samples were taken midstream after manual stimulation of the vulva, while faeces samples were collected as the animal defecated. Faeces and urine were homogenized and stored immediately under refrigeration (<4 °C) and were applied within seven days. When removed from the refrigerator, the urine and dung were allowed to attain ambient temperature before application. Homogenized and representative quantities of fresh urine and dung were applied once per measurement period (1 year or 100 days) in spring, summer, and autumn to avoid introducing new effects due to differences in excreta volume or mass [35]. Urine was applied at a constant rate of 8.8 L m−2 from a height of 40 cm and was expected to cover the entire collar by percolation [36], whereas each dung patch of 2.2 kg covered an approximate area of 0.041 m2. The timing of excreta application, N concentrations, and the total amount of N applied per ha are shown in Table 2.

2.3.2. N2O Sampling

We sampled gas fluxes using the closed static chamber method (Hutchinson and Mosier, 1981). This consisted of polyvinyl chloride (PVC) collar (h = 15 cm, d = 60 cm) installed to a depth of 10 cm into the soil on each replicate plot. The chamber was made of PVC, 30 and 40 cm high for grazed pastures and simulated grazing, respectively, with an internal diameter of 60 cm. In each sampling session, the chamber was deployed onto the plastic collar between 10:00 and 12:00 h [9], with the chamber-collar sealed with a rubber belt. One air sample was taken with a 30-mL polypropylene syringe from the chamber-top at 0, 20, 40, and 60 min after closure. The air sample in the syringe was transferred to 12 mL pre-evacuated glass vials (Labco, High Wycombe, UK), and stored for a maximum of 2 weeks before analyses.

2.3.3. Soil and Biomass Sampling

Each micro plot for gas measurement had a duplication adjacently placed to evaluate WFPS, ammonium (NH4), and nitrate (NO3) concentrations in the top 25 cm of soil. At least six soil samples were taken in this duplicated plot within the first two months following the excreta application and at least once in the subsequent months, using a core sampler. The soil samples were stored immediately at −17 °C until further processing. The biomass was harvested from the rings and micro-plots and was in synchrony with the grazing cycle in experiment 1. Harvesting was done by cutting all forage within each subplot at a 5 cm height from the soil surface. The total fresh matter (FM) weight of each plot’s biomass was recorded immediately after harvesting. After determining the fresh weight, two sub-samples (80–100 g) were taken, one for dry matter determination and nutrient analyses, while the second sub-sample was sorted into three functional groups (grass, legumes, and non-legume herbs).

2.4. Chemical Analyses

Urine and dung samples were analyzed in duplicates by dry combustion using the C/N analyzer (Vario Max CN, Elementar Analysensysteme, Hanau, Germany) to determine total carbon and nitrogen concentrations, using helium as a purge and carrier gas. Two sub-samples of dung were dried at 60 °C to determine the dry mass content. Biomass sub-samples were oven-dried to a constant weight at 55 °C to determine their dry-matter. The dried samples were then milled through a 1-mm sieve (Cyclotech mill, Foss analytical, Hilleröd, Denmark) and later used to determine the N concentration by near-infrared reflectance spectroscopy (NIRS) using a NIR-System 5000 monochromator (Foss Analytical, Hillerød, Denmark). Soil samples were extracted with 0.01 M CaCl2; NO3 and NH4 concentrations were determined photometrically, using a dual-channel continuous flow analyzer (Skalar Analytical Instrument, Breda, the Netherlands). We used 50–80 g of each soil sample to determine the gravimetric moisture by oven-drying the fresh samples at 105 °C to a constant weight. This index was used to correct for soil moisture and to calculate WFPS. The N2O concentration in the sampled gas was analyzed by gas chromatography (model 7890a, Agilent Technology Inc., Santa Clara, CA, USA) equipped with a 63Ni electron-capture detector. Helium was used as the carrier gas and argon-methane as the make-up gas. Three certified gas standards (300, 620, 1510 ppb) were measured regularly to determine the analytical precision (standard deviation of 10 repeated measurements <3 ppb). The gas chromatograph procedure used a detector temperature of 320 °C, a column temperature of 40 °C, and an injector temperature of 200 °C.

2.5. Calculations

We estimated biologically fixed N (BFN) using a model (Equation (1)) by Høgh-Jensen et al. [37]:
BNF   =   D M l e g u m e   ×   N %   ×   P f i x   ×   ( 1   +   P r o o t + s t u b b l e   +   P t r a n s s o i l   +   P t r a n s a n i m a l   +   P i m m o b i l e )
where DMlegume is the accumulated amount of legume shoot dry matter above the standard defoliation height; N% is the concentration of N in the dry matter of the legume (kg kg−1); Pfix is the fixed N2 as the proportion of total N in the shoot dry matter of the legume; Proot+stubble is the fixed N2 in the root and stubble as the proportion of totally fixed shoot N at the end of the growing period; Ptranssoil is the belowground transfer of fixed legume N2 located in the grass mixtures as the proportion of total fixed shoot N at the end of the growing period; Pimmobile is the fixed N2 immobilized in an organic soil pool at the end of the growing period as a proportion of fixed shoot N; Ptransanimal is the above-ground transfer (by grazing animals) of fixed legume N2 located in the grass in mixtures as the proportion of total fixed shoot N at the end of the growing period. To parameterize the model for N%, Pfix, Proot+stubble, Ptransoil, and Pimmobile, we used 0.0375, 0.845, 0.25, 0.15, and 0.315, respectively for swards with white and red clover, and 0.04, 0.80, 0.25, 0.25, and 0.38, for white clover only swards [37], Ptransanimal was set to zero. We considered the N applied, BFN, and annual deposition by precipitation (12.5 kg N ha−1; [38]) as the N input and N yield in harvested biomass as the N output. Patch residual N (PRN) was calculated as the difference between the N input and output [39]. This parameter indicated the available N liable to denitrification and nitrification losses, leaching, ammonia emissions, and immobilization.
Volumetric water content (VWC) was calculated as the product of the gravimetric water and soil bulk density (BD) (Table A1); and WFPS was calculated (Equation (1)) after considering VWC, the BD, and a particle density (PD) of 2.65 g cm−3:
WFPS = VWC 1 BD / PD   ×   100 %
We calculated NO3 and NH4 intensities in the 0–25 cm soil depth for 100 days sampling duration by submitting the daily NO3 and NH4 data to linear interpolation; the NO3 or NH4 intensity is an integrated measure of the accumulation of mineral N in the soil over time [27]. N2O-N fluxes were calculated for each treatment and replicate by linear regression between measured N2O-N concentrations and time [39]. Hourly (Equation (3)), daily, cumulative N2O emissions, as well as emission factors, were estimated according to methods described by Krol et al. [30]. The hourly N2O-N flux (μg m−2 h−1) was estimated by taking account of the slope (Δct) of the line that describes the concentration increase of N2O inside the chamber during the 60 min deployment; the temperature, pressure (assumed as 1 atm), and internal volume of the chamber (V); and the area of the micro plot delimited by the metal base (A); the molar weight (M) of N in N2O; and the ideal gas constant (R):
F ( hourly ) = ( Δ c Δ t ) × M   ×   P R   × T × ( V A )
Daily N2O-N emission (g ha−1 d−1) was calculated by multiplying the hourly fluxes by 24 h. The cumulative emission of N2O-N in each season (kg ha−1) was estimated by integrating the fluxes over each season’s monitoring period (area under the curve). The N2O-N emission factor (EF) was calculated using the IPCC [31] recommended method (Equation (4)), which only considered the amount of N applied. However, as all swards contained legumes, we also estimated N2O-N EF using (Equation (5)) based on the total N input (modelled BFN + N applied):
EF = N 2 ON Treatment N 2 ON Control N   applied ×   100 %
EF 1 =   N 2 ON Treatment / Control Total   N   input   ×   100 %

2.6. Statistics

We performed all the statistical procedures and produced all the graphs using R [40]. For Experiment 1, the effect of grassland diversity on N2O emission from grazed pastures was tested using a generalized linear model with the diverse grasslands as a fixed effect and the block as a random factor. For Experiments 2 and 3, N2O emission, soil, and biomass variables were analyzed using a mixed-effect model with grassland, the season of excreta application and excreta type or control as fixed factors and blocks and replicates as random factors, except for 2019 data where the season of excreta application and excreta type were considered as fixed factors and replicates as random factors. As described, the treatment factors were used to analyze all the variables in a full factorial arrangement. In each case, the adequacy of the model was assessed by examining the appropriateness of residual plots. Variables were log-transformed where necessary before the analysis to ensure a normal distribution of residuals. We separated the effective means at p < 0.05 with Tukey’s post hoc tests, using the “lsmeans” function of the “multcomp” package [41]. Regression tests (linear and quadratic) were performed to establish relationships between N2O emission/EFs and the measured/estimated variables. The best-fitted models were selected based on their Akaike information criterion (AIC) with a small sample second-order bias correction [42].

3. Results

3.1. Plant Yields, Botanical Composition, and Soil Residual N

All fixed factors (grassland diversity, the season of excreta application, and excreta type) had significant effects on the measured biomass yields and species compositions (p < 0.05), except for the herbs and unsown species, which were not significantly affected by the differences in seasons (Table 3). Whereas grass proportions in the swards decreased with the increasing diversity and legume proportions. In addition, BFN were highest, intermediate, and lowest for prwrc, prwrch, and prwc, respectively. The dry matter yield and herbage N were lower for the binary swards compared with the tertiary or the multi-species swards. The urine and dung application significantly affected most of the measured parameters but not the dry matter yield or herb proportions (Table 3).
Grass proportions and herbage N were highest, intermediate, and lowest for urine, dung, and the control plots, respectively. However, legume proportions and the resulting BFN were lowest, intermediate, and highest for urine, dung, and the control plots, respectively. The seasonal differences or time of excreta application significantly affected legume proportions, dry matter yield, herbage N and BFN (Table 3). Whereas, the legume proportion only differed between spring and summer excreta treatments, dry matter yield and herbage N differed significantly between the three seasonal treatments, being highest, intermediate, and lowest for spring, summer, and autumn, respectively. BFN was higher for spring treatments compared with summer or autumn.
Grassland diversity, the excreta application season and excreta type significantly affected (p < 0.05) N input, N uptake, and PRN (Table 3). N input was highest, intermediate, and lowest for prwrc, prwrch, and prwc, respectively. However, N uptake was lower for the binary swards compared with the tertiary or the multi-species swards, while PRN was only higher for prwrc than prwc or prwrch. Similar to the legume proportion and resulting BFN, N input was highest, intermediate, and lowest for urine, dung, and the control plots, respectively. N uptake was only higher for urine-treated plots compared with the control plots, while the resulting PRN was lower for the controls compared with urine or dung treated swards. N input and PRN differed significantly (p < 0.05) between the three seasonal treatments, being highest, intermediate, and lowest for spring, summer, and autumn, respectively, but N uptake was higher in autumn compared with summer or spring.

3.2. N2O Emissions

3.2.1. N2O Emissions from Grazed Pastures with a Gradient in Diversity

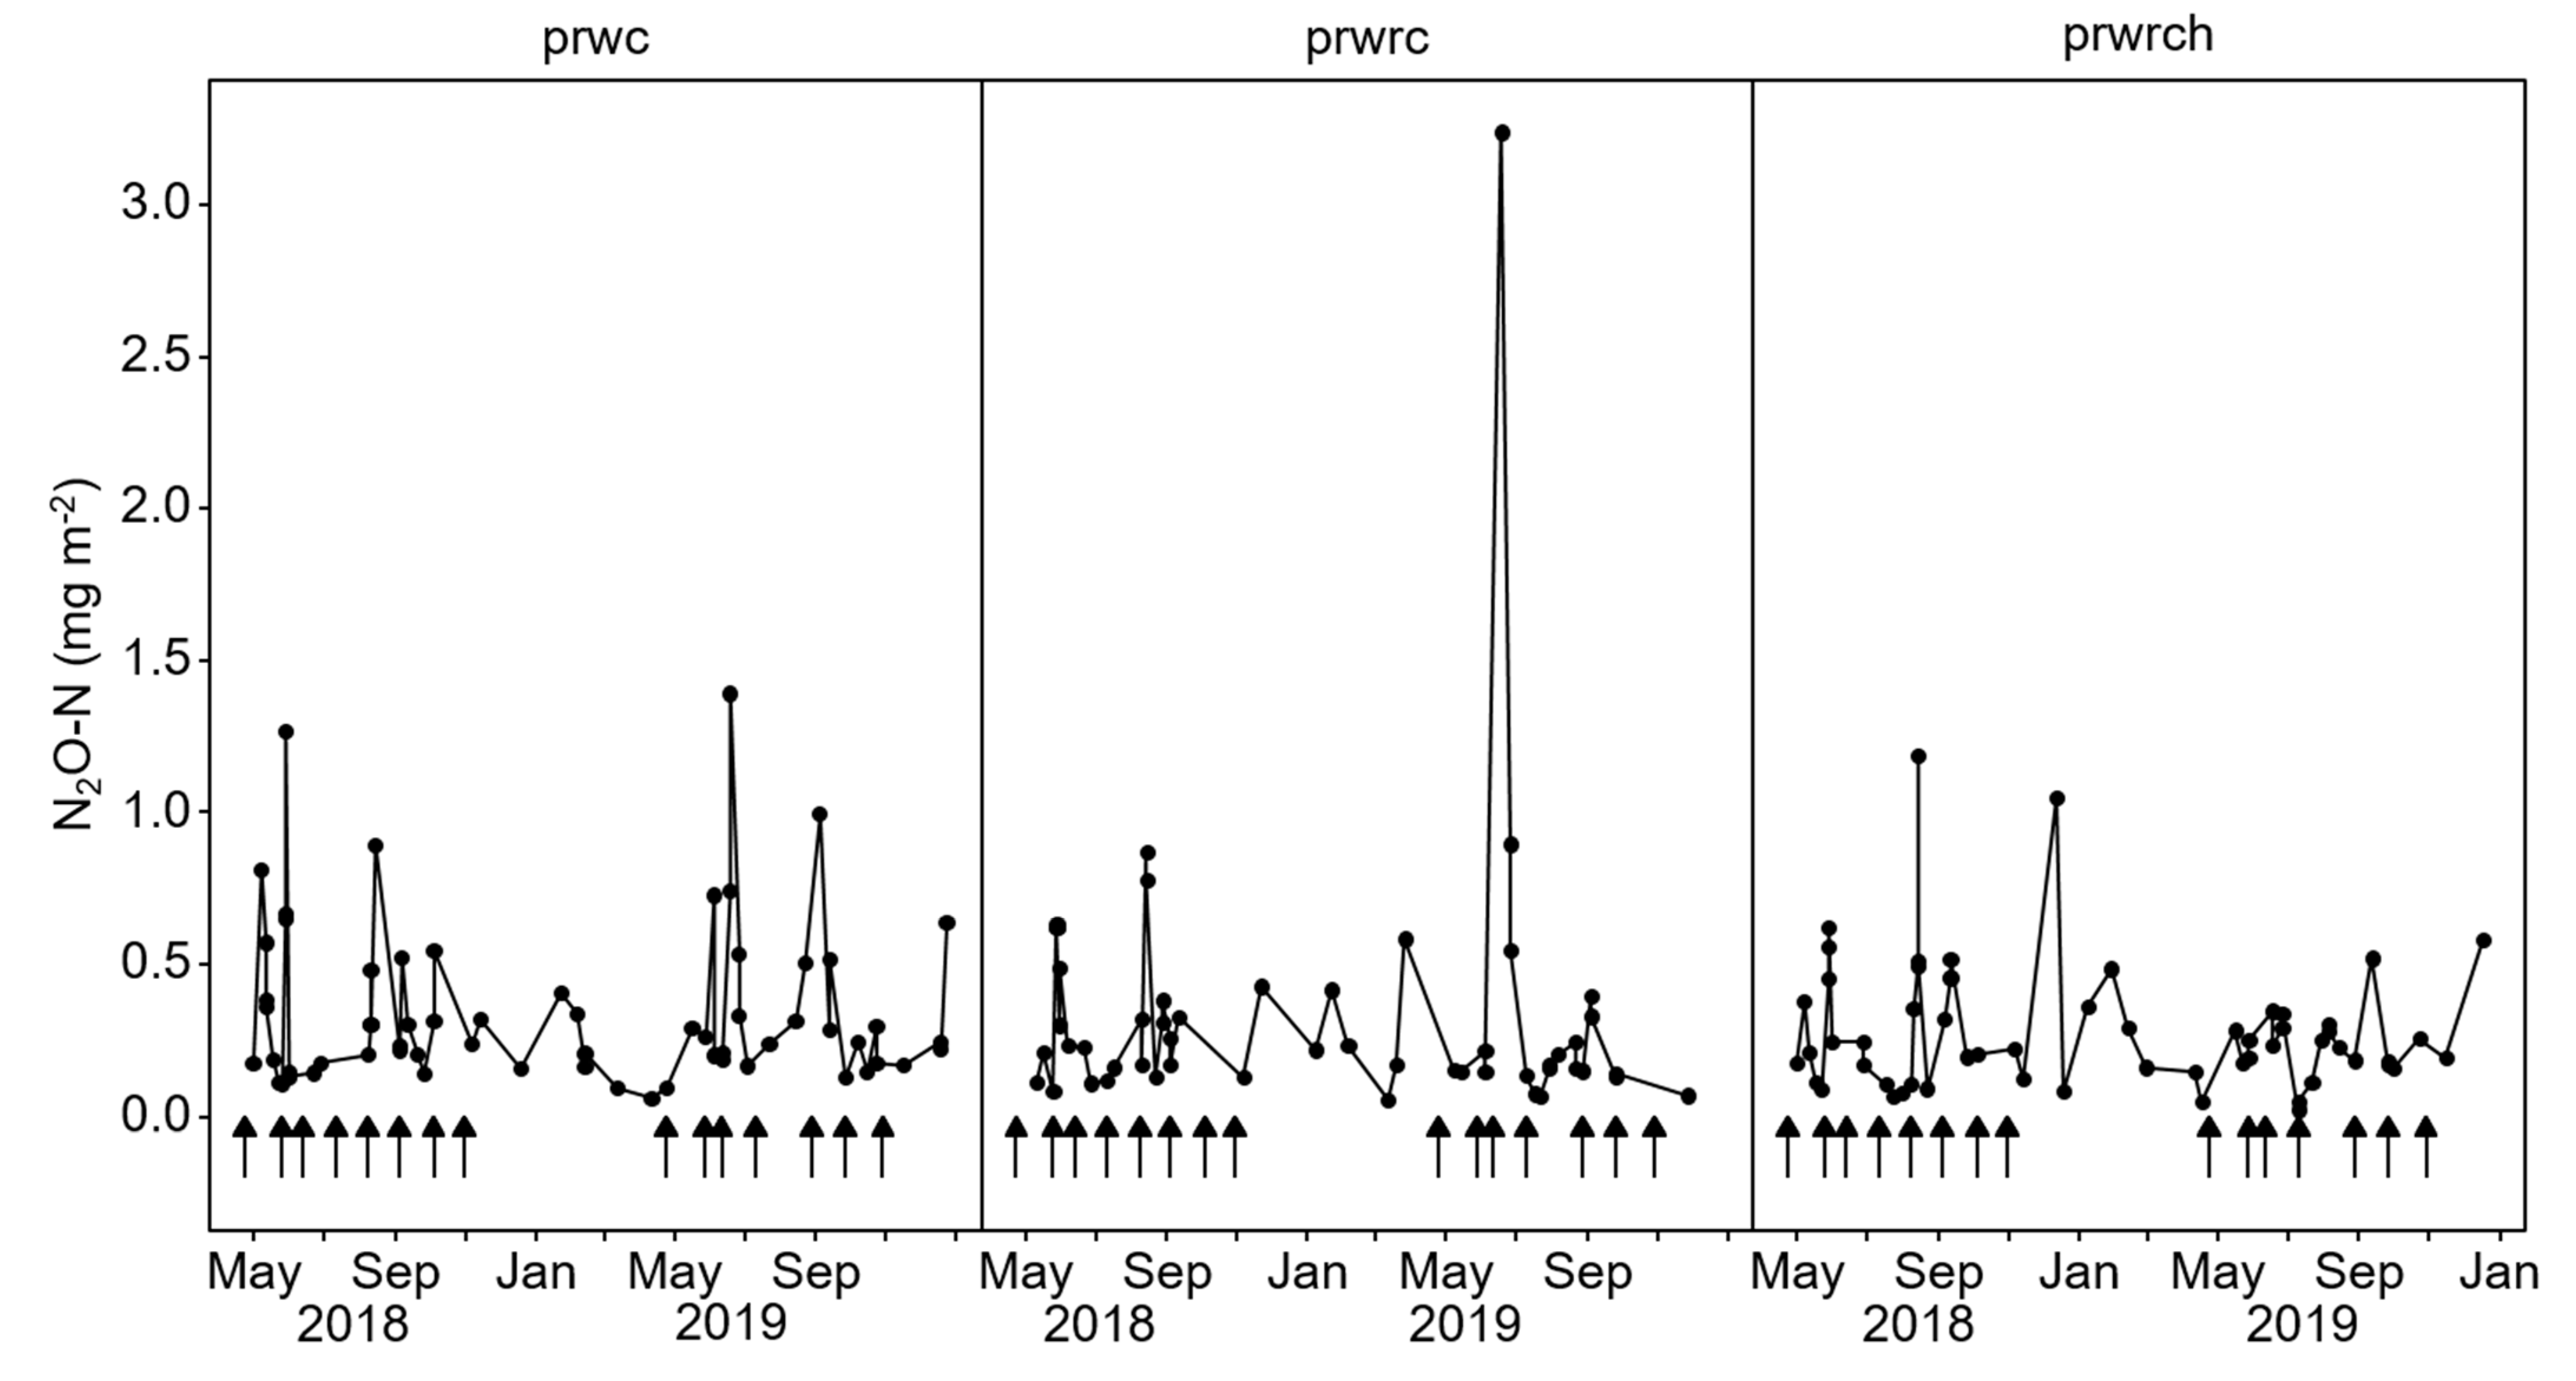
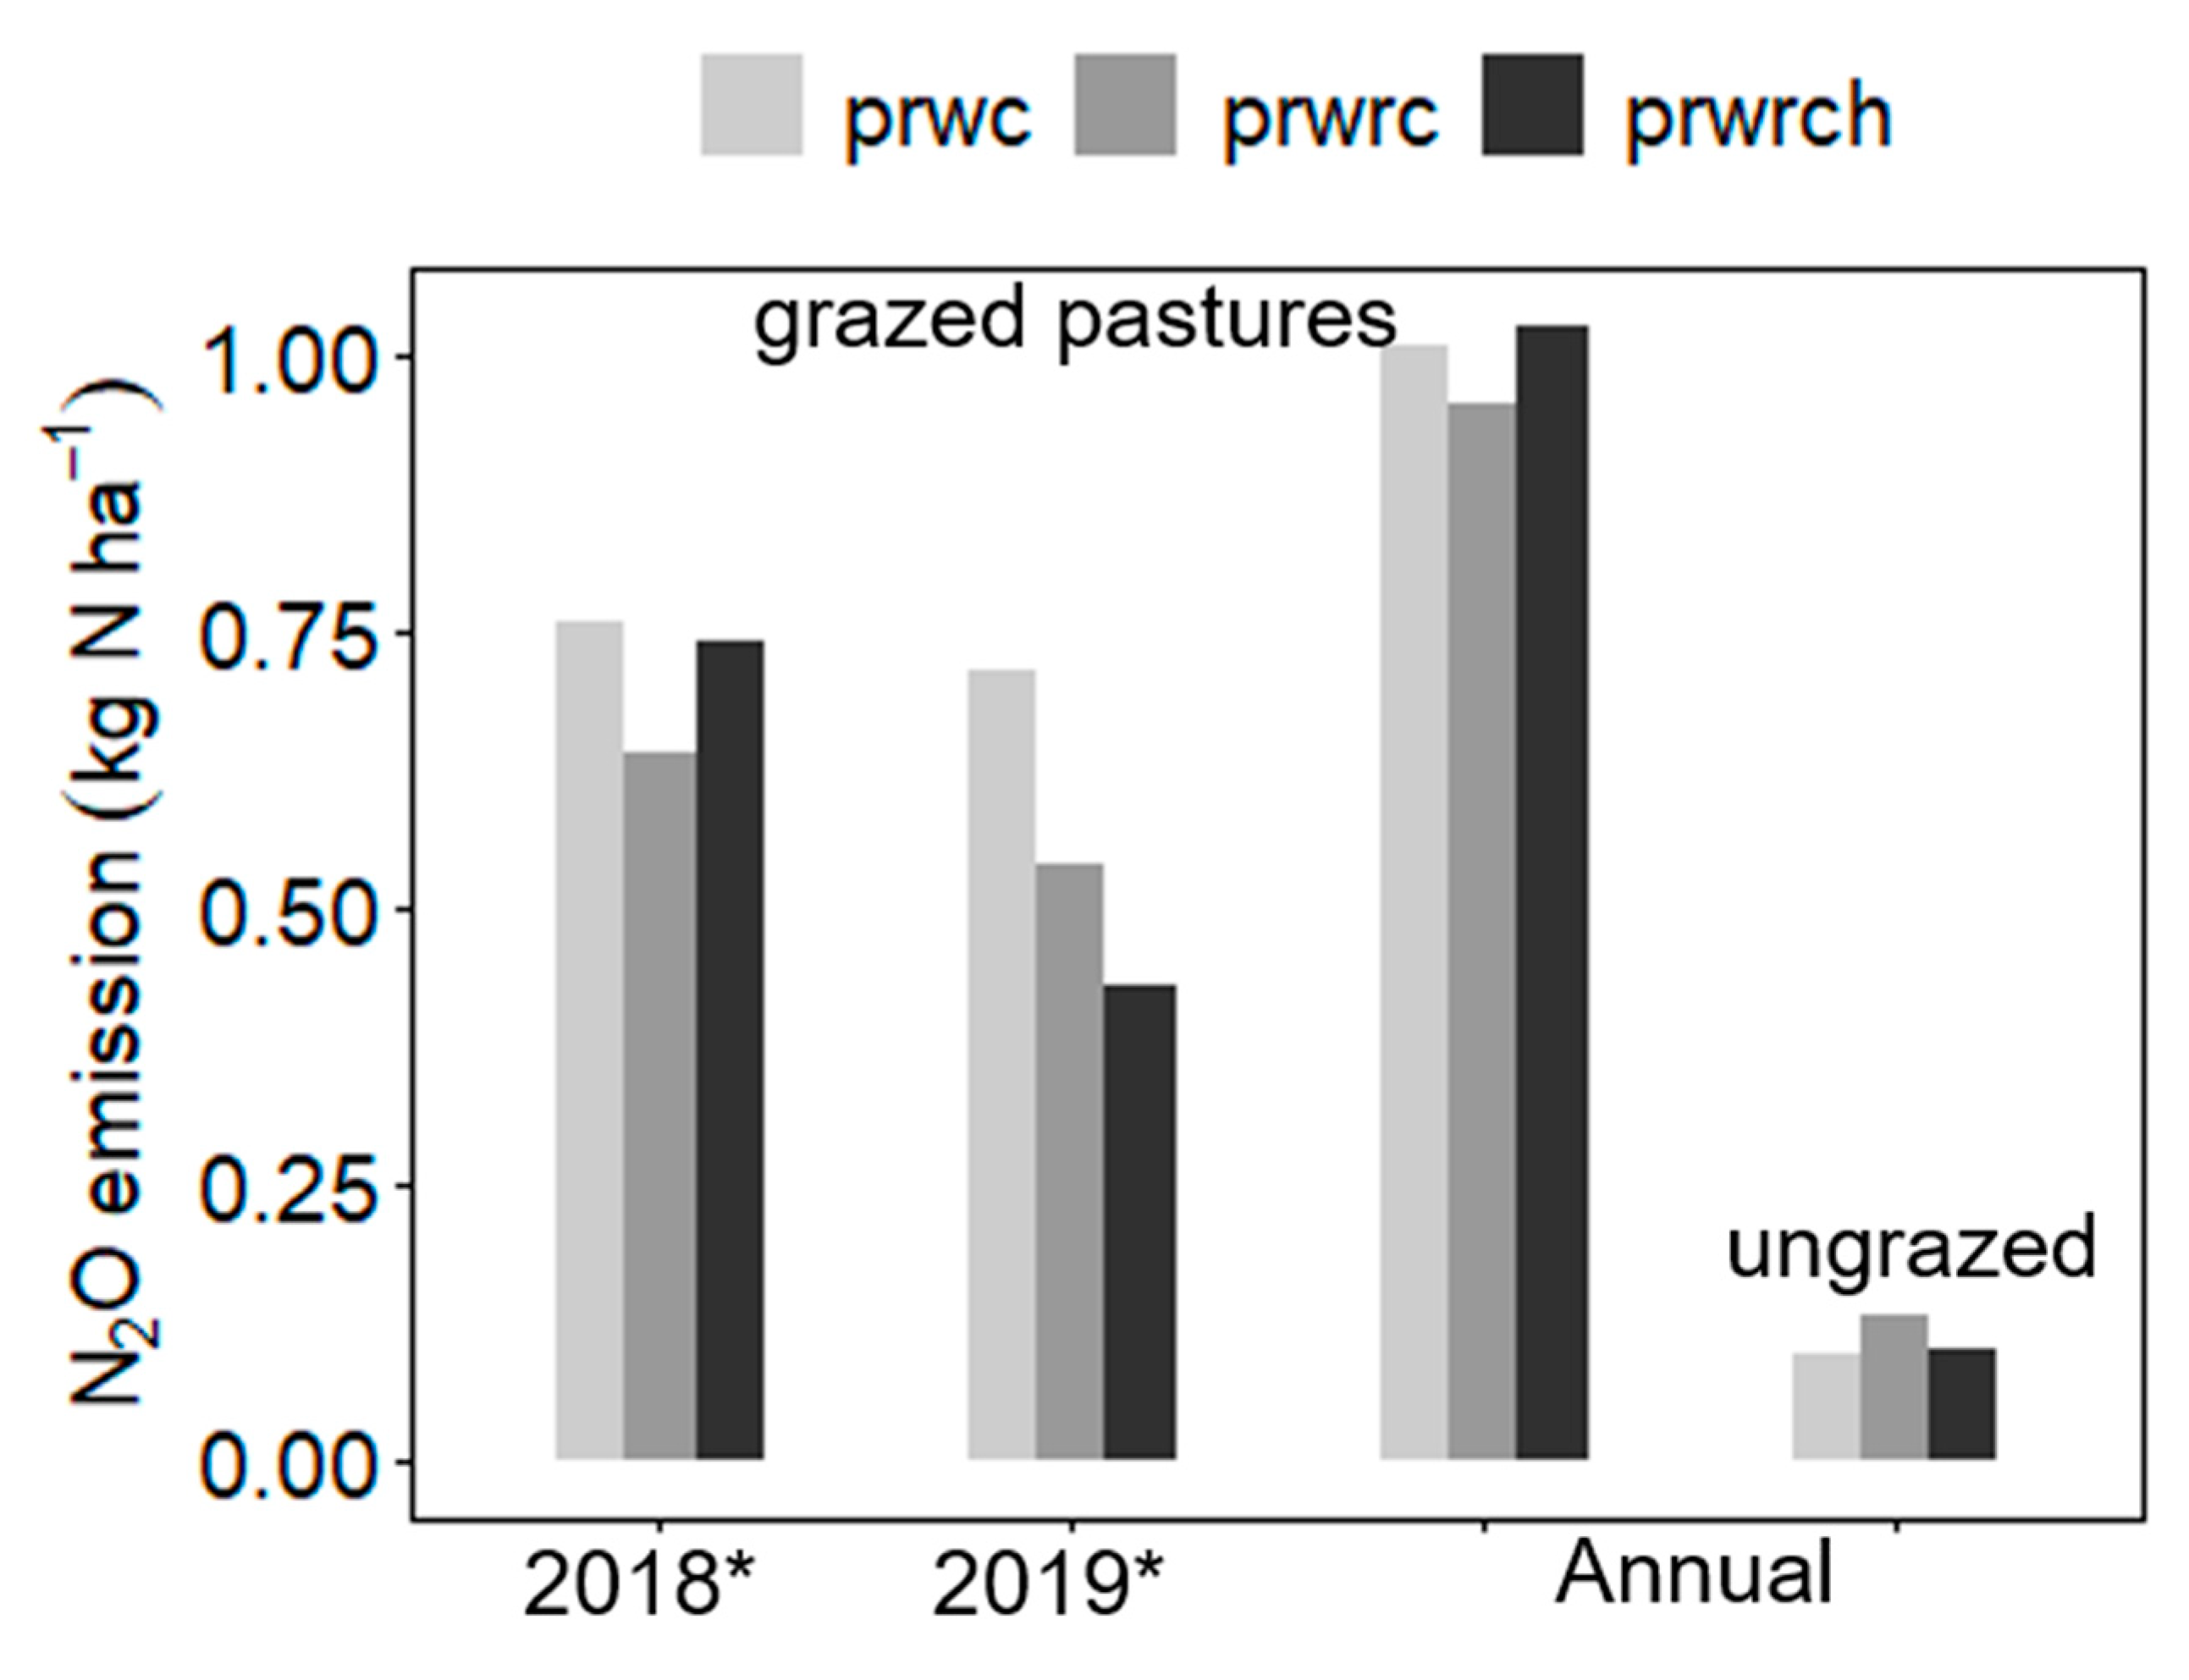
Daily N2O-N fluxes from the grazed grasslands (Figure 2) ranged from 0.04–3.24 mg m−2 d−1 (mean ± SD = 0.31 ± 0.33). The 8-month (May–December) mean(SD) flux was slightly higher in 2019 (0.35 ± 0.46) compared with 2018 (0.29 ± 0.23). Grassland diversity had no apparent impact on the daily N2O-N fluxes, except for 2019, where the highest peak was observed from the prwrc swards (Figure 2). The peaks usually followed precipitation events and appeared to occur a few days after a grazing activity. Despite no grazing events, some appreciable emissions (up to about 1.0 mg N m−2 d−1) also occurred during the winter months. The mean (±se) annual N2O-N emissions were 0.11 ± 0.01 kg N ha−1 and 1.0 ± 0.08 kg N ha−1 for the ungrazed and grazed pastures, respectively, with the differences between the pastures being insignificant (Figure 3; p > 0.05). The 8-month (May–December) average was slightly higher for 2018 compared with 2019 (0.71 ± 0.06 vs. 0.56 ± 0.11 kg N ha−1) with the differences between pastures and years or their interaction being insignificant (Figure 3; p > 0.05).

3.2.2. N2O Emission from Dung and Urine Patches (Simulated Grazing)

Temporal N Fluxes

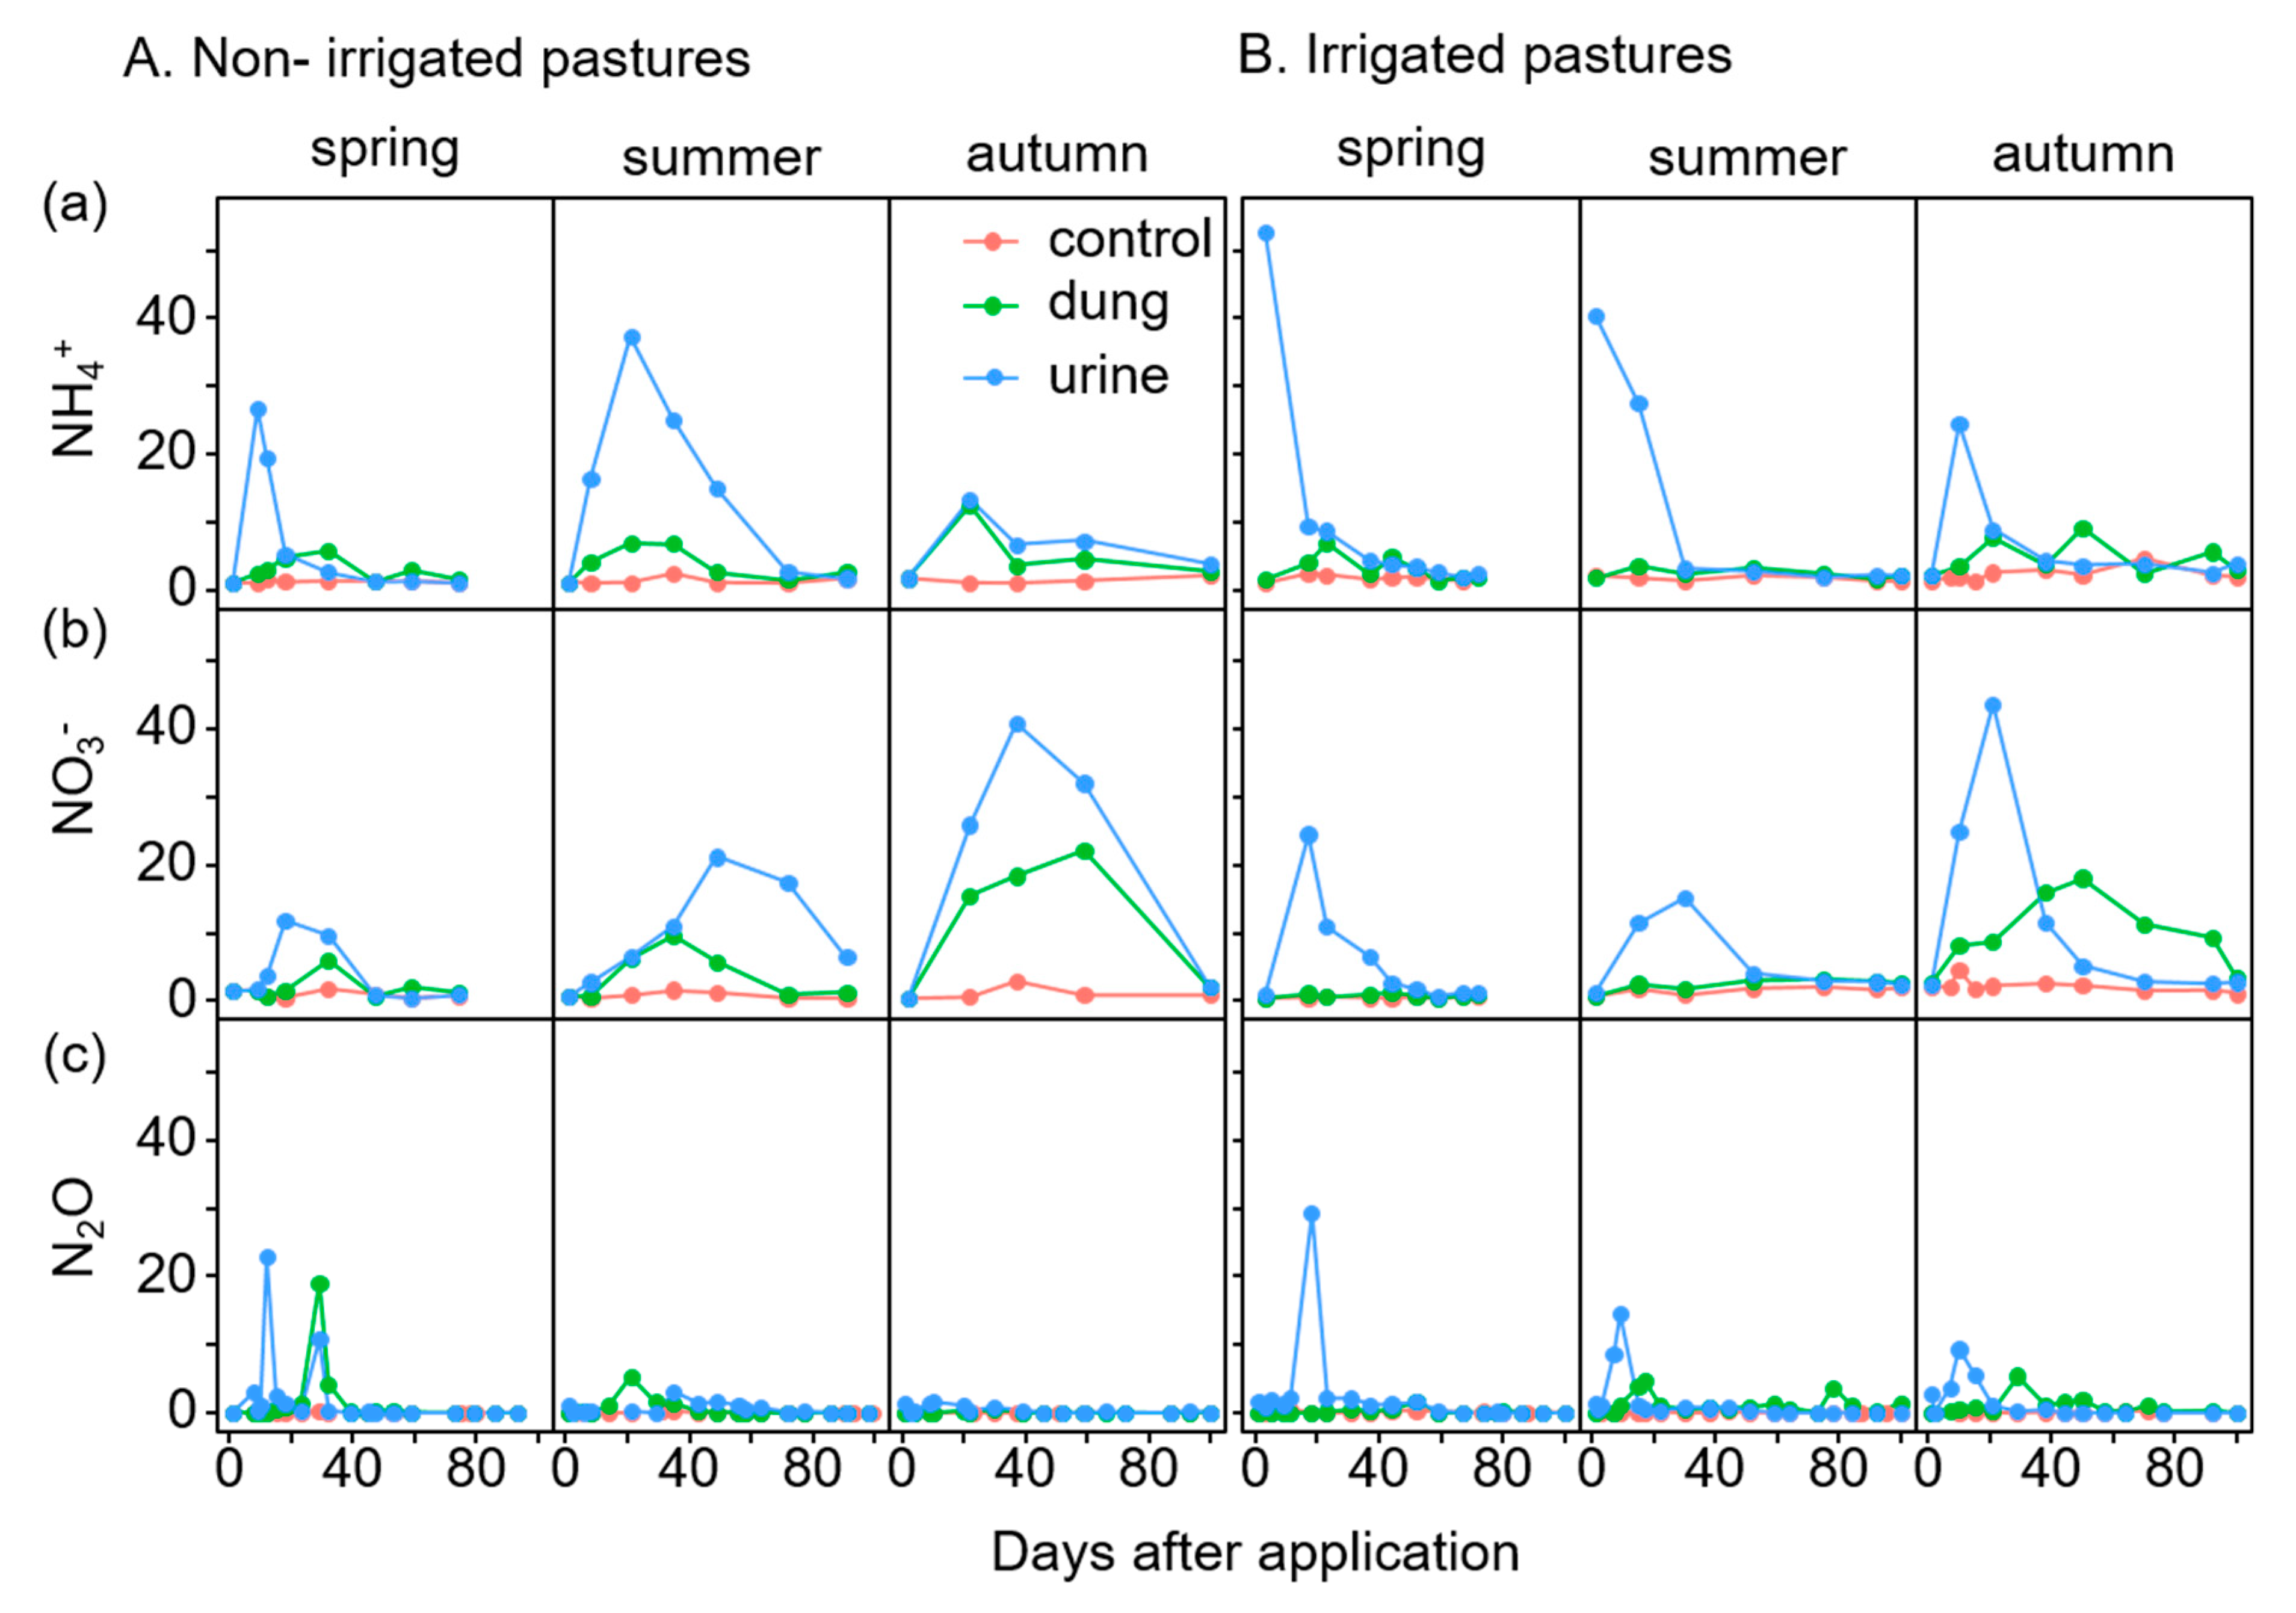
The excreta deposition increased the soil mineral N concentration in soils of both non-irrigated and irrigated pastures across seasons, being higher for urine compared to dung (Figure 4A,B). Each excreta application resulted within the next days in a large increase in soil NH4 and subsequently, in soil NO3, but with varying magnitudes depending on the season and excreta type (Figure 4). As expected, the incidence of NH4 peaks occurred earlier than NO3 peaks as urine is first transformed into NH4 and then into NO3. NO3 flux from spring-applied urine patches was higher for irrigated pastures compared with the non-irrigated ones. For the non-irrigated pastures, the summer application resulted in the highest and most extended peaks of NH4 concentrations when compared with spring and autumn (Figure 4A(a)). NO3 concentrations returned to background levels within the same timeframe as NH4 in spring but appeared to persist over a more extended period in summer and autumn (Figure 4A(b)). Daily N2O-N fluxes ranged between −0.2–24.2 mg m−2 d−1 with the highest peaks in spring from urine patches (Figure 4A(c)). The fluxes were back to background levels between 1–3 months, depending on the season (Figure 4A(c)). Subsequent fluxes following the excreta application in 2018, particularly in summer and autumn, coincided with precipitation events after the initial peak fluxes (Figure 1).
The highest NH4 peak from the irrigated pastures occurred in spring but with a shorter lifespan compared with the other seasons (Figure 4B(a)). NO3 concentrations in summer levelled to the background within the same time frame as NH4 (Figure 4B(a,b)). Whereas, NO3 concentrations in soils were affected by the excreta type and excreta deposition timing, NH4 concentrations were only affected by the excreta type (Table 3). Both NO3 and NH4 concentrations were highest, intermediate, and lowest for urine, dung, and control plots. NO3 concentrations were three-four times lower when excreta was applied in spring or summer than autumn (p < 0.05). Daily N2O-N fluxes ranged from −5–293 g ha−1 d−1 with the highest peak in spring from urine patches (Figure 4B(c)). Generally, peak N2O-N fluxes’ incidences were earlier from urine patches than from dung patches following the excreta application in all seasons. The fluxes were back to background levels between 1–3 months, depending on the season (Figure 4B(c)).

Cumulative N2O Emissions

The annual N2O-N emission from Experiment 2 (non-irrigated grasslands) following 2018 excreta applications ranged from 0.071–0.130, 0.288–1.69, and 0.515–1.70 g ha−1 d−1 for control, dung, and urine patches, respectively. All the N2O emissions were similar across grasslands, but N2O emissions were affected by the type of excreta or time of application (p < 0.05; Table 3; Appendix A, Table A2). Accordingly, cumulative N2O-N emissions were 8–10 times higher for urine or dung treatments than the control and were highest in spring, and lowest in autumn, with 420 and 230 g N ha−1 fewer emissions in summer and autumn, respectively. However, grassland and season or treatment interaction effects were not significant (p > 0.05; Appendix A, Table A2). In addition, N2O-N emissions per unit N uptake was significantly affected (p < 0.05) by the excreta type and season of excreta application (Table 3; Appendix A, Table A2). Accordingly, this parameter was similar for urine and dung but higher than the control, and was highest, intermediate, and lowest in spring, summer, and autumn, respectively.
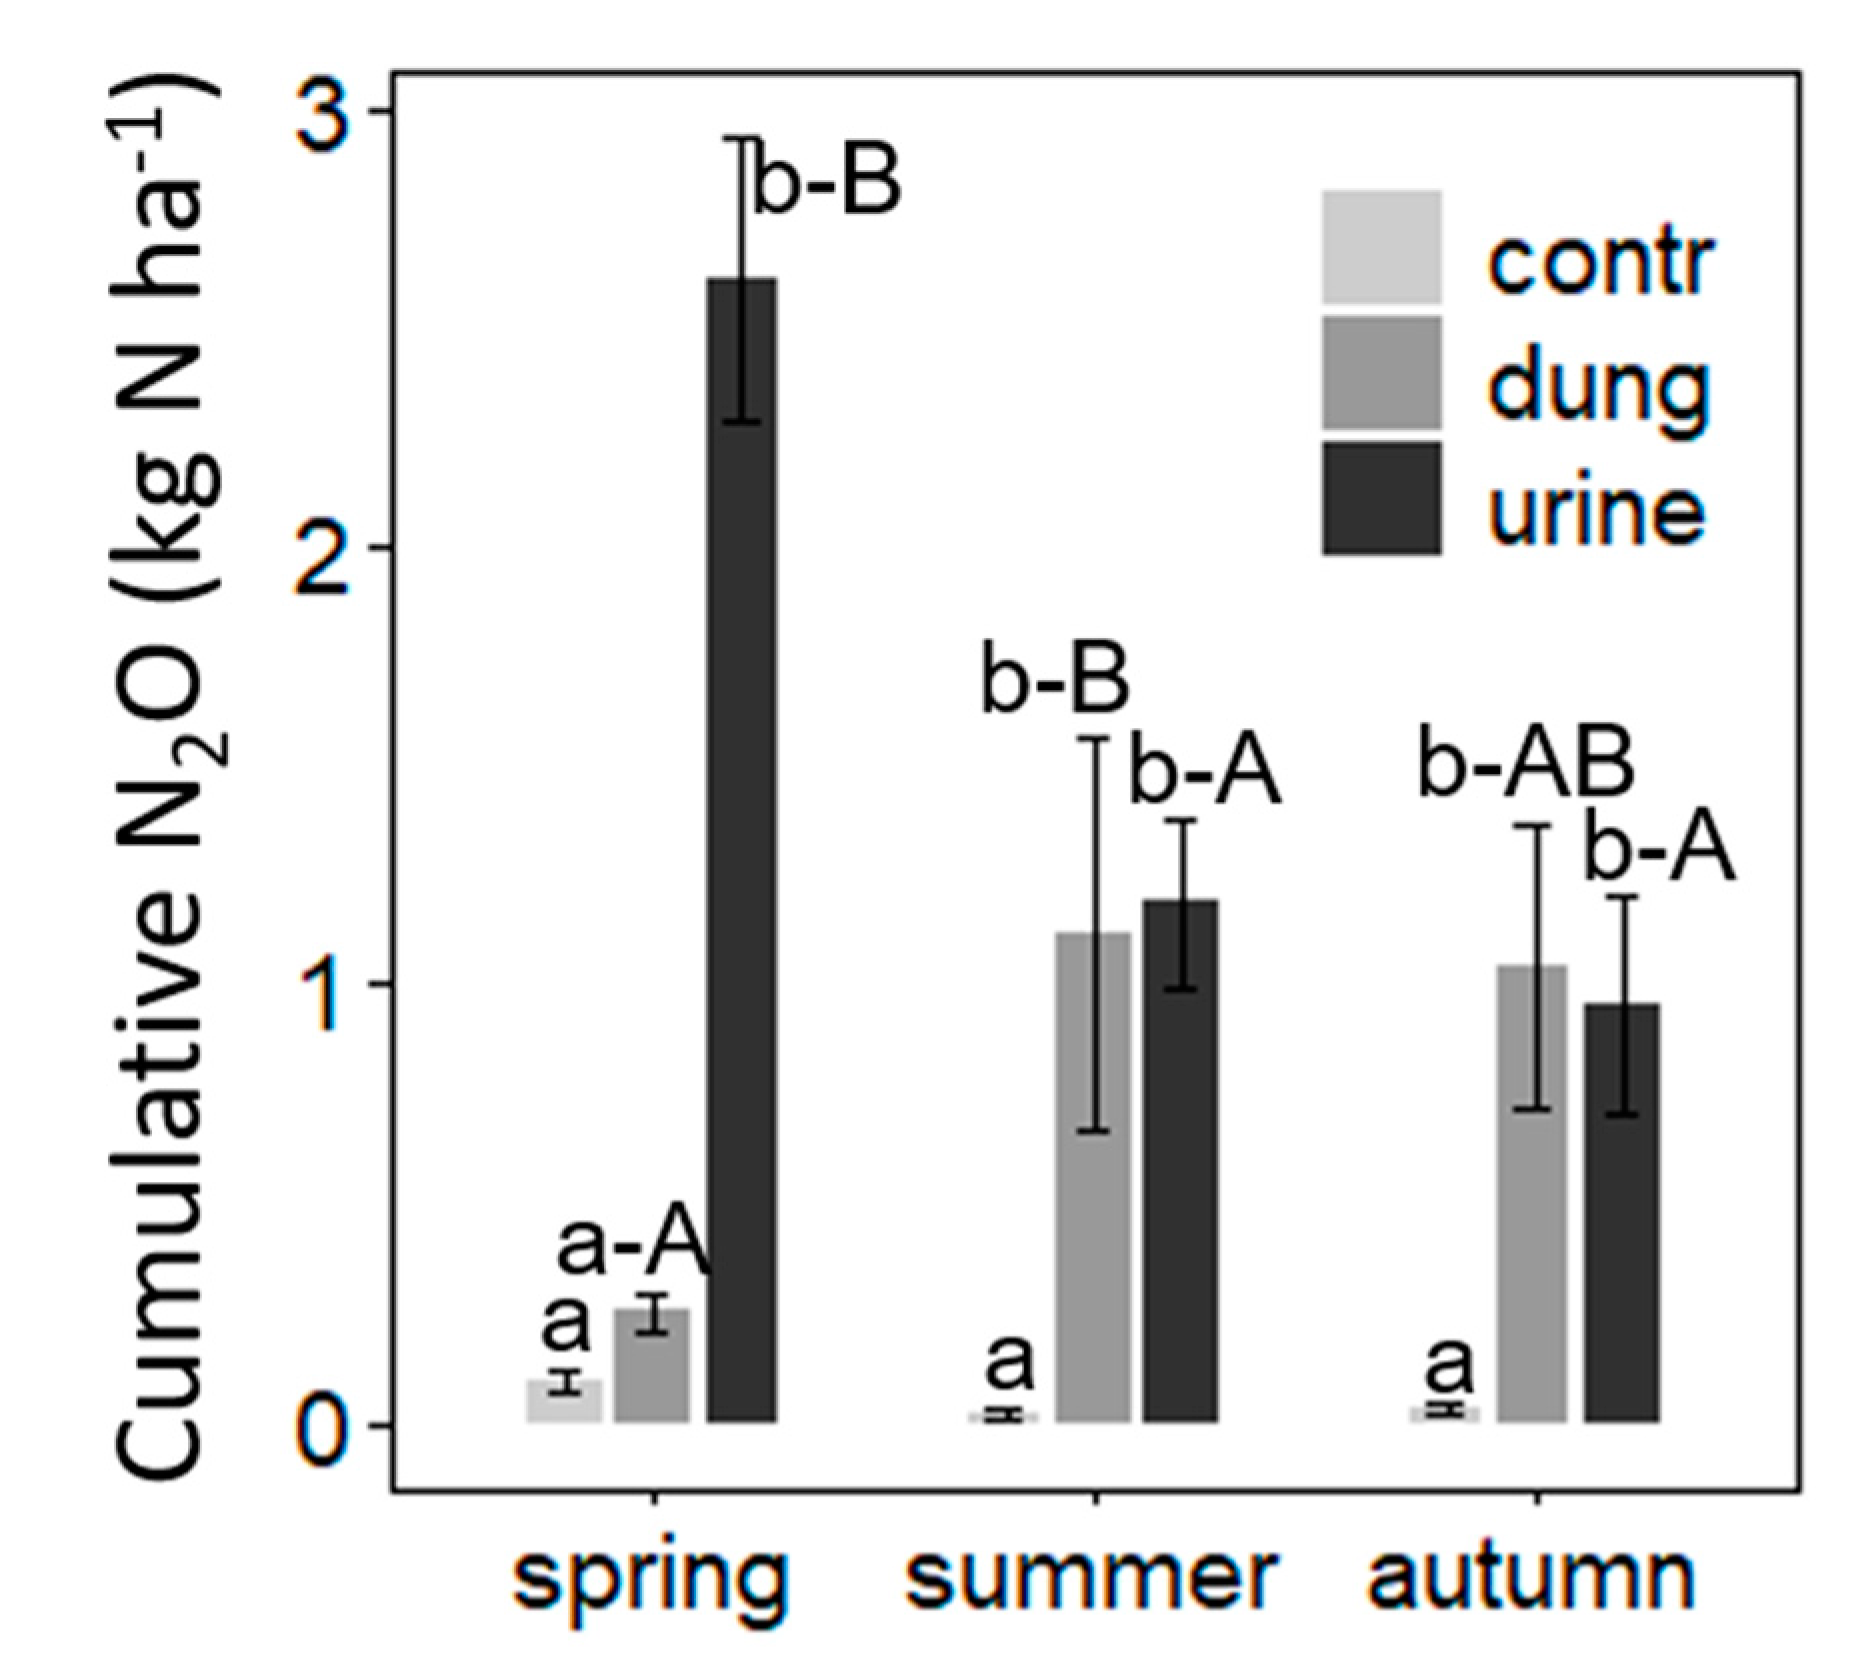
Cumulative N2O-N emissions from Experiment 3 (irrigated pastures, sampled for 100-days) ranged from 0.02–0.09, 0.256–1.118, and 0.958–2.615 kg ha−1 from control, dung, and urine treatments (Table 3) with mean ± SD of 0.81 ± 0.91 kg ha−1. The cumulative N2O-N emissions from non-irrigated similar swards and a similar sampling duration were 0.46 ± 0.55 kg ha−1 (mean ± SD). The cumulative N2O emissions were significantly (p < 0.01) affected by the treatment type and treatment- season interaction effects (Appendix A, Table A2). Therefore, whereas cumulative N2O emissions were higher for urine patches than dung in spring, the emissions were similar in summer and autumn but higher than the control plots (Appendix A, Figure A1). Whereas, cumulative urine N2O emissions were higher in spring relative to summer or autumn, the dung N2O emission only differed between spring and summer (Appendix A, Figure A1).

Drivers of N2O Emission

We fitted linear and quadratic models around the measured cumulative N2O emission from excreta patches using the botanical or soil N variables as predictors. For the non-irrigated pastures, an exponential model involving N input as the predictor variable explained 49% of the variations in annual N2O emission (Figure 5a). However, predicting annual N2O-N emissions using PRN (Figure 5b) yielded a relatively higher coefficient of determination (R2 = 0.77). The cumulative N2O-N emissions from the irrigated pastures were best described by the mineral N intensity across seasons, with a higher coefficient of determination for the NH4-N intensity than the NO3-N intensity (R2 = 0.84 vs. 0.65; Figure 5c,d).

N2O Emission Factors

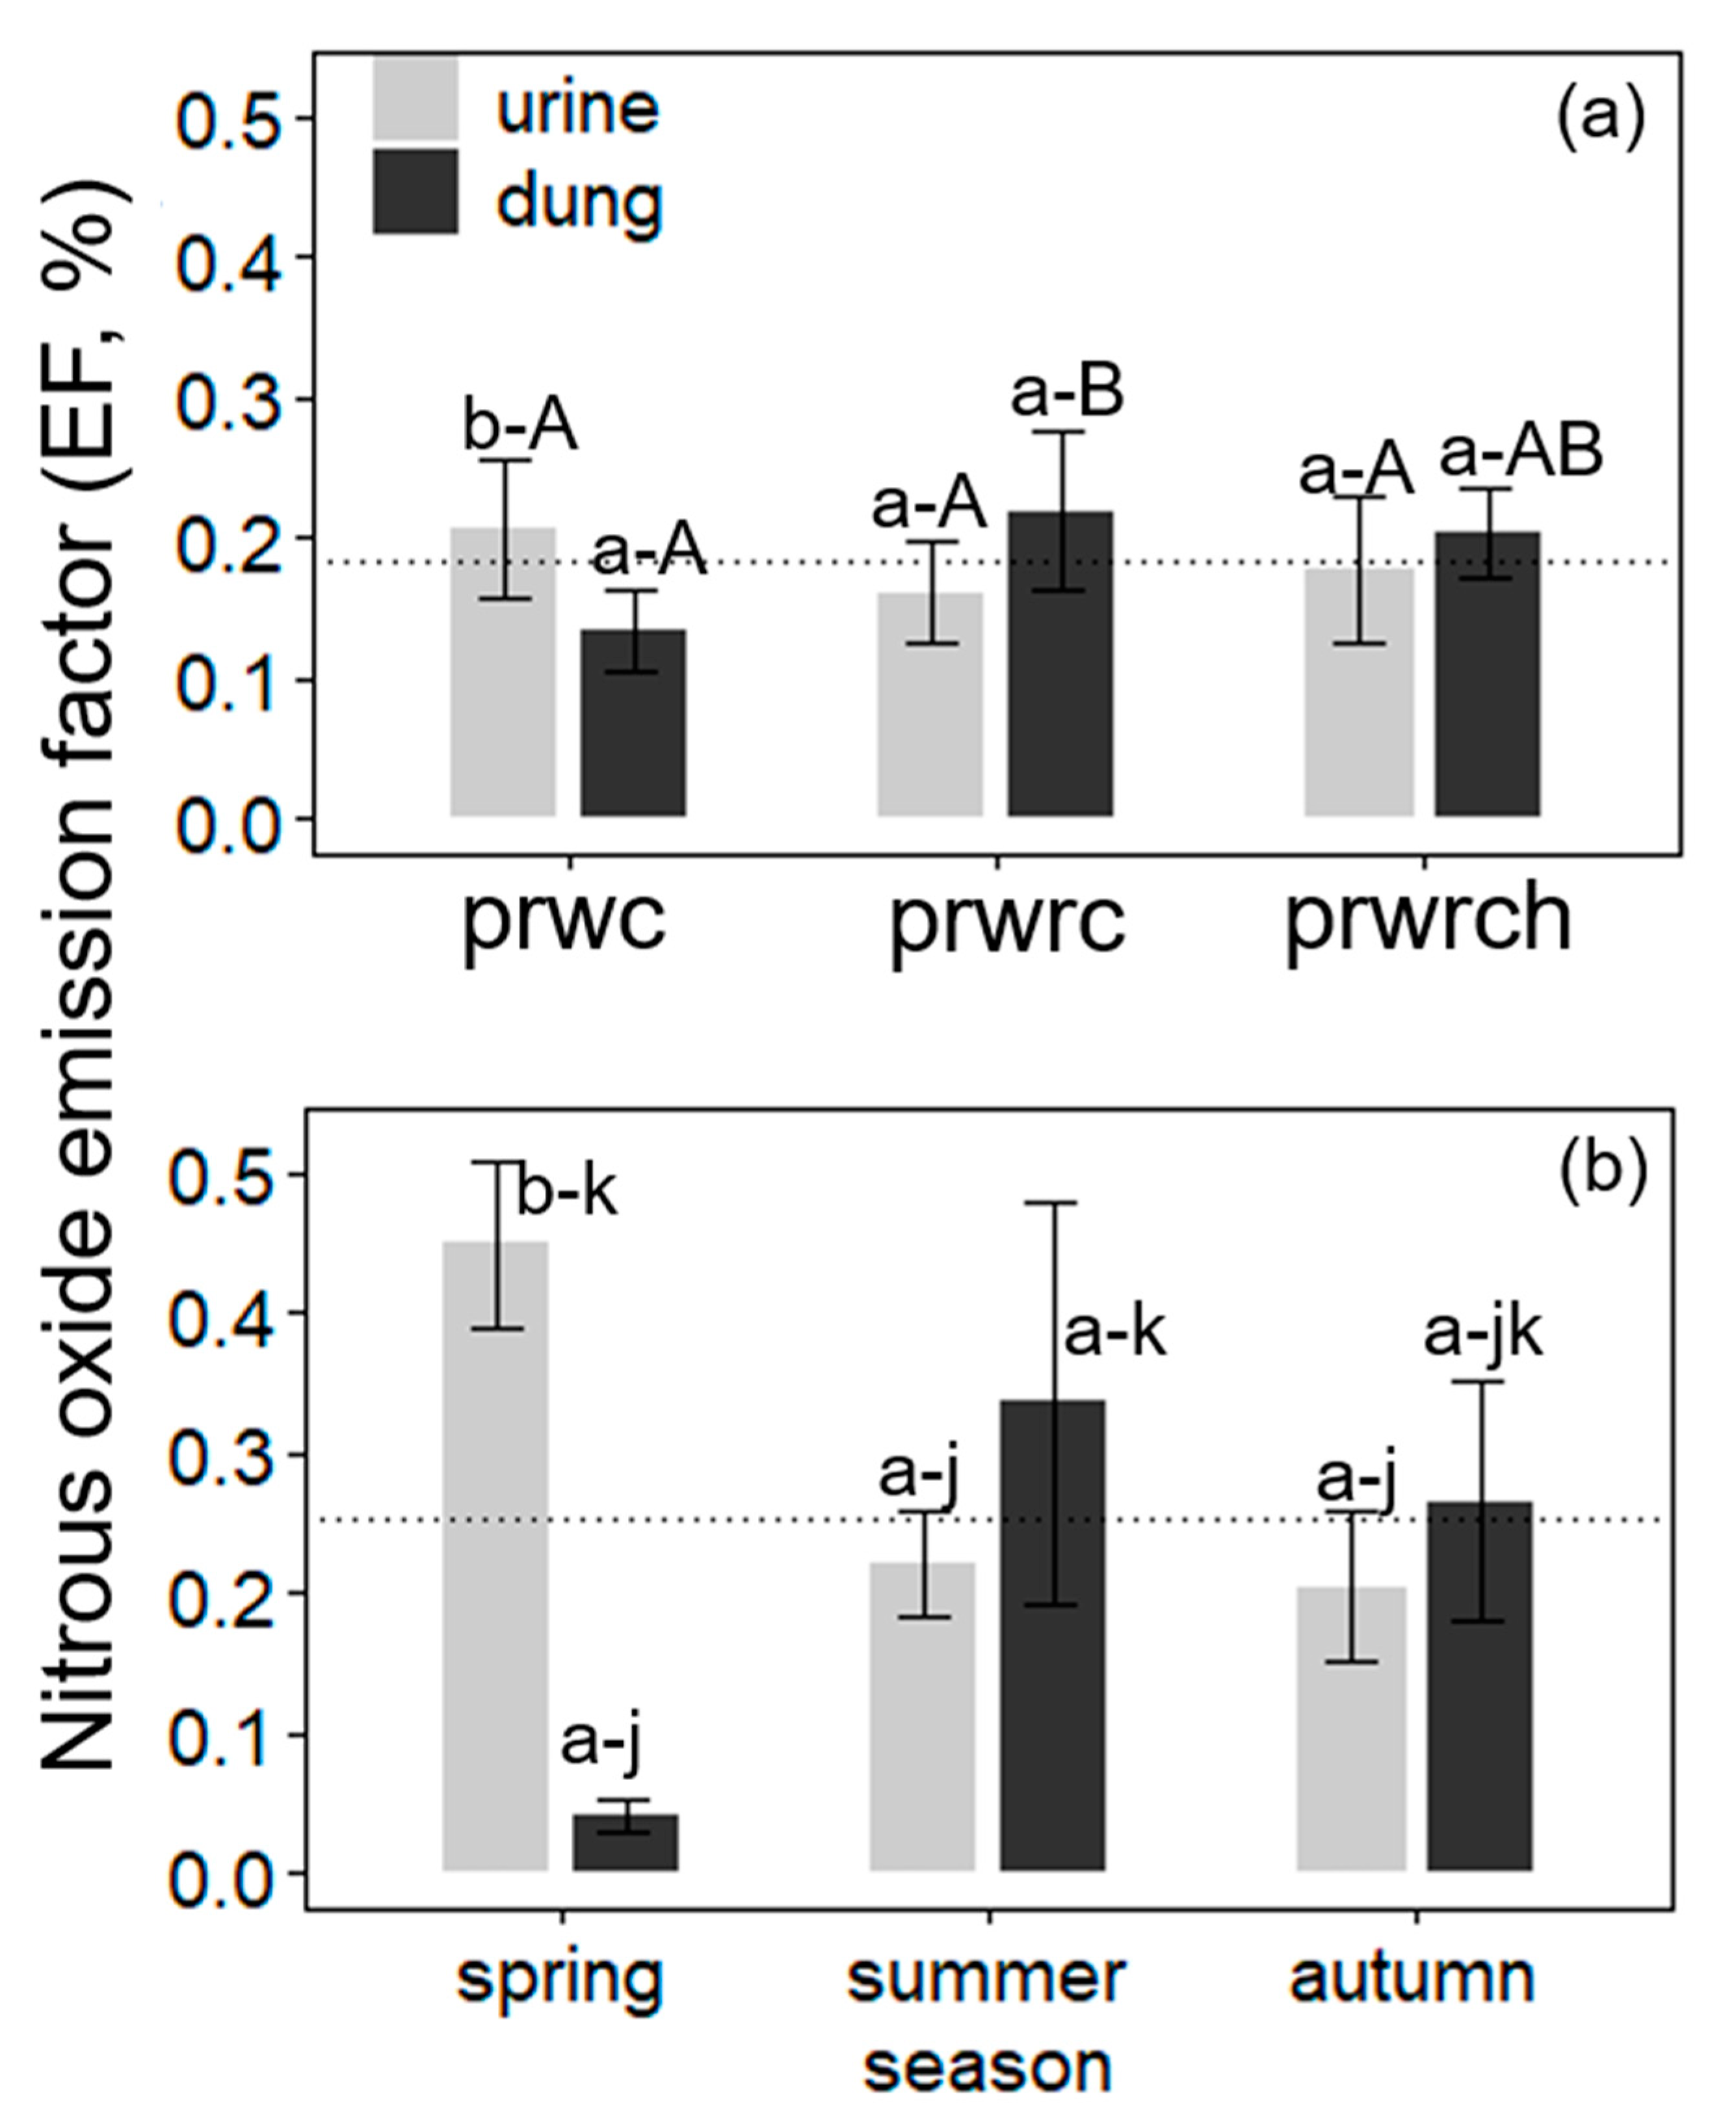
N2O-N EFs were calculated based on 100 days of sampling, higher than the IPPC recommended 30 days threshold. Calculating N2O-N EF based on (Equation (5)) reduced the N2O-N EFs by 16% across grasslands, excreta type, and seasons of its application (Table 2). N2O-N EFs for the non-irrigated and irrigated pastures ranged from 0.01–0.35% (mean ± SD = 0.16 ± 0.11%) and 0.04–0.45% (0.25 ± 0.14%), respectively. For the non-irrigated swards, N2O-N EF was significant for the pasture and N source interaction (p < 0.05; Appendix A, Table A2, Figure 6a), with prwc swards having lower EF for dung compared with prwrc. In the irrigated swards, there was a treatment and season interaction effect (p < 0.01; Appendix A, Table A2). Therefore, whereas the treatment effect was only evident in spring, N2O-N EF was only higher for dung in summer than spring (Figure 6b).

Drivers of N2O-N EF

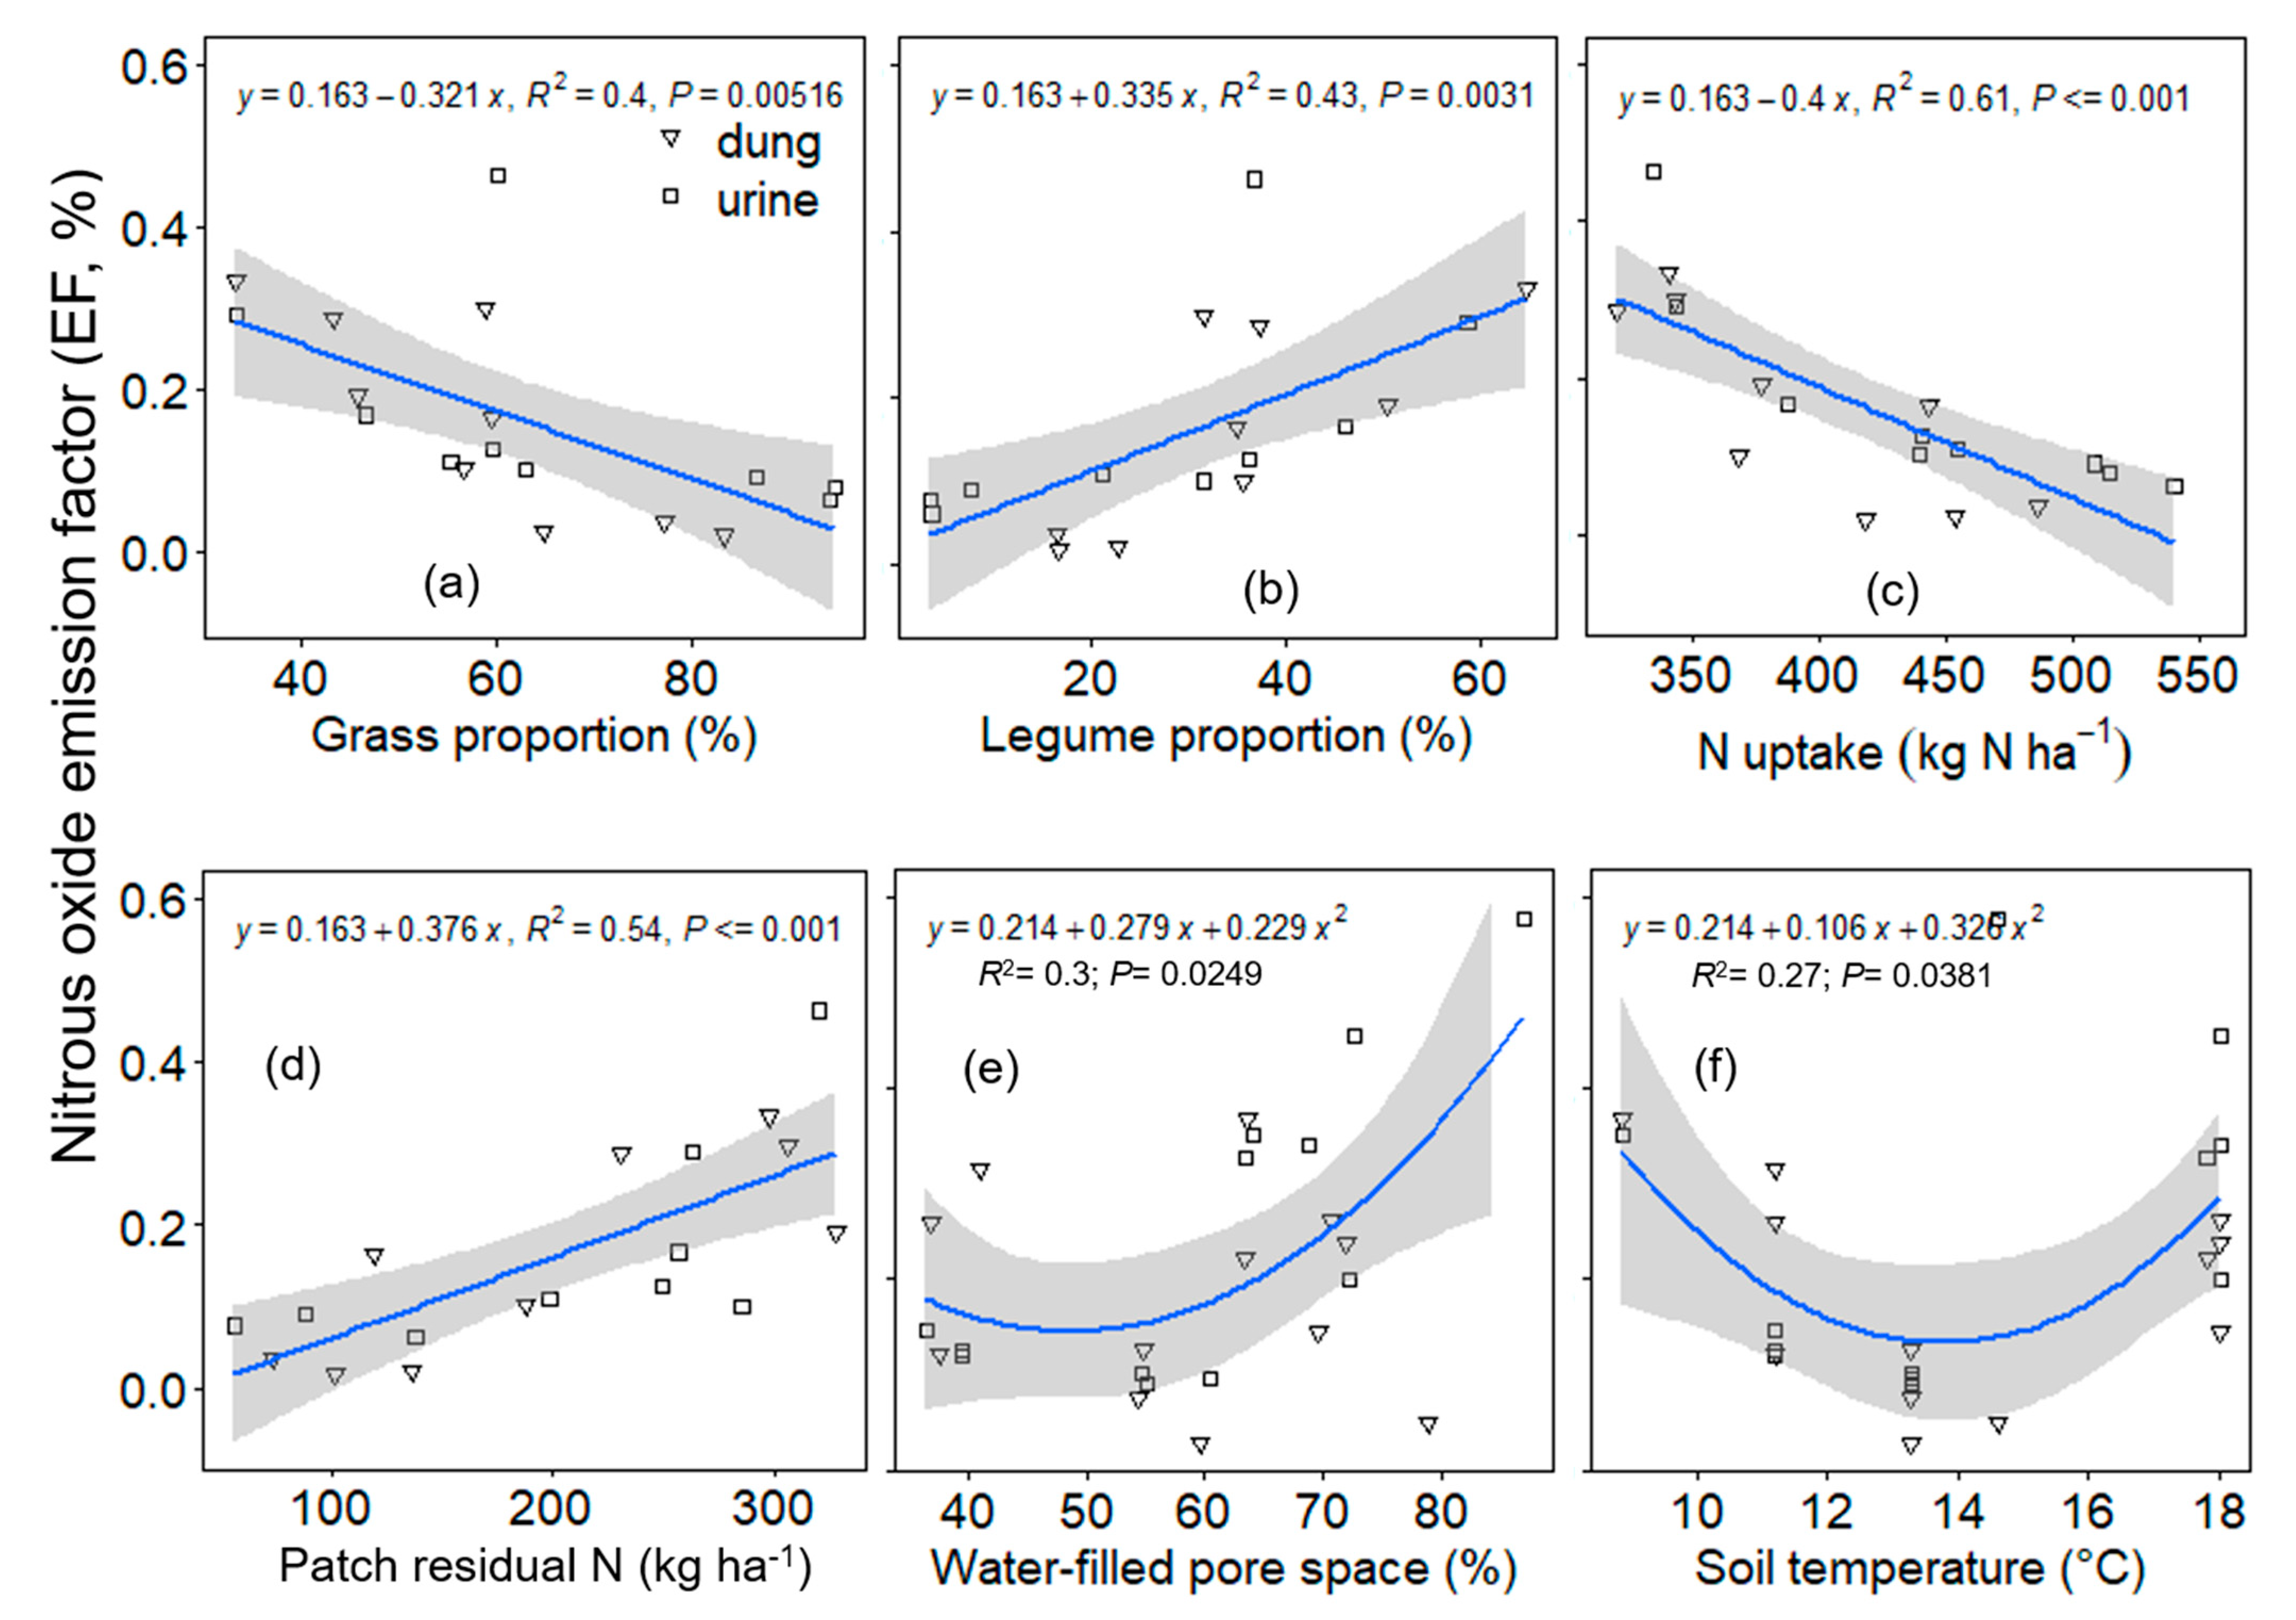
We tested the effect of the measured/estimated parameters on the calculated N2O-N EF using data from Experiments 2 and 3 (the results are shown in Appendix A, Table A3). We found that the soil temperature, precipitation, excreta N and C content, N loading, NO3-N intensity, legume and grass proportions in the swards, sward N uptake, and PRN significantly (p < 0.05) affected N2O EFs for the non-irrigated swards. For the irrigated swards, excreta C and N, N applied, and soil mineral N intensity, as well as the dry matter yield, significantly affected N2O-N EF (p < 0.05; Appendix A, Table A3). The increasing grass proportions resulted in lower N2O-N EF (Figure 7a), while legume proportions >40% resulted in increased N2O-N EF (Figure 7b).
As expected, the N uptake (Figure 7c) was negatively correlated with N2O-N EF, while PRN associated positively with a higher N2O-N EF (p < 0.05; Table 3; Figure 7d). Whereas, soil temperature was significantly and linearly associated with non-irrigated N2O-N EFs, the environmental factors did not associate significantly with irrigated N2O-N EFs. However, using pooled data from both experiments for conducted regression approaches showed that WFPS and soil temperature were most related to N2O-N EF within the first 15 and 60 days following excreta application, respectively, and were quadratic functions (Appendix A, Table A4; Figure 7e,f). It appears N2O-N EF only increased when WFPS increased above 60% (Figure 7f) and when soil temperatures increased above 15 °C (Figure 7f).

4. Discussion

4.1. Plant Yields, Botanical Composition, and Soil Residual N

We did not consider yields and forage uptake from the grazed plots (Experiment 1). However, a previous report by Lorenz [43] showed high forage production from these fields (9.86–11.64 Mg ha−1 year−1). As expected, dry matter forage production and N uptake were higher in the diverse prwrch pastures than the binary prwc pastures in Experiment 2. The higher BFN inputs might partly explain this difference in the prwrch pastures due to their higher legume (N) yield (Table 3). The similar dry matter production of prwrch and prwrc despite the higher N input in the mixture without herbs might be due to the higher ability of multispecies swards to utilize resources for growth efficiently. Previous studies reported higher below and above-ground biomass yield more diverse than less diverse swards [20]. The particularly low dry matter yield of prwc pastures can be partly explained by the inability of white clover-containing swards to withstand drought [44]. The summer of 2018 was especially dry but had an extremely productive spring and an extremely productive long autumn, with excellent growing conditions for white clover. White clover suffered only six weeks of drought. The range of dry matter yield observed in this study agrees with the 9–12 Mg ha−1 reported for similar grasslands under similar climatic and soil conditions, depending on the age or soil N status [43,45].
As the N concentration of both urine and dung could not be controlled, N loading rates varied across seasons and treatments with means (±SD) of 493 ± 43 and 397 ± 47 kg ha−1 for urine and dung patches, respectively, but were similar across grasslands. Still, these differences appear negligible compared to the range of N loading rates of 200–2000 kg N ha−1 year−1 from urine and dung patches reported for dairy cows [6]. The excreta application increased the grass proportion in the swards but reduced the legume yield as N became more available [46]. With this, the partner grass outcompetes the legume easily [47], especially the shallow-rooted white clover. This same argument could be offered to explain the low legume yield by prwc (Table 3).
BFN in grass/legume swards worldwide ranges 13– 682 kg N ha−1 year−1, depending on the legume persistence, yield, associated grass(es), or measurement method. Therefore, the BFN range (51–286 kg N ha−1 year−1) observed in this study could be considered normal. Whereas, the N applied and N input correlated positively (but weakly; r = 0.27–0.33), while the dry matter yield, legume proportion, and BFN correlated more strongly (r = 0.63–0.76). This observation confirmed the critical role of BFN in dry matter production and supported the assertion that legumes deliver a more synchronized N to meet plant demand compared with the N supply from external sources and stimulate the over-yielding of biomass [19,48]. The relatively high dry matter yield from the control plots compared with dung and urine treatments (Table 3) further corroborates this assertion. Indeed, Ledgard [49] contended that pastoral systems could rely solely on BFN for moderate to high dry matter production with moderate N losses.

4.2. N2O Emissions and Emission Factors

N2O emissions from grazed pastures are associated with substantial heterogeneity due to the random nature of emission hotspots from urine and dung depositions, making the eddy covariance method preferred to the chamber method [29] for non-simulated grazing experimental designs. However, the chamber method can capture the magnitude and temporal patterns from emission hotspots (i.e., urine and dung patches), and it makes the comparison of different treatments in parallel possible. Moreover, the accuracy of measurements can be improved if the interval of measurements is increased [10]. Nevertheless, the high coefficient of variation (about 23%) associated with the current measurements might have undermined the detection of significant differences. Due to this, the additional experiment with controlled urine and dung depositions was designed, which allowed creating more uniform N loadings and tracking the emissions from exactly one urine or dung patch.
The range of daily N2O-N fluxes observed from our grazed pastures was similar to the 1.1–2.9 mg N m−2 d−1 reported for grazed Irish pastures on sandy soils [50] and 0.03–2.5 mg N2O m−2 d−1 reported in New Zealand [51]. However, the range of annual N2O-N emission observed for the grazed pastures (mean ± SD = 1.0 ± 0.2 kg N ha−1) appears lower than the values reported by these earlier authors due to the infrequent incidence of high peaks (Figure 2). The pastures in these previous studies received additional chemical N fertilizers and were conducted in locations with slightly higher temperatures compared with our site. These factors might explain the lower fluxes in our case since farm management contributes to the effect of site characteristics and climate variability on the N2O emission [52]. Nevertheless, the result agrees with the 0.04–21.21 kg N2O-N ha−1 year−1 reported for European grasslands (Jena Experiment), depending on the site and management [52].
The range of cumulative N2O-N fluxes (0.05–1.59 kg N ha−1) observed in this study from experiment 2 was slightly lower than the 0.08–3.2 kg N ha−1 reported for similar simulated grazing experiments [7,22], probably since these previous authors used mono-crop swards. The N2O EFs observed for urine and dung in the current study might be related to the soil, climate, and management practices. Previous studies conducted in similar climates [25,27,28,29,30] reported low EFs for urine and dung in line with our findings. De Klein et al. [53] and Marsden et al. [26] reported low (0.03–0.3%) N2O-N EF for animal excreta deposited on free-draining soils. The soils at the site are free-draining sandy loam (Appendix A, Table A1), known to have increased infiltration and percolation of urine, leading to increased N losses via leaching [27] and reduced N2O emission. Recently, low N2O-N EFs (0.12–0.41%), depending on the age of sward and fertilization (slurry) rate, was observed for grass-legume grasslands at the study site [45]. As the current study measured N2O emissions for, at least, 100 days, the N2O-N EFs could be considered site-specific. However, the summer of 2018 was unusually dry, though spring was typical, and autumn very productive.
When N2O-N EF was estimated based on the total N input (i.e., N2O-N EF1 = BFN + N applied), to account for the contribution from legumes in the swards, the mean EF reduced by 16% but was not significantly (p > 0.05) affected by the sward diversity nor excreta type (Table 3). However, this method of estimating EF contrasts with the IPCC 2006 guidelines, which requires that background emissions are considered. Nevertheless, this method provides an opportunity to illustrate the impact of legumes on N2O emission and might guide the maximal N input for an appreciable level of N2O emission from grass-legume swards [45]. The N2O EFs from our study were relatively low compared with the revised IPCC default EF of 0.77%.
Holtan-Hartwig et al. [54] observed that some soils generally have the intrinsic potential for low N2O emission irrespective of environmental conditions, and this has been attributed to differences in denitrifying communities [55]. Moreover, previous and current soil management practices might affect microbial dynamics in soils. The initial N status of soils is likely to have reverberating effects on the microbial soil community’s functions, including N transformations, abundance, and the activity of nitrifying and denitrifying microorganisms [56], and by extension, the production of N2O. The microbial community’s composition is an essential factor that determines the N2O:N2 ratio emitted from temperate soils [57]. The soils were not fertilized and must have had a low residual N, as shown by the control plots’ negative PRN (Table 3).

4.2.1. The Effect of Grassland Diversity

We expected lower N2O emissions from the most diverse pasture (prwrch) under both grazing and simulated grazing experiments, based on the assumption that diverse pastures increase plant productivity through increased niche complementarity, resource uptake efficiency, and N transfer from legumes to grasses/herbs, and particularly, as these also contained plants reported to reduce N2O emission via nitrification inhibitors [7,22]. A decreasing trend in N2O emission as grassland diversity increased was observed from grazed plots in 2019 (Figure 3), and when excreta N2O emitted was related to the N uptake (Table 3). However, the annual N2O, N2O EF or N2O emission intensity were statistically similar for the grasslands. Moreover, the timing of peak N2O production appeared similar across grasslands, seasons, and treatments. This observation contradicts reports by Hoeft et al. [58], who observed alterations in the timing of peak N2O production after urine addition due to species differences. Although the N input differed among the grasslands, obviously due to the differences in legume proportions, N2O emission was similar across the grasslands. The mineral N concentration was similar for the grassland soils (Table 3), suggesting that grasslands might not be too different functionally to influence N cycling. Therefore, we reject the hypothesis that a more diverse grassland would necessarily reduce the N2O emission.
The effect of sward diversity on N2O emission is not conclusive. Hoeft et al. [58] reported no difference in the N2O emission between grass pastures and more diverse pastures in previous studies. In contrast, Niklaus et al. [59] observed reduced N2O emission from more diverse pastures (species richness from 1–16) but not in the presence of fertilizer or large proportions of legumes. In this study, herbs constituted about 18% of the most diverse swards and forage plantain proportion was only around 5% (results not shown). This is likely too low for any effects on N2O emissions. Additionally, the soil-environment interaction might affect plantain BNI effectiveness [7,23]. According to Experiment 2, prwc yielded less dry matter and less nitrogen (Table 3), and had possibly a higher uptake by the animals, which would have resulted in higher droppings of urine and dung. Therefore, similar N2O emissions from higher N-yields in the more complex grasslands could be considered positive.

4.2.2. Effect of N Source

The effect of excreta type on the N2O emission was not consistent as the interaction effects were evident for both non-irrigated and irrigated pastures. However, PRN and all the N2O emission indices were generally similar for both dung and urine in non-irrigated pastures, but with irrigation, N2O emissions/EFs were 1–2 times higher for urine patches compared with dung. Luo et al. [7] also reported a higher N2O emission from urine patches relative to dung, and this could be ascribed to the slow mineralization of dung N. Whereas, urine contains high amounts of available N, dung is rich in C and organic N, and undergoes slower mineralization rates and higher fixation of N by adsorption to soil particles, depending on soil properties and environmental conditions [60]. However, the N mineralization from dung patches and subsequent emission of N2O might be a function of biological, environmental conditions, and time, as over time immobilized N becomes available for mineralization resulting in a later peak, as occurred in experiment 2. It is not clear if all N from dung patches mineralized during the period as dung N were bound in very slowly decaying organic bindings, or more complex molecules might need more time than urine, in which most N is in mineral form. The relatively dry soil conditions in 2018 might have limited N2O emission from the urine patches. The drought must have slowed down mineralisation even further in dung patches as they remained visibly dry in the collars.

4.2.3. Effect of Timing of Excreta Deposition

The peak N2O emissions were visually associated with a decline in NH4 and increased NO3 concentration in the soils. The highest N2O-N peak was obtained in spring, followed by summer, and then autumn in both years, similar to previous reports [7,30,61]. The seasonal effect on PRN, N2O-N emission, and N2O-N EF might be due to the prevailing soil moisture and temperature interaction effects at or following excreta deposition [61]. These environmental differences influence the N uptake and residual N in the soils, and hence N-leaching to the groundwater, which is a function of timing of excreta deposition, soil inorganic N status, and climatic conditions [62]. Although the leaching load was not measured in this study, Biernat et al. [62] reported higher leaching loads when soil mineral N was high in late summer, autumn or early winter. This observation might partly explain the low residual N or N2O emission associated with summer and autumn excreta applications relative to spring.

4.2.4. Effect of Irrigation

The irrigated pastures in Experiment 3 had relatively high WFPS compared with Experiment 2 (Figure 1). It is worth mentioning that irrigation was adopted to provide conducive soil conditions for denitrification losses. Such high soil moisture condition could promote plant growth and enhance plant N uptake but could also promote N leaching to the underground water pool. Similar to reports by Smit et al. [63], the irrigation increased (almost doubled) both cumulative N2O-N emitted (0.46 vs. 0.81) and N2O-N EF (0.25 vs. 0.16%) compared with non-irrigation emissions. The dry conditions in 2018 must have reduced N mineralization, particularly in dung patches as they were visibly dry, and would have limited denitrification. With the irrigated swards, both nitrification and denitrification were significant processes by which N2O fluxes were produced; nitrification seemed to be more dominant, as shown by the more robust relationship between N2O and NH4 compared with NO3 (R2 = 0.84 vs. 0.65; Figure 5c,d) [27].

4.3. Factors That Controlled N2O Emission and EF at the Site

4.3.1. Botanical Characteristics

The measured/estimated botanical variables were significantly associated with N2O-N EFs in this study. The impact of plants on N2O emissions and underlying mechanisms are not always conclusive [21], as several factors might play confounding roles. However, grasslands’ ability to influence N2O emission might depend on factors including N uptake from soils, legume proportion, and the production of soluble sugars [21,59]. Regression analyses showed a significant effect of grass proportion, legume proportion, and N uptake on N2O-N EFs (Appendix A, Table A3, Figure 7a–c). The higher grass proportion and N uptake appeared to depress the N2O emission factor, but the higher legume proportion associated positively with N2O-N EF. Accordingly, Bracken et al. [64] reported a significant functional group identity effect on cumulative N2O emissions, with emissions increasing with the increasing white clover proportion and decreasing with the increasing perennial ryegrass proportion for both irrigated and non-irrigated pastures. Similarly, Niklaus et al. [59] reported a significant legume effect on N2O emission. On the contrary, Barneze et al. [65] found no legume effect on N2O emission, total mineral N or mineral N in fertilized or unfertilized soils.
Under monoculture, legumes appeared to emit more N2O than other species [59]. However, this might not be necessarily additive in mixed pastures [66], but increases in the proportion of legumes might influence C and N cycling processes [65]. This legume effect on N2O emission might be related to the increased N supply (Table 3), leading to nitrification and denitrification losses. Therefore, the increased NO3 availability due to the release of fixed N from legume roots via decomposition and legumes’ inefficiency in acquiring mineral N [65] may explain the high association of legumes with the N2O emission. The inclusion of legumes in mixed-swards at proportions of 30–50% is described as most effective, providing multiple outputs including reduced greenhouse gas emission, higher productivity and increased protein self-sufficiency, and reduced N leaching [48,67]. In this study, legume proportions ranging from 30–50% resulted in N2O-N EFs ranging from 0.17–0.25% (Figure 7b). Meanwhile, legume proportions up to 30% have been widely promoted in New Zealand and Switzerland as a norm [19].

4.3.2. Soil Mineral N Availability and Plant N Uptake

In our study, soil mineral N intensity, PRN, and N uptake were significantly associated with N2O-N EF. The N input was 116–289 kg ha−1, more than the 300 kg N ha−1 required by highly productive grasslands to meet plant demand [50]. At the same time, the N uptake (320–540 kg ha−1) was lower than the N input, resulting in patch residual N ranging from −87–206 (mean = 103 kg ha−1), being positive for excreta patches (Table 3) and negative for the control plots. This estimate might not be precise as lateral flows from urine and dung patches outside the rings were possible [36]. Also, N losses via nitrification, denitrification, and leaching were not considered. Moreover, these pastures can sequester about 1 Mg C per year, equivalent to ~100 kg N (assuming a CN ratio of 10), captured in soil organic matter. Nonetheless, the residual soil N on the entire pasture must be far lower, considering that excreta deposition by grazing livestock affects about 60% of the paddock. In any case, N2O production is primarily driven by the amount of residual N in the soil [57], as corroborated by the high association between N2O emission and PRN (R2 = 0.77; p < 0.001; Figure 5b), which is a function of N input and uptake of the swards. The higher residual N will potentially result in higher N2O emission as N becomes available for nitrifies and denitrifies to act on. It appears values up to 250 kg ha−1 might still keep N2O-N EF from cow excreta patches below 0.2% (Figure 5b) at this site, but the high surplus N might be leached to pollute the underground water pool and/or become a secondary source of N2O emission.
PRN was about 67% higher for prwrc than prwc or prwrc, leading to a relatively low N uptake for prwrc. The similar N uptake for prwrc and prwrch might be due to the high grass proportion (Table 3) as grasses have a higher potential to utilize soil N for growth, reducing soil N and the nitrification/denitrification potential of the soils [22]. The range of N uptake by the grasslands in this study appears to be on the upper side of the range of values (10–450 kg N ha−1 year−1) reported by Bessler et al. [68]. It appears grass-legume swards are associated with the high N uptake, as corroborated in this study and by Reinsch et al. [45]. This has been attributed to species complementarity evident by the development of high root length and root density by grass-legume species [69], leading to low PRN.
The high N uptake (>70%) in this study might partly explain the low N2O-N EFs observed in this study, as the higher N uptake is associated with low N2O-N EF (Figure 7c). The higher N uptake reduced N2O EF, and the higher N input might stimulate the higher N uptake, as observed in this study (results not shown; r = 0.44, p < 0.05), similar to reports by Lü et al. [70]. This observation supports the general concept that the nutrient uptake by roots increases in response to the increasing nutrient supply [71]. Besides, this highlights the critical role of plant N uptake and its potential usage in mediating the effects of N addition from grazing animals. However, it must be noted that plant N uptake/productivity also depends on the availability of other nutrients and has a physiological maximum. Although N2O emissions were similar across the grasslands, the most diverse grassland had a relatively high N uptake compared with the binary-sward grassland, suggesting a higher potential for reduced N2O emission as corroborated by the 9% lower N2O emission intensity by prwrch compared with prwc (Table 3).

4.3.3. Soil Moisture and Temperature

As shown by regression analyses, soil moisture and temperature were significant predictors of N2O-N EF for both non-irrigated and irrigated pastures but appeared to be most vital within the first two weeks and two months, respectively, following excreta application (Appendix A, Table A4). Soil moisture and ambient temperature influence N2O emission significantly by modulating the microbial activity and transport of gases in soil [10,11]. Higher N2O-N EFs associated positively with higher WFPS. However, it appears that increases in N2O-N EF only occurred when WFPS was above 60%, respectively (Figure 7e). Soil moisture affects nitrification and denitrification processes [11], and for that matter, ammonia-oxidizing species [12] reduce their population below 60% of field capacity. The soil water threshold value differs according to the soil type [57], and the critical WFPS for denitrification in many soils is equivalent to the field capacity or above [72]. At higher WFPS, where denitrification becomes the primary process, the N2 produced might exceed the N2O production, leading to reduced N2O emissions at high WFPS, especially when temperatures are high. Davidson [73] explained that both nitrification and denitrification processes co-occur within soils, but the low soil water content and coarse soil texture favour nitrification, while the high soil water content and fine soil texture with a high organic matter content promotes denitrification [74]. The seemingly high occurrence of nitrification might be due to the sandy nature of soils at the site. This might partly explain the relatively low N2O emission observed in this study.
The higher N2O-N EF associated positively with higher soil temperature, but it appears that increases in N2O-N EF only occurred when the soil temperatures went above 15 °C (Figure 7f). Maag and Vinther [75] reported maximum nitrification rates at 20 °C and small responses to soil temperature changes at lower temperatures. Although denitrification depends on the soil type, with sandy loam soils responding significantly to both increases in soil temperature and soil moisture, temperatures above 5 °C are often considered to be required for effective denitrification rates [76]. However, we observed an appreciable N2O emission from grazed fields in winter and early spring (Figure 2), similar to reports by Flessa et al. [77]. In winter, the observed N2O emissions, despite the absence of grazing activity, might be due to substrates accumulations from the proceeding grazing season. Such winter emissions have been attributed to specific freeze/thaw phenomena [78]. However, Holtan-Hartwig et al. [54] explained that decreasing temperatures increase the N2O/N2 product ratio under anaerobic soil conditions due to differences in the temperature response of N2O diffusion versus biological process rates.

5. Conclusions and Implications of the Study

In this study, the grasslands’ species richness did not significantly affect the N2O emission, although there was a tendency for low N2O emission from the prwrch swards when the N2O emission was expressed as a fraction of the N uptake. Differences in the functional composition (i.e., grass and forage legumes) of the swards were significantly related to the N2O emission. We observed a high N uptake efficiency by the grasslands, partly explaining the low N2O emission and EFs at the site. In addition, soil temperature and WFPS, botanical factors, including legume or grass proportions in the swards, and N uptake were dominant factors that drove the N2O emission from dung and urine patches. The high N uptakes observed for grasslands show their high potential to optimize the N use. An elevated WFPS almost doubled the N2O-N EFs; however, the EF values were below the default IPCC [32] for wet temperate climates, suggesting a further disaggregation of the default value to cater for organic dairy systems in wet temperate regions.
The excreta CN ratio, N applied, total N input, PRN, grass and legume proportions, as well as N uptake, were factors that drove the N2O emission from dung and urine patches. The high N uptake (>70%), legume proportions (16–46%), as well as soil type, might explain the relatively low N2O EFs observed in this study. Results suggest that simple regression approaches using grass or legume proportions and N uptake can be used to predict the N2O emission more precisely over a wide range of environments. We further concluded that an efficient proportion of legumes without additional mineral fertilizer use accelerates an efficient N-cycling and is more important than a complex species diversity to reduce undesired N2O emissions from pastures. However, the year 2018 was unusually dry, and results might be or were probably affected by this. Hence, the experiments or at least the simulated grazing studies should be continued to see the difference to “normal” years.

Author Contributions

J.K.N. acquired funding to carry out the study; J.K.N., C.S.M., R.L.; and T.R. conceptualized and designed the research experiment and the hypotheses; J.K.N., T.R. and C.S.M. developed the research protocols and implemented the studies; J.K.N. carried out the data collection; J.K.N. performed the soil and plant analyses; J.K.N. and C.K. compiled the data, developed the model codes, and performed the data analysis; J.K.N. prepared the manuscript’s initial draft with contributions from all co-authors to produce the final manuscript; I.V., C.S.M., and T.R. edited the manuscript; F.T. provided oversight and took leadership responsibility for the research activity planning and execution. All authors have read and agreed to the published version of the manuscript.

Funding

This study received financial assistance from the German Academic Exchange Programme (DAAD). We also acknowledge financial support by the German Research Foundation (DFG) within the funding programme “Open Access Publizieren”.

Institutional Review Board Statement

Not applicable.

Informed Consent Statement

Not applicable.

Data Availability Statement

The data presented in this study are openly available in FigShare at [https://doi.org/10.6084/m9.figshare.13721041.v2], Ref [79].

Acknowledgments

We wish to thank Rita Kopp, Petra Voß, and Katrin Helmich of the Grassland and Forage Science/Organic Agriculture Department at the CAU for their immense technical assistance during the analyses of soils, plants, and gas samples, respectively. We are indebted to Thomas Ehmsen and Keanu Heuck of the Organic Research Farm Lindhof for their unflinching support during the project implementation and data collection.

Conflicts of Interest

The authors declare that they have no competing interests.

Appendix A

Table A1. Physical and chemical properties of the soil at the experimental site (30 cm soil depth).
Properties
Soil textureSandy loam
Sand61.1
Silt26.2
Clay12.7
Bulk density (g m−3)1.56
Organic C (%)2.2
pH6.4
Total C (%) 1.29
Total N (%)0.12
CN ratio10.9
CEC (cmol kg−1)17.2
Field capacity (%)37.5
Table A2. Analyses of variance of the measured parameters showing main effects of pasture diversity (G), excreta type (T), and season (S) of excreta deposition on measured parameters.
ParametersF-/P-Value
(G)rassland
(2,52)
(T)reatment
(2,52)
(S)eason
(2,52)
G × T
(4,52)
G × S
(4,52)
T × S
(4,52)
G × T × S
(8,52)
Experiment 2—Non-irrigated simulated grazing
Grass (%)94.4 ***52.3 ***2.45 ns1.47 ns2.84 *1.88 ns0.44 ns
Legume (%)94.7 ***62.7 ***4.57 *1.25 ns5.36 **0.66 ns0.38 ns
Herb (%)143.4 ***2.72 ns0.62 ns3.66 *0.62 ns0.97 ns0.97 ns
Unsown (%)16.3 ***3.76 *2.85 ns3.65 *0.42 ns0.24 ns0.36 ns
DM yield (Mg ha−1)44.0 ***1.35 ns39.3 ***2.97 *0.76 ns15.2 ***0.87 ns
N (g N kg DM−1)9.4 ***67.4 ***291.0 ***4.39 **1.54 ns26.9 ***0.53 ns
β BFN (kg ha−1)87.7 ***79.0 ***29.8 ***4.63 **6.96 ***13.0 ***0.69 ns
N input (kg N ha−1)87.7 ***512.7 ***42.7 ***4.63 **6.96 ***16.9 ***0.69 ns
N uptake (kg N ha−1)22.5 ***6.44 **5.77 **2.43 ns0.94 ns21.8 ***1.85 ns
PRN (kg N ha−1)10.1 ***45.7 ***46.5 ***3.40 *3.11 *19.7 ***2.46 *
NO3 (mg kg−1 soil d−1)0.44 ns64.4 ***22.9 ***1.06 ns0.26 ns4.54 **1.03 ns
NH4 (mg kg−1 soil d−1)0.90 ns29.6 ***2.70 ns1.30 ns2.19 ns2.27 ns0.72 ns
N2O-Nexcreta ( kg N ha−1)0.28 ns51.6 ***24.0 ***1.80 ns1.05 ns6.06 ***0.90 ns
N2O (kg N ha−1 100 day−1)0.40 ns10.5 **17.6 ***1.35 ns0.57 ns5.05 **0.56 ns
N2O-N EF (%)0.63 ns
(2,34)
0.005 ns
(1,34)
34.4 ***
(2,34)
3.37 *
(2,34)
1.40 ns
(4,34)
2.44 ns
(2,34)
1.63 ns
(4,34)
g N2O-N kg−1 N uptake0.31 ns99.3 ***34.0 ***1.73 ns0.71 ns11.1 ***1.04 ns
N2O-Ngrazed ( kg N ha−1)0.19 ns
Experiment 3—Irrigated simulated grazing
Parameters (T)reatment
(2,24)
(S)eason
(2,24)
T × S
(4,24)
NO3 (mg kg−1 soil day−1) 79.8 ***75.3 *** 16.9 ***
NH4 (mg kg−1 soil day−1) 135.9 ***3.22 ns 3.19 *
N2O-Nexcreta (kg N ha−1) 53.9 ***0.44 ns 8.68 ***
N2O-N EF (%) 8.37 *
(1,15)
2.76 ns
(2,15)
12.5 ***
(2,15)
DM: dry matter; Level of significance, ns = p > 0.05, * < 0.05, ** < 0.01, *** < 0.001; β Estimated parameter. BFN: Biologically fixed nitrogen; N2O-Nexcreta: Emission from excreta patches; N2O-Ngrazed: Emitted from grazed fields. Figures in parenthesis indicate degrees of freedom followed by the sample size.
Figure A1. Graph showing the season x treatment interaction effect (p < 0.01) on cumulative N2O emission irrigated binary-sward grasslands (Experiment 3). Means with different letters are significantly different (p < 0.05; abc for the seasonal effect, ABC for the treatment effect).
Atmosphere 12 00223 g0a1
Table A3. Bivariate relationships between N2O-N emission factors and the measured/estimated variables.
ParameterEstimateAdj. R2FPr > FEstimateAdj. R2FPr > F
Non-Irrigated Simulated GrazingIrrigated Simulated Grazing
Soil temp.0.050.155.52*0.02−0.020.38ns
Precipitation−0.010.145.27*2.75 × 10−4−0.030.13ns
WFPS−0.0020.0021.04ns−0.030.021.82ns
WFPS^2−0.0020.132.92*
N content1.190.219.65**6.540.175.82*
C content−0.10−0.060.07ns−0.230.269.18**
C content^2−0.100.307.68**
C:N ratio−0.002−0.050.17ns
C:N ratio^2−0.030.5419.8***−0.080.227.64*
N load0.0020.4223.7***0.010.227.38*
NH4 intensity−7.94 × 10−50.072.29ns0.0030.8353.4***
NO3 intensity−8.45 × 10−50.3710.8**0.0020.6118.4**
Grass−0.020.4514.9**
Clover0.020.5219.1***
Clover:grass0.500.6330.1***
Herbs−0.003−0.060.04ns
Herbs:clover−0.280.123.25ns
Herbs:grass0.500.011.24ns
Dry matter yield−1.21 × 10⁻⁴−0.050.22ns4.37 × 10−40.104.87*
Harvested N−0.01−0.0020.98ns
N input0.00030.032.85ns
N uptake−8.93 × 10−40.4012.6**
PRN7.0 × 10−40.3428.7***
Level of significance, ns = p > 0.05, * < 0.05, ** < 0.01, *** < 0.001; WFPS: Water-filled pore space.
Table A4. Effect of sampling days on the relationships (R2) between N2O-N emission and environmental factors (soil temperature and water-filled pore space).
Days after Excreta Application153060100
Soil temperature (°C)0.08 ns−0.03 ns0.07 ns0.26 ***
Soil temperature^2 (°C)0.38 ***0.32 ***0.49 ***0.43 ***
Water-filled pore space (%)0.18 **0.19 **0.03 ns−0.004 ns
Water-filled pore space^2 (%)0.16 *0.18 *0.002 ns−0.03 ns
ns = p > 0.05, * < 0.05, ** < 0.01, *** < 0.001.

References

  1. Myers, S.S.; Smith, M.R.; Guth, S.; Golden, C.D.; Vaitla, B.; Mueller, N.D.; Dangour, A.D.; Huybers, P. Climate Change and Global Food Systems: Potential Impacts on Food Security and Undernutrition. Annu. Rev. Public Health 2017, 38, 259–277. [Google Scholar] [CrossRef]
  2. The Intergovernmental Panel on Climate Change. Climate Change 2014 Synthesis Report; The Intergovernmental Panel on Climate Change: Geneva, Switzerland, 2014; ISBN 978-92-9169-143-2. [Google Scholar]
  3. Portmann, R.W.; Daniel, J.S.; Ravishankara, A.R. Stratospheric Ozone Depletion Due to Nitrous Oxide: Influences of Other Gases. Philos. Trans. R. Soc. B Biol. Sci. 2012, 367, 1257–1264. [Google Scholar] [CrossRef] [Green Version]
  4. Tian, H.; Chen, G.; Lu, C.; Xu, X.; Ren, W.; Zhang, B.; Banger, K.; Tao, B.; Pan, S.; Liu, M.; et al. Global Methane and Nitrous Oxide Emissions from Terrestrial Ecosystems Due to Multiple Environmental Changes. Ecosyst. Health Sustain. 2015, 1, 1–20. [Google Scholar] [CrossRef] [Green Version]
  5. Tian, H.; Xu, R.; Canadell, J.G.; Thompson, R.L.; Winiwarter, W.; Suntharalingam, P.; Davidson, E.A.; Ciais, P.; Jackson, R.B.; Janssens-Maenhout, G.; et al. A Comprehensive Quantification of Global Nitrous Oxide Sources and Sinks. Nature 2020, 586, 248–256. [Google Scholar] [CrossRef] [PubMed]
  6. Selbie, D.R.; Buckthought, L.E.; Shepherd, M.A. The Challenge of the Urine Patch for Managing Nitrogen in Grazed Pasture Systems; Elsevier: Amsterdam, The Netherlands, 2015; Volume 129, ISBN 978-0-12-802138-5. [Google Scholar]
  7. Luo, J.; Balvert, S.F.; Wise, B.; Welten, B.; Ledgard, S.F.; de Klein, C.A.M.; Lindsey, S.; Judge, A. Using Alternative Forage Species to Reduce Emissions of the Greenhouse Gas Nitrous Oxide from Cattle Urine Deposited onto Soil. Sci. Total Environ. 2018, 610–611, 1271–1280. [Google Scholar] [CrossRef]
  8. Dangal, S.R.S.; Tian, H.; Xu, R.; Chang, J.; Canadell, J.G.; Ciais, P.; Pan, S.; Yang, J.; Zhang, B. Global Nitrous Oxide Emissions From Pasturelands and Rangelands: Magnitude, Spatiotemporal Patterns, and Attribution. Glob. Biogeochem. Cycles 2019, 33, 200–222. [Google Scholar] [CrossRef]
  9. Reinsch, T.; Loges, R.; Kluß, C.; Taube, F. Renovation and Conversion of Permanent Grass-Clover Swards to Pasture or Crops: Effects on Annual N2O Emissions in the Year after Ploughing. Soil Tillage Res. 2018, 175, 119–129. [Google Scholar] [CrossRef]
  10. McAuliffe, G.A.; López-Aizpún, M.; Blackwell, M.S.A.; Castellano-Hinojosa, A.; Darch, T.; Evans, J.; Horrocks, C.; Le Cocq, K.; Takahashi, T.; Harris, P.; et al. Elucidating Three-Way Interactions between Soil, Pasture and Animals That Regulate Nitrous Oxide Emissions from Temperate Grazing Systems. Agric. Ecosyst. Environ. 2020, 300, 106978. [Google Scholar] [CrossRef] [PubMed]
  11. van der Weerden, T.J.; Manderson, A.; Kelliher, F.M.; de Klein, C.A.M. Spatial and Temporal Nitrous Oxide Emissions from Dairy Cattle Urine Deposited onto Grazed Pastures across New Zealand Based on Soil Water Balance Modelling. Agric. Ecosyst. Environ. 2014, 189, 92–100. [Google Scholar] [CrossRef]
  12. Di, H.J.; Cameron, K.C.; Podolyan, A.; Robinson, A. Effect of Soil Moisture Status and a Nitrification Inhibitor, Dicyandiamide, on Ammonia Oxidizer and Denitrifier Growth and Nitrous Oxide Emissions in a Grassland Soil. Soil Biol. Biochem. 2014, 73, 59–68. [Google Scholar] [CrossRef]
  13. Oenema, O.; Sapek, A. Controlling nitrous oxide emissions from grassland farming systems; the COGANOG project. In Effects of Liming and Nitrogen Fertilizer Application on Soil Acidity and Gaseous Nitrogen Oxide Emissions in Grassland Systems; Falenty IMUZ Publisher: Falenty, Poland, 2000; pp. 7–13. [Google Scholar]
  14. Burke, I.C.; Lauenroth, W.K.; Cunfer, G.; Barrett, J.E.; Mosier, A.; Lowe, P. Nitrogen in the Central Grasslands Region of the United States. BioScience 2002, 52, 813–823. [Google Scholar] [CrossRef] [Green Version]
  15. Núñez, P.; Demanet, R.; Matus, F.; Mora, M. Grazing Management, Ammonia and Nitrous Oxide Emissions: A General View. Rev. Cienc. Suelo Y Nutr. Veg. 2007, 7, 61–99. [Google Scholar] [CrossRef]
  16. Schmeer, M.; Loges, R.; Dittert, K.; Senbayram, M.; Horn, R.; Taube, F. Legume-Based Forage Production Systems Reduce Nitrous Oxide Emissions. Soil Tillage Res. 2014, 143, 17–25. [Google Scholar] [CrossRef]
  17. Schaub, S.; Buchmann, N.; Lüscher, A.; Finger, R. Economic Benefits from Plant Species Diversity in Intensively Managed Grasslands. Ecol. Econ. 2020, 168, 106488. [Google Scholar] [CrossRef]
  18. Nyfeler, D.; Huguenin-Elie, O.; Suter, M.; Frossard, E.; Connolly, J.; Lüscher, A. Strong Mixture Effects among Four Species in Fertilized Agricultural Grassland Led to Persistent and Consistent Transgressive Overyielding. J. Appl. Ecol. 2009, 46, 683–691. [Google Scholar] [CrossRef]
  19. Fuchs, K.; Merbold, L.; Buchmann, N.; Bellocchi, G. Evaluating the Potential of Legumes to Mitigate N 2 O Emissions from Permanent Grassland Using Process-Based Models. Glob. Biogeochem. Cycles 2020, 34, e2020GB006561. [Google Scholar] [CrossRef]
  20. Cong, W.F.; Jing, J.; Rasmussen, J.; Søegaard, K.; Eriksen, J. Forbs Enhance Productivity of Unfertilised Grass-Clover Leys and Support Low-Carbon Bioenergy. Sci. Rep. 2017, 7, 1422. [Google Scholar] [CrossRef]
  21. de Klein, C.A.M.; van der Weerden, T.J.; Luo, J.; Cameron, K.C.; Di, H.J. A Review of Plant Options for Mitigating Nitrous Oxide Emissions from Pasture-Based Systems. N. Z. J. Agric. Res. 2019, 63, 29–43. [Google Scholar] [CrossRef]
  22. Bowatte, S.; Hoogendoorn, C.J.; Newton, P.C.D.; Liu, Y.; Brock, S.C.; Theobald, P.W. Grassland Plant Species and Cultivar Effects on Nitrous Oxide Emissions after Urine Application. Geoderma 2018, 323, 74–82. [Google Scholar] [CrossRef]
  23. Podolyan, A.; Di, H.J.; Cameron, K.C. Effect of Plantain on Nitrous Oxide Emissions and Soil Nitrification Rate in Pasture Soil under a Simulated Urine Patch in Canterbury, New Zealand. J. Soils Sediments 2020, 20, 1468–1479. [Google Scholar] [CrossRef]
  24. Franzluebbers, A.J. Cattle Grazing Effects on the Environment: Greenhouse Gas Emissions and Carbon Footprint. In Management Strategies for Sustainable Cattle Production in Southern Pastures; Academic Press: Cambridge, MA, USA, 2019; pp. 11–34. [Google Scholar] [CrossRef]
  25. Chadwick, D.R.; Cardenas, L.M.; Dhanoa, M.S.; Donovan, N.; Misselbrook, T.; Williams, J.R.; Thorman, R.E.; McGeough, K.L.; Watson, C.J.; Bell, M.; et al. The Contribution of Cattle Urine and Dung to Nitrous Oxide Emissions: Quantification of Country Specific Emission Factors and Implications for National Inventories. Sci. Total Environ. 2018, 635, 607–617. [Google Scholar] [CrossRef]
  26. Marsden, K.A.; Jones, D.L.; Chadwick, D.R. The Urine Patch Diffusional Area: An Important N2O Source? Soil Biol. Biochem. 2016, 92, 161–170. [Google Scholar] [CrossRef] [Green Version]
  27. Simon, P.L.; Dieckow, J.; de Klein, C.A.M.; Zanatta, J.A.; van der Weerden, T.J.; Ramalho, B.; Bayer, C. Nitrous Oxide Emission Factors from Cattle Urine and Dung, and Dicyandiamide (DCD) as a Mitigation Strategy in Subtropical Pastures. Agric. Ecosyst. Environ. 2018, 267, 74–82. [Google Scholar] [CrossRef]
  28. Thomas, B.W.; Gao, X.; Beck, R.; Hao, X. Are Distinct Nitrous Oxide Emission Factors Required for Cattle Urine and Dung Deposited on Pasture in Western Canada? Environ. Sci. Pollut. Res. 2017, 24, 26142–26147. [Google Scholar] [CrossRef]
  29. Voglmeier, K.; Six, J.; Jocher, M.; Ammann, C. Grazing-Related Nitrous Oxide Emissions: From Patch Scale to Field Scale. Biogeosciences 2019, 16, 1685–1703. [Google Scholar] [CrossRef] [Green Version]
  30. Krol, D.J.; Carolan, R.; Minet, E.; McGeough, K.L.; Watson, C.J.; Forrestal, P.J.; Lanigan, G.J.; Richards, K.G. Improving and Disaggregating N 2 O Emission Factors for Ruminant Excreta on Temperate Pasture Soils. Sci. Total Environ. 2016, 568, 327–338. [Google Scholar] [CrossRef] [PubMed] [Green Version]
  31. IPCC. IPCC Guidelines for National Greenhouse Gas Inventories; Institute for Global Environmental Strategies (IGES): Tokyo, Japan, 2006; pp. 1–49. [Google Scholar]
  32. IPCC 2019 Refinement to the 2006 IPCC Guidelines for National Greenhouse Gas Inventories. In Agriculture, Forestryand Other Land Use; Intergovernmental Panel on Climate Change: Geneva, Switzerland, 2019; Volume 4, ISBN 978-4-88788-232-4.
  33. FAO. World Reference Base for Soil Resources 2014. International Soil Classification System for Naming Soils and Creating Legends for Soil Maps; FAO: Rome, Italy, 2014; ISBN 978-92-5-108369-7. [Google Scholar]
  34. Loges, R.; Loza, C.; Voss, P.; Kluß, C.; Malisch, C.; Taube, F. The Potential of Multispecies Swards for Eco-Efficient Dairy Production in Northern Germany. In Proceedings of the Grassland Science in Europe, Helsinki, Finland, 19–22 October 2020; pp. 312–314. [Google Scholar]
  35. Cardoso, A.D.S.; Alves, B.J.R.; Urquiaga, S.; Boddey, R.M. Effect of Volume of Urine and Mass of Faeces on N2O and CH4 Emissions of Dairy-Cow Excreta in a Tropical Pasture. Anim. Prod. Sci. 2018, 58, 1079–1086. [Google Scholar] [CrossRef]
  36. Cichota, R.; Vogeler, I.; Snow, V.; Shepherd, M.; Mcauliffe, R.; Welten, B. Science of the Total Environment Lateral Spread Affects Nitrogen Leaching from Urine Patches. Sci. Total Environ. 2018, 635, 1392–1404. [Google Scholar] [CrossRef] [PubMed]
  37. Høgh-Jensen, H.; Loges, R.; Jørgensen, F.V.; Vinther, F.P.; Jensen, E.S. An Empirical Model for Quantification of Symbiotic Nitrogen Fixation in Grass-Clover Mixtures. Agric. Syst. 2004, 82, 181–194. [Google Scholar] [CrossRef]
  38. Ministry of Energy, Agriculture, the Environment, Nature and Digitalization of Schleswig Holstein Annual Balance of Nutrients and Alkali/Alkaline or Trace Metals of Wet Deposition in Schleswig-Holstein. Available online: https://www.schleswig-holstein.de/DE/Fachinhalte/H/hydrologie_niederschlag/Downloads/JahresbilanzNaehrstoffe.pdf (accessed on 4 February 2021).
  39. Parkin, T.B.; Venterea, R.T. USDA-ARS GRACEnet Project Protocols Chapter 3. Chamber-Based Trace Gas Flux Measurements. Flux 2010, 2010, 1–39. [Google Scholar]
  40. R Development Core Team R: A Language and Environment for Statistical Computing; R Foundation for Statistical Computing Vienna Austria: Vienna, Austria, 2019; ISBN 3-900051-07-0. [CrossRef] [Green Version]
  41. Bretz, F.; Hothorn, T.; Westfall, P. Multiple Comparisons Using R; CRC Press: Boca Raton, FL, USA, 2016; ISBN 978-1-4200-1090-9. [Google Scholar]
  42. Burnham, K.P.; Anderson, D.R.; Burnham, K.P.; Anderson, D.R. Burnham-Anderson, Model Selection. 2004. Available online: http://spider.ipac.caltech.edu/staff/fmasci/home/astro_refs/AIC_in_modelselection.pdf (accessed on 4 February 2021).
  43. Lorenz, H.; Reinsch, T.; Kluß, C.; Taube, F.; Loges, R. Does the Admixture of Forage Herbs Affect the Yield Performance, Yield Stability and Forage Quality of a Grass Clover Ley? Sustainability 2020, 12, 5842. [Google Scholar] [CrossRef]
  44. Komainda, M.; Küchenmeister, F.; Küchenmeister, K.; Kayser, M.; Wrage-Mönnig, N.; Isselstein, J. Drought Tolerance Is Determined by Species Identity and Functional Group Diversity Rather than by Species Diversity within Multi-Species Swards. Eur. J. Agron. 2020, 119, 126116. [Google Scholar] [CrossRef]
  45. Reinsch, T.; Malisch, C.; Loges, R.; Taube, F. Nitrous Oxide Emissions from Grass–Clover Swards as Influenced by Sward Age and Biological Nitrogen Fixation. Grass Forage Sci. 2020, 75, 372–384. [Google Scholar] [CrossRef]
  46. Vinther, F.P. Biological Nitrogen Fixation in Grass-Clover Affected by Animal Excreta. Plant Soil 2020, 203, 207–215. [Google Scholar] [CrossRef]
  47. Ledgard, S.F.; Steele, K.W. Biological Nitrogen Fixation in Mixed Legume/Grass Pastures. Plant Soil 1992, 141, 137–153. [Google Scholar] [CrossRef]
  48. Lüscher, A.; Mueller-Harvey, I.; Soussana, J.F.; Rees, R.M.; Peyraud, J.L. Potential of Legume-Based Grassland-Livestock Systems in Europe: A Review. Grass Forage Sci. 2014, 69, 206–228. [Google Scholar] [CrossRef]
  49. Ledgard, S.F. Nitrogen Cycling in Low Input Legume-Based Agriculture, with Emphasis on Legume/Grass Pastures. Plant Soil 2001, 228, 43–59. [Google Scholar] [CrossRef]
  50. Rafique, R.; Hennessy, D.; Kiely, G. Nitrous Oxide Emission from Grazed Grassland Under Different Management Systems. Ecosystems 2011, 14, 563–582. [Google Scholar] [CrossRef]
  51. Saggar, S.; Andrew, R.M.; Tate, K.R.; Hedley, C.B.; Rodda, N.J.; Townsend, J.A. Modelling Nitrous Oxide Emissions from Dairy-Grazed Pastures. Nutr. Cycl. Agroecosyst. 2004, 68, 243–255. [Google Scholar] [CrossRef]
  52. Rees, R.M.; Augustin, J.; Alberti, G.; Ball, B.C.; Boeckx, P.; Cantarel, A.; Castaldi, S.; Chirinda, N.; Chojnicki, B.; Giebels, M.; et al. Nitrous Oxide Emissions from European Agriculture—An Analysis of Variability and Drivers of Emissions from Field Experiments. Biogeosciences 2013, 10, 2671–2682. [Google Scholar] [CrossRef] [Green Version]
  53. de Klein, C.A.M.; Shepherd, M.A.; van der Weerden, T.J. Nitrous Oxide Emissions from Grazed Grasslands: Interactions between the N Cycle and Climate Change—A New Zealand Case Study. Curr. Opin. Environ. Sustain. 2014, 9–10, 131–139. [Google Scholar] [CrossRef]
  54. Holtan-Hartwig, L.; Dörsch, P.; Bakken, L.R. Low Temperature Control of Soil Denitrifying Communities: Kinetics of N2O Production and Reduction. Soil Biol. Biochem. 2002, 34, 1797–1806. [Google Scholar] [CrossRef]
  55. Cavigelli, M.A.; Robertson, G.P. Role of Denitrifier Diversity in Rates of Nitrous Oxide Consumption in a Terrestrial Ecosystem. Soil Biol. Biochem. 2001, 33, 297–310. [Google Scholar] [CrossRef]
  56. Levy-Booth, D.J.; Prescott, C.E.; Grayston, S.J. Microbial Functional Genes Involved in Nitrogen Fixation, Nitrification and Denitrification in Forest Ecosystems. Soil Biol. Biochem. 2014, 75, 11–25. [Google Scholar] [CrossRef]
  57. Saggar, S.; Jha, N.; Deslippe, J.; Bolan, N.S.; Luo, J.; Giltrap, D.L.; Kim, D.G.; Zaman, M.; Tillman, R.W. Denitrification and N2O: N2 Production in Temperate Grasslands: Processes, Measurements, Modelling and Mitigating Negative Impacts. Sci. Total Environ. 2013, 465, 173–195. [Google Scholar] [CrossRef]
  58. Hoeft, I.; Steude, K.; Wrage, N.; Veldkamp, E. Response of Nitrogen Oxide Emissions to Grazer Species and Plant Species Composition in Temperate Agricultural Grassland. Agric. Ecosyst. Environ. 2012, 151, 34–43. [Google Scholar] [CrossRef]
  59. Niklaus, P.A.; Le Roux, X.; Poly, F.; Buchmann, N.; Scherer-Lorenzen, M.; Weigelt, A.; Barnard, R.L. Plant Species Diversity Affects Soil–Atmosphere Fluxes of Methane and Nitrous Oxide. Oecologia 2016, 181, 919–930. [Google Scholar] [CrossRef] [PubMed] [Green Version]
  60. Van Groenigen, J.W.; Kuikman, P.J.; De Groot, W.J.M.; Velthof, G.L. Nitrous Oxide Emission from Urine-Treated Soil as Influenced by Urine Composition and Soil Physical Conditions. Soil Biol. Biochem. 2005, 37, 463–473. [Google Scholar] [CrossRef]
  61. Van der Weerden, T.J.; Luo, J.; de Klein, C.A.M.; Hoogendoorn, C.J.; Littlejohn, R.P.; Rys, G.J. Disaggregating Nitrous Oxide Emission Factors for Ruminant Urine and Dung Deposited onto Pastoral Soils. Agric. Ecosyst. Environ. 2011, 141, 426–436. [Google Scholar] [CrossRef]
  62. Biernat, L.; Taube, F.; Vogeler, I.; Reinsch, T.; Kluß, C.; Loges, R. Is Organic Agriculture in Line with the EU-Nitrate Directive? On-Farm Nitrate Leaching from Organic and Conventional Arable Crop Rotations. Agric. Ecosyst. Environ. 2020, 298, 106964. [Google Scholar] [CrossRef]
  63. Smit, H.P.J.; Reinsch, T.; Swanepoel, P.A.; Kluß, C. Grazing under Irrigation Affects N 2 O-Emissions Substantially in South Africa. Atmosphere 2020, 11, 925. [Google Scholar] [CrossRef]
  64. Bracken, C.J.; Lanigan, G.J.; Richards, K.G.; Müller, C.; Tracy, S.R.; Grant, J.; Krol, D.J.; Sheridan, H.; Lynch, M.B.; Grace, C.; et al. Sward Composition and Soil Moisture Conditions Affect Nitrous Oxide Emissions and Soil Nitrogen Dynamics Following Urea-Nitrogen Application. Sci. Total Environ. 2020, 722, 137780. [Google Scholar] [CrossRef]
  65. Barneze, A.S.; Whitaker, J.; McNamara, N.P.; Ostle, N.J. Legumes Increase Grassland Productivity with No Effect on Nitrous Oxide Emissions. Plant Soil 2020, 446, 163–177. [Google Scholar] [CrossRef] [Green Version]
  66. Abalos, D.; De Deyn, G.B.; Kuyper, T.W.; van Groenigen, J.W. Plant Species Identity Surpasses Species Richness as a Key Driver of N2O Emissions from Grassland. Glob. Chang. Biol. 2014, 20, 265–275. [Google Scholar] [CrossRef] [PubMed]
  67. Vogeler, I.; Hansen, E.M.; Thomsen, I.K.; Østergaard, H.S. Legumes in Catch Crop Mixtures: Effects on Nitrogen Retention and Availability, and Leaching Losses. J. Environ. Manag. 2019, 239, 324–332. [Google Scholar] [CrossRef]
  68. Bessler, H.; Oelmann, Y.; Roscher, C.; Buchmann, N.; Scherer-Lorenzen, M.; Schulze, E.-D.; Temperton, V.M.; Wilcke, W.; Engels, C. Nitrogen Uptake by Grassland Communities: Contribution of N2 Fixation, Facilitation, Complementarity, and Species Dominance. Plant Soil 2012, 358, 301–322. [Google Scholar] [CrossRef]
  69. Chen, S.; Lin, S.; Reinsch, T.; Loges, R.; Hasler, M.; Taube, F. Comparison of Ingrowth Core and Sequential Soil Core Methods for Estimating Belowground Net Primary Production in Grass–Clover Swards. Grass Forage Sci. 2016, 71, 515–528. [Google Scholar] [CrossRef]
  70. Lü, X.T.; Dijkstra, F.A.; Kong, D.L.; Wang, Z.W.; Han, X.G. Plant Nitrogen Uptake Drives Responses of Productivity to Nitrogen and Water Addition in a Grassland. Sci. Rep. 2014, 4, 1–7. [Google Scholar] [CrossRef] [Green Version]
  71. Lambers, H.; Chapin, F.S., III; Pons, T.L. Plant Physiological Ecology, 2nd ed.; Springer: Berlin/Heidelberg, Germany, 2008; ISBN 978-0-387-78340-6. [Google Scholar]
  72. de Klein, C.A.; Van Logtestijn, R.S. Denitrification in Grassland Soils in The Netherlands in Relation to Irrigation, N-Application Rate, Soil Water Content and Soil Temperature. Soil Biol. Biochem. 1996, 28, 231–237. [Google Scholar] [CrossRef]
  73. Davidson, E.A. Fluxes of nitrous oxide and nitric oxide from terrestrial ecosystems. In Microbial Production and Consumption of Greenhouse Gases: Methane, Nitrogen Oxides and Halomethanes; American Society for Microbiology: Washington, DC, USA, 1991; pp. 219–235. [Google Scholar]
  74. de Klein, C.A.M.; Eckard, R.J. Targeted Technologies for Nitrous Oxide Abatement from Animal Agriculture. Aust. J. Exp. Agric. 2008, 48, 14–20. [Google Scholar] [CrossRef]
  75. Maag, M.; Vinther, F.P. Nitrous Oxide Emission by Nitrification and Denitrification in Different Soil Types and at Different Soil Moisture Contents and Temperatures. Appl. Soil Ecol. 1996, 4, 5–14. [Google Scholar] [CrossRef]
  76. Granli, T.; Bøckman, O.C. Nitrous Oxide (N2O) Emissions from Soils in Warm Climates. Fertil. Res. 1995, 42, 159–163. [Google Scholar] [CrossRef]
  77. Flessa, H.; Dorsch, P.; Beese, F. Seasonal Variation of N2O and CH4 Fluxes in Differently Managed Arable Soils in Southern Germany. J. Geophys. Res. 1995, 100, 23115–23124. [Google Scholar] [CrossRef]
  78. Burton, D.L.; Beauchamp, E.G. Profile Nitrous Oxide and Carbon Dioxide Concentrations in a Soil Subject to Freezing. Soil Sci. Soc. Am. J. 1994, 58, 115–122. [Google Scholar] [CrossRef]
  79. Nyameasem, J.K.; Malisch, C.S.; Loges, R.; Taube, F.; Kluß, C.; Vogeler, I.; Reinsch, T. Nitrous Oxide Emission from Grazing Is Low across a Gradient of PlantS Functional Diversity and Soil Conditions-Dataset. Figshare 2021. [Google Scholar] [CrossRef]
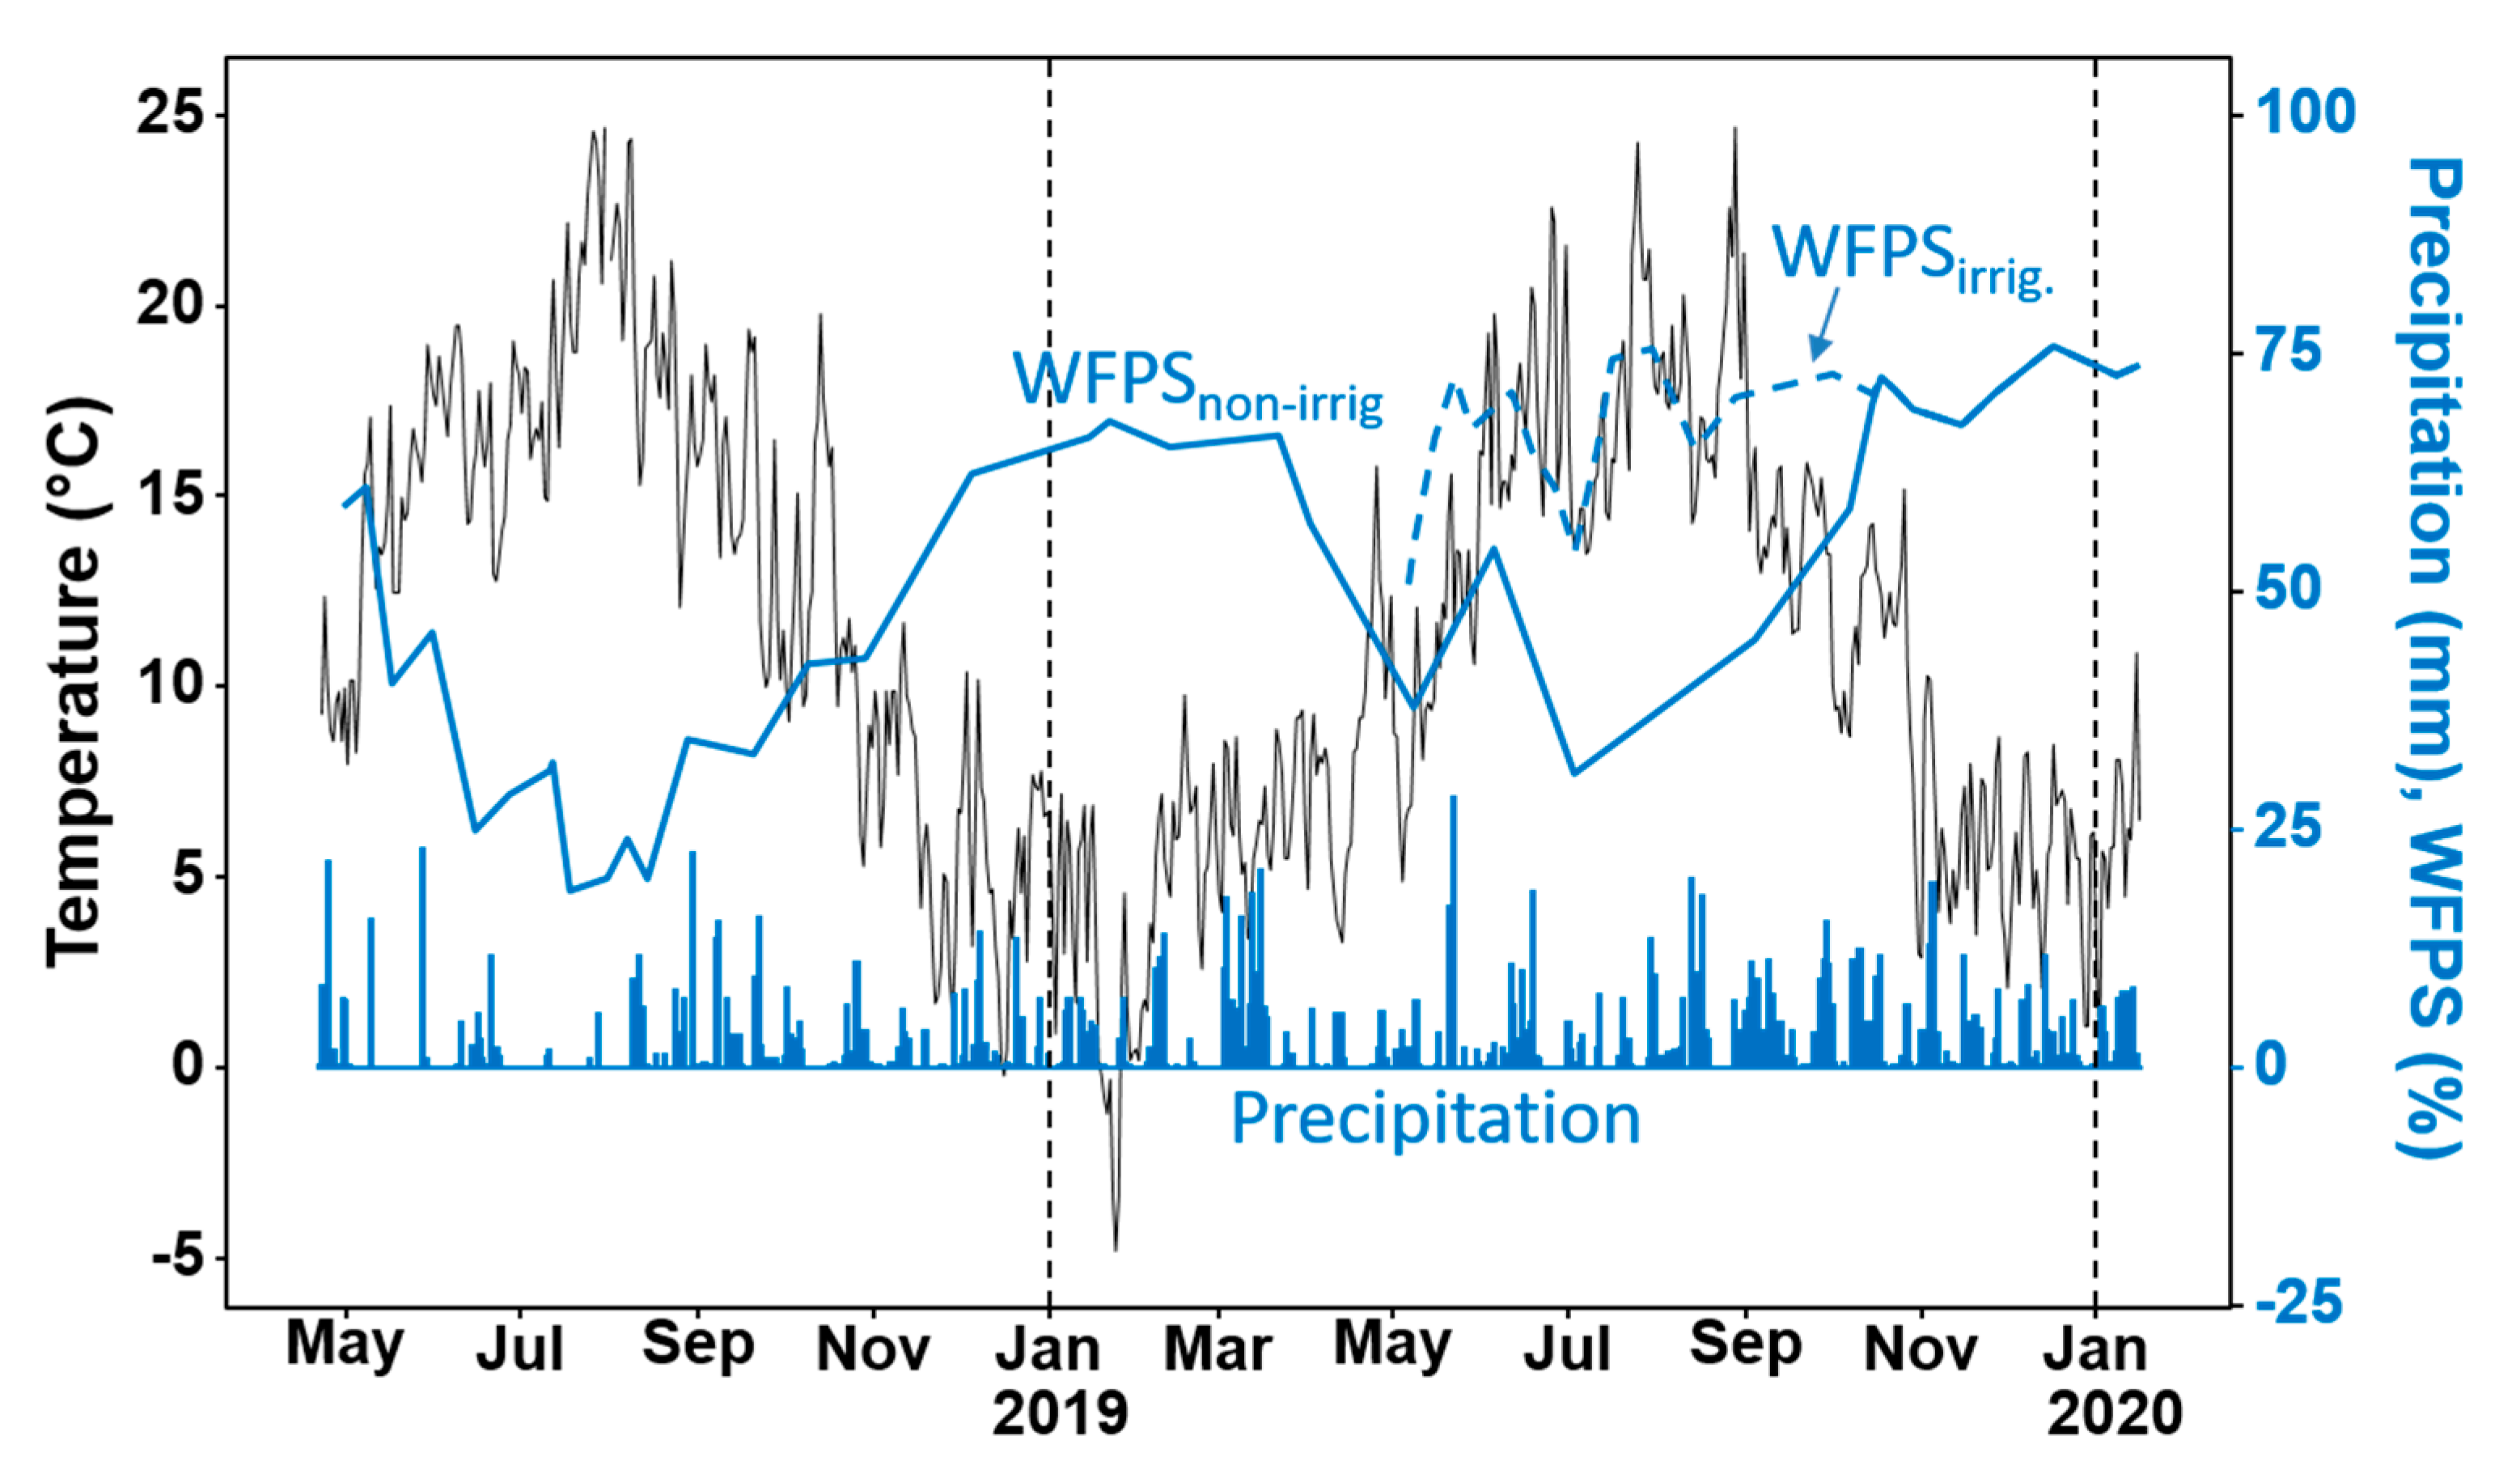
Figure 1. Weather parameters and water-filled pore space (WFPS) during the experimental period. Blue (broken) lines demarcate the experimental years; non-irrig: Non-irrigated; irrig.: Irrigated.
Atmosphere 12 00223 g001
Figure 2. Daily N2O-N emissions from diverse grasslands grazed by dairy cows. prwc: Perennial ryegrass and white clover swards; prwrc: Perennial ryegrass, white- and red clover swards; prwrch: Perennial ryegrass, white- and red clover + herbs. The arrows indicate grazing events.
Atmosphere 12 00223 g002
Figure 3. Mean values of the N2O-N emission from diverse pastures grazed by dairy cows in a 3–5 week rotational cycle. Error bars are the standard error of the mean; * accumulated for eight months (May–December); the annual mean was accumulated from May 2018 to April 2019. prwc: Perennial ryegrass and white clover swards; prwrc: Perennial ryegrass, white- and red clover swards; prwrch: Perennial ryegrass, white- and red clover + herbs.
Atmosphere 12 00223 g003
Figure 4. Changes in the soil (a) ammonium (mg N kg−1 dry soil), and (b) nitrate contents (mg N kg−1 dry soil) plus daily emissions of (c) nitrous oxide (mg N m−2 d−1) from (A) non-irrigated pastures pooled across grasslands and (B) irrigated pastures.
Atmosphere 12 00223 g004
Figure 5. Best models showing stoichiometric relationships between the cumulative N2O-N emission and (a) N input, (b) patch residual N, (c) ammonium intensity of (d) nitrate intensity. (a,b) Based on data from experiment 2, (c,d) based on the irrigated experiment (3); the grey region is 95% confidence interval.
Atmosphere 12 00223 g005
Figure 6. Bar charts showing N2O-N EF (% of applied excreta N emitted as N2O-N) as affected by (a) the grassland-treatment interaction effect in non-irrigated pastures and (b) season-treatment interaction effect in irrigated pastures. Means with different letters are significantly different [p < 0.05; ABC being the grassland effect, jkl being the seasonal effect, and abc being the treatment effect].
Atmosphere 12 00223 g006
Figure 7. Graphs showing stoichiometric relationships between N2O-N EF from pastures and (a) grass or (b) legume proportion, (c) N uptake, (d) PRN, (e) water-filled pore space, and (f) soil temperature. The grey region is a 95% confidence interval. (ad) Pooled across grasslands; (e,f) pooled across experiments 2 and 3. Individual dots indicate replicates of dung and urine patches.
Atmosphere 12 00223 g007
Table 1. Summary of the experimental designs and measurements.
Experimental DesignMeasurements
Experiment 1: Grassland diversity affects N2O emission from pastures under grazing stress
Static chambers established on the three diverse pastures (prwc, prwrc, and prwrch); in a randomized complete block design, laid out in three replicate blocks (18 experimental units in all); each replicate plot measured 12 × 9 m; Jersey dairy cows rotationally grazed on a 3–5-week cycle depending on the pastures’ growth rate.Gas sampling was done at least once a week to measure N2O; gas sampling started from April 2018 to January 2020, weather parameters were monitored.
Experiment 2: Botanical and environmental factors determine N2O emission from soils
Static chambers arranged in a split-split-split plot design; the diverse grasslands as main plots, excreta treatments as split-split plots, and season as split-split-split plots, laid out in three replicated blocks (27 experimental units per each set-up); urine and dung applied once in spring, summer and autumn; each application was measured for one year; duplicate plots for soil sampling.Gas sampling started immediately after excreta application; was done at least once a week for one year, except in December where only three samples were taken; weather parameters, soil mineral N concentration, biomass dry matter and N yields, species composition, water-filled pore space (WFPS) were monitored.
Experiment 3: N2O EF for cow excreta deposited on irrigated pastures is lower for systems with legume as a sole N source compared with the IPCC default.
Static chambers were arranged in a split-split plot design, using the prwc swards; the season of excreta application as a split-plot and excreta treatment as a split-split plot, all laid out randomly in one block with four replicates (12 experimental units per each set-up); duplicate plots were used for soil sampling.Gas sampling was done at least once a week for 100 days; weather parameters, mineral N concentration, biomass dry matter and WFPS were monitored; sampling duration was 100 days.
Table 2. Cow excreta chemical characteristics and application rates.
ParametersExperiment 2Experiment 3
SpringSummerAutumnSpringSummerAutumn
UDUDUDUDUDUD
N (%)0.440.490.520.420.460.390.540.450.510.360.430.41
C:N2.712.22.214.22.515.32.514.53.414.54.012.5
Application rate (kg m−2) *2.52.22.52.22.52.22.52.22.52.22.52.2
N loading rate (kg ha−1)458449542385479358563413529326451380
Date of application30.04.201811.07.201808.10.201806.05.201916.07.201909.10.2019
U: Urine; D: Dung; * excreta was applied only once per measurement period.
Table 3. Mean values of the measured parameters showing main effects of grassland diversity (grassland), excreta type (treatment), and timing of excreta deposition (season).
ParametersGrasslandTreatmentSeasonSEM
prwcprwrcprwrchControlDungUrineSpringSummerAutumn
Experiment 2—Non-irrigated simulated grazing
Grass (%)74 c55 b47 a48 a60 b67 c5761581.77
Legume (%)18 a42 c33 b41 c30 b22 a34 b29 a30 ab1.62
Herb (%)--184776671.14
Unsown (%)8 b3 a2 a6333550.65
DM yield (Mg ha−1)9.8 a11.7 b12.4 b11.810.711.312.7 c11.2 b9.9 a0.26
Herbage N (g N kg DM−1)35.4 a37.3 b36.7 b33.2 a36.7 b39.5 c31.2 a34.7 b43.4 c0.74
β BFN (kg ha−1 year−1)106 a279 c241 b294 c187 b146 a263 b190 a174 a13.8
N input (kg N ha−1 year−1)416 a589 c550 b307 a597 b651 c578 c512 b465 a21.0
N uptake (kg N ha−1 year−1)344 a432 b447 b389 a394 a440 b397 a391 a435 b10.6
PRN (kg N ha−1 year−1)67 a152 b98 a-87 a198 b206 b176 c116 b26 a18.9
NO3 (mg N kg−1 dry soil)3.83.33.51.4 a3.5 b5.7 c2.2 a3.1 a5.4 b0.37
NH4 (mg N kg−1 dry soil)3.52.93.21.5 a2.9 b5.3 c2.83.92.90.26
α N2O (kg N ha−1 year−1)0.610.670.680.11 a0.87 b0.99 b1.01 c0.59b0.36a0.07
N2O (kg N ha−1 100 d−1)0.460.570.530.03 a0.71 b0.83 b0.92 b0.48 a0.17 a0.07
g N2O-N kg−1 N uptake year−11.831.731.670.29 a2.38 b2.56 b2.88 c1.55 b0.80 a0.21
N2O-N EF (%)0.170.190.19-0.190.180.30 c0.16 b0.09 a0.02
N2O-N EF1 (%)0.130.100.110.04 a0.14 b0.16 b0.16 b0.11 a0.08 a0.01
Experiment 3—Irrigated simulated grazing
NO3 (mg kg−1 dry soil)4.64--1.2 a4.7 b8.1 c2.2 a3.2 a8.5 b0.77
NH4 (mg kg−1 dry soil)4.80--1.8 a3.5 b9.1 c4.65.04.80.65
α N2O (kg N ha−1 100 d−1)0.81--0.05 a0.81 b1.59 c0.990.780.680.15
N2O-N EF (%)0.25---0.21 a0.29 b0.240.280.230.04
See Appendix A, Table A2 for the corresponding F- and p-values. Means with different letters are different at p < 0.05; SEM: Standard error of the pooled mean across grasslands, treatments, and seasons; β Estimated parameter. β BFN: Biologically fixed nitrogen; DM: dry matter; PRN: Patch residual N (PRN = N uptake − N input); N2O-N EF1 was calculated as % of N input (BFN + applied N) emitted as N2O-N; N2O-N EF was calculated as % of applied N emitted as N2O-N. * Accumulated for one year; α accumulated for 100 days. prwc: Perennial ryegrass and white clover swards; prwrc: Perennial ryegrass, white- and red clover swards; prwrch: Perennial ryegrass, white- and red clover + herbs.
Publisher’s Note: MDPI stays neutral with regard to jurisdictional claims in published maps and institutional affiliations.