
Trends and Source Contribution Characteristics of SO2, NOX, PM10 and PM2.5 Emissions in Sichuan Province from 2013 to 2017

Abstract
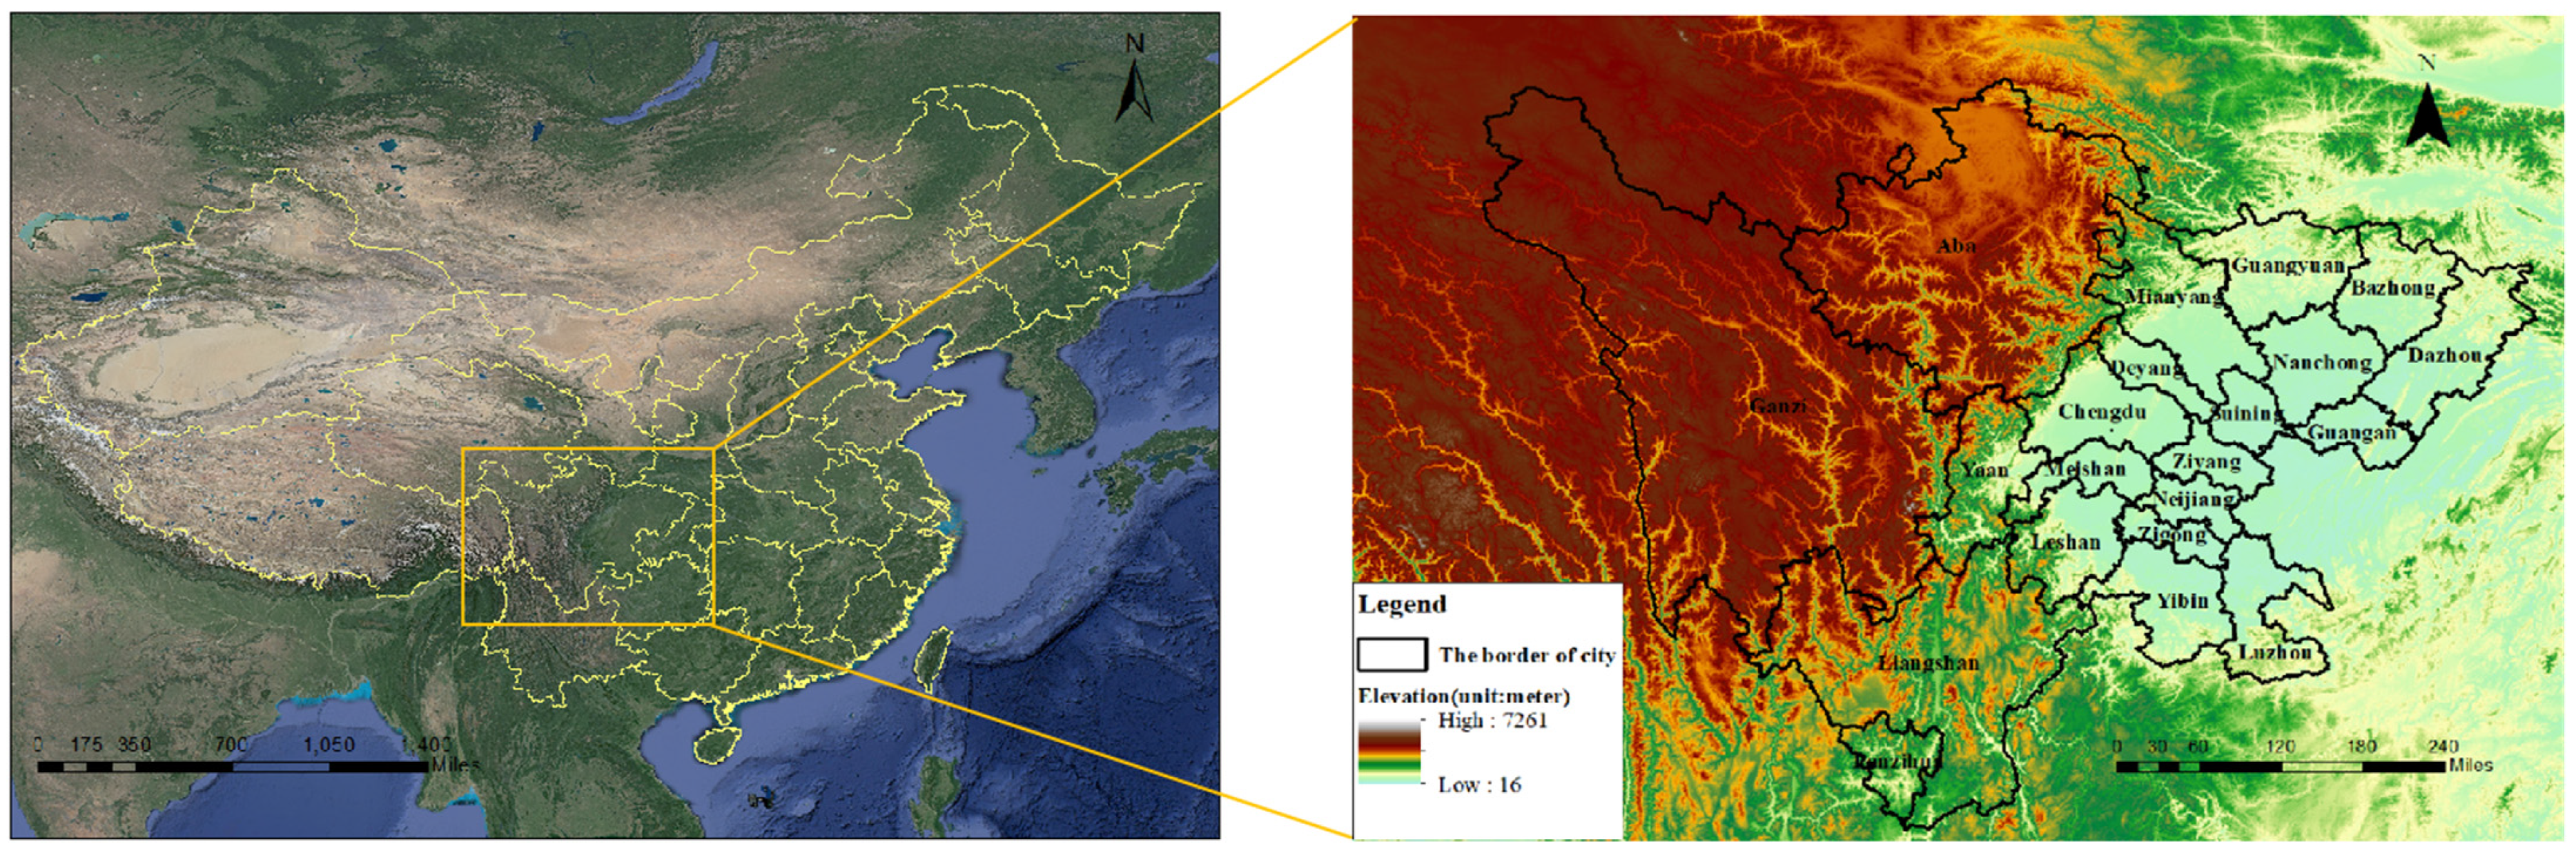
1. Introduction
2. Materials and Methods
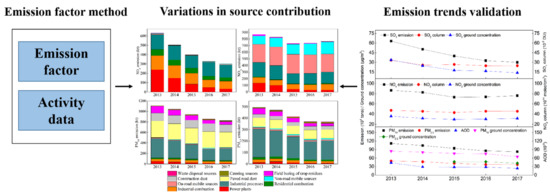
2.1. Methods for Emission Estimation
2.2. Activity Data Processing and Determination of Emission Factors
2.2.1. Activity Data Processing
2.2.2. Determination of Emission Factors
2.3. Verification of Emission Trends
2.4. Methods for Uncertainty Analysis
3. Results and Discussion
3.1. Emission Trends in Sichuan Province
3.2. Characterization of Emission Source Contribution Variation
3.2.1. SO2 Emission Characteristics Variation
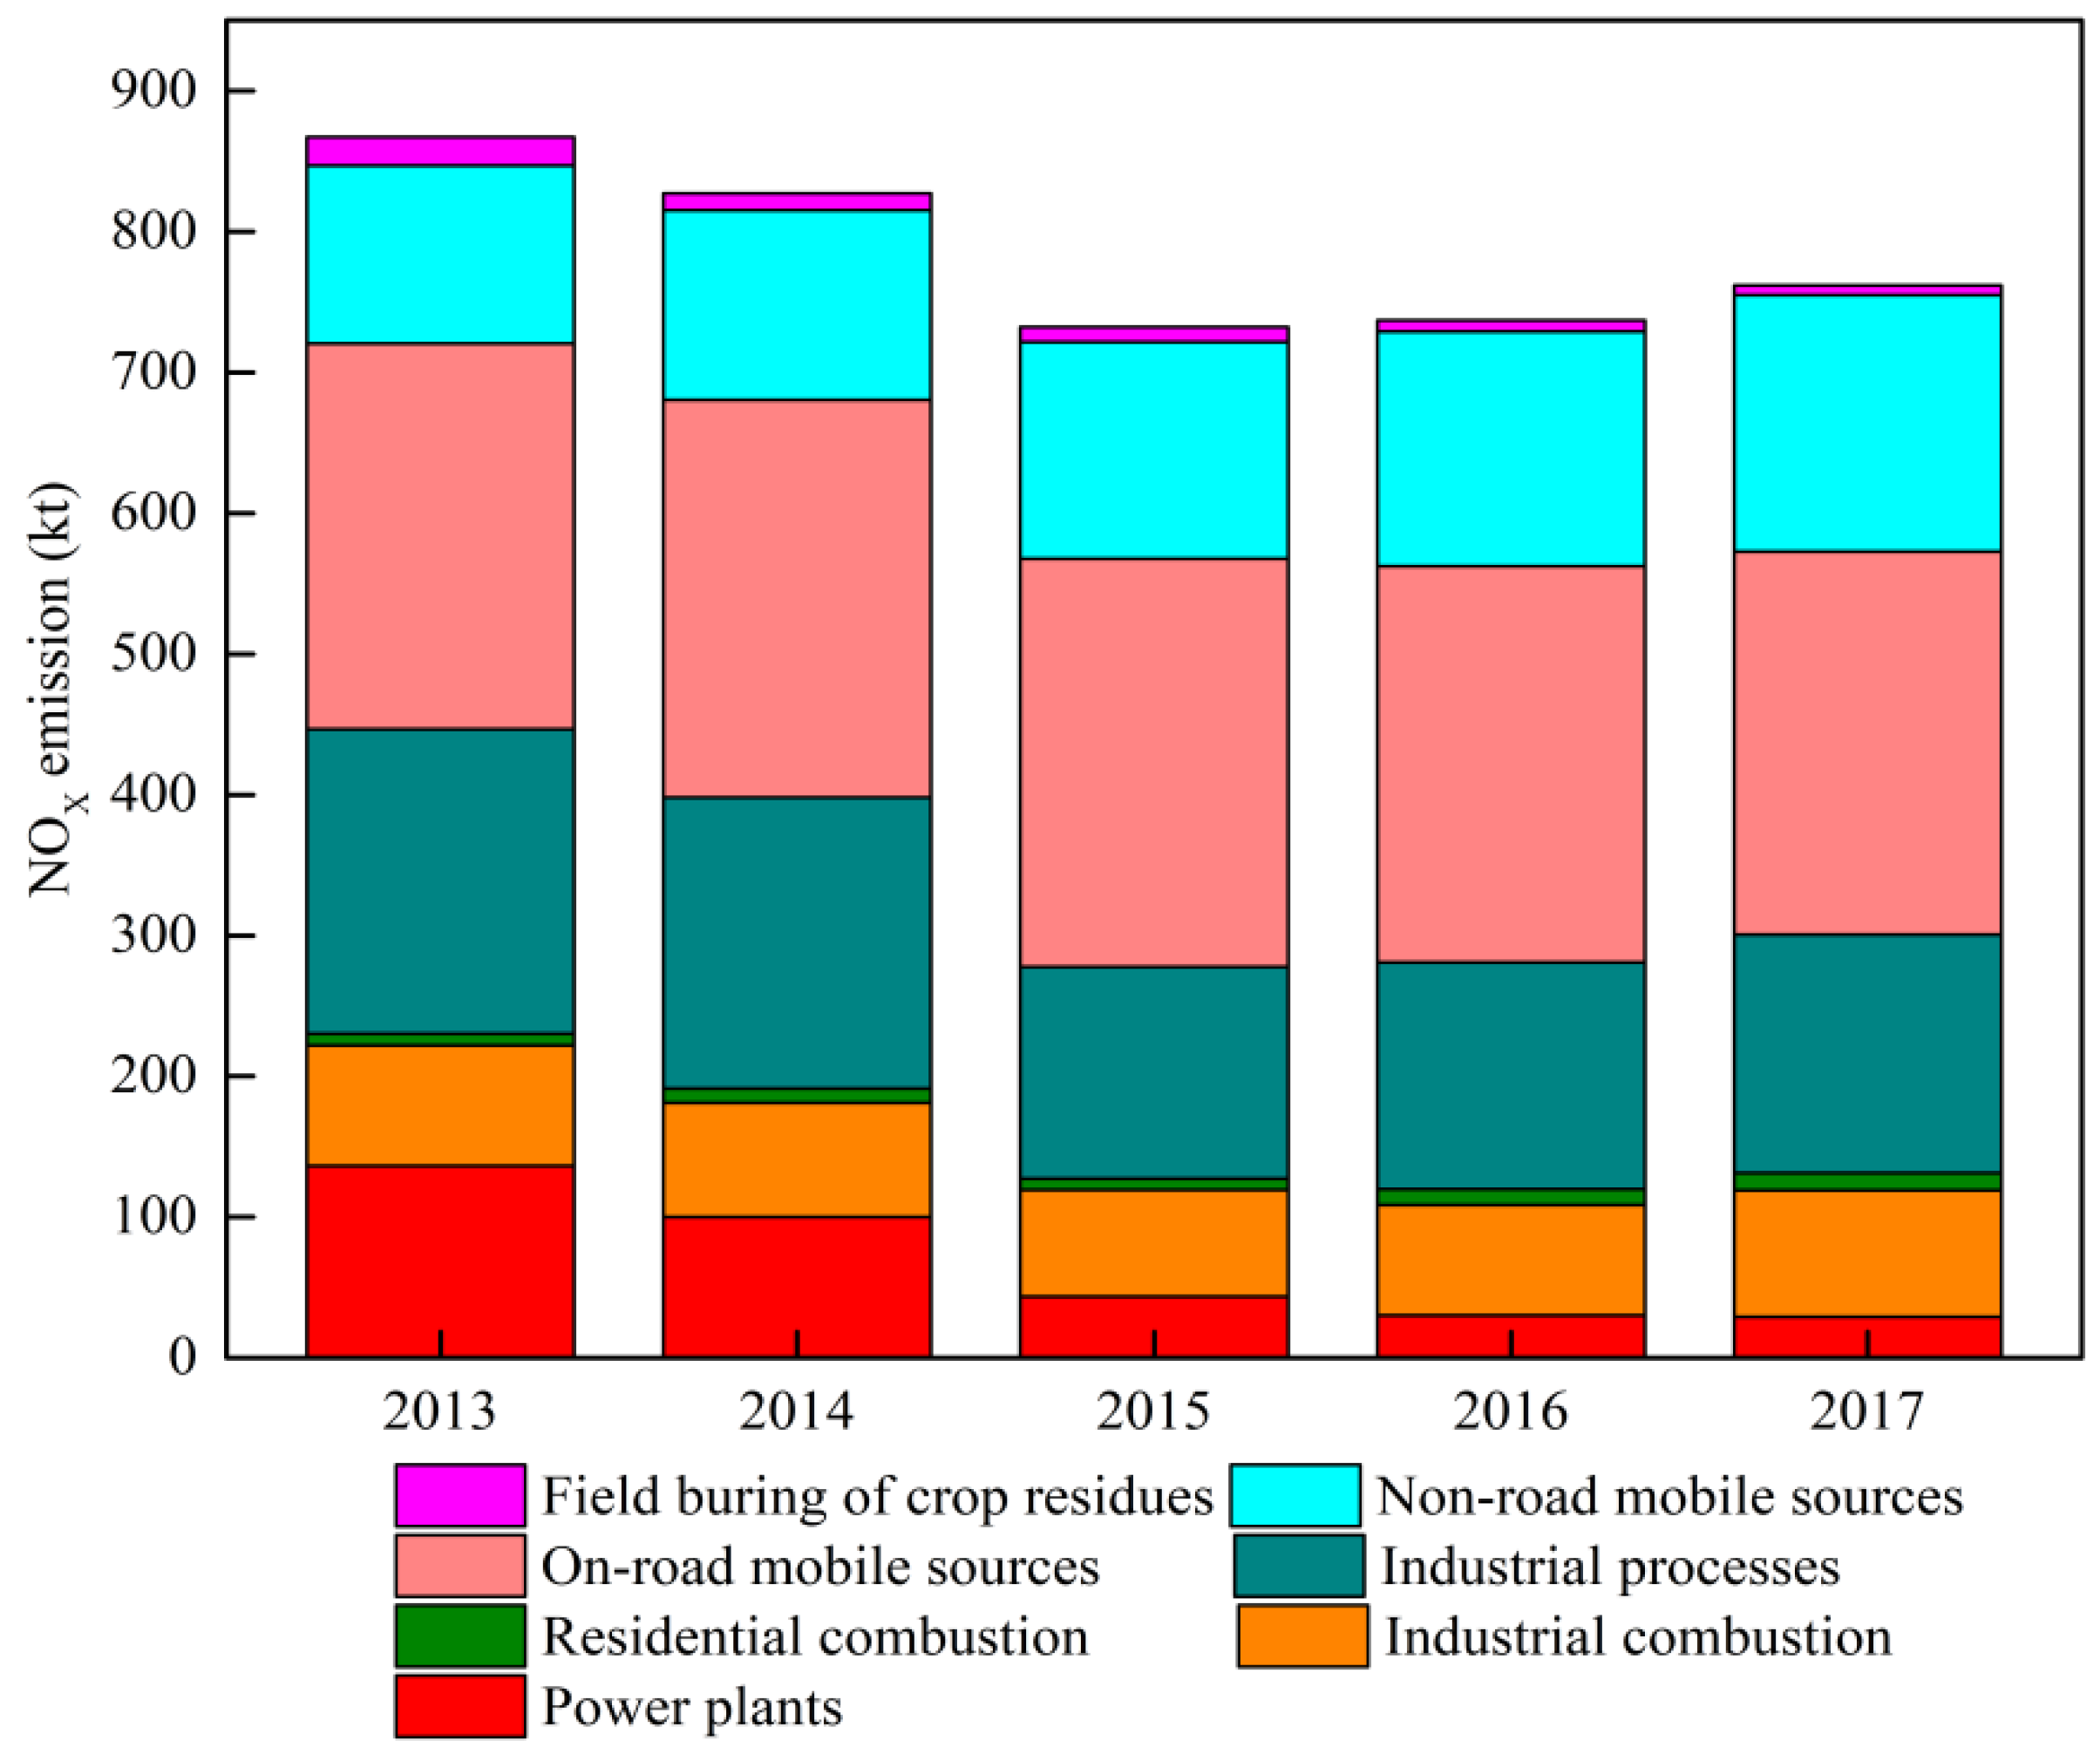
3.2.2. NOX Emission Characteristics Variation
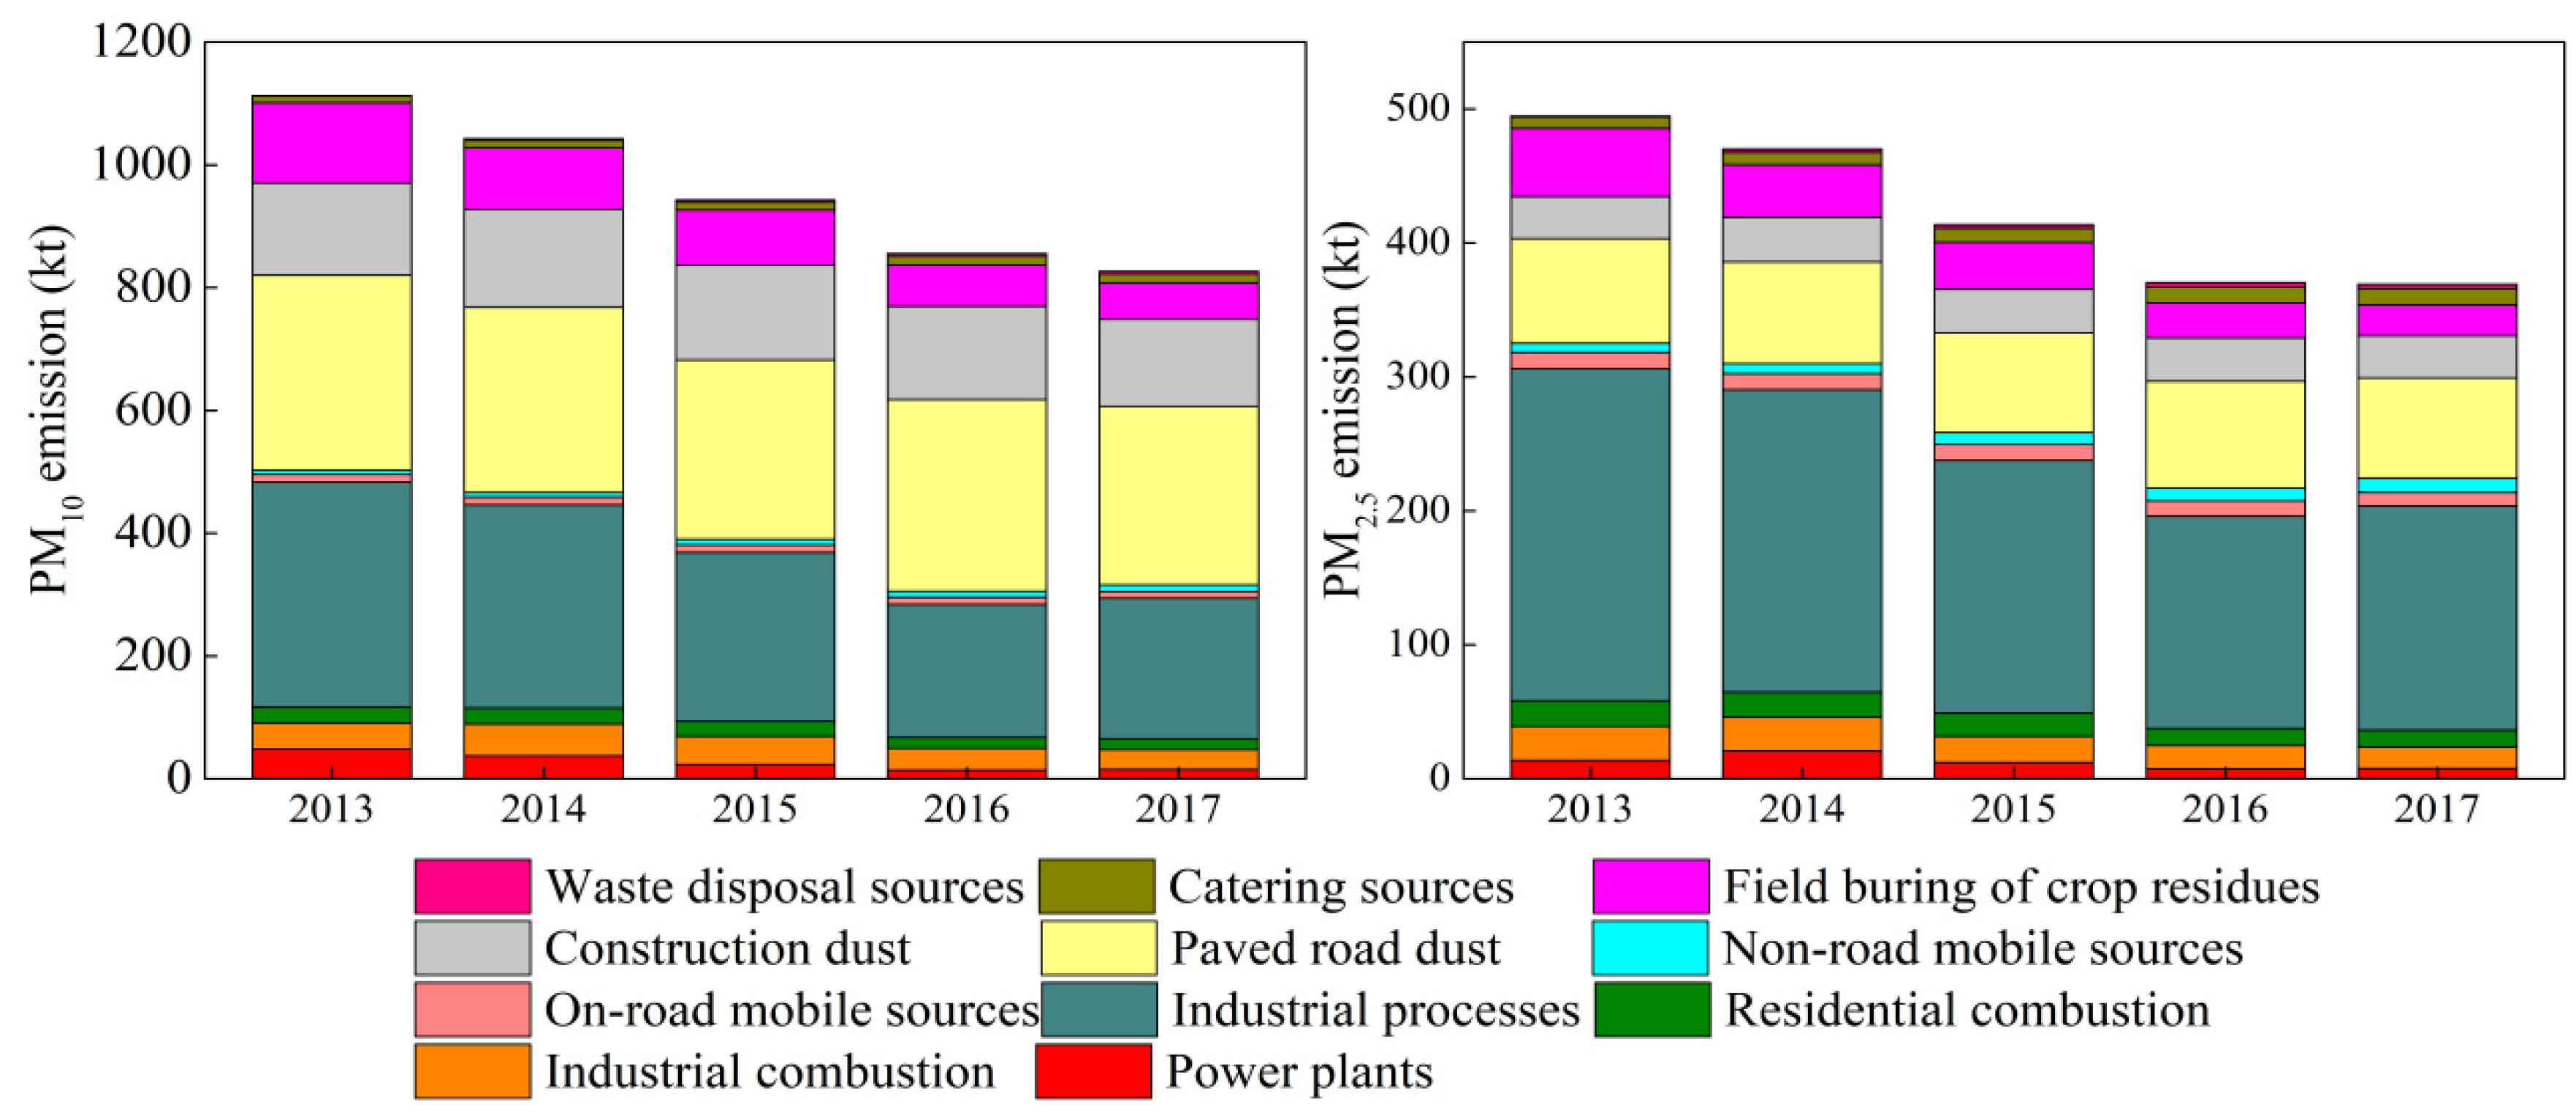
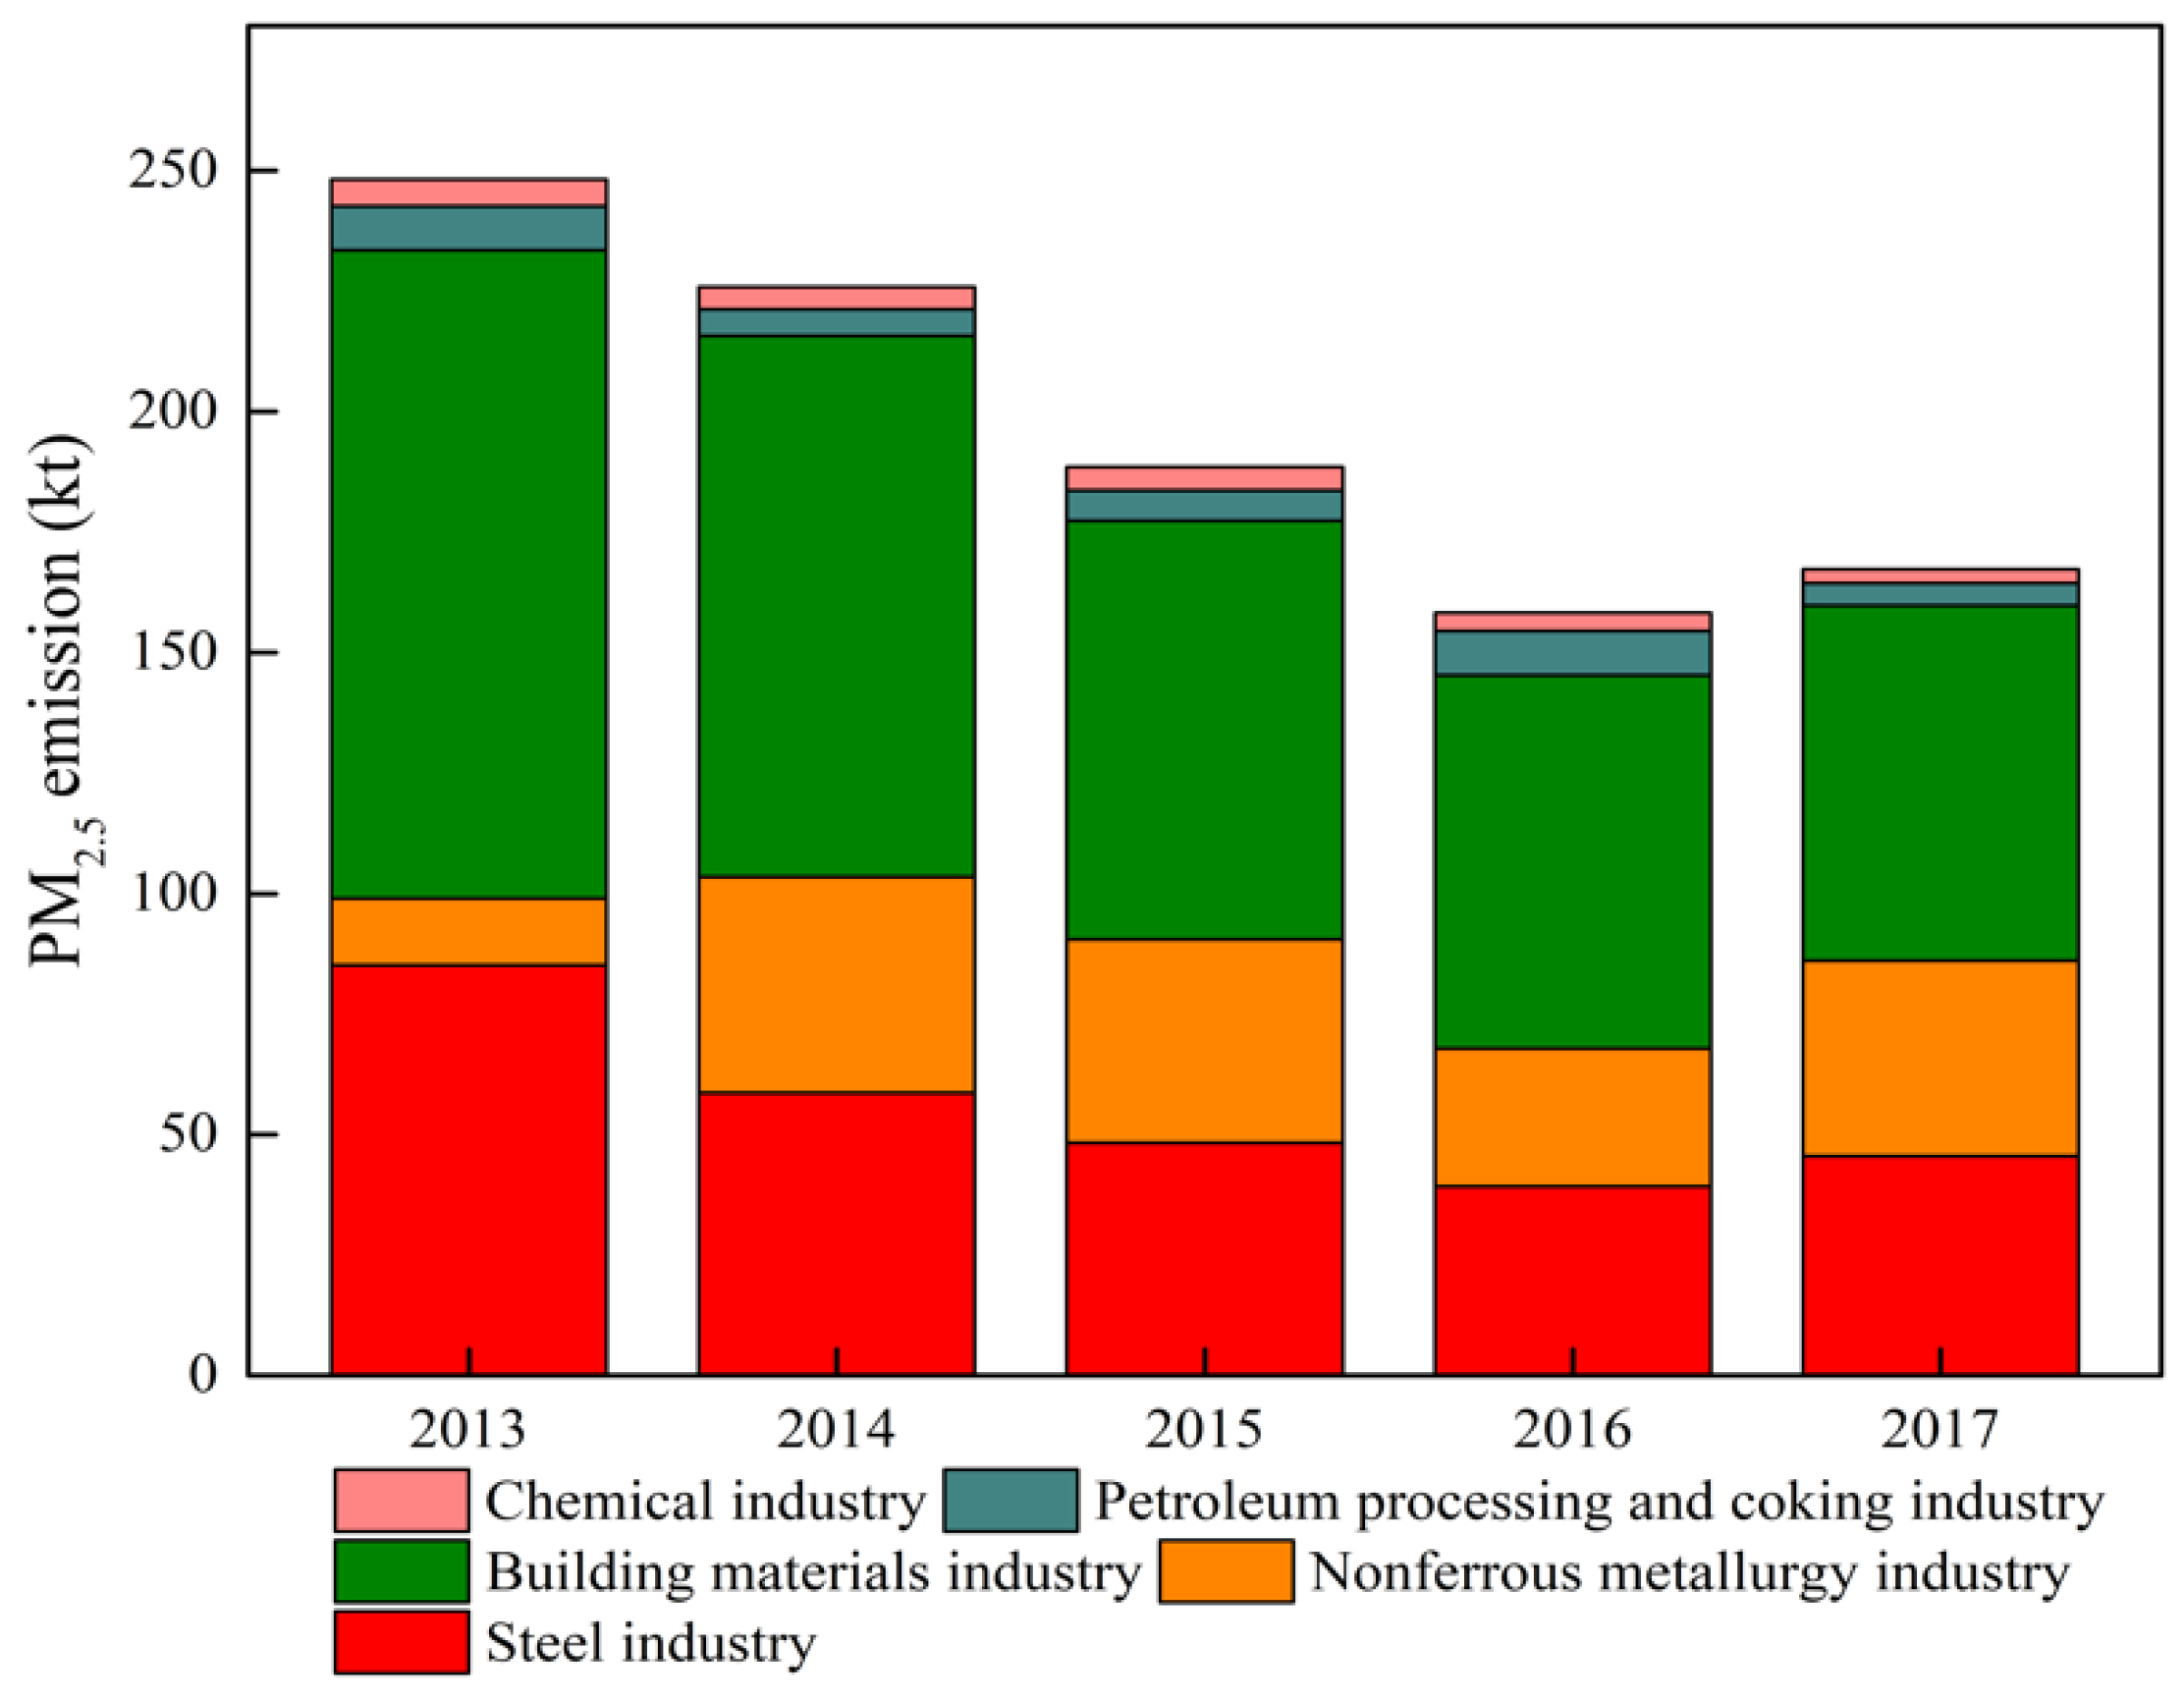
3.2.3. PM10 and PM2.5 Emissions Characteristics Variation
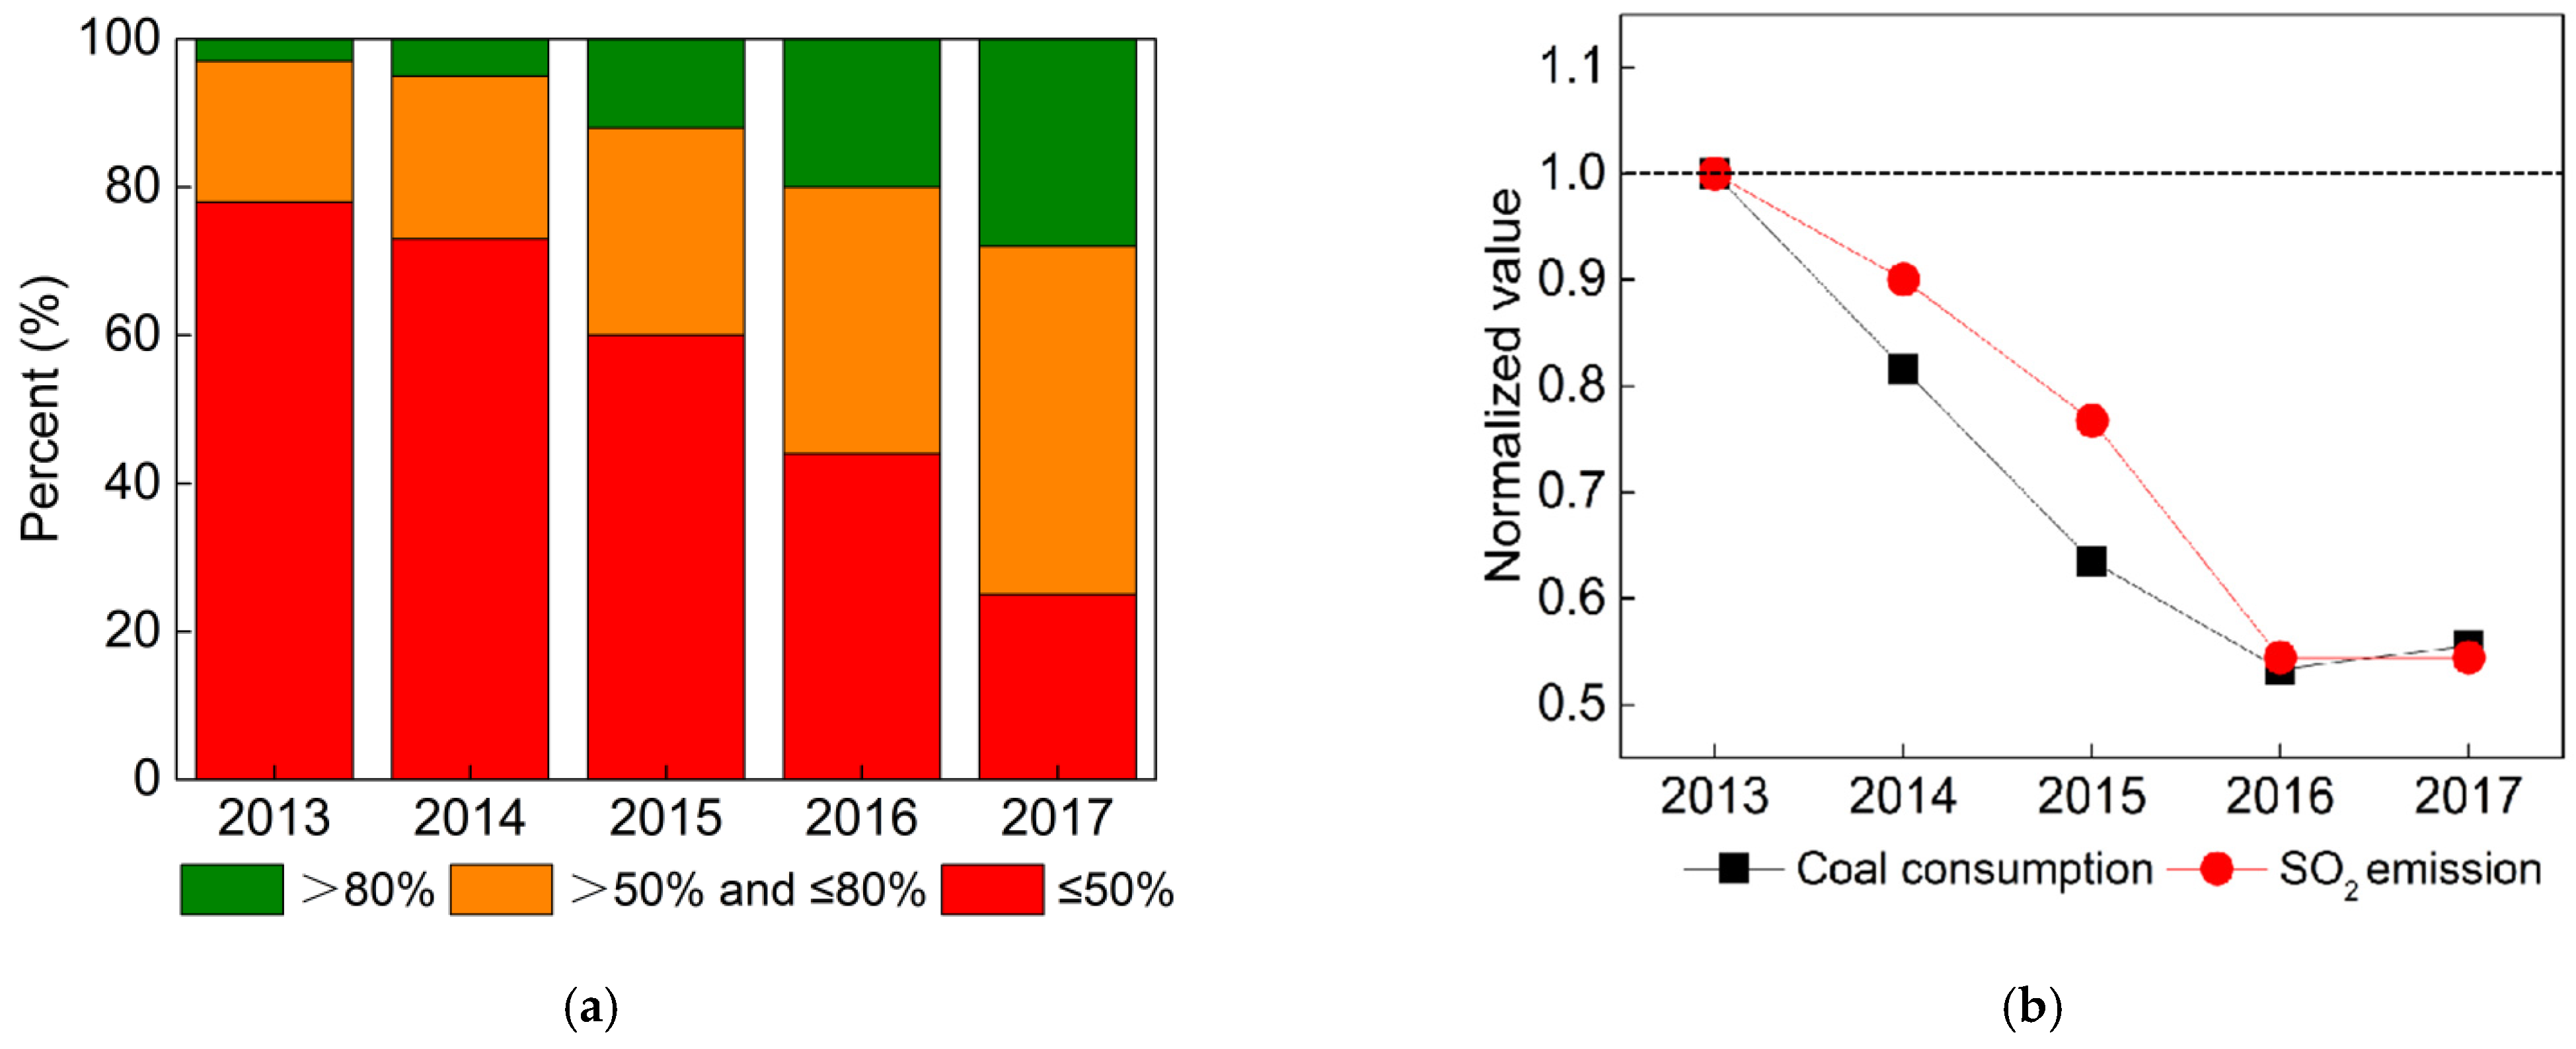
3.3. Emission Trends Validation
3.3.1. Comparison with Other Emission Inventories
3.3.2. Comparison with Satellite Data and Ground Concentrations
3.4. Uncertainties in Emission Estimates
4. Summary and Conclusions
Author Contributions
Funding
Acknowledgments
Conflicts of Interest
References
- Statistics Bureau of Sichuan Province (SBS). Sichuan Statistical Yearbook 2014—2018; China Statistics Press: Chengdu, China, 2014—2018. [Google Scholar]
- National Bureau of Statistics of China (NBS). China Statistical Yearbook 2018; China Statistics Press: Beijing, China, 2018. [Google Scholar]
- Liu, X.Y.; Chen, Q.L.; Che, H.Z.; Zhang, R.; Gu, K.; Zhang, H.; Zhao, T. Spatial distribution and temporal variation of aerosol optical depth in the Sichuan basin, China, the recent ten years. Atmos. Environ. 2016, 147, 434–445. [Google Scholar] [CrossRef]
- Tian, P.; Cao, X.; Zhang, L.; Sun, N.; Sun, L.; Logan, T.; Shi, J.; Wang, Y.; Ji, Y.; Lin, Y.; et al. Aerosol vertical distribution and optical properties over China from long-term satellite and ground-based remote sensing. Atmos. Chem. Phys. 2017, 17, 1–47. [Google Scholar] [CrossRef]
- Ning, G.C.; Wang, S.G.; Yim, S.H.L.; Li, J.; Hu, Y.; Shang, Z.; Wang, J.; Wang, J. Impact of low-pressure systems on winter heavy air pollution in the northwest Sichuan Basin, China. Atmos. Chem. Phys. 2018, 18, 13601–13615. [Google Scholar] [CrossRef]
- Zhao, S.P.; Yu, Y.; Yin, D.Y.; Qin, D.; He, J.; Dong, L. Spatial patterns and temporal variations of six criteria air pollutants during 2015 to 2017 in the city clusters of Sichuan Basin. China Sci. Total Environ. 2018, 624, 540–557. [Google Scholar] [CrossRef]
- Tang, Y.L.; Yang, F.M.; Zhan, Y. High resolution spatiotemporal distribution and correlation analysis of PM2.5 and PM10 concentrations in the Sichuan Basin. China Environ. Sci. 2019, 12, 4950–4958. [Google Scholar]
- Wang, C.Y.; He, M.Q.; Chen, J.H.; Liu, Z. Temporal and spatial variation characteristics of MODIS Aerosol Optical Depth in Sichuan Basin from 2006 to 2017. Res. Environ. Sci. 2020, 33, 54–62. [Google Scholar]
- Department of Ecology and Environment of Sichuan Province (DEESP). Sichuan Environmental Status Bulletin (2013-2017). 2018. Available online: http://sthjt.sc.gov.cn/sthjt/c104157/list_level2.shtml (accessed on 30 June 2020).
- He, K.B.; Yang, F.K.; Ma, Y.L.; Zhang, Q.; Yao, X.; Chan, T.; Mulawa, P. The characteristics of PM2.5 in Beijing, China. Atmos. Environ. 2001, 35, 4959–4970. [Google Scholar] [CrossRef]
- Yang, Y.R.; Liu, X.G.; Ou, Y.; Wang, J.; An, J.; Zhang, Y.; Zhang, F. Formation mechanism of continuous extreme haze episode in the megacity Beijing, China, in January 2013. Atmos. Res. 2015, 155, 192–203. [Google Scholar] [CrossRef]
- Chen, Z.; Xie, X.; Cai, J.; Chen, D.; Gao, B.; He, B.; Cheng, N.; Xu, B. Understanding meteorological influences on PM2.5 concentrations across China: A temporal and spatial perspective. Atmos. Chem. Phys. 2018, 18, 5343–5358. [Google Scholar] [CrossRef]
- Zhao, S.P.; Yu, Y.; Qin, D.H.; Dong, L.; Hee, J. Analyses of regional pollution and transportation of PM2.5 and ozone in the city clusters of Sichuan Basin, China. Atmos. Pollut. Res. 2019, 10, 374–385. [Google Scholar] [CrossRef]
- Cheng, J.; Su, J.P.; Cui, T.; Li, X.; Dong, X.; Sun, F.; Yang, Y.; Tong, D.; Zheng, Y.; Li, Y. Dominant role of emission reduction in PM2.5 air quality improvement in Beijing during 2013-2017: A model-based decomposition analysis. Atmos. Chem. Phys. 2019, 19, 6125–6146. [Google Scholar] [CrossRef]
- European Environment Agency (EEA). EMEP/EEA air pollutant emission inventory guidebook 2019. Available online: https://www.eea.europa.eu//publications/emep-eea-guidebook-2019 (accessed on 30 June 2020).
- Unites Stated Environmental Protection Agency (U.S.EPA). 2020 National Emissions Inventory (NEI) Documentation. Available online: https://www.epa.gov/air-emissions-inventories/2020-national-emissions-inventory-nei-documentation (accessed on 30 June 2020).
- Zheng, J.Y.; He, M.; Shen, X.L.; Yuan, Z. High resolution of black carbon and organic carbon emissions in the Pearl River Delta region, China. Sci. Total Environ. 2012, 438, 189–200. [Google Scholar] [CrossRef] [PubMed]
- Li, Y.; Shi, J.C.; Chen, J.H.; Pan, Y.J.; Zhou, H.H.; Fan, W.B.; Ye, H.; Qian, J.; Liu, Z. Trends of vehicle emissions in Sichuan province, 2010–2017. Environ. Sci. 2020. [Google Scholar] [CrossRef]
- Department of Transportation of Sichuan Province (DTSP). Sichuan Transport Yearbook 2014–2018; Sichuan Science and Technology Press: Chengdu, China, 2014–2018. [Google Scholar]
- He, K.B.; Zhang, Q.; Wang, S.X. Guidebook for Air Pollution Emission Inventory Development in City; Research Report; Tsinghua University: Beijing, China, 2015. [Google Scholar]
- Chen, J.H.; Fan, W.B.; Qian, J.; Li, Y.; Zhao, W.Y. Establishment of the light-duty gasoline vehicle emission inventory in Chengdu by the International Vehicle Emission model. Acta Sci. Circumstantiae 2015, 7, 2016–2024. [Google Scholar]
- Unites Stated Environmental Protection Agency (U.S.EPA). AP 42, Fifth Edition, Volume I Chapter 13: Miscellaneous Sources. Available online: https://www.epa.gov/sites/production/files/2020-10/documents/13.2.1_paved_roads.pdf (accessed on 30 June 2020).
- Qian, J.; Ye, H.; Ye, Z.X. Research on Fugitive Dust Emission Inventory of City Clusters in Sichuan Basin; Research Report; Sichuan Academy of Environmental Sciences: Chengdu, China, 2014. [Google Scholar]
- Ye, H.; Qian, J.; Wang, B. Development Emission Inventory of Catering Sources of City Clusters in Sichuan Basin; Research Report; Sichuan Academy of Environmental Sciences: Chengdu, China, 2014. [Google Scholar]
- Ai, J.; Sun, Y.; Zheng, F.; Ni, C.; Gui, K.; Zhang, X.; Jiang, W.; Liao, T. The spatial temporal variation and factor analysis of the tropospheric NO2 columns in the Sichuan Basin from 2005 to 2016. Atmos. Pollut. Res. 2018, 9, 1157–1166. [Google Scholar] [CrossRef]
- Intergovernment Panel on Climate Change (IPCC). Greenhouse Gas Inventory Reference Manual. In Revised 2006 IPCC Guidelines for National Greenhouse Gas Inventories; IPCC/OECD/IES/Meteorological Office: Bracknell, UK, 2007. [Google Scholar]
- Zheng, J.Y.; Zheng, Z.Y.; Yu, Y.F.; Zhong, L.J. Temporal, spatial characteristics and uncertainty of biogenic VOC emissions in the Pearl River Delta region, China. Atmos. Environ. 2010, 44, 1960–1969. [Google Scholar] [CrossRef]


| Emission Sources | Policies and Control Measure |
|---|---|
| Power plants Industrial combustion Industrial processes | 1. Installing flue gas desulfurization (FGD), denitrification facilities, and particulate matter control devices. |
| 2. Enacting the “ultralow emission” standard for large-scale coal-fired power plants, which requests the emission limits for SO2, NOX, and particulates to be 35, 50, and 10 mg/m3, respectively. | |
| 3. Phase-out of industrial coal boilers less than 10 t/h in the urban area. | |
| 4. Installing FGD for coal boilers larger than 20 t/h. | |
| 5. Closing industrial enterprises with high energy consumption and emissions. | |
| 6. Installing denitrification facilities for cement plants. | |
| 7. Strengthening industrial emission standards for power plants, industrial boilers, steel industry, flat glass production, cement production, and brick production. | |
| Vehicle sources | 1. Upgrading motor vehicle emission standards for all new vehicles (the National Ⅳ and Ⅴ standards were implemented in 2013 and 2017, respectively). |
| 2. Phase-out of yellow-label vehicles, including gasoline vehicles that are below National Ⅰ standard, and diesel vehicles that are below National Ⅲ standard. | |
| 3. Improving fuel quality and public transportation facilities. | |
| Fugitive dust | Strengthening the control of dust resulting from paved road and construction sites. |
| Field burning of crop residues | Reinforcing the control of field burning of crop residues. |
| Category | Subcategory | Category | Subcategory |
|---|---|---|---|
| Stationary combustion sources | Power plants | On-road mobile sources | Buses |
| Industrial combustion | Light duty trucks (LDT) | ||
| Residential combustion | Medium duty trucks (MDT) | ||
| Industrial processes | Building materials industry | Heavy duty trucks (HDT) | |
| Steel industry | Low-speed trucks (LST) | ||
| Nonferrous metallurgy industry | Tricycles | ||
| Petroleum refining and coking industry | Motorcycles | ||
| Chemical industry | Nonroad mobile sources | Plane | |
| Pulp and paper industry | Marine | ||
| Mining industry | Construction machinery | ||
| Pharmaceuticals industry | Agricultural machinery | ||
| Alcoholic beverage industry | Fugitive dust | Construction dust | |
| Food industry | Paved road dust | ||
| Other industries | Field burning of crop residues | ||
| On-road mobile sources | Light duty vehicles (LDV) | Catering sources | |
| Medium duty vehicles (MDV) | Waste disposal sources | Sewage treatment | |
| Heavy duty vehicles (HDV) | Waste disposal | ||
| Taxis |
| Sector | Subsector | Major Activity Data | Sources |
|---|---|---|---|
| Power plants | — | Fuel consumption by fuel types | SPPSR (2013–2017) |
| Industrial combustion | — | Fuel consumption by fuel types | SPPSR (2013–2017) |
| Residential combustion | — | Fuel consumption by fuel types | Sichuan Statistical Yearbook 2014–2018 [1] |
| Industrial processes | — | Product output and raw materials consumption | SPPSR (2013–2017) |
| On-road mobile sources | — | Vehicle populations and yearly VKT | NCPS (2010), SPPSR (2011–2015), field survey |
| Nonroad mobile sources | Plane | Full landing and take-off (LTO) | Field survey |
| Marine | Oil consumption | Sichuan Statistical Yearbook 2014–2018 [1] | |
| Construction machinery | Oil consumption | Sichuan Statistical Yearbook 2014–2018 [1] | |
| Agricultural machinery | Oil consumption | Sichuan Statistical Yearbook 2014–2018 [1] | |
| Fugitive dust | Paved road dust | Roads length and traffic flow | Sichuan Transport Yearbook 2014–2018 [19], field survey |
| Construction dust | Construction area | Sichuan Statistical Yearbook 2014–2018 [1] | |
| Field burning of crop residues | — | Crop production | Sichuan Statistical Yearbook 2014–2018 [1] |
| Catering sources | — | Number of restaurants and consumption of cooking oil | Field survey |
| Waste disposal | — | Amount of sewage treatment and waste disposal | SPPSR (2013–2017) |
| Emission Source | Uncertainty Range * | |||
|---|---|---|---|---|
| SO2 | NOX | PM10 | PM2.5 | |
| Power plants | (−9%,9%) | (−23%,20%) | (−28%,42%) | (−30%,47%) |
| Industrial combustion | (−15%,15%) | (−24%,27%) | (−32%,45%) | (−36%,46%) |
| Cement industry | (−35%,35%) | (−31%,41%) | (−44%,40%) | (−54%,43%) |
| Steel industry | (−41%,45%) | (−47%,50%) | (−46%,42%) | (−51%,46%) |
| Paved road dust | (−52%,89%) | (−54%,92%) | ||
| Construction dust | (−45%,77%) | (−47%,86%) | ||
| Field burning of crop residues | (−23%,25%) | (−28%,35%) | (−33%,56%) | (−37%,58%) |
Publisher’s Note: MDPI stays neutral with regard to jurisdictional claims in published maps and institutional affiliations. |
© 2021 by the authors. Licensee MDPI, Basel, Switzerland. This article is an open access article distributed under the terms and conditions of the Creative Commons Attribution (CC BY) license (http://creativecommons.org/licenses/by/4.0/).
Share and Cite
He, M.; Chen, J.; He, Y.; Li, Y.; Long, Q.; Qiao, Y.; Zhang, K. Trends and Source Contribution Characteristics of SO2, NOX, PM10 and PM2.5 Emissions in Sichuan Province from 2013 to 2017. Atmosphere 2021, 12, 189. https://doi.org/10.3390/atmos12020189
He M, Chen J, He Y, Li Y, Long Q, Qiao Y, Zhang K. Trends and Source Contribution Characteristics of SO2, NOX, PM10 and PM2.5 Emissions in Sichuan Province from 2013 to 2017. Atmosphere. 2021; 12(2):189. https://doi.org/10.3390/atmos12020189
Chicago/Turabian StyleHe, Min, Junhui Chen, Yuming He, Yuan Li, Qichao Long, Yuhong Qiao, and Kaishan Zhang. 2021. "Trends and Source Contribution Characteristics of SO2, NOX, PM10 and PM2.5 Emissions in Sichuan Province from 2013 to 2017" Atmosphere 12, no. 2: 189. https://doi.org/10.3390/atmos12020189
APA StyleHe, M., Chen, J., He, Y., Li, Y., Long, Q., Qiao, Y., & Zhang, K. (2021). Trends and Source Contribution Characteristics of SO2, NOX, PM10 and PM2.5 Emissions in Sichuan Province from 2013 to 2017. Atmosphere, 12(2), 189. https://doi.org/10.3390/atmos12020189