3.1. Convective Precipitation Weather
Continuous live observational data from the X-band dual-polarization weather radar on the northern slope of Mount Everest from 08:00 to 09:00 (UTC) on 17 July 2020, were selected for analysis.
Figure 4 shows the T-log
p generated by the sounding data for the Tibetan Dingri station at 00:00 (UTC) on 17 July 2020. As shown in
Figure 4, the wind direction is easterly at 500–300 hPa, and turns to be westerly at approximately 500 hPa, where obvious wind shear appears. Above 300 hPa, the wind direction turns easterly, with noticeable vertical wind shear. The T-Td values of the middle and bottom layers below 450 hPa with abundant water vapor are very small. The altitude of the lifting condensation level (LCL) is only approximately 1 km relative to the elevation of the station. The Showalter index (Si) is <−3 °C, the K index is equal to 26, and the atmospheric thermal structure is unstable, which results in convective precipitation.
Figure 5 shows the observational data from the FY4 satellite at 08:19 (UTC) on 17 July 2020.
Figure 5a shows a visible light channel image, and the albedo at the station (red circle) is 0.47, which indicates that the vertical depth of the cloud body was large at this time.
Figure 5b shows a longwave infrared channel image; the cloud top brightness temperature at the station (red circle) is 0.47 °C, which indicates that the cloud top was at a high altitude at this time. Finally,
Figure 5c shows an image from the high-level water vapor channel, and the brightness temperature of water vapor at the station (red circle) is −26.93 °C, which indicates that the atmospheric water vapor content was very high.
Figure 6a–d shows the dual-polarization physical quantities of convective single cells on the northern slope of Mount Everest observed simultaneously at 8:23 (UTC) on 17 July 2020, using plan position indicator (PPI) detection mode at an elevation of 9°. As shown in
Figure 6a, the horizontal scale of convective precipitation observed at this elevation is approximately 35 km from east to west and approximately 8.4 km from north to south. The height above ground level (AGL) is approximately 4 km. There is a strong convective core with reflectivity >40 dBZ (indicated by the black circle in
Figure 6a), which corresponds to the anticyclone divergence field at the same position in the black circle in
Figure 6b. In addition, there is an area with large
Zdr values at the same position in the black circle in
Figure 6c, and the
ρhv value at the corresponding position in
Figure 6d is close to 1, which indicates that a strong convective core appears at this position and that the shape of raindrops is oblate. Obvious wind field convergence appears in the red frame in
Figure 6b, which corresponds to the developing convective echo at the same position in the red frame in
Figure 6a. In addition, the
Zdr value at the same position in the red frame in
Figure 6c is close to 0 dB, and the
ρhv value at the corresponding position in
Figure 6d is low, which indicates that there is a new precipitation echo triggered by convective upward movement at this position and that the precipitation cloud is mixed with small raindrops and ice crystals that are approximately spherical in shape.
Figure 7 shows the vertical profiles obtained by using X-band dual-polarization weather radar in RHI detection mode when the convective precipitation weather developed to a mature stage.
Figure 7a shows the reflectivity distribution at 08:23 (UTC) on 17 July 2020, and
Figure 7b shows the reflectivity distribution at 08:33 (UTC) on 17 July 2020.
Figure 8a–d shows the distributions of the velocity,
Zdr,
Kdp, and
ρhv based on
Figure 7a, and
Figure 8e–h shows the distributions of the velocity,
Zdr,
Kdp, and
ρhv based on
Figure 7b. As shown in
Figure 7a, there is a mature, long, and narrow convective precipitation echo at a radial distance of 16–25 km from the radar station; the vertical extent is between 9 and 2 km AGL. Due to the low-level beam blockage, no precipitation echo signals are observed. Most of the
Zh values of the whole layer are above 30 dBZ, with the strong echo center (>40 dBZ) appearing at 4–5 km AGL. At 4.5 km AGL, obvious convective updrafts and downdrafts are observed (
Figure 8a–d), which is consistent with the center position of the strong echo in
Figure 7a. Most of the
Zdr values are between −1 and 1 dB, and the
Kdp values are distributed mainly between −1° and 2°. The
ρhv values are very large and are basically greater than 0.98. The ground rain gauge shows that the cumulative precipitation in this period is 21.3 mm. Therefore, during the period in which the convective precipitation on the northern slope of Mount Everest develops to a mature stage, the total precipitation is lower than that in the plains area. Furthermore, in this region, the particle phase indicates approximately spherical raindrops, and the number of flat ellipses along the horizontal axis is equivalent to that of the long ellipses along the vertical axis.
Figure 7b shows the evolved echo of the single mature convective cell after ten minutes; at radial distances of 18–26 km from the radar station, the top height of the narrow convective precipitation echo is more than 10 km AGL, which is noticeably higher than that at the mature stage 10 min prior, and it has moved horizontally approximately 2 km to the northwest. Within 2 km AGL, no precipitation echo signals are observed due to the low-level beam blockage. The
Zh values of the whole layer are noticeably weakened, most of which are between 20 and 30 dBZ, with that at the center of the strongest echo <35 dBZ. The height of the vertical wind shear drops to 4 km AGL, and the updrafts are weak and concentrated at the bottom of the precipitation cloud (
Figure 8e–h). The interior of the whole precipitation cloud layer is basically composed of downdrafts. Most of the
Zdr values are between −3 and 2 dB, and the
Kdp values are distributed mainly between −2° and 3°. The
ρhv values below 5 km AGL are significantly lower than those in
Figure 8d, with an average below 0.95. The ground rain gauge shows that the rain intensity during this period is 6.1 mm/h. Therefore, with the passage of time, the convective precipitation on the northern slope of Mount Everest gradually weakens after reaching the mature stage, and the rain intensity of the whole layer is remarkably weaker than that in the mature stage. The middle and bottom layers contain raindrops and a semi-melted rain–hail mixture with a low correlation coefficient. Furthermore, large, oblate raindrops also exist. All these factors contribute to a high
Zdr value. The coexistence of raindrops and graupels is confirmed by observations from a ground laser raindrop spectrometer. The middle and high layers contain relatively consistent small spherical ice crystals with a high correlation coefficient. This observation is verified by the data observed in the middle and high atmospheric layers by sensors equipped on unmanned aerial vehicles (UAVs).
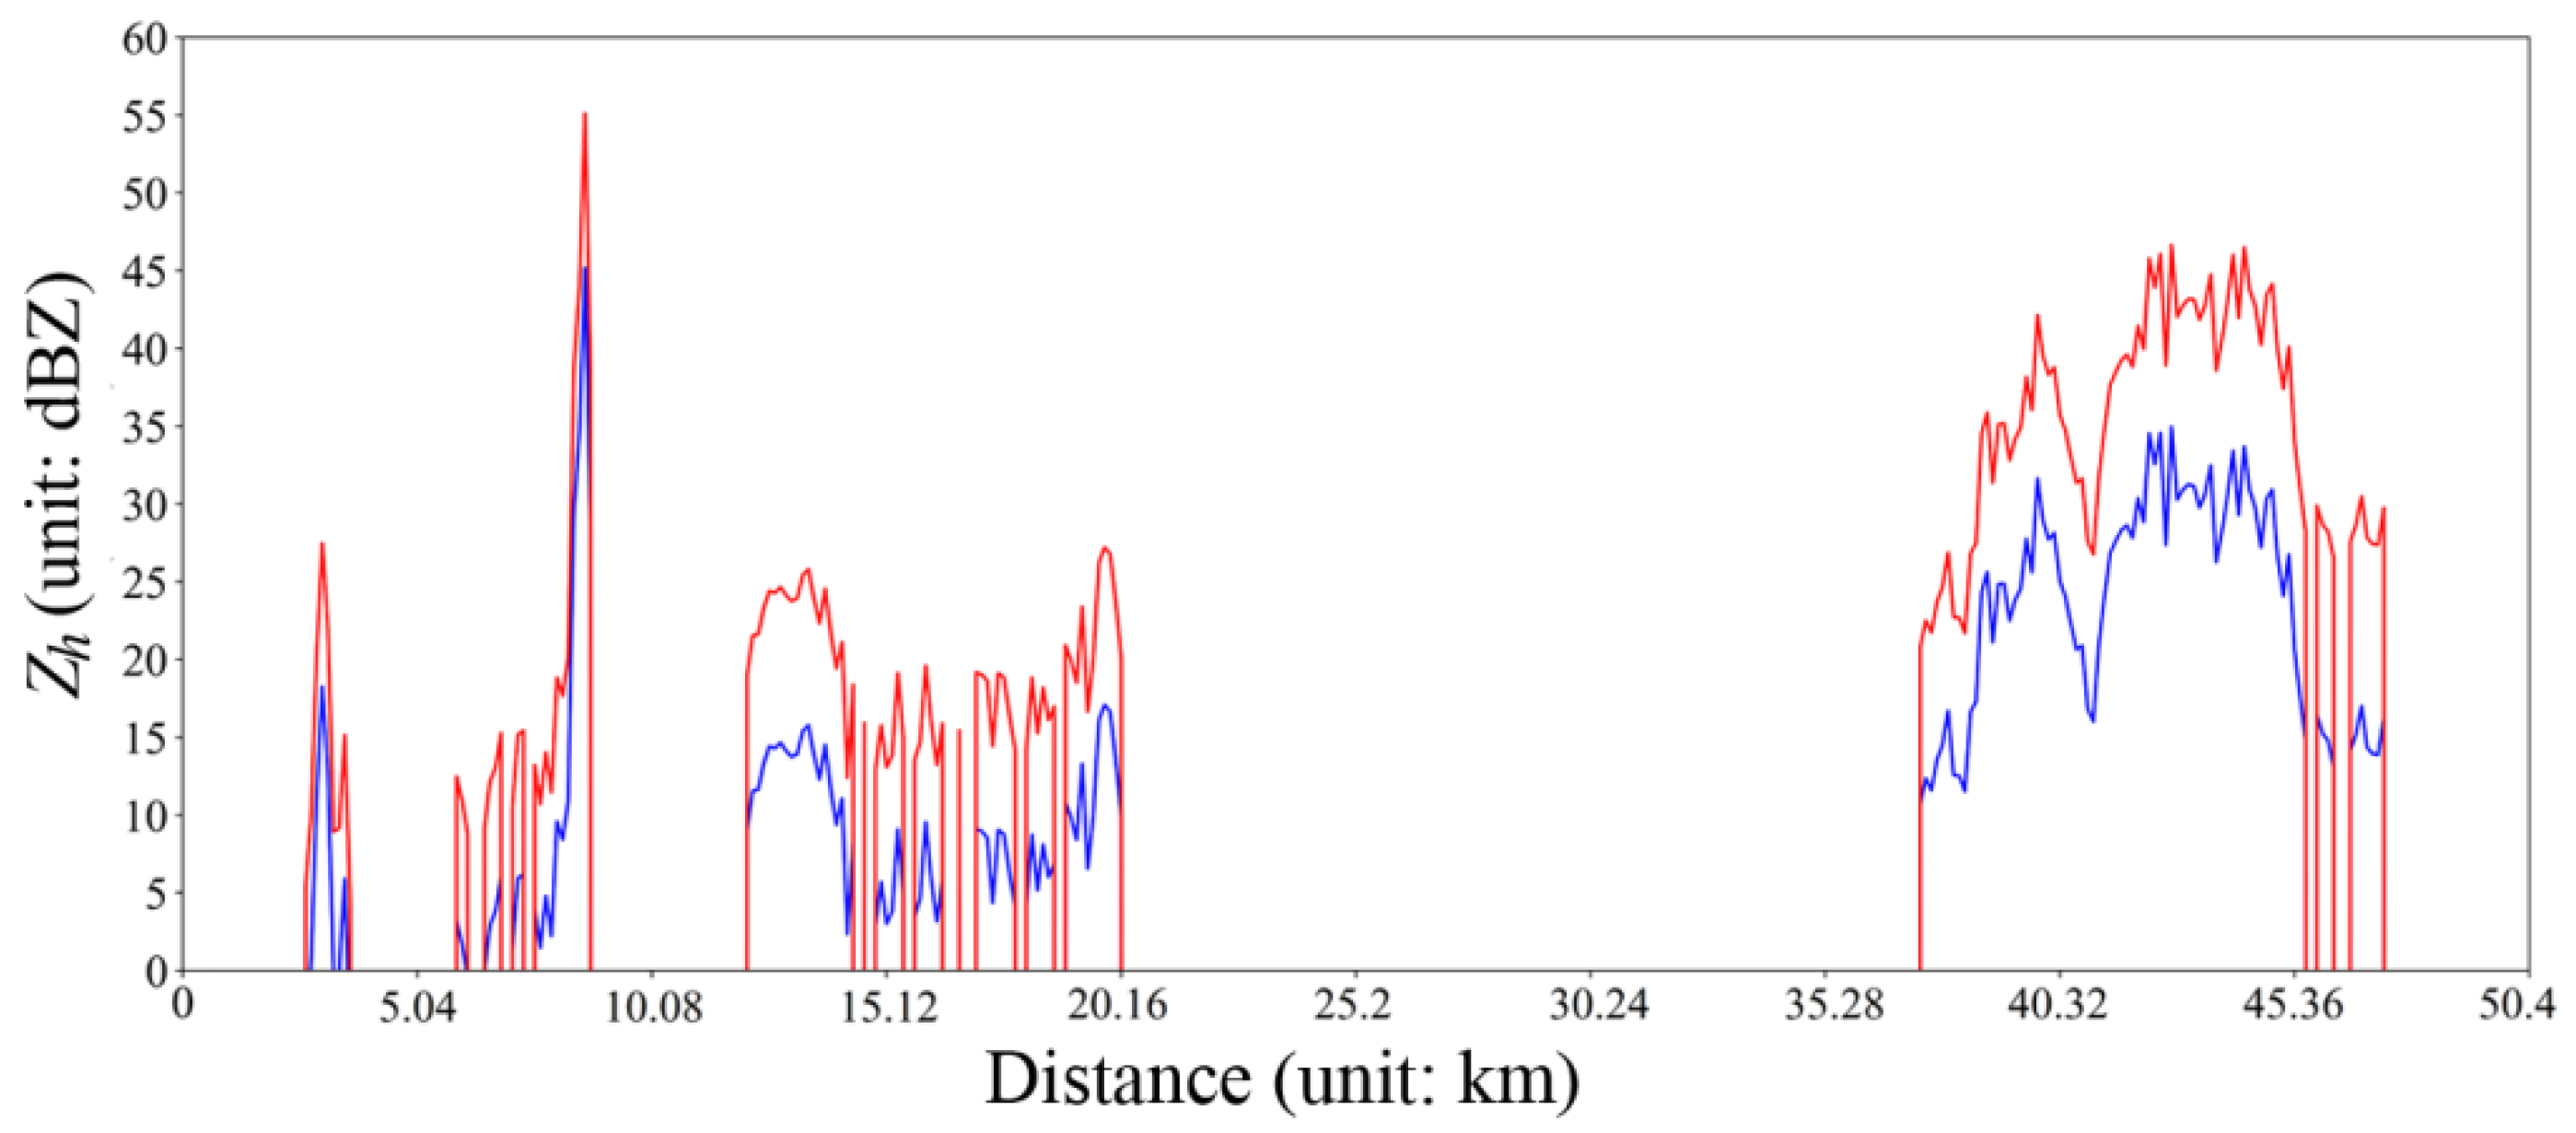
Figure 9 presents a vertical profile of
Zh comparing cases of medium- and small-scale severe convective weather over plain and plateau areas. In this figure, the y axis indicates the altitude (height above sea level). The red stars in the figure represent the profile of this severe convective precipitation weather event in the Qomolangma area, while the blue stars represent the profile of a strong convective precipitation event in the Chengdu Plain. As shown in this figure, the vertical extent of strong convective precipitation over the plain area is approximately 12 km, whereas that over Mount Everest is noticeably shallower (approximately 8.5 km). In terms of the range of
Zh values, the values over the plain area range from −5 to 43 dBZ, while those over the northern slope of Mount Everest are within only 15–45 dBZ. On the other hand, upon analyzing the variation trend of
Zh of the strong convective precipitation with height in Qomolangma, the red stars in the figure reveal two
Zh peaks with increasing height, and the first peak is approximately 4.7 km AGL. The
Zh values near the ground surface are only 15–25 dBZ. From the blue stars in the figure, the value of strong convective precipitation over the Chengdu Plain exceeds 40 dBZ from the boundary layer, which slowly reaches the peak at 2 km AGL and then decreases exponentially with increasing altitude.
The reasons for the above phenomena are analyzed. The following equation can be derived after simplifying the atmospheric vertical motion equation and the ideal gas equation of state [
17]:
where
w is the vertical velocity,
p is the atmospheric pressure,
h is the height,
g is the gravitational constant of acceleration,
g’ is the disturbance due to gravity,
fv is the vertical component of the tide-generating force,
fu is the vertical Coriolis force,
V is the gas block volume,
n is the number moles of air within the volume
V,
R is the gas constant, and
T is the air temperature. Compared with
fv, buoyancy and the perturbations due to
p, gravity, and various forces have much greater impacts on the vertical motions within the atmosphere. Then, the following expression can be obtained:
Equation (5) indicates that in a convective weather system, the acceleration of the vertical motion of the air block is directly proportional to its rate of temperature decrease. In the same time period, the greater the rate of temperature decrease is, the greater the vertical movement speed of the gas block.
Based on 10 years of scientific research on the southwest vortex (SWV) and the atmosphere over the Tibetan Plateau, although the altitudes of the Chengdu Plain and Mount Everest differ greatly, the altitude of the tropopause is basically consistent between them at approximately 12 km, and the temperature in both regions is
Tst. Under the action of solar radiation, the surface temperatures on the plains and Mount Everest both reach
Ts. Then, the relative heights from the tropopause to the surfaces of the plateau and the plain are Δ
H1 and Δ
H2, respectively, and Δ
H1 << Δ
H2; and the vertical atmospheric velocities over the plateau and plain are
w1 and
w2, respectively. Therefore, the following expression can be obtained:
Equation (6) indicates that the acceleration of vertical atmospheric motion over the plateau is generally greater than that over the plain; that is, air flows rise faster and thus are more likely to trigger strong isolated convective cells. In addition, in the field of fluid dynamics, it is widely accepted that the vertical extent and size of a convective cell are positively proportional to its horizontal extent and size. Based on
Figure 9 and
Figure 10, as well as Equation (6), this theory is well evidenced by the outcome of this work; i.e., the vertical depth of the convective cell in the Mount Everest region is noticeably shallower than that over the Chengdu Plain, and its horizontal extent is noticeably narrower than that above the plain.
Figure 10 shows the probability density distribution of the
Zdr values in medium- and small-scale convective precipitation. The red curve in the figure is the probability density of the
Zdr values for PPI precipitation on the northern slope of Mount Everest within distances of 18–25 km from the radar station at an elevation of 9°, and the blue curve is the probability density of
Zdr for strong convective precipitation on the Chengdu Plain within distances of 70–80 km from the radar station at an elevation of 2.5°. In addition, both data samples were collected from a height of 3 km AGL. Comparing these curves shows that the spectral distribution of
Zdr in the severe convective precipitation above the Chengdu Plain is wide, the most frequent occurrence of raindrops is approximately 5–6 dB, and the occurrence frequency of positive
Zdr values is much greater than that of negative values. In contrast, the spectral distribution of
Zdr in the convective precipitation on the northern slope of Mount Everest is narrow, the most frequent occurrence of raindrops is observed at approximately 0–0.5 dB, and the occurrence frequencies of positive and negative
Zdr values are basically equivalent. These findings further suggest that during the microphysical process of convective precipitation, all liquid raindrops are the results of the collision of mid- and high-layer crystals with supercooled water and their subsequent melting. Due to the unique high-altitude topographic features of the Mount Everest region, the vertical growth depth of convective precipitation is restricted and is noticeably shallower than that in the Chengdu Plain area. Ice crystal particles do not melt completely when falling into the boundary layer, and the raindrops that reach the ground tend to maintain a round shape. Therefore, the
Zdr values in the Mount Everest region are normally distributed approximately 0 with a narrow spectral width.
3.2. Snow Weather
The T-log
p diagram calculated from the radiosonde data from the Dingri station at 08:00 (UTC+8) on 22 April 2021, is shown in
Figure 11. Within a vertical height of less than 1 km from the station, the wind direction suddenly changes from a westerly wind to an easterly wind. Strong vertical wind shear can be observed near the boundary layer, and the whole layer exhibits clockwise rotation of the wind in the vertical direction, which is conducive to the development of convection. The level of free convection (LFC) is close to the boundary layer and lower than the LCL; in addition, the convective available potential energy (CAPE) reaches 2300 J/kg, and the storm intensity index (SII) equals 211.4, which indicates that the atmospheric thermal structure of the whole layer is extremely unstable. On the other hand, the cloud bottom height, namely, the convective condensation level (CCL), is less than 2 km AGL, which indicates that water vapor condenses quickly due to the low temperature and high humidity at the boundary layer, forming stratus clouds in the middle and low layers of the atmosphere. Within these stratus clouds, the condensation of water vapor releases latent heat, which increases the temperature and humidity at the top of the stratus clouds to form a thermally unstable structure in the middle- and high-level atmosphere. In addition, above 400 hPa, the wind speed exceeds 70 m/s. The Bernoulli effect of this strong wind speed further serves to lift the middle and high-level air flows, which is likely to lead to elevated convective snowfall.
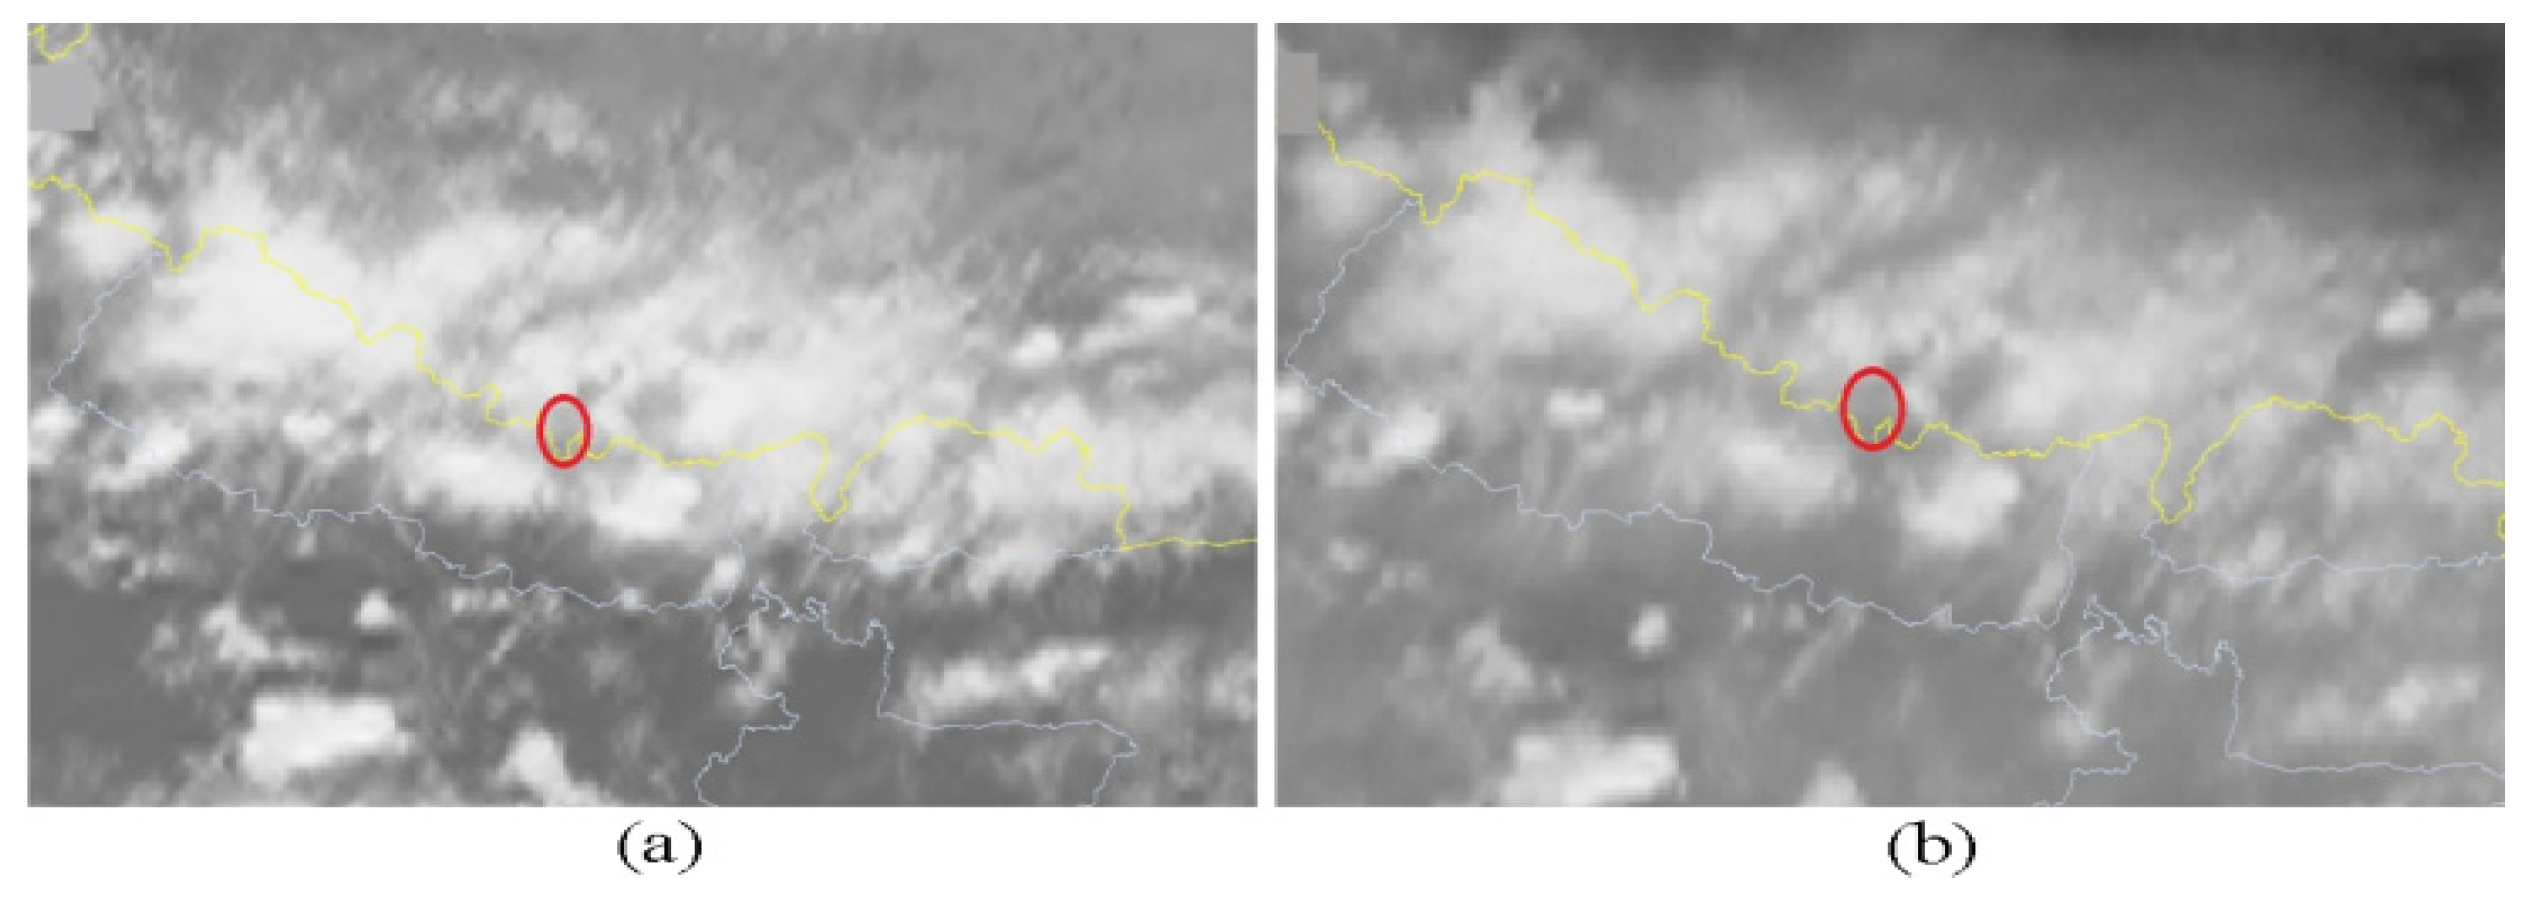
Figure 12 shows the observational data from the FY4 satellite at 09:30 (UTC+8) on 22 April 2021.
Figure 12a shows the longwave infrared image. The cloud top brightness temperature at the station (red circle) is 0.47 °C, which indicates that the cloud top is at a high altitude at this time.
Figure 12b shows the image from the high-level water vapor channel. The brightness temperature of the water vapor at the station (red circle) is −26.93 °C, which indicates that the atmospheric water vapor content is very high.
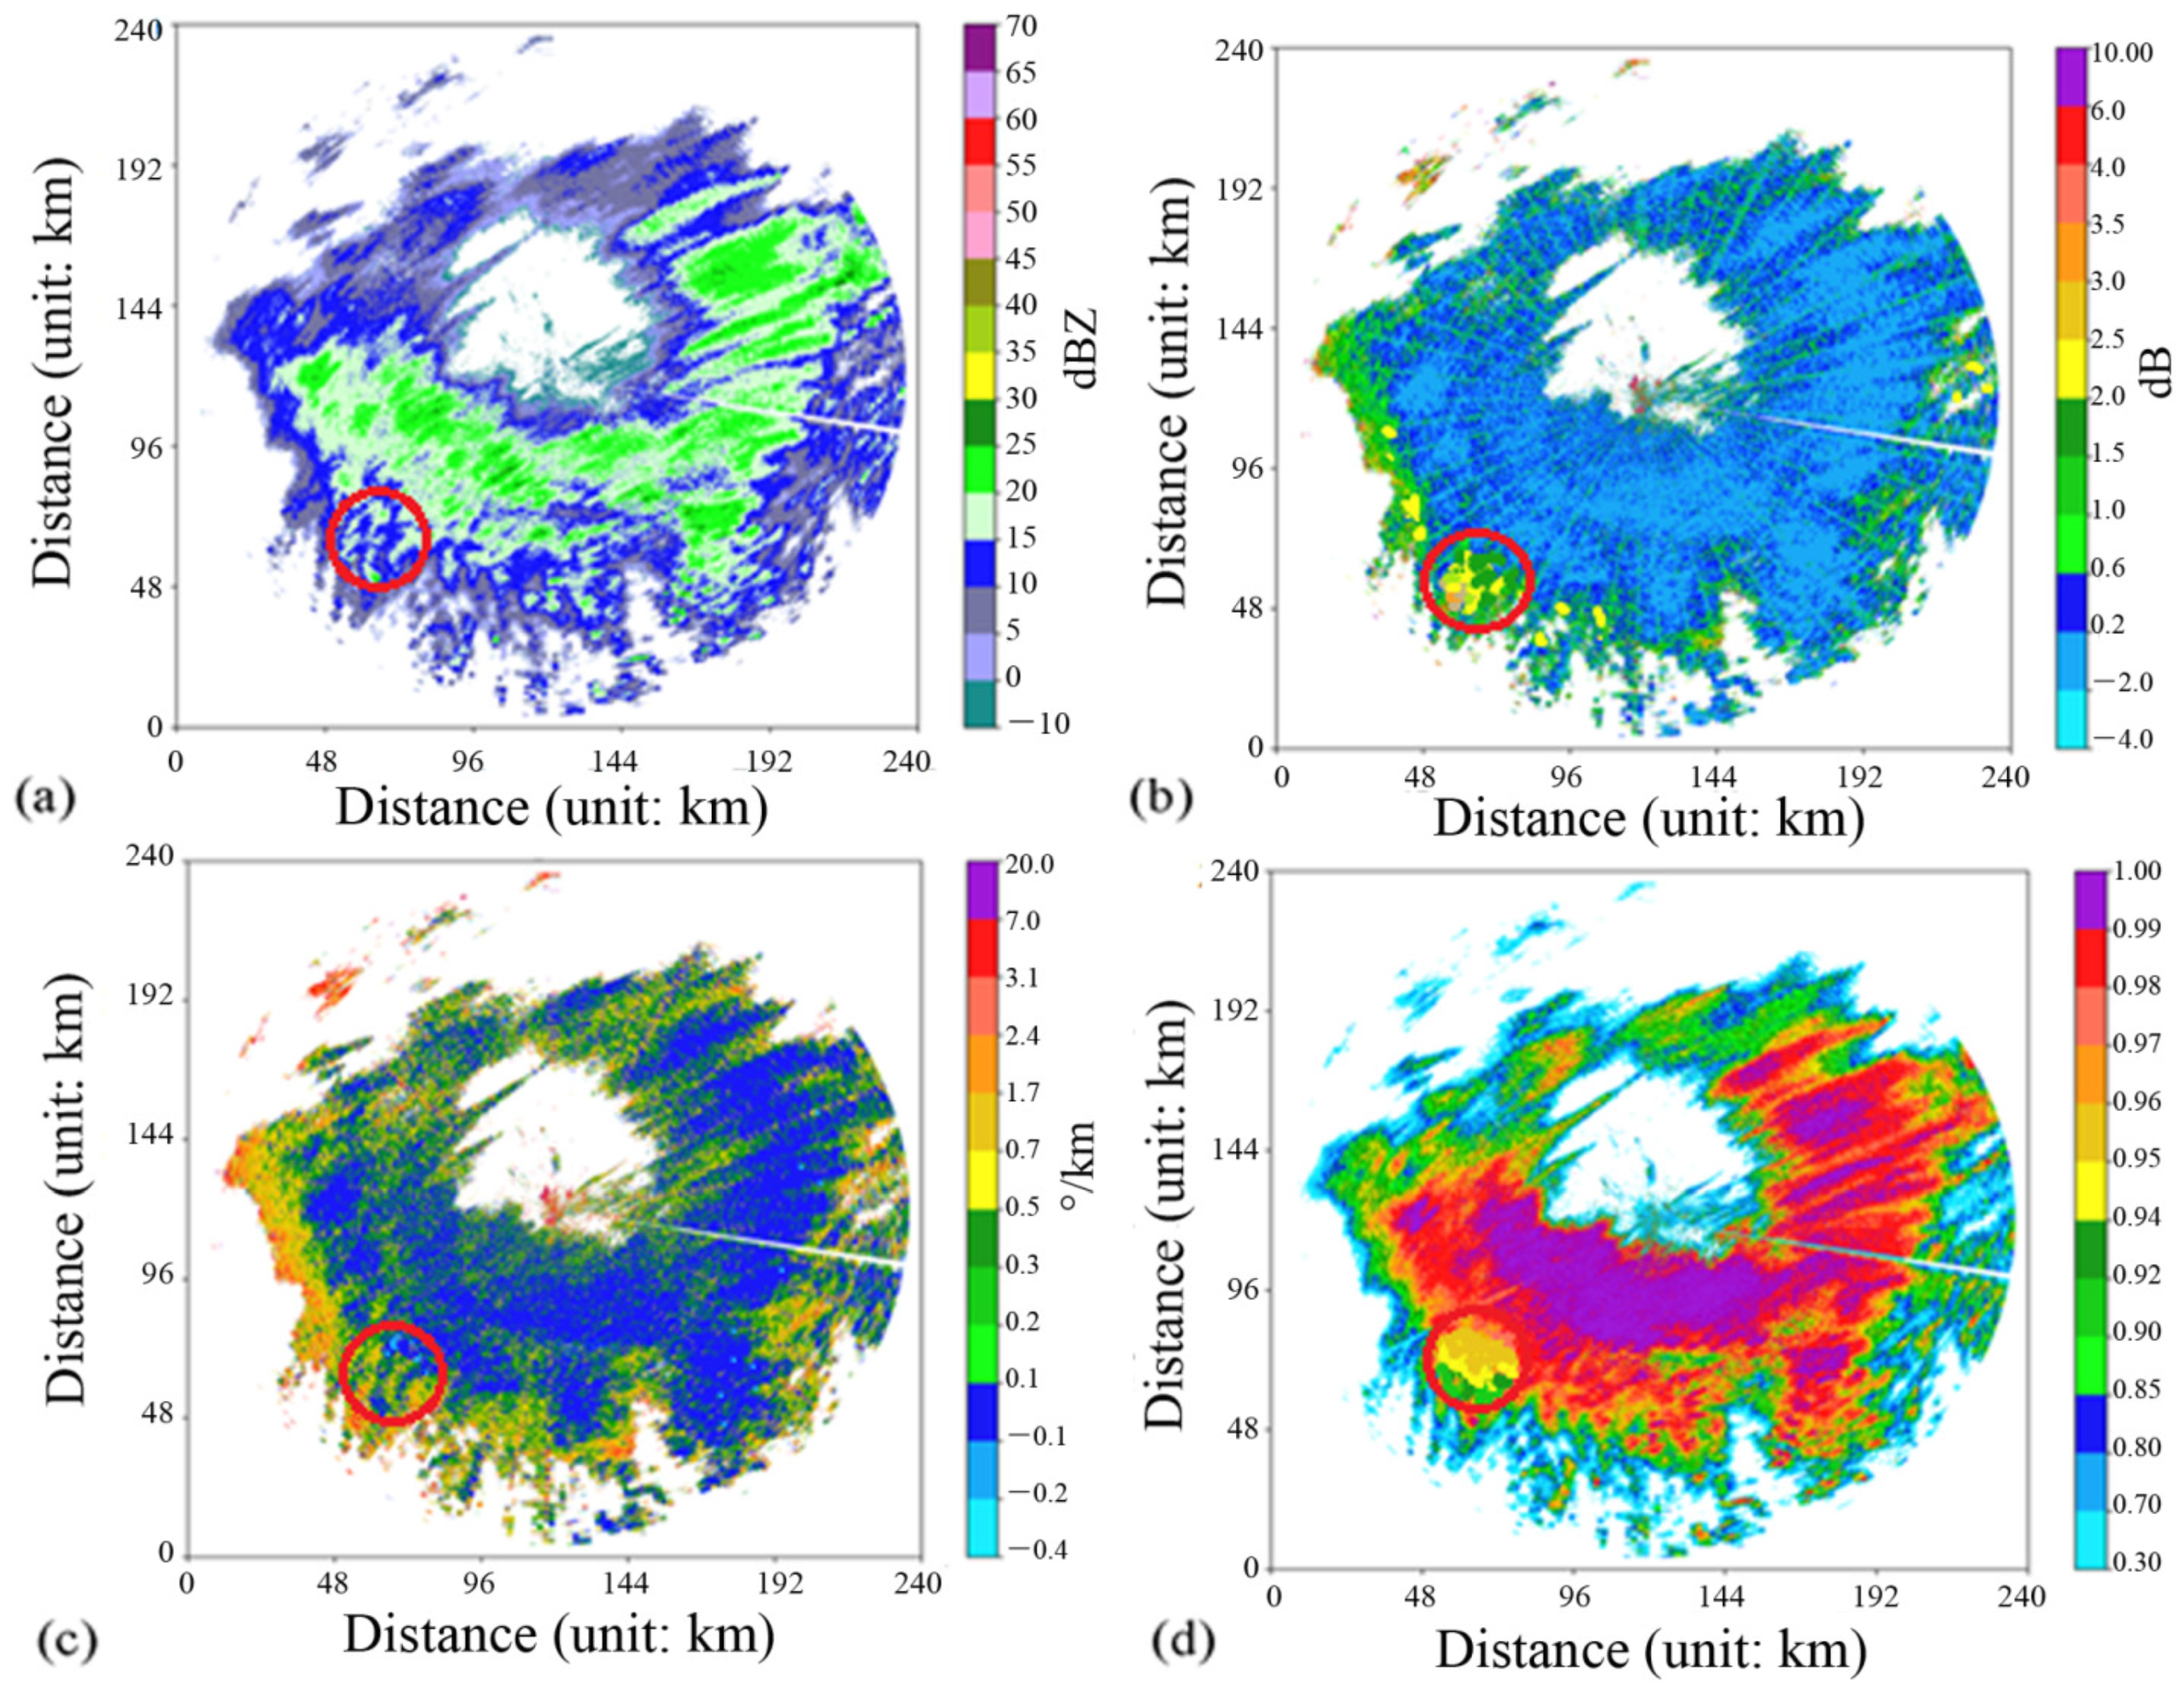
Figure 13a–d shows the
Zh,
Zdr,
Kdp, and
ρhv data observed by the X-band dual-polarization weather radar on the northern slope of Mount Everest at 09:45 (UTC+8) on 22 April 2021, at an elevation of 5° in PPI mode. As shown in
Figure 13a, the horizontal extent of the whole echo area is approximately 200 × 200 km. The maximum vertical height above the ground is approximately 9 km, and the height of the echo within the red circle is approximately 7.5 km AGL. Within this area, all
Zh values are <25 dBZ, the
Zdr values are large (close to 3 dB), the
Kdp values have a wide span ranging from −0.2° to 1.7°, and the average
ρhv is low (<0.95). Many nonspherical ice crystal particles and supercooled water droplets are observed in this area by UAV sensors (
Figure 14). The UAV was provided by Soarability, Shenzhen, China, and was technically supported by the University of Auckland, New Zealand. The UAV carried a small and lightweight atmospheric aerosol and hydrometeor monitoring instrument named Sniffer4D. The output products are summarized in
Table 2. These findings are basically consistent with the radar polarization eigenvalues of ice crystal particles during snowfall in North America reported by Doviak et al. [
3].
Figure 15 shows the velocity and spectral width data simultaneously acquired at an elevation of 5° in radar PPI detection mode. As shown in
Figure 15a, at radial distances of approximately 50–55 km from the radar station, an obvious wind shear zone is observed (within the black circle), and its vertical height is approximately 4–5 km AGL. From the convergence at a low level (near 4 km) to the divergence at a high level (near 5 km), this vertical wind shear promotes the upward movement of convection. In addition, ambiguous velocities are detected in both the lower and middle-upper layers, which indicates that the wind speed in the whole layer is high. These findings are consistent with the radiosonde data. The suction effect of strong wind speeds is conducive to the rapid development of convective movement and maintains strong snowfall. As shown in
Figure 15b, there is an annular area with large spectral widths (approximately 5 m/s) at 4–5 km AGL corresponding to the area of the abovementioned ice crystal particles and vertical wind shear. These results indicate that there is a strong velocity disturbance for a large number of condensate particles within this height range that promotes the strong attachment of ice crystals and supercooled water [
18] and the formation of ice crystal clouds.
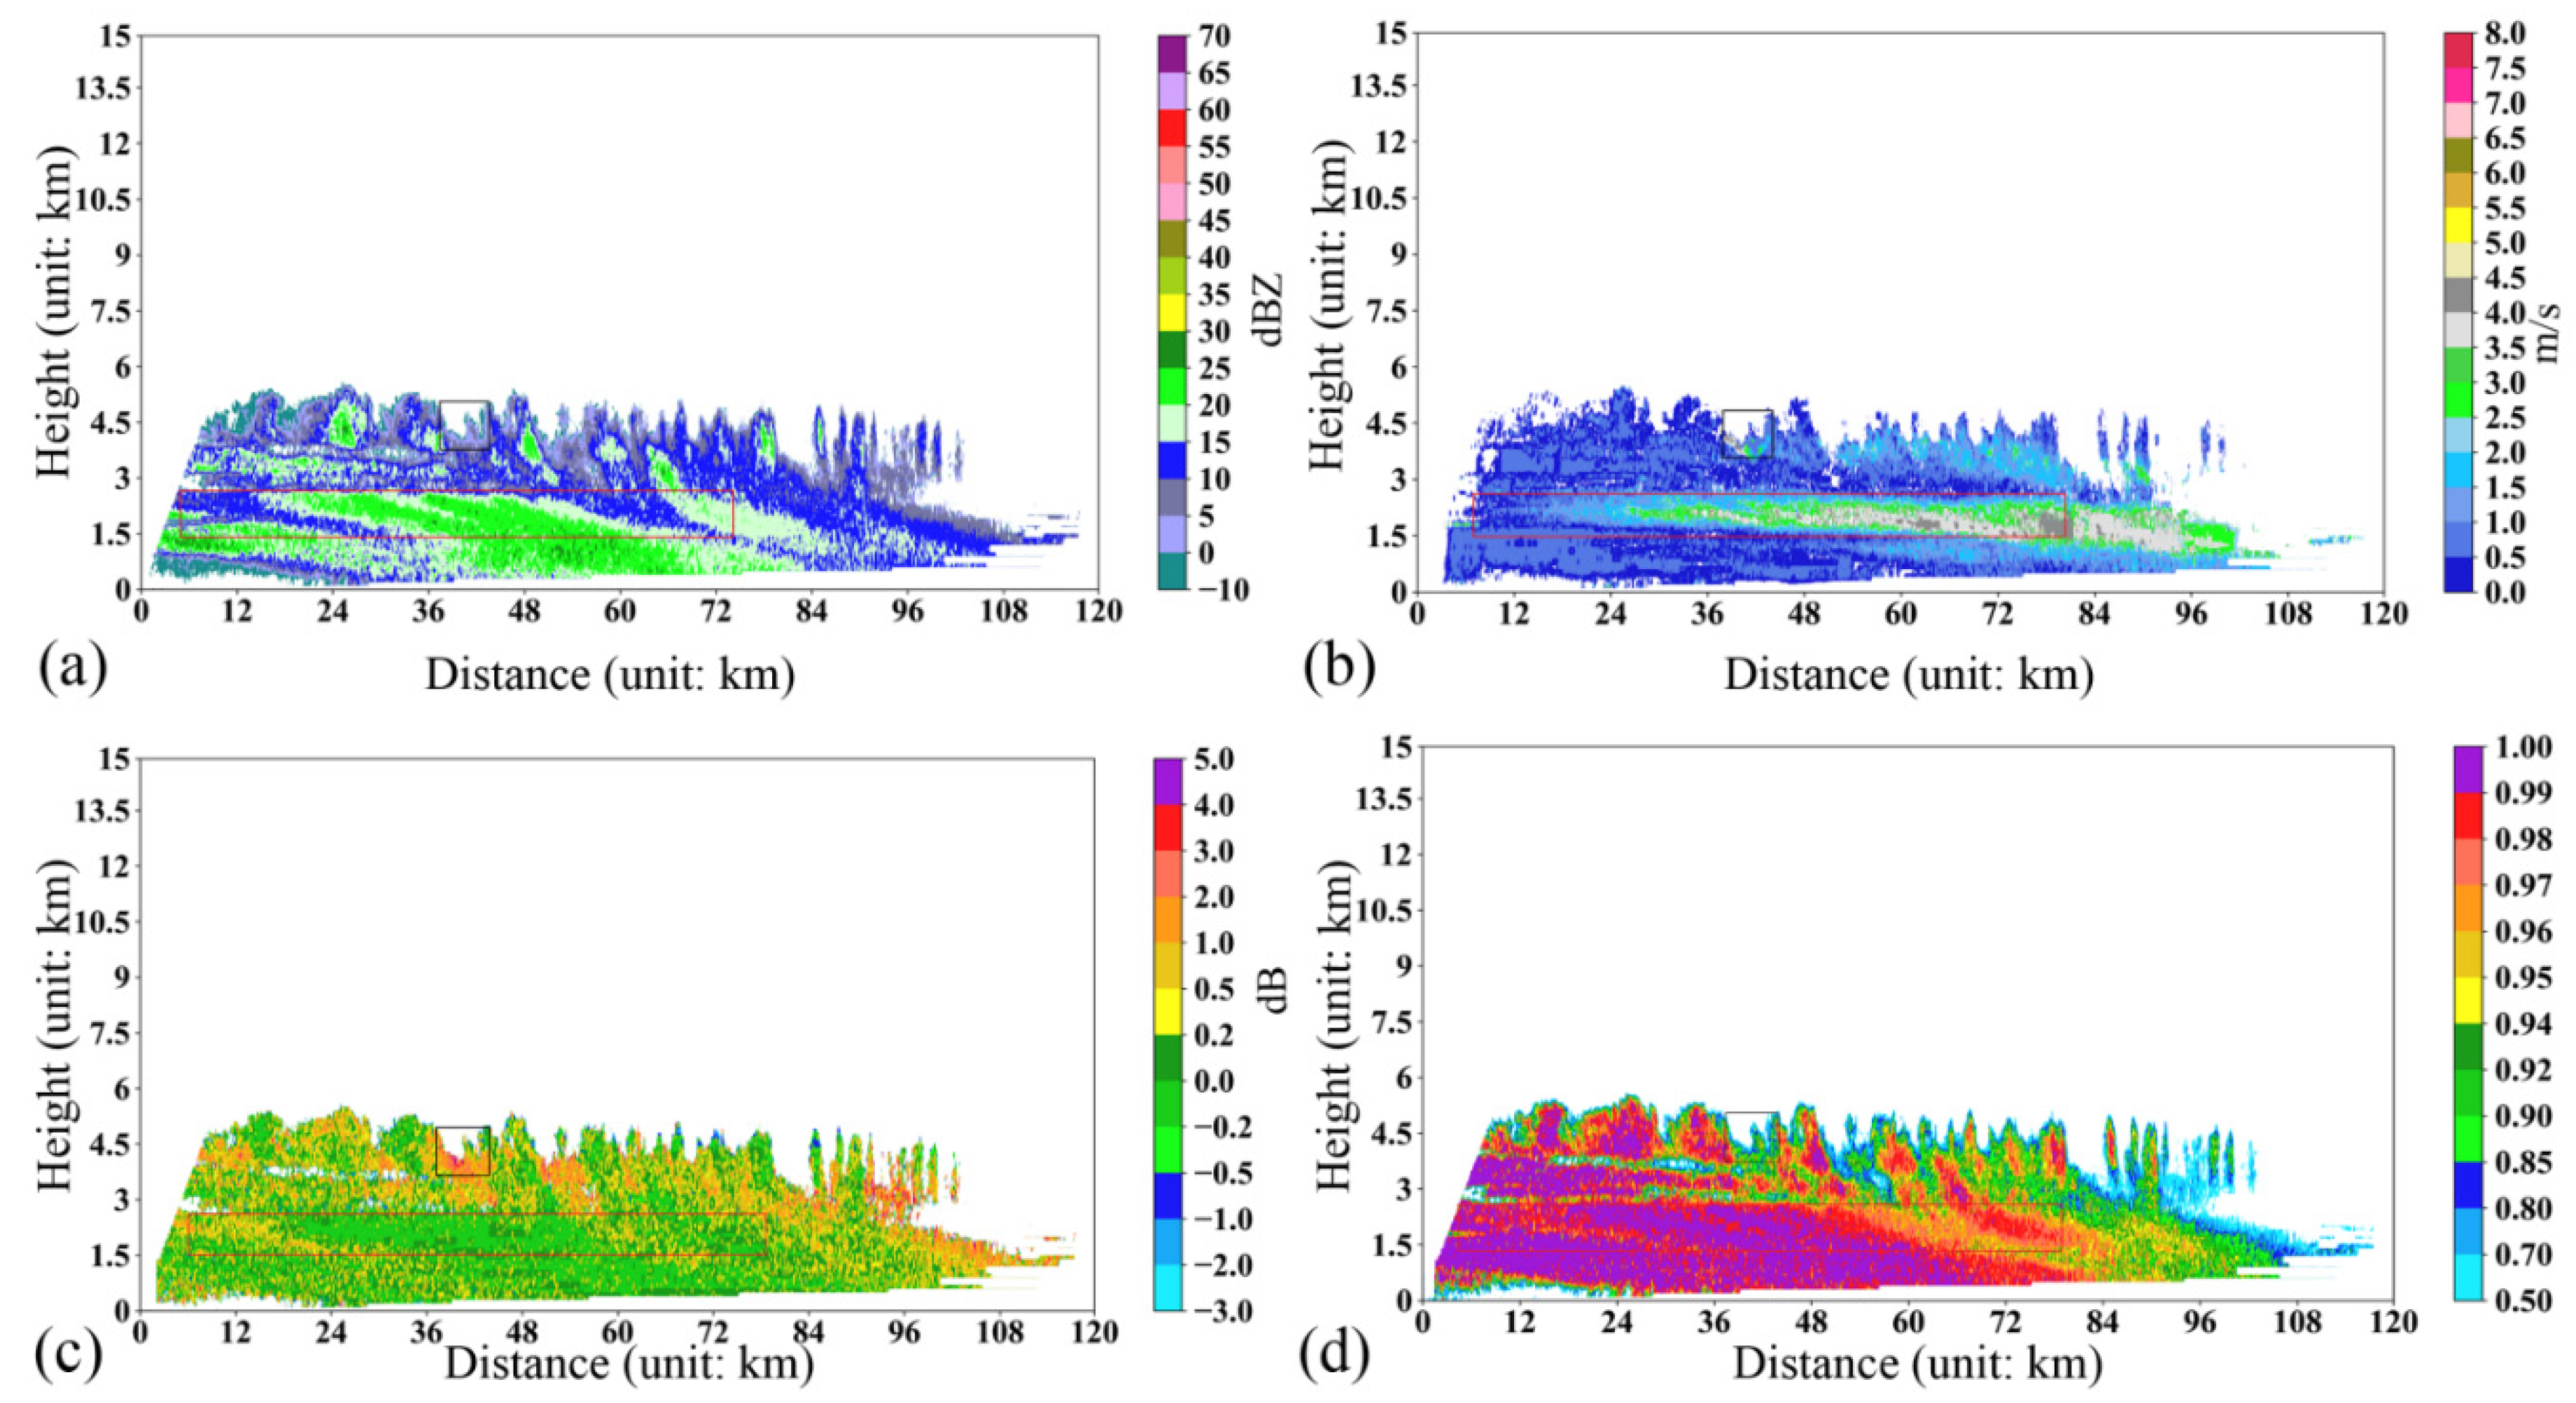
Figure 16a–d shows vertical profiles of the dual-polarization physical quantities
Zh, sw,
Zdr, and
ρhv obtained simultaneously in RHI mode along an azimuth of 250°. The horizontal extent of the whole echo area is approximately 100 km, and the vertical height extends from the boundary layer to approximately 6 km AGL.
Figure 17 shows vertical profiles of
Zh, sw,
Zdr, and
ρhv within vertical heights of 0–6 km AGL at a radial distance of 39 km from the radar station as well as their corresponding relationship with the isotherm. The black box in
Figure 16 shows that the vertical height of this position is approximately 4–4.5 km AGL. Furthermore, the −20 °C isotherm is located above 4 km, where
Zh is <10 dBZ, the
Zdr valuesare distributed between 1 and 4 dB, and sw reaches 4 m/s. On the other hand,
ρhv is smaller than 0.92, and
ρhv is defined as follows [
19]:
Based on Equation (7), ρhv is determined by the correlation between the reflectivity factor of horizontally polarized electromagnetic waves in the form of pulse signals in m groups and that of the vertically polarized electromagnetic waves. Therefore, ρhv can effectively reflect the mixing degree of hydrometeor particles within a unit volume: a higher ρhv value indicates a higher phase diversity of hydrometeor particles and a higher mixing degree; conversely, a smaller ρhv value indicates greater phase consistency among the hydrometeor particles and a lower mixing degree.
In combination with the UAV observations in this area, high-density nonspherical ice crystal particles and supercooled water are present in the investigated area that manifests as a high-reflectivity zone [
20]. At this high altitude, due to the low temperature and strong wind turbulence, supercooled water and ice crystal particles (snowflakes) collide repeatedly and freeze instantaneously on the surface, resulting in a strong attachment growth effect. In this way, small ice crystals gradually grow into large ice crystals and begin to fall. When approaching the ground, due to the increase in temperature, their outer layer melts into high-density wet snow. Based on the data from the ground laser raindrop spectrometer at the corresponding position, the 24h cumulative snowfall at this time is approximately 2.6 mm, reaching the level of moderate snowfall, and the particle phase state is melted snow on the surface. On the other hand, according to the red box in
Figure 16, within the height range of 1.5–2.5 km AGL, there is a precipitation echo area with small
Zh values (approximately 15–25 dBZ), a wide range of
Zdr values (approximately from −1 to 0.8 dB), a maximum sw value close to 5 m/s, and a very high
ρhv value > 0.98. As shown in
Figure 17, the temperature of the boundary layer below 1.5 km AGL is less than 0 °C, but the temperature at approximately 2.5 km is >0 °C, which indicates that the warming phenomenon occurs between 1.5 and 2.5 km; i.e., the temperature changes from negative to positive. This finding further suggests that warm stratus clouds may be present in the area bounded by this red box. During this snowfall event, the bottom of the stratiform clouds is approximately 1.5 km AGL, and the temperature of the boundary layer within 1.5 km AGL is lower than 0 °C.
In addition, as shown in
Figure 11, at an altitude of 5.5 km (approximately 1 km AGL), the wind direction suddenly changes from a westerly wind in the lower layer to an easterly wind in the upper layer with obvious vertical wind shear; the atmosphere here is characterized by low temperature, high humidity, and strong dynamic uplift. As shown in
Figure 17, the temperature of the boundary layer below 1.5 km AGL is very low (<0 °C), and the strong dynamic uplift caused by vertical wind shear transports sufficient water vapor to the boundary layer; consequently, water vapor condenses above 1.5 km AGL to form stratiform clouds. During the condensation of water vapor at approximately 1.5–2.5 km AGL, latent heat is released. For this reason, the temperature of the stratiform clouds in this area increases with increasing relative height. At a height of 2.5 km AGL, the temperature at the top of the stratiform clouds reaches >0 °C. On the other hand,
Figure 17 indicates that the −20 °C isotherm is located at approximately 4km AGL, which shows that the middle- and upper-layer atmospheric temperatures remain quite low. Therefore, the thermal instability between the top of the stratiform clouds (>2.5 km) and the middle and upper atmospheric layers (<4 km) generates convective movement, which reveals that the winter snowfall in Qomolangma has the characteristics of elevated convection.


