Article

Satellite Data Applications for Site-Specific Air Quality Regulation in the UK: Pilot Study and Prospects

1
Earth Observation Science Group, School of Physics and Astronomy, University of Leicester, Leicester LE1 7RH, UK
2
School of Engineering, University of Birmingham, Edgbaston B15 2TT, UK
3
Environment Agency, c/o Lancaster University, Lancaster LA1 4YQ, UK
4
National Physical Laboratory, Teddington TW11 0LW, UK
5
Environment Agency, Reading RG1 8DQ, UK
6
Centre for Environmental Health and Sustainability, University of Leicester, Leicester LE1 7RH, UK
*
Author to whom correspondence should be addressed.
Atmosphere 2021, 12(12), 1659; https://doi.org/10.3390/atmos12121659
Submission received: 14 November 2021 / Revised: 6 December 2021 / Accepted: 7 December 2021 / Published: 10 December 2021
(This article belongs to the Special Issue Air Quality in the UK)

Abstract

:
Atmospheric composition data from satellite platforms offers great potential for improving current understanding of anthropogenic emissions. Whilst this data has been used extensively in research, its use by governments to regulate and assess site-specific legislation compliance is minimal. Here, we outline the regulatory context for air quality regulation in the UK, and present a pilot study highlighting the potential of current instruments. The pilot study demonstrates the capabilities and limitations of the TROPOspheric Monitoring Instrument (TROPOMI) for detecting and isolating emissions of NO2 from regulated UK point sources. This study successfully isolated NO2 emissions from a cluster of three closely situated regulated sites in the north east of England, despite their proximity to large urban sources. This is the first time these sites have been resolved from satellite-based observations, and serves as a clear demonstration of the potential of current and future Earth observation data products for site-specific monitoring and investigation within the UK.

Graphical Abstract

1. Introduction

Poor air quality has increasingly been acknowledged as one of the biggest threats to public and environmental health [1,2,3,4]. The issue is multifaceted, varying in severity, and distinct to each country, but it is now globally understood that behaviours must rapidly shift to low-emission alternatives to protect both the environment and health.
UK air quality legislation compliance is currently evaluated using well-established in situ reference monitoring techniques [5]. However, research into air quality has progressed rapidly in recent decades, driven in part by advances in satellite-based remote sensing. Satellite-based instruments are able to retrieve column counts of several individual pollutant species, with increasingly finer resolution and precision. Of particular interest, due to its high spatial resolution and multiple pollutant products, is the TROPOspheric Monitoring Instrument (TROPOMI). TROPOMI is the main instrument onboard the Sentinel-5 Precursor satellite, launched by the European Space Agency (ESA) in October 2017. TROPOMI can derive columns of trace gases such as nitrogen dioxide (NO2), sulphur dioxide (SO2), carbon monoxide (CO), methane (CH4) and ozone (O3), with a spatial resolution of 7 km × 7 km up to 3.5 km × 5.5 km [6]. TROPOMI’s ability to measure co-located pollutant species at relatively high resolution makes it a prime candidate for investigating and monitoring point sources for UK regulators.
Historically, satellite instruments have been used in scientific research to: (i) observe large temporal and spatial trends of trace gases on regional or global scales [7], (ii) investigate strong isolated point sources in regions with infrequent cloud cover [8,9,10,11,12], (iii) track large-scale transport events [13,14] and (iv) monitor phenomena such as the Antarctic Ozone hole [15,16,17]. Recently, as data products have matured, a number of UK-based agencies and departments have become interested in developing satellite data capabilities. Studies for government, such as the “Innovative technology to improve AQ monitoring” report for the Department for Environment, Food, and Rural Affairs (Defra) [18], the Highways England’s “Strategy to improve air quality” [19] and the Scottish Government’s “Clean air for Scotland strategy” [20], have identified satellite data products as a technology worthy of further investigation or implementation [21]. Defra are funding a project titled “Applying Earth Observation (EO) to Reduce Uncertainties in Emission Inventories”, which has produced outputs demonstrating the potential of current satellites to validate UK National Atmospheric Emission Inventory (NAEI) for NO2 and NH3 [22,23]. The Scottish ClimateXchange Centre of expertise conducted a study, on behalf of the Scottish government, where satellite data was used to investigate urban and regional Scottish emission changes over time [24]. In 2020, the Environment Agency ran a year-long exploratory investigation culminating in a report by Brown et al. [21], which investigated the potential uses of current satellite data products for air quality regulators, and identified future instruments as potentially viable for supporting regulation. Certain regions, such as East Asia, the Middle East and the USA, feature heavily in satellite air quality studies, but difficulties with retrievals over the UK (see Section 3.1) mean it is often neglected, and UK sources are generally omitted from larger studies. Of the handful of UK studies in the literature, the majority focus on regional or city scale emission trends over time [23,25,26,27,28,29]. This is not sufficient for air quality regulation, because emissions need to be attributable to individual sites/sources to inform the assessment of compliance.
There is a global interest in satellite data among air quality regulators, as the data could provide supplementary evidence for a range of regulatory concerns such as: (i) transboundary impacts to/from other countries, (ii) regional and conurbation-scale plumes, (iii) individual sources or industrial complexes, (iv) impacts in a local district or region where one type of source is concentrated (e.g., ammonia from rural poultry farming) and (v) auditing of fugitive emissions/identification of unanticipated sources (e.g., methane leaks from oil and gas infrastructure). Satellite data has been used to some extent for purposes (i) and (ii), but rarely for purposes (iii), (iv) and (v), especially in UK, due to the limited spatio-temporal resolution of previous instruments. However, the next-generation of public and private satellite missions will provide a step change in capability—so that more situations like (iii), (iv) and (v) can be investigated by regulators using satellite-based data. It is therefore timely to develop robust methods, using data from current instruments, to prepare regulators to make use of new higher-resolution missions once they are available. Accordingly, this paper presents a pilot study demonstrating the current capability of high-resolution satellite data for UK source detection, case (iii), and discusses the potential of upcoming missions for investigating site-specific emissions.

2. Regulatory Context

2.1. Air Quality Management in the UK

UK air quality policy is derived from national, European Union (EU) and international legislation, each covering different aspects of anthropogenic emissions and public exposure to air pollutants. These fall into three main groups, as outlined in Table 1.
Air quality management and regulation are the responsibility of national, regional and local authorities within England and each of the devolved administrations of the UK (Wales, Scotland and Northern Ireland). As per the Environment Act (1995), the UK government and the devolved administrations must each develop strategies to improve air quality, which must be updated regularly.
National authorities, such as Defra, are ultimately responsible and accountable for meeting limit values specified in legislation. Air quality regulation is conducted on behalf of these national authorities by their respective environment agencies. These are outlined in Table 2. These agencies, such as the Environment Agency in England, are responsible for granting and evaluating permits for industrial emissions to air, in line with the Industrial Emissions Directive and the Environmental Permitting Regulations (2010). Smaller industrial sources, ambient air quality impacts from transportation and other air pollution concerns are the responsibility of local authorities, who are mandated to review and manage air quality in their area.

2.2. Environment Agency’s Role as a Regulator

This work focuses on the roles and remit of the Environment Agency in England, but the responsibilities, challenges and opportunities should apply similarly to all UK regulators. The Environment Agency, sponsored by Defra, is the government agency tasked with the protection of the environment in England. They are responsible for the regulation of major industrial activities, waste management, flood risk management, fisheries and conservation. In particular, the Environment Agency is responsible for regulating air pollutant releases from industrial Part A (1) sources (detailed in Table 3) and acts as England’s large industrial emissions-to-air regulator [30].
The Environment Agency grants and enforces air quality permits through the UK Environmental Permitting Regulation legislation [30], which is designed to satisfy emission objectives set by the UK Air Quality Strategy [31] and the Industrial Emissions Directive [32]. The Environment Agency also assists with emergency ambient air quality monitoring, partly through portable battery operated monitoring equipment, for situations such as wildfires and large industrial incidents. For emissions regulation, the Environment Agency uses dispersion models (e.g., ADMS-5) and ambient air quality monitoring to regulate sites, and specifically to determine ground level concentrations and potential air quality standard breaches due to the site. This modelling/monitoring is conducted by either the Environment Agency or by the site operator, which is then verified by the Environment Agency.
Currently, the Environment Agency does not utilise satellite data for air quality purposes [21]. Satellites gather information about the entire tropospheric column of air, so whilst they are not directly comparable to current regulatory tools, they do present a new perspective to consider a site emissions, and offer a range of currently unexploited information about emissions from Part A (1) sources into the atmosphere. Furthermore, future missions will provide satellite data at higher spatial, temporal and spectral resolution. This will include hourly observations, enabling finer-scale identification of sources. Therefore, urgent research is required to prepare government agencies to utilise this data, and to develop robust techniques for interpreting satellite data for regulatory purposes. Data from currently operating satellites are crucial for developing and piloting methods for use with future higher-resolution data, when it becomes available. For current instruments we need to focus on conditionally-selected situations where the “signal” of an individual source (e.g., an oil refinery) in satellite data is prominent compared to the “noise” from other sources (e.g., urban areas). The following pilot study lays the groundwork for the incorporating these datasets into regulation, and will work towards preparing these agencies for future data products.

3. Satellite Data for UK Regulation

3.1. Challenges in Utilising Satellite Data for UK Regulators

There are three areas of challenge when utilising satellite data for regulatory purposes in the UK. Firstly, UK point sources are often omitted from global studies due to difficulties associated with observations over the UK. Frequent and extensive cloud cover is the main obstacle for UK observations. The UK spans a latitude range of 50°–60° and as a result is influenced by the collision of Ferrel and Polar circulation cells [33]. This interaction gives rise to increased cloud formation and also drives the polar jet stream, which delivers low-pressure systems to the UK and leads to increased cloudiness and precipitation. Clouds limit the ability of the satellite instrument to detect boundary layer pollutants, as they can completely shield the column of air below the cloud layer [7]. Clouds increase the uncertainty in the light path, as scattering off high clouds can shorten the light path, and multiple scatterings within thick clouds can increase the light path [7]. Therefore, any pixel with a cloud fraction greater than 0.5 (i.e., greater than 50% cloud coverage within the pixel) is typically discarded [6]. This results in a large portion of data being omitted, and represents the greatest obstacle in using satellite data for regulatory purposes, as clouds reduce the amount of data available and introduce a “bias” towards clear sky conditions [34]. Figure 1a demonstrates the percentage coverage of cloud-free high-quality retrievals for the TROPOMI NO2 data product. The majority of UK mainland sits between 30 and 40% data coverage, with rural mountainous areas such as north-west Scotland, falling to approximately 15–20%.
Secondly, the UK has a high population density and many of the UK’s regulated industrial sites are located within tens of kilometres of nearby cities or other regulated sites, as shown in Figure 1b. This makes it challenging for satellite instruments to resolve emissions from a specific site, as variable winds lead to mixing/masking of emissions from multiple, closely situated sources.
Thirdly, the UK can be subject to transboundary air pollution episodes imported from mainland Europe, which can overlay and obscure emissions from point sources. The masking of a site due to contributions from other sources is a major obstacle for the application of satellite data for UK regulators, as a regulator needs to be able to isolate and attribute emissions to a specific site for the evidence to be admissible.
In a broader context, the application of current satellite instruments are limited for regulatory activities by their spatial resolution, temporal resolution and sensitivity. With km-scale spatial resolution, it is challenging to resolve small point sources, or to isolate them from other neighbouring sources, and so it is often required to treat co-located sources as a “cluster”, and investigate emissions as if they were a single combined source. Private ventures, such as GHGSat’s high-resolution methane constellation, and future high-resolution missions, such as the CO2 Monitoring mission (CO2M), should allow for more individual sources to be resolved. The coarse temporal resolution of current instruments (e.g., 13.30 daily overpass for TROPOMI) limits the regulation of intra-day varying sources, and prevents the consideration of the diurnal cycle for contributions from other sources, such as transport. Until there are geostationary missions (e.g., Sentinel-4) providing hourly data, satellites will only be able to offer a “snapshot” of emissions from a site each day. Satellite observations also have a variable vertical sensitivity, particularly for species absorbing at lower wavelengths, such as NO2. This means the instrument is less sensitive to pollutants at the surface [7], and cannot identify where in the vertical column the pollutant resides. Modelling methods are generally required to assess ground impacts from satellite data [35,36,37]. The sensitivity of the instrument to a given trace gas is also an issue, particularly for weak absorbers/absorbers of larger wavelengths. Therefore, for regulatory applications, the emission from the site may be below the sensitivity of the instrument, and therefore will be undetected. This was discussed as an issue for UK-based methane observations of landfill sites in the Brown et al. [21] report. Moreover, there is a requirement for a comprehensive understanding of the uncertainties associated with (i) the inferred emissions from the region of interest, and (ii) the attribution of these emissions to the source of interest. The development of an uncertainty assessment procedure for satellite-based emission estimates for regulatory purposes would be an important next step in making satellite-derived data admissible as regulatory evidence. Despite these limitations, satellite data, when properly handled and interpreted, offer a currently underutilised wealth of information, which will only increase as new missions are launched. Therefore, work must be performed now to understand the full capabilities and limitations of these data products, so that regulators and air quality practitioners can use these datasets in an informed and responsible way.

3.2. Moving towards Site-Specific Regulation

One specific interest for the Environment Agency is the use of satellite air quality data to investigate industrial point source emissions. Few studies have focused on UK industrial point sources, and typically only large power stations such as Drax, the UK’s largest NO2 point source, are identified [38]. The majority of UK studies focus on combined source emissions over a large area, such as from large cities [22,25], or they investigate regional/national-scale changes [23,26]. In other countries with more favourable conditions, point source analysis has matured over the last 10 years. Emission plume detection using satellite data began with a 2011 study by Beirle et al. [39], where Ozone Monitoring Instrument (OMI) NO2 data was used along with meteorological fields to conditionally aggregate tropospheric NO2 measurements with respect to the prevailing wind direction. This allowed the succesful identification of NO2 outflow from the city centre in the direction of the prevailing wind, from which they could determine the mean NOx lifetime and thus infer the NOx emission rate. Subsequently, several studies have followed the approach of co-selecting satellite data and meteorological data to obtain an enhanced signal-to-noise ratio. The studies of Valin et al. [40] and Pommier et al. [41] developed this further by using wind fields to rotate NO2 (OMI) and CO (Measurements Of Pollution In The Troposphere, MOPITT) observations over megacities. Each satellite pixel was rotated about a central point with respect to wind direction, so that every observation is re-orientated along the upwind/downwind direction. This rotation further enhances the signal-to-noise ratio of the target, and is a valuable method to identify and isolate a point sources.
Since these studies, wind direction and wind rotation analysis has become an widely used analysis technique. For example, they have been used on OMI NO2 and SO2 observations of power stations [10,38]; Infrared Atmospheric Sounding Interferometer (IASI) and Cross-track Infrared Sounder (CrIS) NH3 observations of industrial point sources [42,43]; and TROPOMI NO2 observations over a large power station in South Africa [8]. These techniques to increase the signal-to-noise ratio of point sources allow emission rates to be derived, and comparisons to be made between satellite-based estimates and “bottom up” inventories. Whilst satellite data will not replace current techniques, they can act as a valuable supplement and provide indictive information about a site or region.

4. Case Study: Detecting Regulated UK Industrial Activity from Space

This section presents a collection of techniques developed to better resolve a plume from a point source, and enhance the sites signal-to-noise ratio above other sources. The first step in investigating a regulated site is to resolve and isolate that site’s signal. As discussed, the majority of UK-based investigations focus on regional and city scale emissions. Nonetheless, as we will show, some industrial emission sources can be resolved by combining new high-resolution satellite observations with meteorological fields and oversampling techniques (see Section 4.3 and Section 4.4) can allow for industrial emission sources to be resolved. Here, we present a case study of a small cluster of sources all situated within a 2 km2 area on the south bank of the Humber estuary. This region is comprised of two oil refineries, the Humber Oil Refinery and the Lindsey Oil Refinery, and also the Immingham gas-fired power station, all regulated by the Environment Agency. Their locations are shown in Figure 2. In the 2019 NAEI Point Source Emission Inventory, these sources had “Nitrogen oxide as NO2” annual emissions of 2347, 795 and 955 tonnes, respectively. These three sources are treated here as one source, due to their close proximity and TROPOMI’s multiple-kilometre-scale resolution, resulting in an implied combined emission of approximately 4100 tonnes.
The data presented here is TROPOMI-derived tropospheric NO2, which has been processed with a quality value threshold of 0.75 and a cloud radiance fraction less than 0.5 [6]. These flags ensure only high-quality cloud-free pixels are selected for processing. For this work, NO2 from TROPOMI spanning a time frame from May 2018 to September 2021 was used.

4.1. Oversampling for Temporal Averages

Oversampling is a processing technique that allows multiple observations to be combined onto a higher-resolution regular grid. It is an essential first step to convert from level 2 (original swath coordinates) to level 3 (regular grid) when conducting analyses using multiple observations. Various methods exist, but for TROPOMI, the most common oversampling methods are tessellation based [44,45], subpixel [29] or physics-based [46] oversampling. For this study, data was oversampled using the subpixel method outlined in Pope et al. [29], whereby each satellite pixel is “sliced” into n × n subpixels, and these subpixels are binned onto a higher-resolution grid. For TROPOMI, it is possible to oversample 3.5 × 5.5 km pixels onto a 0.01° × 0.01° regular grid (approximately 1 km × 1 km), using an n of 20, without introducing high levels of noise. Subpixel oversampling takes advantage of the variable positions of satellite pixels over subsequent orbits, which allows for greater detail to be seen when averaging multiple observations together, compared to binning with respect to the pixel centre. Figure 3a,b, when compared to the oversampled Figure 3c, demonstrate how greater detail can be extracted from the same satellite products through the use of these processing techniques, and that an oversampling technique is essential when using a higher-resolution grid

4.2. Temporal Average

The simplest technique to combine multiple observations is a temporal average. For a temporal average, every observation within a given timeframe, which passes the quality filtering requirements, is averaged. In order to reduce noise due to incomplete observations, an ‘areal coverage’ criterion was applied, meaning observations were only used when at least 50% of the available pixels from that observation passed the quality filters. The result is a time-averaged map of the pollutant, allowing for analysis of long-term trends (such as seasonal, weekday-weekend and yearly trends) and the identification of strong persistent sources. Figure 3c shows an enhancement of NO2 on the south bank of the Humber estuary over the target site, along with an urban enhancement from Hull on the north bank. It should be noted that the Humber is also a busy shipping route, and so some of the regional enhancement will be due to emissions from shipping and port activities. An enhancement west of the refineries is also detected, which coincides with Scunthorpe. Scunthorpe is a small town with a large steelworks on its eastern side, which is another Environment Agency regulated site and has considerable emissions of NO2. Temporal averages are useful for detecting strong isolated sources, but, by themselves, are of limited use for quantifying point source plumes and deriving emissions. The main issue with a standard temporal average is the smearing effect due to variable winds [39]. The UK, whilst predominantly experiencing south-westerly winds, also experiences a range of wind directions and wind speeds. This means that day to day variability will carry the plume in different directions depending on the meteorology of each day. The longer the period analysed, weaker/more variable sources are diminished/disguised against regional levels (background). Strong consistent sources are easier to distinguish, but are still smeared by variable winds.

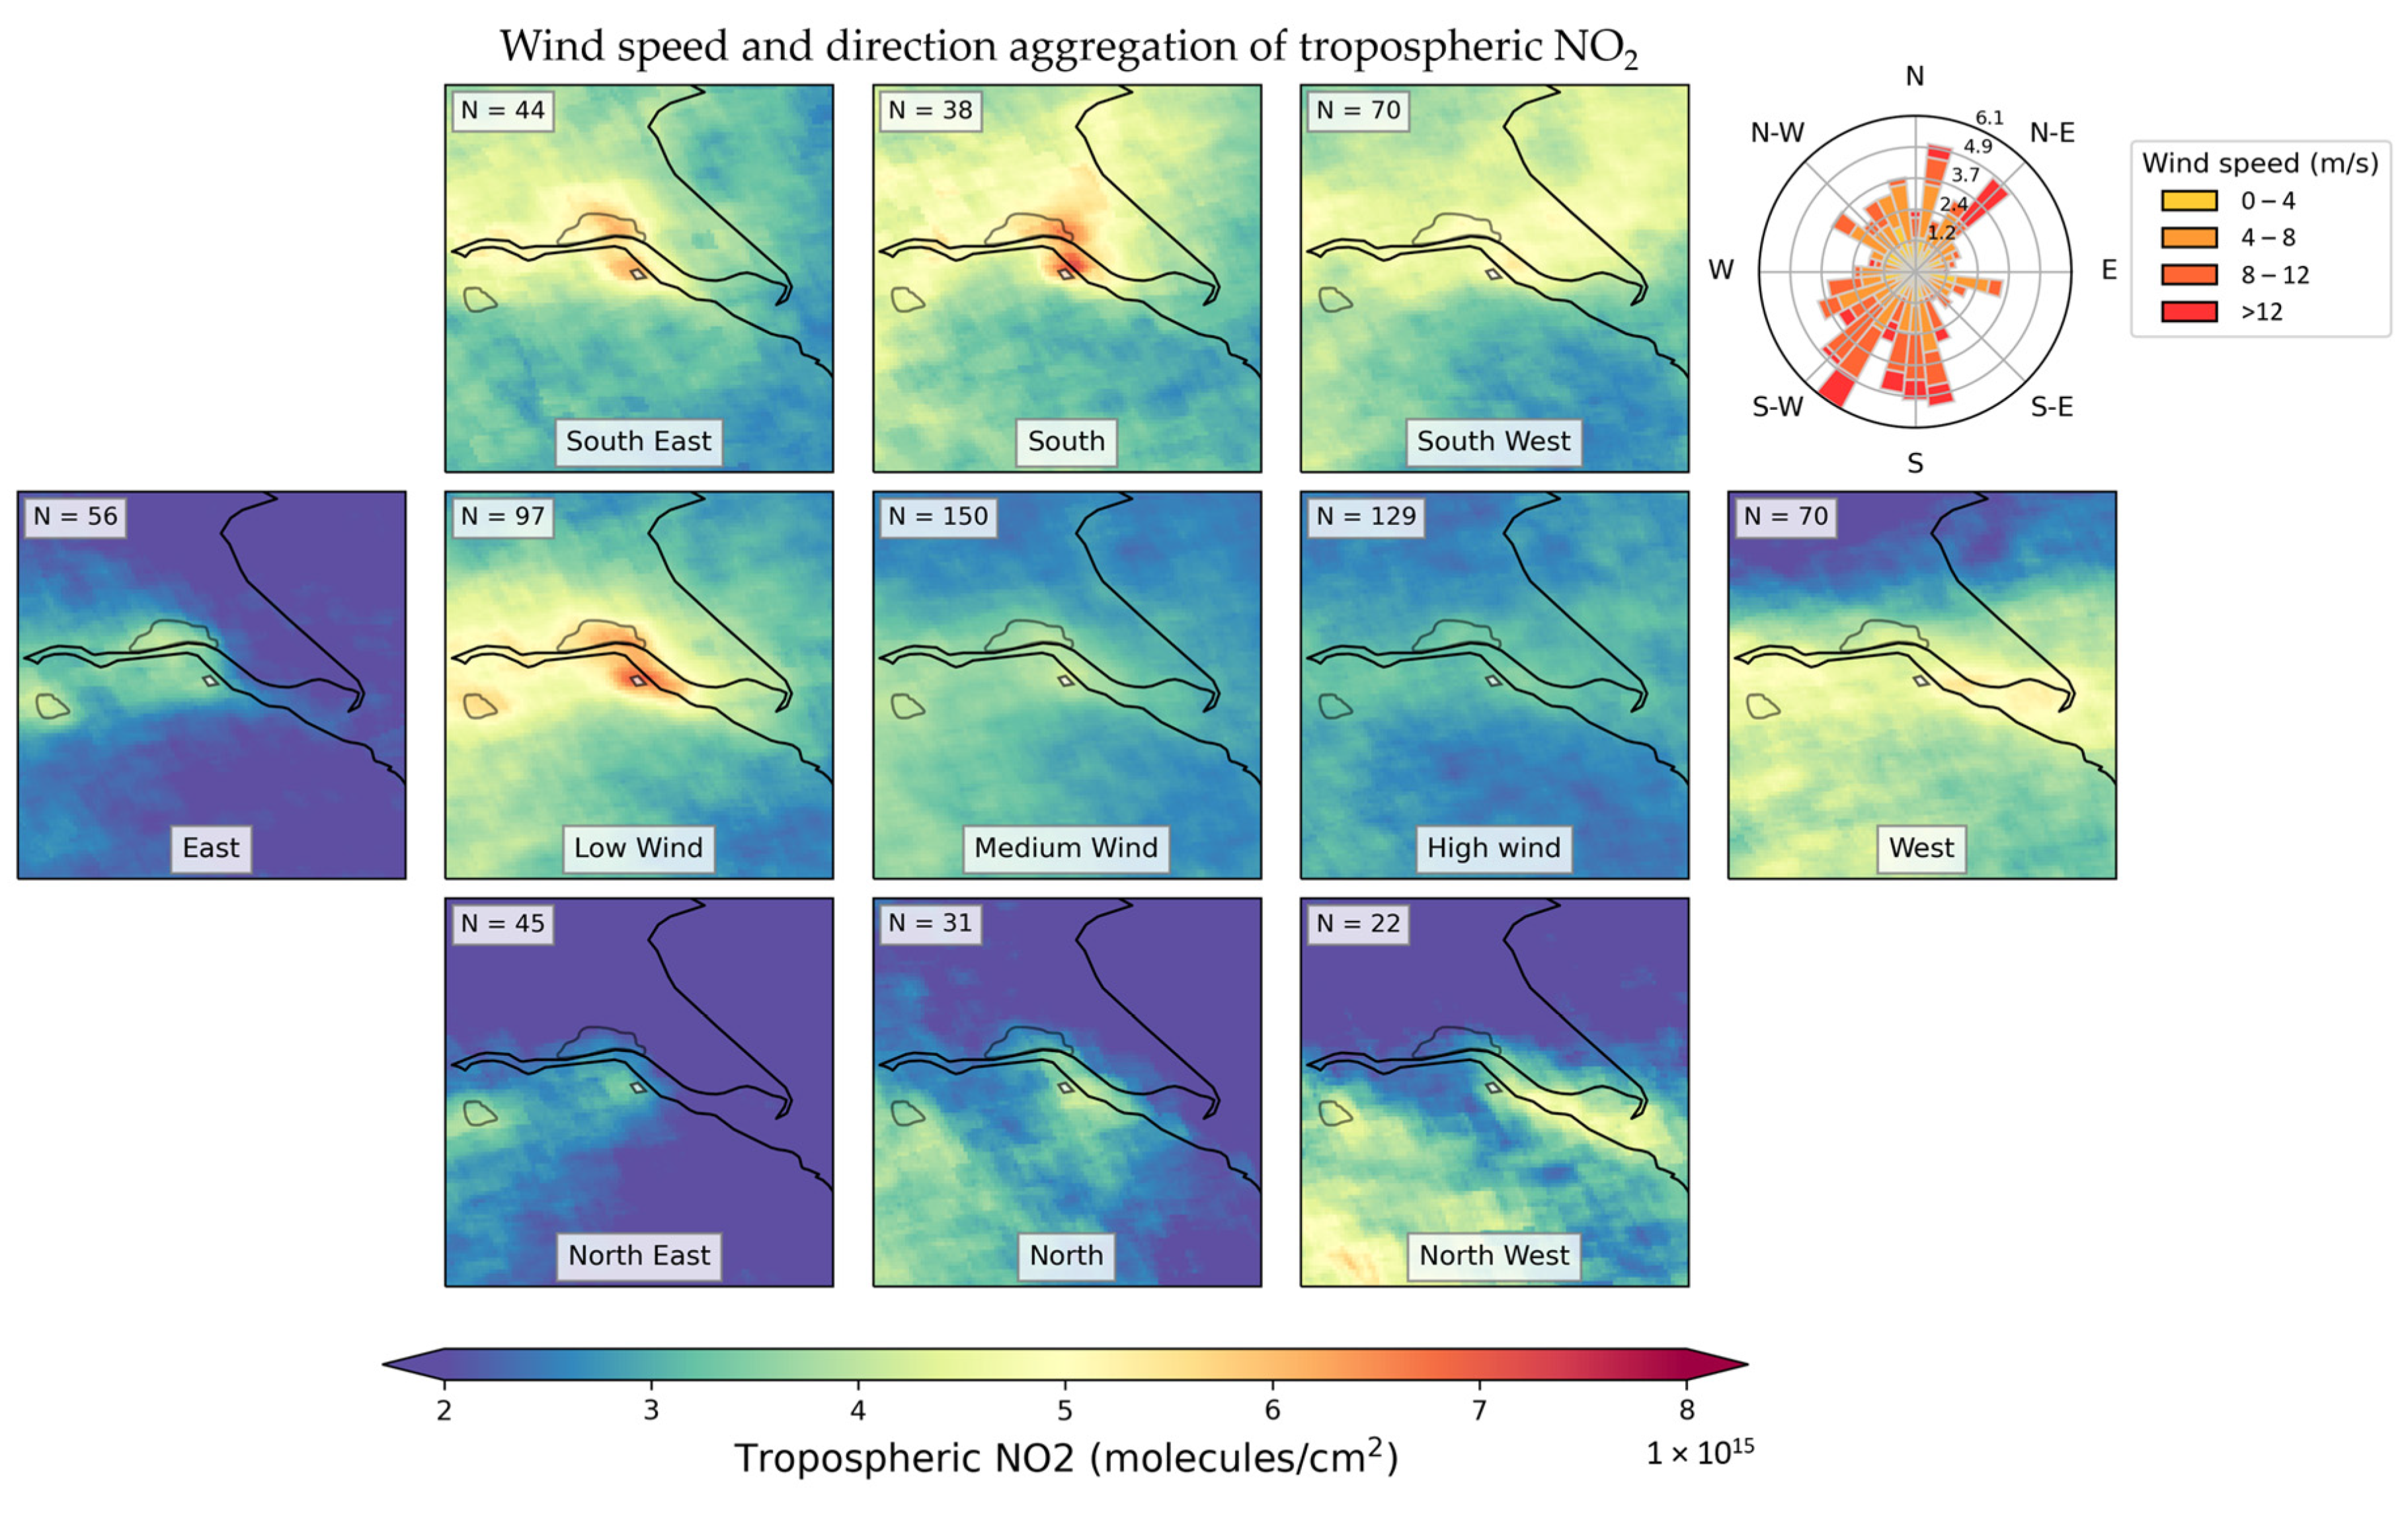
4.3. Wind Speed and Wind Direction Aggregation

Aggregation by wind speed and direction was first applied to satellite data around a “point source” by Beirle et al. [39], and has been notably used in the UK in the 2016 Pope et al. [38] study of Yorkshire coal power stations. A similar procedure is used in this case study, in which observations are grouped into eight wind sectors, so that only observations within the same sector are averaged together. By combining satellite data with modelled wind fields, this method can preserve the plume and avoid smearing due to variable winds, as the upwind-downwind fields are kept consistent (within a 45° sector). For this study, European Centre for Medium-Range Weather Forecasts (ECMWF) reanalysis winds at a height of 100 m were used. Tests were performed with wind products at 1000, 950, 900 and 850 hPa pressure, and it was found that both the 1000 (110 m) and 950 hPa (540 m) wind products represented the direction of the industrial plume well; so for simplicity, the 100 m winds were used here. It would also be possible to vary the selected wind height to take into account the boundary layer height on each day [41], which will be investigated in future work. Wind speeds were categorised into low (0–4 m/s), medium (4–8 m/s) and high (>8 m/s) wind speeds at 100 m, based on ECMWF fields that have been interpolated spatially to the location of the site and temporally to the time of the satellite overpass.
Figure 4 shows that under calm, low wind speed conditions, we see the highest NO2 columns above the site, as emissions are not rapidly dispersed from the source during the NO2 chemical lifetime. The enhancement above the study region is clearly identifiable during low wind conditions, and confirms that the enhancement is due to emissions from the industrial sources, rather than potential transport from urban sources such as Hull. The possibility of transport from Hull could not have been excluded if the analysis had been a simple temporal average (Figure 3c). The low wind speed scenario also shows a clearer enhancement for Scunthorpe town and Scunthorpe steelworks, compared to the temporal average. Higher wind speeds lead to greater dispersion, and so for medium to high wind speeds it is not possible to identify the regulated sites, which is to be expected. Southerly and south-easterly winds display the clearest signal from the Humberside site containing the three sources, as there is a clear enhancement in NO2 originating from the site, which aligns with the direction of the wind. Southerly winds show a strong plume over the Humber estuary before merging with Hull’s urban plume. South-easterly winds show the clearest enhancement from the industrial region, as this direction avoids direct overlap with Hull’s emissions, and also rules out the enhancement being caused by shipping, as the SE plume flows parallel to the estuary and is entirely on land. This is valuable information for a regulator, as this investigation has revealed that for this site SE winds provide the clearest, least obstructed plume for analysis. Other wind directions show evidence of outflow from the regulated sites, such as south-westerly, westerly and north-westerly. Each of these directions display NO2 enhancement immediately downwind from the potential sources, but with less clarity and intensity than the southerly directions. This analysis has successfully identified, for the first time, NO2 emission plumes from these regulated sites. These regulated sites significantly contribute to the NO2 enhancement observed by TROPOMI in the region. The analysis has not only clarified the emissions signal are from the three sites, but has also helped to demonstrate a contribution to NO2 levels across the wider surrounding region.

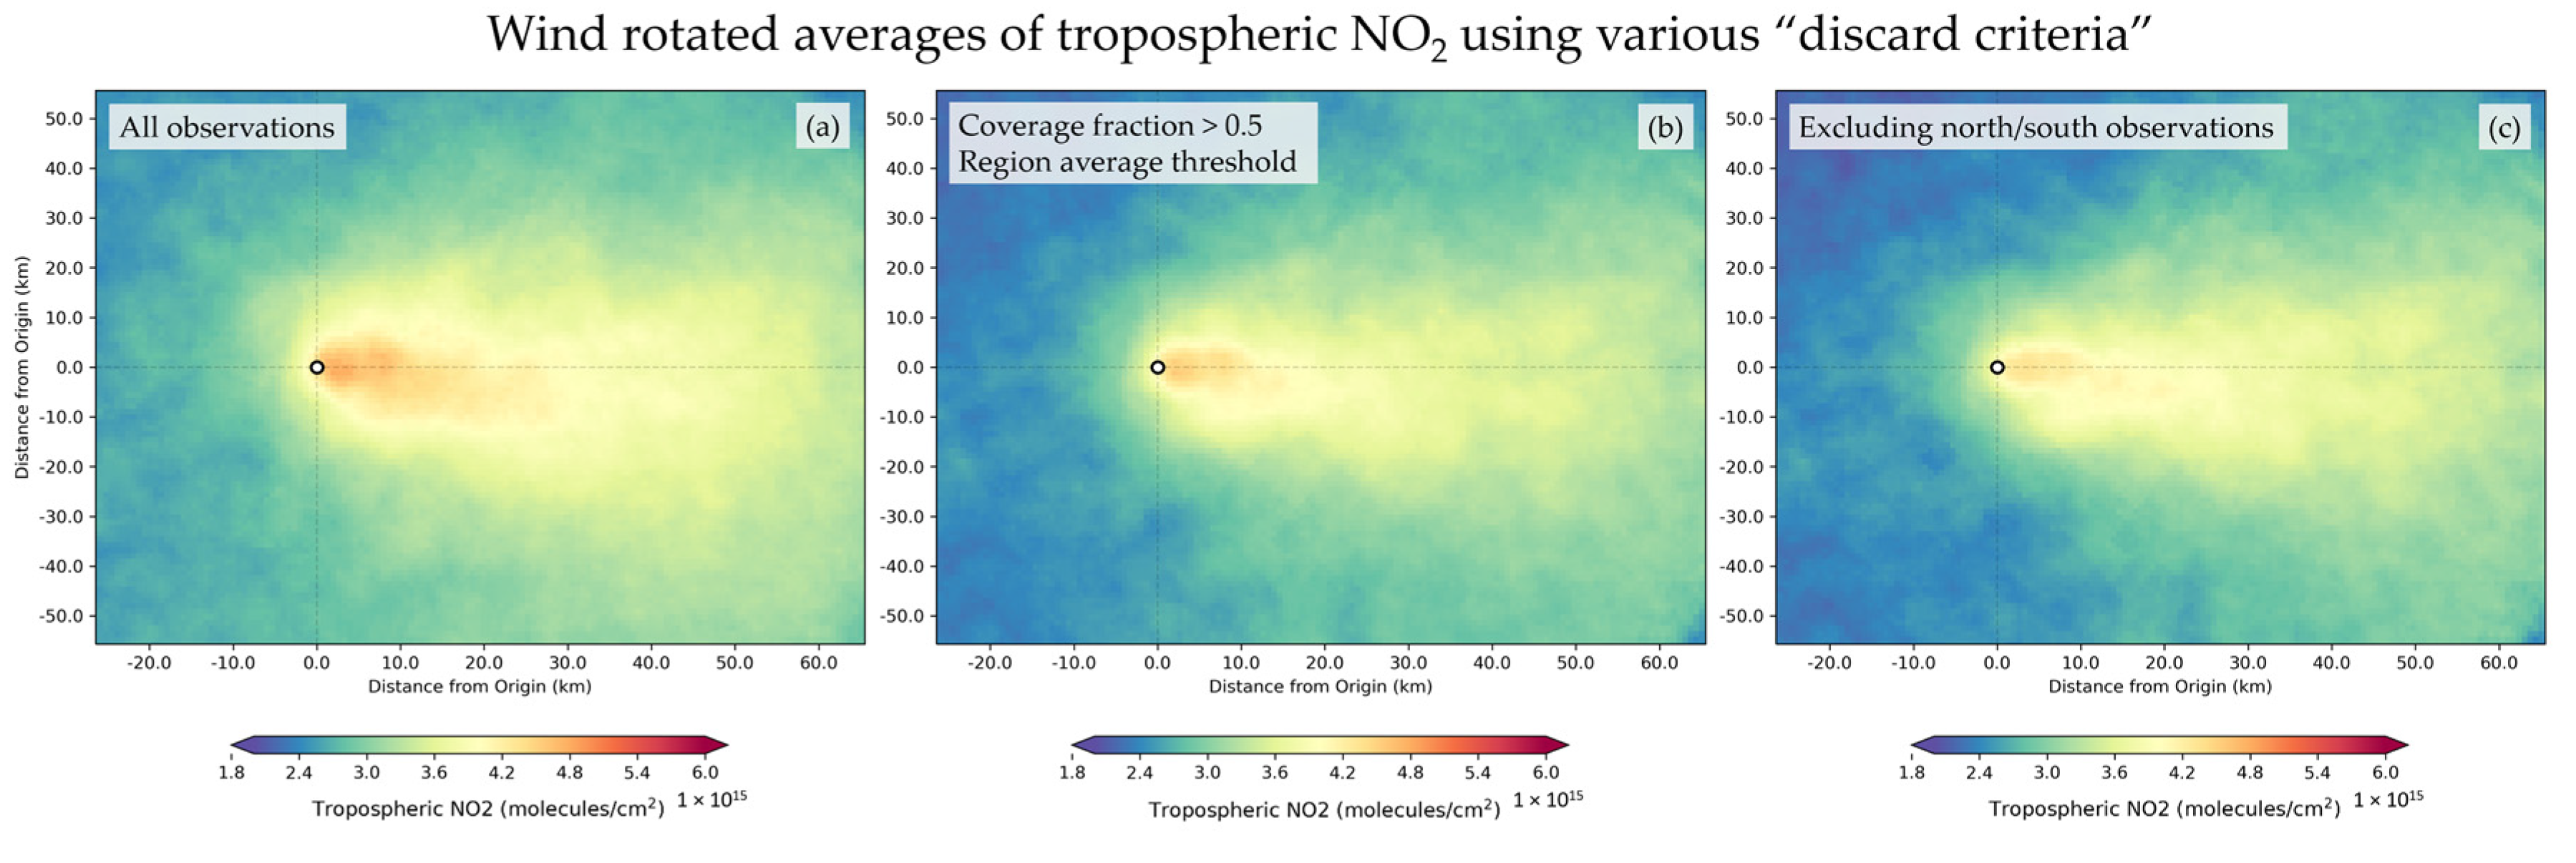
4.4. Wind Rotation Aggregation

Here, we build on a wind rotation aggregation approach first utilised for satellite air pollution data by Pommier et al. [41]. For this method each observation is rotated with respect to the prevailing wind direction, so that each daily observation is aligned along a common axis. The same wind fields used in the wind direction aggregation method were used here. The “origin” of rotation was selected as a central point between the three sites of interest. The original swath pixels were rotated with respect to the wind vector, and then oversampled as before. Several versions of the wind-rotated average were produced in order to illustrate the site-specific considerations required to isolate a target source from surrounding sources. This preliminary analysis step is required to correctly interpret the satellite data.
Wind rotation acts to suppress contributions from surrounding sources. For example, take an idealised wind field, with equal frequency of winds from all directions and constant speed, and the source of interest at the origin. Any additional source, situated at a distance R from the origin, will be spread into a ring of elevated NO2 around the origin. As the total mass of pollutant must be preserved, contributions from an additional source decline by 1/R with distance from the centre of rotation. For real-world wind conditions where winds are not uniform, the reduction at all points does not directly follow 1/R, but emissions from additional sources surrounding the target site will be suppressed up to a factor of 1/R [10]. Therefore, any indirect contributions from Hull should diminish as horizontal distance, x, increases. Despite this suppression, we omit observations with wind angles from the south and north, in order to avoid direct overlap with Hull’s urban plume.
Furthermore, the UK experiences occasional episodes of elevated tropospheric NO2, typically during anti-cyclonic conditions or under conditions which promote transport of NO2 from mainland Europe. During these episodes, emissions from a single site cannot be distinguished, as elevated regional levels mask the industrial site. When these occasions are included in the wind-rotated average, it leads to an elevation in NO2 downwind from the site but not originating from the site. Therefore, cases where the regional average exceeds a threshold of 6 × 10¹⁵ molecules/cm2 were discarded.
Enhancing the signal-to-noise ratio of a site requires the development of “discard criteria”. When using “discard criteria”, there is a fine balance between (a) obtaining a better signal-to-noise ratio from conditional selection of data versus (b) a poorer representation of the source because of a smaller sample of eligible data. Furthermore, as this analysis is a composite of many observations, spanning a total time frame of 3 years, real-time analysis using this approach is not possible, and investigations would require a dataset covering at least a few months to build up a representative composite over the UK. The new generation of satellites should shift this balance considerably, as platforms such as Sentinel-4 will provide hourly observations during daylight hours, compared to a single daily observation from TROPOMI. Therefore, with much more data available, conditional data selection methods should be more viable, producing sharper signals for individual sources whilst maintaining a considerable sample size.
Here, we have demonstrated the importance of considering the source of interest in the context of its surroundings and the wider air quality situation. For Figure 5a, every observation that passes the quality filtering requirements is rotated to a westerly wind direction. This scene is noisy, and the upwind background is reasonably elevated. Figure 5b required 50% data coverage for a region along the upwind downwind direction of the site (−10 km to +60 km in the x axis, −20 km to +20 km in the y axis), and also includes the regional average threshold filter described previously, to omit observations with highly elevated background levels. Figure 5c is the same as before but with observations under north–south conditions omitted to rule out direct contributions from Hull. These conditions have been outlined in Table 4, which includes the percentage of observations that pass each condition.
Comparing Figure 5b to Figure 5a, there is an observed reduction in the intensity and width of the plume due to the omission of observations with highly elevated regional NO2 columns, i.e., excluding episodes of poor regional air quality. This reduces the overall column within and around the plume. Comparing Figure 5c to Figure 5b, we observe another reduction in the overall intensity, but mainly in the first 15 km downwind of the plume. This reduction is due to the omission of observations under wind directions where Hull’s plume would overlap the site or vice versa. Hull sits at approximately 12 km north from the regulated site of interest. As mentioned previously, by conditionally selecting data in this way, we sacrifice the sample size for an enhanced signal-to-noise ratio of the site versus other sources. Looking at southerly observations in Figure 4, we see a strong enhancement immediately north of the target site but before Hull. Emissions from the site are highly visible under these wind conditions, but as the target site plume eventually overlaps the urban plume, we have had to discard these good observations in the pursuit of a better signal-to-noise ratio. This scenario demonstrates the trade-off between signal-to-noise ratio and sample size for the current instruments. Figure 5c shows a good enhancement in tropospheric NO2, originating from the site, and has shown how conditional data selection can be used to isolate a point source from regional contributions and neighbouring sources.

5. Conclusions

This case study has demonstrated various techniques to enhance the interpretation of satellite data for regulatory applications, and highlights how current and future instruments could provide supplemental data to inform UK regulation. It has demonstrated four techniques to enhance a point source’s signal-to-noise ratio, and has successfully identified for the first time a strong emission plume from three co-located sources along the south bank of the Humber. Limited studies have used satellite data for UK applications on account of the challenges faced with UK observations, but this research demonstrates that, under certain conditions and using conditionally selected data, satellites can provide value to UK regulators.
As discussed in Section 3.2, this type of analysis is not limited to NO2, nor is it limited to exact point sources, as more diffuse/area sources such as cities or landfill sites can also be investigated. More work needs to be performed to trial and adapt these methods for various types of UK sources, so that air quality regulators at the national, regional and local scales are equipped with the right tools to use this new data source effectively and responsibly, whether it be for a city, an agricultural region or a steelworks.
Regulators require robust and auditable data in order for it to be admissible as evidence. Therefore, there is a need to develop standardised procedures for selecting, analysing and interpreting satellite data, so that this data can be regarded as “objective evidence”, and not “subjective summaries”. This pilot study serves as the first step towards the development of this toolset, and highlights the potential of current and future instruments for regulation.
These results are of importance for regulators, air quality practitioners and researchers alike. For regulators and practitioners, it shows that existing data has benefits, and with higher-temporal-and-spatial-resolution instruments on the horizon, the true potential of these datasets can be realised. Given the time lag between traditional data availability, regulatory processes and policy, now is the time to develop tools and robust methodologies to understand how satellite data can play a part in regulatory processes, in preparation for future high-value missions. For researchers, these results demonstrate the value of conditional analyses of plume data and how, by careful selection, insight can be gained from even those datasets considered to be of low value for air quality purposes.

Author Contributions

Conceptualisation: D.A.P., E.J.S.F., J.D.V.H. and R.T.; methodology: D.A.P., R.T. and A.S.B.; investigation: D.A.P.; formal Analysis: D.A.P.; writing—original draft preparation: D.A.P.; writing—review and editing: D.A.P., E.J.S.F., A.S.B., R.T. and J.D.V.H.; supervision: E.J.S.F., J.D.V.H. and R.T. All authors have read and agreed to the published version of the manuscript.

Funding

This research and D.A.P. is supported by the CENTA Doctoral Training Partnership (UK Natural Environment Research Council, NERC) (NE/S007350/1), in CASE partnership with the Environment Agency. J.D.V.H. acknowledges funding from the NIHR HPRU in Environmental Exposures and Health at the University of Leicester. E.J.S.F. acknowledges funding from the NERC Knowledge Exchange Fellowship MEDIATE (NE/N005325/1).

Data Availability Statement

The TROPOMI data used in the findings of this study are openly available at the following URL/DOI: https://s5phub.copernicus.eu/dhus/#/home (accessed on 1 September 2021). NAEI point source UK emission estimates are available at https://naei.beis.gov.uk/data/map-large-source (accessed on 1 November 2021). Wind products used in this study are publicly available at https://cds.climate.copernicus.eu/cdsapp#!/dataset/reanalysis-era5-single-levels (accessed on 1 September 2021).

Acknowledgments

The University of Leicester High Performance Computing Facility ALICE was used to conduct data processing and analysis. The authors acknowledge the TROPOMI mission scientists and associated Sentinel-5P personnel for the production of the TROPOMI data products used herein. Thanks to Nick Martin and Andrew Sims for providing feedback on the final manuscript. Thanks to the anonymous reviewers, whose feedback and suggestions have improved the overall quality of the manuscript.

Conflicts of Interest

The authors declare no conflict of interest.

Disclaimer

The views expressed are those of the authors, and are not formal positions of their organisations.

References

  1. World Health Organisation. Ambient Air Pollution: A Global Assessment of Exposure and Burden of Disease; World Health Organisation: Geneva, Switzerland, 2016.
  2. Cohen, A.J.; Brauer, M.; Burnett, R.; Anderson, H.R.; Frostad, J.; Estep, K.; Balakrishnan, K.; Brunekreef, B.; Dandona, L.; Dandona, R.; et al. Estimates and 25-year trends of the global burden of disease attributable to ambient air pollution: An analysis of data from the Global Burden of Diseases Study 2015. Lancet 2017, 389, 1907–1918. [Google Scholar] [CrossRef] [Green Version]
  3. Manisalidis, I.; Stavropoulou, E.; Stavropoulos, A.; Bezirtzoglou, E. Environmental and Health Impacts of Air Pollution: A Review. Front. Public Health 2020, 8, 14. [Google Scholar] [CrossRef] [Green Version]
  4. Landrigan, P.J.; Fuller, R.; Acosta, N.J.R.; Adeyi, O.; Arnold, R.; Basu, N.; Baldé, A.B.; Bertollini, R.; Bose-O’Reilly, S.; Boufford, J.I.; et al. The Lancet Commission on pollution and health. Lancet 2018, 391, 462–512. [Google Scholar] [CrossRef] [Green Version]
  5. Department for Environment Food and Rural Affairs. Air Pollution in the UK 2020. Available online: https://uk-air.defra.gov.uk/library/annualreport/viewonline?year=2020_issue_1 (accessed on 1 November 2021).
  6. Eskes, H.; van Geffen, J.; Boersma, F.; Eichmann, K.; Apituley, A.; Pedergnana, M.; Sneep, M.; Veefkind, J.; Loyola, D. Sentinel-5 Precursor/TROPOMI Level 2 Product User Manual Nitrogendioxide. 2019. Koninklijk Nederlands Meteorologisch Instituut (KNMI) CI-7570-PUM. Available online: https://sentinel.esa.int/documents/247904/2474726/Sentinel-5P-Level-2-Product-User-Manual-Nitrogen-Dioxide (accessed on 1 November 2021).
  7. Burrows, J.P.; Platt, U.; Borrell, P. The Remote Sensing of Tropospheric Composition from Space; Springer Science & Business Media: New York, NY, USA, 2011. [Google Scholar]
  8. Hakkarainen, J.; Szeląg, M.E.; Ialongo, I.; Retscher, C.; Oda, T.; Crisp, D. Analyzing nitrogen oxides to carbon dioxide emission ratios from space: A case study of Matimba Power Station in South Africa. Atmos. Environ. X 2021, 10, 100110. [Google Scholar] [CrossRef]
  9. Van Damme, M.; Clarisse, L.; Whitburn, S.; Hadji-Lazaro, J.; Hurtmans, D.; Clerbaux, C.; Coheur, P.F. Industrial and agricultural ammonia point sources exposed. Nature 2018, 564, 99. [Google Scholar] [CrossRef] [PubMed]
  10. Fioletov, V.E.; McLinden, C.A.; Krotkov, N.; Li, C. Lifetimes and emissions of SO2 from point sources estimated from OMI. Geophys. Res. Lett. 2015, 42, 1969–1976. [Google Scholar] [CrossRef]
  11. Fioletov, V.E.; McLinden, C.A.; Krotkov, N.; Li, C.; Joiner, J.; Theys, N.; Carn, S.; Moran, M.D. A global catalogue of large SO2 sources and emissions derived from the Ozone Monitoring Instrument. Atmos. Chem. Phys. 2016, 16, 11497–11519. [Google Scholar] [CrossRef] [Green Version]
  12. Beirle, S.; Borger, C.; Dorner, S.; Li, A.; Hu, Z.K.; Liu, F.; Wang, Y.; Wagner, T. Pinpointing nitrogen oxide emissions from space. Sci. Adv. 2019, 5, eaax9800. [Google Scholar] [CrossRef] [Green Version]
  13. Guerova, G.; Bey, I.; Attié, J.L.; Martin, R.V.; Cui, J.; Sprenger, M. Impact of transatlantic transport episodes on summertime ozone in Europe. Atmos. Chem. Phys. 2006, 6, 2057–2072. [Google Scholar] [CrossRef] [Green Version]
  14. Zhang, L.; Jacob, D.J.; Boersma, K.F.; Jaffe, D.A.; Olson, J.R.; Bowman, K.W.; Worden, J.R.; Thompson, A.M.; Avery, M.A.; Cohen, R.C.; et al. Transpacific transport of ozone pollution and the effect of recent Asian emission increases on air quality in North America: An integrated analysis using satellite, aircraft, ozonesonde, and surface observations. Atmos. Chem. Phys. 2008, 8, 6117–6136. [Google Scholar] [CrossRef] [Green Version]
  15. Onoda, M.; Young, O.R. Satellite Earth Observations and Their Impact on Society and Policy; Springer Nature: Basingstoke, UK, 2017. [Google Scholar]
  16. Stolarski, R.S.; Krueger, A.J.; Schoeberl, M.R.; McPeters, R.D.; Newman, P.A.; Alpert, J.C. Nimbus 7 satellite measurements of the springtime Antarctic ozone decrease. Nature 1986, 322, 808–811. [Google Scholar] [CrossRef]
  17. Abbasi, S.; Abbasi, T. The Ozone Hole. In Ozone Hole; Springer: Berlin/Heidelberg, Germany, 2017; pp. 13–35. [Google Scholar]
  18. Ricardo Energy and Environment. Investigating the Feasibility of Innovative Technologies to Improve Air Quality Monitoring over the Medium to Long Term. 2015. Available online: https://uk-air.defra.gov.uk/library/reports?report_id=909 (accessed on 1 November 2021).
  19. Highways England. Air Quality Strategy. 2017. Available online: www.gov.uk/government/publications/highways-england-air-quality-strategy (accessed on 1 November 2021).
  20. Minister for Environment and Land Reform. Cleaner Air for Scotland 2—Towards a Better Place for Everyone. 2021. Available online: www.gov.scot/publications/cleaner-air-scotland-2-towards-better-place-everyone (accessed on 1 November 2021).
  21. Brown, A.; Hayward, T.; Timmis, R.; Wade, K.; Pope, R.J.; Trent, T.; Boesch, H.; Barrio Guillo, R. Satellite Measurements of Air Quality and Greenhouse Gases: Application to Regulatory Activities; Environment Agency: Bristol, UK, 2021.
  22. Pope, R.J.; Kelly, R.; Marais, E.A.; Graham, A.M.; Wilson, C.; Harrison, J.J.; Moniz, S.J.A.; Ghalaieny, M.; Arnold, S.R.; Chipperfield, M.P. Exploiting satellite measurements to reduce uncertainties in UK bottom-up NOx emission estimates. Atmos. Chem. Phys. Discuss. 2021, 2021, 1–23. [Google Scholar] [CrossRef]
  23. Marais, E.; Pandey, A.K.; Van Damme, M.; Clarisse, L.; Coheur, P.-F.; Shephard, M.W.; Cady-Pereira, K.; Misselbrook, T.; Zhu, L.; Luo, G.; et al. UK ammonia emissions estimated with satellite observations and GEOS-Chem. J. Geophys. Res. Atmos. 2021, 18, e2021JD035237. [Google Scholar] [CrossRef]
  24. ClimateXchange. Using Satellite Data to Help Quantify Scottish Greenhouse Gas Emissions. 2020. Available online: https://www.climatexchange.org.uk/research/projects/using-satellite-data-to-help-quantify-scottish-greenhouse-gas-emissions (accessed on 1 November 2021).
  25. Vohra, K.; Marais, E.A.; Suckra, S.; Kramer, L.; Bloss, W.J.; Sahu, R.; Gaur, A.; Tripathi, S.N.; Van Damme, M.; Clarisse, L.; et al. Long-term trends in air quality in major cities in the UK and India: A view from space. Atmos. Chem. Phys. Discuss. 2021, 21, 6275–6296. [Google Scholar] [CrossRef]
  26. Potts, D.A.; Marais, E.A.; Boesch, H.; Pope, R.J.; Lee, J.; Drysdale, W.; Chipperfield, M.P.; Kerridge, B.; Siddans, R.; Moore, D.P.; et al. Diagnosing air quality changes in the UK during the COVID-19 lockdown using TROPOMI and GEOS-Chem. Environ. Res. Lett. 2021, 16, 054031. [Google Scholar] [CrossRef]
  27. Pope, R.J.; Marshall, A.M.; O’Kane, B.O. Observing UK Bonfire Night pollution from space: Analysis of atmospheric aerosol. Weather 2016, 71, 288–291. [Google Scholar] [CrossRef] [Green Version]
  28. Pope, R.J.; Graham, A.M.; Chipperfield, M.P.; Veefkind, J.P. High resolution satellite observations give new view of UK air quality. Weather 2019, 74, 316–320. [Google Scholar] [CrossRef] [Green Version]
  29. Pope, R.J.; Arnold, S.R.; Chipperfield, M.P.; Latter, B.G.; Siddans, R.; Kerridge, B.J. Widespread changes in UK air quality observed from space. Atmos. Sci. Lett. 2018, 19, e817. [Google Scholar] [CrossRef]
  30. UK Government Legislation. The Environmental Permitting (England and Wales) Regulations. 2016. Available online: https://www.legislation.gov.uk/uksi/2016/1154 (accessed on 1 November 2021).
  31. Department for Environment Food and Rural Affairs. Clean Air Strategy. 2019. Available online: https://www.gov.uk/government/publications/clean-air-strategy-2019 (accessed on 1 November 2021).
  32. European Parliment and the Council of the European Union. Industrial Emissions Directive. 2010. Available online: https://eur-lex.europa.eu/legal-content/EN/TXT/?uri=CELEX:32010L0075 (accessed on 1 November 2021).
  33. Rossby, C.-G. The Scientific Basis of Modern Meteorology; US Department of Agriculture, Climate and Man, Yearbook of Agriculture: Washington, DC, USA, 1941; pp. 599–655.
  34. Geddes, J.; Murphy, J.G.; O’brien, J.; Celarier, E. Biases in long-term NO2 averages inferred from satellite observations due to cloud selection criteria. Remote. Sens. Environ. 2012, 124, 210–216. [Google Scholar] [CrossRef] [Green Version]
  35. Cooper, M.J.; Martin, R.V.; McLinden, C.A.; Brook, J.R. Inferring ground-level nitrogen dioxide concentrations at fine spatial resolution applied to the TROPOMI satellite instrument. Environ. Res. Lett. 2020, 15, 104013. [Google Scholar] [CrossRef]
  36. Wu, S.; Huang, B.; Wang, J.; He, L.; Wang, Z.; Yan, Z.; Lao, X.; Zhang, F.; Liu, R.; Du, Z. Spatiotemporal mapping and assessment of daily ground NO2 concentrations in China using high-resolution TROPOMI retrievals. Environ. Pollut. 2021, 273, 116456. [Google Scholar] [CrossRef]
  37. Lamsal, L.N.; Martin, R.V.; van Donkelaar, A.; Steinbacher, M.; Celarier, E.A.; Bucsela, E.; Dunlea, E.J.; Pinto, J.P. Ground-level nitrogen dioxide concentrations inferred from the satellite-borne Ozone Monitoring Instrument. J. Geophys.Res. Atmos. 2008, 113, 113. [Google Scholar] [CrossRef] [Green Version]
  38. Pope, R.; Provod, M. Detection of the Yorkshire power stations from space: An air quality perspective. Weather 2016, 71, 40–43. [Google Scholar] [CrossRef] [Green Version]
  39. Beirle, S.; Boersma, K.F.; Platt, U.; Lawrence, M.G.; Wagner, T. Megacity Emissions and Lifetimes of Nitrogen Oxides Probed from Space. Science 2011, 333, 1737–1739. [Google Scholar] [CrossRef] [PubMed]
  40. Valin, L.C.; Russell, A.R.; Cohen, R.C. Variations of OH radical in an urban plume inferred from NO2 column measurements. Geophys. Res. Lett. 2013, 40, 1856–1860. [Google Scholar] [CrossRef]
  41. Pommier, M.; McLinden, C.A.; Deeter, M. Relative changes in CO emissions over megacities based on observations from space. Geophys. Res. Lett. 2013, 40, 3766–3771. [Google Scholar] [CrossRef] [Green Version]
  42. Dammers, E.; McLinden, C.A.; Griffin, D.; Shephard, M.W.; Van der Graaf, S.; Lutsch, E.; Schaap, M.; Gainairu-Matz, Y.; Fioletov, V.; Van Damme, M.; et al. NH3 emissions from large point sources derived from CrIS and IASI satellite observations. Atmos. Chem. Phys. 2019, 19, 12261–12293. [Google Scholar] [CrossRef] [Green Version]
  43. Clarisse, L.; Van Damme, M.; Clerbaux, C.; Coheur, P.F. Tracking down global NH3 point sources with wind-adjusted superresolution. Atmos. Meas. Tech. 2019, 12, 5457–5473. [Google Scholar] [CrossRef] [Green Version]
  44. Barkley, M.P.; González Abad, G.; Kurosu, T.P.; Spurr, R.; Torbatian, S.; Lerot, C. OMI air-quality monitoring over the Middle East. Atmos. Chem. Phys. 2017, 17, 4687–4709. [Google Scholar] [CrossRef] [Green Version]
  45. Spurr, R. Area-Weighting Tessellation for Nadir-Viewing Spectrometers; Internal Technical Note; Harvard-Smithsonian Centre for Astrophysics: Cambridge, MA, USA, 2003. [Google Scholar]
  46. Sun, K.; Zhu, L.; Cady-Pereira, K.; Miller, C.C.; Chance, K.; Clarisse, L.; Coheur, P.F.; Abad, G.G.; Huang, G.Y.; Liu, X.; et al. A physics-based approach to oversample multi-satellite, multispecies observations to a common grid. Atmos. Meas. Tech. 2018, 11, 6679–6701. [Google Scholar] [CrossRef] [Green Version]
Figure 1. Three plots demonstrating the difficulties associated with retrievals over the UK. (a) The percentage of TROPOMI NO2 observations that pass the quality filtering requirement of >0.75 and cloud radiance fraction <0.5, over a 3 year period from May 2018 to April 2021. (b) Location of large point source NO2 emitters from the NAEI 2019 point source inventory. (c) The 3 year average of tropospheric NO2 from TROPOMI from May 2018 to April 2021.
Atmosphere 12 01659 g001
Figure 2. Map illustrating the location of the regulated site, containing the Humber and Lindsey oil refineries and the Immingham power station.
Atmosphere 12 01659 g002
Figure 3. Demonstration of the importance of oversampling: (a) no oversampling, pixels binned by pixel centre into 0.05 × 0.05 degree grid. (b) Pixels binned by pixel centre onto a high-resolution grid with no oversampling. (c) Pixels oversampled and binned onto higher-resolution grid, highly effective with low noise.
Atmosphere 12 01659 g003
Figure 4. Wind direction and wind speed aggregated plots of tropospheric NO2 using ECMWF wind fields. Central three plots show low (<4 m/s), medium (4 < w < 8 m/s) and high (>8 m/s) wind speeds in all directions. Plots around the edges show observations under wind directions in one of eight categories. Wind rose of wind speed and wind directions over this site displayed in the top right hand corner.
Atmosphere 12 01659 g004
Figure 5. Wind rotation averaged tropospheric NO2 with the origin situated at the regulated site. (a) All observations rotated and averaged. (b) Require 50% data coverage for an observation to be accepted and set a regional average threshold to remove regional pollution episodes. (c) Same as (b) but also excluding observations under north/south wind directions.
Atmosphere 12 01659 g005
Table 1. Overview of key air quality legislation in force in the UK.
Regulatory FieldKey Legislation
Regulation on the total emissions
of air pollutants
  • National Emission Ceilings Directive (2016/2284/EU)
  • Gothenburg Protocol to the Convention on Long-range Transboundary Air Pollution (United Nations Economic Commission for Europe (UNECE) (1999, revised 2012)
Regulation on the concentrations
of pollutants in ambient air
  • Directive 2008/50/EC of the European Parliament
  • Directive 2004/107/EC of the European Parliament. (Both made into UK law through the Air Quality Standards Regulations 2010)
Regulation on the emission of pollutants from specific sources
  • Industrial Emissions Directive (2010/75/EU)
  • Medium Combustion Plant Directive (EU/2015/2193)
  • The Clean Air Act (1993)
Table 2. Breakdown of national authorities and air quality regulation by country.
CountryNational Authority (Policy Maker)Regulator/Policy Enforcement
EnglandDepartment for Environment, Food
and Rural Affairs (Defra)
Environment Agency (EA)
ScotlandScottish GovernmentScottish Environment Protection Agency (SEPA)
WalesWelsh GovernmentNatural Resources Wales (NRW)
Northern IrelandDepartment of Agriculture, Environment and Rural Affairs Northern Ireland (DAERA)Northern Ireland Environment Agency (NIEA)
Table 3. List of Part A (1) regulated sources [30].
Part A (1) Sources Regulated by the Environment Agency
Burning of fuel with a thermal input larger than 50 MW
Refining gas likely to involve the use of over 1000 tons of gas within 12 months
Incineration of hazardous waste
Disposal of waste into landfill greater than 10 tonnes per day
Rearing poultry or pigs intensively (40,000 poultry, 2000 pigs, 750 sows or more)
Reforming natural gas
Operation of coke ovens
Producing gas from oil
Refining mineral oils
Producing non-ferrous metals from ore, concretes, etc.
Various mining processes
Production of organic/inorganic chemicals
Table 4. Percentage of observations remaining after each discard criteria is applied.
Corresponding FigureDiscard CriteriaPercentage of Observations
Figure 5aNo discard criteria100%
Figure 5b50% Data coverage
Regional average threshold
30.1%
Figure 5cNorth/South winds + Number 225.1%
Publisher’s Note: MDPI stays neutral with regard to jurisdictional claims in published maps and institutional affiliations.

