Article

Bioaerosol Emission from Biofilters: Impact of Bed Material Type and Waste Gas Origin

by
Katarzyna Affek
,
Agnieszka Tabernacka
,
Monika Załęska-Radziwiłł
,
Nina Doskocz
and
Adam Muszyński
*
Faculty of Building Services, Hydro and Environmental Engineering, Warsaw University of Technology, 00-653 Warsaw, Poland
*
Author to whom correspondence should be addressed.
Atmosphere 2021, 12(12), 1574; https://doi.org/10.3390/atmos12121574
Submission received: 29 September 2021 / Revised: 25 October 2021 / Accepted: 23 November 2021 / Published: 27 November 2021
(This article belongs to the Special Issue Bioaerosols: Composition, Meteorological Impact, and Transport)

Abstract

:
Three semi-technical scale biofilters were applied to treat waste gases at different industrial sites in Poland: a mechanical–biological treatment plant of municipal solid waste, a wastewater treatment plant and a food industry plant. Two types of materials were used as beds in the biofilters: stumpwood chips and pine bark, and stumpwood chips, pine bark and compost from green waste. Both bed materials supported the microbial growth and high numbers (106–108 cfu/g dry mass (DM)) of culturable bacteria, and fungi in beds were observed. There was no correlation between the number of microorganisms (cfu/g DM) and the respiratory activity in the biofilter beds. However, microbial respiration activity corresponded with microbial abundance expressed as microbial equivalents (ME), which was calculated based on adenosine triphosphate (ATP) determination. The biofilters either reduced or increased bioaerosol emissions from industrial plants, depending on the microbial content in the waste gases. A high microbial content in the waste gases made the effect of microbial emission from the biofilter bed negligible. The type of biofilter bed and number of microorganisms in the bed also influenced the final bioaerosol emission, but these factors were relevant for biofilters that treated waste gases with low microbial concentrations.

1. Introduction

The use of biofiltration to eliminate chemical pollutants and reduce the emission of microorganisms from waste gas from industries (as well as alleviate odor nuisance) has become popular worldwide [1,2,3,4,5]. The main reasons for that are the high efficiency of volatile organic compounds (VOCs) removal, low financial outlays and operating costs and minimal secondary waste streams comparing to physicochemical methods (scrubbing, adsorption and condensation) [6]. The application of biofiltration also has some disadvantages, the most important of which are: poor control of environmental conditions, discharge of drainage from the filter beds and the relatively large surface area required. Nevertheless, this technology stays in line with emission control legislations and focuses on climate change and public health.
In the case of biological treatment, one of the key issues is to provide suitable conditions for the growth of microorganisms. In biofilters, waste gas is filtrated through the bed and the pollutants are transported and sorbed in biofilter media, where they are used by microorganisms as a carbon and/or energy source [6]. Various bioactive and preferably organically stable media are used as the beds of biofilters, such as compost, soil and yard waste. Biofilter media should provide high gas and water permeabilities and a high surface area for microbial growth [1,6]. In order to increase porosity and to reduce pressure drop, bulking agents such as wood chips, sawdust, hay, straw, pine wood shavings, cardboard, leftover cattle feed, wheat residue pellets, leaves, tobacco stalks and others are added to the active ingredients [1].
Understanding the physical and chemical properties of the biofilter bed as well as the microbial community structure and biodiversity depending on the bed material is crucial for the operation of biofilters. The composition, activity and viability of bacterial and fungal communities determine the effectiveness of biofiltration units [7]. The choice of bed material is substantial for biofilm formation, as it can affect oxygen distribution leading to the formation of anoxic/anaerobic zones within biofilter media [1]. However, biofilter designers tend to focus more on the sorption properties of the biofilter beds rather than their optimal colonization by bacteria and fungi [8,9,10,11]. Furthermore, only limited information is available on the performance of systems on a semi-technical and technical scale, with most of the studies conducted in laboratories on a bench-scale using biogas mimics [3,5,7,9,12].
Another aspect is that despite the removal of nonbiological suspended particles by filtration, biofilters can be a source of bioaerosol emissions [13]. A variety of harmful and infectious organisms has been detected inside the biofilters, depending on the bed media used [13]. However, little information has been reported about the effects of biofilter bed materials on bioaerosol emissions characteristics [14]. Although the composition of bacterial populations was studied using both culture-dependent and culture-independent approaches, few studies are of an applicational nature and rarely recommend simple methods and techniques to be used on-site by technical personnel and practitioners as a tool for monitoring microbial abundance and activity during the operation of biofilters [2,14,15].
The main purpose of this work was to assess the potential of two bed materials to prevent bioaerosol emissions from various types of industrial plants. The tested media (a mix of stumpwood chips with pine bark and a mix of stumpwood chips with pine bark with green waste compost) were used in semi-technical scale biofilters, which were installed in three various industrial facilities. The specific objectives were to compare the biofilter media in the view of:
  • Colonization by bacteria and fungi measured by culture-dependent and independent methods that may be easy to apply on-site;
  • Activity of microorganisms inhabiting the biofilters beds;
  • Bioaerosol emissions from the biofilters.

2. Materials and Methods

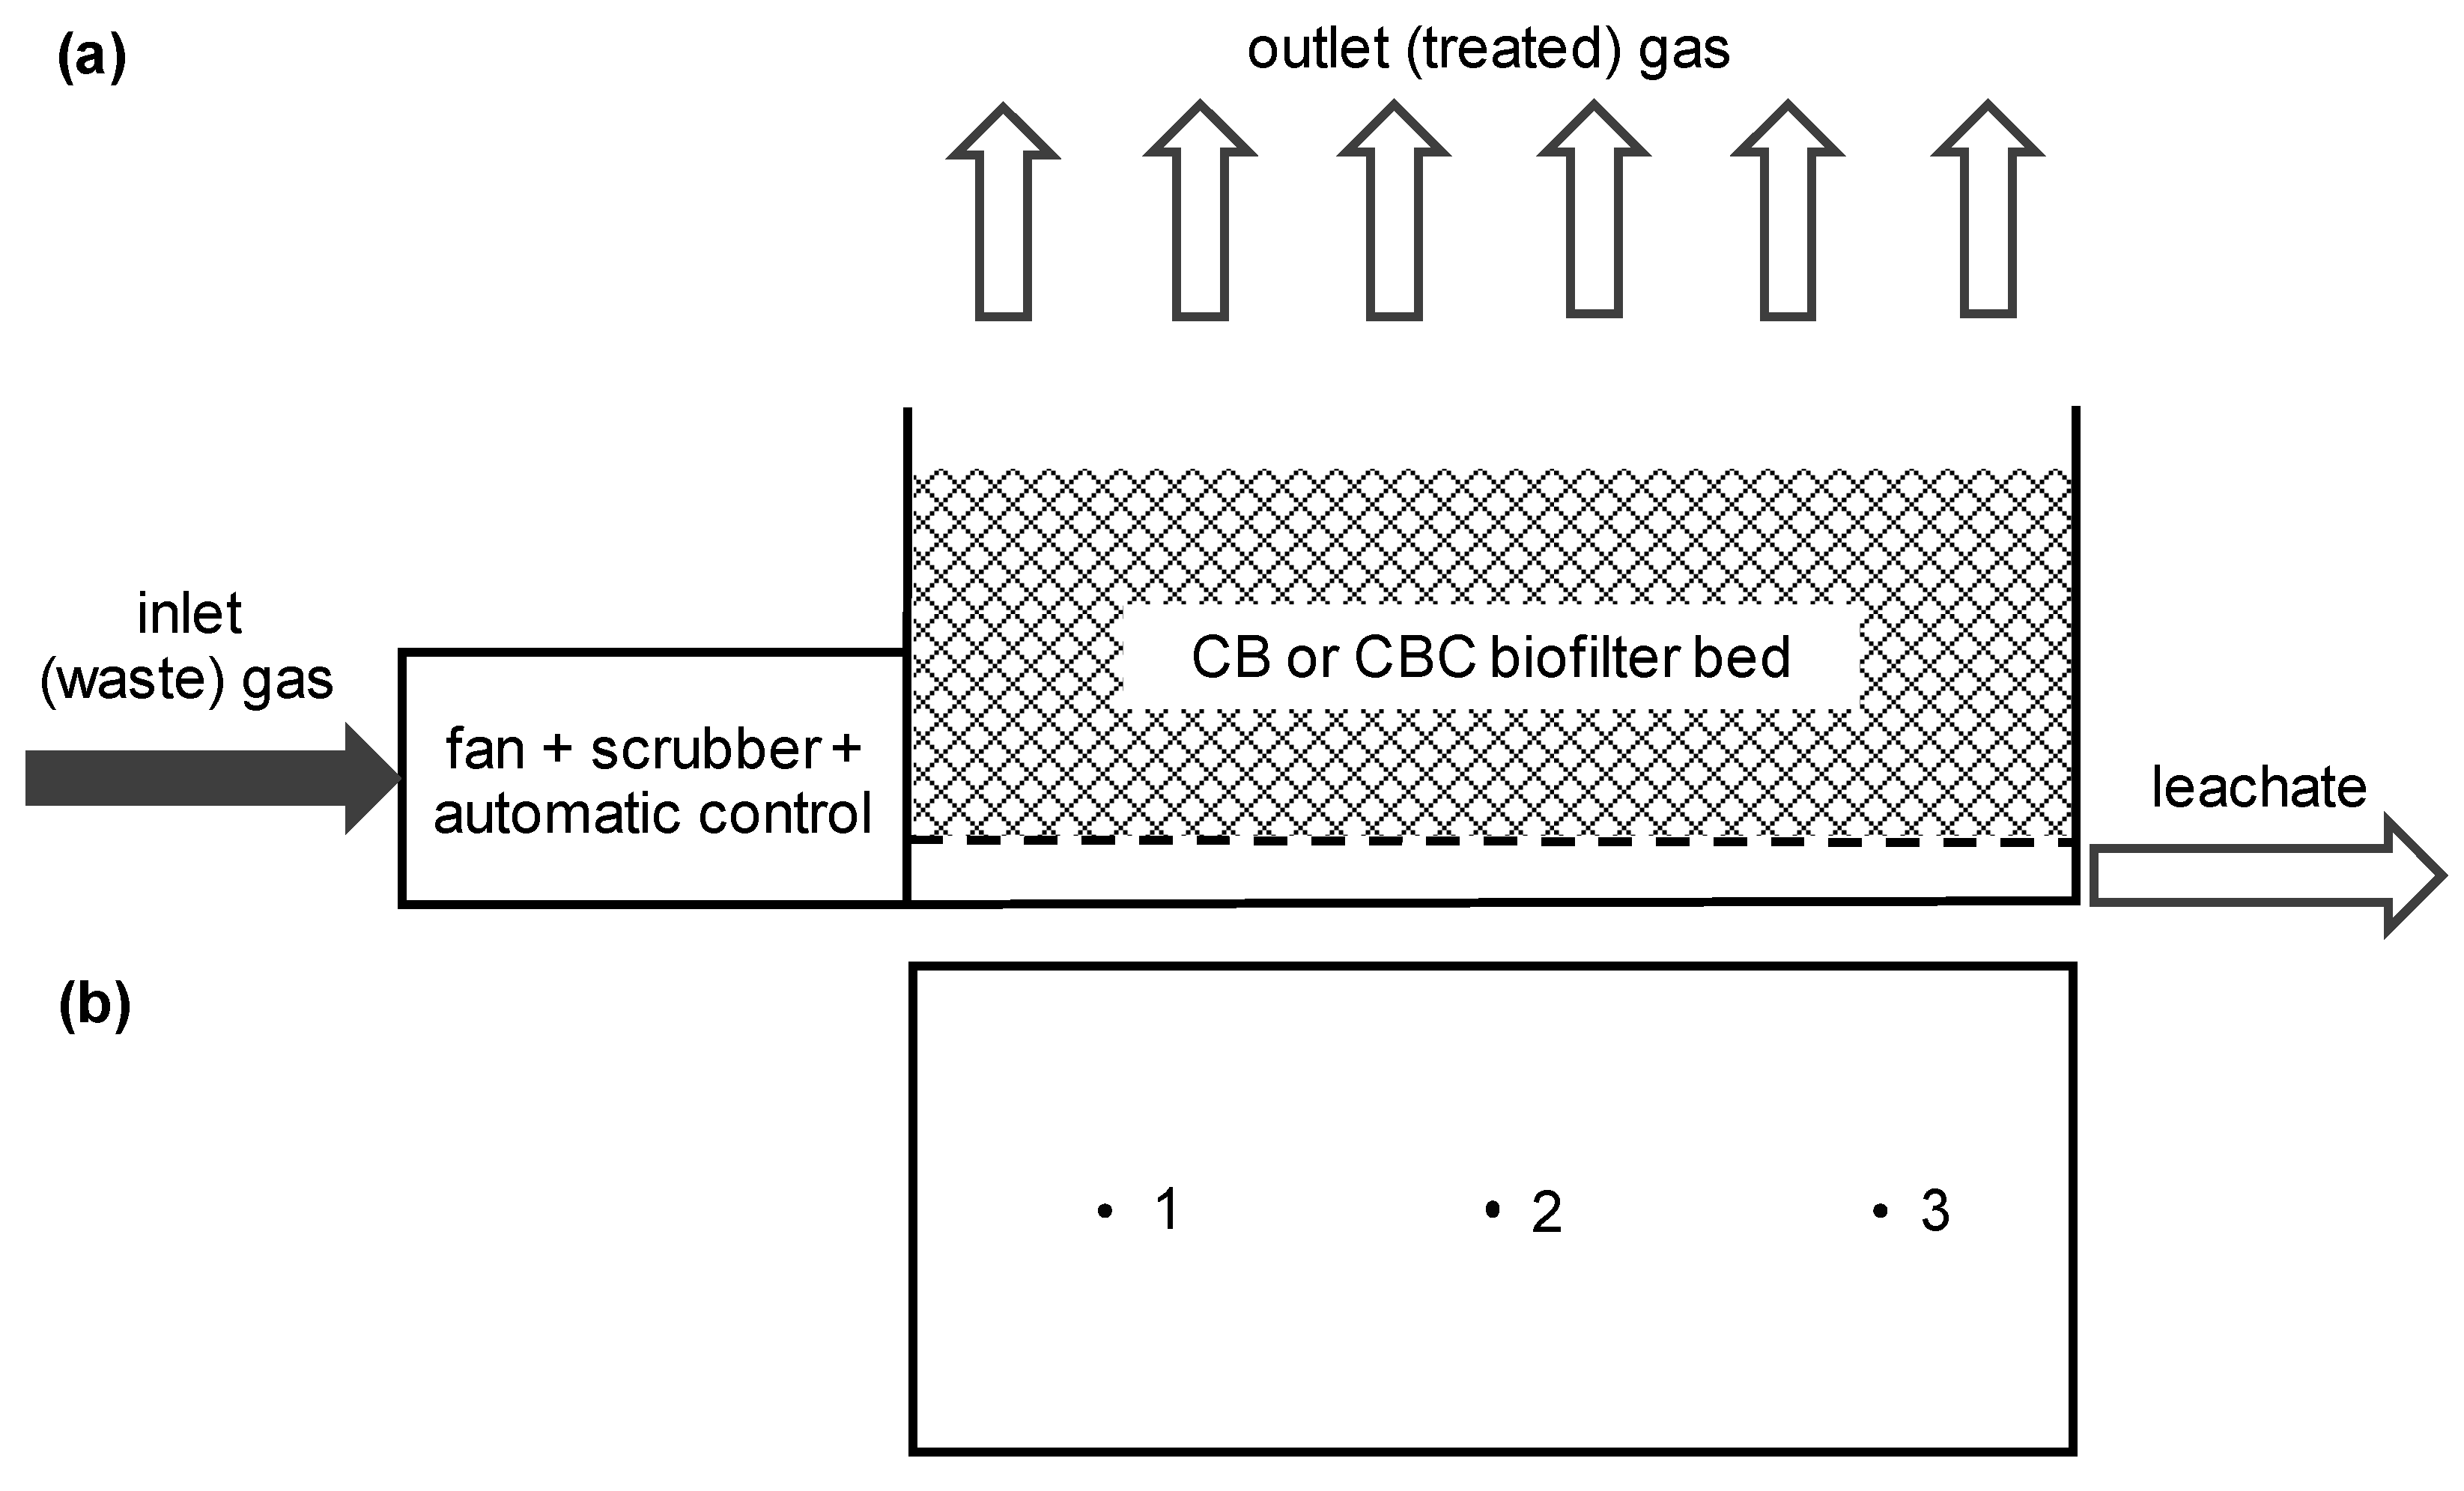
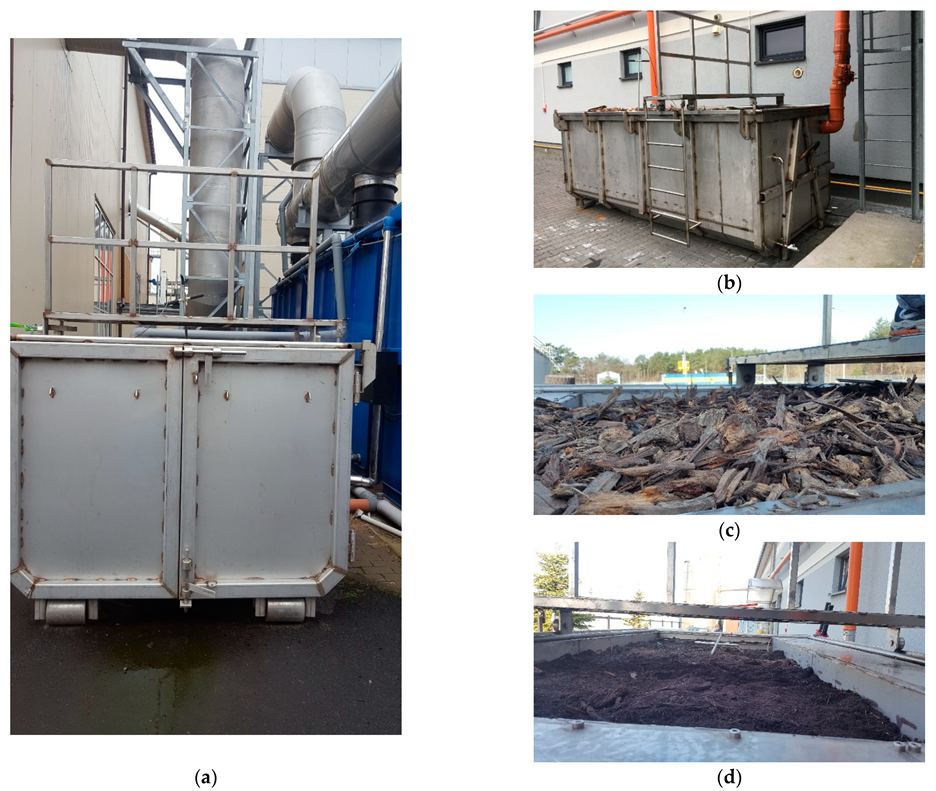
2.1. Test Sites and Biofilters

The semi-technical scale research was conducted in three different industrial sites located in Poland: a mechanical–biological treatment plant (MBTP), which treated municipal solid waste in aerobic conditions; a wastewater treatment plant (WWTP); and a food industry plant (FIP), which manufactured high-quality lard and vegetable fats. The tested three biofilters were identical and were connected to installations for the extraction of process gases from the aerobic stabilization hall at MBTP, the sludge drying hall at WWTP, and the production hall at FIP. The biofilters were operated to alleviate the odor nuisance and to eliminate main pollutants from the waste gases, such as VOCs, hydrogen sulfide and ammonia, as described in detail by Rolewicz–Kalińska et al. [16]. The main operational parameters are listed in Table 1.
Each biofilter was equipped with a fan, a scrubber, automatic regulation and measurement of gas flow, temperature and humidity control systems, and an installation for the distribution of waste gas and leachate drainage (Figure 1a and Figure 2a,b). The dimensions of the active surface of the biofilters were 1.32 m × 3.00 m and the depth of the bed was 1.1–1.2 m.
Two types of materials were used as beds in the biofilters: stumpwood chips and pine bark (CB), and stumpwood chips, pine bark and compost from green waste (CBC). CB was a 1:1 mix of pine bark and stumpwood chips with a grain diameter of 20–80 mm, whereas CBC was a mix of stumpwood chips with pine bark (50%, 1:1 ratio) with compost (50%) (Figure 2c,d). For more detailed description of biofilter bed materials, as well as operational parameters of the biofiltration process, please refer to Lelicińska–Serafin et al. [17] and Rolewicz–Kalińska et al. [16].

2.2. Bed Material Sampling

Two series of sampling with an interval of 2–3 weeks were performed for each bed material (CB and CBC) and for each biofilter. In each series, the bed material was collected at three sampling points (Figure 1b):
  • Point 1 was located symmetrically (centrally) in relation to the longer walls of the biofilter, but 0.5 m from the shorter wall of the biofilter;
  • Point 2 was located in the center of the biofilter;
  • Point 3 was located symmetrically (centrally) in relation to the longer walls of the biofilter, but 2.50 m from the shorter wall of the biofilter.
From each sampling point, 250 g of bed material was collected and mixed thoroughly to average the sample. Then 10 g of the bed material was shaken for 30 min in 90 mL of sterile 0.85% NaCl at 120 rpm and the obtained suspension was used for enumeration of culturable bacteria and fungi separately in each sampling point. The final result for each series was calculated as a mean value from three sampling points.

2.3. Gas Sampling

For each bed material (CB and CBC) and for each biofilter, two series of sampling were performed with an interval of 2–3 weeks, each series of sampling was carried out in seven replications. Three types of gas samples (waste gas, treated gas and ambient air) were collected using MAS-100 (Merck) and SAS Super ISO (VWR) impactors following the manufacturers’ instructions. Waste gas samples (gas entering the biofilter) were taken at the inlet to the biofilters. Treated gas samples were taken from three sampling points located directly above the biofilter bed (CB and CBC configurations) (see Section 2.2 and Figure 1b). The samples of treated gases were collected with the application of a shield that eliminated the interfering effects of environmental conditions (flow of ambient air), as described previously [18]. Ambient air samples (the test background) were collected 5 m from the biofilter and 1.5 m above the ground level upwind.

2.4. Quantification of the Number of Microorganisms

Enumeration of culturable bacteria and fungi was performed using standard culture-dependent techniques using tryptone–soya agar (TSA) and rose bengal chloramphenicol agar (RBC) after 48 h and 6 days incubation at 26 °C, respectively. The numbers of microorganisms in bed materials and treated gases in each series were calculated as mean values from three sampling points, and the results are expressed as CFU/g DM (biofilter bed samples) or CFU/m3 (gas samples).
The assessment of total live biomass (both culturable and unculturable microorganisms) in biofilter bed samples was carried out based on ATP determination in Deltatox II portable device (Modern Water, Sand Hutton, York, UK), following the manufacturer’s manual, and calculated from the Equation (1):
cATP = tATP − fATP
where:
  • cATP—intracellular ATP, reflecting total live biomass;
  • tATP—total ATP;
  • fATP—free-available ATP.
The final result for each series was calculated as a mean value from three sampling points. To relate the obtained results of ATP measurements to culture-dependent methods, cATP was converted to microbial equivalents (ME), based on the assumption that 1 cell of Escherichia coli size contains 0.001 pg (1 fg) ATP.

2.5. Determination of Microbial Activity

Determination of respiratory activity in the biofilter bed materials was performed in accordance with ISO 16072 [19] using the LOVIBOND BSB/BOD-Sensors system, following the manufacturer’s manual. Based on the measurement of consumed oxygen, the amount of produced CO2 was calculated, assuming the molar ratio of consumed O2 to produced CO2 as 1:1. The mean microbial respiration activity was determined by the linear regression method (least squares) from the results obtained during the first 72 h and expressed as mg CO2/(kg DM × h). Microbial activity in bed materials in each series was calculated as a mean value from three sampling points, the measurement of consumed oxygen in each sampling point was carried out in three replications.

2.6. Statistical Measures and Methods

Standard statistical comparisons and graphing were made in Microsoft Excel. Results of standard culture-dependent methods are presented in box and whiskers charts. The bottom and top of each box are the first and third quartiles, the band inside the box and the cross marker are the median and the mean, respectively, the whiskers represent the minimum and maximum values of each data set. Results that are numerically distant from the rest of the data (outside of 1.5 times the interquartile range above the third quartile and below the first quartile) are presented as outliers. As the outliers had a large impact on the mean values, the results of the different stages of the experiment (biofilter configurations) are compared based of the median values. Relationships between the quantified microbial populations and between these populations and microbial respiration activity were tested using correlation analyses with Pearson’s product moment correlation coefficient and Spearman’s rank correlation coefficient.

3. Results

The effects of two types of bed materials on bioaerosol emission from biofilters were estimated on the basis of microbial abundance in gases and beds. Microbial activity was measured as the respiratory activity of the bed materials.

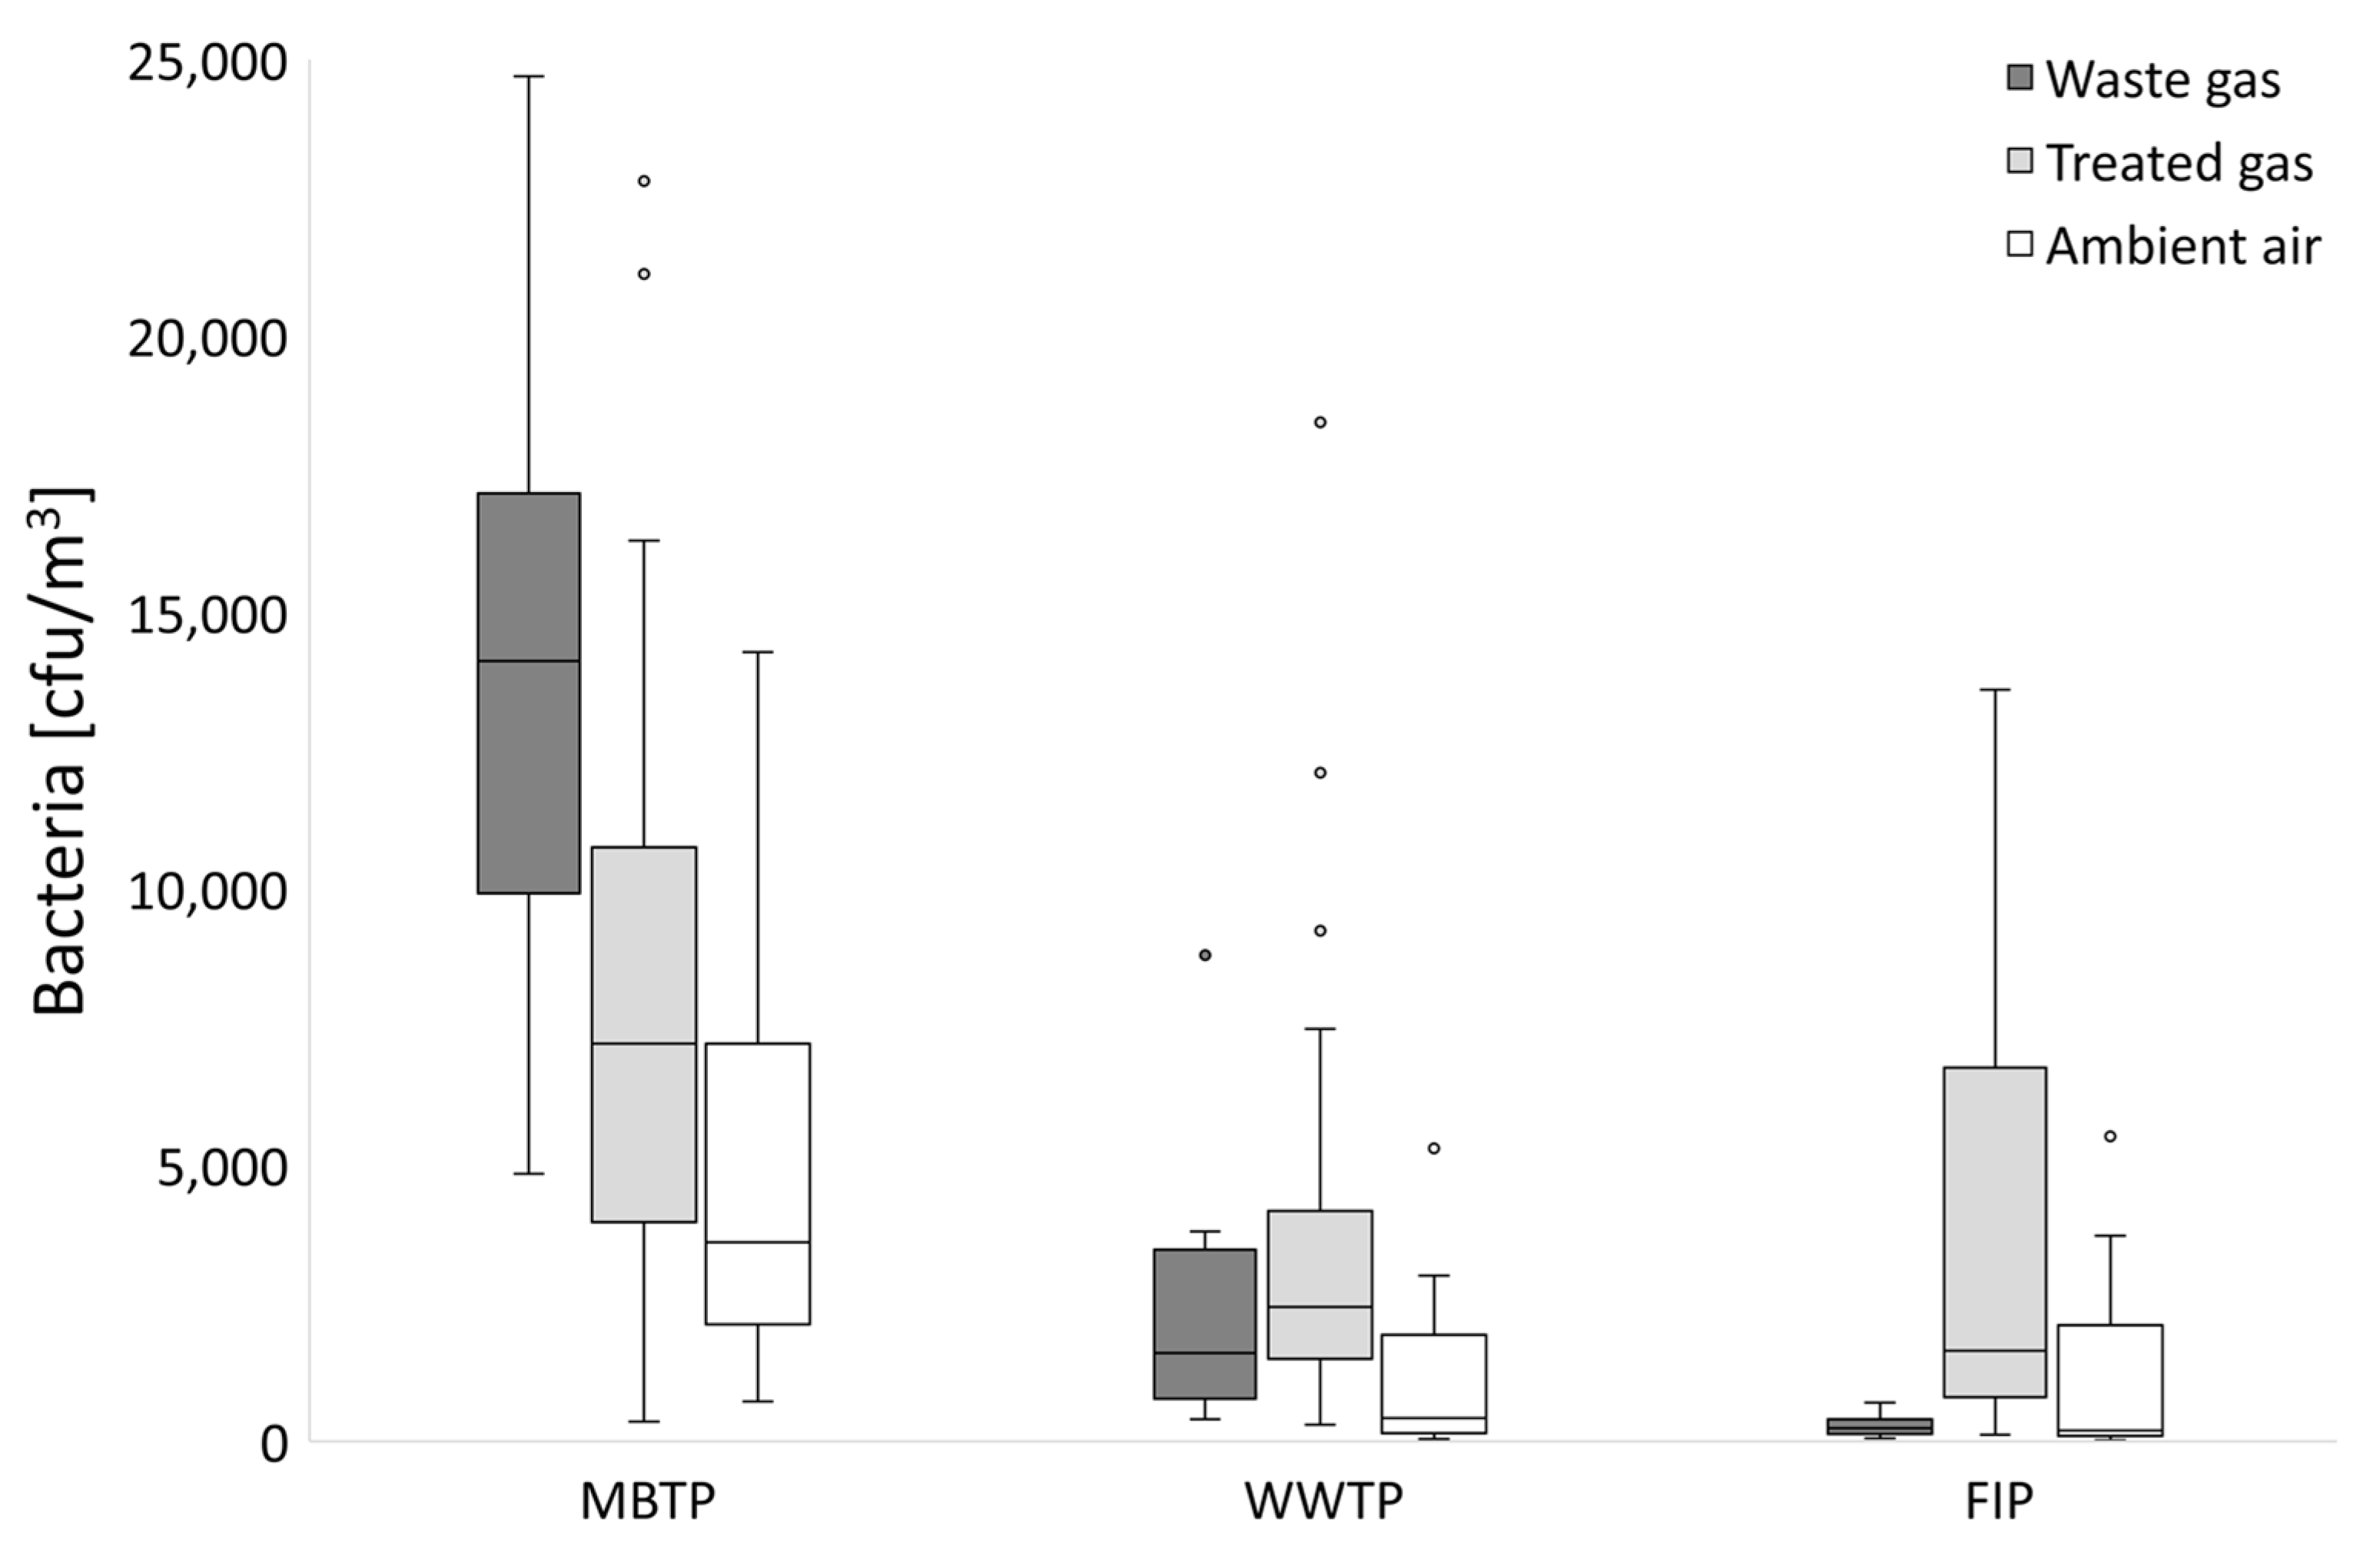
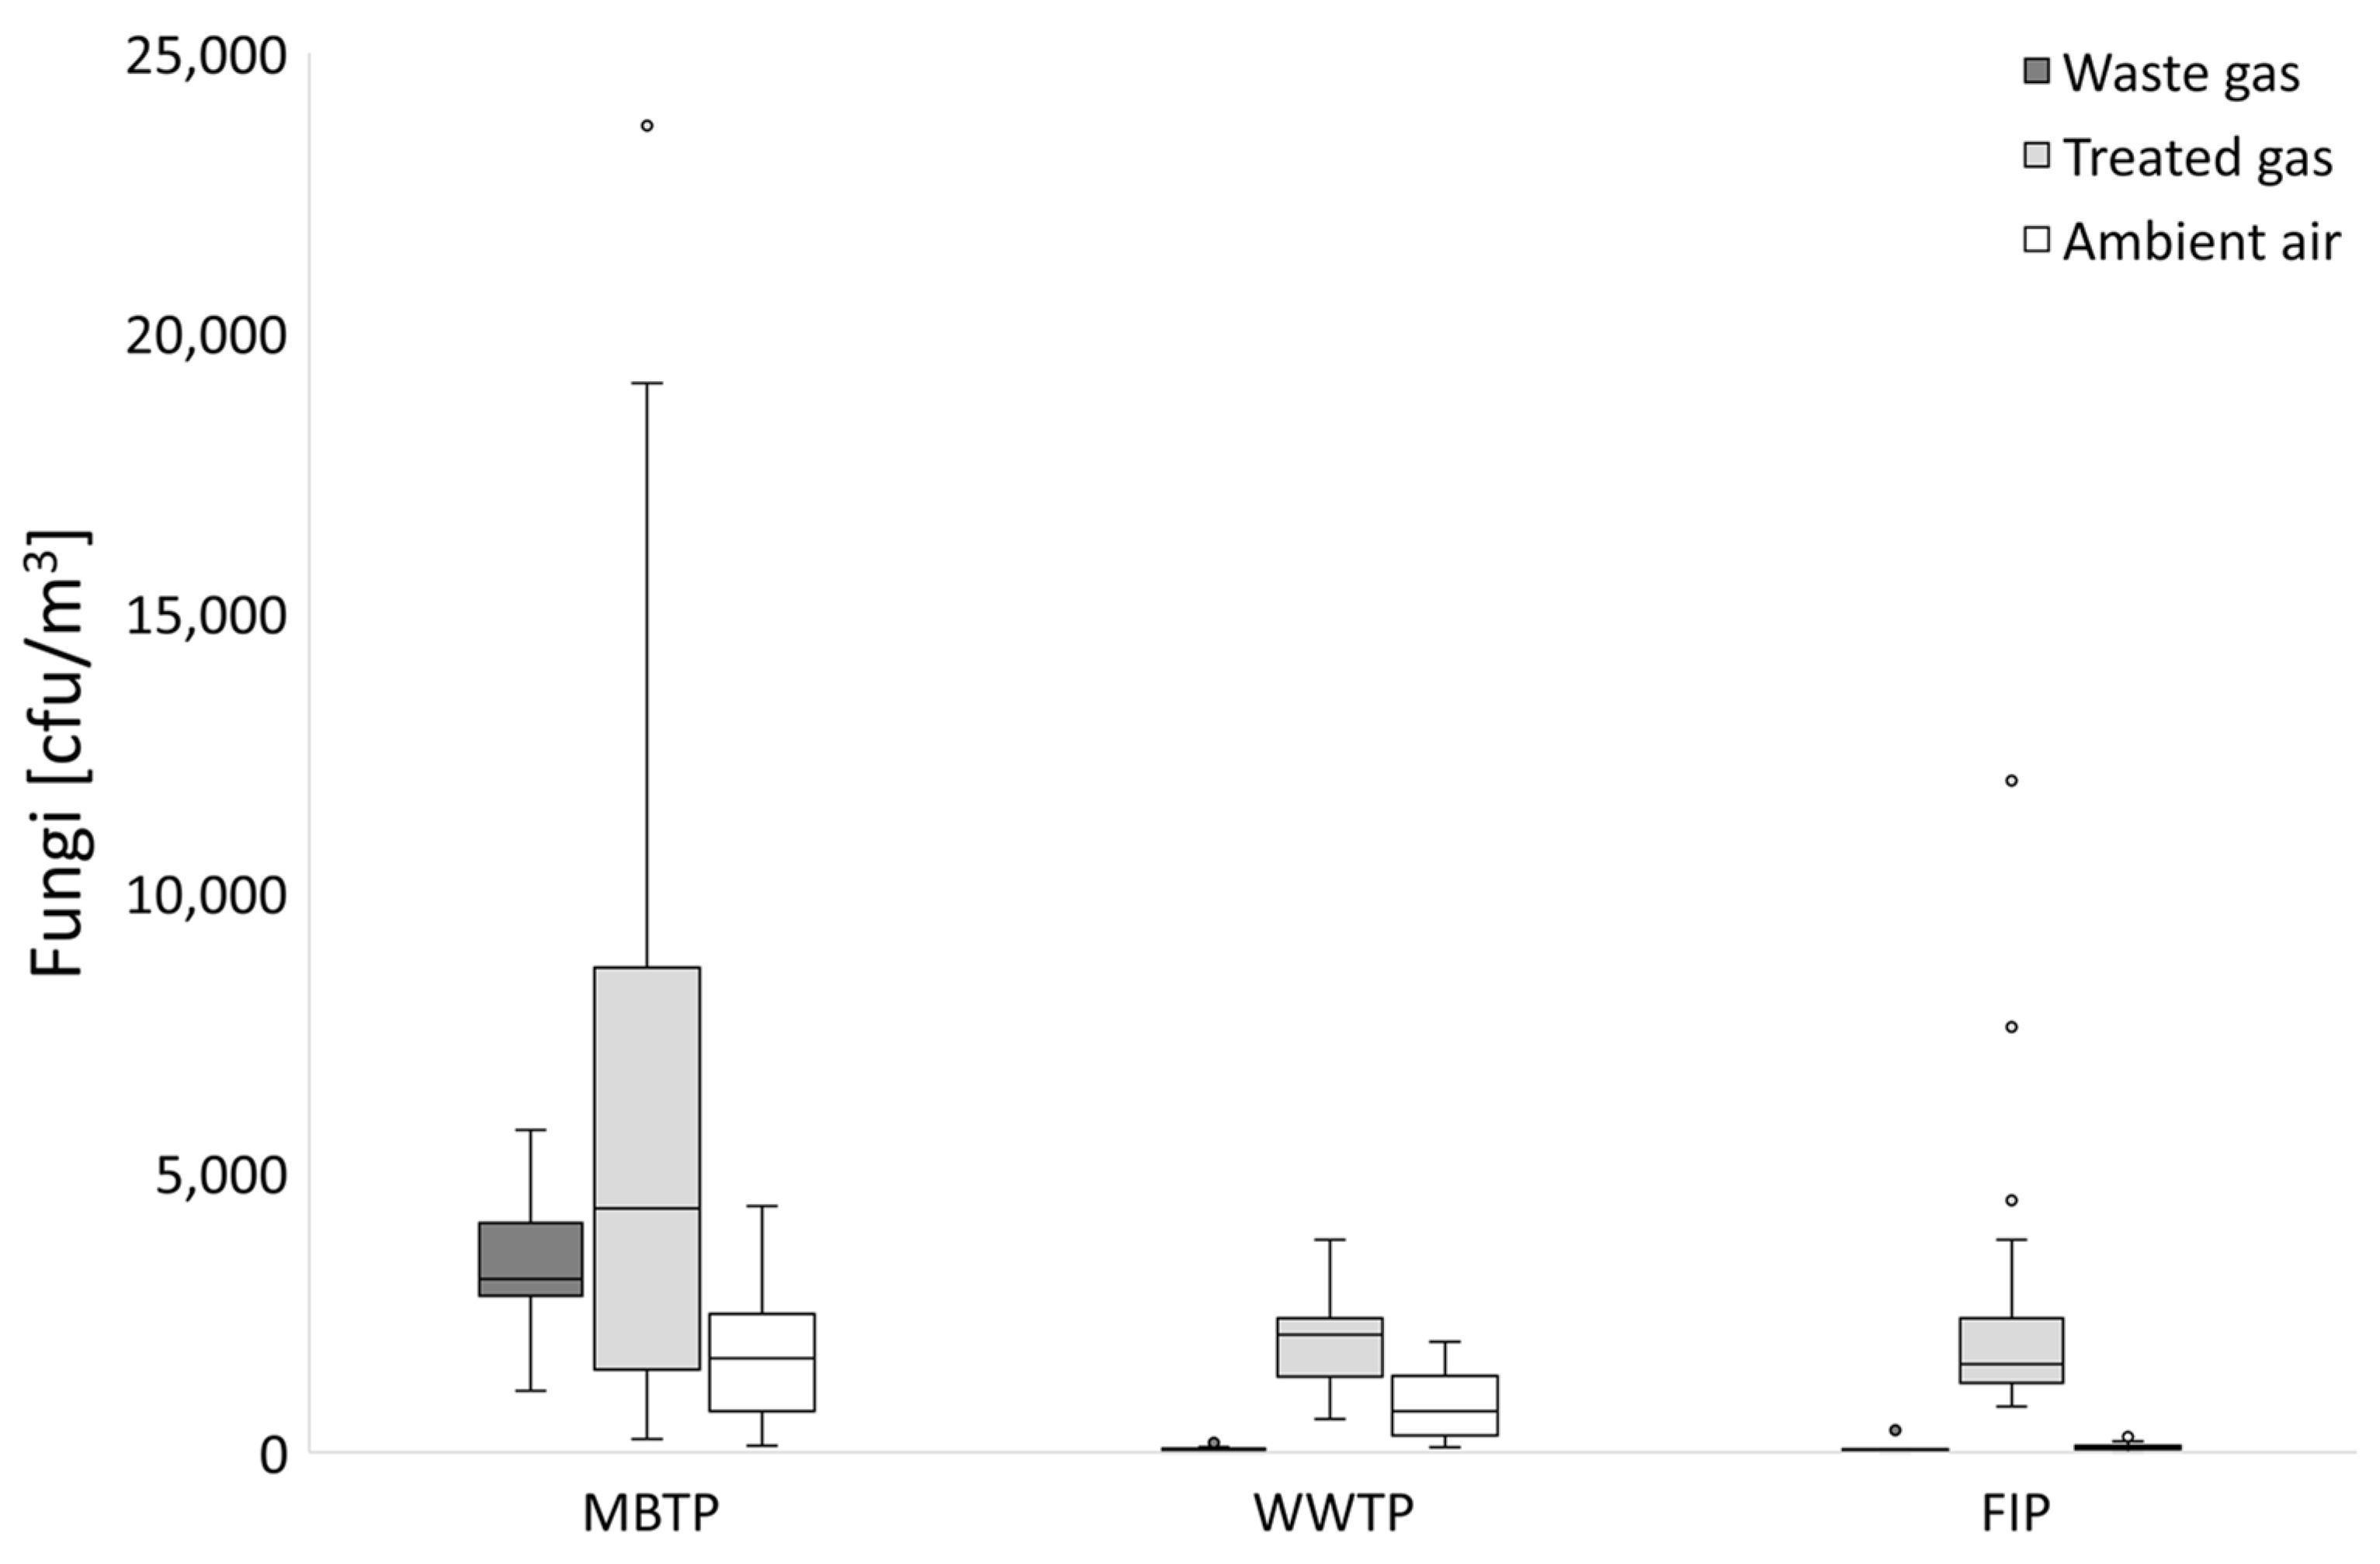
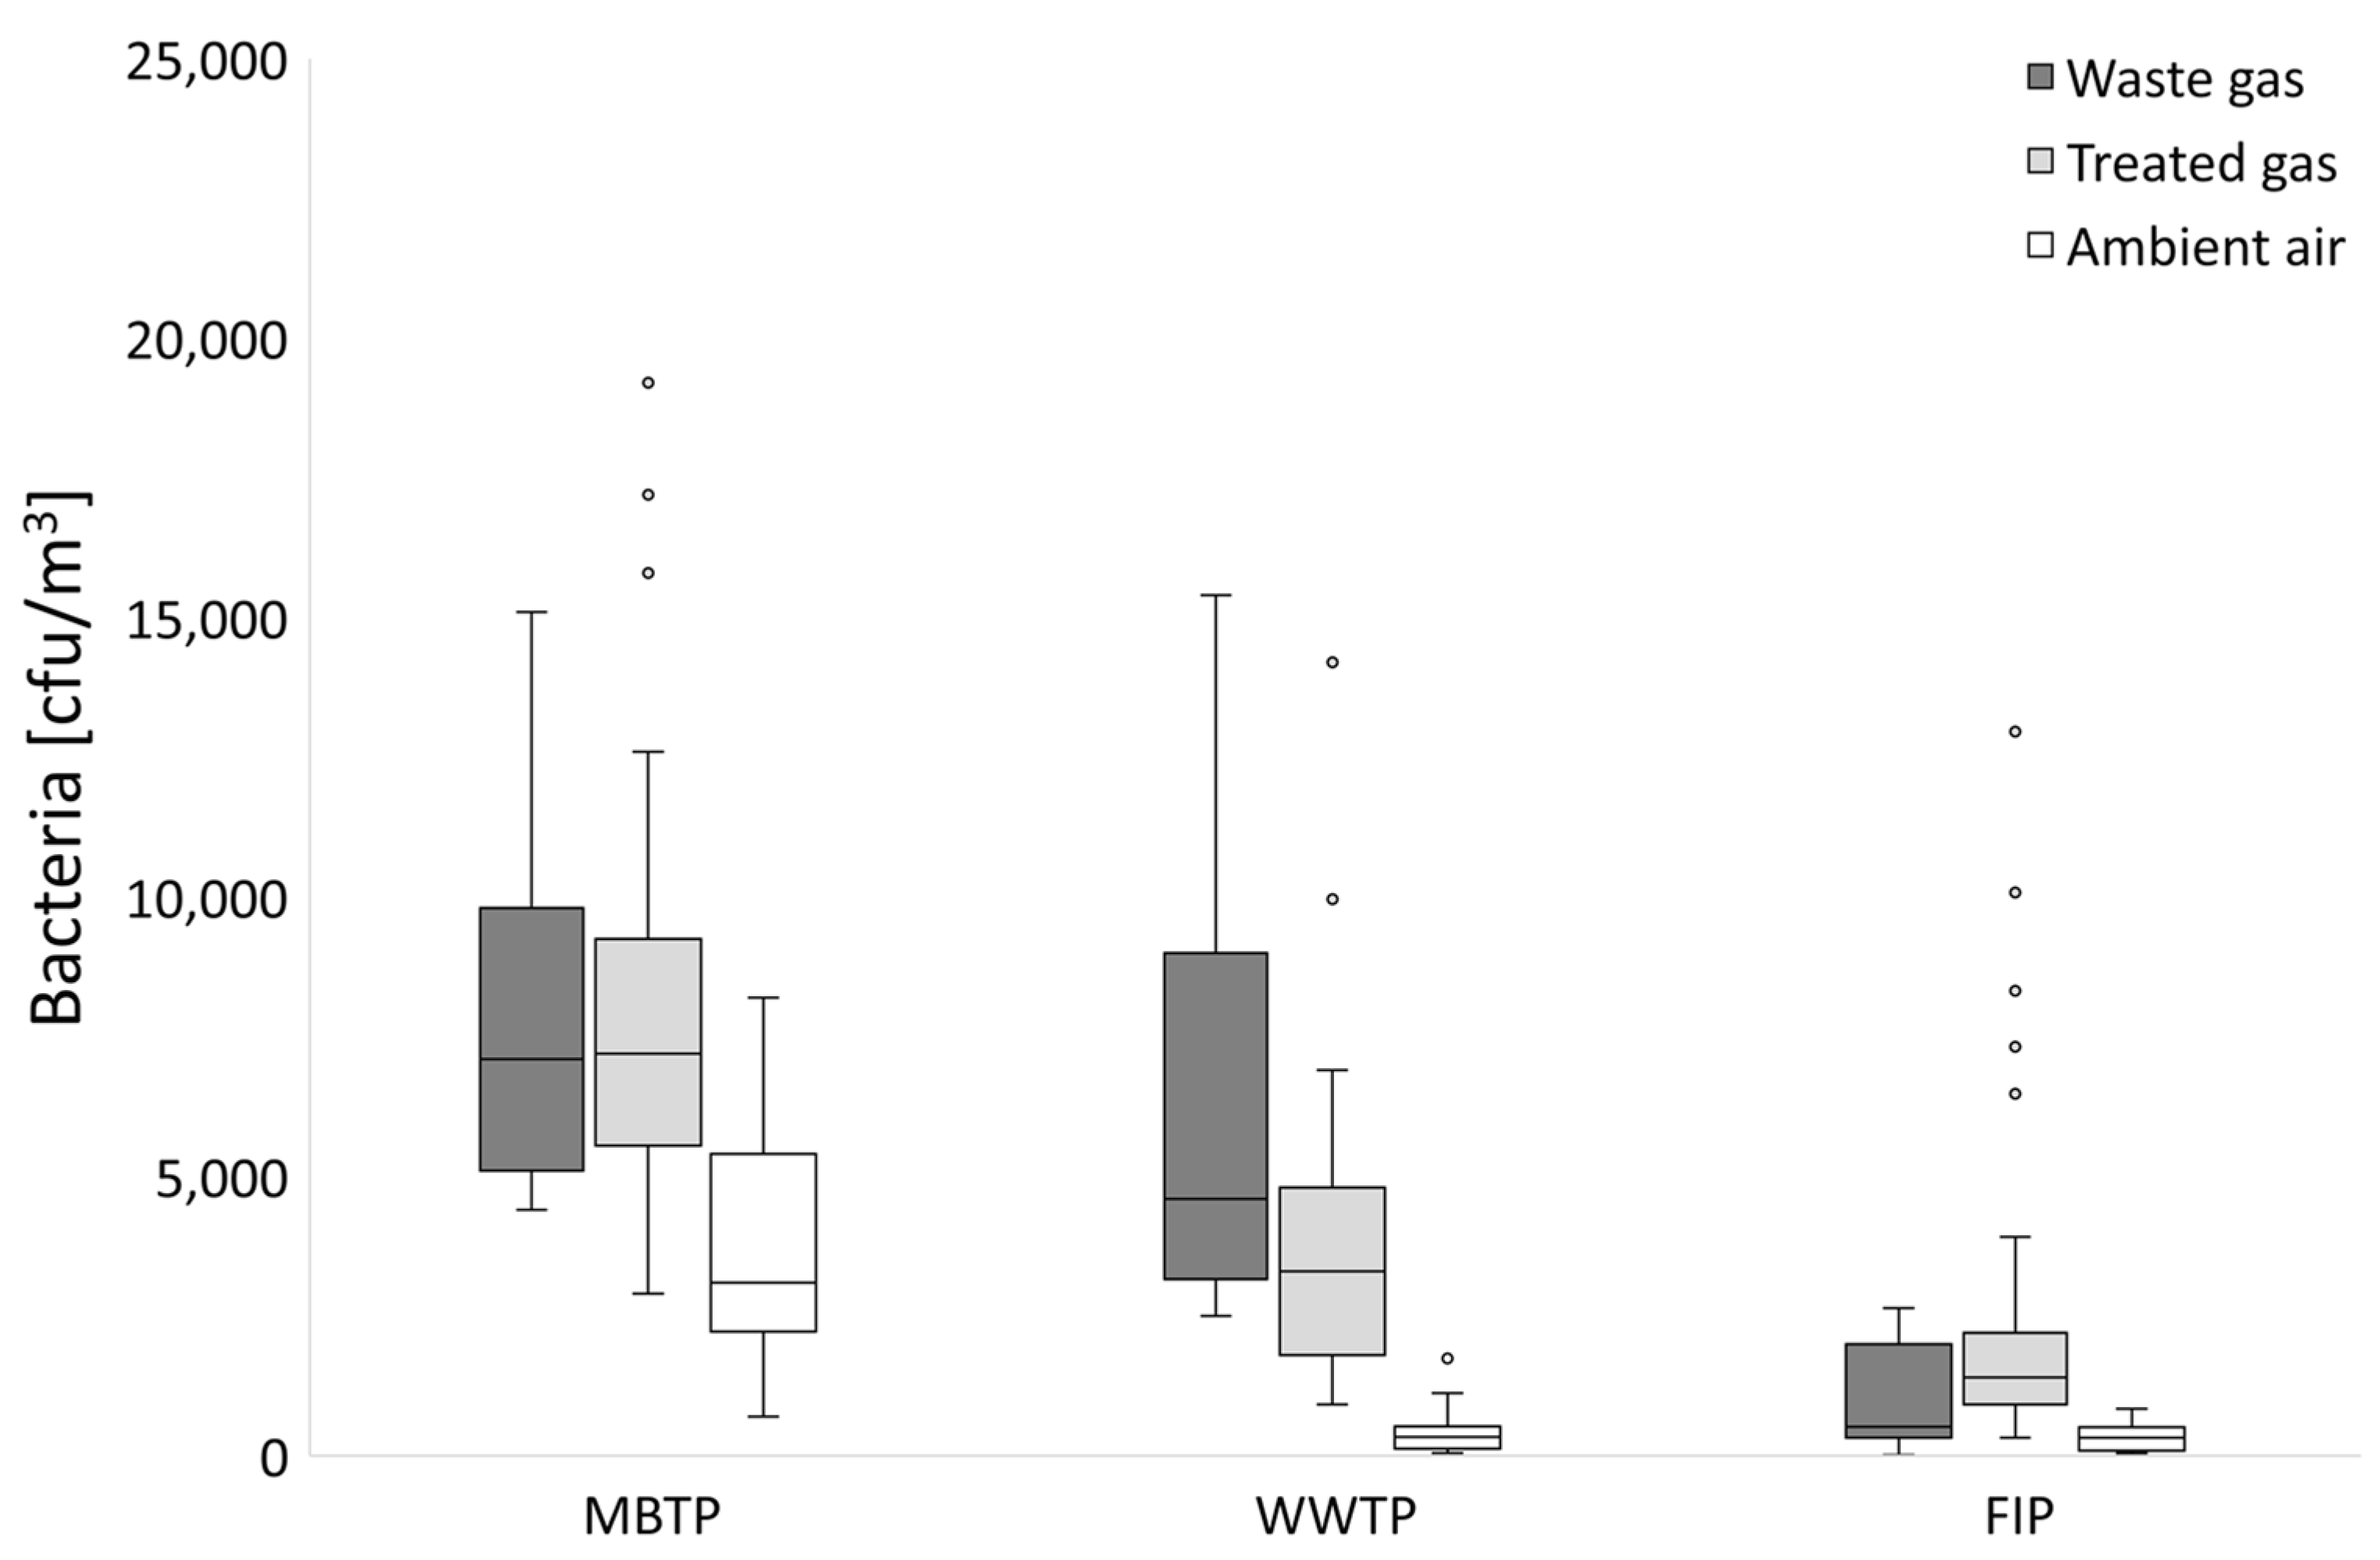
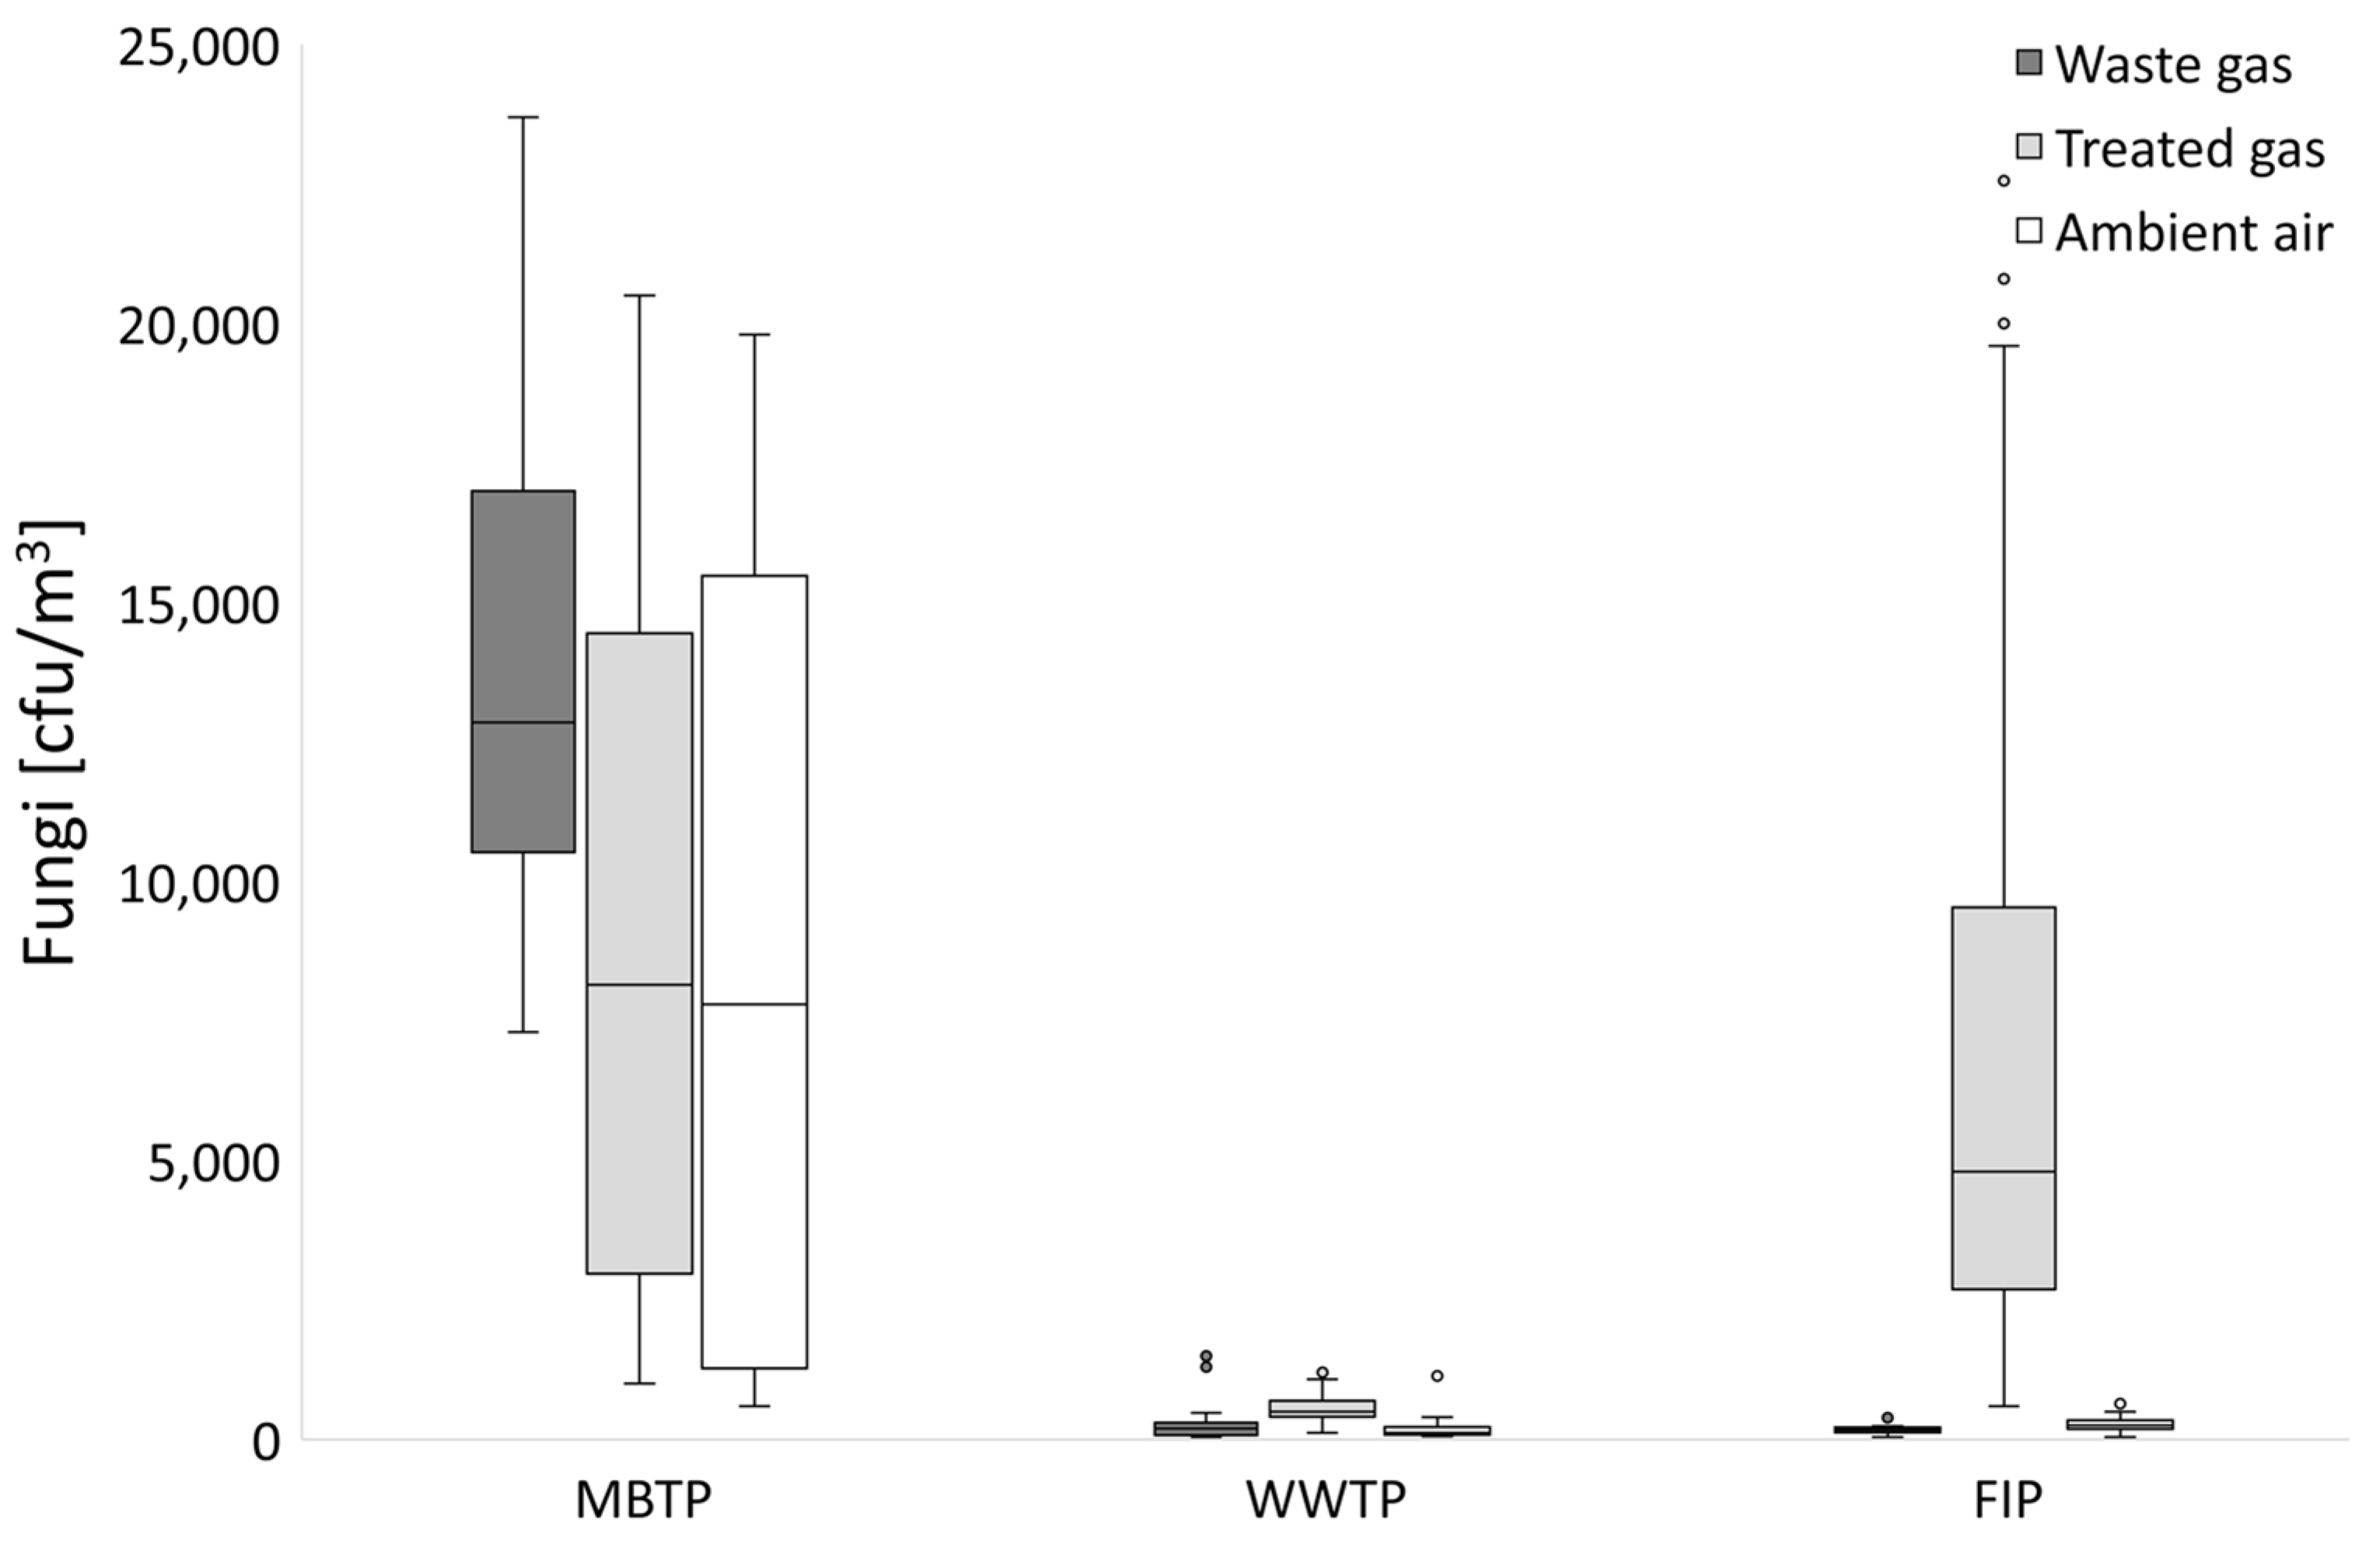
3.1. Microbial Abundance in Gases

3.1.1. CB Beds

The analysis of the number of bacteria in the waste and treated gases showed that CB bed in the MBTP biofilter effectively eliminated these microorganisms from the treated gases (the median number of bacteria was twice lower than in the inlet gases) (Figure 3). However, CB bed caused a small bacterial emission from the WWTP biofilter and contributed substantially to the emission from the FIP biofilter (the median number of bacteria in gases treated by these biofilters increased from 1600 cfu/m3 to 2430 cfu/m3 and from 240 cfu/m3 to 1640 cfu/m3, respectively). For all analyzed biofilters the numbers of bacteria in treated gases were higher than in ambient air.
CB beds turned out to be emitters of fungi from each biofilter, regardless of the type of treated waste gases (Figure 4). Some results for the MBTP biofilter suggest the possibility of fungal retention in the bed in some cases of two series of sampling; however, the median number of fungi in the treated gases (4360 cfu/m3) is higher than in the waste gases (3100 cfu/m3). Higher variability of the fungal number was also observed.

3.1.2. CBC Beds

Despite the highest median number of bacteria in waste gases at MBTP (7100 cfu/m3), neither elimination nor increased emission of these microorganisms from CBC bed was observed (Figure 5). On the other hand, the same bed material used in the biofilter at WWTP reduced the median number of bacteria in treated gases from 4600 cfu/m3 to 3300 cfu/m3. On the contrary, the CBC bed at FIP to some extent emitted bacteria, but it should be emphasized that the content of these microbes in the waste gases at this plant was the lowest (520 cfu/m3).
Contrary to CB bed when median number of fungal colony forming units was much lower (median equaled 3100 cfu/m3 in case of CB and 12,850 cfu/m3 in case of CBC), CBC bed worked at MBTP as a filter retaining fungi (Figure 6). The median number of fungi lowered from 12,850 cfu/m3 to 8150 cfu/m3. However, CBC beds worked as emitter in case of WWTP and, to a greater extent, at FIP, where contents of fungi was much lower in waste gases (200 cfu/m3 and 174 cfu/m3, respectively).

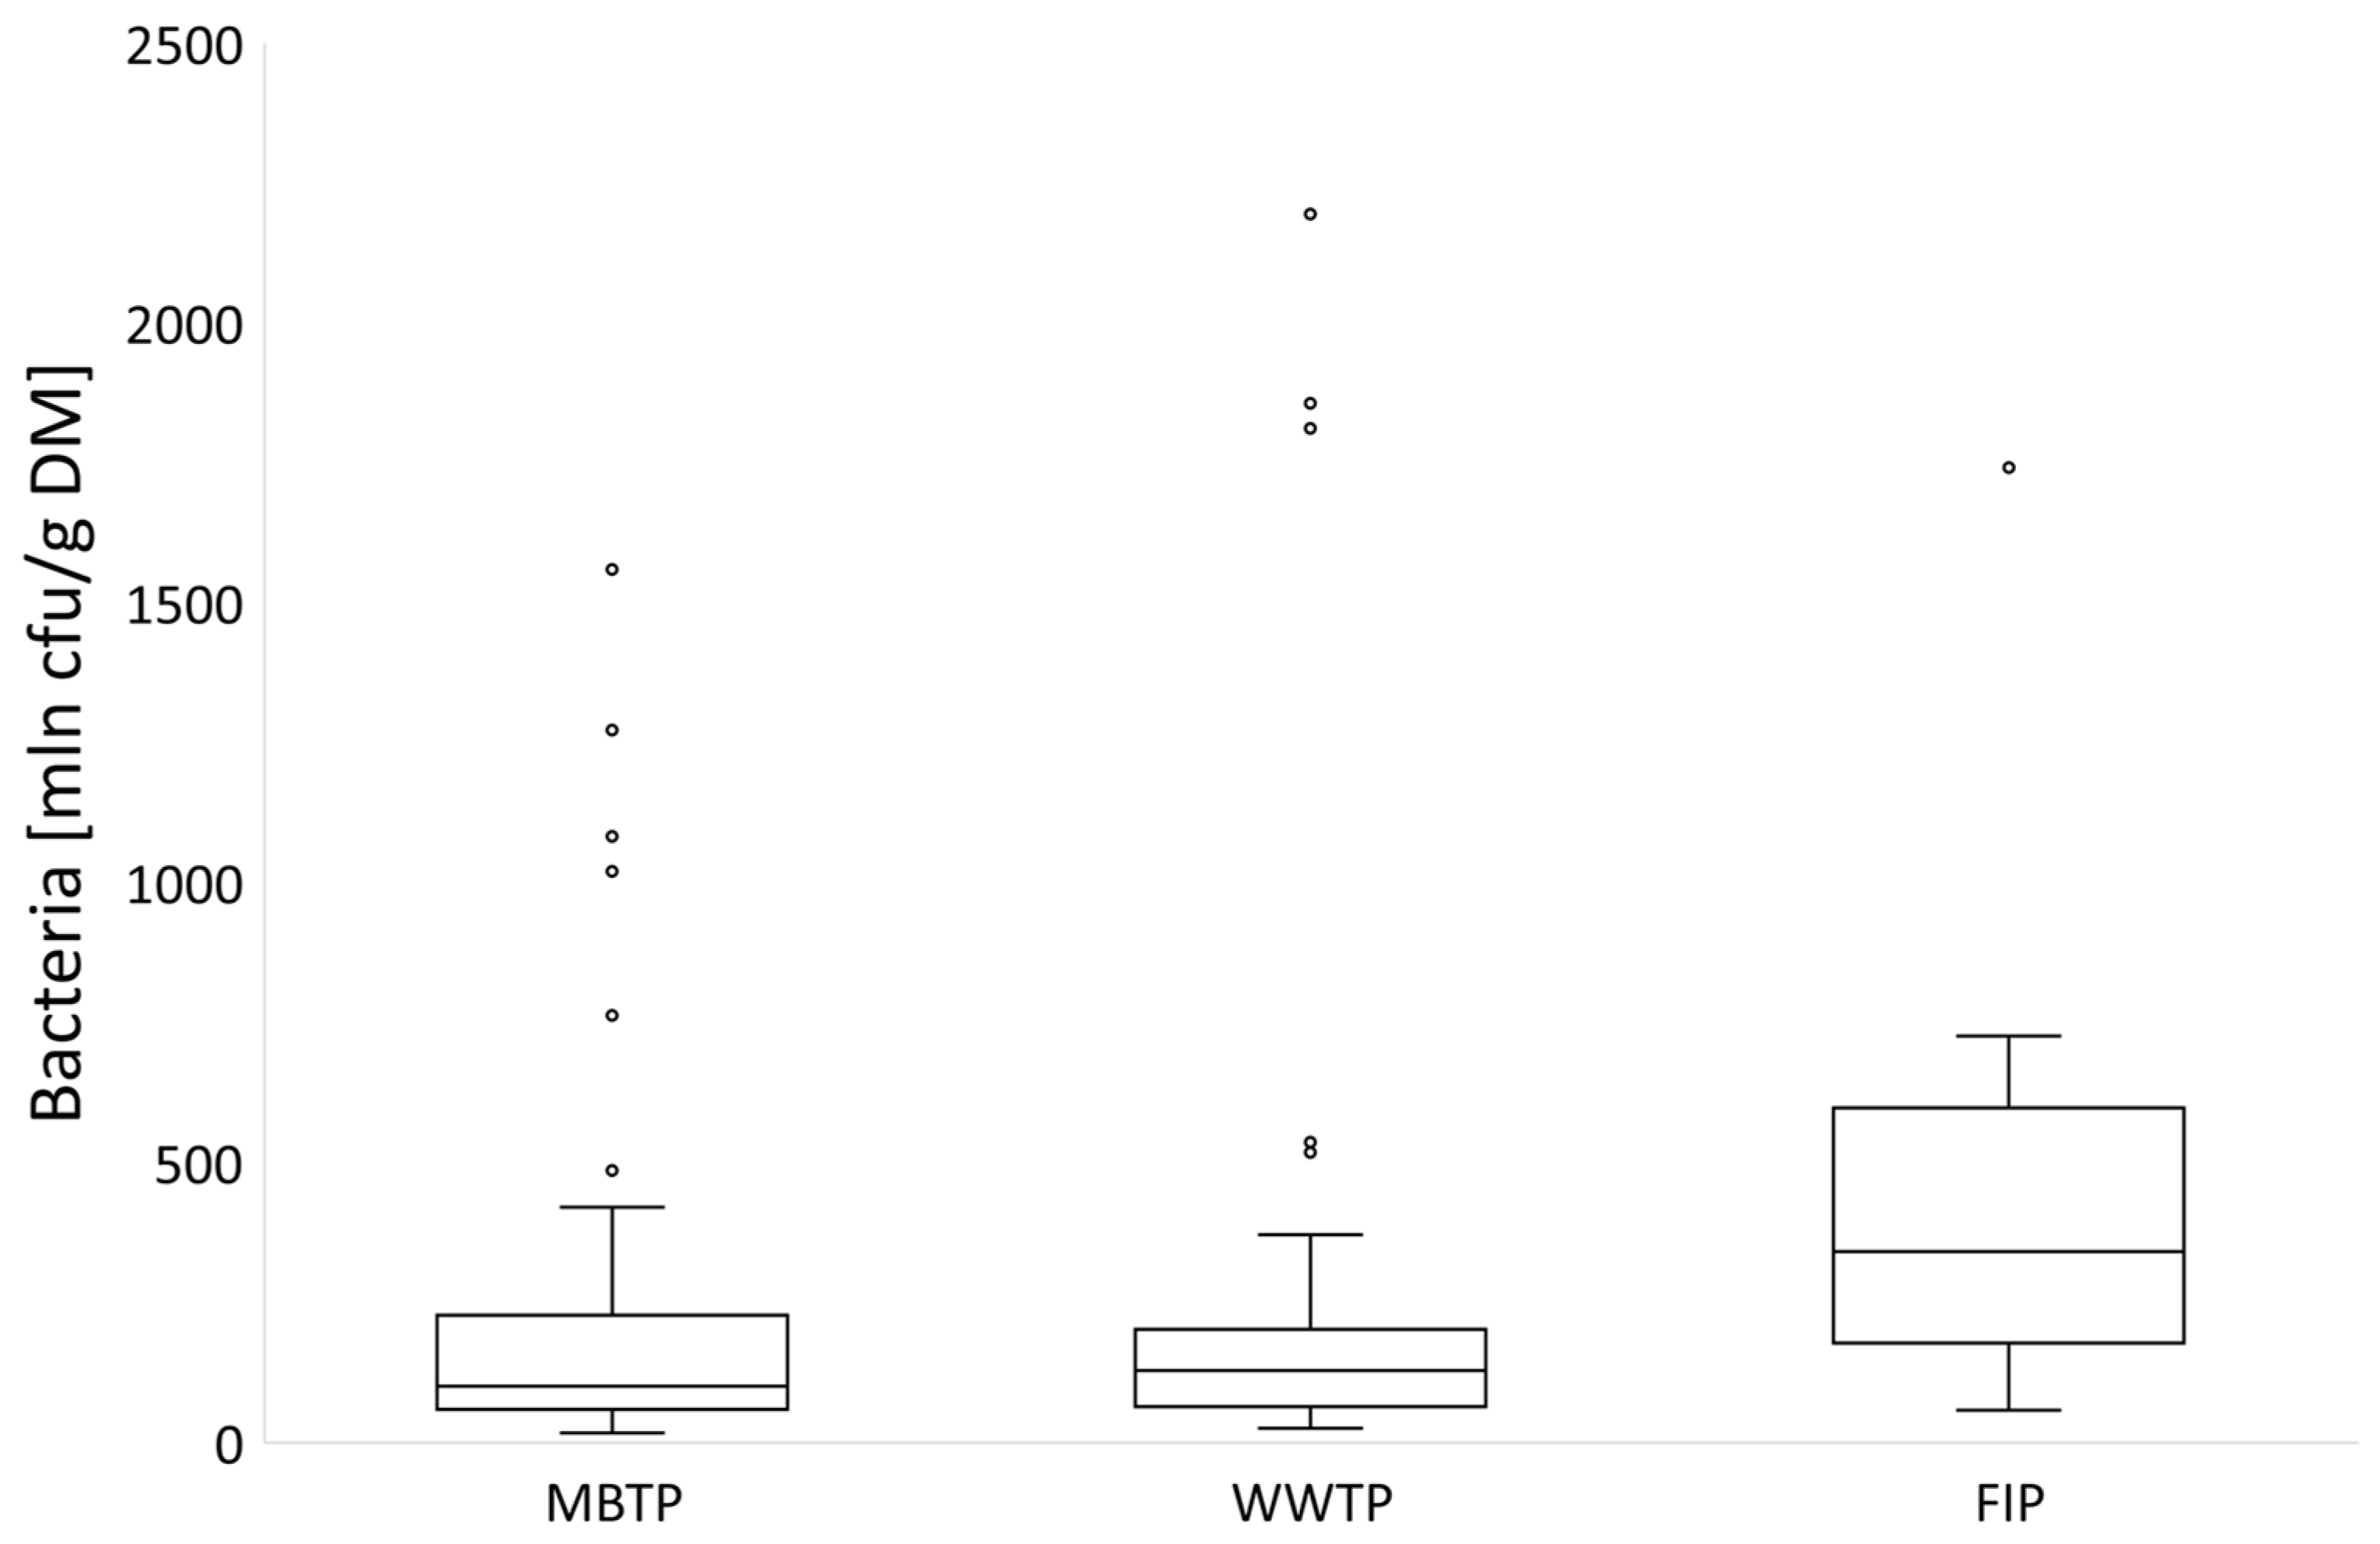
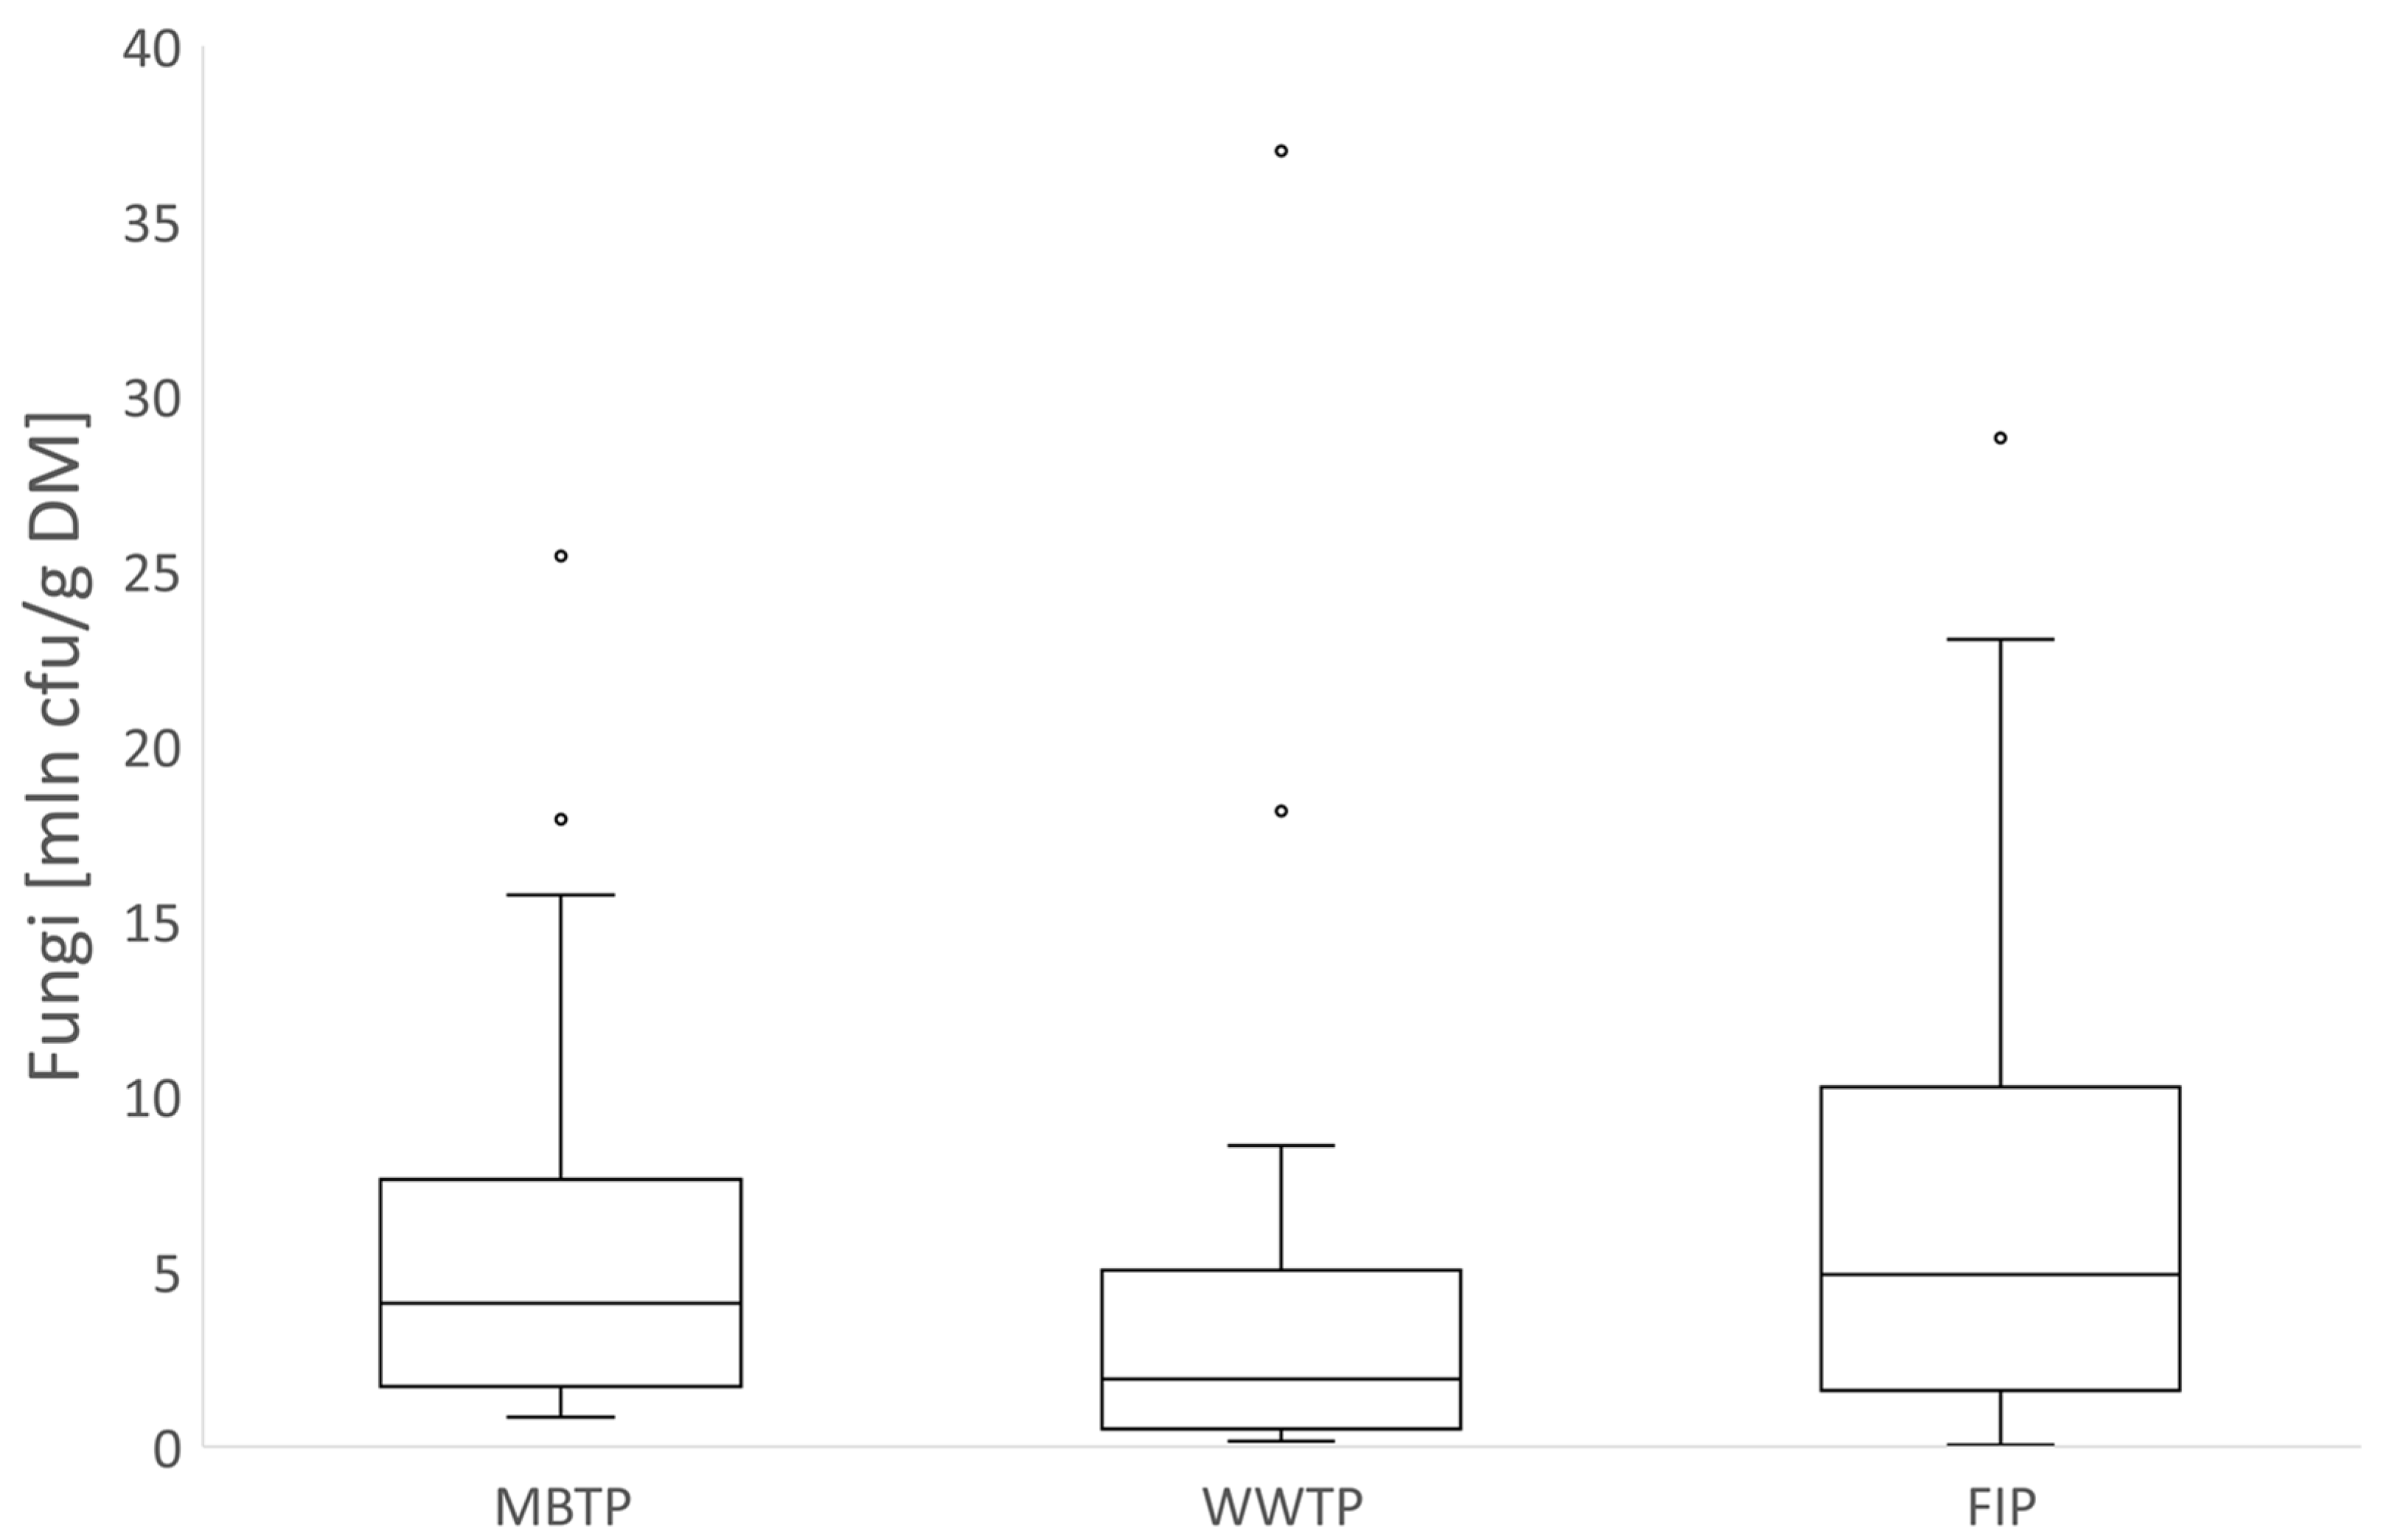
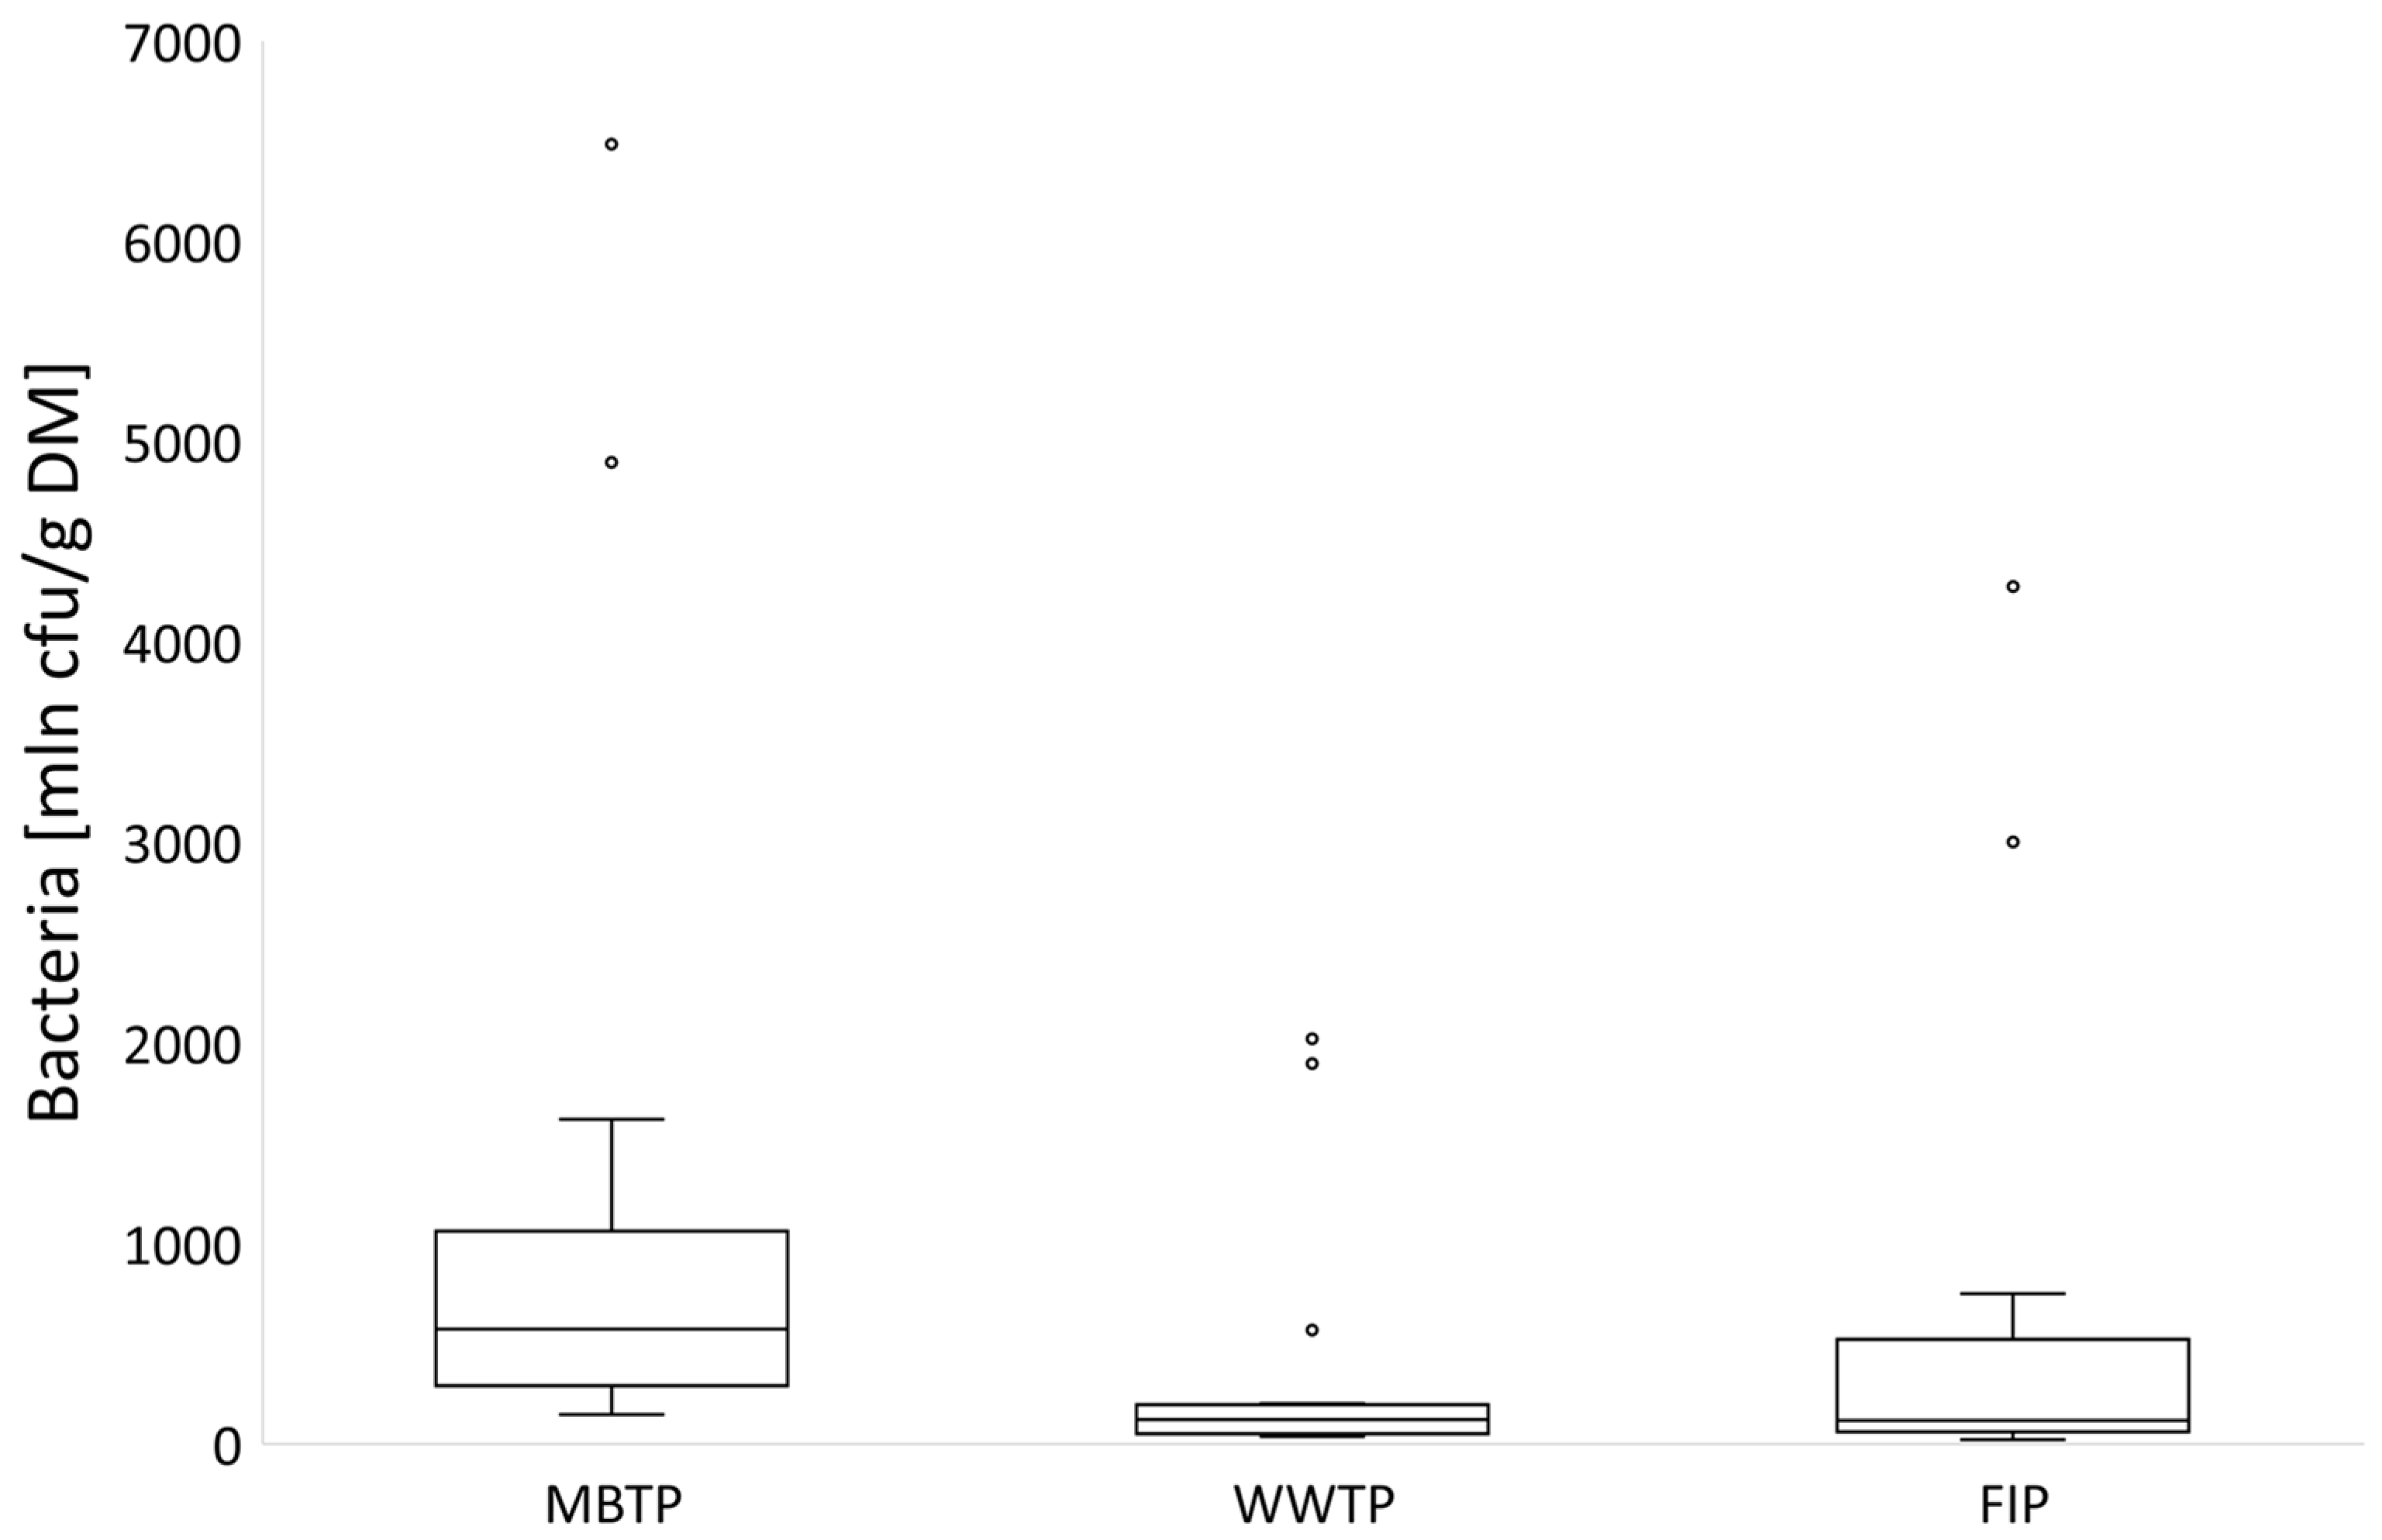
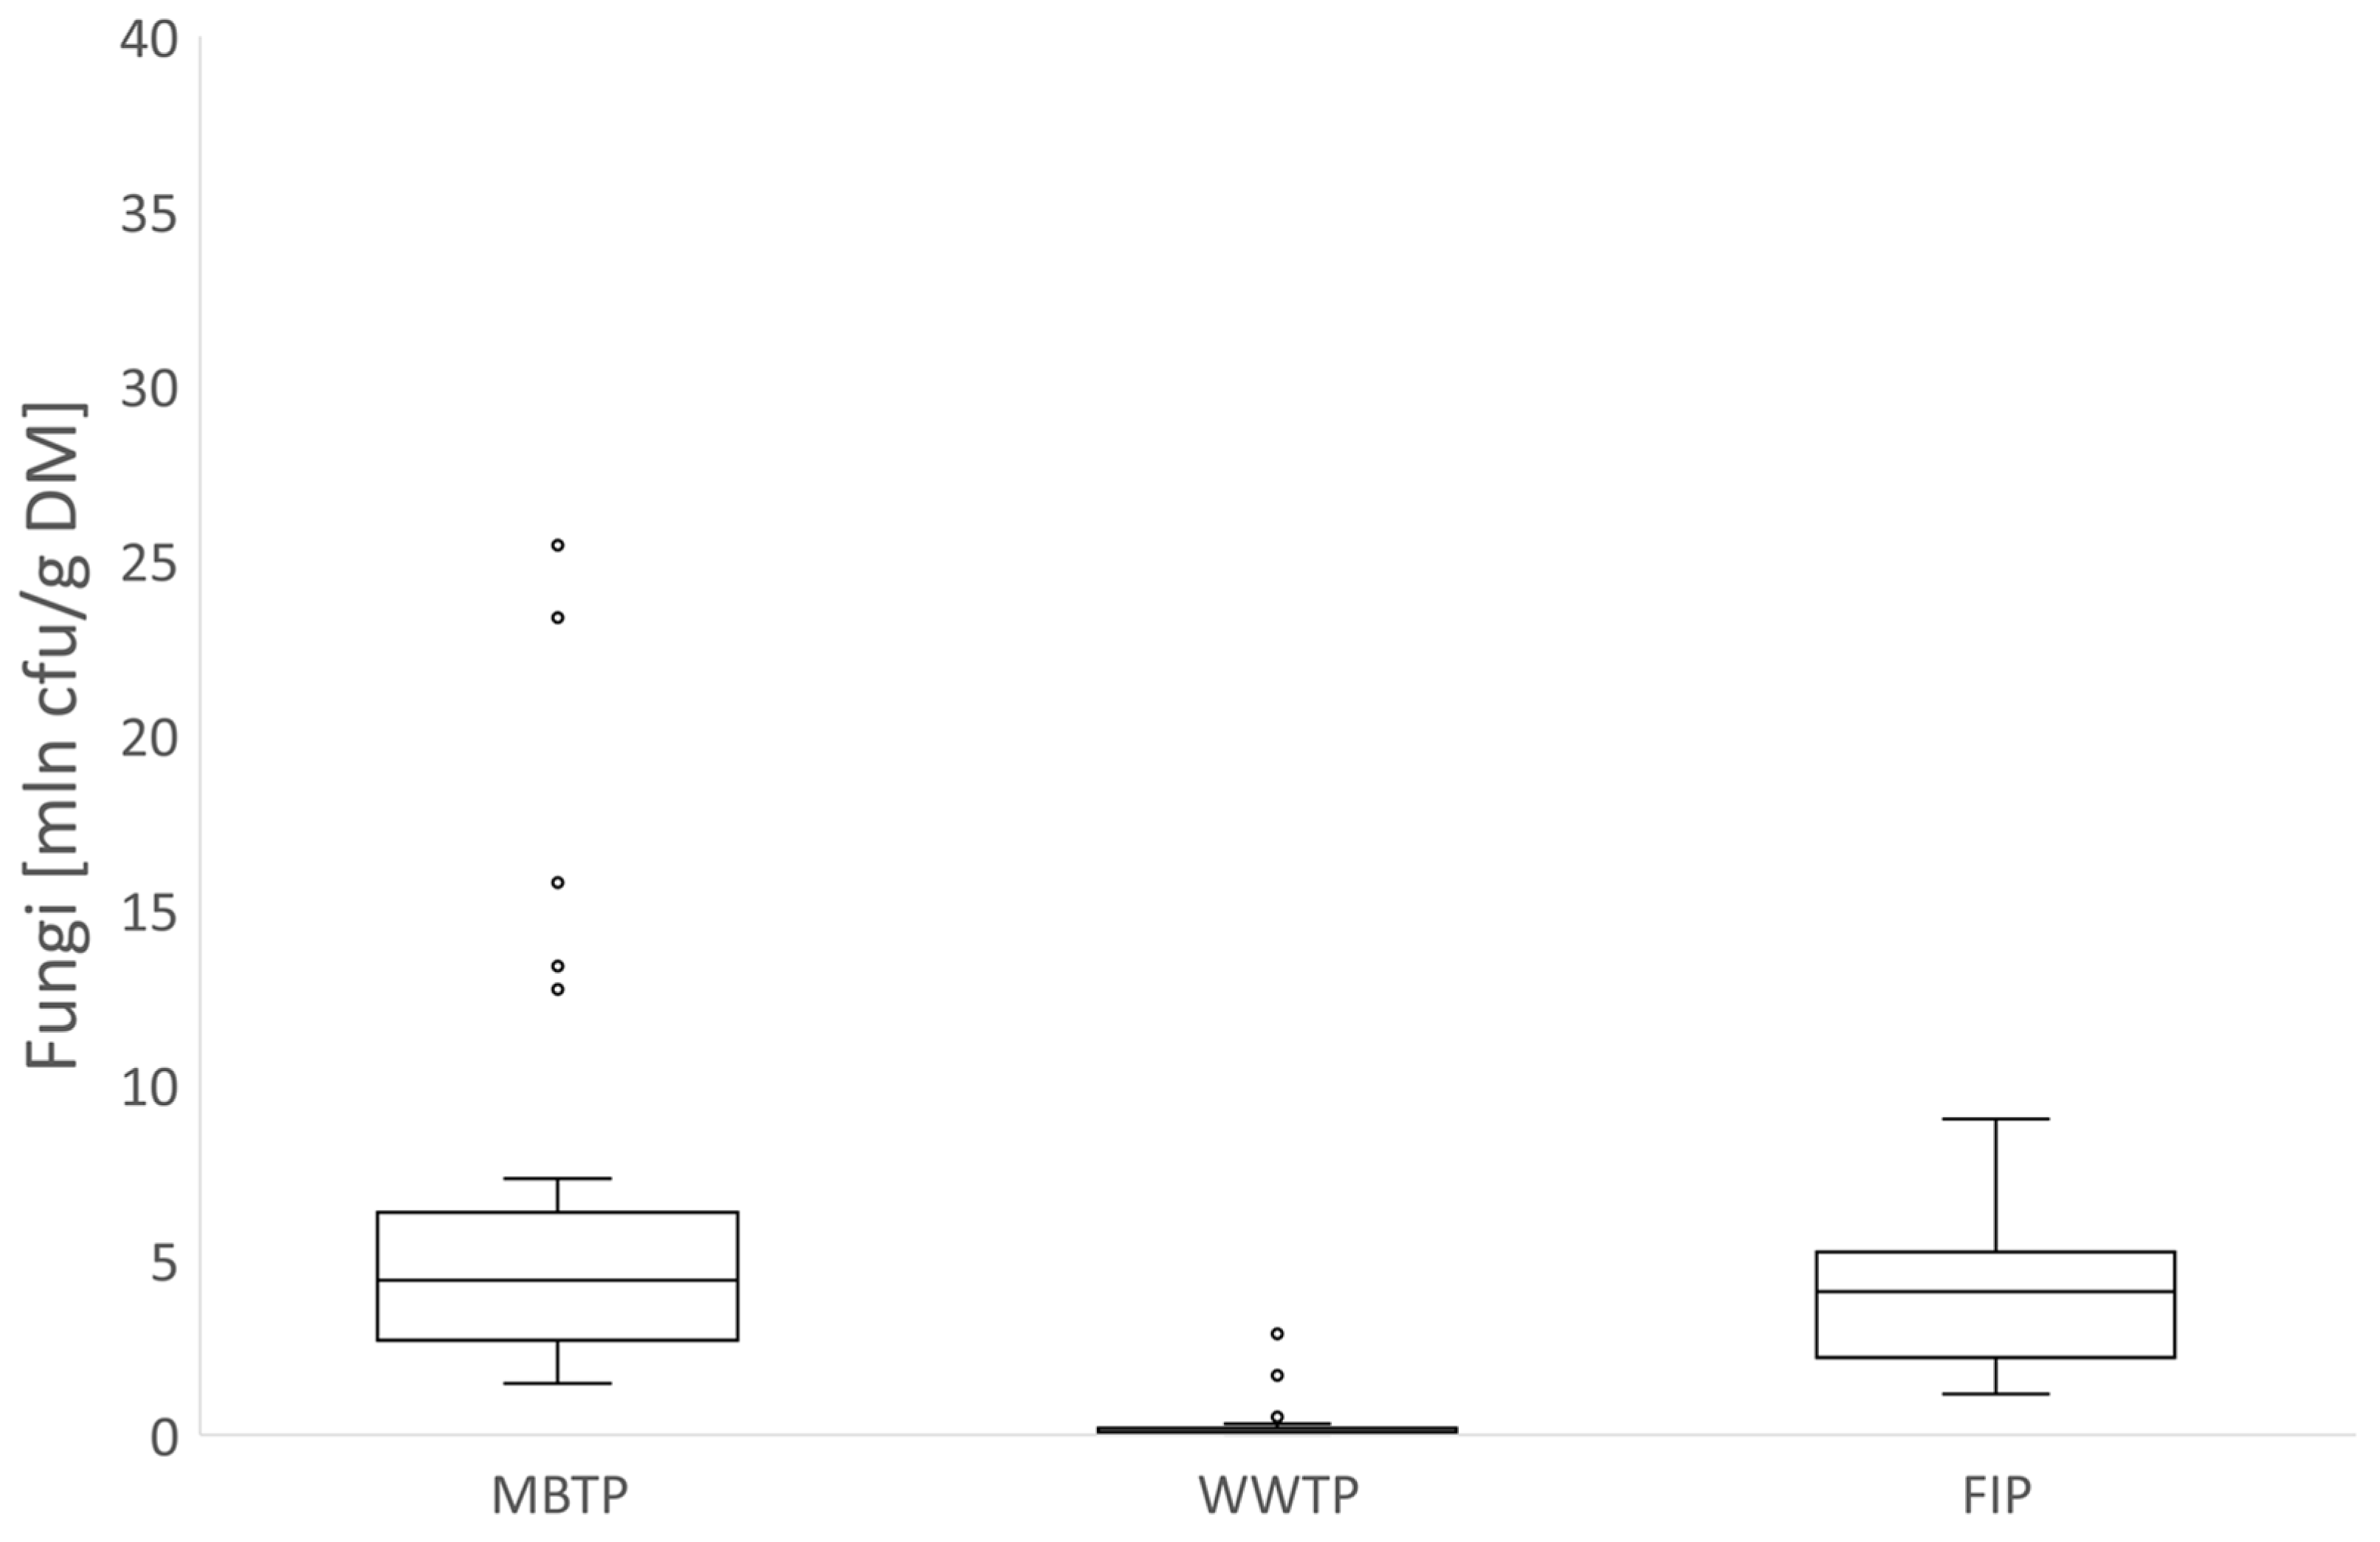
3.2. Microbial Abundance in Biofilters’ Bed Materials

3.2.1. CB Beds

Analysis of the microbial abundance in the bed materials of the biofilters revealed a comparable growth of bacteria in the CB beds at MBTP and WWTP (median number of bacteria 101 and 129 million cfu/g DM, respectively) (Figure 7). Considerably higher numbers of culturable bacteria were detected in the CB bed at FIP (341 million cfu/g DM), which probably contributed subsequently to the higher bacterial emission from the biofilter bed (see Section 3.1.1). Figure 7 also displays the greater dispersion of the data for the FIP biofilter compared to the two other plants, which reveals higher variability of the bacterial number in this biofilter.
A comparable development of fungi (Figure 8) was observed in the CB beds of the biofilters at MBTP and FIP (medians were 4.1 and 4.9 million cfu/g DM, respectively) with slightly lower fungal numbers in the biofilter bed at WWTP (1.9 million cfu/g DM). However, the variability of the fungal number both in time and in sampling points at FIP was higher than in two other plants.

3.2.2. CBC Beds

Higher numbers of culturable bacteria were detected in the CBC bed at MBTP (median was 574 million cfu/g DM) than at WWTP and FIP (medians were 122 and 118 million cfu/g DM, respectively) (Figure 9).
Similarly to CB beds, comparable fungal development was observed in CBC beds at MBTP and FIP (medians 4.4 and 4.1 million cfu/g DM, respectively), with slightly lower growth of fungi in the biofilter bed at WWTP (0.1 million cfu/g DM) (Figure 10).

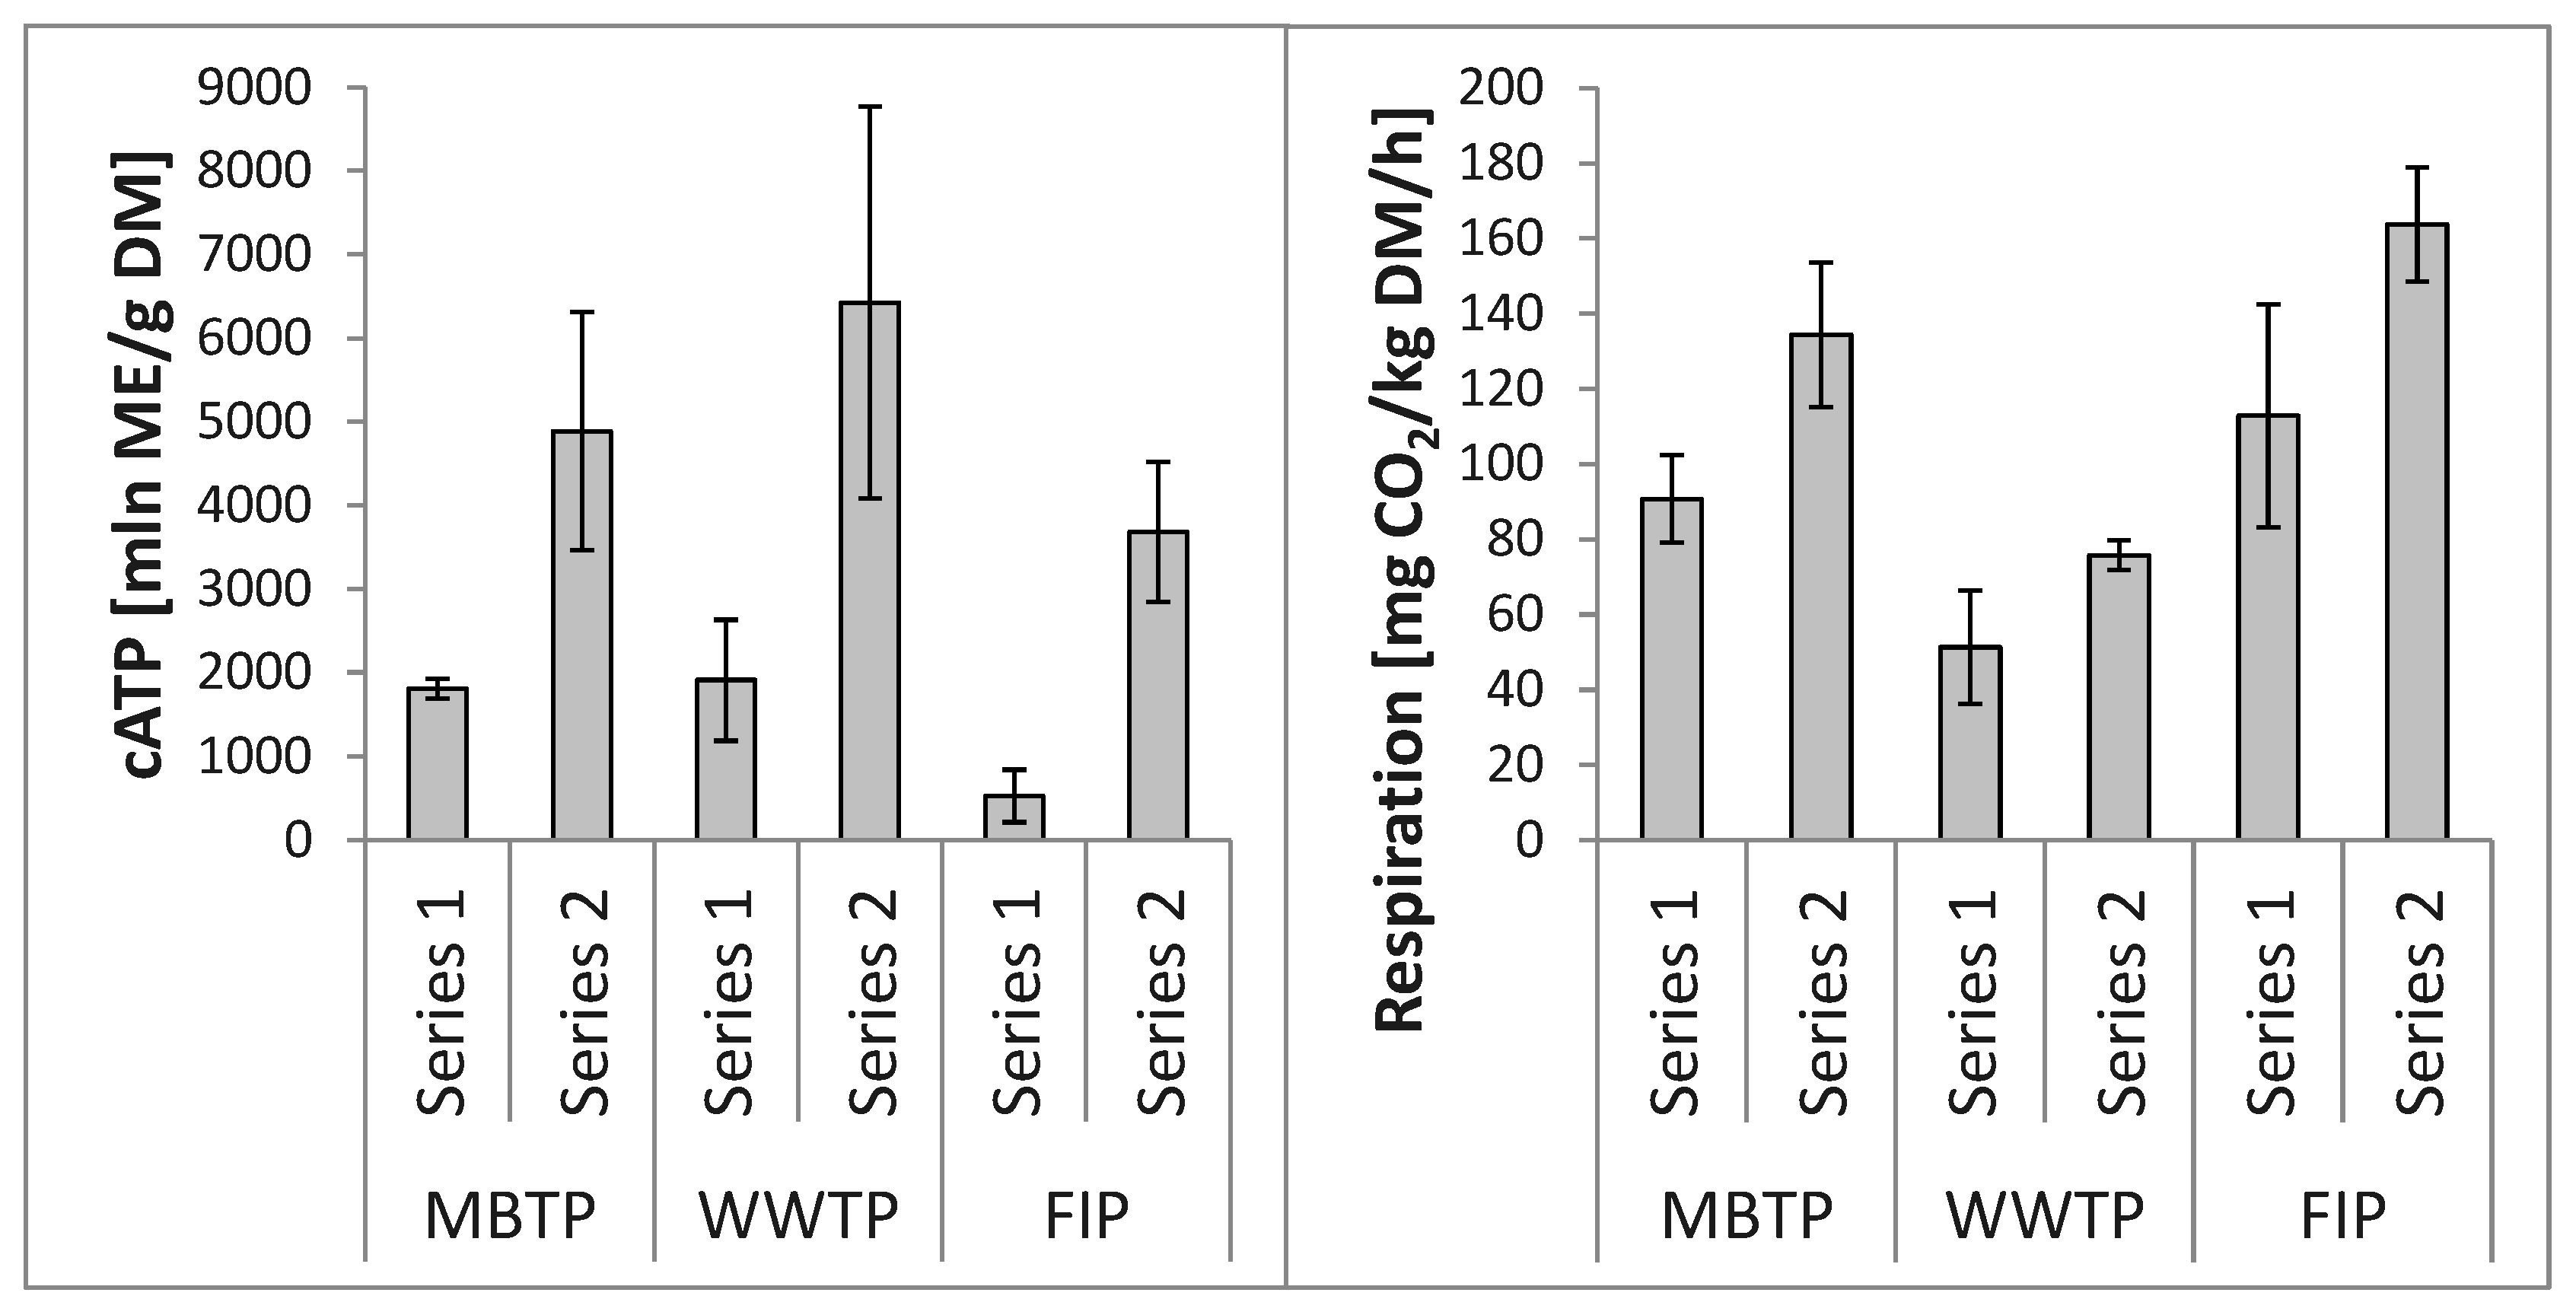
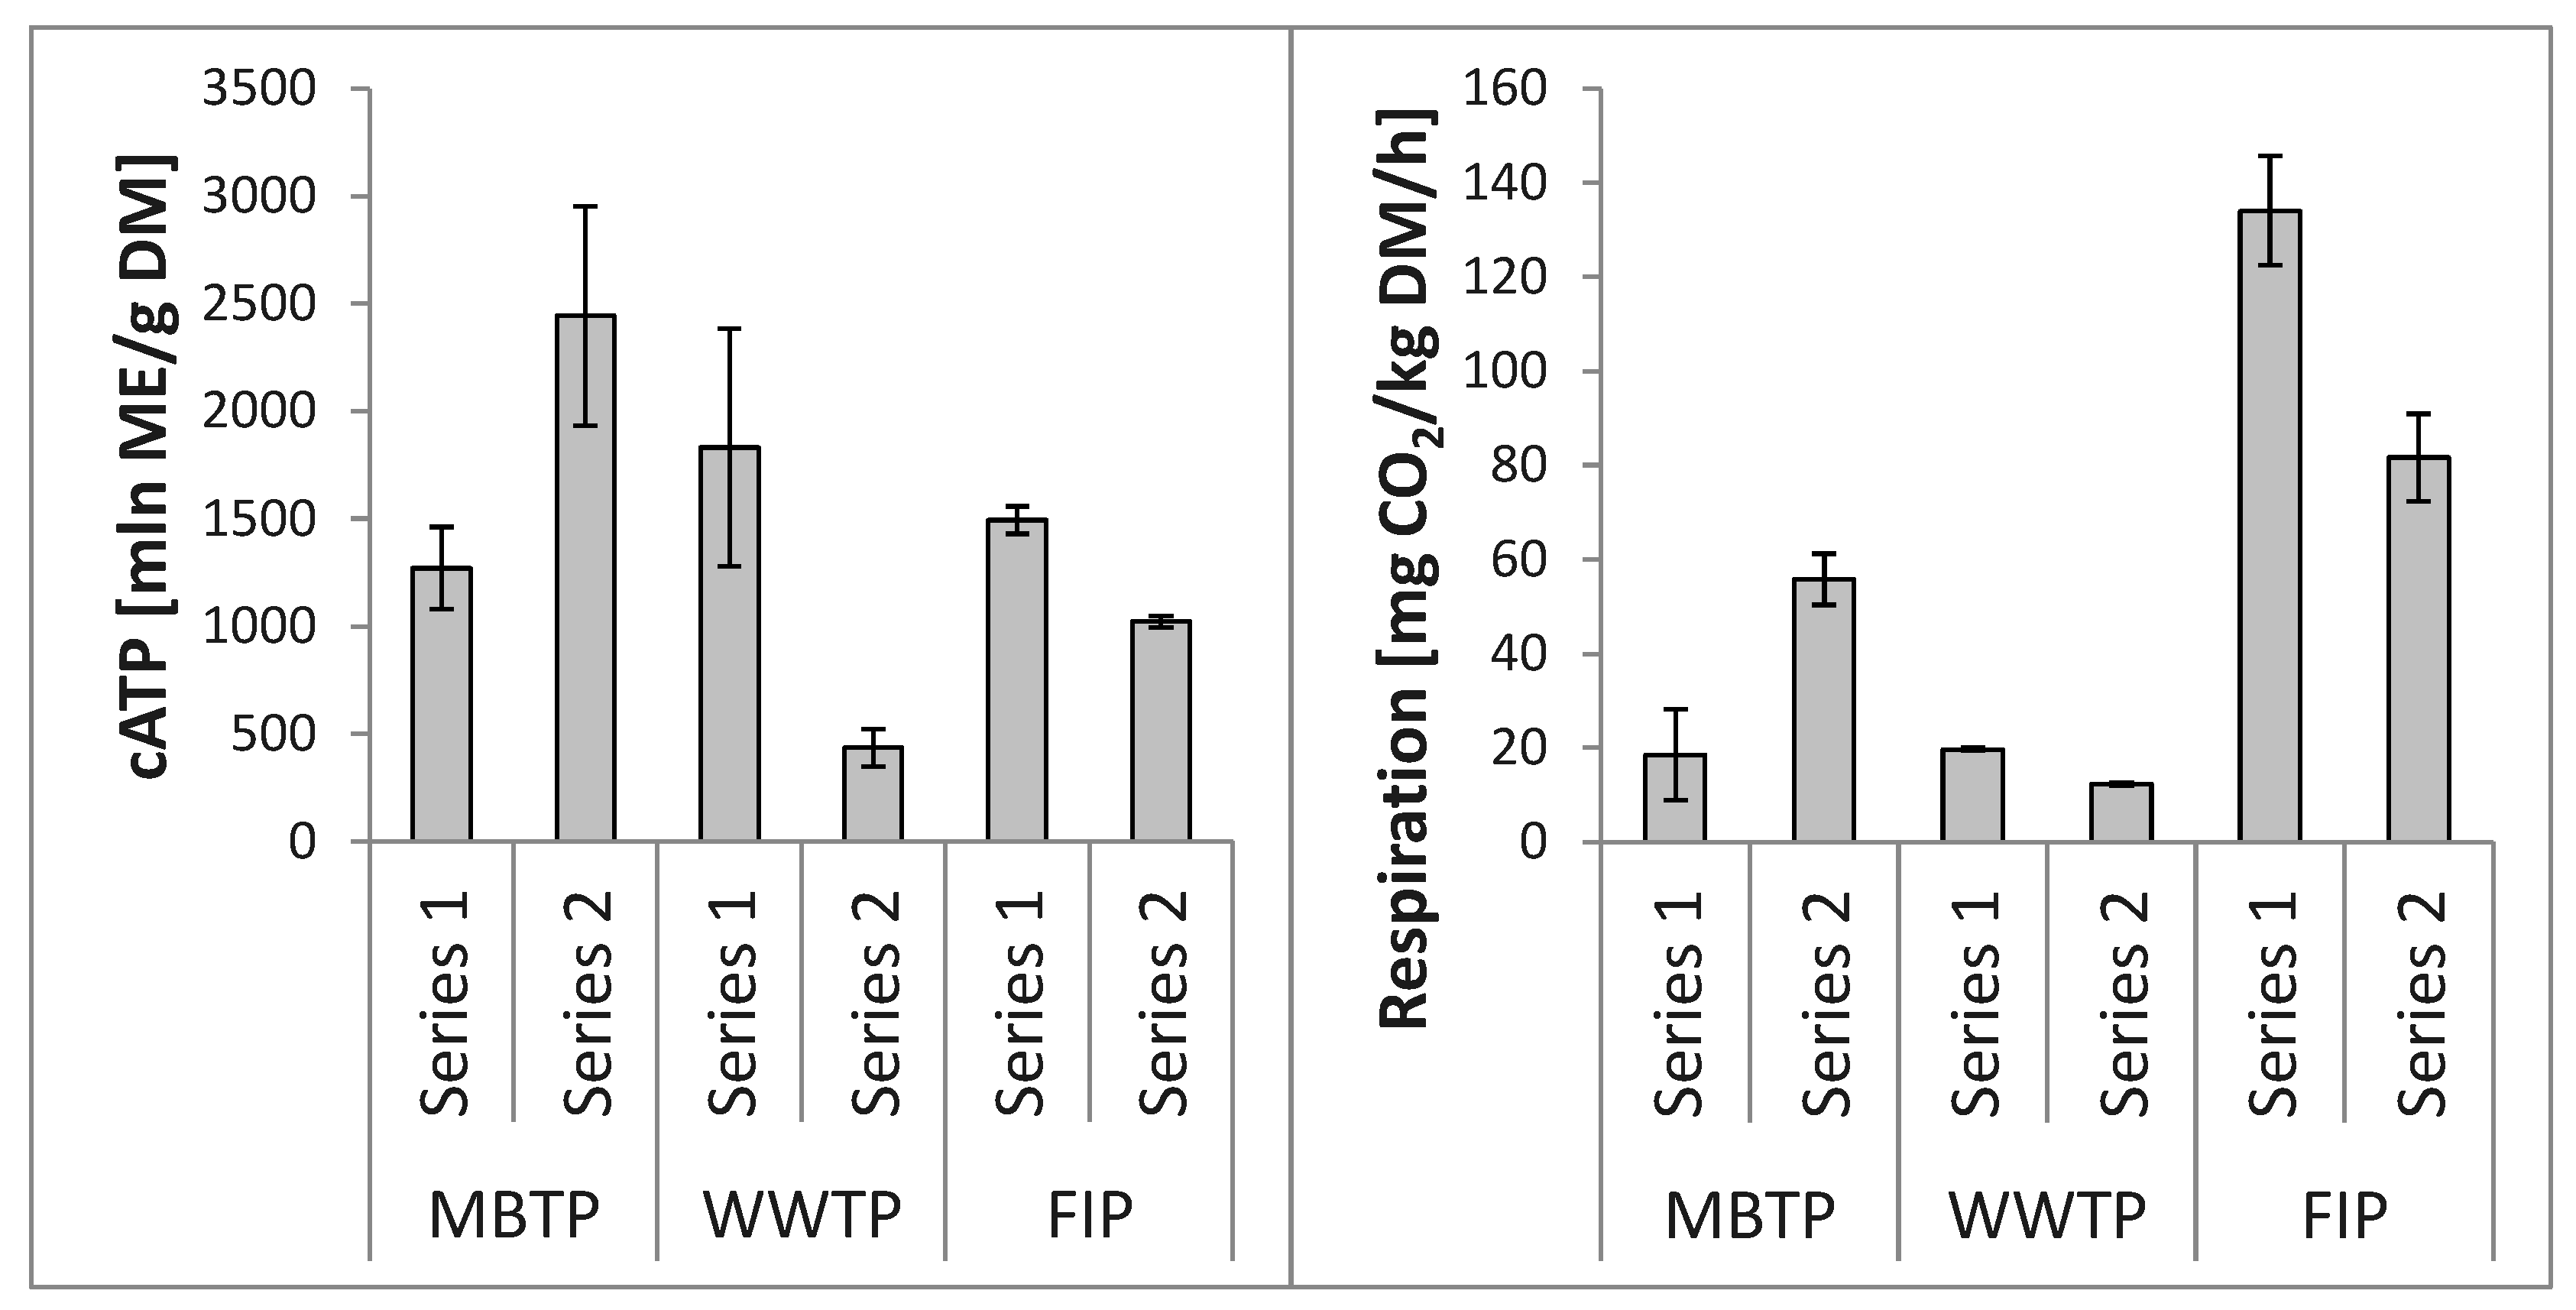
3.3. Relationships between Microbial Abundance and Microbial Respiration Activity

In order to find relationships between microbial abundance and microbial activity, the results from each of the two series for each biofilter were considered separately. There was no general correlation between the number of microorganisms (expressed either as cfu or ME) and the respiratory activity in the biofilter bed materials (Pearson coefficient was 0.18 and 0.008, Spearman coefficient was 0.03 and 0.23 for CB and CBC beds, respectively). However, the trends of the microbial activity and microbial abundance, expressed as ME based on intracellular ATP determination, were consistent in each biofilter and both beds when considered separately (Figure 11 and Figure 12).

4. Discussion

4.1. Relationships between Microbial Abundance in Gases and Biofilters’ Bed Materials

The microbial abundance in process gases from the aerobic stabilization hall at MBTP, the sludge drying hall at WWTP, and the production hall at FIP differed significantly depending on the type of industry. The lowest concentrations of bacteria and fungi were observed in waste gases from FIP and the highest were observed in waste gases from MBTP. It should be noted that the microbial content in waste gas from FIP (101–103 cfu/m3) was significantly lower than in waste gases from dairy, piggery or poultry food processing (104–106 cfu/m3) presented in literature [20,21,22]. Waste gas from the sludge drying hall at WWTP contained 103 cfu/m3 of bacteria and 101–102 cfu/m3 of fungi, which is similar to bioaerosols usually emitted from WWTPs (101–105 cfu/m3) [23,24,25,26]. Concentrations of bacteria and fungi in waste gas from MBTP observed in our study (103104 cfu/m3) were also in the same range as those reported by Pearson et al. [27] and Pahari et al. [28] (101–107 cfu/m3 and 103–104 cfu/m3, respectively).
The comparison of microbial abundance in waste and treated gases demonstrated that both CB and CBC beds used in biofilters can reduce substantially bioaerosol emissions (MBTP), but they can also emit both bacteria and fungi (WWTP and FIP). The final effect depended mostly on the concentrations of microorganisms in inlet waste gases, although the type of biofilter bed, and number of microorganisms in the biofilter bed, also affected the final outcome to some extent. Similarly, Schlegelmilch et al. [29] stated that biofilters designed for odor removal could act both as a source for microbial emissions originating from the filter bed and as emission reduction point. The number of bacteria in treated gases varied from 1.0 × 10³ cfu/m3 to 4.0 × 10⁷ cfu/m3 and the final result (bioaerosol reduction or increased emission) depended on the system configuration (including the type of a biofilter bed) and operation.
Investigations of the biofilters used to treat toluene vapors [30] and waste gases from a composting facility [31] showed that biofilters can be quite efficient in reducing bioaerosols emissions—removal efficiencies varied between studies from 11% to >90% for bacteria and from 49% to 100% for fungi. In our study, in the case of MBTP, where large number of bacteria and fungi were present in waste gas, the application of CB bed was effective in reducing the number of bacteria in the treated gas by around 50%, and the application of CBC bed resulted in over 30% reduction of fungi in treated gases. On the other hand, the use of both CB and CBC beds may result in an increase in the concentration of bacteria and fungi in the treated gases, but mainly in those cases where the microbial content in waste gases is low, as demonstrated with the biofilters tested at WWTP and FIP. Ottengraf and Konnings [32] tested full scale biofilters filled with compost-polystyrene particles and compost to treat waste gases from oriental food processing, flavor and fragrance production, and domestic wastewater treatment plant. None of the tested biofilters reduced the concentration of bacteria and molds, and these microorganisms were even emitted from biofilter beds despite they were not detected before filtration in waste gas from oriental food processing and domestic wastewater treatment plant. Similar effects were observed also in our study for the biofilter treating process gases from the production hall at FIP; high emission of fungal bioaerosol from both CB and CBC beds (medians 1580 cfu/m3 and 4800 cfu/m3) was detected despite very low content of these microorganism in waste gases (medians 20 cfu/m3 and 174 cfu/m3). Chmielowiec–Korzeniowska et al. [33] reported an analogous increase in the concentration of airborne bacteria in the treated gas from the biofilter compared to process gases from the hatchery.
Many authors, reviewed by [31], stated that biofilters could be a source of bioaerosol emission, and it was generally assumed that the emission was caused by the high abundance of the microorganisms in the biofilter bed. Our study shows that the final concentrations of microbes in the treated gases also depended on a type of biofilter bed and its microbial content. In the case of biofilter at MBTP, which treated process gases with high content of bacteria (over 14,000 cfu/m3), 50% reduction of bioaerosol was noted for the CB bed. On the other hand, neither elimination nor increased emission of bacteria from CBC bed was observed for this biofilter, despite the two times lower initial concentration of these microorganisms in the waste gas. However, it should be noted that the median bacterial content in the CBC bed (5.7 × 10⁸ cfu/g DM) was almost six times higher than in the CB bed (1.0 × 10⁸ cfu/g DM), which could have affected the biofilter performance. Notwithstanding, in some cases the CBC bed generated higher microbial emissions than the CB bed, even though the median numbers of bacteria and fungi were similar in both beds of biofilters examined at WWTP and FIP, respectively. This means that not only the high abundance of the microorganisms in the biofilter bed (as reviewed by [31]), but also other factors play a decisive role in determining whether the biofilter is an emitter of microorganism into the ambient air. Frederickson et al. [31] showed that the final microbial concentrations in the treated gases differed depending on the biofilter bed—perlite generated lower bioaerosol emission (up to 7 × 10⁷ cells/m3) than tezontle (1.3 × 10⁸ cells/m3), but higher than pine chips and wood chips (104 cfu/m3). Zilli et al. [34] indicated that the mechanism of bioaerosols reduction in biofilters is based on inertial impaction of particles, and they are liberated by shear stress. It should be noted that the properties of both bed materials and the hydraulic parameters of the biofilters examined in our study differed significantly, as discussed previously [16,17]. The average values of the equivalent diameter and specific surface of the CB and CBC packing grains were 31.08 mm and 6.66 mm, and 0.71 m2/g and 1.60 m2/g, respectively [16]. As a result, the CBC bed was densely packed (which is reflected in approximately 1.5 times the pressure drop compared to the CB bed). Lelicińska–Serafin et al. [17] observed the higher efficiency of pollutants removal from gases for the CBC bed, which was characterized by the larger specific surface and the smaller hydraulic diameter, but it is not always accompanied by lower emission of microbes from the biofilter bed, as demonstrated in this study. Water content in biofilter beds can also affect the bioaerosol emission from the biofilter, because dryness usually favors sporulation and cell emission. In this study, water content in CB beds was 10–25% higher than in CBC beds in all tested biofilters. However, lower fungal emission from the CBC bed has been reported for WWTP biofilters, which shows that the water content in the biofilter bed may have a substantially lesser impact on bioaerosol emissions than other factors such as microbial abundance in the waste gas and/or in the biofilter bed.
Summarizing, the results presented in this study showed that the abundance of bacteria and fungi in the waste gas is the decisive factor determining the emission from the biofilter. Both CB and CBC beds can reduce the emissions of bacteria and fungi from industrial plants when a large number of these microorganisms are present in the waste gases. It means that the high microbial content in the inlet gases may make the effect of microbial emission from the biofilter bed negligible. The type of biofilter bed also plays a role in the final bioaerosol emission; however, it has a much smaller impact, although to some extent it is relevant for biofilters that treat waste gases with very low microbial concentrations.
It should be noted that culture-dependent methods have been demonstrated to underestimate the concentration of microorganisms from bioaerosol emissions—only 17% of the known fungal spores and approximately 1% of bacteria can be cultivable [35,36,37]. Therefore, the total content of microorganisms in bioaerosol was certainly much higher than the levels presented in this study. Several techniques to measure or characterize bioaerosols (such as PCR, DGGE, epifluorescence microscopy, real-time bioparticle sensing, next-generation sequencing and immunoassays) have been proposed as an alternative to the culture-depending methods. However, culture-based methods are still used routinely by researchers and most of the threshold values or guidelines for assessing exposure to biological factors were established using these techniques.
High numbers of culturable bacteria and fungi (~108 cfu/g DM and ~106 cfu/g DM, respectively) were detected in both CB and CBC beds. Growth of microorganisms inhabiting biofilter beds and substrate utilization rates depend on the type of gas pollutants, the bed composition, and on the operational parameters such as the substrate mass loading rate, volumetric loading rate, waste gas temperature, pH, moisture. As a result, microbial communities in the biofilter beds may differ even in very similar biofilter configurations and waste gases with the same main pollutants [38,39]. It should be noted that in this study the beds of biofilters were not inoculated prior to their application and similar operating parameters were maintained in all biofilters [16]. The only differences were the pollutant loadings and type of pollutants. Therefore, the number of microorganisms in the bed materials can be explained by the type of biofilter bed selected in our study and to some extent by the waste gas characteristics. All process gases mostly contained easily biodegradable compounds. However, their concentrations in waste gases (measured as VOCs) were very low (Table 1). While there were variations in average VOCs concentrations (from <1 ppm at MBTP to 3.5 ppm at FIP), the maximum overall substrate mass loading rates were slightly higher than 1 g/(m3 × h), which is quite low and may not support the biomass growth. The literature data indicate that in order to obtain efficient biofiltration, the concentration of VOCs in waste gases should be at least 10 ppm [17,40], and the elimination capacity of typical biofilters treating gases with easily biodegradable compounds could be even 250 times higher [41]. In this study, both of the examined bed materials were organic and contained additional sources of carbon, nitrogen and phosphorus which were easily available for microorganisms. We believe that this could explain the large number of microorganisms in the biofilter beds. Sakuma et al. [40] observed that the biofilter beds that are rich in organic matter, nitrogen, and phosphorus were more favorable for the microbial growth and contained more microorganisms than inorganic bed materials used under the same operating conditions.
As mentioned earlier, the high microbial abundance in the beds of biofilters also had a certain impact on the final bioaerosol concentrations in the treated gases. The range of bioaerosol concentrations emitted from biofilters can be remarkably wide and may vary between 103 cfu/m3 and 108 cfu/m3 [15,29,42]. While threshold values for bioaerosols have not been officially established by the WHO, various governmental and private organizations have proposed quantitative guidelines [43]. In accordance with the guidance of the Environment Agency for bioaerosols at open windrow compost sites [31], the permissible values are 1000 cfu/m3 for bacteria and 500 cfu/m3 for fungi. In our research the limit of bacterial concentration in treated gases was exceeded in all tested biofilters with both bed materials (1400–7200 cfu/m3). The concentrations of fungi in the treated gases were also higher for all tested biofilters (1580–8150 cfu/m3) but one with the CBC bed tested at WWTP. Such concentrations could be potentially harmful to humans and considering that activated sludge and compost, which are often used as inoculation sources for biofilters, may contain a large number of pathogenic bacteria, fungi and viruses, it should be noted that this may result in the release of bioaerosols containing pathogenic microorganisms during biofiltration, posing a threat on both occupational health as well as on society in the vicinity of such facilities [13,44]. The solution to this problem could be the application of a technology to control the bioaerosol emissions released from the biofilter. Up to date several techniques to inactivate and remove microorganisms from air have been studied and used for air disinfection: ultraviolet light (UV), O3 and H2O2 (as strong oxidizing agents), microwave, plasma technology and photocatalysis disinfection (PCD) [15,45]. The possibility of application of those technologies to control the bioaerosols emission from biofilters has been studied by several authors [35,36,46,47]. Wang et al. [48] proved that application of UV as a pre-treatment method in a combined UV-biofiltration process effectively reduced the emission of bioaerosol from a biofilter treating waste gas contaminated with chlorobenzene. Saucedo–Lucero et al. [47] successfully applied photolytic and photocatalytic post-treatment processes to reduce the bioaerosol emission from biofilter treating waste gas polluted with hexane. Studies of Valdez–Castillo et al. [35,36] demonstrated that PCD could be successfully used as a post-treatment technology and the inactivation efficiency of bioaerosol by this method was 70–78% with an active catalyst. Muszyński et al. [18] showed that the application of membranes designed as a second-step treatment of waste gases from food industry in combined biofilter could be also a very efficient tool in bioaerosol removal from treated gases.

4.2. Relationships between Microbial Abundance and Microbial Respiration Activity

Microbial abundance in the biofilter beds was examined using both culture-dependent and culture-independent methods, but in most literature studies only one of these methods has been used [3,48]. However, the analysis of the results obtained in our research showed no correlations between cfu/g DM and ME/g DM, respectively (statistical data not shown). It should be stated that the conversion of cATP to ME is based on the assumption that all microorganisms contain 1 fg of ATP in the cell. Taking into consideration the differences in microbial consortia inhabiting the biofilter beds, this assumption may not be accurate. Anet et al. [49] analyzed several bed materials (pines barks, composted wood mulch and expanded schist) used for biofiltration of odorous emissions. The initial concentrations of bacteria and cATP were 29.1 × 10¹³ cfu/m3 and 93 g ATP/m3 of biofilter bed, respectively, which corresponded to 320 fg ATP/1 cfu. It confirms that probably more than 99% of bacterial cells were not recovered using microbiological media and the ATP concentration may also vary depending on the microbial genera [49,50].
It is worth noting that in our study microbial respiration activity corresponds with microbial abundance expressed as cATP/ME in contrast to the traditional approach (cfu), although no general correlation could be found. Theoretically, more cATP means that cells are more active, probably also displaying higher respiratory activity. In turn, more cfu does not necessarily mean higher respiration level. A large number of cells may be present, but not necessarily highly active, and this may be the reason for the lack of cfu-respiration correlation. This indicates that ATP measurement can be used to determine microbial activity in a biofilter bed but may not always be considered as a measurement of microbial abundance in biofilters. This thesis was confirmed by the research of Estrada et al. [51], who also reported a correlation between ATP content and microbial activity measured as the toluene elimination capacity.
It should be noted that in a specific biotope (the same bed in the same biofilter), similar abiotic conditions affect the microbial community structure and comparable trends in activity changes (respiration) and ATP content are observed (Figure 11 and Figure 12). However, in a different biotope, other groups of microorganisms with different intracellular ATP content may develop. These findings suggest that cATP-based monitoring of microbial activity cannot be reliably used when comparing different biofilters with completely different microbial communities. However, it is possible to use it for on-site monitoring of one specific biofilter with a stable microbial community structure.

5. Conclusions

Biofilters used to treat waste gases from mechanical–biological treatment plant, wastewater treatment plant and food industry may reduce bioaerosol emissions from industrial plant, but they can be also emitters of both bacteria and fungi. The final effect depends mostly on the content of microorganisms in waste gases, although the type of biofilter bed, and number of microorganisms inhabiting the biofilter bed also affect the final outcome. The microbial concentrations in treated gases far exceeded the microbial abundance in ambient air. It may result in the release of bioaerosols containing pathogenic microorganisms during biofiltration, causing hazard for human health.
Microbial respiration activities corresponded with microbial abundance expressed as ME, which was calculated based on intracellular ATP determination. This indicates that ATP measurement could be used to determine microbial activity, rather than microbial abundance in biofilter beds. However, its application may be limited when different biofilters are compared with completely different microbial communities.

Author Contributions

Conceptualization, A.M., A.T., M.Z.-R. and K.A.; methodology, A.T. and A.M.; validation, A.M., A.T., M.Z.-R. and K.A; investigation, A.T., A.M., N.D. and K.A.; data curation, A.M.; writing—original draft preparation, K.A., N.D. and A.M.; writing—review and editing, A.M., A.T., M.Z.-R. and K.A.; visualization, A.M.; supervision, M.Z.-R.; project administration, A.T.; funding acquisition, A.T. All authors have read and agreed to the published version of the manuscript.

Funding

This research was funded by European Regional Development Fund operated by the National Centre for Research and Development under the Smart Growth Operational Programme 2014–2020 under the priority axis IV: “Increasing the scientific and research potential” in the Measure 4.1. ‘R&D activity”, Sub-measure 4.1.2 “Regional science and research agendas” in the frame of Project Contract No POIR.04.01.02-00-0019/16. url: https://biozin.wordpress.com/ (accessed on 23 October 2021).

Institutional Review Board Statement

Not applicable.

Informed Consent Statement

Not applicable.

Data Availability Statement

Not applicable.

Conflicts of Interest

The authors declare no conflict of interest.

References

  1. Maia, G.D.N.; Sales, G.T.; Day, G.B.V.; Gates, R.S.; Taraba, J.L. Characterizing physical properties of gas-phase biofilter media. Trans. ASABE 2012, 55, 1939–1950. [Google Scholar] [CrossRef]
  2. Wéry, N. Bioaerosols from composting facilities–A review. Front. Cell. Infect. Microbiol. 2014, 4, 1–9. [Google Scholar] [CrossRef]
  3. Ralebitso-Senior, T.K.; Senior, E.; Di Felice, R.; Jarvis, K. Waste gas biofiltration: Advances and limitations of current approaches in microbiology. Environ. Sci. Technol. 2012, 46, 8542–8573. [Google Scholar] [CrossRef] [PubMed]
  4. Fletcher, L.A.; Jones, N.; Warren, L.; Stentiford, E.I. Understanding Biofilter Performance and Determining Emission Concentrations under Operational Conditions. 2014. Available online: http://organics-recycling.org.uk/uploads/article2834/ER36%20Final%20Report%20for%20publication.pdf (accessed on 23 October 2021).
  5. Tang, H.M.; Hwang, S.J.; Hwang, S.C. Waste Gas Treatment in Biofilters. J. Air Waste Manag. Assoc. 1996, 46, 349–354. [Google Scholar] [CrossRef] [PubMed]
  6. Omri, I.; Aouidi, F.; Bouallagui, H.; Godon, J.J.; Hamdi, M. Performance study of biofilter developed to treat H2S from wastewater odour. Saudi J. Biol. Sci. 2013, 20, 169–176. [Google Scholar] [CrossRef] [Green Version]
  7. Le Borgne, S.; Baquerizo, G. Microbial ecology of biofiltration units used for the desulfurization of biogas. Chem. Eng. 2019, 3, 72. [Google Scholar] [CrossRef] [Green Version]
  8. Runye, Z.; Kennes, C.; Zhuowei, C.; Lichao, L.; Jianming, Y.; Jianmeng, C. Styrene removal in a biotrickling filter and a combined UV-biotrickling filter: Steady- and transient-state performance and microbial analysis. Chem. Eng. J. 2015, 275, 168–178. [Google Scholar] [CrossRef]
  9. Pandey, R.A.; Padoley, K.V.; Mukherji, S.S.; Mudliar, S.N.; Vaidya, A.N.; Rajvaidya, A.S.; Subbarao, T.V. Biotreatment of waste gas containing pyridine in a biofilter. Bioresour. Technol. 2007, 98, 2258–2267. [Google Scholar] [CrossRef]
  10. Ghasemi, R.; Golbabaei, F.; Rezaei, S.; Pourmand, M.R.; Nabizadeh, R.; Jafari, M.J.; Masoorian, E. A comparison of biofiltration performance based on bacteria and fungi for treating toluene vapors from airflow. AMB Express 2020, 10, 1–9. [Google Scholar] [CrossRef] [PubMed]
  11. Li, L.; Lian, J.; Han, Y.; Liu, J. A biofilter integrated with gas membrane separation unit for the treatment of fluctuating styrene loads. Bioresour. Technol. 2012, 111, 76–83. [Google Scholar] [CrossRef] [PubMed]
  12. Rene, E.R.; Kar, S.; Krishnan, J.; Pakshirajan, K.; López, M.E.; Murthy, D.V.S.; Swaminathan, T. Start-up, performance and optimization of a compost biofilter treating gas-phase mixture of benzene and toluene. Bioresour. Technol. 2015, 190, 529–535. [Google Scholar] [CrossRef]
  13. Wang, Y.; Fu, Y.; Wang, C.; Wen, N. Dissimilar emission characteristics between bioaerosol and suspended particles from gaseous biofilters and bioaerosol health risk evaluation. Aerosol Air Qual. Res. 2018, 18, 1874–1885. [Google Scholar] [CrossRef]
  14. Ibanga, I.E.; Fletcher, L.A.; Noakes, C.J.; King, M.F.; Steinberg, D. Pilot-scale biofiltration at a materials recovery facility: The impact on bioaerosol control. Waste Manag. 2018, 80, 154–167. [Google Scholar] [CrossRef]
  15. Hu, X.R.; Han, M.F.; Wang, C.; Yang, N.Y.; Wang, Y.C.; Duan, E.H.; Hsi, H.C.; Deng, J.G. A short review of bioaerosol emissions from gas bioreactors: Health threats, influencing factors and control technologies. Chemosphere 2020, 253, 126737. [Google Scholar] [CrossRef]
  16. Rolewicz-Kalińska, A.; Lelicińska-Serafin, K.; Manczarski, P. Volatile organic compounds, ammonia and hydrogen sulphide removal using a two-stage membrane biofiltration process. Chem. Eng. Res. Des. 2021, 165, 69–80. [Google Scholar] [CrossRef]
  17. Lelicińska-Serafin, K.; Rolewicz-Kalińska, A.; Manczarski, P. VOC removal performance of a joint process coupling biofiltration and membrane-filtration treating food industry waste gas. Int. J. Environ. Res. Public Health 2019, 16, 3009. [Google Scholar] [CrossRef] [Green Version]
  18. Muszyński, A.; Tabernacka, A.; Załęska-Radziwiłł, M. How to reduce the emission of microorganisms from a biofilter used to treat waste gas from a food industry plant. Atmosphere 2021, 12, 673. [Google Scholar] [CrossRef]
  19. ISO 16072:2011. Soil Quality—Laboratory Methods for Determining Respiration of Soil Microorganisms. Technical Committee CEN TC 444. 2011. Available online: https://standards.iteh.ai/catalog/standards/cen/d89f3b14-4f89-49da-82ee-c479553931be/en-iso-16072-2011 (accessed on 23 October 2021).
  20. Mirskaya, E.; Agranovski, I.E. Sources and mechanisms of bioaerosol generation in occupational environments. Crit. Rev. Microbiol. 2018, 44, 739–758. [Google Scholar] [CrossRef]
  21. Millner, P.D. Bioaerosols associated with animal production operations. Bioresour. Technol. 2009, 100, 5379–5385. [Google Scholar] [CrossRef] [PubMed]
  22. Lues, J.F.R.; Theron, M.M.; Venter, P.; Rasephei, M.H.R. Microbial composition in bioaerosols of a high-throughput chicken-slaughtering facility. Poult. Sci. 2007, 86, 142–149. [Google Scholar] [CrossRef]
  23. Bauer, H.; Fuerhacker, M.; Zibuschka, F.; Schmid, H.; Puxbaum, H. Bacteria and fungi in aerosols generated by two different types of wastewater treatment plants. Water Res. 2002, 36, 3965–3970. [Google Scholar] [CrossRef]
  24. Korzeniewska, E.; Filipkowska, Z.; Gotkowska-Płachta, A.; Janczukowicz, W.; Dixon, B.; Czułowska, M. Determination of emitted airborne microorganisms from a BIO-PAK wastewater treatment plant. Water Res. 2009, 43, 2841–2851. [Google Scholar] [CrossRef]
  25. Li, J.; Zhou, L.; Zhang, X.; Xu, C.; Dong, L.; Yao, M. Bioaerosol emissions and detection of airborne antibiotic resistance genes from a wastewater treatment plant. Atmos. Environ. 2016, 124, 402–412. [Google Scholar] [CrossRef]
  26. Vijatov, T.; Dražić, G.; Jovanović, F. Environmental aspects of biological wastewater treatment by different methods and microorganisms. Sustain. For. Collect. 2020, 81–82, 133–147. [Google Scholar] [CrossRef]
  27. Pearson, C.; Littlewood, E.; Douglas, P.; Robertson, S.; Gant, T.W.; Hansell, A.L. Exposures and health outcomes in relation to bioaerosol emissions from composting facilities: A systematic review of occupational and community studies. J. Toxicol. Environ. Health 2015, 18, 43–69. [Google Scholar] [CrossRef] [PubMed]
  28. Pahari, A.K.; Dasgupta, D.; Patil, R.S.; Mukherji, S. Emission of bacterial bioaerosols from a composting facility in Maharashtra, India. Waste Manag. 2016, 53, 22–31. [Google Scholar] [CrossRef]
  29. Schlegelmilch, M.; Herold, T.; Streese, J.; Hensel, A.; Stegmann, R. The potential to reduce emissions of airborne microorganisms by means of biological waste gas treatment systems. Waste Manag. 2005, 25, 955–964. [Google Scholar] [CrossRef]
  30. Esquivel-Gonzalez, S.; Aizpuru, A.; Patrón-Soberano, A.; Arriaga, S. Characterization of bioaerosol emissions from two biofilters during treatment of toluene vapours using epifluorescence microscopy. Int. Biodeter. Biodegr. 2017, 123, 78–86. [Google Scholar] [CrossRef]
  31. Frederickson, J.; Boardman, C.P.; Gladding, T.L.; Simpson, A.E.; Howell, G.; Sgouridis, F. Evidence: Biofilter Performance and Operation as Related to Commercial Composting; Environment Agency: Bristol, UK, 2013.
  32. Ottengraf, S.P.P.; Konings, J.H.G. Emission of microorganisms from biofilters. Bioprocess Eng. 1991, 7, 89–96. [Google Scholar] [CrossRef] [Green Version]
  33. Chmielowiec-Korzeniowska, A.; Tymczyna, L.; Skórska, C.; Sitkowska, J.; Cholewa, G.; Dutkiewicz, J. Efficacy of a novel biofilter in hatchery sanitation: I. Removal of airborne bacteria, dust and endotoxin. Ann. Agric. Environ. Med. 2007, 14, 141–150. [Google Scholar] [PubMed]
  34. Zilli, M.; Guarinoa, C.; Daffonchio, D.; Borin, S.; Converti, A. Laboratory–scale experiments with a powdered compost biofilter treating benzene-polluted air. Proc. Biochem. 2005, 40, 2035–2043. [Google Scholar] [CrossRef]
  35. Valdez-Castillo, M.; Saucedo-Lucero, J.O.; Arriaga, S. Photocatalytic inactivation of airborne microorganisms in continuous flow using perlite-supported ZnO and TiO2. Chem. Eng. J. 2019, 374, 914–923. [Google Scholar] [CrossRef]
  36. Valdez-Castillo, M.; Saucedo-Lucero, J.O.; Villalobos-Romero, K.L.; Péréz-Rodriguez, F.; Arriaga, S. Steady-state operation of a biofilter coupled with photocatalytic control of bacterial bioaerosol emissions. Environ. Sci. Pollut. Res. 2021, 28, 13970–13980. [Google Scholar] [CrossRef]
  37. Flores-Barbosa, A.B.; Aizpuru, A.; Quijano, G.; Arriaga, S. Evaluation of bioaerosols by flow cytometry and removal performance in a biofilter treating toluene/ethyl acetate vapors. Chemosphere 2020, 251, 126404. [Google Scholar] [CrossRef] [PubMed]
  38. Cho, E.; Galera, M.M.; Lorenzana, A.; Chung, W.-J. Ethylbenzene, o-xylene, and BTEX removal by Sphingomonas sp. D3K1 in rock wool-compost biofilters. Environ. Eng. Sci. 2009, 26, 45–52. [Google Scholar] [CrossRef]
  39. Cho, K.-S.; Yoo, S.-K.; Ryu, H.W. Thermophilic biofiltration of benzene and toluene. J. Microbiol. Biotechnol. 2007, 17, 1976–1982. [Google Scholar] [PubMed]
  40. Sakuma, T.; Hattori, T.; Deshusses, M.A. Comparison of different packing materials for the biofiltration of air toxics. J. Air Waste Manage. Assoc. 2006, 56, 1567–1575. [Google Scholar] [CrossRef] [PubMed] [Green Version]
  41. Estrada, J.M.; Hernández, S.; Muñoz, R.; Revah, S. A comparative study of fungal and bacterial biofiltration treating a VOC mixture. J. Hazard. Mater. 2013, 250, 190–197. [Google Scholar] [CrossRef]
  42. Yang, K.; Li, L.; Ding, W.; Liu, J.; Xue, S. A full-scale thermophilic biofilter in the treatment of sludge drying exhaust: Performance, microbial characteristics and bioaerosol emission. J. Chem. Technol. Biotechnol. 2018, 93, 2216–2225. [Google Scholar] [CrossRef]
  43. Wikuats, C.F.H.; Duarte, E.H.; Prates, K.V.M.C.; Janiaski, L.L.L.; Gabriel, D.O.; Molina, A.C.; Martins, L.D. Assessment of airborne particles and bioaerosols concentrations in a waste recycling environment in Brazil. Sci. Rep. 2020, 10, 14812. [Google Scholar] [CrossRef] [PubMed]
  44. Yang, K.; Li, L.; Xue, S.; Wang, Y.; Liu, J.; Yang, T. Influence factors and health risk assessment of bioaerosols emitted from an industrial scale thermophilic biofilter for off gas treatment. Process. Saf. Environ. Prot. 2019, 129, 55–62. [Google Scholar] [CrossRef]
  45. Wang, C.; Zhang, Z.W.; Liu, H. Microwave-induced release and degradation of airborne endotoxins from Escherichia coli bioaerosol. J. Hazard Mater. 2019, 366, 27–33. [Google Scholar] [CrossRef] [PubMed]
  46. Wang, C.; Xi, J.Y.; Hu, H.Y. Reduction of toxic products and bioaerosol emission of a combined ultraviolet-biofilter process for chlorobenzene treatment. J. Air Waste Manag. Assoc. 2009, 59, 405–410. [Google Scholar] [CrossRef]
  47. Saucedo-Lucero, J.O.; Quijano, G.; Arriaga, S.; Muňoza, R. Hexane abatement and spore emission control in a fungal biofilter-photoreactor hybrid unit. J. Hazard Mater. 2014, 276, 287–294. [Google Scholar] [CrossRef] [PubMed]
  48. Andrès, Y.; Dumant, E.; Gerente, C. Characterization of packing material colonization in gas biofiltration processes. Can. J. Civ. Eng. 2009, 36, 1895–1902. [Google Scholar] [CrossRef]
  49. Anet, B.; Couriol, C.; Lendormi, T.; Amrane, A.; Le Cloirec, P.; Cogny, G.; Fillières, R. Characterization and selection of packing materials for biofiltration of rendering odourous emissions. Water Air Soil Pollut. 2013, 224, 1–13. [Google Scholar] [CrossRef]
  50. Martin, F.J.; Loehr, R.C. Effect of periods of non-use on biofilter performance. J. Air Waste Manag. Assoc. 1996, 46, 539–546. [Google Scholar] [CrossRef] [PubMed] [Green Version]
  51. Estrada, J.M.; Rodríguez, E.; Quijano, G.; Muñoz, R. Influence of gaseous VOC concentration on the diversity and biodegradation performance of microbial communities. Bioprocess Biosys. Eng. 2012, 35, 1477–1488. [Google Scholar] [CrossRef] [PubMed]
Figure 1. (a) Scheme of the pilot-scale biofilter equipped with a fan, a scrubber, an automatic regulation and control unit, and an installation for the distribution of waste gas and leachate drainage. Biofilter bed materials (CB—mix of stumpwood chips and pine bark; CBC—mix of stumpwood chips, pine bark and compost from green waste) were tested alternatively. (b) Location of sampling points (1, 2, 3) for bed material and treated gases—top view.
Atmosphere 12 01574 g001
Figure 2. Pilot-scale biofilters tested for the treatment of waste gases from: (a) a wastewater treatment plant (WWTP) and (b) a food industry plant (FIP). (c) CB medium (mix of stumpwood chips and pine bark) in the pilot-scale biofilter tested for the treatment of waste gases from a mechanical–biological treatment plant (MBTP). (d) CBC medium (mix of stumpwood chips, pine bark and compost from green waste) in the pilot-scale biofilter at FIP.
Atmosphere 12 01574 g002
Figure 3. Total number of bacteria (cfu/m3) in the waste gases and gases treated by biofilters with CB beds (mix of stumpwood chips and pine bark) at mechanical–biological treatment plant (MBTP), wastewater treatment plant (WWTP) and food industry plant (FIP). The band inside the box—median; ◦—outliers.
Atmosphere 12 01574 g003
Figure 4. Total number of fungi (cfu/m3) in the waste gases and gases treated by biofilters with CB beds (mix of stumpwood chips and pine bark) at mechanical–biological treatment plant (MBTP), wastewater treatment plant (WWTP) and food industry plant (FIP). The band inside the box—median; ◦—outliers.
Atmosphere 12 01574 g004
Figure 5. Total number of bacteria (cfu/m3) in the waste gases and gases treated by biofilters with CBC beds (mix of stumpwood chips, pine bark, and compost from green waste) at mechanical–biological treatment plant (MBTP), wastewater treatment plant (WWTP) and food industry plant (FIP). The band inside the box—median; ◦—outliers.
Atmosphere 12 01574 g005
Figure 6. Total number of fungi (cfu/m3) in the waste gases and gases treated by biofilters with CBC beds (mix of stumpwood chips, pine bark, and compost from green waste) at mechanical–biological treatment plant (MBTP), wastewater treatment plant (WWTP) and food industry plant (FIP). The band inside the box—median; ◦—outliers.
Atmosphere 12 01574 g006
Figure 7. Total number of bacteria (million cfu/g DM) in CB beds (mix of stumpwood chips and pine bark) of biofilters at mechanical–biological treatment plant (MBTP), wastewater treatment plant (WWTP) and food industry plant (FIP). The band inside the box—median; ◦—outliers.
Atmosphere 12 01574 g007
Figure 8. Total number of fungi (million cfu/g DM) in CB beds (mix of stumpwood chips and pine bark) of biofilters at mechanical–biological treatment plant (MBTP), wastewater treatment plant (WWTP) and food industry plant (FIP). The band inside the box—median; ◦—outliers.
Atmosphere 12 01574 g008
Figure 9. Total number of bacteria (million cfu/g DM) in CBC beds (mix of stumpwood chips, pine bark, and compost from green waste) of biofilters at mechanical–biological treatment plant (MBTP), wastewater treatment plant (WWTP) and food industry plant (FIP). The band inside the box—median; ◦—outliers.
Atmosphere 12 01574 g009
Figure 10. Total number of fungi (million cfu/g DM) in CBC beds (mix of stumpwood chips, pine bark and compost from green waste) of biofilters at mechanical–biological treatment plant (MBTP), wastewater treatment plant (WWTP) and food industry plant (FIP). The band inside the box—median; ◦—outliers.
Atmosphere 12 01574 g010
Figure 11. Microbial abundance (million ME/g DM) (left panel) and microbial activity expressed as respiration (mg CO2/(kg DM × h)) (right panel) in CB beds (mix of stumpwood chips and pine bark) in each of two sampling series for biofilters at mechanical–biological treatment plant (MBTP), wastewater treatment plant (WWTP) and food industry plant (FIP). Error bars illustrate standard errors.
Atmosphere 12 01574 g011
Figure 12. Microbial abundance (million ME/g DM) (left panel) and microbial activity expressed as respiration (mg CO2/(kg DM × h)) (right panel) in CBC beds (mix of stumpwood chips, pine bark, and compost from green waste) in each of two sampling series for biofilters at mechanical–biological treatment plant (MBTP), wastewater treatment plant (WWTP) and food industry plant (FIP). Error bars illustrate standard errors.
Atmosphere 12 01574 g012
Table 1. Operational parameters of semi-technical scale biofilters used to treat waste gases from mechanical–biological treatment plant (MBTP), wastewater treatment plant (WWTP) and food industry plant (FIP). Bed materials: CB—mix of stumpwood chips and pine bark; CBC—mix of stumpwood chips, pine bark, and compost from green waste.
Test SiteBed
Material
Water Content [%]Average Inlet Concentrations ± SD (Range)Average Flow
Rate ± SD [m3/h]
Average
Surface
Load ± SD
[m3/(m2 × h)]
Average Volumetric Load ± SD
[m3/(m3 × h)]
Average
Pressure
Drop ± SD
[Pa]
VOCs [ppb]NH3
[ppm]
H2S
[ppm]
MBTPCB55 ± 4938 ± 3725 ± 11.5 ± 0.4379 ± 1495.8 ± 3.583.2 ± 2.9372 ± 9
CBC27 ± 2(405–1820)(4–6)(0.9–2.3)381 ± 1296.1 ± 3.083.6 ± 2.6542 ± 9
WWTPCB62 ± 52258 ± 95526 ± 144.8 ± 0.1380 ± 1196.1 ± 2.883.5 ± 2.4375 ± 15
CBC45 ± 4(140–3980)(6–59)(4.6–5.0)385 ± 1697.1 ± 1.684.4 ± 1.4510 ± 26
FIPCB61 ± 53478 ± 311910 ± 47.5 ± 3.9382 ± 2496.5 ± 6.184.0 ± 5.3379 ± 13
CBC51 ± 5(480–9400)(4–15)(2.1–14.3)322 ± 8681.3 ± 21.770.7 ± 18.9596 ± 84
Publisher’s Note: MDPI stays neutral with regard to jurisdictional claims in published maps and institutional affiliations.

