
Rare and Extreme Wildland Fire in Sakha in 2021


Abstract
:1. Introduction
2. Methods and Data
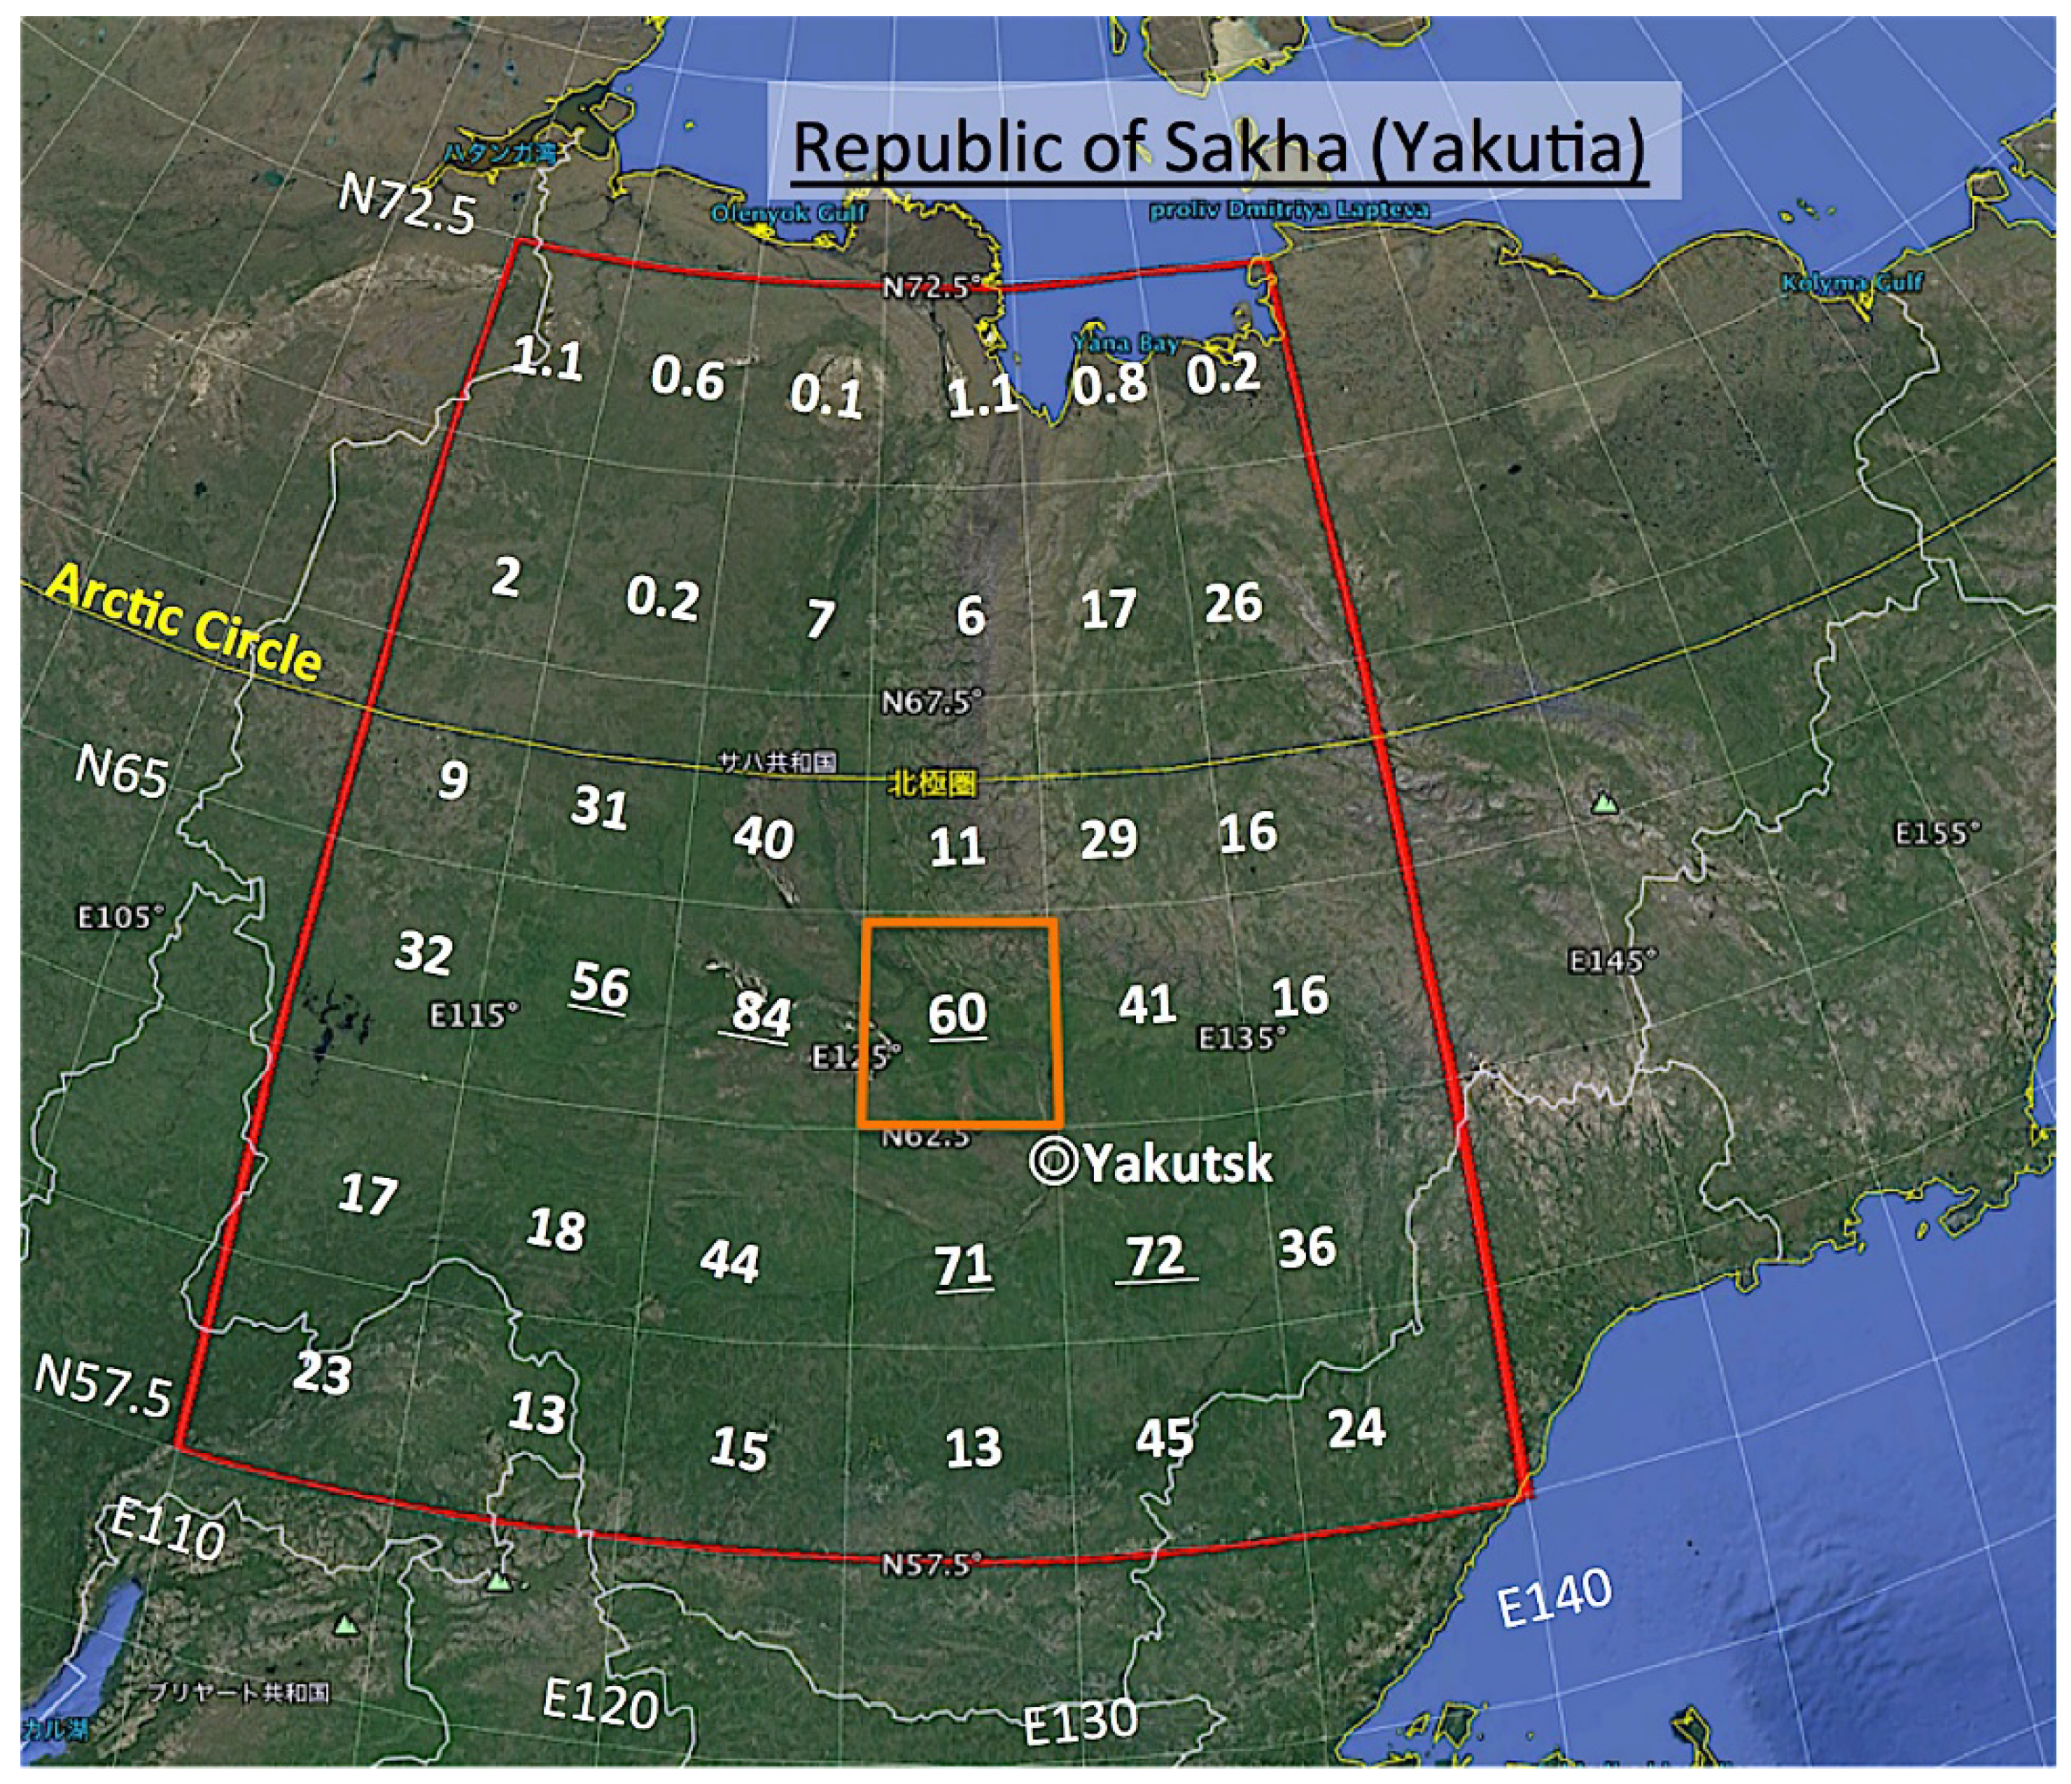
2.1. Study Region
2.2. Hotspot (Fire) and Weather Data
2.3. Analysis Methods
3. Results
3.1. Recent Fire History
3.2. Fire in 2021
3.2.1. Hotspot (Fire) Distribution
3.2.2. Daily Fire Occurrence
- The largest daily number of HSs in 2021 was 16,226, detected on 2 August. This is larger than 10,454, the second largest number of HSs detected on 19 August 2002. As the third largest daily number of HSs was 8282, detected on 4 August 2012, we may say that 2021 had very active daily fire after 2002.
- Total number of HSs of the HFA in 2012 was 65,102 (see Table 1). This number exceeds 60,171, the total number of HSs of 19 years (2002–2020). This is about 21 times the average value over those 19 years (3167).
- The daily highest number of HSs in the HFA was 8175, detected on 7 August (larger than the above-mentioned value of 8282, detected on 4 August 2012 in Sakha). The second peak of HS was 6661, on 2 August.
3.3. Weather Conditions during the Active Fire Period in the HFA
3.3.1. Large Meandering of Westerlies at Upper Air Level (500 hPa)
3.3.2. High-Pressure Systems over Sakha at Upper Air Level (500 hPa)
3.3.3. Warm Air Mass at Lower Air Level (925 hPa)
3.3.4. Weather Map at Lower Air Level (925 hPa)
3.3.5. Wind Velocity at Lower Air Level (925 hPa) and Hotspot (Fire)
3.3.6. Strong Wind Area in u- and v-Wind Map
4. Discussion
- A temperature map at the lower air level (925 hPa) is used to watch warm air mass (cTe) movement from the south (see Figure 6). cTe over Sakha is one of the essential active conditions;
- In addition to the above weather maps, u- and v-wind maps at the lower air level (925 hPa) are used to display the strong wind area (see Figure 9). This wind-rating method turned out to be effective and will improve the accuracy of fire forecast in a local area such as the HFA and the second HFA in Figure 9.
- The four critical weather elements that produce extreme fire behavior are low relative humidity, strong surface wind, unstable air, and drought;
- Most periods of critical fire weather occur in transition zones between high- and low-pressure systems, both at the surface and in the upper air;
- In Alaska, the primary pattern is the breakdown of the upper ridge with a southeastern flow. This can bring gusty winds and dry lightning to the interior of Alaska after a period of hot, dry weather.
5. Conclusions
- The 2021 wildland fire in Sakha was rare and extreme. The total number of hotspots in 2021 exceeded 267,000. This is about six times the average number of fires over the last 19 years from 2002.
- The largest daily number of hotspots in 2021 was 16,226, detected on 2 August. On 7 August, about half of daily hotspots (52.6% = 8175/15,537 × 100) were detected in the highest fire density area (HFA, 62.5–65° N, 125–130° E) near Yakutsk, under strong southeasterly wind (wind velocity was about 12 m/s (43 km/h)).
- The very active fire in August 2021 was caused by large meandering westerlies due to stagnant low-pressure systems from late July in the southern part of the Valentz Sea (L5300, at around 73° N, 45° E).
- High-pressure systems at the upper air level (H5820, 63° N, 95° E) appeared around 24 July and moved to the Sakha region. Persistent high-pressure systems lasted until around 8 August. Downward flow of high-pressure systems created warm and dry conditions at the lower air level and ground surface.
- High-pressure systems at the lower air level moved from the Arctic Ocean and developed (H930, 78° N, 155° E). Strong wind conditions were made by large pressure difference over Sakha.
- Warm air masses (continental temperate (cTe)) at the low air level were stagnant over Sakha during the active fire period.
- Strong wind areas on the v- and u-wind map coincided with the location of the highest fire density area (HFA) on 7 August and the second HFA on 2 August. This simple wind analysis method is effective to find strong wind areas and will be used for future fire forecast.
Funding
Institutional Review Board Statement
Informed Consent Statement
Data Availability Statement
Acknowledgments
Conflicts of Interest
References
- Previdi, M.; Smith, K.L.; Polvani, L.M. Arctic amplification of climate change: A review of underlying mechanisms. Environ. Res. Lett. 2021, 16, 093003. [Google Scholar] [CrossRef]
- Delmotte, M.V.; Zhai, P.; Pirani, A.; Connorsv, S.L.; Péanv, C.; Berger, S.; Caud, N.; Chen, Y.; Goldfarbv, L.; Gomis, M.I.; et al. (Eds.) IPCC, 2021: Summary for Policymakers. In Climate Change 2021: The Physical Science Basis, Contribution of Working Group I to the Sixth Assessment Report of the Intergovernmental Panel on Climate Change; Cambridge University Press: Cambridge, UK, in press.
- Flannigan, M.D.; Amiro, B.D.; Logan, K.A.; Stocks, B.J.; Wotton, B.M. Forest fires and climate change in the 21st century. In Mitigation and Adaptation Strategies for Global Change; Springer: Berlin/Heidelberg, Germany, 2006; Volume 11, pp. 847–859. [Google Scholar]
- McCarty, J.L.; Aalto, J.; Paunu, V.-V.; Arnold, S.R.; Eckhardt, S.; Klimont, Z.; Fain, J.J.; Evangeliou, N.; Venäläinen, A.; Tchebakova, N.M.; et al. Reviews and syntheses: Arctic fire regimes and emissions in the 21st century. Biogeosciences 2021, 18, 5053–5083. [Google Scholar] [CrossRef]
- Gillett, N.P.; Weaver, A.J.; Zwiers, F.W.; Flannigan, M.D. Detecting the effect of climate change on Canadian forest fires. Geophys. Res. Lett. 2004, 31, 18211. [Google Scholar] [CrossRef] [Green Version]
- Duffy, P.A.; Walsh, J.E.; Graham, J.M.; Mann, D.H.; Rupp, T.S. Impacts of large scale atmospheric—Ocean variability on Alaskan fire season severity. Ecol. Appl. 2005, 15, 1317–1330. [Google Scholar] [CrossRef] [Green Version]
- Flannigan, M.D.; Logan, K.A.; Amiro, B.D.; Skinner, W.R.; Stocks, B.J. Future area burned in Canada. Clim. Chang. 2005, 72, 1–16. [Google Scholar] [CrossRef]
- IPCC. Climate change 2014: Impacts, adaptation, and vulnerability. Summaries, frequently asked questions, and cross-chapter boxes. In A Contribution of Working Group II to the Fifth Assessment Report of the Intergovernmental Panel on Climate Change; Field, C.B., Barros, V.R., Eds.; World Meteorological Organization: Geneva, Switzerland, 2014; p. 190. [Google Scholar]
- Ponomarev, E.I.; Kharuk, V.I.; Ranson, K.J. Wildfires Dynamics in Siberian Larch Forests. Forests 2016, 7, 125. [Google Scholar] [CrossRef] [Green Version]
- Conard, S.G.; Sukhinin, A.I.; Stocks, B.J.; Cahoon, D.R.; Davidenko, E.P.; Ivanova, G.A. Determining effects of area burned and fire severity on carbon cycling and emissions in Siberia. Clim. Chang. 2002, 55, 197–211. [Google Scholar] [CrossRef]
- Shvidenko, A.Z.; Schepaschenko, D.G. Climate Change and Wildfires in Russia. Contemp. Probl. Ecol. 2013, 6, 683–692. [Google Scholar] [CrossRef]
- Federal State Statistics Service. Available online: http://www.gks.ru (accessed on 29 February 2016).
- Forkel, M.; Thonicke, K.; Beer, C.; Cramer, W.; Bartalev, S.; Schmullius, C. Extreme fire events are related to previous-year surface moisture conditions in permafrost-underlain larch forests of Siberia. Environ. Res. Lett. 2012, 7, 1–9. [Google Scholar] [CrossRef]
- Kharuk, V.I.; Ranson, K.J.; Dvinskaya, M.L.; Im, S.T. Wildfires in northern Siberian larch dominated communities. Environ. Res. Lett. 2011, 6, 1–7. [Google Scholar] [CrossRef]
- Krylov, A.; McCarty, J.L.; Potapov, P.; Loboda, T.; Tyukavina, A.; Turubanova, S.; Hansen, M.C. Remote sensing estimates of stand-replacement fires in Russia, 2002–2011. Environ. Res. Lett. 2014, 9, 1–8. [Google Scholar] [CrossRef]
- Abatzoglou, J.T.; Crystal, A.K. Relative importance of weather and climate on wildfire growth in interior Alaska. Int. J. Wildland Fire 2011, 20, 479–486. [Google Scholar] [CrossRef]
- Bell, G. Special Climate Summary, April–July 2004, Hot in Alaska, Cool over Central North America, Wet in South-Central U.S. Available online: http://www.cpc.ncep.noaa.gov/products/expert_assessment/alaska.pdf (accessed on 27 October 2015).
- Wendler, G.; Conner, J.; Moore, B.; Shulski, M.; Stuefer, M. Climatology of Alaskan wildfires with special emphasis on the extreme year of 2004. Theor. Appl. Clim. 2010, 104, 459–472. [Google Scholar] [CrossRef]
- Fauria, M.; Johnson, E.A. Large-scale climatic patterns control large lightning fire occurrence in Canada and Alaska forest regions. J. Geophys. Res. Biogeosci. 2006, 111, G04008. [Google Scholar] [CrossRef] [Green Version]
- Fauria, M.; Johnson, E.A. Climate and wildfires in the North American boreal forest. Philos. Trans. R. Soc. B Biol. Sci. 2007, 363, 2315–2327. [Google Scholar] [CrossRef] [PubMed]
- Skinner, W.R.; Stocks, B.J.; Martell, D.L.; Bonsal, B.; Shabbar, A. The association between circulation anomalies in the mid-troposphere and area burned by wildland fire in Canada. Theor. Appl. Clim. 1999, 63, 89–105. [Google Scholar] [CrossRef]
- Skinner, W.R.; Flannigan, M.D.; Stocks, B.J.; Martell, D.L.; Wotton, B.M.; Todd, J.B.; Mason, J.A.; Logan, K.A.; Bosch, E.M. A 500 hPa synoptic wildland climatology for large Canadian forest fires 1959–1996. Theor. Appl. Clim. 2002, 71, 157–169. [Google Scholar] [CrossRef]
- Hayasaka, H.; Fukuda, M.; Kushida, K. Recent Large-scale Forest Fires in Boreal Forests and Climate Change—Discussion Based on Forest Fire and Weather Data in Alaska and Sakha. J. JAFSE 2007, 57, 45–51. (In Japanese) [Google Scholar]
- Hayasaka, H. Recent Vegetation Fire Incidence in Russia. Glob. Environ. Res. 2011, 15, 5–13. [Google Scholar]
- Hayasaka, H.; Tanaka, H.L.; Bieniek, P.A. Synoptic-scale fire weather conditions in Alaska. Polar Sci. 2016, 10, 217–226. [Google Scholar] [CrossRef]
- Hayasaka, H.; Yamazaki, K.; Naito, D. Weather conditions and warm air masses in southern Sakha during active wildfire periods. J. Disaster Res. 2019, 14, 641–648. [Google Scholar] [CrossRef]
- Hayasaka, H.; Yamazaki, K.; Naito, D. Weather Conditions and Warm Air Masses during Active Fire-periods in Boreal Forests. Polar Sci. 2019, 22, 100472. [Google Scholar] [CrossRef]
- Hayasaka, H.; Sokolova, G.V.; Ostroukhov, A.; Naito, D. Classification of Active Fires and Weather Conditions in the Lower Amur River Basin. Remote Sens. 2020, 12, 3204. [Google Scholar] [CrossRef]
- Shahgedanova, M. Climate at present and in the historical past. In The Physical Geography of Northern Eurasia; Oxford University Press: Oxford, UK, 2003; pp. 70–102. Available online: http://www.rusnature.info/geo/03_2.htm (accessed on 25 November 2021).
- Kalnay, E.; Kanamitsu, M.; Kistler, R.; Collins, W.; Deaven, D.; Gandin, L.; Iredell, M.; Saha, S.; White, G.; Woollen, J.; et al. The NCEP/NCAR 40-year reanalysis project. Bull. Am. Meteorol. Soc. 1996, 77, 437–470. [Google Scholar] [CrossRef] [Green Version]
- Carbon Brief, Jet Stream: Is Climate Change Causing More ‘Blocking’ Weather Events? Available online: https://www.carbonbrief.org/jet-stream-is-climate-change-causing-more-blocking-weather-events (accessed on 8 October 2021).
- Reigate Grammar School Weather Station, HIGH Pressure: Windy Round the Edges, a Bit on Super-Geostrophic Winds. Available online: https://rgsweather.com/2015/02/09/high-pressure-windy-round-the-edges-a-bit-on-super-geostrophic-winds/ (accessed on 8 October 2021).


| East Longitude 110–140° E | |||||||
|---|---|---|---|---|---|---|---|
| 110– | 115– | 120– | 125– | 130– | 135– | ||
| North Latitude 57.5–72.5° N | 70– | 18 | 39 | 4 | 0 | 19 | 0 |
| 67.5– | 47 | 0 | 29 | 66 | 136 | 212 | |
| 65– | 191 | 11,766 | 17,286 | 5938 | 945 | 493 | |
| 62.5– | 16,702 | 31,861 2 | 11,339 | 65,102 1 | 11,900 | 3923 | |
| 60– | 7101 | 4292 | 23,876 | 27,813 | 11,324 | 8358 | |
| 57.5– | 328 | 1313 | 1044 | 476 | 2439 | 1296 | |
Publisher’s Note: MDPI stays neutral with regard to jurisdictional claims in published maps and institutional affiliations. |
© 2021 by the author. Licensee MDPI, Basel, Switzerland. This article is an open access article distributed under the terms and conditions of the Creative Commons Attribution (CC BY) license (https://creativecommons.org/licenses/by/4.0/).
Share and Cite
Hayasaka, H. Rare and Extreme Wildland Fire in Sakha in 2021. Atmosphere 2021, 12, 1572. https://doi.org/10.3390/atmos12121572
Hayasaka H. Rare and Extreme Wildland Fire in Sakha in 2021. Atmosphere. 2021; 12(12):1572. https://doi.org/10.3390/atmos12121572
Chicago/Turabian StyleHayasaka, Hiroshi. 2021. "Rare and Extreme Wildland Fire in Sakha in 2021" Atmosphere 12, no. 12: 1572. https://doi.org/10.3390/atmos12121572
APA StyleHayasaka, H. (2021). Rare and Extreme Wildland Fire in Sakha in 2021. Atmosphere, 12(12), 1572. https://doi.org/10.3390/atmos12121572