Article

Changes of Extreme Precipitation and Possible Influence of ENSO Events in a Humid Basin in China

1
School of Geographical Sciences, Southwest University, Chongqing 400715, China
2
State Key Laboratory of Simulation and Regulation of Water Cycle in River Basin, Institute of Water Resources and Hydropower Research, Beijing 100038, China
*
Author to whom correspondence should be addressed.
Atmosphere 2021, 12(11), 1522; https://doi.org/10.3390/atmos12111522
Submission received: 27 October 2021 / Revised: 15 November 2021 / Accepted: 15 November 2021 / Published: 18 November 2021
(This article belongs to the Special Issue Meteorological Extremes in China)

Abstract

:
In this study, 11 extreme precipitation indices were selected to examine the spatiotemporal variation of extreme precipitation in the Poyang Lake Basin during 1960–2017. The responses of extreme precipitation indices to El Nino/Southern Oscillation (ENSO) events of different Pacific Ocean areas were further investigated. The results show that the temperature in the Poyang Lake Basin has increased significantly since the 1990s, and the inter-decadal precipitation fluctuated. Most extreme precipitation indices showed an increasing trend with abrupt changes occurring around 1991. Spatially, most of the extreme precipitation indices decreased from northeast to southwest. The increasing trend of most indices in the center and south of the basin was relatively prominent. The linear correlations between the extreme precipitation indices and Nino 1 + 2 were the most significant. On the timescale of 2–6 years, a common oscillation period between the extreme precipitation of the basin and the four ENSO indices can be observed. After 2010, the positive correlation between the precipitation of the Poyang Lake Basin and the SST (sea surface temperature) anomalies in the equatorial Pacific increased significantly. Additionally, annual total wet–day precipitation in most areas of the Poyang Lake Basin increased with varying degrees in warm ENSO years. The results of this study will improve the understanding of the complex background and driving mechanism of flood disasters in the Poyang Lake Basin.

1. Introduction

The 5th IPCC (Intergovernmental Panel on Climate Change) Assessment Report indicates that the global mean surface temperature increased by about 0.85 °C from 1880–2012, which is accompanied by a general trend of extremes in precipitation events [1]. Secondary disasters such as rainstorm, flood and mudslides caused by extreme precipitation events have serious impacts on human life, social development and natural ecosystems, and have attracted extensive attention in the international community [2]. Previous studies show that extreme precipitation varied significantly in difference regions [3,4,5,6,7]. The intensity and probability of occurrence of extreme precipitation events tend to increase in most midlatitudes, as well as in the more humid tropics [1]. Currently, research on the phenomenological analysis of extreme precipitation indicators has decreased, while the investigation of the mechanism of extreme precipitation changes has gradually increased, and the modelling studies of extreme precipitation trends have become a new growth point [8,9]. In terms of the causes of extreme precipitation, the interannual variability of El Nino/Southern Oscillation (ENSO) is considered to be an important driving factor of precipitation anomalies in China [10]. ENSO generally affects precipitation in China by influencing the strength of the East Asian monsoon, and the impact of ENSO events varies at different stages [11,12,13,14]. Normally, extreme precipitation events are reduced in central China in the year of El Niño development, while the following year, extreme precipitation events are more likely to occur in eastern China [15]. The occurrence of ENSO events often causes severe climate anomalies, triggering serious meteorological and hydrological disasters around the world and causing huge social and economic losses. Therefore, strengthening the research on ENSO events and extreme precipitation is essential for regional economic and social development.
Located in the south bank of the Yangtze River, the Poyang Lake Basin has significant impact on the water security and ecological security of middle and lower reaches of Yangtze River. Annual discharge of the lake into the Yangtze River exceeds the total runoff of Yellow River, Hai River and Huai River in northern China. Affected by regional unique climatic conditions, geomorphic features and human activities, the Poyang Lake Basin is suffered from frequent flood disasters. Statistics indicates that there were four major floods that occurred in the 1990s alone: 1992, 1995, 1996 and 1998 [16]. The flood disaster in the summer of 2020 was abnormally severe, causing significant economic losses to the Poyang Lake Basin and the middle and lower reaches of Yangtze River. Thus far, many studies have analyzed the characteristics, variation trend and possible causes of extreme precipitation events in the Poyang Lake Basin. For example, Min et al. [17] examined the extreme precipitation and its relationship with largescale circulation characteristics in special years in the Poyang Lake. Liu et al. [18] analyzed the flood indicators and their relationship with climate factors in the Poyang Lake Basin. Lei et al. [19] explored the temporal–spatial and nonstationarity characteristics of extreme precipitation in the Poyang Lake Basin. Wang et al. [20] reconstructed drought and flood series in the Poyang Lake Basin in recent 550 years and analyzed their temporal–spatial variation. However, there is still lack of studies on the temporal–spatial variation of extreme precipitation in the Poyang Lake Basin and its correlation with ENSO events, which is not conducive to the understanding of the causal background of extreme precipitation and its interannual prediction.
With the promotion of the construction of China’s national “Poyang Lake Ecological Economic Zone”, it is urgent to deeply understand the complex background and generation mechanism of flood disasters in the basin. Under this context, by using the methods of trend analysis, correlation analysis and wavelet analysis, this paper attempts to systematically analyze the spatial and temporal variations of extreme precipitation in the Poyang Lake Basin under the background of global warming and explore its correlation with ENSO events. It is believed that the results of this study will provide theoretical support for regional scientific adaptation and response to extreme climate change.

2. Materials and Methods
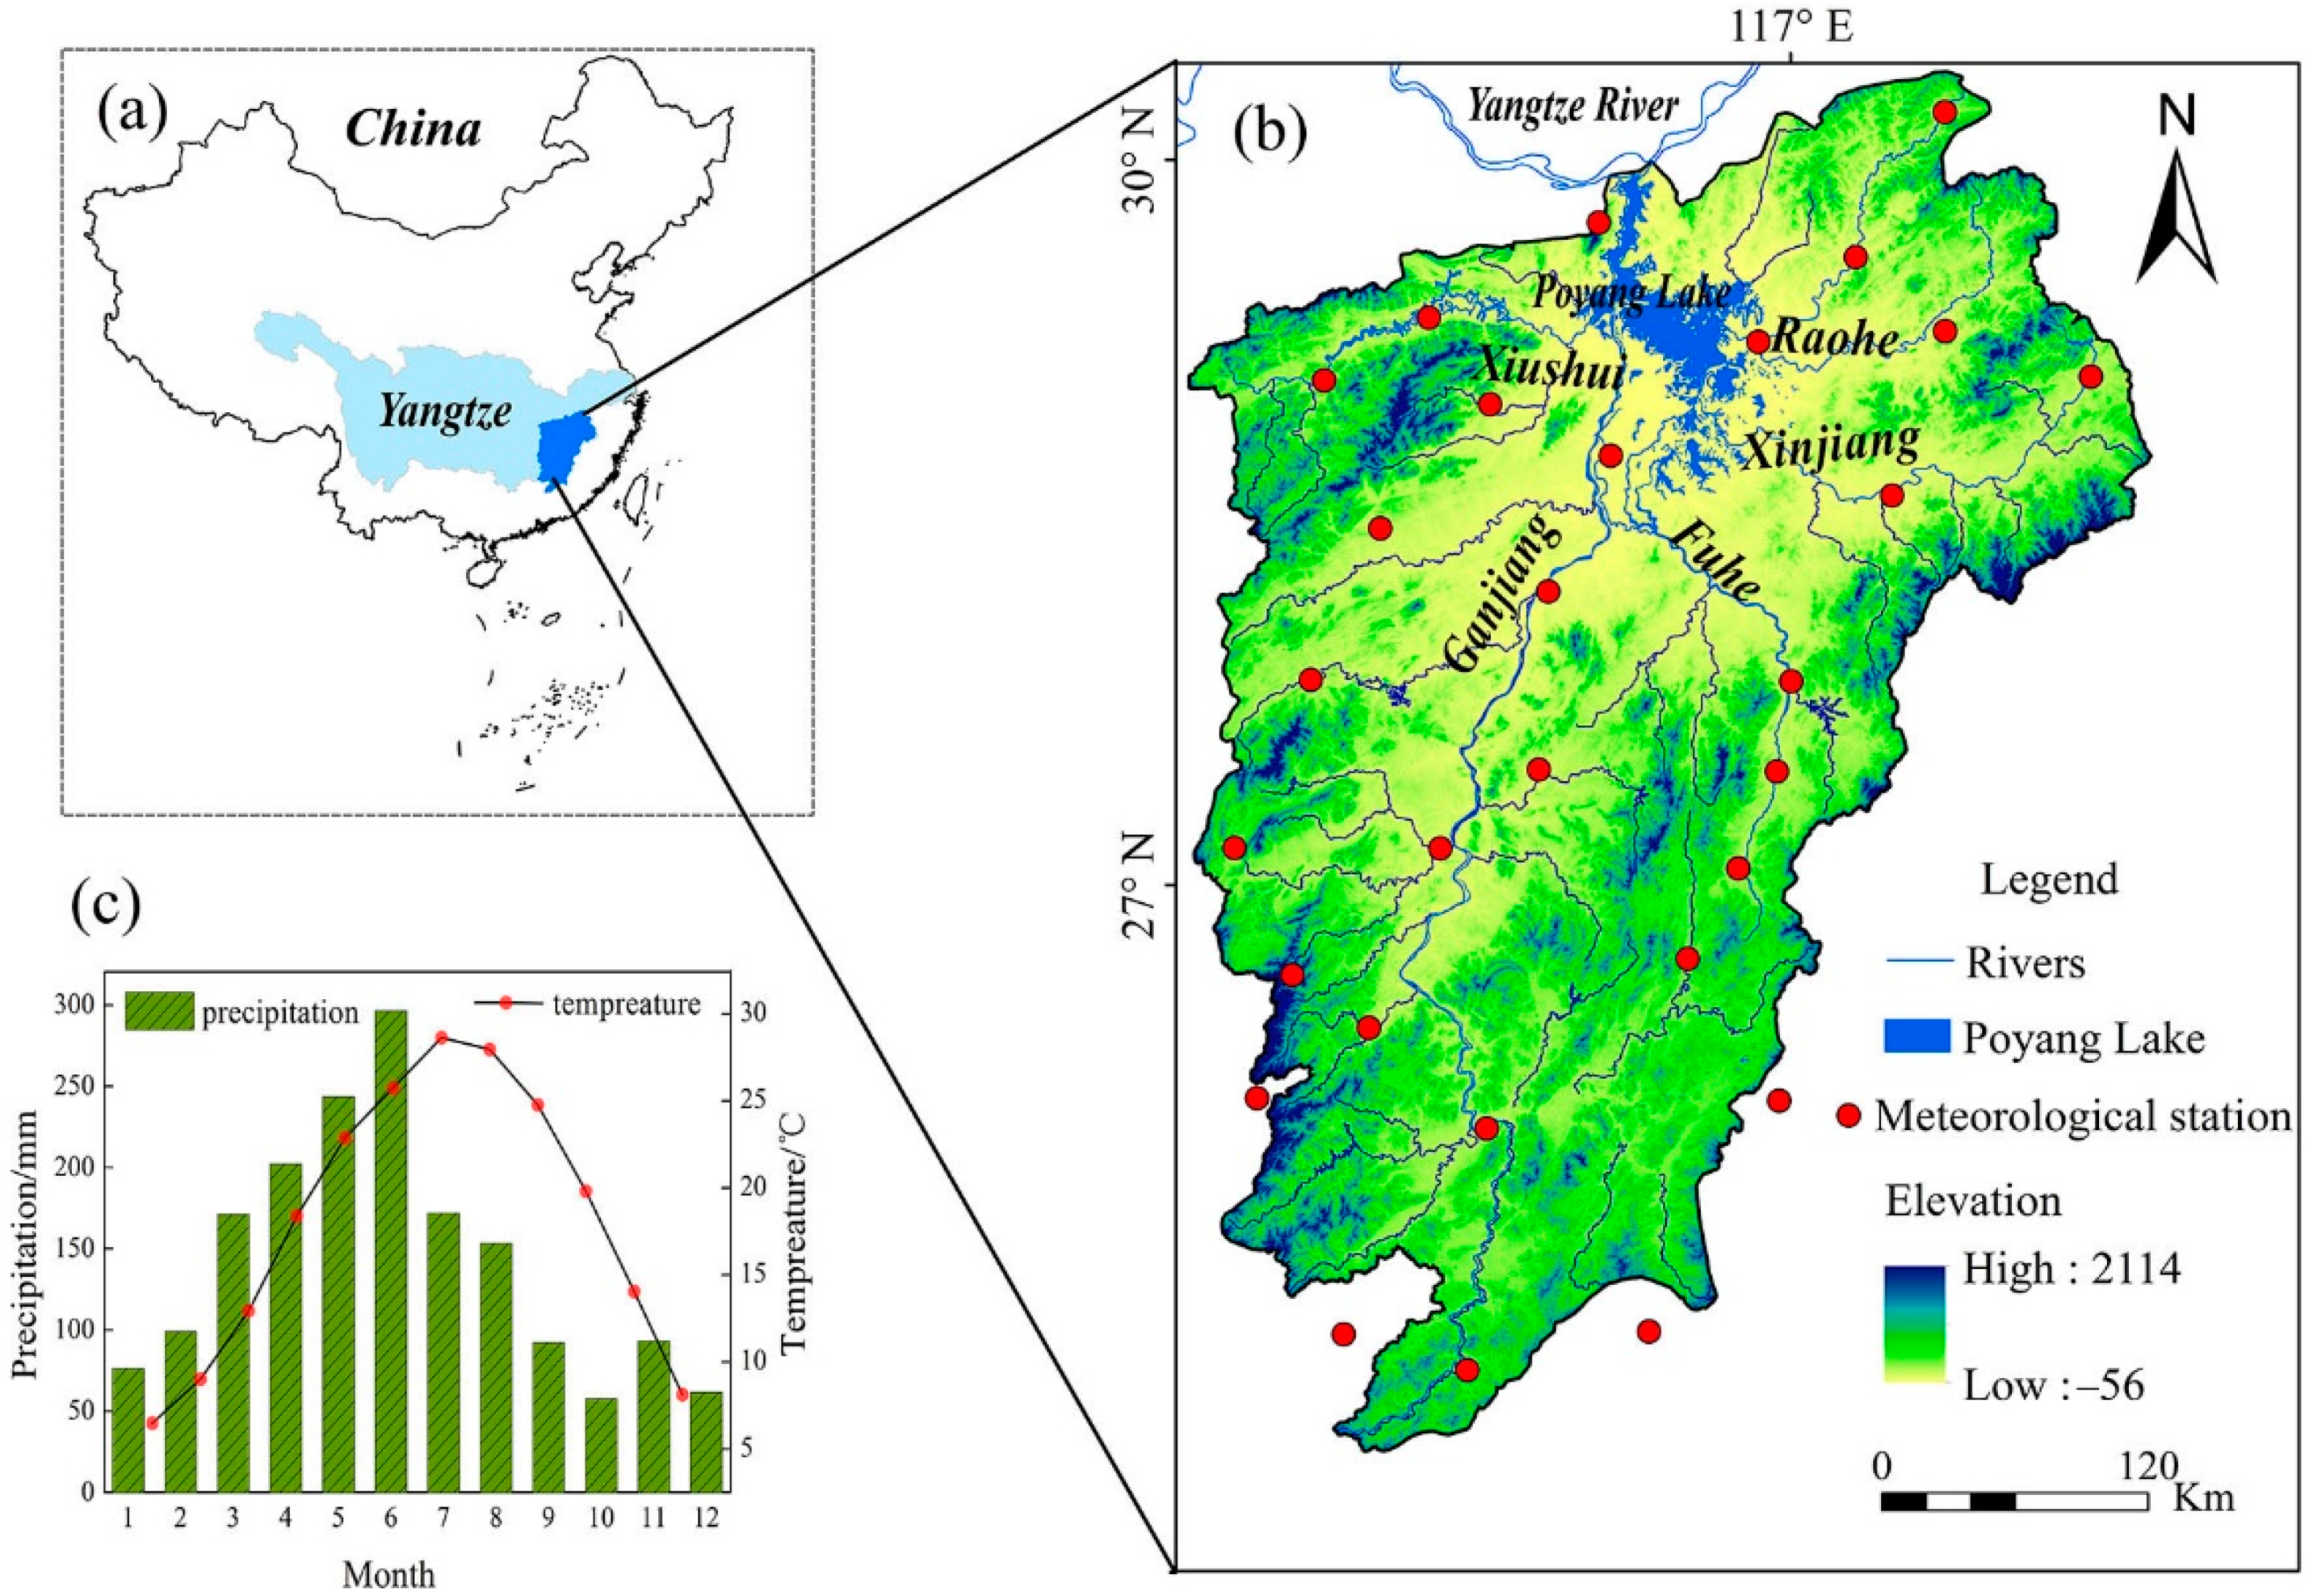
2.1. Study Area

The Poyang Lake Basin is an important sub-basin in the middle and lower reaches of the Yangtze River, covering an area of 162,000 km2 (Figure 1a). The basin is surrounded by mountains in the east, south and west, and bounded by the Yangtze River in the north. The water system in the basin is well developed, mainly including the “Five Rivers”: Ganjiang, Fuhe, Xinjiang, Raohe and Xiushui. Poyang Lake, the largest freshwater lake in China, is located in the north of the basin. The lake is an alternately filled lake in Yangtze River basin that plays an irreplaceable ecological service function in water conservation, flood regulation and storage, climate regulation, degradation of pollutants and providing habitat for organisms (Figure 1b). The “Five Rivers” receive water from the surrounding mountains that finally discharges into Yangtze River at the mouth of the lake in the north after being regulated and stored by the lake, forming a complete basin system of “mountain–river–lake”. Climatically, the Poyang Lake Basin is located in the subtropical monsoon climate zone, with annual average precipitation of 1680 mm and annual average temperature of 17.6 °C. Annual precipitation mainly concentrated in March to August, which accounts for about 70% of the year (Figure 1c). The unique geomorphic features and climatic conditions of the basin make the Poyang Lake area vulnerable to droughts and floods.

2.2. Data Sources and Processing

Meteorological data from 29 meteorological stations in and around the Poyang Lake Basin (see Figure 1) were obtained from National Climate Centre of China Meteorological Administration (CMA) (http://data.cma.cn, accessed on 23 October 2019). The data include daily maximum temperature, daily minimum temperature and precipitation data during the period of 1960–2017. All the climate variables provided by CMA had gone through a standard quality control process before delivery. Mean interpolation process was performed for some of the stations with missing measurements. The definition of extreme precipitation indices is based on the 27 extreme indices developed by the Expert Team on Climate Change and Indices (ECCI), which was established by the World Meteorological Organization (WMO) Climate Committee and other organizations [21]. In this paper, a total of 11 extreme precipitation indices in four categories were selected according to the actual precipitation situation and research needs in the study area (Table 1). The RClimDex1.0 software (developed and maintained by Xuebin Zhang and Feng Yang at the Climate Research Branch of Meteorological Service of Canada.) based on R language was used to calculate the extreme precipitation indices and establish the time series. The sea surface temperature anomaly (SSTA) indicators for Nino 1 + 2, Nino 3, Nino 3.4, and Nino 4 in the equatorial Pacific Ocean were selected to reflect ENSO events, and the data were obtained from the National Atmospheric and Oceanic Administration (http://www.cpc.ncep.noaa.gov/data/indices, accessed on 15 August 2020).

2.3. Analysis of Temporal Variability

The nonparametric Sen’s slope was applied to analyze the interannual change rate of extreme precipitation indices in the watershed [22]. The positive value of the slope indicates an increasing trend, while a negative value of slope indicates a decreasing trend. The significance of the linear trend was further estimated by the Mann–Kendall test [23]. In the Mann–Kendall method, the null hypothesis of no trend is rejected if standardized statistics |Z| ≥ 1.96 at 0.05 significance level and rejected if |Z| ≥ 2.32 at 0.01 significance level. In addition, step change of time series was detected by the combination of Mann–Kendall test and sliding t test. The accuracy of the change point was verified by testing whether there was a significant difference between the sample means of the random variables in the two groups.

2.4. Correlation Analysis

Pearson correlation coefficient was used to measure the degree of linear correlation between the two variables. The significance of the correlation was further determined by the t test. However, due to the complexity of ENSO events and extreme precipitation, the simple linear correlation cannot truly reflect the intrinsic relationship between the ENSO and extreme precipitation variables.

2.5. Wavelet Analysis

In order to reveal intrinsic connections of ENSO and extreme precipitation variables from multiple time scales and compensate for the shortcomings of simple linear correlation analysis, the signal analysis techniques of cross wavelet transform (XWT) and Wavelet coherence (WTC) [24] were applied. The ENSO event has complex time–frequency structure and multiscale periodic variation characteristics. Compared with traditional methods, XWT can more objectively and quantitatively reveal the time–frequency phase relationship between extreme precipitation indices and ENSO events.

3. Results

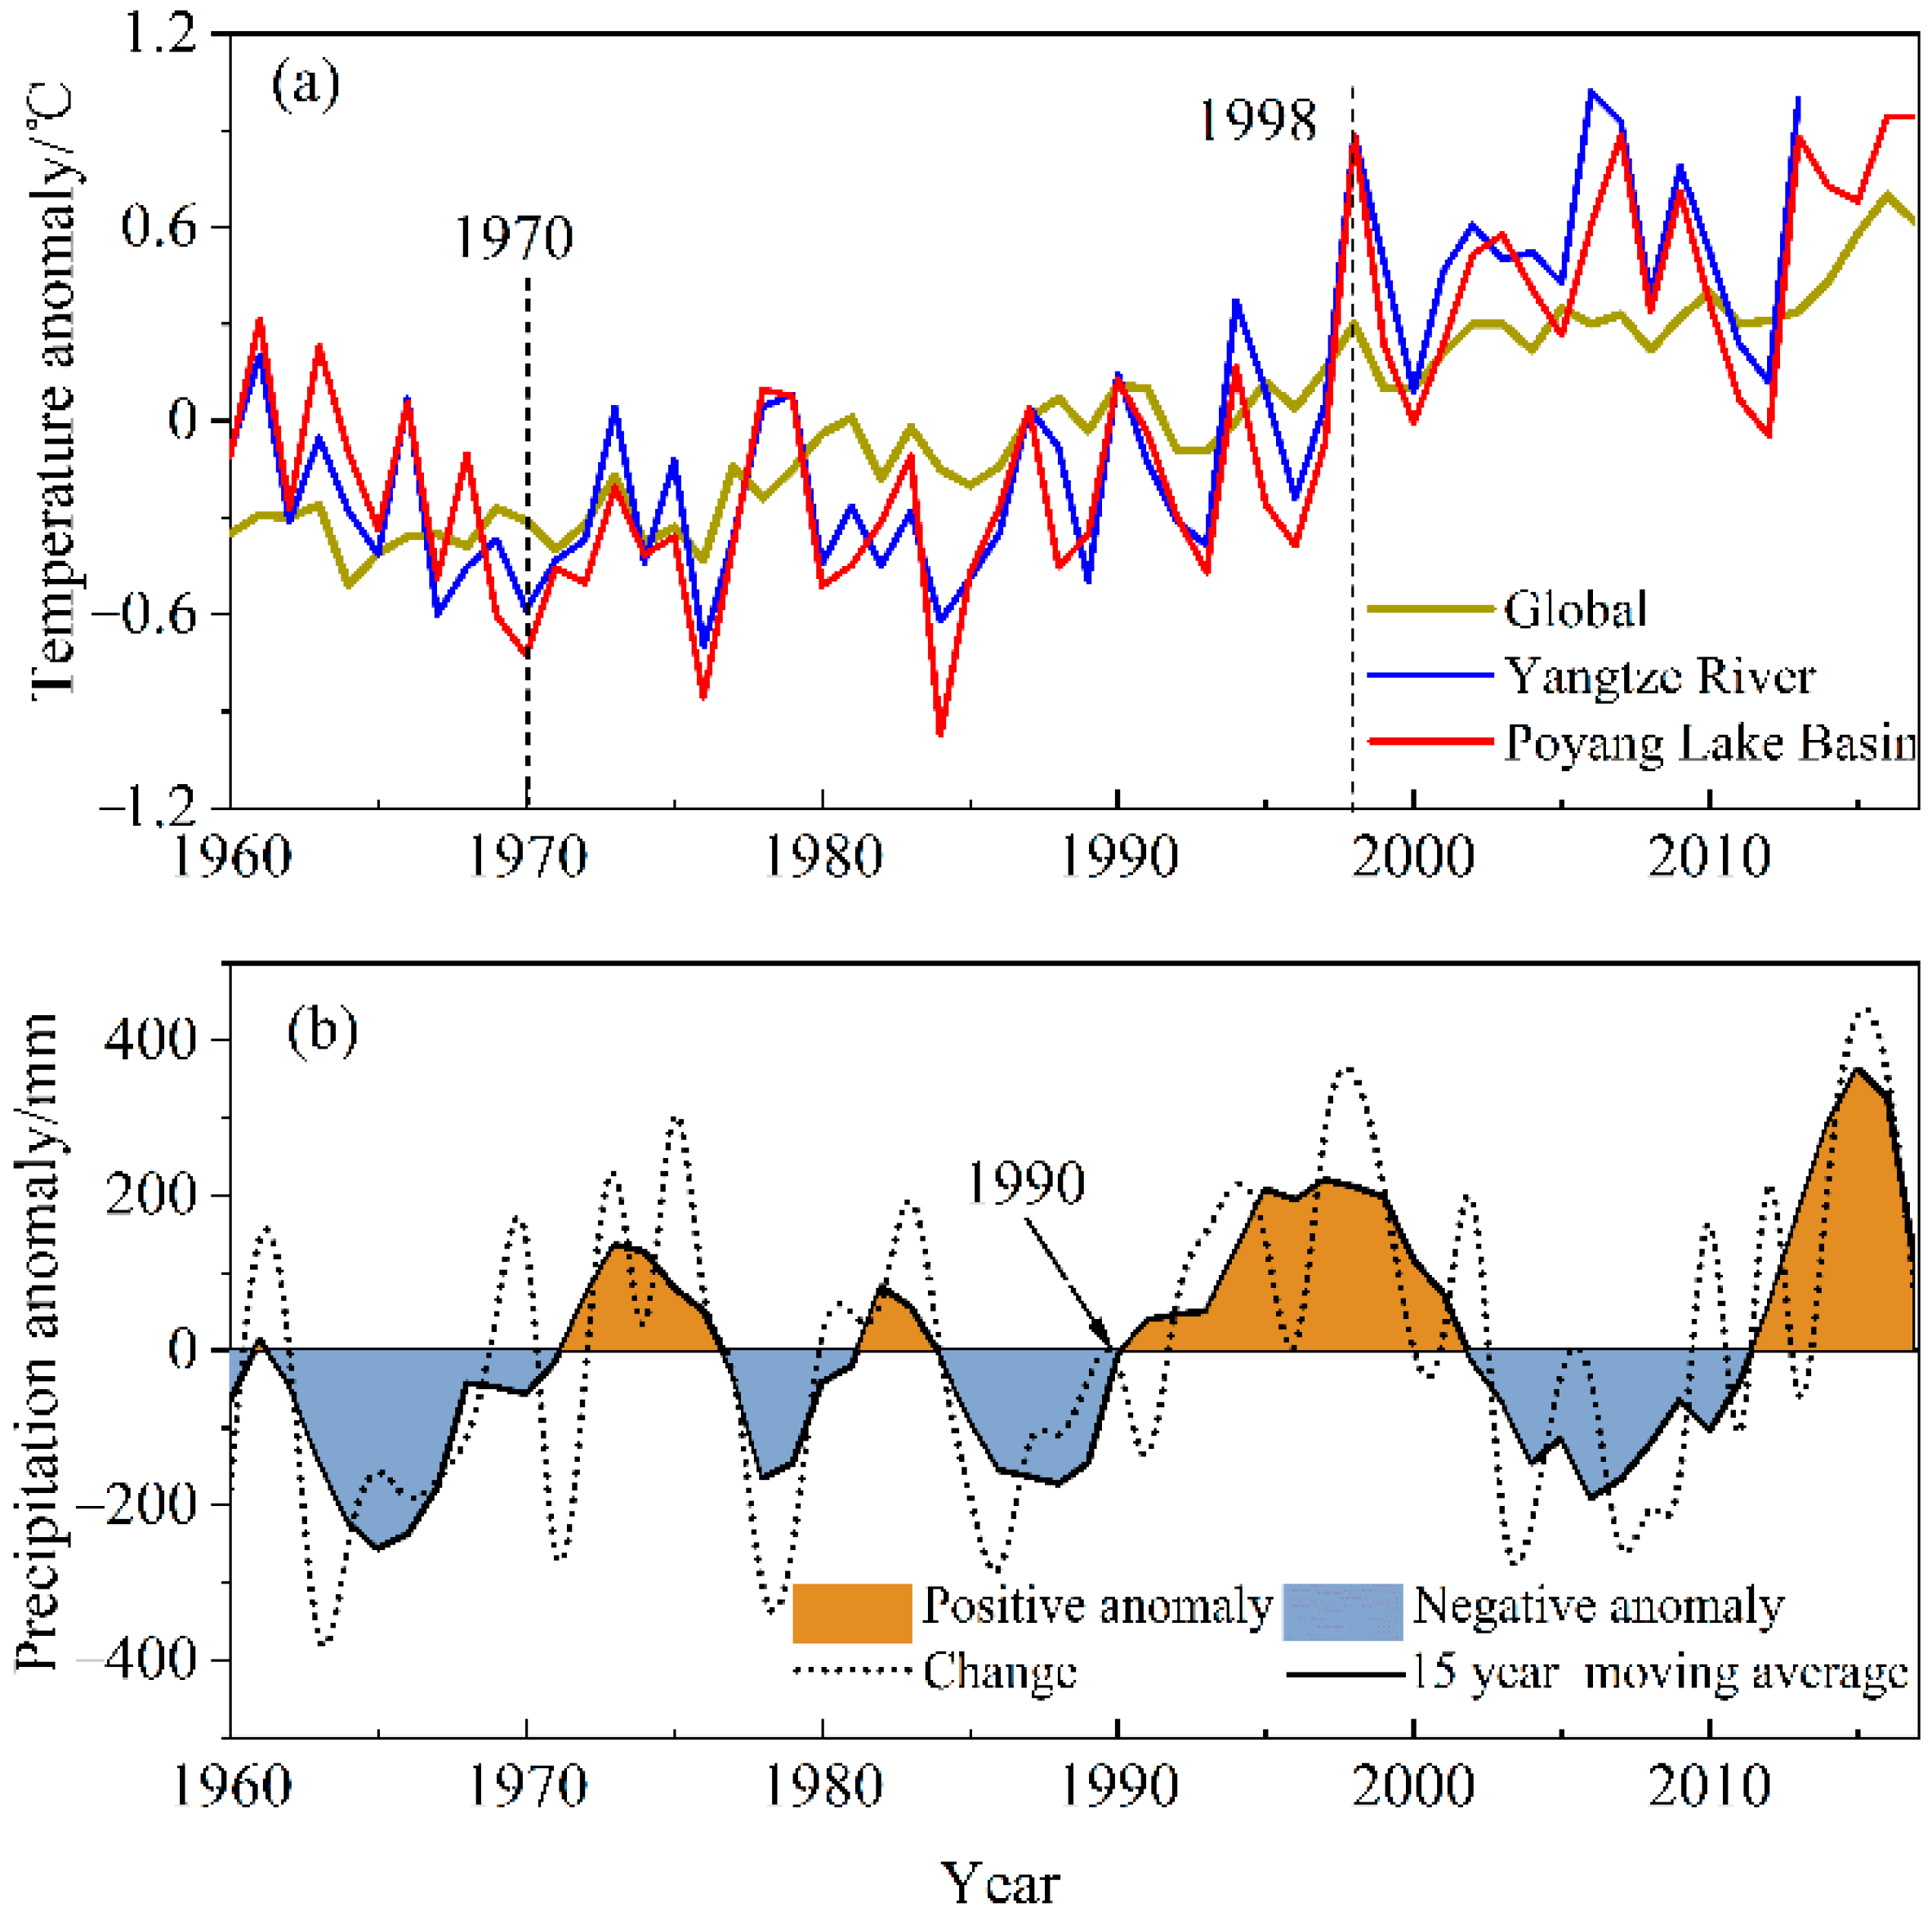
3.1. Climatic Background of Extreme Precipitation Change in the Poyang Lake Basin

The change of regional extreme precipitation is closely related to the general background of global warming. Figure 2 shows the overall background of climate change in the Poyang Lake Basin from 1960 to 2017. In terms of temperature change, it can be seen from Figure 2a that the global average temperature has shown an obvious increasing trend in the last 58 years. The change of annual mean temperature in the Poyang Lake Basin is highly consistent with that in the Yangtze River basin. Although the two curves are generally consistent with the variation of global temperature, there still exist some differences. Specifically, temperature anomaly of the three curves changed from negative to positive around 1990, indicating that the increasing trend of temperature of global and Yangtze River basin has accelerated significantly since 1990, while the increase of temperature in the Poyang Lake Basin and the Yangtze River basin is more prominent. The fluctuation of annual temperature in the Poyang Lake Basin and Yangtze River basin was remarkably larger than that of the global temperature, and there exists an obvious process of first decline and then rise. Especially during the 1960s and 1970s, the temperature of the two regions decreased greatly, while temperature increased significantly since the 1990s and was maintained at a higher level after 1998.
According to the changes of global and regional temperature, annual precipitation in the Poyang Lake Basin showed obvious interdecadal fluctuation characteristics during 1960–2017 (Figure 2b). Annual precipitation in the basin was relatively less in the 1960s and 1970s, showing an obvious negative anomaly. From the 1970s to 1990s, the annual precipitation fluctuated little in the basin, and there existed several transitions between dry and wet periods of precipitation. Since the 1990s, the fluctuation of annual precipitation has intensified, and the interdecadal variation has become more obvious. Among which, precipitation in the 1990s and 2010s was abnormally high, while in the 2000s, it was abnormally low.

3.2. Temporal Variation of Extreme Precipitation Indices

According to the four categories of extreme precipitation indices, temporal variation of extreme precipitation in the Poyang Lake Basin was analyzed from multiple perspectives. As shown in Table 2, the absolute indices of extreme precipitation represented by R10, R20 and R25 showed an increasing trend during the study time. Among which, the increasing trend of R25 was significant, and the change rate was 0.78 d/10a. Both R95p and R99p in the relative index showed a significant increasing trend, and their change rates were 26.74 and 11.90 mm/10a, respectively. The result of site ratio further indicates the increasing trend observed in most areas of the Poyang Lake Basin. The continuity index represented by CWD and CDD showed a slight decreasing trend with a change rate of −0.10 and −0.06 d/10a, while PRCPTOT showed an increasing trend. The intensity indices of extreme precipitation changed significantly, and all passed the 0.05 significance level. Especially, the change of SDII passed the 0.01 significance level. In addition, except for CDD and CWD, the site ratio with increasing extreme precipitation indices was obviously higher than that with decreasing extreme precipitation indices in the basin. The site ratio with increasing trend of RX1day and SDII reached 100%. All the above results indicate that the increasing trend of extreme precipitation prevailed in most areas of the Poyang Lake Basin in the recent 58 years.
Most of the extreme precipitation indices in the Poyang Lake Basin show a significant change point around 1991, except for the total annual wet–day precipitation (PRCPTOT). This result indicates that the extreme precipitation in the Poyang Lake Basin has increased significantly since the earlier 1990s, which is consistent with the previous results on interdecadal variation of precipitation in the basin. Previous studies also revealed that there was more precipitation in the Poyang Lake Basin in the 1990s; the frequency and intensity of heavy rainfall increased [25], and several serious flood disasters occurred during this period.

3.3. Spatial Variation of Extreme Precipitation Indices

Figure 3 shows the spatial interpolation (ordinary kriging) of multiyear averages of the 11 extreme precipitation indices and the significance test of the change trend at each station. The specific results are described as follows:
(1)
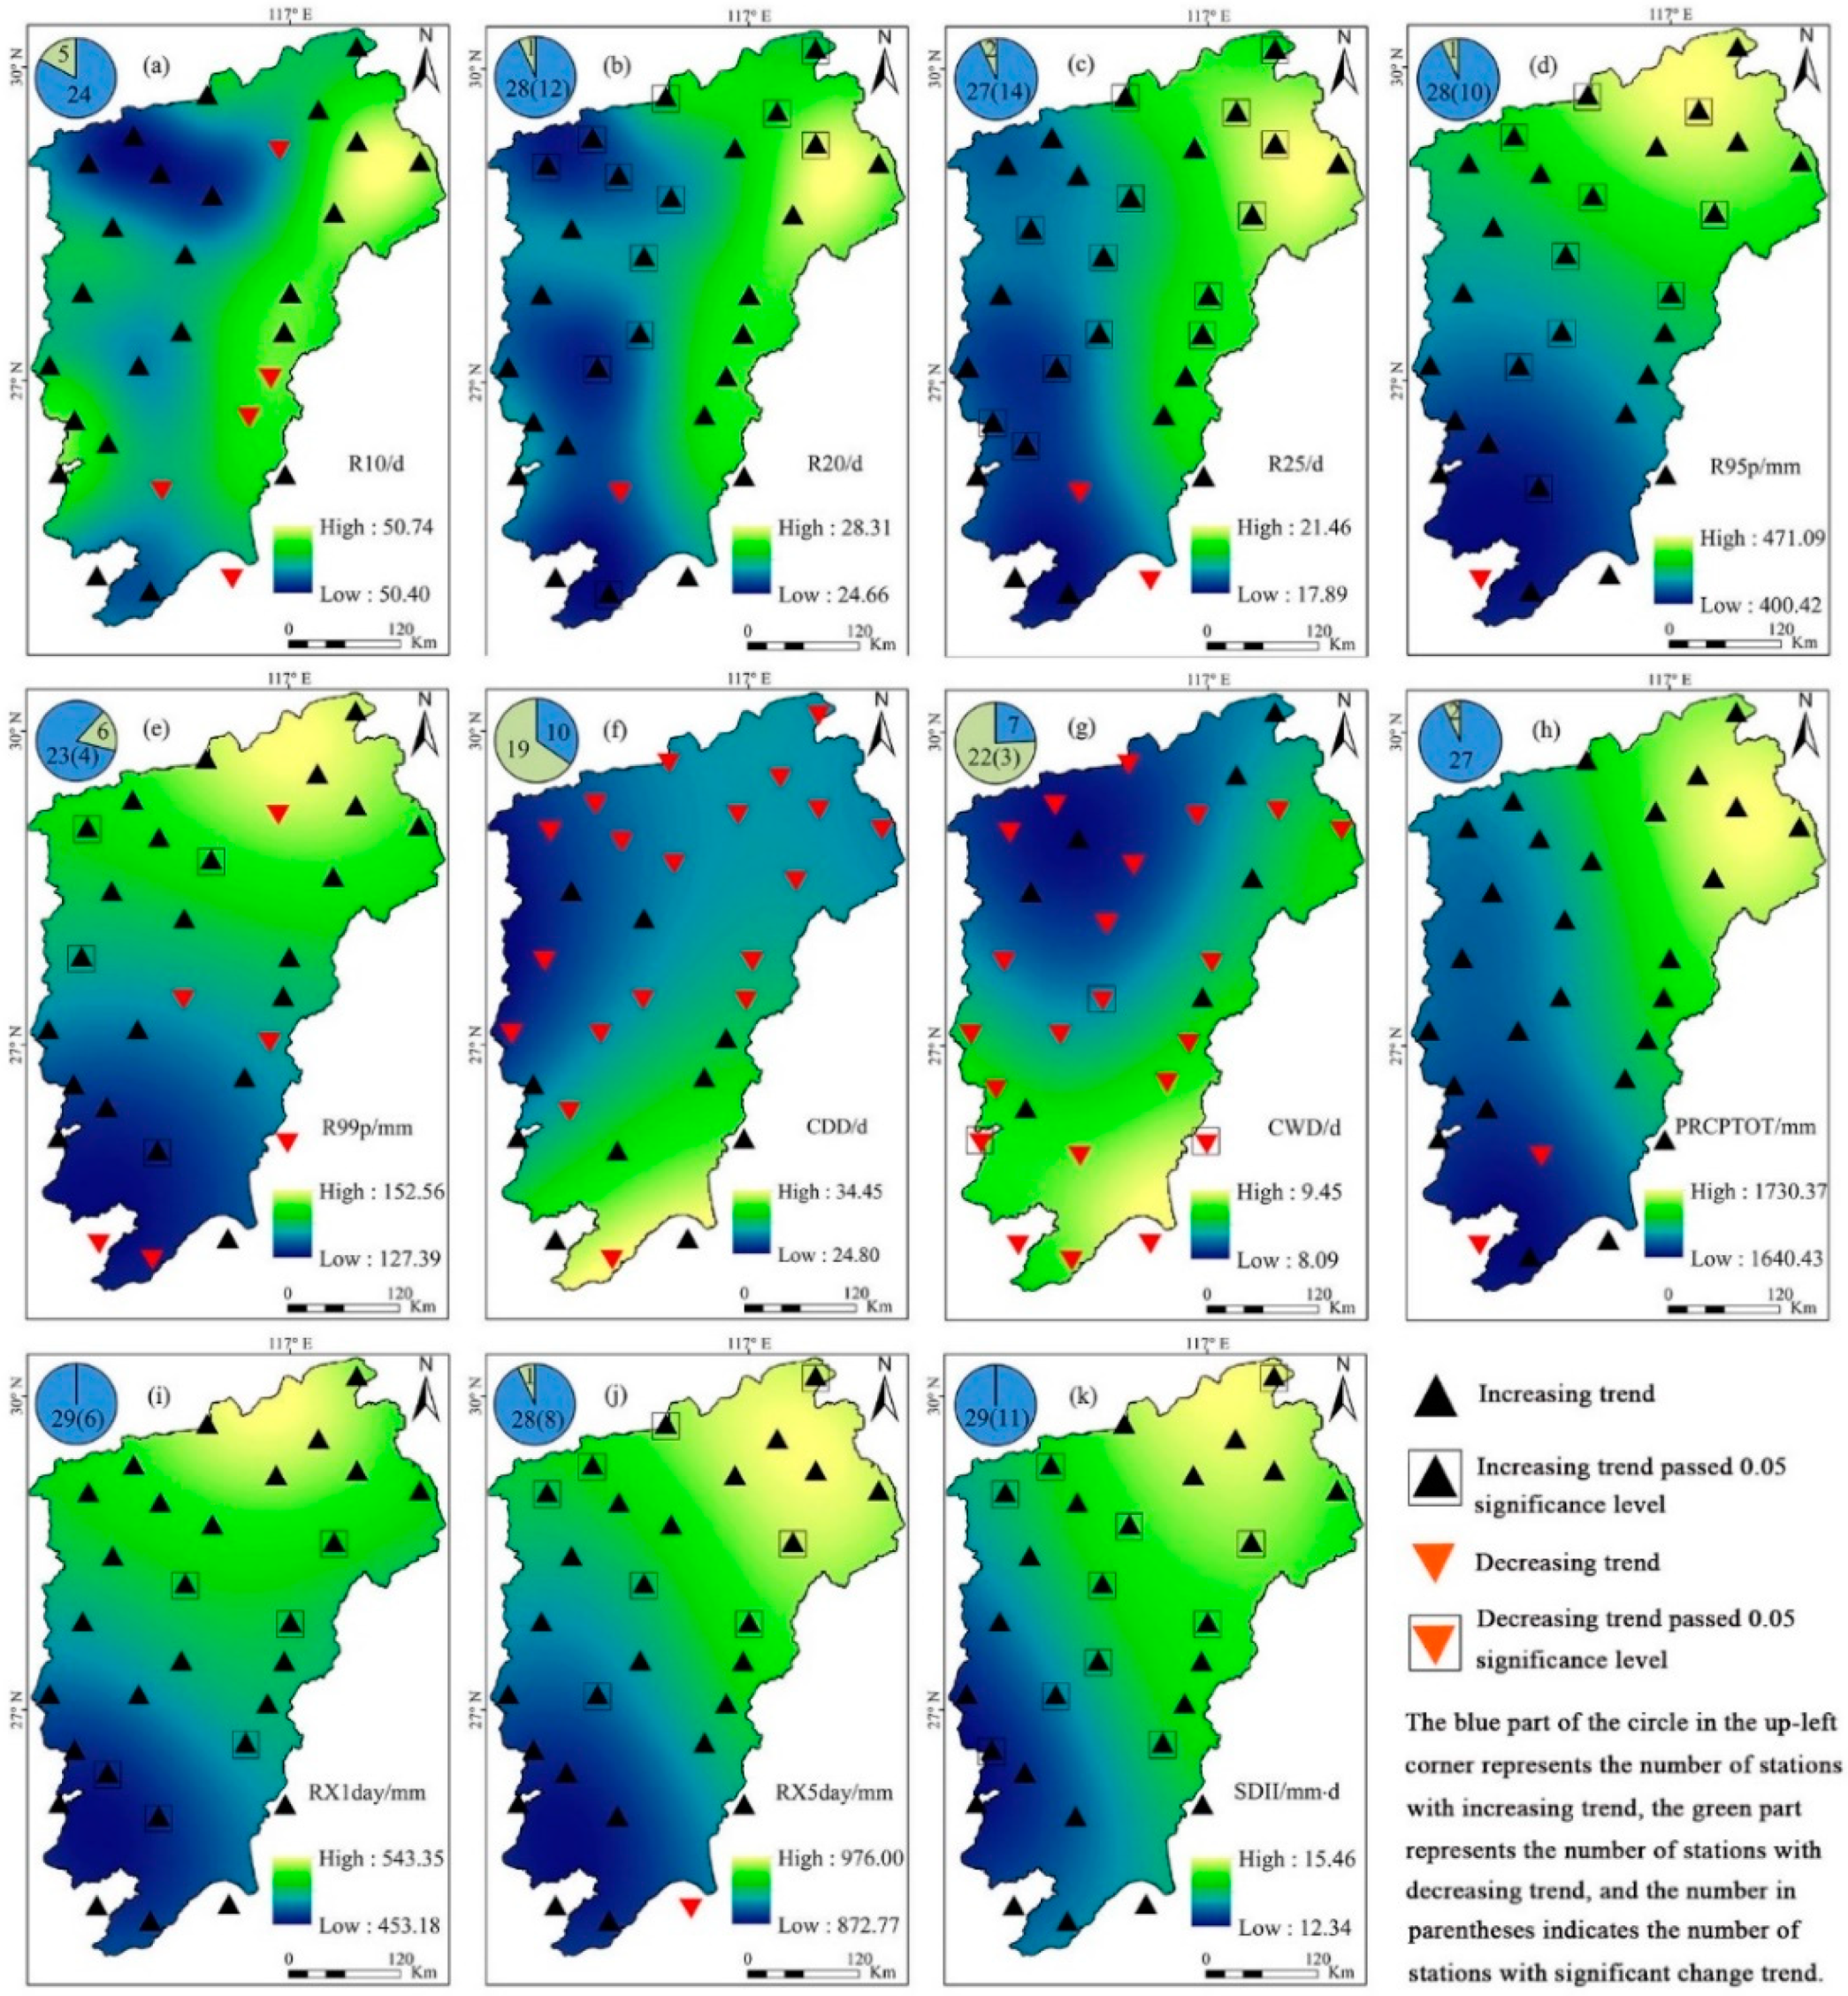
Absolute indices: the spatial distribution patterns of R10, R20 and R25 are basically the same (Figure 3a–c), which generally decrease from east to west. In contrast, the spatial distribution of R10 and R20 is more dispersed and less continuous. The low value area of R10 is mainly concentrated in the northwest of the basin, and the decreasing trend is mainly located in the southeast. The spatial continuity of R25 is good, with an increasing trend in the center and west regions and a decreasing trend in the south regions.
(2)
Relative indices: the spatial distribution patterns of R95p and R99p are well consistent, which decreases from north to south (Figure 3d–e). The high value area is concentrated in the Poyang Lake area, Raohe and its surrounding areas in the east of the basin, and the low value area is concentrated in the Ganjiang basin in the south. In terms of temporal variation, R95p showed an increasing trend in the whole basin, and the increasing trend at four stations in the east and central of the basin is significant. However, a decreasing trend can be observed for R99p in the southeast mountainous area.
(3)
Continuity indices: spatially, CDD and CWD decrease from southeast to northwest, while PRCPTOT decreases from southwest to northeast (Figure 3f–h). The change trends of CDD and CWD at each stations vary greatly in the basin. Although a decreasing trend prevailed in the basin, some stations show an increasing trend. In contrast, an increasing trend of PRCPTOT was observed in most stations.
(4)
Intensity indices: The distributions of RX1day, RX5day and SDII have good spatial consistency (Figure 3i–k), which are characterized by the decreasing feature from northeast to southwest. During the study period, all three indices showed an increasing trend in the Poyang Lake Basin, especially SDII, which increased significantly at most stations along the direction of northwest–southeast.

3.4. Impact of ENSO on Extreme Precipitation

3.4.1. Linear Correlations between Extreme Precipitation Indices and ENSO Indices

Table 3 lists the Pearson correlation coefficient matrix of each extreme precipitation index and ENSO index in the Poyang Lake Basin. Generally, in all 44 groups of the correlation, there are 40 groups that were positively correlated and the remaining four groups were negatively correlated. All extreme precipitation indices except CDD showed a positive correlation with ENSO indices (Nino 1 + 2, Nino 3, Nino 3.4 and Nino 4), indicating that the increase of sea surface temperature has an important impact on the increase of extreme precipitation in the Poyang Lake Basin. Among the four ENSO indices, the correlation between Nino 1 + 2 and the extreme precipitation indices is the most significant. The correlations for the six extreme precipitation indices (R20, R25, PRCPTOT, RX1day, RX5day, SDII) passed the 0.05 significance level, and one index (R10) passed the 0.01 significance level. This result indicates that when the sea surface temperature in Nino 1 + 2 area is abnormally high, the number of very heavy precipitation days, extreme heavy precipitation days, total annual wet–day precipitation, 1-day maximum precipitation, 5-day maximum precipitation and precipitation intensity in the Poyang Lake Basin show a relatively increasing trend.

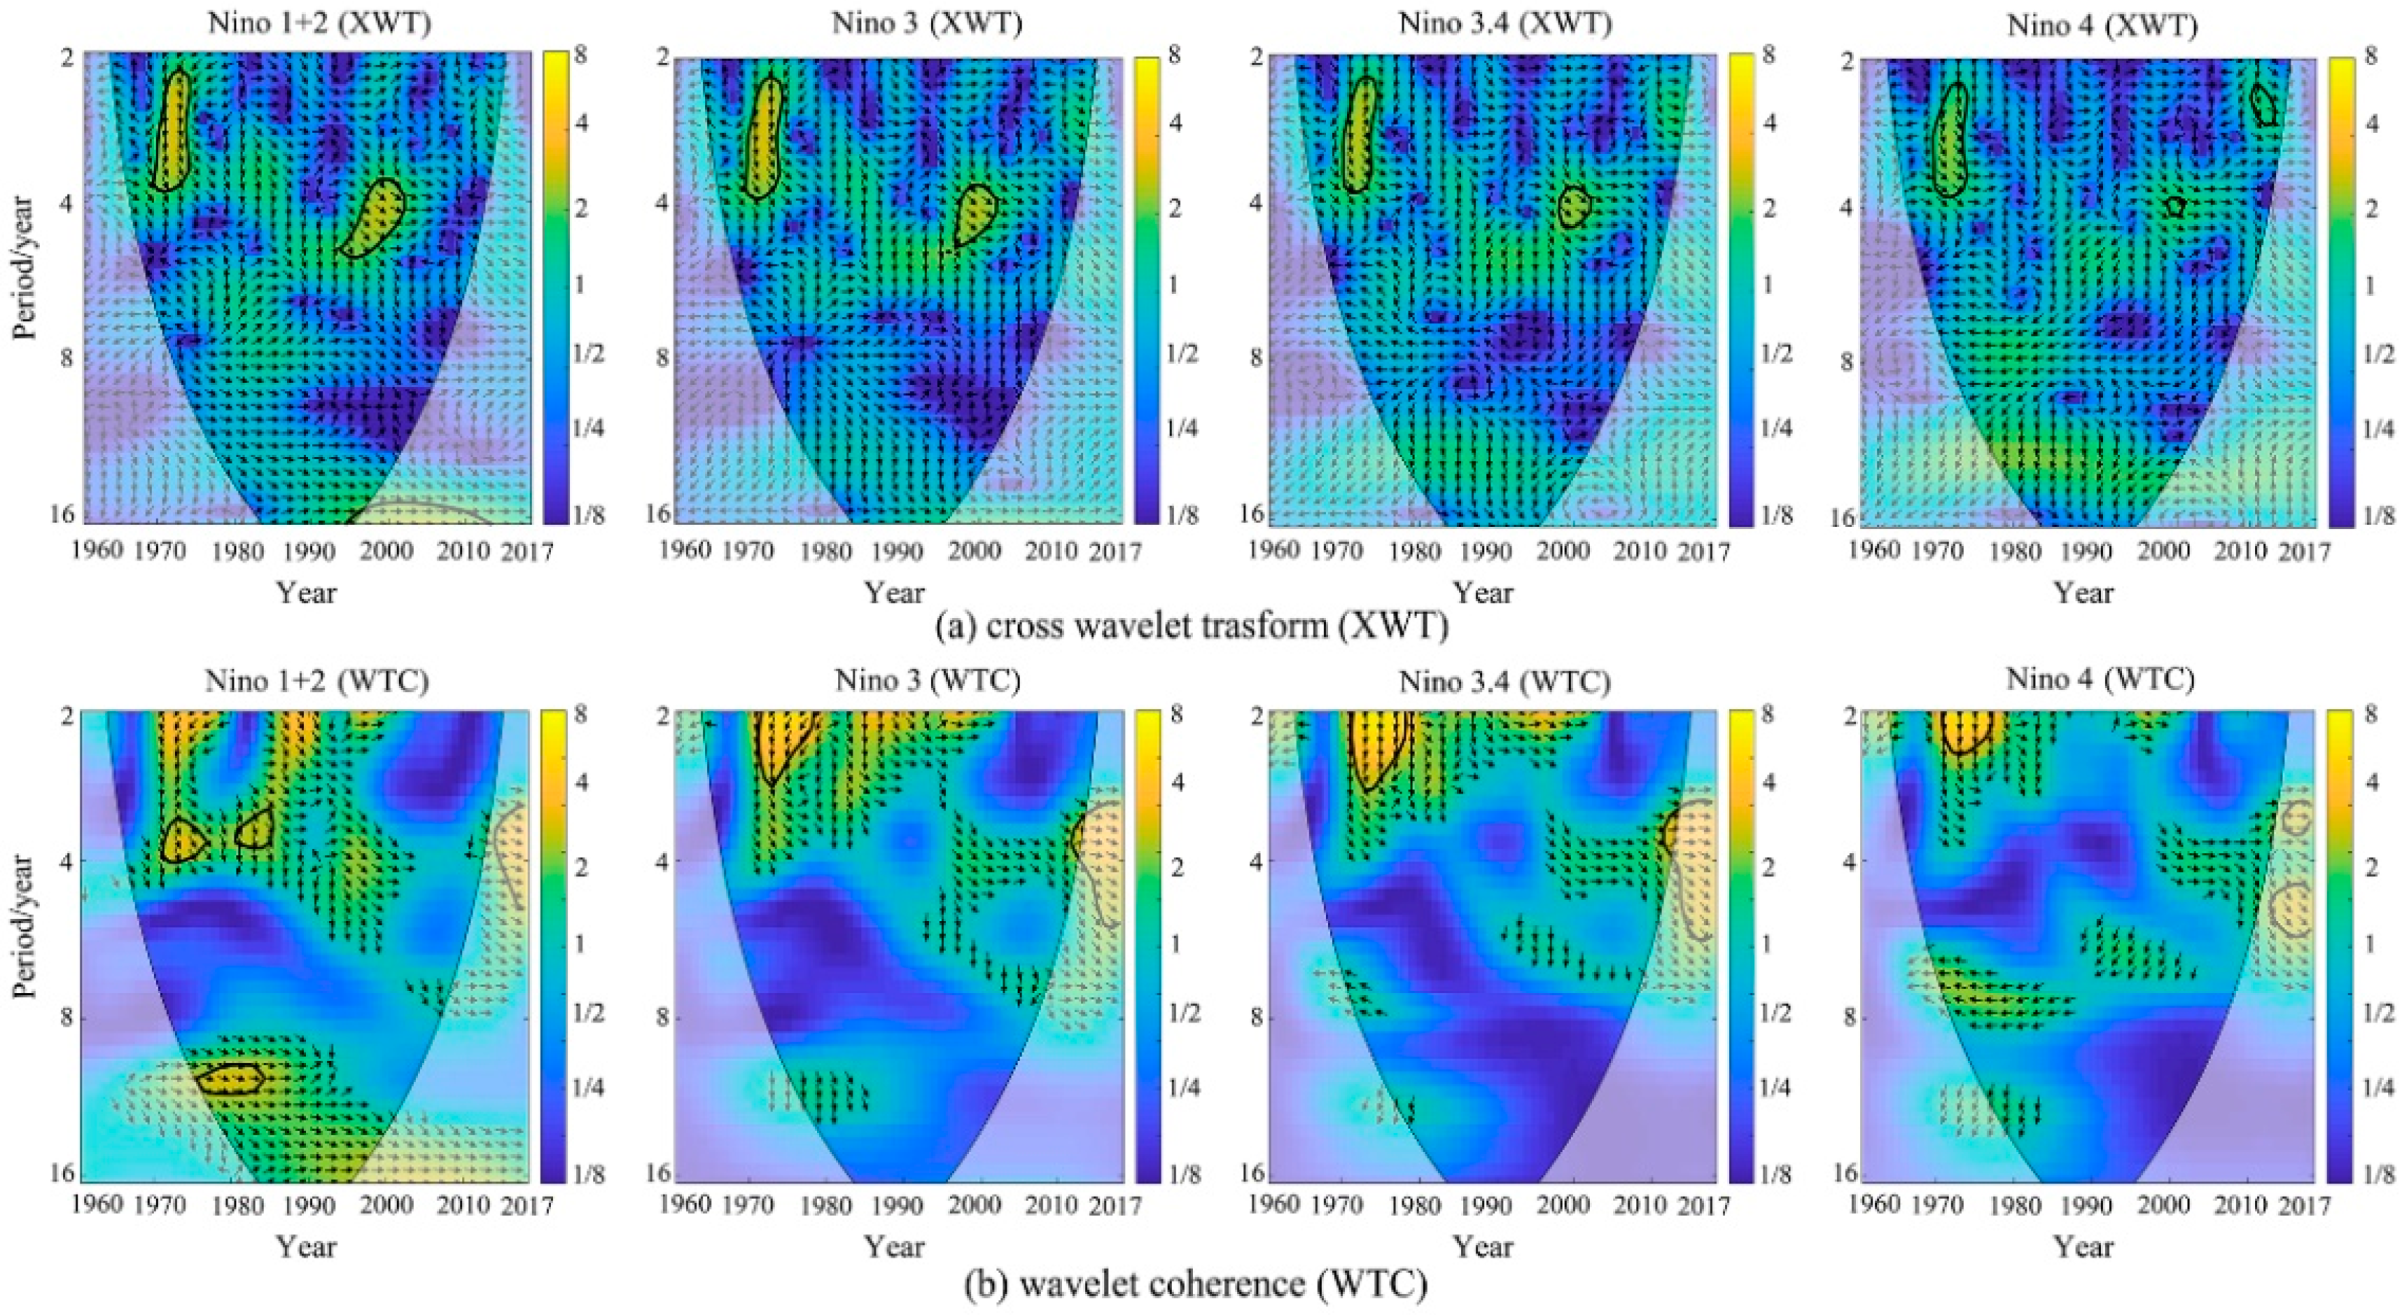
3.4.2. Multi-Timescale Correlations between Extreme Precipitation Indices and ENSO Indices

By analyzing the cross-correlations between all extreme climate indices, it is observed that the correlation coefficients between annual total wet–day precipitation (PRCPTOT) and other indices are relatively high. Therefore, PRCPTOT can be used as a typical index to reflect the interdecadal variation of extreme precipitation. On this basis, for simplicity, this section focuses on the multi timescale correlations between PRCPTOT and the four ENSO indices.
According to the method of wavelet analysis, the cross-wavelet spectrum and wavelet coherence spectrum between ENSO indices and the PRCPTOT in the Poyang Lake Basin were calculated, and the results are displayed in Figure 4. In the figure, the larger the wavelet coherence coefficient, the higher the correlation between the two variables. According to the cross-wavelet spectrum (Figure 4a), in the low frequency region, that is, on the long timescale, the PRCPTOT and ENSO indices do not have a common periodic signal, and the wavelet spectrum energy in this region is weak. On the contrary, a common strong periodic signal can be observed on the time scale of about 4 years in the high frequency region. This may be related to the interannual periodic oscillation of precipitation in the Poyang Lake Basin and sea surface temperature of equatorial Pacific Ocean. The wavelet coherent spectrum (Figure 4b) further indicates that the correlation between PRCPTOT and ENSO indices varies in different periods under different timescales. Generally, the correlation between Nino 1 + 2 and the PRCPTOT in the Poyang Lake Basin is relatively higher than that of ENSO indices, specifically: Nino 1 + 2 > Nino 3 > Nino 3.4 > Nino 4. From the perspective of periodicity, the high-energy regions of the cross-wavelet spectrum of PRCPTOT and all the four ENSO indices were observed in the 2–4 years band during 1969–1974 and 4–6 years band during 1997–2003. In comparison, the oscillation periodicity between PRCPTOT and Nino 1 + 2 and Nino 3 is stronger than that of Nino 3.4 and Nino 4. At the same time, significant areas can be observed in both of the wavelet coherence spectrum, in which the significant correlation of Nino 1 + 2 appears in the timescale of 3–6 years band during 1970–1976 and 1980–1985, and 10–12 years band during 1974–1984. The significant correlation for Nino 3, Nino 3.4 and Nino 4 appears in the timescale of 2–3 years band during 1970–1978.
In the interannual variation, there was no direct correlation between the PRCPTOT and the four ENSO indices before 1970. On the timescale of 2–3 years band, the PRCPTOT in the basin lags Nino 3, Nino 3.4 and Nino 4 by nearly 90° during 1970–1978. However, this phase relationship gradually turned positive in the following time, but the correlation weakened. This correlation almost disappeared after 2000. On the timescale of 3–6 years band, in-phase variation (positive correlation) of PRCPTOT and Nino 1 + 2 dominated during 1970–2000, and this relationship disappeared during 2000–2010. After 2010, the correlations between PRCPTOT and the four ENSO indices increased significantly, indicating that the influence of SST anomalies of the equatorial Pacific Ocean on precipitation in the Poyang Lake Basin gradually enhanced in recent years.

3.4.3. Effects of Warm and Cold ENSO Events on Extreme Precipitation

According to the years when peak warm and cold ENSO events occur, 17 years of warm ENSO events (1963, 1965, 1969, 1972, 1976, 1978, 1980, 1983, 1987, 1992, 1994, 1997, 2002, 2004, 2006, 2009 and 2015) and 11 years of cold ENSO events (1964, 1971, 1973, 1975, 1985, 1988, 1995, 2000, 2008, 2010 and 2011) can be observed during the study period (1960–2017). Similarly, the representative extreme precipitation index PRCPTOT was also selected to analyze the effects of warm and cold ENSO events on extreme precipitation in the basin. Referring to algorithm in the reference [26], the difference between the PRCPTOT of the basin in warm and cold ENSO events = (mean value of PRCPTOT during warm event years—mean value of PRCPTOT during cold event years)/mean value of PRCPTOT during cold event years. In addition, the student t test was used to examine the significance of the difference.
Figure 5 shows the spatial discrepancy of the PRCPTOT in the years of warm and cold ENSO events. It can be seen from the figure that during warm ENSO years, the annual total wet–day precipitation increases in most areas of the Poyang Lake Basin except for a smaller area in the north and south. Spatially, the increase of PRCPTOT shows the largest in the middle of the basin with a maximum value of about 15% and decreases to the north and south. In contrast, previous studies have shown that most regions along the Qinling–Huaihe River are dominated by low precipitation throughout the year when warm ENSO event occurs [10], while the magnitude of extreme precipitation in the upper reaches of the Pearl River basin increases, and the magnitude of extreme precipitation in the lower reaches and the southern edge areas decreases [26]. Statistical test shows that for each specific meteorological station in the Poyang Lake Basin, the increase of PRCPTOT in the basin is not significant during warm ENSO events.

4. Discussion

The mechanism of interdecadal variability of precipitation anomalies is complex, which is potentially related to internal and external forced fluctuations in global sea surface temperature (SST) [27]. As the strongest interaction between the global ocean and the atmosphere, the oscillation of ENSO is one of the most important influencing factors on seasonal precipitation variations in China [28]. In addition, North Atlantic Oscillation (NAO), Indian Ocean Dipole (IOD) and Pacific Decadal Oscillation (PDO) may also exert some influence [29]. The mechanisms of ENSO exert influence on extreme precipitation in China mainly through its effect on the Asian monsoon [30,31]. However, due to instability of the relation between ENSO and the Asian monsoon, the interactions among ENSO, the Asian monsoon and precipitation are quite complicated [32]. This possibly led to instability of the connection between extreme precipitation of the Yangtze River basin and the ENSO events, as revealed in this study. It is anticipated that ENSO will experience strong variations according to global warming [33], and thus the instability of the Asian monsoon system will be enhanced, which in turn will increase the heterogeneity of spatial and temporal precipitation in the Yangtze River basin. In terms of SST anomalies in different equatorial Pacific areas, Nino 1 + 2 was found to have the most important impact on extreme precipitation changes in the Poyang Lake Basin, which is worthy of attention and further study in the simulation and prediction of climate change in the future. Previous studies also revealed that the spatial distribution of seasonal precipitation in eastern China has a good teleconnection relationship with SST in the east pacific Nino 1.2 region over the same period (i.e., Nino 1 + 2) [34,35].
Interdecadal shift of regional precipitation over the eastern China during the past 100 years has been reported [35]. Under the background of global warming, extreme precipitation in the Poyang Lake Basin has shown new change characteristics since 1990s: the precipitation in the basin shows significant interdecadal fluctuation and the main extreme precipitation indices show an increasing trend. Unlike the increasing trend of other extreme precipitation indices, the continuity indices CDD and CWD showed an overall decreasing trend during the study period. To a certain extent, this result reflects the increase of precipitation randomness and precipitation intensity in the Poyang Lake Basin in recent years. According to the increasing number of heavy, very heavy and extreme heavy precipitation days (R10, R20 and R25), the continuity of extreme precipitation will be reduced. As a result, the hydrological processes in the Poyang Lake Basin have changed significantly, floods and droughts occurred frequently, and extreme climatic and hydrological events tended to increase [36,37]. Whether this trend will continue under the impact of continued regional climate change due to global warming in the future is critical to the development of rational watershed disaster risk management. Research on the time–frequency evolution of extreme precipitation in the basin are quite necessary in the future. According to the interdecadal variation of precipitation in the basin (Figure 2b), it is anticipated that the Poyang Lake Basin is currently in a humid period with large precipitation. After that (possibly > 10 years), the basin may enter a relatively dry period, and the precipitation will decrease. Such changes may also occur in extreme precipitation. In addition, the positive correlation between extreme precipitation and SST anomalies on the scale of 2–6 years should be noted in the coming period. Deeply understanding the complex background and generation mechanisms of floods in the basin is also important. Since the results of extreme precipitation analysis and prediction vary among different methods and models, how to improve the accuracy of the assessment and prediction is still the focus of relevant research.
The Poyang Lake Basin is an area with abnormal serious soil erosion in the red soil region of South China. In recent years, under the guidance of the comprehensive development strategy of “Mountain–River–Lake”, a series of ecological restoration project have been implemented, such as the projects of ecological environment construction and soil and water conservation in the headwater mountains of the basin. The forest coverage and vegetation coverage in the basin increased significantly. In addition to impact of human activities, the role of climate change is particularly prominent to the change of terrestrial vegetation. For example, Qu et al. [38] revealed that the increase of temperature and precipitation in the Yangtze River basin have a positive effect on vegetation restoration. However, it should be pointed out that extremes in precipitation may also pose potential risks to the sustainability of ecological restoration [39]. In order to ensure the ecological security and sustainable development of the Poyang Lake Basin and the middle and lower reaches of the Yangtze River, it is of great practical significance to carry out the investigation on the response of vegetation changes to extreme climate change and explore the feedback mechanism of climate change on ecological restoration under the background of increasing extreme precipitation in the Poyang Lake Basin.

5. Conclusions

The current study systematically analyzed the spatial and temporal variations of extreme precipitation in the Poyang Lake Basin, a typical humid basin in south China, and its connection with ENSO events in the past 58 years. Results show that under the background of global warming, the temperature in the Poyang Lake Basin has increased significantly since the 1990s, and the interdecadal fluctuation of precipitation is obvious. All the extreme precipitation indices except for CDD and CWD showed an increasing trend during the study period, and the proportion of increasing meteorological stations exceeded 85%. A significant change point was observed around 1991 for all the extreme precipitation indices except for R10 and CDD. Spatially, most of the extreme precipitation indices showed a decreasing trend from northeast to southwest in the basin. The interannual change trend of extreme precipitation indices varies in different regions of the basin, but most of them show a relatively prominent increasing trend in the center and south of the basin.
As an important influencing factor of extreme precipitation, the ENSO event has a certain correlation with the change of extreme precipitation in the Poyang Lake Basin. Among the four ENSO indices, the linear correlation between Nino 1 + 2 and the extreme precipitation indices is the most significant. An oscillation period of 2–6 years was observed between the extreme precipitation in the basin and the four ENSO indices. Regarding SST anomalies in the four sea zones, the in-phase variation (positive correlation) between precipitation in the basin and SST anomalies in the equatorial Pacific has increased significantly after 2010. In addition, when a warm ENSO event occurs, the annual total wet–day precipitation (PRCPTOT) increases in most areas of the basin with varying degrees.

Author Contributions

Conceptualization, X.Y. (Xuchun Ye); methodology, X.Y. (Xiaoxia Yang) and J.L.; software, X.Y. (Xuchun Ye); validation, J.W. and J.L.; formal analysis, X.Y. (Xiaoxia Yang); data curation, J.W.; writing—original draft preparation, X.Y. (Xiaoxia Yang); writing—review and editing, X.Y. (Xuchun Ye); project administration, X.Y. (Xuchun Ye); funding acquisition, X.Y. (Xuchun Ye). All authors have read and agreed to the published version of the manuscript.

Funding

This research was funded by (1) the National Natural Science Foundation of China, grant number 42071028 and 51822906; (2) the National Key Research and Development Project, grant number 2017YFC1502405.

Institutional Review Board Statement

Not applicable.

Informed Consent Statement

Not applicable.

Data Availability Statement

All data for this study are available from the corresponding author on request.

Acknowledgments

This research was jointly supported by the National Natural Science Foundation of China (42071028, 51822906) and the National Key Research and Development Project (2017YFC1502405). Cordial thanks go to two anonymous reviewers and academic editor for their valuable comments and suggestions that greatly improved the quality of this paper.

Conflicts of Interest

The authors declare no conflict of interest.

References

  1. Pachauri, R.; Reisinger, A. Climate change 2014: Synthesis report. Contribution of working groups I, II and III to the fifth assessment report of the intergovernmental panel on climate change. J. Rom. Stud. 2014, 4, 85–88. [Google Scholar]
  2. Yin, Z.E.; Tian, P.F.; Chi, X.X. Multi-scenario-based risk analysis of precipitation extremes in China during the past 60 years (1951–2011). Acta Geogr. Sin. 2018, 73, 405–413. [Google Scholar]
  3. Zhang, Z.X.; Fraedrich, K.; Jiang, T.; Zhang, J.C. Projection of future precipitation extremes in the Yangtze River Basin for 2001–2050. Adv. Clim. Chang. Res. 2007, 3, 340–344. [Google Scholar]
  4. Shi, G.X.; Liu, J.; Ma, L.; Li, C.H.; Chen, Q.; Zhang, H.M. Spatial–temporal variations of extreme precipitation events in Yangtze River Basin during 1970–2014. J. China Hydrol. 2017, 37, 77–85. [Google Scholar]
  5. Zhai, P.M.; Pan, X.H. Change in extreme temperature and precipitation over Northern China during the second half of the 20th century. Acta Geogr. Sin. 2003, 58, 1–10. [Google Scholar]
  6. Ren, G.Y.; Feng, G.L.; Yan, Z.W. Progresses in observation studies of climate extremes and changes in main–land China. Clim. Chang. Res. 2010, 15, 337–353. [Google Scholar]
  7. Li, S.S.; Kun, F.; Han, L.; Yan, J.P.; Wang, C.B.; Wu, Y.Q. Spatiotemporal variability of extreme precipitation and influencing factors on the Loess Plateau in northern Shaanxi province. Geogr. Res. 2020, 39, 140–151. [Google Scholar]
  8. Yuan, Z.; Yang, Z.; Yan, D.; Yin, J. Historical changes and future projection of extreme precipitation in China. Theor. Appl. Climatol. 2017, 127, 393–407. [Google Scholar] [CrossRef]
  9. Wang, X.; Jiang, D.; Lang, X. Extreme temperature and precipitation changes associated with four degree of global warming above pre-industrial levels. Int. J. Climatol. 2019, 39, 1822–1838. [Google Scholar] [CrossRef]
  10. Li, S.S.; Yang, S.N.; Liu, X.F. Spatiotemporal variability of extreme precipitation in north and south of the Qinling–Huaihe region and influencing factors during 1960–2013. Prog. Geogr. 2015, 34, 354–363. [Google Scholar]
  11. Zhang, Q.; Li, J.; Singh, V.P.; Xu, C.Y.; Deng, J. Influence of ENSO on precipitation in the East River basin, south China. J. Geophys. Res. Atmos. 2013, 118, 2207–2219. [Google Scholar] [CrossRef]
  12. Fu, C.B.; Teng, X.L. The relationship between China climate anomalies in summer and ENSO phenomena. J. Atmos. Sci. 1988, 12, 133–141. [Google Scholar]
  13. Zhang, R.; Sumi, A.; Kimoto, M. Impact of El Nio on the East Asian Monsoon: A Diagnostic Study of the ‘86/87 and ‘91/92 Events. J. Meteorol. Soc. Jpn. 1996, 74, 49–62. [Google Scholar] [CrossRef] [Green Version]
  14. Gong, D.; Wang, S. Impacts of ENSO on rainfall of global land and China. Chin. Sci. Bull. 1999, 44, 852–857. [Google Scholar] [CrossRef]
  15. Xiao, M.; Zhang, Q.; Singh, V.P. Spatiotemporal variations of extreme precipitation regimes during 1961–2010 and possible teleconnections with climate indices across China. Int. J. Climatol. 2017, 37, 468–479. [Google Scholar] [CrossRef]
  16. Guo, H.; Zhang, Q.; Wang, Y.J. Annual variations in climatic and hydrological processes and related flood and drought occurrences in the Poyang Lake basin. Acta Geogr. Sin. 2012, 67, 699–709. [Google Scholar]
  17. Min, S.; Liu, J. Characteristics and causes of the extreme precipitation anomaly in Lake Poyang area. J. Lake Sci. 2011, 23, 435–444. [Google Scholar]
  18. Liu, J.; Zhang, Q.; Gu, X.; Xiao, M.; Kong, D. Floods Characteristics and impacts from climate indices in the Poyang Lake basin. Sci. Geogr. Sin. 2016, 36, 1234–1242. [Google Scholar]
  19. Lei, X.; Gao, L.; Ma, M.; Dang, H.; Gao, J. Temporal–spatial and non–stationarity characteristics of extreme precipitation in the Poyang Lake basin, China. Chin. J. Appl. Ecol. 2021, 32, 3277–3287. [Google Scholar]
  20. Wang, Z.; Jia, Y.; Hong, Y.; Li, H.; Jiang, M. Spatiotemporal variation of drought and flood series in the Poyang Lake basin in recent 550 years based on EEMD and EOF analysis. Resour. Environ. Yangtze Basin 2018, 27, 919–928. [Google Scholar]
  21. Wei, F.Y. Modern Climate Statistical Diagnosis and Prediction Technology; China Meteorological Press: Beijing, China, 2007. [Google Scholar]
  22. Sen, P.K. Estimates of the Regression Coefficient Based on Kendall’s Tau. J. Am. Stat. Assoc. 1968, 63, 1379–1389. [Google Scholar] [CrossRef]
  23. Kahya, E.; Partal, T. Is seasonal precipitation decreasing or increasing in Turkey? Online J. Earth Sci. 2007, 1, 43–46. [Google Scholar]
  24. Grinsted, A.; Moore, J.C.; Jevrejeva, S. Application of the cross wavelet transform and wavelet coherence to geophysical time series. Nonlinear Proc. Geophys. 2004, 11, 561–566. [Google Scholar] [CrossRef]
  25. Zhang, Q.; Xu, C.Y.; Jiang, T.; Wu, Y. Possible influence of ENSO on annual maximum streamflow of the Yangtze River, China. J. Hydrol. 2007, 333, 265–274. [Google Scholar] [CrossRef]
  26. Zheng, J.Y.; Zhang, Q.; Shi, P.J.; Gu, X.H.; Zheng, Y.J. Spatiotemporal characteristics of extreme precipitation regimes and related driving factors in the Pearl River Basin. Sci. Geogr. Sin. 2017, 37, 283–291. [Google Scholar]
  27. Wu, S.A.; Jiang, Z.H.; Liu, Z.X. Study on the correlations between decadal variability of pacific ssta and that of rainfall in China. J. Trop. Meteorol. 2005, 21, 153–162. [Google Scholar]
  28. Wei, W.; Zhang, R.; Wen, M.; Rong, X.; Li, T. Impact of Indian summer monsoon on the South Asian High and its influence on summer rainfall over China. Clim. Dyn. 2014, 43, 1257–1269. [Google Scholar] [CrossRef]
  29. Xiao, M.; Zhang, Q.; Singh, V.P. Influences of ENSO, NAO, IOD and PDO on seasonal precipitation regimes in the Yangtze River basin, China. Int. J. Climatol. 2015, 35, 3556–3567. [Google Scholar] [CrossRef]
  30. Iii, J.K.; Miyakoda, K.; Yang, S. Recent change in the connection from the Asian monsoon to ENSO. J. Clim. 2002, 15, 1203–1215. [Google Scholar]
  31. Yin, Y.; Xu, Y.; Chen, Y. Relationship between flood/drought disasters and ENSO from 1857 to 2003 in the Taihu Lake basin, China. Quat. Int. 2009, 208, 93–101. [Google Scholar] [CrossRef]
  32. Wang, B.; Yang, J.; Zhou, T. Interdecadal changes in the major modes of Asian–Australian monsoon variability: Strengthening relationship with ENSO since the late 1970s. J. Clim. 2008, 21, 1771–1789. [Google Scholar] [CrossRef]
  33. Latif, M.; Semenov, V.A.; Park, W. Super El Niños in response to global warming in a climate model. Clim. Chang. 2015, 132, 489–500. [Google Scholar] [CrossRef] [Green Version]
  34. Chen, Y.; Zhou, R.; Wu, H. Features of the western pacific subtropical high duringthe warm and cool periods of Nino 1 + 2 area and its influence on the East Asian Monsoon. Chin. J. Atmos. Sci. 2002, 26, 373–386. [Google Scholar] [CrossRef]
  35. Zhang, W.; Qian, Y. The relationships between variations of sea surface temperature anomalies in the key ocean areas and the precipitation and surface air temperature in China. Adv. Atmos. Sci. 2001, 18, 294–308. [Google Scholar]
  36. Lǜ, J.; Ju, J.; Jiang, J. Interdecadal regime shifts of regional precipitation over eastern China during the last 100 years. Chin. J. Atmos. Sci. 2009, 33, 524–536. [Google Scholar]
  37. Ma, D.; Liu, Y.; Chen, J.; Zheng, L.; Zhang, W. Farmers’ vulnerability to flooding in the Poyang lake region. Acta Geogr. Sin. 2007, 32, 321–333. [Google Scholar]
  38. Qu, S.; Wang, L.; Lin, A.; Zhu, H.; Yuan, M. What drives the vegetation restoration in Yangtze River basin, China: Climate change or anthropogenic factors? Ecol. Indic. 2018, 90, 438–450. [Google Scholar] [CrossRef]
  39. Jiang, S.S.; Zhang, Z.X.; Wang, W.L.; Du, W.; Jin, Q. Dynamic variation rules of vegetation cover in Jiangsu Province and its response to climate change. J. Nanjing For. Univ. 2016, 40, 74–80. [Google Scholar]
Figure 1. Study area: (a) location of the Poyang Lake basin in China; (b) monthly precipitation and temperature of the basin, and (c) Topography, water system and meteorological stations distribution in the basin.
Atmosphere 12 01522 g001
Figure 2. (a) Comparison of annual mean temperature anomalies among the world, the Yangtze River basin and the Poyang Lake Basin during 1960–2017, and (b) interdecadal variation of annual precipitation anomaly in the Poyang Lake Basin.
Atmosphere 12 01522 g002
Figure 3. Spatial distribution patterns of extreme precipitation indices in the Poyang Lake Basin: (a) R10, (b) R20, (c) R25, (d)R95p, (e) R99p, (f) CDD, (g) CWD, (h) PRCPTOT, (i) RX1day, (j) RX5day, and (k) SDII.
Atmosphere 12 01522 g003
Figure 4. The time–frequency spectrum of XWT (a) and WTC (b) between annual precipitation in the Poyang Lake Basin and the four ENSO indices. The arrows indicate the relative phase difference, the right arrow indicates the same phase of change, and the left arrow indicates the opposite phase of change; the range surrounded by the thick black line indicates that the 0.05 significance test is passed; the U-shaped thin black line is the cone of influence curve (COI), the power spectrum outside this curve is not considered because of the boundary effect. The larger the wavelet coherence coefficient, the higher the correlation between the two. “→” indicates that the two are in-phase (positive correlation); “←” indicates that the two are in-phase (negative correlation); “↑” indicates that the extreme precipitation change is ahead of the sea surface temperature change. “↓” indicates that the extreme precipitation change lags the sea surface temperature change; the solid black line indicates that the correlation passes the 0.05 significance test.
Atmosphere 12 01522 g004
Figure 5. The spatial relative difference (%) of the PRCPTOT between the years of warm and cold ENSO events over the Poyang Lake Basin. Black filled circles indicate the sites where the change of PRCPTOT is not significant at 0.1 significance level.
Atmosphere 12 01522 g005
Table 1. Definition of extreme precipitation indices.
CategoryCodeNameDefinitionUnit
Absolute indexR10Number of heavy precipitation daysAnnual count of days when precipitation > = 10 mmd
R20Number of very heavy precipitation daysAnnual count of days when precipitation > = 20 mmd
R25Number of extreme heavy precipitation daysAnnual count of days when precipitation > = 25 mmd
Relative indexR95pVery wet daysAnnual total precipitation when daily precipitation > 95th percentilemm
R99pExtremely wet daysAnnual total precipitation when daily precipitation > 99th percentilemm
Continuity indexCDDConsecutive dry daysMaximum number of consecutive days with daily precipitation < 1 mmd
CWDConsecutive wet daysMaximum number of consecutive days with daily precipitation > = 1 mmd
PRCPTOTAnnual total wet–day precipitationAnnual total daily precipitation in wet daysmm
Intensity indexRX1dayMax 1-day precipitation amountMonthly maximum 1-day precipitationmm
RX5dayMax 5-day precipitation amountMonthly maximum consecutive 5-day precipitationmm
SDIISimple daily intensity indexAnnual total daily precipitation in wet daysmm/d
Table 2. Variations of extreme precipitation indices in the Poyang Lake Basin during 1960–2017.
Extreme Precipitation IndexSlopeChange PointSite Ratio/%
IncreasingDecreasing
Absolute indexR100.54 d/10a201186.21%13.79%
R200.75 d/10a1991 *96.55%3.45%
R250.78 d/10a *1991 *96.55%3.45%
Relative indexR95p26.74 mm/10a *1991 *96.55%3.45%
R99p11.90 mm/10a *1992 *86.21%13.79%
Continuity indexCDD–0.06 d /10a2014 *34.48%65.52%
CWD–0.10 d/10a1999 *24.14%75.86%
PRCPTOT0.58 mm/10a199193.10%6.09%
Intensity indexRX1day14.14 mm/10a *1992 *100%
RX5day29.13 mm/10a *1991 *96.55%3.45%
SDII0.32 (mm/d)·10a **1991 *100%
** indicates 0.01 significant level, * indicates 0.05 significant level, —Indicates no decreasing sites.
Table 3. Correlation coefficients between extreme precipitation indices and ENSO indices in the Poyang Lake Basin.
Extreme Precipitation IndexENSO Index
Nino 1 + 2Nino 3Nino 4Nino 3.4
Absolute indexR100.37 **0.31 *0.140.25
R200.33 *0.260.140.20
R250.31 *0.240.140.19
Relative indexR95p0.250.160.100.09
R99p0.170.130.150.10
Continuity indexCDD–0.02–0.04–0.07–0.07
CWD0.090.040.030.03
PRCPTOT0.33 *0.260.130.19
Intensity indexRX1day0.32 *0.27 *0.210.20
RX5day0.28 *0.220.150.16
SDII0.28 *0.220.170.15
** indicates 0.01 significance level; * indicates 0.05 significance level.
Publisher’s Note: MDPI stays neutral with regard to jurisdictional claims in published maps and institutional affiliations.

