Article

Implications of COVID-19 Restriction Measures in Urban Air Quality of Thessaloniki, Greece: A Machine Learning Approach

by
Dimitris Akritidis
1,*,
Prodromos Zanis
1,
Aristeidis K. Georgoulias
1,
Eleni Papakosta
2,
Paraskevi Tzoumaka
3 and
Apostolos Kelessis
3
1
Department of Meteorology and Climatology, School of Geology, Aristotle University of Thessaloniki, 54124 Thessaloniki, Greece
2
Department of Environment and Hydroeconomy, Directorate of Environment, Industry, Energy and Natural Resources, of the Region of Central Macedonia, 54642 Thessaloniki, Greece
3
Department of Environment of the Municipality of Thessaloniki, 54642 Thessaloniki, Greece
*
Author to whom correspondence should be addressed.
Atmosphere 2021, 12(11), 1500; https://doi.org/10.3390/atmos12111500
Submission received: 14 September 2021 / Revised: 2 November 2021 / Accepted: 10 November 2021 / Published: 14 November 2021
(This article belongs to the Special Issue Coronavirus Pandemic Shutdown Effects on Urban Air Quality)

Abstract

:
Following the rapid spread of COVID-19, a lockdown was imposed in Thessaloniki, Greece, resulting in an abrupt reduction of human activities. To unravel the impact of restrictions on the urban air quality of Thessaloniki, NO 2 and O 3 observations are compared against the business-as-usual (BAU) concentrations for the lockdown period. BAU conditions are modeled, applying the XGBoost (eXtreme Gradient Boosting) machine learning algorithm on air quality and meteorological surface measurements, and reanalysis data. A reduction in NO 2 concentrations is found during the lockdown period due to the restriction policies at both AGSOFIA and EGNATIA stations of −24.9 [−26.6, −23.2]% and −18.4 [−19.6, −17.1]%, respectively. A reverse effect is revealed for O 3 concentrations at AGSOFIA with an increase of 12.7 [10.8, 14.8]%, reflecting the reduced O 3 titration by NO x . The implications of COVID-19 lockdowns in the urban air quality of Thessaloniki are in line with the results of several recent studies for other urban areas around the world, highlighting the necessity of more sophisticated emission control strategies for urban air quality management.

1. Introduction

Severe acute respiratory syndrome coronavirus 2 (SARS-CoV-2), the virus responsible for coronavirus disease 2019 (COVID-19) [1], was first reported in Wuhan, China [2] in late December 2019. Its high contagiousness [3] and the substantial early undocumented infections [4] facilitated the rapid worldwide spread of COVID-19, which was confirmed as a pandemic by the World Health Organization (WHO) in March 2020 [5]. In the absence of vaccinations, and to control the COVID-19 outbreak, several social, working, and transportation restrictions were gradually imposed around the world [6], with the strictness and duration of the so-called “lockdowns” varying by country.
The sharp reduction in human activities, as a result of restrictions measures, resulted in a decrease of major air pollutants, such as carbon dioxide (CO 2 ) [6,7] and nitrogen dioxide (NO 2 ) [8,9]. Assessing the impact of COVID-19-associated anthropogenic emissions decline on air quality is a challenging task, as weather variability should also be considered [10], before attributing air pollutant concentration changes to COVID-19 restrictions alone. Recently, several studies have investigated the potential NO 2 and O 3 benefits ascribed to COVID-19 related emission reductions using statistical (machine learning, multivariate regression, difference-in-difference, generalized additive models) [11,12,13,14] and/or modeling [15,16,17] approaches. In particular, Keller et al. [18] and Grange et al. [11] explored the implications of COVID-19 restrictions in NO 2 and O 3 concentrations around the globe and in Europe, respectively, while other studies were performed for individual countries [17,19,20,21,22,23] and cities [24,25,26]. Overall, in urban environments, NO x reductions during the COVID-19 lockdowns were followed by O 3 increases [27,28]. Apart from reduced O 3 titration by NO x , the increasing O 3 pollution is also subject to variations of volatile organic compounds (VOC) emissions [29].
Thessaloniki, located at the northern part of Greece, is the second largest city of the country, with over one million inhabitants in its metropolitan area. In addition, the city is located within a local pollution hot spot [30]. In accordance with the national restrictions imposed during the COVID-19 outbreak, Thessaloniki’s residents strictly limited their social, working, and educational activities. In particular, and after the first confirmed COVID-19 case in Thessaloniki (first in Greece also) on 26 February 2020, the following actions were taken:
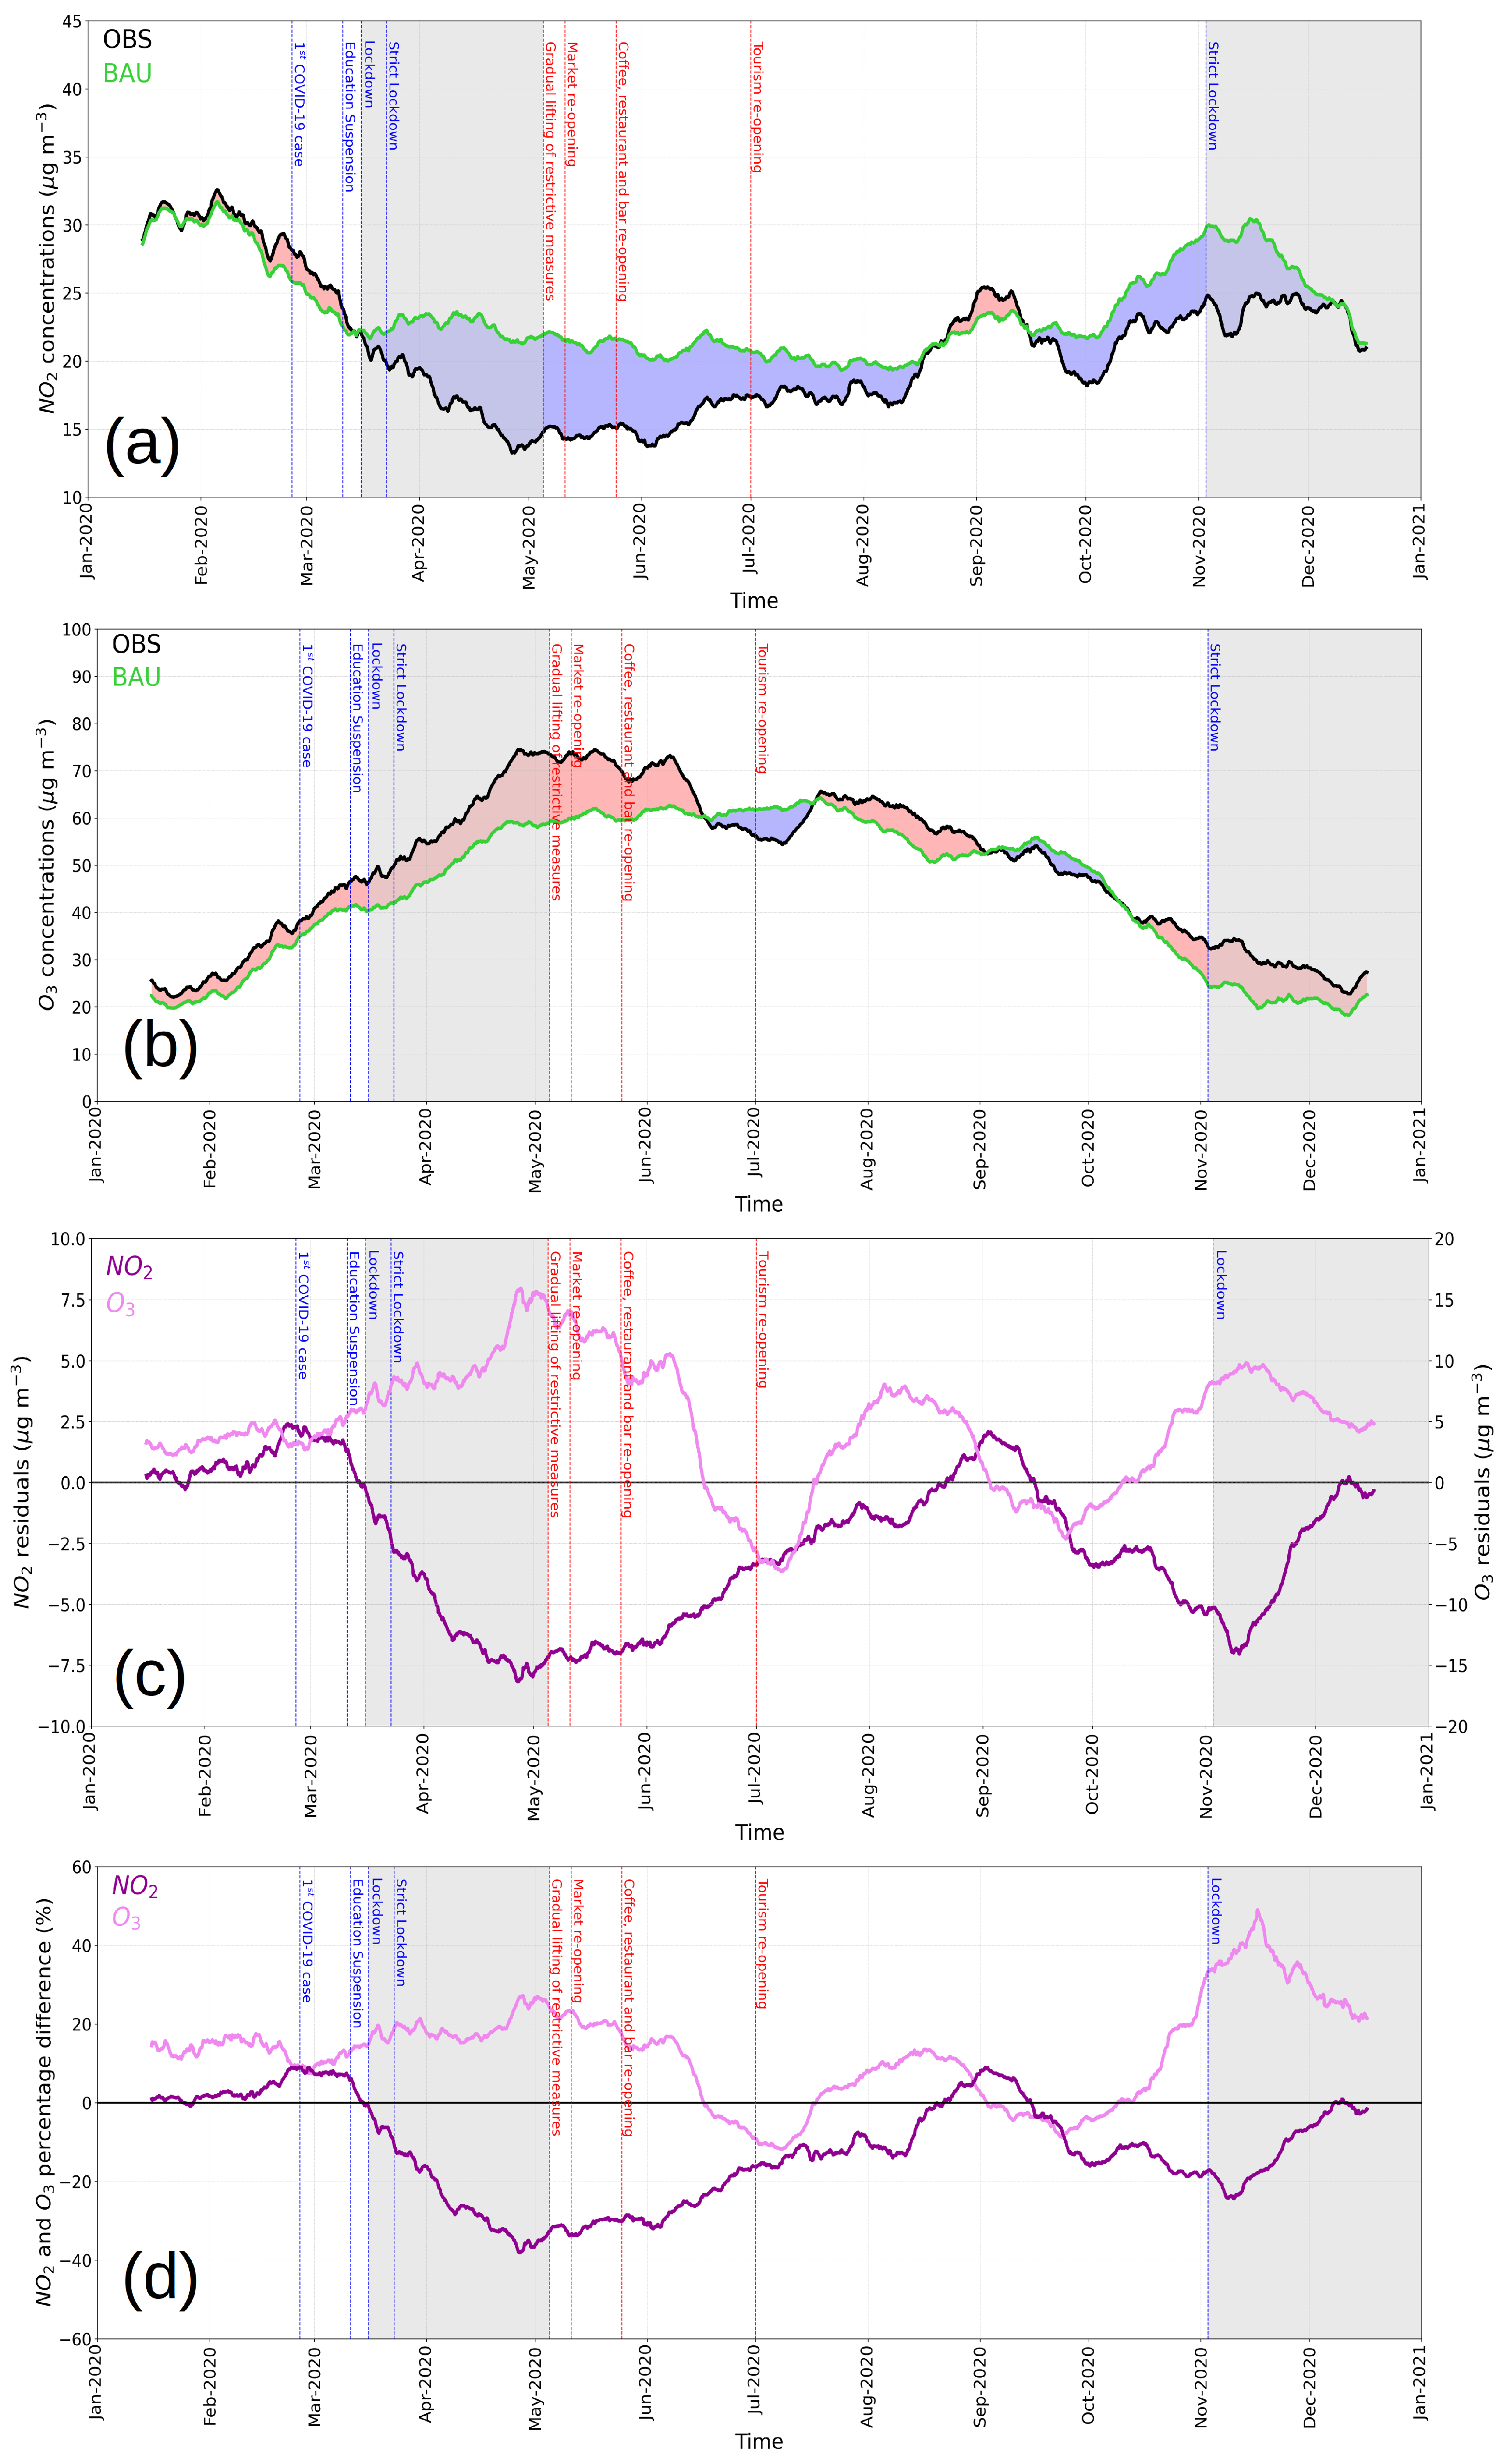
11 March 2020: the operations of educational institutions, at all levels nationwide, were suspended.
14 to 18 March 2020: coffee shops, restaurants, bars, markets, tourism services, and museums were closed, and several social activities were held.
23 March 2020: a strict lockdown was applied with significant restrictions on the movement of citizens throughout the territory.
The reverse process—in regard to the lifting of restrictions—was applied as follows:
5 May 2020: a gradual lifting of restrictions was introduced.
11 May 2020: reopening of markets.
25 May 2020: reopening of coffee shops, restaurants, and bars.
1 July 2020: reopening of tourism services.
As COVID-19 cases increased in late October 2020, and considering the available epidemiological data, the government announced a second strict lockdown in Thessaloniki, which was soon later imposed across the whole country.
The present study assesses the impacts of COVID-19 restriction policies on the urban air quality (NO 2 and O 3 ) of Thessaloniki, Greece, using NO 2 and O 3 measurements from two ground-based stations, meteorological observations from one meteorological station, high-resolution meteorological reanalysis data, and the so-called XGBoost (eXtreme Gradient Boosting) machine learning algorithm. Section 2 presents the observational and reanalysis data used in the analysis, providing also a description of the applied XGBoost algorithm and the overall methodological approach. In Section 3, the main results are presented and discussed, in regard to recent research findings. Finally, Section 4 summarizes the key findings of the study.

2. Materials and Methods

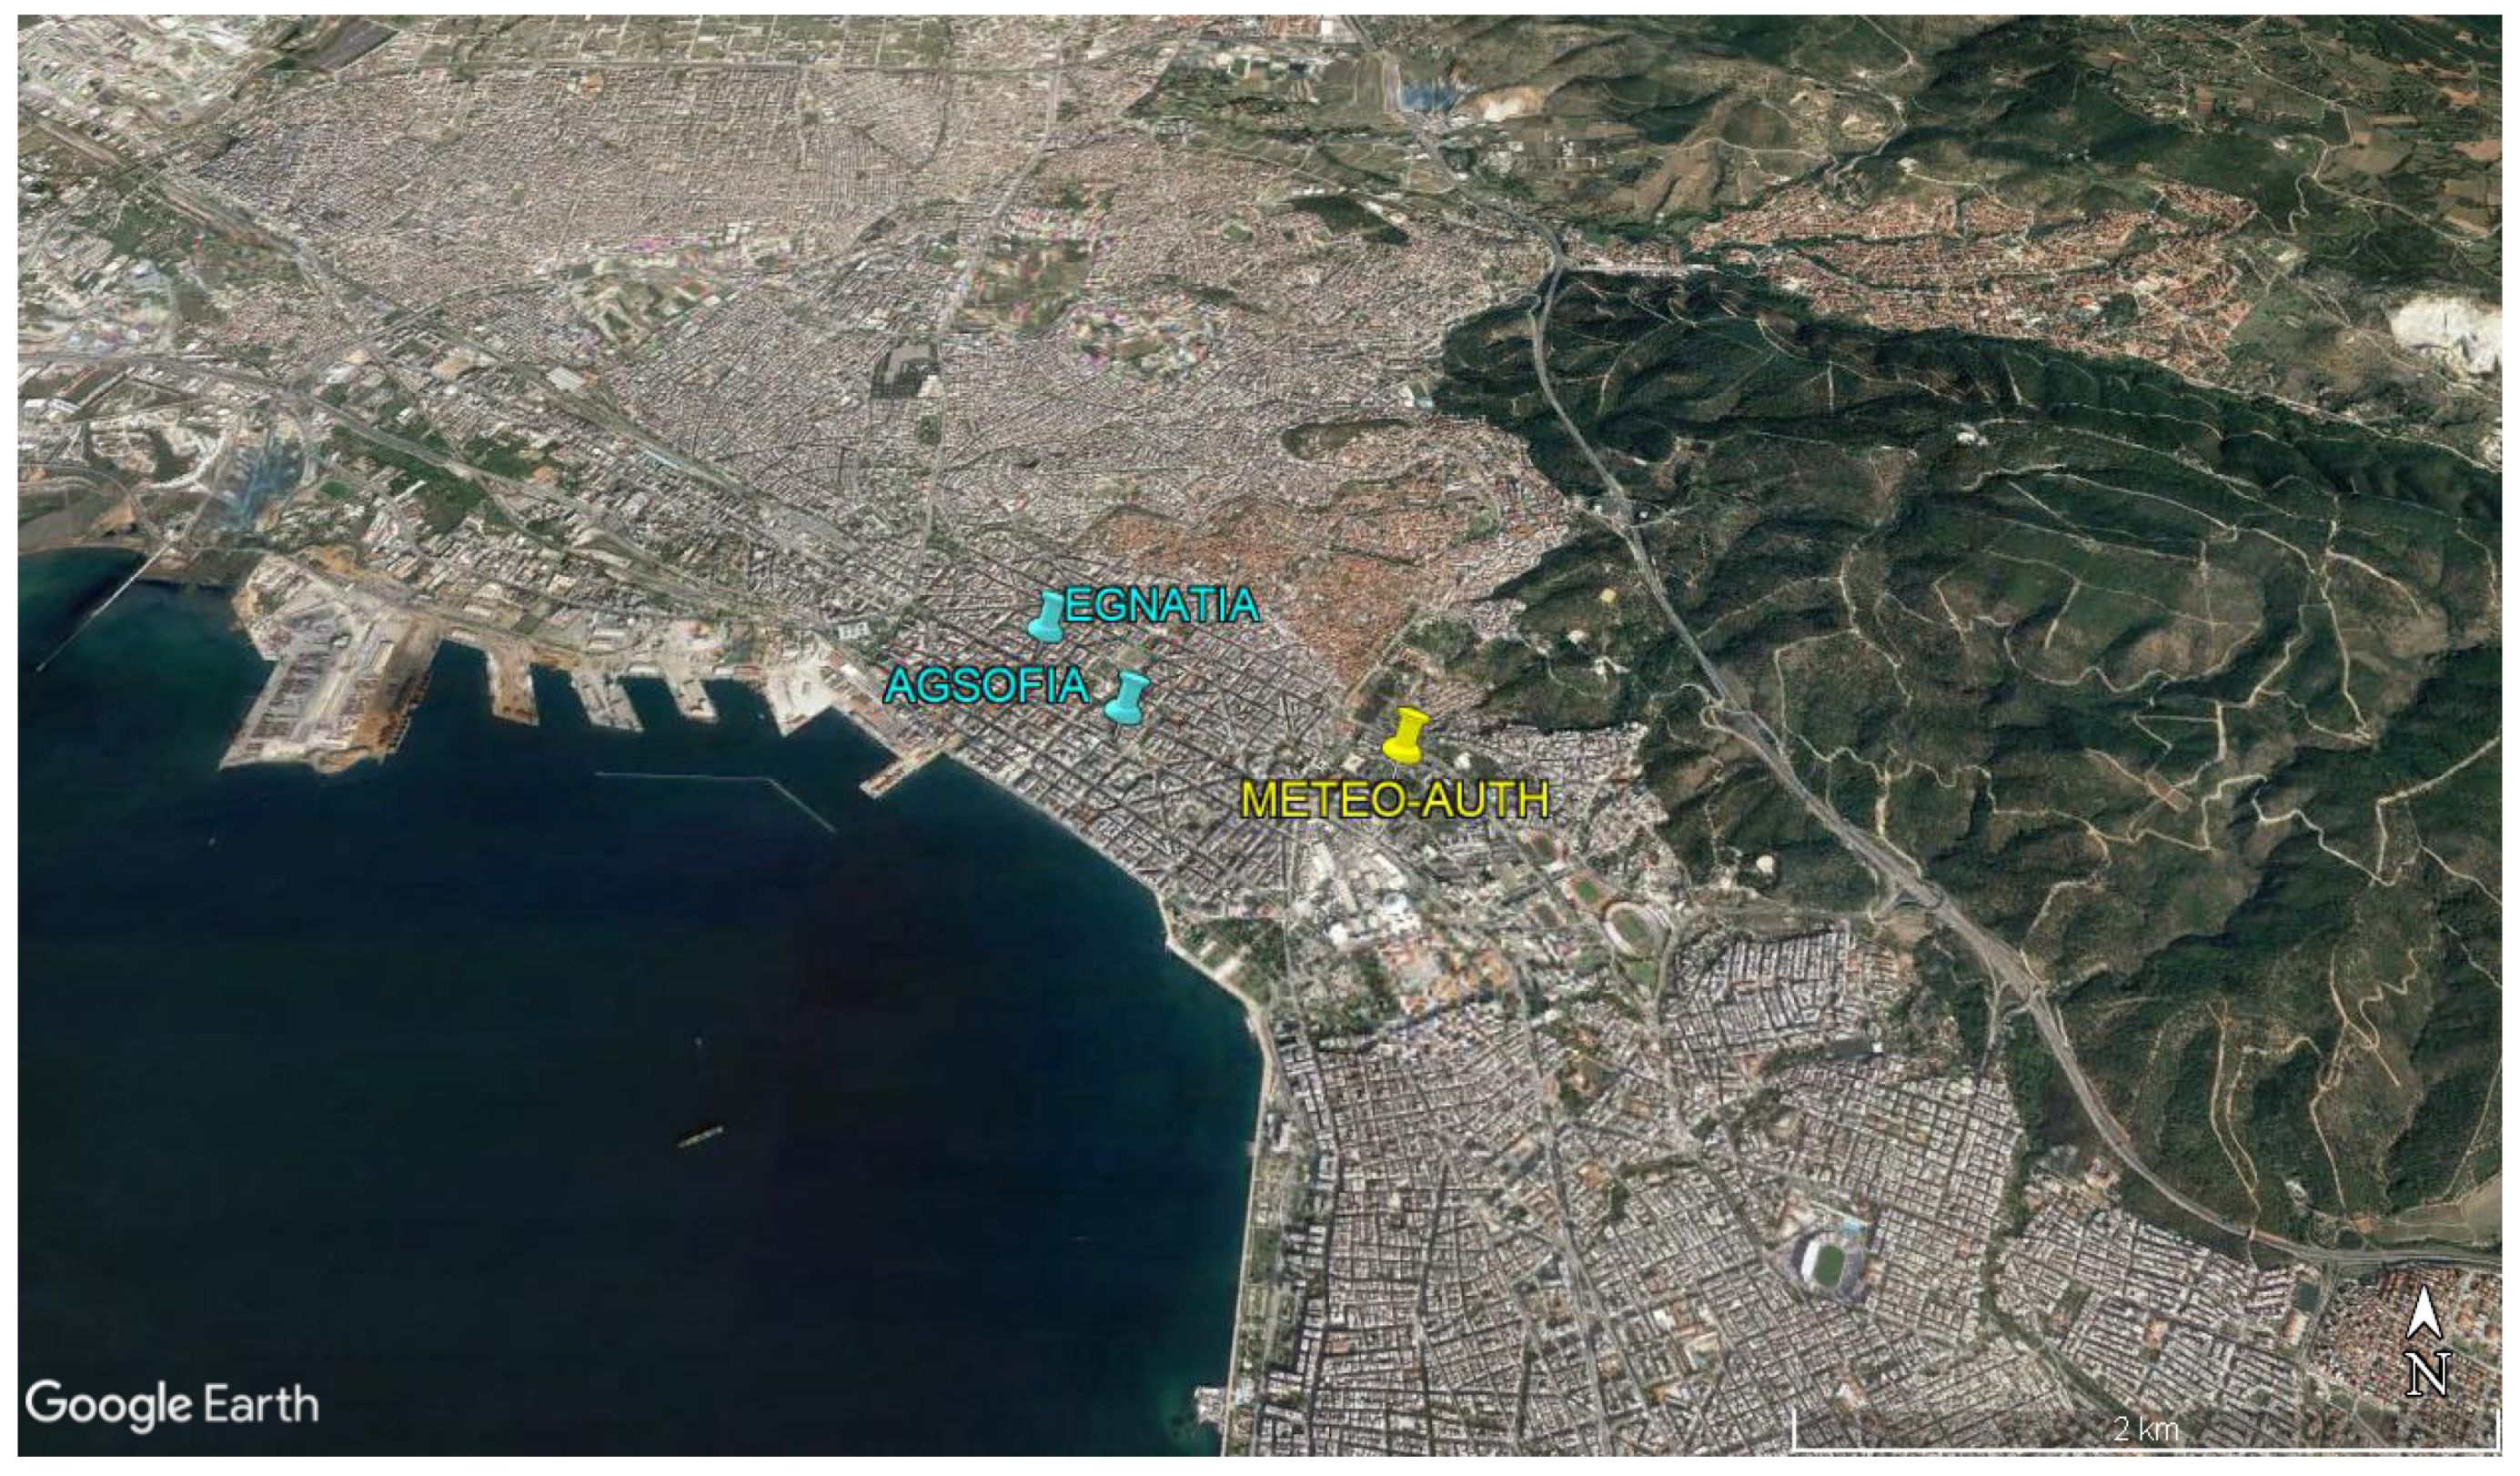
2.1. Data Description

Air quality data from two ground-based stations located in the urban area of Thessaloniki are used in the analysis. NO 2 and O 3 hourly concentration measurements from the Agia Sofia Square station (hereafter called AGSOFIA) (40.634° N, 22.945° E), from 2018 to 2020, were provided by the Department of Environment and Hydroeconomy of the Region of Central Macedonia. AGSOFIA is a low altitude (27 m) station located in Thessaloniki city center and is characterized as an urban-traffic station. The NO x (NO-NO 2 -NO x ) analyzer is the HORIBA Ltd. (Kyoto, Japan) model APNA-360, based on the chemiluminescence measurement technique, with a detection limit of 0.5 ppb, while the calibration of the instrument is performed according to the technical standards. The O 3 analyzer is the HORIBA Ltd. model APOA-360, using the principle of UV fluorescence, with a detection limit of 0.5 ppb and a calibration according to the technical standards.
In addition, NO 2 hourly concentrations from the Egnatia station (hereafter called EGNATIA) (40.638° N, 22.941° E), from 2018 to 2020, were provided by the Environmental Department of the Municipality of Thessaloniki. EGNATIA station is an urban-traffic station in the city center of Thessaloniki with an elevation of 11 m. The NO x (NO-NO 2 -NO x ) analyzer is the Envea (environment s.a.) model AC32M, which is in compliance with; EN 14211 (2012); U.S. EPA approved as compliant, no. RFNA-0202-146; certified by the TÜV report N° 936/21205818/C; and ISO 7996, VDI4202. The measurement technique is based on chemiluminescence, with a detection limit of 0.4 ppb. The calibration of the instrument is performed on a monthly basis with the gas phase titration technique and calibration gas cylinders. Descriptive statistics for NO 2 and O 3 concentrations at AGSOFIA station, and NO 2 concentrations at EGNATIA station, from 1 January 2018 to 31 December 2019, are provided in Table S1 of the Supplementary Materials.
Hourly meteorological data from the meteorological station of the Aristotle University of Thessaloniki (hereafter called METEO-AUTH) were also used, for the time period 2018 to 2020, including temperatures at 2 m, mean sea level pressure, wind speed at 10 m, total precipitation, relative humidity, and total radiation. METEO-AUTH is located in the Aristotle University Campus at an altitude of 32 m, being in close proximity to the aforementioned air quality stations (∼1 km from AGSOFIA and ∼1.5 km from EGNATIA). The location of the air quality and meteorological stations is depicted in Figure 1.
Moreover, hourly data of boundary layer height, wind speed at 10 m, temperature at 2 m, mean sea level pressure, and total radiation for the period from 2018 to 2020, were obtained from the state-of-the-art ERA5 reanalysis dataset [31]. ERA5 is issued by the European Centre for Medium-Range Weather Forecasts (ECMWF) and produced with the 4D-Var data assimilation and model forecasts of the ECMWF CY41R2 Integrated Forecast System (IFS), including 137 hybrid sigma/pressure levels in the vertical and a horizontal resolution of 0.25° × 0.25°. The ERA5 data were extracted for the grid cell (22.95° E, 40.65° N) that includes the air quality and meteorological stations.

2.2. Machine Learning Approach

2.2.1. Business as Usual (BAU) Model

Here, we apply the XGBoost machine learning algorithm [32] to model NO 2 and O 3 hourly concentrations at the air quality stations, in order to unravel the impact of COVID-19 restrictions on the observed air quality. XGBoost is a supervised learning technique based on the ensemble of gradient boosting decision trees, which is nowadays widely used in data science due to its scalability, speed, and performance [32]. Detailed information on the XGBoost algorithm, hyperparameters, and implementation can be found at https://xgboost.readthedocs.io/en/latest/index.html (accessed on 11 November 2021). Here, the python XGBoost library is used.
For each air quality monitoring station and species, we built an XGBoost model using meteorological and time explanatory variables (so-called features) to explain the observed time-varying concentrations of the examined species. A past period was used for the training of the models, which represents a business-as-usual (BAU) situation. Subsequently, we applied the BAU model for the COVID-19 period in order to predict what would be the expected species hourly concentrations during this period in BAU conditions (absence of restriction policies). The residuals of the observations and BAU during the COVID-19 period reveal the impact of COVID-19 restrictions on the observed air quality. The benefit of the applied approach is that natural meteorological variability is consider before extracting the implications for air quality, unlike simply subtracting species concentrations during past periods from the respective concentrations during the COVID-19 period. Similar XGBoost-based machine learning approaches for the same scientific purpose were also applied recently by Keller et al. [18] and Granella et al. [33].
The air quality data (target variables) at both examined stations exhibit a data completeness ≥70% for the train period (1 January 2018 to 31 December 2019). The meteorological features include observations of air temperature at 2 m, total precipitation, mean sea level pressure, relative humidity, wind speed at 10 m, and total radiation, as well as ERA5 boundary layer height. Missing data of air temperature at 2 m (∼0.4%), mean sea level pressure (∼0.4%), total radiation (∼5.3%), and wind speed at 10 m (∼8%) are filled by the ERA5 reanalysis. The correlation coefficients between observations and ERA5 hourly values for temperature at 2 m, mean sea level pressure, total radiation, and wind speed are 0.97, 0.98, 0.93, and 0.65, respectively. The wind direction was initially included in the BAU model, but as it had no significant contribution, it was excluded. The time explanatory variables include hour of the day, day of week, and month, and were created using the one-hot encoding method.

2.2.2. Hyperparameter Tuning

Prior to the creation of the XGBoost machine learning model for prediction, two basic processes are essential; the hyperparameters tuning and testing of the model performance on unseen data. The hyperparameters are a set of parameters that shape the learning process and, thus, control the overall behavior of the XGBoost model. To this end, we perform a tuning of the hyperparameters max_depth, n_estimators, min_child_weight, sub_sample, eta, reg_alpha, reg_lambda, and gamma using the Hyperopt Python library [34] that uses a form of Bayesian optimization, providing the hyperparameters that minimize/maximize a specified metric (R 2 here) for the given model. For as fair as possible tuning, and to avoid overfitting, we apply an 8-fold cross-validation with shuffle split to the dataset that extended from 1 January 2018 to 31 December 2019. The mean (out of eight cross validations) R 2 values during the tuning process for NO 2 at AGSOFIA, O 3 at AGSOFIA, and NO 2 at EGNATIA, are 0.67, 0.82, and 0.57, respectively. With the selected hyperparameters (see Table S2 in the Supplementary Materials) applied, the XGBoost model (BAU) is trained over the period from 1 January 2018 to 31 December 2019, applying the “early stopping” technique that terminates training at the point where performance on the test dataset starts to decrease while performance on the training dataset continues to improve, in order to avoid overfitting.

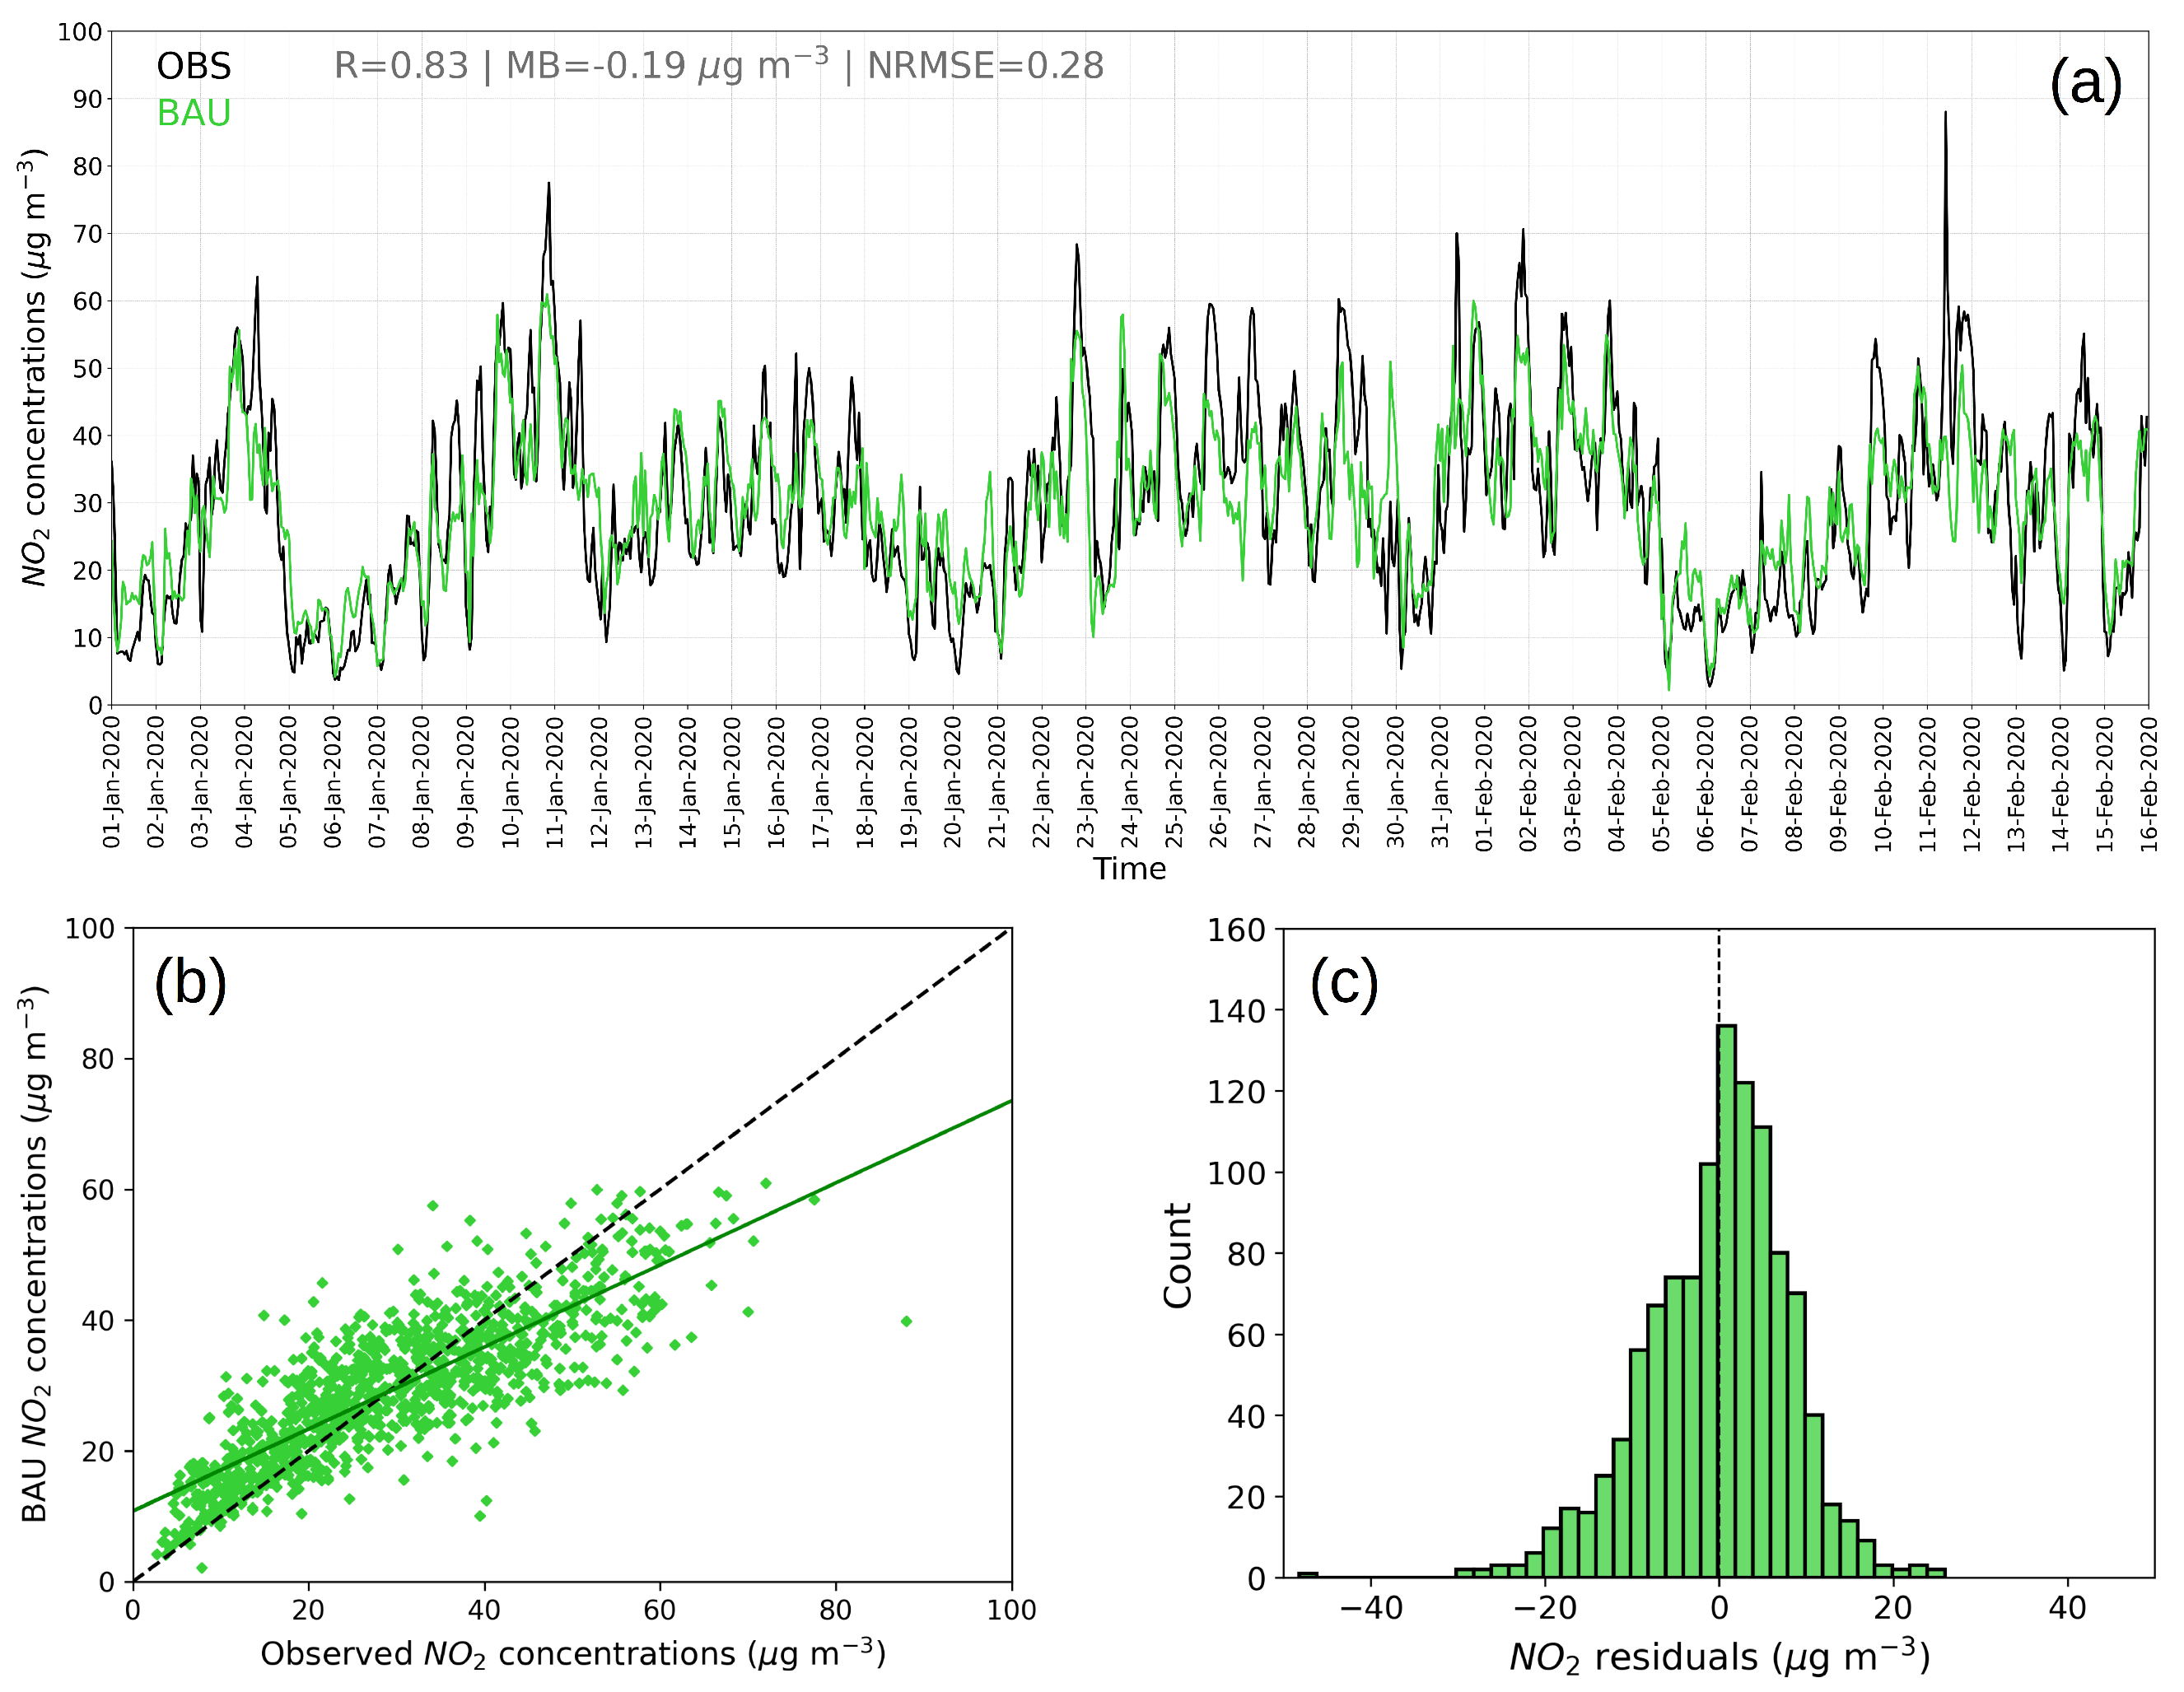
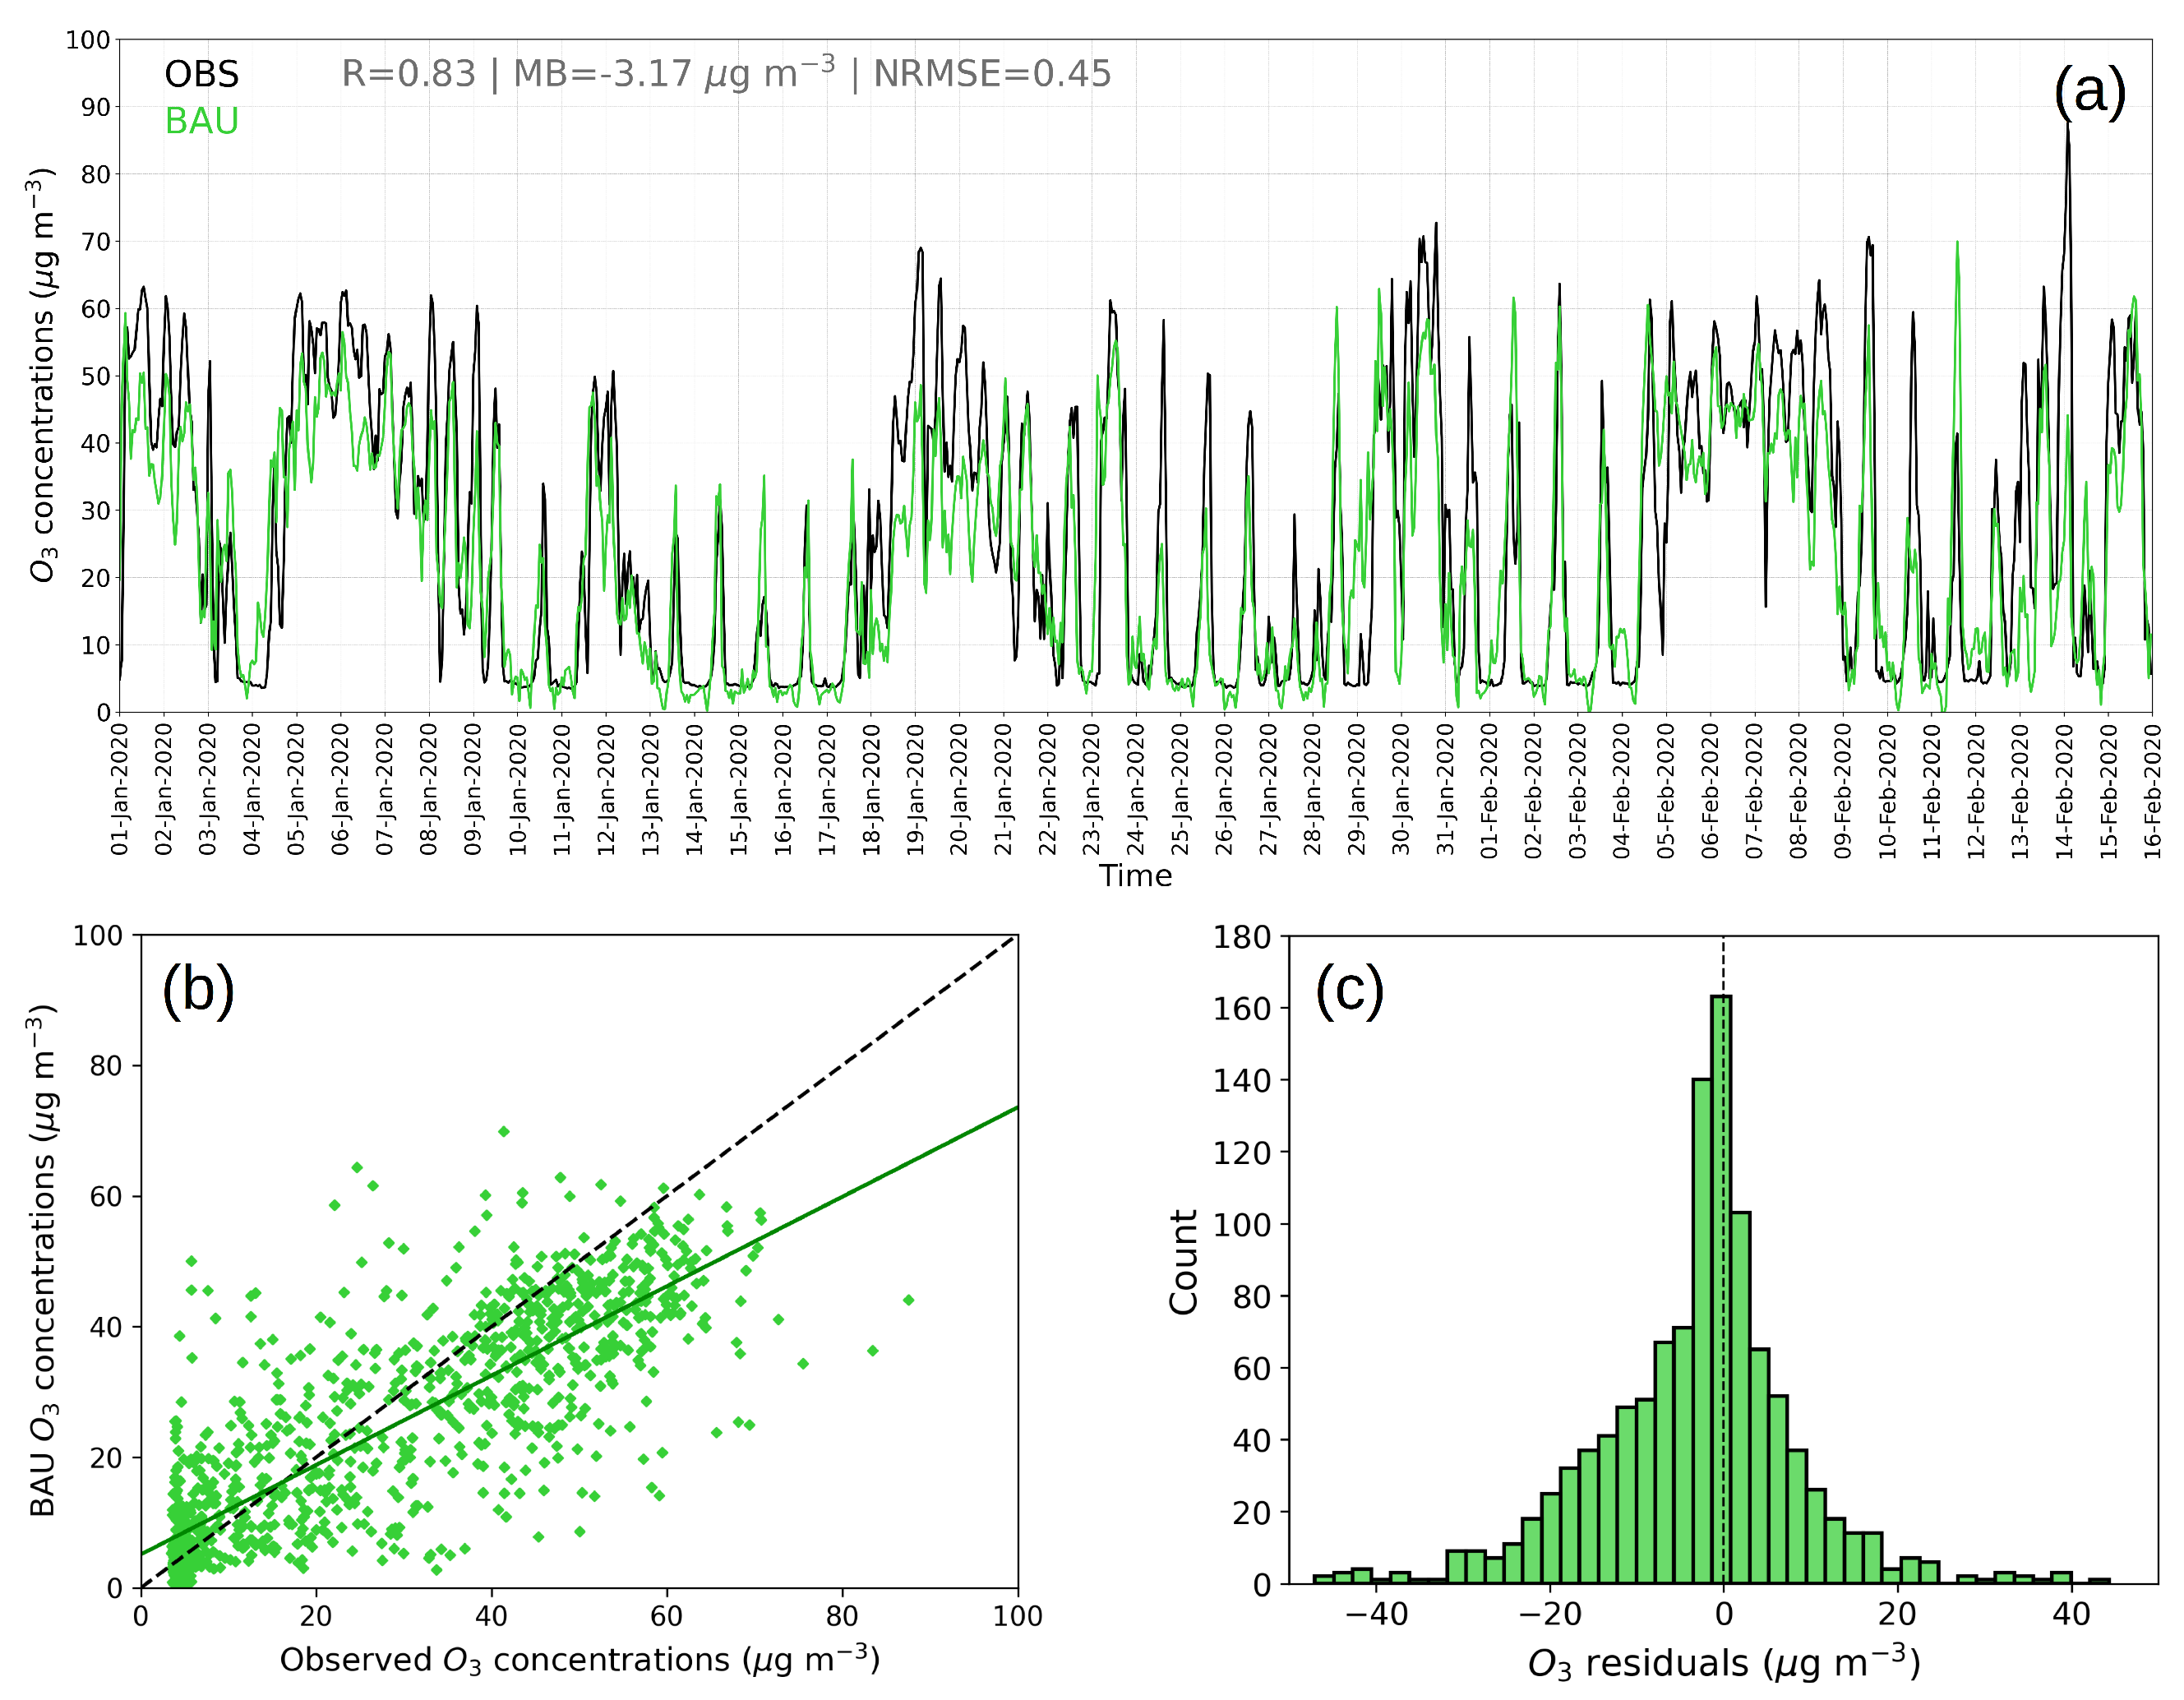
2.2.3. Evaluation of BAU Model

To gain confidence in the BAU model use, we evaluate its prediction performance from 1 January to 15 February 2020 (1 January to 10 February 2020, for the EGNATIA station due to missing data), a period which was not included in the train process and, thus, is suitable for an independent evaluation. For brevity, we present evaluation results only for the AGSOFIA station, while for the EGNATIA station, the respective results are included as Supplementary Materials (Figure S1). Figure 2a presents the observed and BAU (predicted) time series of NO 2 hourly concentrations at the AGSOFIA station, indicating a good agreement between observations and BAU during the test period, with a Pearson correlation coefficient (R) of 0.83, a mean bias (MB) of −0.19 μ g m 3 , and a normalized root mean squared error (NRMSE) of 0.28. The former is also confirmed by the scatter plot of the observed and BAU NO 2 hourly concentrations shown in Figure 2b. Noteworthy are the normally distributed NO 2 concentration residuals (Figure 2c), revealing that the BAU model over- and underpredicts with a relatively equal probability, underestimating/overestimating high/low observed NO 2 concentrations. As for O 3 , Figure 3a shows a good comparison between the observed and BAU time series of O 3 hourly concentrations at AGSOFIA, with an R of 0.83, a MB of −3.17 μ g m 3 , and an NRMSE of 0.45. Similar to NO 2 , the O 3 concentration residuals follow a bell-shaped pattern allowing for valid inferences. Regarding NO 2 at EGNATIA station, the observed and BAU time series exhibit an R of 0.7, a MB of 2.99 μ g m 3 , and an RMSE of 0.23, with normally distributed residuals (Figure S1 of the Supplementary Materials). For the train period the BAU model for NO 2 at AGSOFIA, O 3 at AGSOFIA, and NO 2 at EGNATIA, exhibit skill scores of R = 0.96/MB = 0 μ g m 3 /RMSE = 0.14, R = 0.98/MB = 0 μ g m 3 /RMSE = 0.13, and R = 0.93/MB = 0 μ g m 3 /RMSE = 0.12, respectively, as also depicted in Figure S2 of the Supplementary Materials. The evaluation results for both train and test periods are in line with the respective results of the recent COVID-19-related studies by Grange et al. [11], Keller et al. [18], Petetin et al. [21].

2.2.4. Estimation of Uncertainty

For a more robust interpretation of the results, estimation of the uncertainty in the BAU model predictions is essential. To this end, two methodologies are applied to estimate the uncertainty of BAU predictions following Petetin et al. [21] and Keller et al. [18]. At first, the 2018–2019 period was randomly split in eight sub-periods, and subsequently, the BAU model was applied using seven sub-periods for train and the remaining for test, in an iterative process of eight steps. The hourly residuals (BAU–OBS) were then calculated and the following two methodologies were applied to estimate the uncertainty.
Method1: following Petetin et al. [21], the 5th and 95th percentiles of the hourly residuals are found forming a fixed asymmetric 90% confidence interval for the hourly predictions. As our results are presented as a 1-month moving average, the 1-month moving average of the hourly residuals are calculated, and the respective 5th and 95th percentiles are used for the 90% confidence interval.
Method 2: following Keller et al. [18], the standard deviation of the hourly residuals is used as the uncertainty of the hourly predictions. The temporal (monthly) average of the uncertainty is then calculated as follows:
σ ¯ 2 = i = 1 N ( σ i N ) 2
where σ ¯ the mean uncertainty, σ i the hourly uncertainty, and N the sample size. Here we use the 2 σ ¯ interval corresponding to an approximately 95% confidence interval.
The resulting uncertainties of each BAU model predictions are presented in Table 1.

3. Results

To unravel the impact of COVID-19 restrictions on urban air quality of Thessaloniki, we compare the BAU-predicted NO 2 and O 3 concentrations during the COVID-19 period with the actual observations. To obtain more robust conclusions from the results, the MB of BAU 1-month moving average concentrations during the test period is removed (positive/negative bias is subtracted/added) from the respective BAU values during the lockdown period. This correction process is only applied for the reported in the text differences and percentage differences between observations and BAU, while in all figures, we present the original concentrations (without correction). As both uncertainty estimation methods presented in Section 2.2.4 give quite similar intervals, hereafter, only uncertainties obtained by method 2 are reported as 95% confidence interval enclosed in brackets.
Figure 4a presents the observed and BAU time series of NO 2 1-month moving average concentrations for the AGSOFIA station during the year 2020. Until the first lockdown at 16 March 2020, the observed NO 2 time series followed closely the BAU NO 2 time series, indicating that the observed situation before the lockdown was a BAU one. From 16 March to early May 2020, a distinct decrease of observed NO 2 concentrations was seen in contrast to the respective BAU time series, which remained relatively constant. From early May 2020, and as the COVID-19 restrictions were gradually lifted, the observed NO 2 concentrations were at first stabilized, and from early June 2020, increased, approaching the NO 2 BAU concentration levels. The residual (observation-BAU) of NO 2 and O 3 1-month moving average concentrations are presented in Figure 4c, indicating a sharp decrease of the NO 2 residual concentrations, which, during the lockdown period (16 March to 5 May 2020) ranged from −0.6 to −8.5 μ g m 3 with an average value of −5.7 [−6.21, −5.19] μ g m 3 , reflecting the direct effect of COVID-19 restrictions in NO 2 levels at AGSOFIA. The respective 1-month moving average NO 2 percentage differences between observations and BAU depicted in Figure 4d reveal a similar decrease for the same period ranging from −2.6 to −39.1% with an average value of −24.9 [−26.6, −23.2]%. Recently, Keller et al. [18] examined observational data from 46 countries reporting that during the lockdowns, NO 2 concentrations were on average 18% lower than BAU. At a European scale, Grange et al. [11] estimated a mean percentage change of −34% for NO 2 based on European traffic stations, using Bayesian inference to detect change points and subsequently the lockdown periods. As for Greece, Grivas et al. [24] using in situ observations found an NO 2 decline of 32% compared to the pre-lockdown period in Athens, Greece, while Koukouli et al. [35] using satellite observations and a chemical transport model, attributed a 12% decrease of tropospheric NO 2 columns at Thessaloniki during March to emissions changes.
As regards O 3 , prior to the lockdown, the observed and BAU concentrations varied similarly, while from the lockdown onset, the observed O 3 levels started to diverge incrementally from the respective BAU levels up to early May 2020, returning close to BAU levels in mid-June 2020 (Figure 4b). The aforementioned NO 2 decline was accompanied with a synchronous increase of O 3 residual (observation-BAU) concentrations of an average value of 7 [6.06, 7.94] μ g m 3 (range from 3 to 12.9 μ g m 3 ) (Figure 4c) and percentage differences of an average value of 12.7 [10.8, 14.8]% (range from 7 to 21%) (Figure 4d). The clear anti-correlation (R of −0.74) between NO 2 and O 3 residuals during the lockdown period (grey shaded areas in Figure 4c,d) reflects the link between NO x and O 3 chemistry, with reduced NO x resulting in reduced O 3 titration by NO and thus in enhanced O 3 levels. Moreover, in a likely VOC-limited environment, a decline in NO x leads in enhanced O 3 production. The mean European percentage changes of O 3 for traffic sites during the lockdowns was reported 30% by Grange et al. [11], mainly attributed to decreased O 3 destruction via the titration cycle. Similar increases in European O 3 concentrations during the lockdowns were also reported by Gualtieri et al. [20], Higham et al. [22], Tobías et al. [26], Sicard et al. [27], Putaud et al. [36].
The same behavior is revealed from the observed and BAU diurnal cycles of NO 2 and O 3 concentrations at AGSOFIA during the period from 16 March to 31 May 2020, shown in Figure 5. Both BAU and observed NO 2 diurnal cycles exhibit two distinct peaks; an early morning due to rush–hour vehicle traffic and a late evening resulting from both emissions and accumulation, due to absence of sunlight inhibiting NO 2 photolysis. The respective O 3 diurnal cycles are characterized by a broad afternoon maximum owing to its photochemical production. Lower/higher NO 2 /O 3 concentrations are observed throughout the day and night compared to BAU as depicted in Figure 5a,b. In particular, the diurnal cycles of NO 2 and O 3 residuals shown in Figure 5c indicate a reverse response (R = −0.88) of the two pollutants to the COVID-19 restrictions policies within the day. These are in line with the diurnal variations of NO 2 and O 3 anomalies during the lockdowns at several European megacities, such as Berlin, London, Brussels, Paris, Milan, and Madrid [37].
Regarding the second lockdown imposed in early November 2020, although a decrease/increase of NO 2 /O 3 levels is seen at AGSOFIA station as shown in Figure 4, these are not as pronounced as in the first lockdown, reflecting the greater intensity of the first lockdown. During the intermediate period between the two lockdowns, the observed NO 2 and O 3 concentrations are more close to BAU values compared to that during the lockdown periods.
As for the second examined station, Figure 6 presents both the time series and diurnal cycles of observed and BAU NO 2 concentrations at the EGNATIA station. In agreement with the AGSOFIA station, a decrease of observed NO 2 1-month moving average concentrations was seen from early March 2020 relative to BAU concentrations with an average value of −13.1 [−14.2, −12] μ g m 3 (Figure 6a), while the percentage difference between observations and BAU during the lockdown (16 March 2020 to 5 May 2020) ranged from −7.3% to −24.1% with an average value of −18.4 [−19.6, −17.1]% (Figure 6b). From early May 2020, and as the restrictions started to relax, the observed NO 2 levels gradually increased, reaching near BAU values from mid-June 2020 onward. Regarding the second lockdown in early November 2020, this was not clearly reflected in the observed and residual NO 2 concentrations. The diurnal cycle of the observed and BAU NO 2 concentrations at the EGNATIA station from 16 March to 31 May 2020, shown in Figure 6c, exhibits the same two-peak shape as that of the AGSOFIA station, revealing a clear decline of NO 2 levels throughout the day and night during the first lockdown period.

4. Conclusions

This study investigated the impact of COVID-19 restriction policies on the urban air quality of Thessaloniki, Greece, using air quality and meteorological observations, ERA5 reanalysis data, and the XGBoost machine learning algorithm. Modeling NO 2 and O 3 BAU concentrations and comparing with observations for the lockdown period, allowed the assessment of COVID-19 restriction footprints on the urban air quality of Thessaloniki. With the applied approach, the impact of weather variability was also considered.
Both AGSOFIA and EGNATIA urban-traffic stations exhibited an NO 2 drop during the lockdown period (from 16 March to 5 May 2020) led by the COVID-19 restrictions, of −24.9 [−26.6, −23.2]% and −18.4 [−19.6, −17.1]%, respectively, accompanied by an 12.7 [10.8, 14.8]% increase of O 3 at AGSOFIA. Similar conclusions arose from the diurnal variation of the pollutants during the lockdown, indicating lower/higher NO 2 /O 3 levels relative to BAU throughout the day and night at both stations/AGSOFIA. The mirroring pattern of NO 2 and O 3 residuals during the lockdown in both time series and diurnal cycles back the view that a decline in NO x results in O 3 increase through a decrease of O 3 titration, and presumably the enhanced O 3 production in a likely VOC-limited regime. It should be noted that the aforementioned O 3 increase at AGSOFIA, due to the COVID-19 restrictions, should not be generalized for other locations in Thessaloniki, where O 3 might be governed by different photochemical regimes.
Consistent with recent studies on other urban areas worldwide, the NO 2 decrease at Thessaloniki during the COVID-19 lockdown was associated with an O 3 increase. Such real-life modeling scenarios, like the COVID-19 pandemic, provide tangible evidence that, for a better future air quality management in urban environments, a more sophisticated emissions control is required. To mitigate O 3 pollution, NO x reductions should be accompanied by VOC-targeted control strategies specifically designed for each urban environment.

Supplementary Materials

The following are available online at https://www.mdpi.com/article/10.3390/atmos12111500/s1. Table S1: Descriptive statistics (mean, 10th percentile, 25th percentile, median, 75th percentile, 90th percentile, and standard deviation) for NO 2 ( μ g m 3 ) and O 3 ( μ g m 3 ) at AGSOFIA station, and NO 2 ( μ g m 3 ) at EGNATIA station, for the time period from 1 January 2018 to 31 December 2019. Table S2: XGBoost hyperparameters used for the BAU models. Figure S1: (a) Observed (black) and BAU (green) timeseries of NO 2 hourly concentrations at EGNATIA station during the time period from 1 January to 10 February 2020. (b) Scatter plot of observed and BAU NO 2 hourly concentrations at EGNATIA station during the time period from 1 January to 10 February 2020. The solid green line represents the regression line of the observed and BAU NO 2 concentrations, while the dashed black line is the 1:1 line. (c) Histogram of NO 2 residual concentrations (BAU-observation) at EGNATIA station during the time period from 1 January to 10 February 2020. Figure S2: Observed (black) and BAU (green) 1-month moving average concentrations during the train (left of the blue dashed line) and test (right of the blue dashed line) periods, along with the correlation coefficient (R), mean bias (MB), and normalized root mean square error (NRMSE) for the train period for AGSOFIA NO 2 (a), AGSOFIA O 3 (b), and EGNATIA NO 2 (c).

Author Contributions

Conceptualization, D.A.; methodology, D.A., P.Z., A.K.G.; software, D.A.; validation, D.A., E.P., P.T., A.K.; formal analysis, D.A.; investigation, D.A., P.Z., A.K.G.; resources, D.A., E.P., P.T., A.K.; data curation, D.A., E.P., P.T., A.K.; writing—original draft preparation, D.A.; writing—review and editing, D.A., P.Z., A.K.G.; visualization, D.A.; supervision, D.A.; project administration, D.A. All authors have read and agreed to the published version of the manuscript.

Funding

This research received no external funding.

Institutional Review Board Statement

Not applicable.

Informed Consent Statement

Not applicable.

Data Availability Statement

The air quality and meteorological observations used in the present study are available from the authors upon request. The ECMWF ERA5 reanalysis data [38] were obtained from the Copernicus Climate Change Service Climate Data Store (CDS) (https://cds.climate.copernicus.eu/cdsapp#!/dataset/reanalysis-era5-single-levels?tab=form) (accessed on 11 November 2021).

Acknowledgments

We acknowledge ECMWF for distributing the ERA5 reanalysis data, generated using Copernicus Climate Change Service Information 2021. This study contains modified Copernicus Climate Change Service Information 2021. Neither the European Commission nor ECMWF are responsible for any use that may be made of the Copernicus Information or data it contains.

Conflicts of Interest

The authors declare no conflict of interest.

References

  1. WHO. Naming the Coronavirus Disease (COVID-19) and the Virus that Causes It. 2020. Available online: https://www.who.int/emergencies/diseases/novel-coronavirus-2019/technical-guidance/naming-the-coronavirus-disease-(covid-2019)-and-the-virus-that-causes-it (accessed on 11 November 2021).
  2. WHO. Pneumonia of Unknown Cause–China. 2020. Available online: https://www.who.int/csr/don/05-january-2020-pneumonia-of-unkown-cause-china/en/ (accessed on 11 November 2021).
  3. Sanche, S.; Lin, Y.T.; Xu, C.; Romero-Severson, E.; Hengartner, N.; Ke, R. High contagiousness and rapid spread of severe acute respiratory syndrome coronavirus 2. Emerg. Infect. Dis. 2020, 26, 1470–1477. [Google Scholar] [CrossRef]
  4. Li, R.; Pei, S.; Chen, B.; Song, Y.; Zhang, T.; Yang, W.; Shaman, J. Substantial undocumented infection facilitates the rapid dissemination of novel coronavirus (SARS-CoV-2). Science 2020, 368, 489–493. [Google Scholar] [CrossRef] [Green Version]
  5. WHO. WHO Director-General’s Opening Remarks at the Media Briefing on COVID-19, 11 March 2020. Available online: https://www.who.int/director-general/speeches/detail/who-director-general-s-opening-remarks-at-the-media-briefing-on-covid-19—11-march-2020 (accessed on 11 November 2021).
  6. Le Quéré, C.; Jackson, R.B.; Jones, M.W.; Smith, A.J.; Abernethy, S.; Andrew, R.M.; De-Gol, A.J.; Willis, D.R.; Shan, Y.; Canadell, J.G.; et al. Temporary reduction in daily global CO2 emissions during the COVID-19 forced confinement. Nat. Clim. Chang. 2020, 10, 647–653. [Google Scholar] [CrossRef]
  7. Liu, Z.; Ciais, P.; Deng, Z.; Lei, R.; Davis, S.J.; Feng, S.; Zheng, B.; Cui, D.; Dou, X.; Zhu, B.; et al. Near-real-time monitoring of global CO2 emissions reveals the effects of the COVID-19 pandemic. Nat. Commun. 2020, 11, 5172. [Google Scholar] [CrossRef] [PubMed]
  8. Bauwens, M.; Compernolle, S.; Stavrakou, T.; Müller, J.F.; van Gent, J.; Eskes, H.; Levelt, P.F.; van der, A.R.; Veefkind, J.P.; Vlietinck, J.; et al. Impact of Coronavirus Outbreak on NO2 Pollution Assessed Using TROPOMI and OMI Observations. Geophys. Res. Lett. 2020, 47, e2020GL087978. [Google Scholar] [CrossRef] [PubMed]
  9. Liu, F.; Page, A.; Strode, S.A.; Yoshida, Y.; Choi, S.; Zheng, B.; Lamsal, L.N.; Li, C.; Krotkov, N.A.; Eskes, H.; et al. Abrupt decline in tropospheric nitrogen dioxide over China after the outbreak of COVID-19. Sci. Adv. 2020, 6, eabc2992. [Google Scholar] [CrossRef] [PubMed]
  10. Grange, S.K.; Carslaw, D.C. Using meteorological normalisation to detect interventions in air quality time series. Sci. Total Environ. 2019, 653, 578–588. [Google Scholar] [CrossRef]
  11. Grange, S.K.; Lee, J.D.; Drysdale, W.S.; Lewis, A.C.; Hueglin, C.; Emmenegger, L.; Carslaw, D.C. COVID-19 lockdowns highlight a risk of increasing ozone pollution in European urban areas. Atmos. Chem. Phys. 2021, 21, 4169–4185. [Google Scholar] [CrossRef]
  12. Cameletti, M. The Effect of Corona Virus Lockdown on Air Pollution: Evidence from the City of Brescia in Lombardia Region (Italy). Atmos. Environ. 2020, 239, 117794. [Google Scholar] [CrossRef]
  13. Liu, F.; Wang, M.; Zheng, M. Effects of COVID-19 lockdown on global air quality and health. Sci. Total Environ. 2021, 755, 142533. [Google Scholar] [CrossRef]
  14. Ordóñez, C.; Garrido-Perez, J.M.; García-Herrera, R. Early spring near-surface ozone in Europe during the COVID-19 shutdown: Meteorological effects outweigh emission changes. Sci. Total Environ. 2020, 747, 141322. [Google Scholar] [CrossRef] [PubMed]
  15. Evangeliou, N.; Platt, S.M.; Eckhardt, S.; Lund Myhre, C.; Laj, P.; Alados-Arboledas, L.; Backman, J.; Brem, B.T.; Fiebig, M.; Flentje, H.; et al. Changes in black carbon emissions over Europe due to COVID-19 lockdowns. Atmos. Chem. Phys. 2021, 21, 2675–2692. [Google Scholar] [CrossRef]
  16. Guevara, M.; Jorba, O.; Soret, A.; Petetin, H.; Bowdalo, D.; Serradell, K.; Tena, C.; Denier van der Gon, H.; Kuenen, J.; Peuch, V.H.; et al. Time-resolved emission reductions for atmospheric chemistry modelling in Europe during the COVID-19 lockdowns. Atmos. Chem. Phys. 2021, 21, 773–797. [Google Scholar] [CrossRef]
  17. Xing, J.; Li, S.; Jiang, Y.; Wang, S.; Ding, D.; Dong, Z.; Zhu, Y.; Hao, J. Quantifying the emission changes and associated air quality impacts during the COVID-19 pandemic on the North China Plain: A response modeling study. Atmos. Chem. Phys. 2020, 20, 14347–14359. [Google Scholar] [CrossRef]
  18. Keller, C.A.; Evans, M.J.; Knowland, K.E.; Hasenkopf, C.A.; Modekurty, S.; Lucchesi, R.A.; Oda, T.; Franca, B.B.; Mandarino, F.C.; Díaz Suárez, M.V.; et al. Global impact of COVID-19 restrictions on the surface concentrations of nitrogen dioxide and ozone. Atmos. Chem. Phys. 2021, 21, 3555–3592. [Google Scholar] [CrossRef]
  19. Salma, I.; Vörösmarty, M.; Gyöngyösi, A.Z.; Thén, W.; Weidinger, T. What can we learn about urban air quality with regard to the first outbreak of the COVID-19 pandemic? A case study from central Europe. Atmos. Chem. Phys. 2020, 20, 15725–15742. [Google Scholar] [CrossRef]
  20. Gualtieri, G.; Brilli, L.; Carotenuto, F.; Vagnoli, C.; Zaldei, A.; Gioli, B. Quantifying road traffic impact on air quality in urban areas: A Covid19-induced lockdown analysis in Italy. Environ. Pollut. 2020, 267, 115682. [Google Scholar] [CrossRef]
  21. Petetin, H.; Bowdalo, D.; Soret, A.; Guevara, M.; Jorba, O.; Serradell, K.; Pérez García-Pando, C. Meteorology-normalized impact of the COVID-19 lockdown upon NO2 pollution in Spain. Atmos. Chem. Phys. 2020, 20, 11119–11141. [Google Scholar] [CrossRef]
  22. Higham, J.; Ramírez, C.A.; Green, M.; Morse, A. UK COVID-19 lockdown: 100 days of air pollution reduction? Air Qual. Atmos. Health 2021, 14, 325–332. [Google Scholar] [CrossRef]
  23. Lee, J.D.; Drysdale, W.S.; Finch, D.P.; Wilde, S.E.; Palmer, P.I. UK surface NO2 levels dropped by 42 % during the COVID-19 lockdown: Impact on surface O3. Atmos. Chem. Phys. 2020, 20, 15743–15759. [Google Scholar] [CrossRef]
  24. Grivas, G.; Athanasopoulou, E.; Kakouri, A.; Bailey, J.; Liakakou, E.; Stavroulas, I.; Kalkavouras, P.; Bougiatioti, A.; Kaskaoutis, D.G.; Ramonet, M.; et al. Integrating in situ Measurements and City Scale Modelling to Assess the COVID–19 Lockdown Effects on Emissions and Air Quality in Athens, Greece. Atmosphere 2020, 11, 1174. [Google Scholar] [CrossRef]
  25. Collivignarelli, M.C.; Abbà, A.; Bertanza, G.; Pedrazzani, R.; Ricciardi, P.; Carnevale Miino, M. Lockdown for CoViD-2019 in Milan: What are the effects on air quality? Sci. Total Environ. 2020, 732, 139280. [Google Scholar] [CrossRef] [PubMed]
  26. Tobías, A.; Carnerero, C.; Reche, C.; Massagué, J.; Via, M.; Minguillón, M.C.; Alastuey, A.; Querol, X. Changes in air quality during the lockdown in Barcelona (Spain) one month into the SARS-CoV-2 epidemic. Sci. Total Environ. 2020, 726, 138540. [Google Scholar] [CrossRef] [PubMed]
  27. Sicard, P.; De Marco, A.; Agathokleous, E.; Feng, Z.; Xu, X.; Paoletti, E.; Rodriguez, J.J.D.; Calatayud, V. Amplified ozone pollution in cities during the COVID-19 lockdown. Sci. Total Environ. 2020, 735, 139542. [Google Scholar] [CrossRef] [PubMed]
  28. Huang, X.; Ding, A.; Gao, J.; Zheng, B.; Zhou, D.; Qi, X.; Tang, R.; Wang, J.; Ren, C.; Nie, W.; et al. Enhanced secondary pollution offset reduction of primary emissions during COVID-19 lockdown in China. Natl. Sci. Rev. 2020, 8, nwaa137. [Google Scholar] [CrossRef]
  29. Li, K.; Jacob, D.J.; Liao, H.; Qiu, Y.; Shen, L.; Zhai, S.; Bates, K.H.; Sulprizio, M.P.; Song, S.; Lu, X.; et al. Ozone pollution in the North China Plain spreading into the late-winter haze season. Proc. Natl. Acad. Sci. USA 2021, 118, e2015797118. [Google Scholar] [CrossRef]
  30. Alexandri, G.; Georgoulias, A.K.; Balis, D. Effect of Aerosols, Tropospheric NO2 and Clouds on Surface Solar Radiation over the Eastern Mediterranean (Greece). Remote Sens. 2021, 13, 2587. [Google Scholar] [CrossRef]
  31. Hersbach, H.; Bell, B.; Berrisford, P.; Hirahara, S.; Horányi, A.; Muñoz-Sabater, J.; Nicolas, J.; Peubey, C.; Radu, R.; Schepers, D.; et al. The ERA5 global reanalysis. Q. J. R. Meteorol. Soc. 2020, 146, 1999–2049. [Google Scholar] [CrossRef]
  32. Chen, T.; Guestrin, C. XGBoost: A Scalable Tree Boosting System. In Proceedings of the 22nd ACM SIGKDD International Conference on Knowledge Discovery and Data Mining; Association for Computing Machinery, KDD ’16, New York, NY, USA, 2016; pp. 785–794. [Google Scholar] [CrossRef] [Green Version]
  33. Granella, F.; Reis, L.A.; Bosetti, V.; Tavoni, M. COVID-19 lockdown only partially alleviates health impacts of air pollution in Northern Italy. Environ. Res. Lett. 2021, 16, 035012. [Google Scholar] [CrossRef]
  34. Bergstra, J.; Yamins, D.; Cox, D. Making a Science of Model Search: Hyperparameter Optimization in Hundreds of Dimensions for Vision Architectures. In Proceedings of the 30th International Conference on Machine Learning, Atlanta, GA, USA, 16–21 June 2013; Dasgupta, S., McAllester, D., Eds.; PMLR: Atlanta, GA, USA, 2013; Volume 28, pp. 115–123. [Google Scholar]
  35. Koukouli, M.E.; Skoulidou, I.; Karavias, A.; Parcharidis, I.; Balis, D.; Manders, A.; Segers, A.; Eskes, H.; van Geffen, J. Sudden changes in nitrogen dioxide emissions over Greece due to lockdown after the outbreak of COVID-19. Atmos. Chem. Phys. 2021, 21, 1759–1774. [Google Scholar] [CrossRef]
  36. Putaud, J.P.; Pozzoli, L.; Pisoni, E.; Martins Dos Santos, S.; Lagler, F.; Lanzani, G.; Dal Santo, U.; Colette, A. Impacts of the COVID-19 lockdown on air pollution at regional and urban background sites in northern Italy. Atmos. Chem. Phys. 2021, 21, 7597–7609. [Google Scholar] [CrossRef]
  37. Deroubaix, A.; Brasseur, G.; Gaubert, B.; Labuhn, I.; Menut, L.; Siour, G.; Tuccella, P. Response of surface ozone concentration to emission reduction and meteorology during the COVID-19 lockdown in Europe. Meteorol. Appl. 2021, 28, e1990. [Google Scholar] [CrossRef]
  38. Hersbach, H.; Bell, B.; Berrisford, P.; Biavati, G.; Horányi, A.; Muñoz Sabater, J.; Nicolas, J.; Peubey, C.; Radu, R.; Rozum, I.; et al. ERA5 Hourly Data on Single Levels from 1979 to Present. Copernicus Climate Change Service (C3S) Climate Data Store (CDS). 2018. Available online: https://doi.org/10.24381/cds.adbb2d47 (accessed on 30 June 2021).
Figure 1. Location of air-quality (cyan) and meteorological (yellow) measurement stations in Thessaloniki, Greece. Map data ©2019 Google.
Atmosphere 12 01500 g001
Figure 2. (a) Observed (black) and BAU (green) time series of NO 2 hourly concentrations at AGSOFIA station from 1 January to 15 February 2020. (b) Scatter plot of observed and BAU NO 2 hourly concentrations at AGSOFIA station from 1 January to 15 February 2020. The solid green line represents the regression line of the observed and BAU NO 2 concentrations, while the dashed black line is the 1:1 line. (c) Histogram of NO 2 residual concentrations (BAU-observation) at AGSOFIA station during the time period from 1 January to 15 February 2020.
Atmosphere 12 01500 g002
Figure 3. (a) Observed (black) and BAU (green) time series of O 3 hourly concentrations at AGSOFIA station from 1 January to 15 February 2020. (b) Scatter plot of the observed and BAU O 3 hourly concentrations at AGSOFIA station from 1 January to 15 February 2020. The solid green line represents the regression line of the observed and BAU O 3 concentrations, while the dashed black line is the 1:1 line. (c) Histogram of O 3 residual concentrations (BAU-observation) at AGSOFIA station from 1 January to 15 February 2020.
Atmosphere 12 01500 g003
Figure 4. Observed (black) and BAU (green) time series of NO 2 (a) and O 3 (b) 1-month moving average concentrations at AGSOFIA station during the year 2020. Residual (observation-BAU) (c) and percentage differences (d) of NO 2 (purple) and O 3 (pink) 1-month moving average concentrations at AGSOFIA station during the year 2020. The gray shaded areas represent the lockdown periods. The blue/red shaded areas represent the decrease/increase of observed NO 2 and O 3 concentrations relative to the BAU conditions.
Atmosphere 12 01500 g004
Figure 5. Observed (black) and BAU (green) diurnal cycles of NO 2 (a) and O 3 (b) concentrations at AGSOFIA station. The blue/red shaded areas represent the decrease/increase of observed NO 2 and O 3 concentrations relative to the BAU conditions. (c) Diurnal cycle of NO 2 (purple) and O 3 (pink) residual (observation-BAU) concentrations at AGSOFIA station. The examined period is from 16 March to 31 May 2020. Hours are in UTC.
Atmosphere 12 01500 g005
Figure 6. (a) Observed (black) and BAU (green) time series of NO 2 1-month moving average concentrations at the EGNATIA station during 2020. (b) Percentage differences of NO 2 1-month moving average concentrations between observations and BAU at EGNATIA station during 2020. (c) Observed (black) and BAU (green) diurnal cycle of NO 2 concentrations at EGNATIA station from 16 March to 31 May 2020. Hours are in UTC. The blue/red shaded areas represent the decrease/increase of observed NO 2 concentrations relative to the BAU conditions.
Atmosphere 12 01500 g006
Table 1. Uncertainty estimations ( μ g m 3 ) for BAU models predictions.
AGSOFIA NO 2 AGSOFIA O 3 EGNATIA NO 2
5th percentile of hourly residuals−11.84−20.73−23.79
95th percentile of hourly residuals10.2520.9922.47
standard deviation of hourly residuals6.8112.5614.09
monthly uncertainty interval (method 1)[−0.44, +0.55][−0.69, +0.74][−0.92, +1.44]
monthly uncertainty interval (method 2)[−0.51, +0.51][−0.94, +0.94][−1.05, +1.05]
Publisher’s Note: MDPI stays neutral with regard to jurisdictional claims in published maps and institutional affiliations.

