Article

Wind Speed Analysis of Hurricane Sandy

by
Pablo Martínez
,
Isidro A. Pérez
*,
María Luisa Sánchez
,
María de los Ángeles García
and
Nuria Pardo
Department of Applied Physics, Faculty of Sciences, University of Valladolid, Paseo de Belén, 7, 47011 Valladolid, Spain
*
Author to whom correspondence should be addressed.
Atmosphere 2021, 12(11), 1480; https://doi.org/10.3390/atmos12111480
Submission received: 20 October 2021 / Revised: 2 November 2021 / Accepted: 4 November 2021 / Published: 9 November 2021

Abstract

:
The database of the HWind project sponsored by the National Oceanic and Atmospheric Administration (NOAA) for hurricanes between 1994 and 2013 is analysed. This is the first objective of the current research. Among these hurricanes, Hurricane Sandy was selected for a detailed study due to the number of files available and its social relevance, with this being the second objective of this study. Robust wind speed statistics showed a sharp increase in wind speed, around 6 m s−1 at the initial stage as Category 1, and a linear progression of its interquartile range, which increased at a rate of 0.54 m s−1 per day. Wind speed distributions were initially right-skewed. However, they evolved to nearly symmetrical or even left-skewed distributions. Robust kurtosis was similar to that of the Gaussian distribution. Due to the noticeable fraction of wind speed intermediate values, the Laplace distribution was used, its scale parameter increasing slightly during the hurricane’s lifecycle. The key features of the current study were the surface and recirculation factor calculation. The surface area with a category equal to, or higher than, a tropical storm was calculated and assumed to be circular. Its radius increased linearly up to 600 km. Finally, parcel trajectories were spirals in the lower atmosphere but loops in the mid-troposphere due to wind translation and rotation. The recirculation factor varied, reaching values close to 0.9 and revealing atmospheric stratification.

1. Introduction

Hurricanes are among the most destructive natural hazards, not only in terms of human life, but also on built infrastructure [1]. Since their consequences are devastating, the effects of these winds on structures such as bridges, transmission lines, offshore wind turbines, skyscrapers, or water supplies are the subject of research [2,3,4,5,6]. However, the most common constructions are usually low-rise buildings, where the direct impact perceived by most of the population is on the building roofs [7]. Moreover, coastal economic activities, such as fisheries, are affected [8]. Last but not least, the longest-lasting consequences are observed on human health [9].
Due to their global impact, hurricanes have been studied in numerous analyses, some of which, such as the relationship between pressure or temperature and wind, are experimentally based [10,11]. Other studies consider the vertical wind profile [12], which is extremely useful for evaluating the structural safety of buildings in extreme wind conditions. The hurricane trajectory analysis is one line of research [13], with other studies focus on gauging their size [14]. Theoretical research has also occasionally been conducted [15].
Due to the close link between ocean surface temperatures and hurricanes, Hosseini et al. [16] obtained a high correlation between sea surface temperature, the increase in which was attributed to climate change, and hurricane frequency over the last century. Another consequence of recent atmospheric warming might be the decrease in translation speed and the increase in the rain rate [17]. However, Rojo-Garibaldi et al. [18] reported a decreasing trend in the number of hurricanes in the Gulf of Mexico and the Caribbean over a wider period, 1749–2010, which they correlated with sunspot activity.
The current paper is divided into two unequal sections. The first analyses a hurricane database spanning a period of nearly twenty years in order to explore its main features and hurricane distributions, with the extended analysis period being one of the prominent aspects in this section. The remainder of the research is devoted to Hurricane Sandy, which hit in October 2012 and gained prominence due to its trajectory, which ran parallel to the US coast, sparking tremendous fear in much of the population. Its origin was traced to a Saharan dust event on 8 October 2012 that moved west until cyclogenesis conditions were reached over the Caribbean [19]. Its evolution was affected by polar and subtropical jet streams [20]. Finally, the “Greenland block”, a high-pressure area near Greenland, turned the hurricane towards the northwest coast of the United States [21]. This left turn was unusual [22] and the wind intensified due to a warm seclusion phase [23]. Its effects, such as moderate flooding and sand deposition [24] or soil contamination [25], were noticeable on the coast. However, water clarity and nutrients reached pre-storm conditions in about one year on the Hudson–Raritan estuary, whereas biotic recovery took longer than that in other estuaries [26]. Recent analyses of this hurricane have focused on its reintensification after its extratropical transition [27], its roll vortices, which were a prominent feature due to their large wavelengths [28], its surges [29,30], its effects on infrastructures [31], and its westward turn when it made landfall [32,33]. In the second section of this paper, modelled wind fields are used to explore the progression of wind statistics and the hurricane size. As a specific contribution of this research, this area is determined by plotting isotachs. Finally, since air parcel trajectories are spirals or similar, the evolution of the recirculation factor is studied, with the analysis of this factor being another original contribution of this research.

2. Materials and Methods

2.1. Database Description

Files considered in the current research correspond to the HWind Project [34,35], which are freely available [36]. This database extended mainly from 1994 to 2013, covering over 200 hurricanes. The information for each hurricane includes real-time observations and maps with the wind field and wind speed components in a grid, where the origin lies in the hurricane centre. These latter files were used in this paper.
One section of this study is devoted to analysing air parcel trajectories. These trajectories were calculated with the METeorological data EXplorer (METEX) model [37], which provides, among other variables, the hourly longitude and latitude of the air parcel one day before it reaches the desired point.

2.2. Statistics

Wind fields are described using robust statistics. The median, Q0.5, is considered as the location. Spread is quantified by the interquartile range, IQR = Q0.75 − Q0.25, where Q0.25 and Q0.75 are the first and third quartiles, respectively. Symmetry is determined by the Yule-Kendall index, γYK [38]
γ Y K = ( Q 0.25 2 Q 0.5 + Q 0.75 ) / I Q R
Finally, the distribution flatness is given by the robust kurtosis, RK [39]
R K = ( Q 0.75 Q 0.25 ) / [ 2 ( D 0.9 D 0.1 ) ] ,
where D0.1, and D0.9 are the first and ninth deciles, respectively. RK is 0.263 for a Gaussian distribution.

2.3. The Laplace Distribution

Its probability density function, f, is defined as
f ( x ) = 1 / ( 2 b )   e x p ( | x Q 0.5 | / b ) ,
where the median is the location parameter, and b is the scale parameter, and
b = 1 / n   i = 1 n | x i Q 0.5 | ,
where n is the number of xi, which are the wind speed values of each wind field.

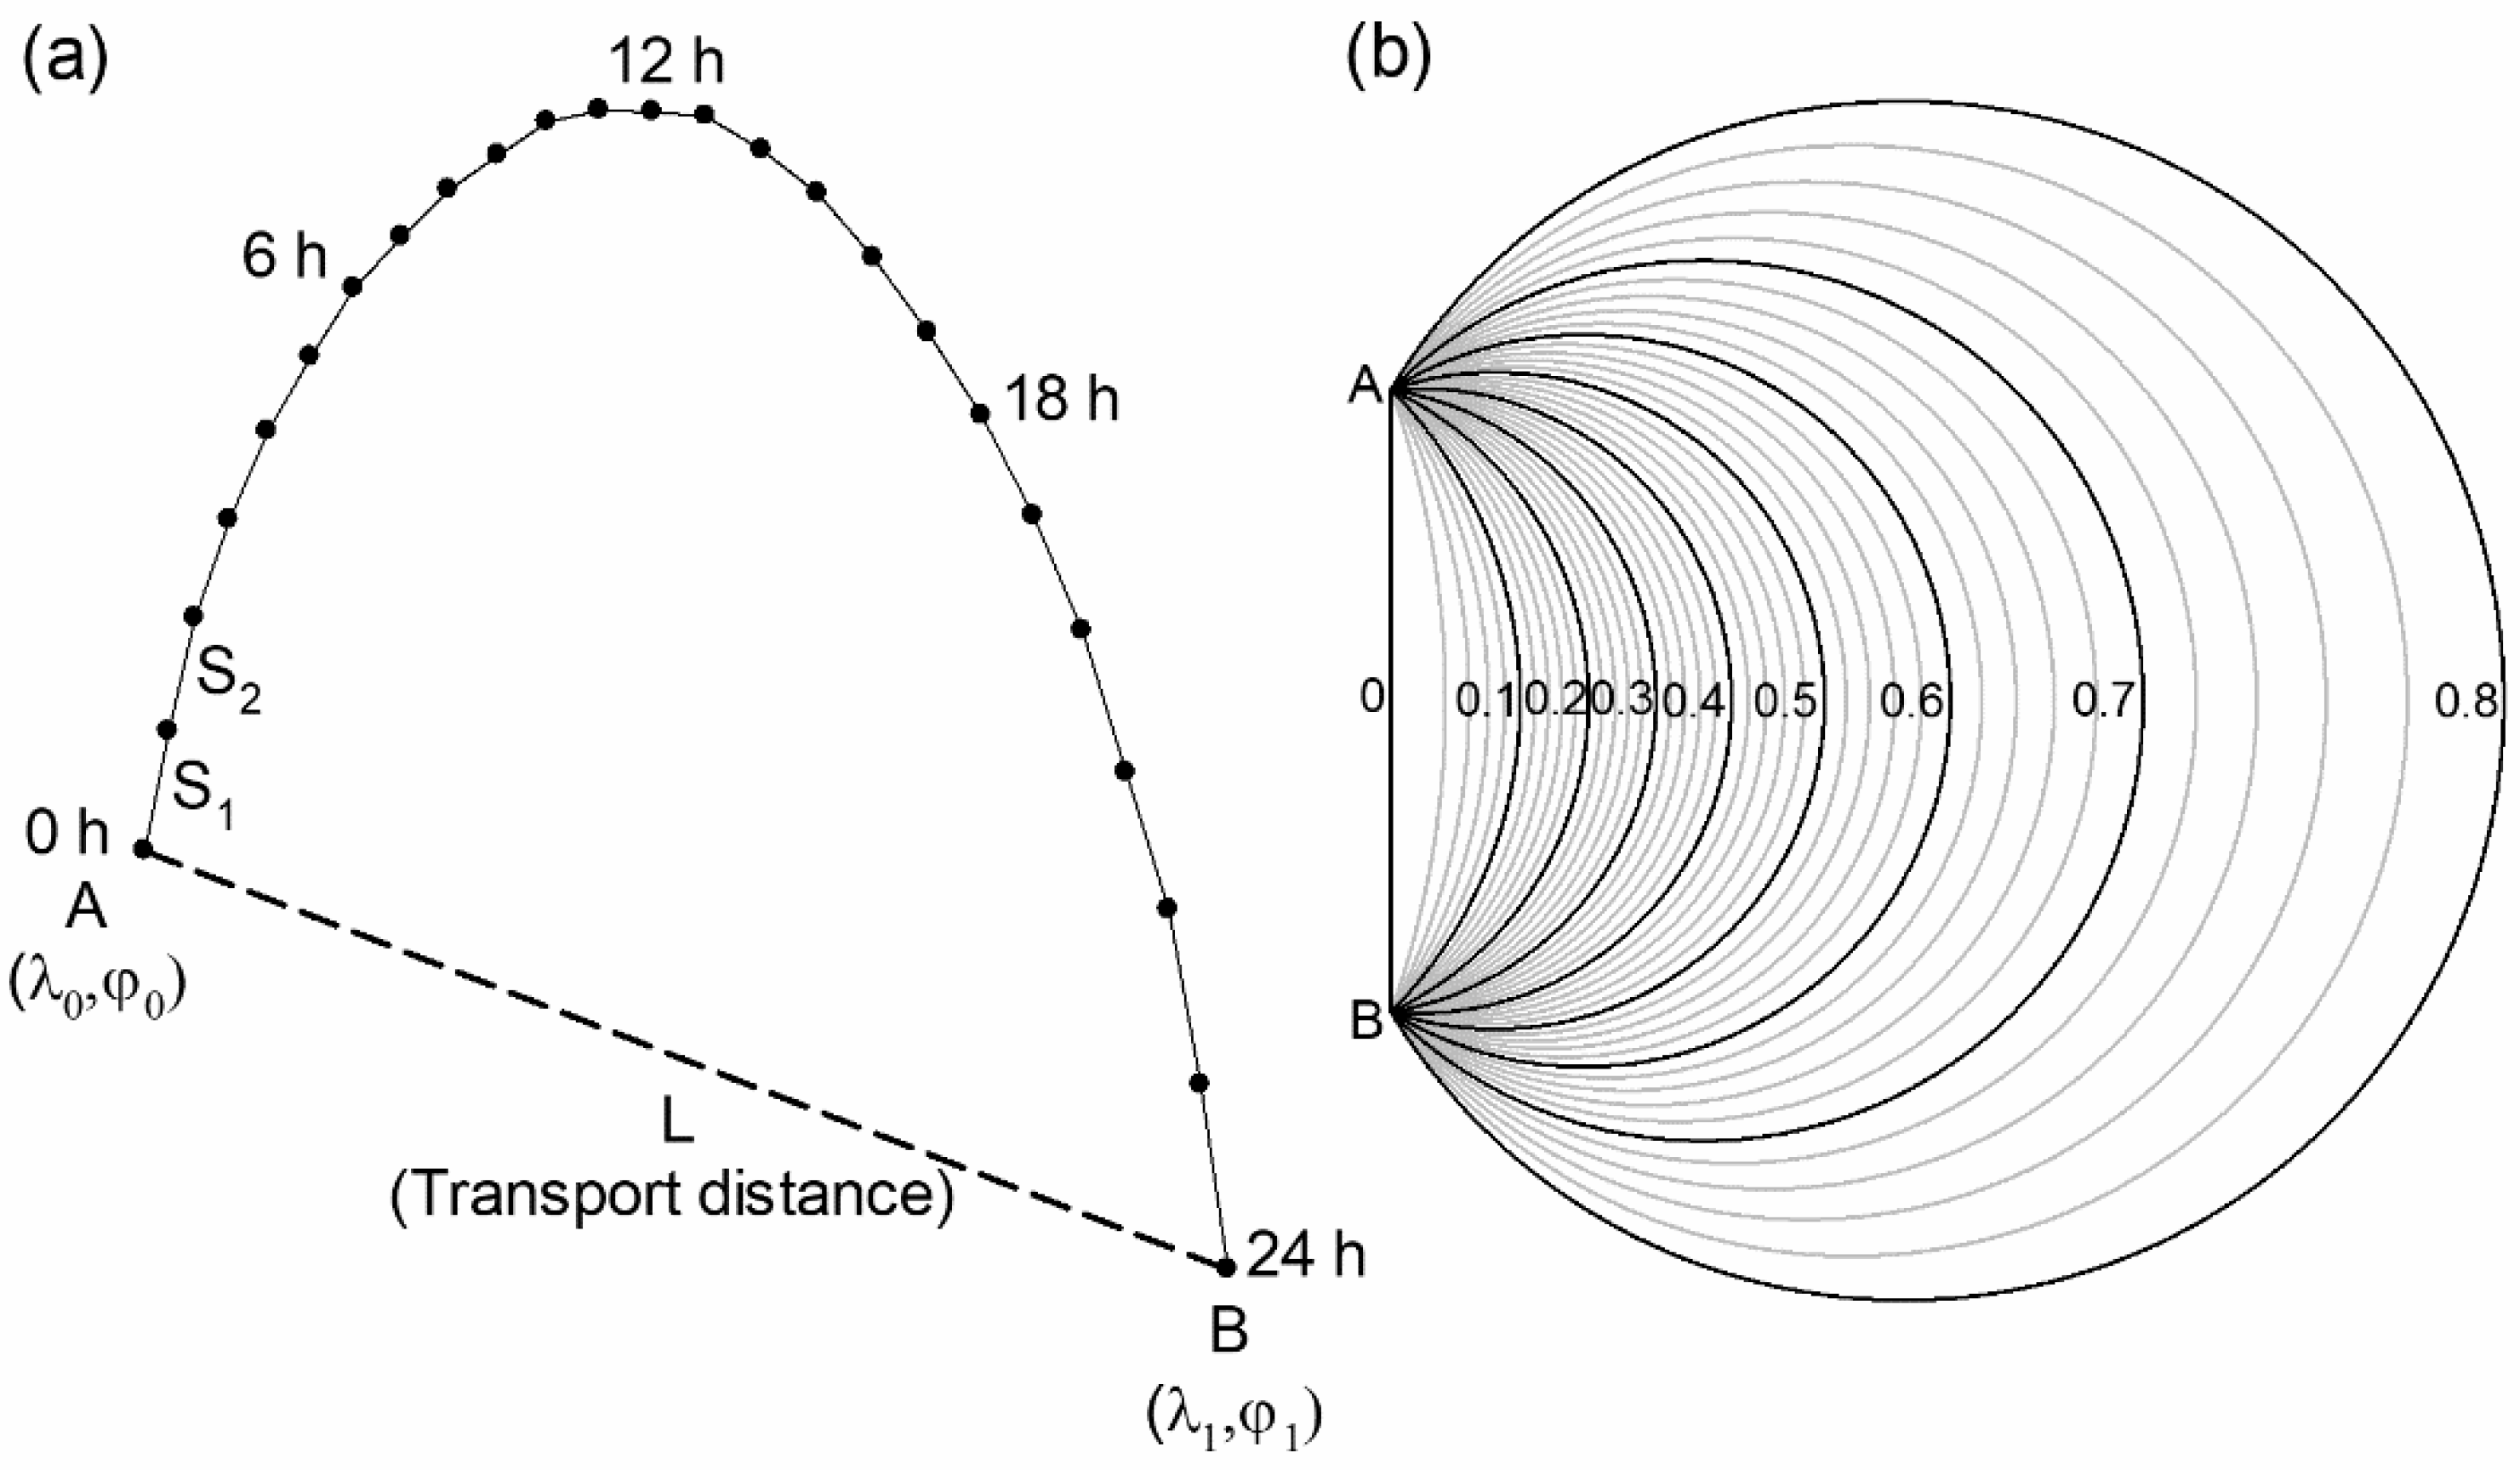
2.4. Recirculation Factor

This factor was introduced by Allwine and Whiteman [40] to indicate the presence of recirculation on a given timescale, usually one day. Figure 1a illustrates its calculation. The air parcel moves from point B, with longitude λ1 and latitude φ 1 , to point A(λ0, φ 0 ). Si is the distance travelled by the air parcel each hour, and the wind run, S, is its sum.
S = i = 1 24 S i ,
Transport distance, L, is the straight distance between the beginning, B, and end of trajectory, A, and the recirculation factor is
R = 1 L / S ,
which lies between 0 and 1. Since Si and L are arcs on the Earth’s surface, these distances are calculated by the Sinnott equation [41], which for arc L is
s i n ( L / 2 ) = { s i n 2 [ ( φ 0 φ 1 ) / 2 ] + cos φ 0 cos φ 1   s i n 2 [ ( λ 0 λ 1 ) / 2 ] } 1 / 2
R equal to 0 means no recirculation, since the trajectory is a straight line. However, when R is equal to 1, the air parcel has returned to its origin. Figure 1b presents different recirculation factors assuming that the corresponding trajectories are circumference arcs.

3. Results

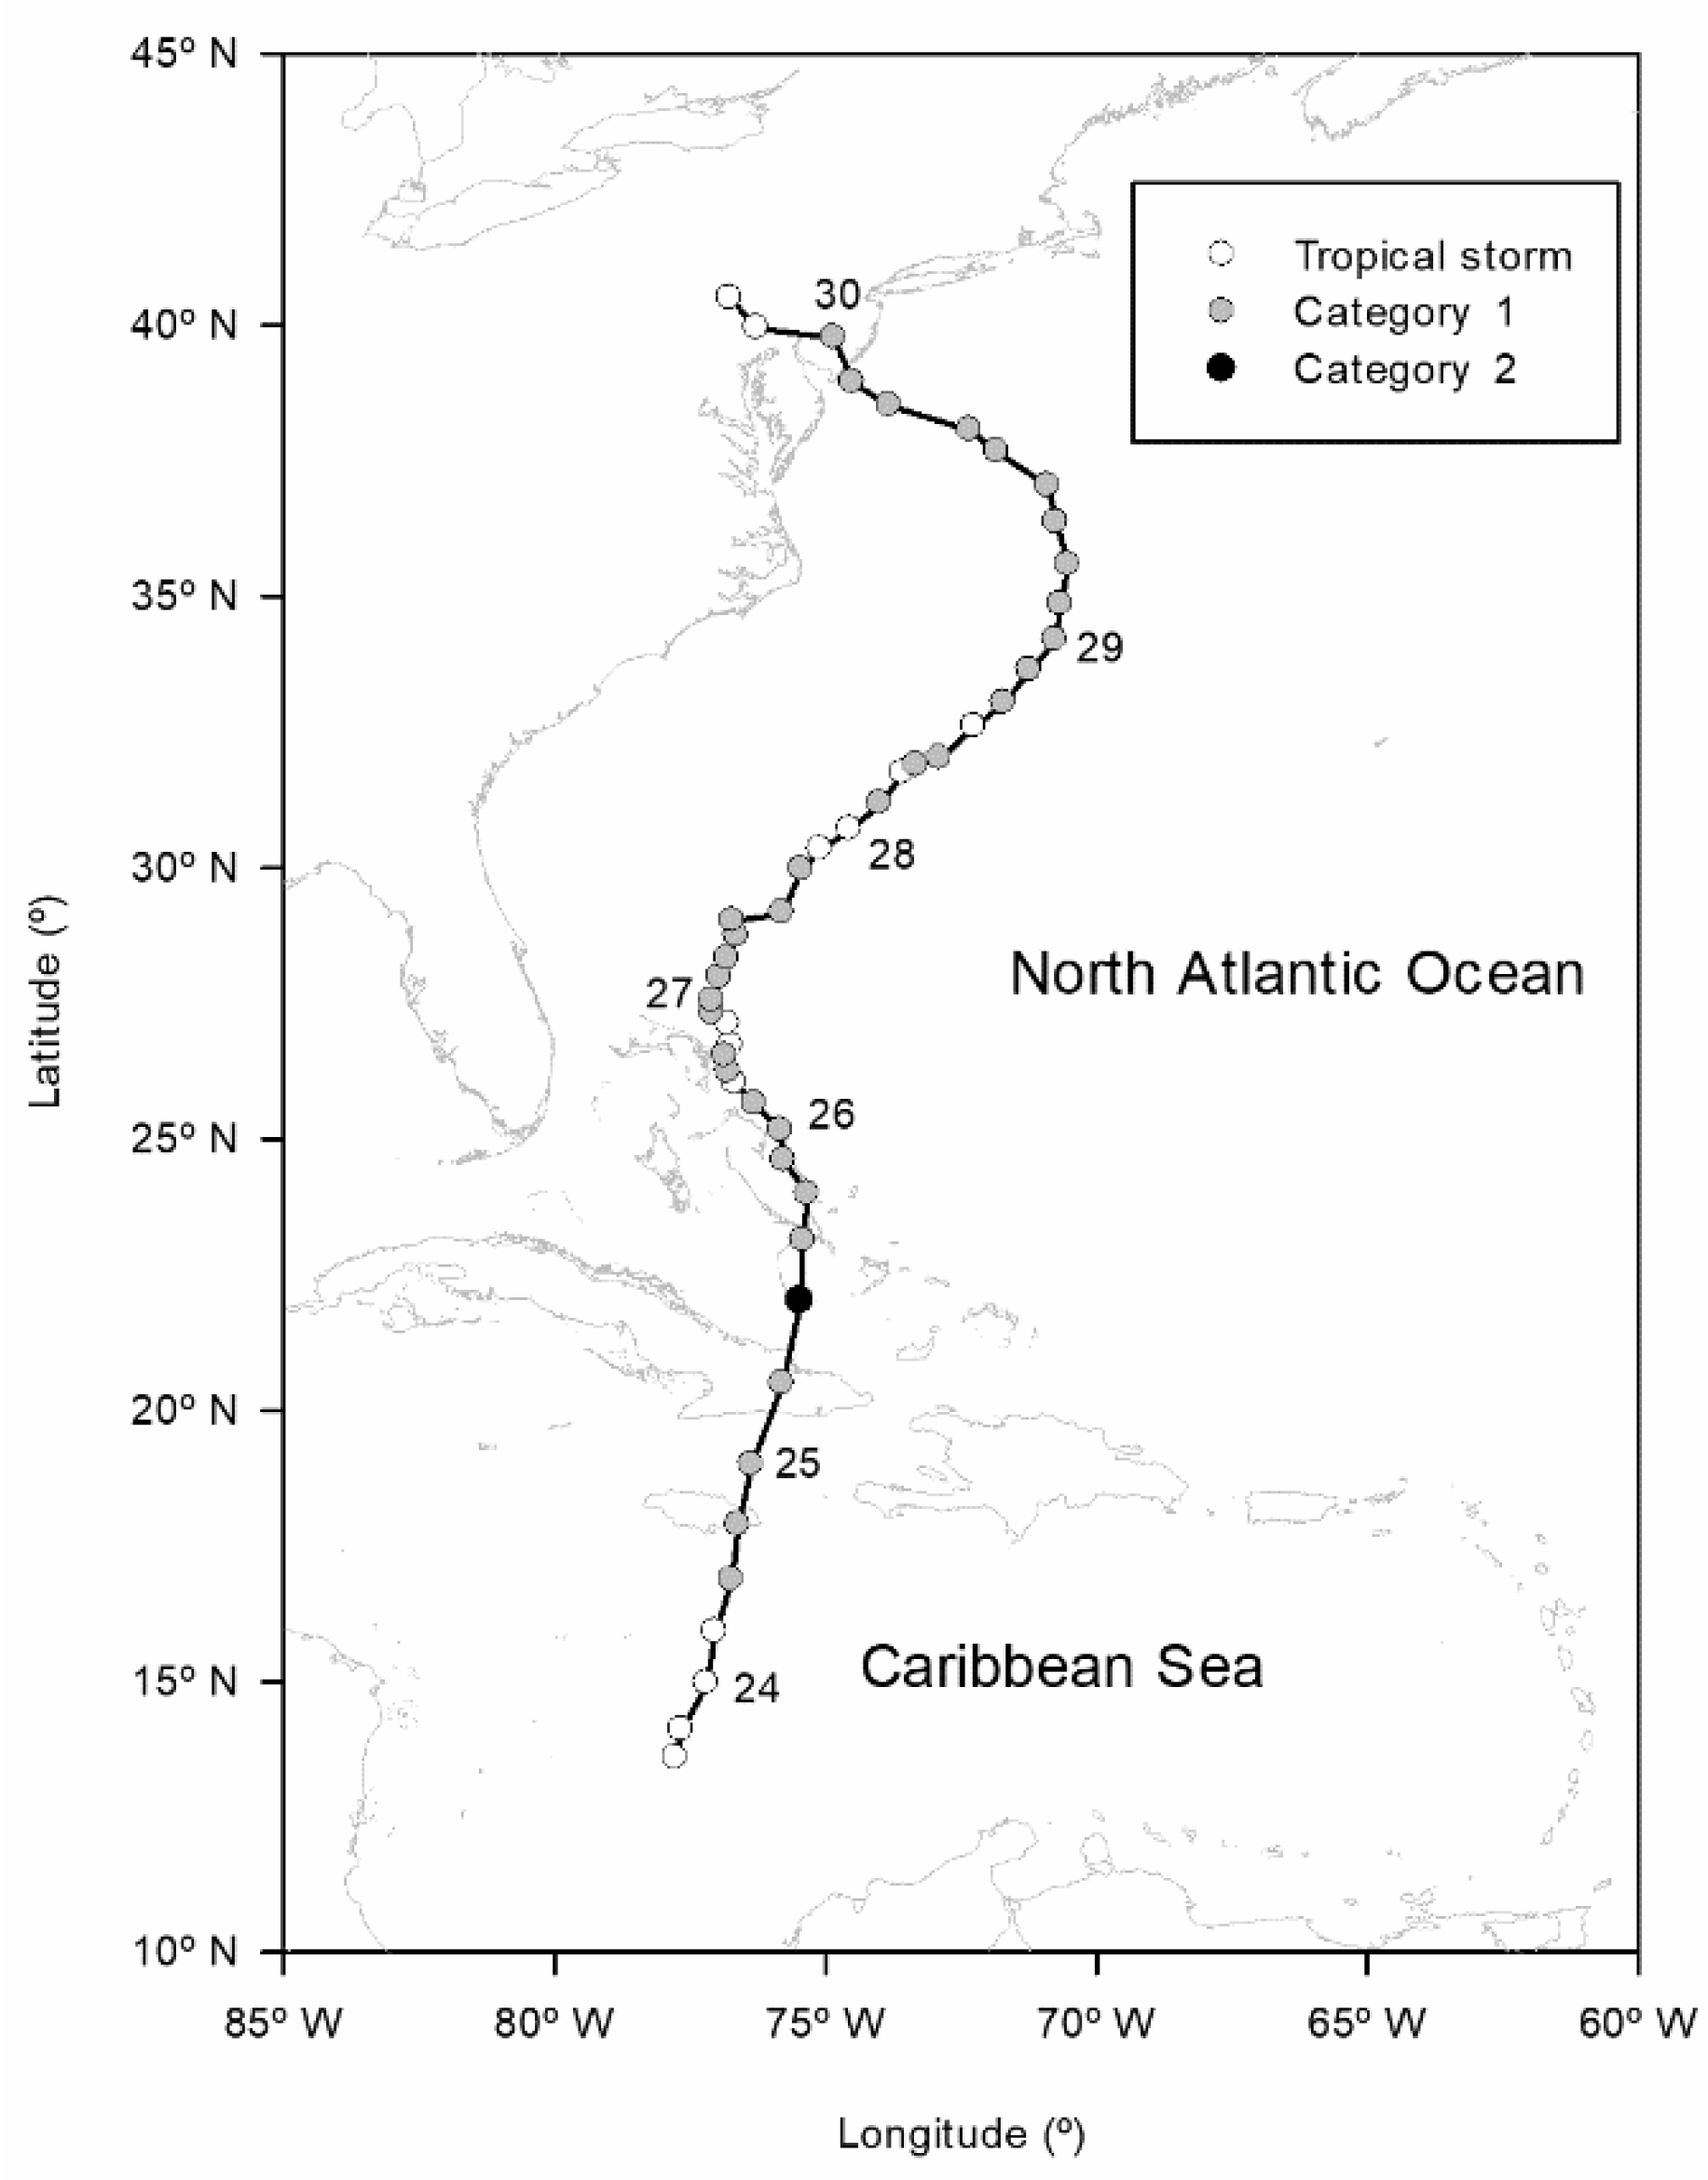
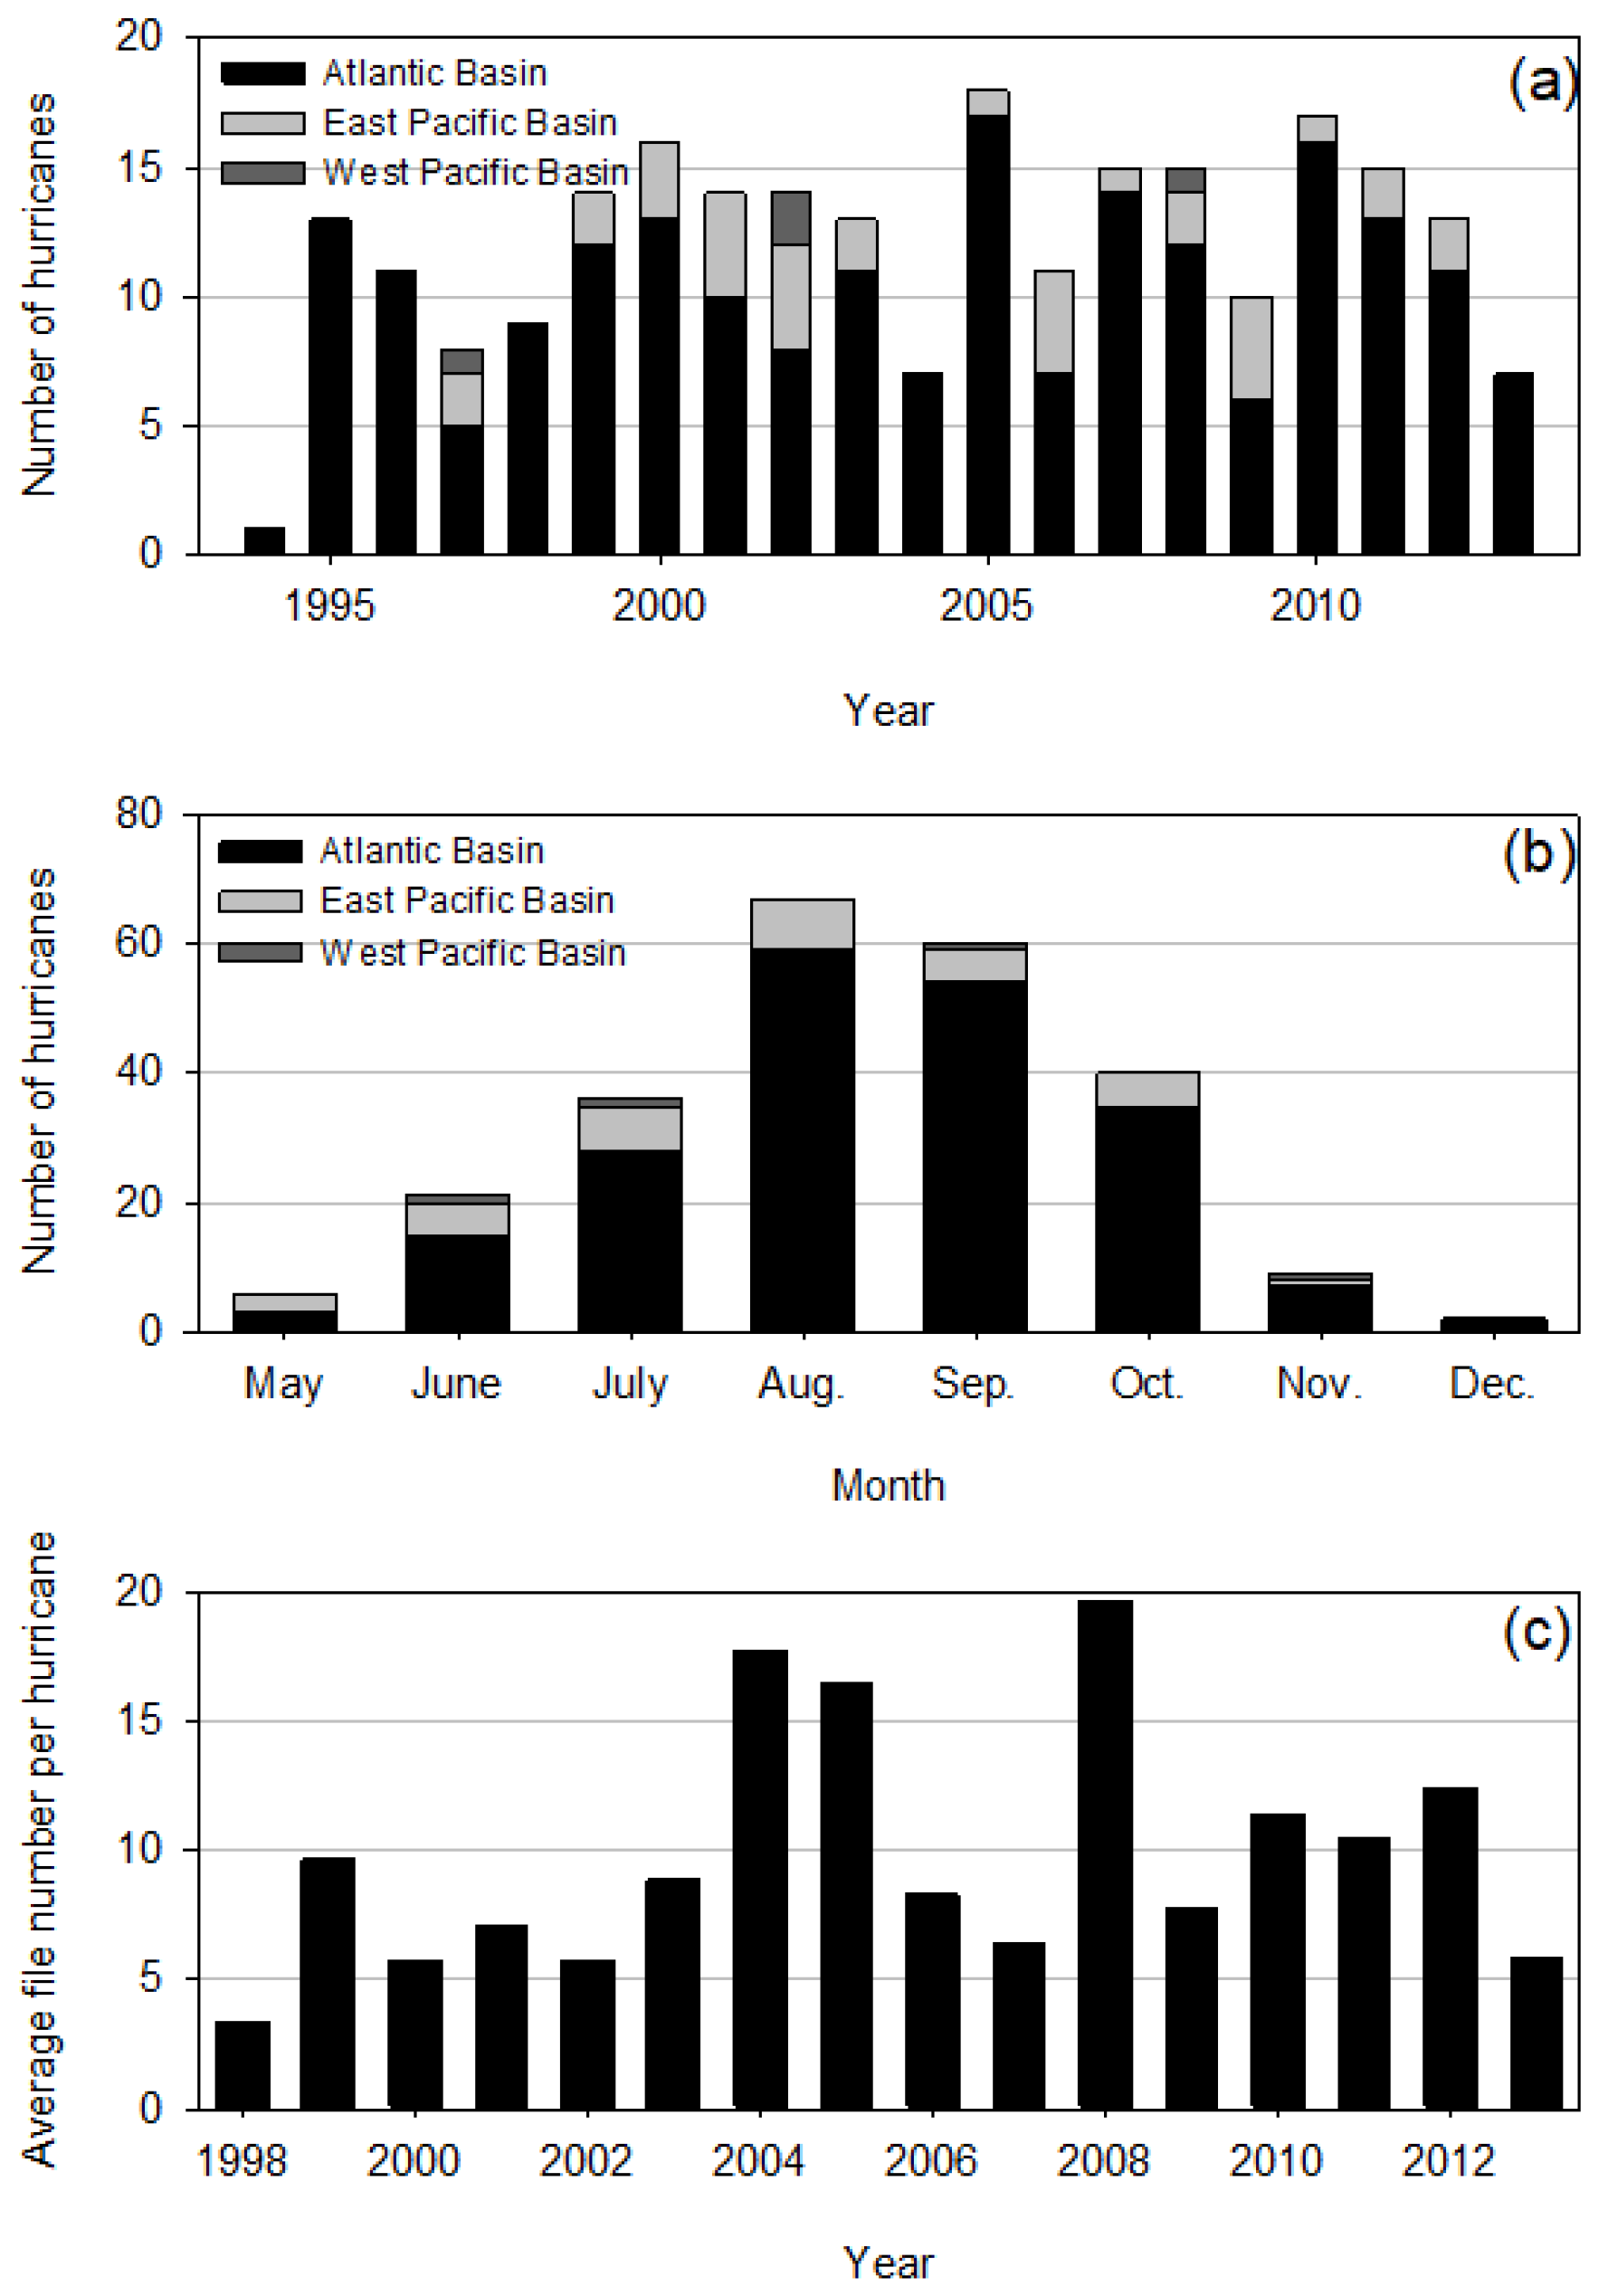
3.1. Database Analysis

Figure 2a presents the distribution of 241 hurricanes recorded in the period 1994–2013. Most correspond to the Atlantic Basin (84.23%), followed by the East Pacific Basin (14.11%) and the West Pacific Basin (1.66%). If the first year (1994) is excluded, the average number is 12.6 hurricanes per year. This is in sharp contrast to 2004, this being the year with the least number of hurricanes recorded, only seven, followed by the greatest number of hurricanes, 18, recorded in 2005. Another possible temporal analysis may be made by considering monthly distribution. Figure 2b shows that hurricanes in this database took place from May to December. This number gradually increased until the marked growth observed in August, with 67 hurricanes, followed by September, which had slightly fewer. A sharp decrease was noted in November, with nine hurricanes, the minimum being recorded in December with only two hurricanes. From a practical point of view, only hurricanes with the so-called GriddedData files may be useful for detailed analyses. These files are not available for the oldest hurricanes, and have only been present since 1998 for most hurricanes. However, a varying number of files may be found for each hurricane, reaching up to 60 files at different hours and days. Figure 2c presents the average number of files per hurricane. Although the mean is 9.7 and the number of files is close to this mean, this number is very noticeable in 2004, 2005, and 2008, with between 15 and 20 files per hurricane.

3.2. Analysis of Hurricane Sandy

Two criteria were considered when selecting a hurricane for detailed analysis: the number of GiddedData files and the social impact. Only 24 hurricanes occurring between 2005 and 2012 were described with at least 20 GriddedData files. Of these, six reached the highest category, Category 5, and only Hurricane Katrina, in 2005, left a marked social impact. However, the current research investigates Hurricane Sandy, which occurred in 2012. Although it was only Category 3 [42], it is described by 48 GriddedData files accompanied by a noticeable social impact reflected by the extremely high number of web search results to emerge. The files available cover from 23 to 30 October 2012. Moreover, each file contains over 20,000 wind speed values distributed in networks centred on the hurricane between about 1000 km × 1000 km and 2000 km × 2000 km.
Figure 3 shows the hurricane trajectory based on the HWind files. It appeared as a tropical storm on 23 October 2012 over the Caribbean at a latitude of about 14° N. It reached Category 1 in the following 24 h and made landfall in Jamaica on 24 October 2012. The hurricane crossed the island and wind speed increased over the Cayman trough before reaching Cuba. Substantial damage was reported in Haiti. The hurricane crossed Cuba in five hours, reached Category 2 (according to these files), and lay north of the Abaco Islands on 26 October 2012, where it lost its hurricane category. However, wind speed increased and hurricane category was again reached on 27 October 2012, when it commenced a trajectory that ran parallel to the US coast for about two days. Finally, it turned west on 29 October 2012, made landfall in New Jersey as a tropical storm at a latitude of about 40° N, and continued over the continent before disappearing.

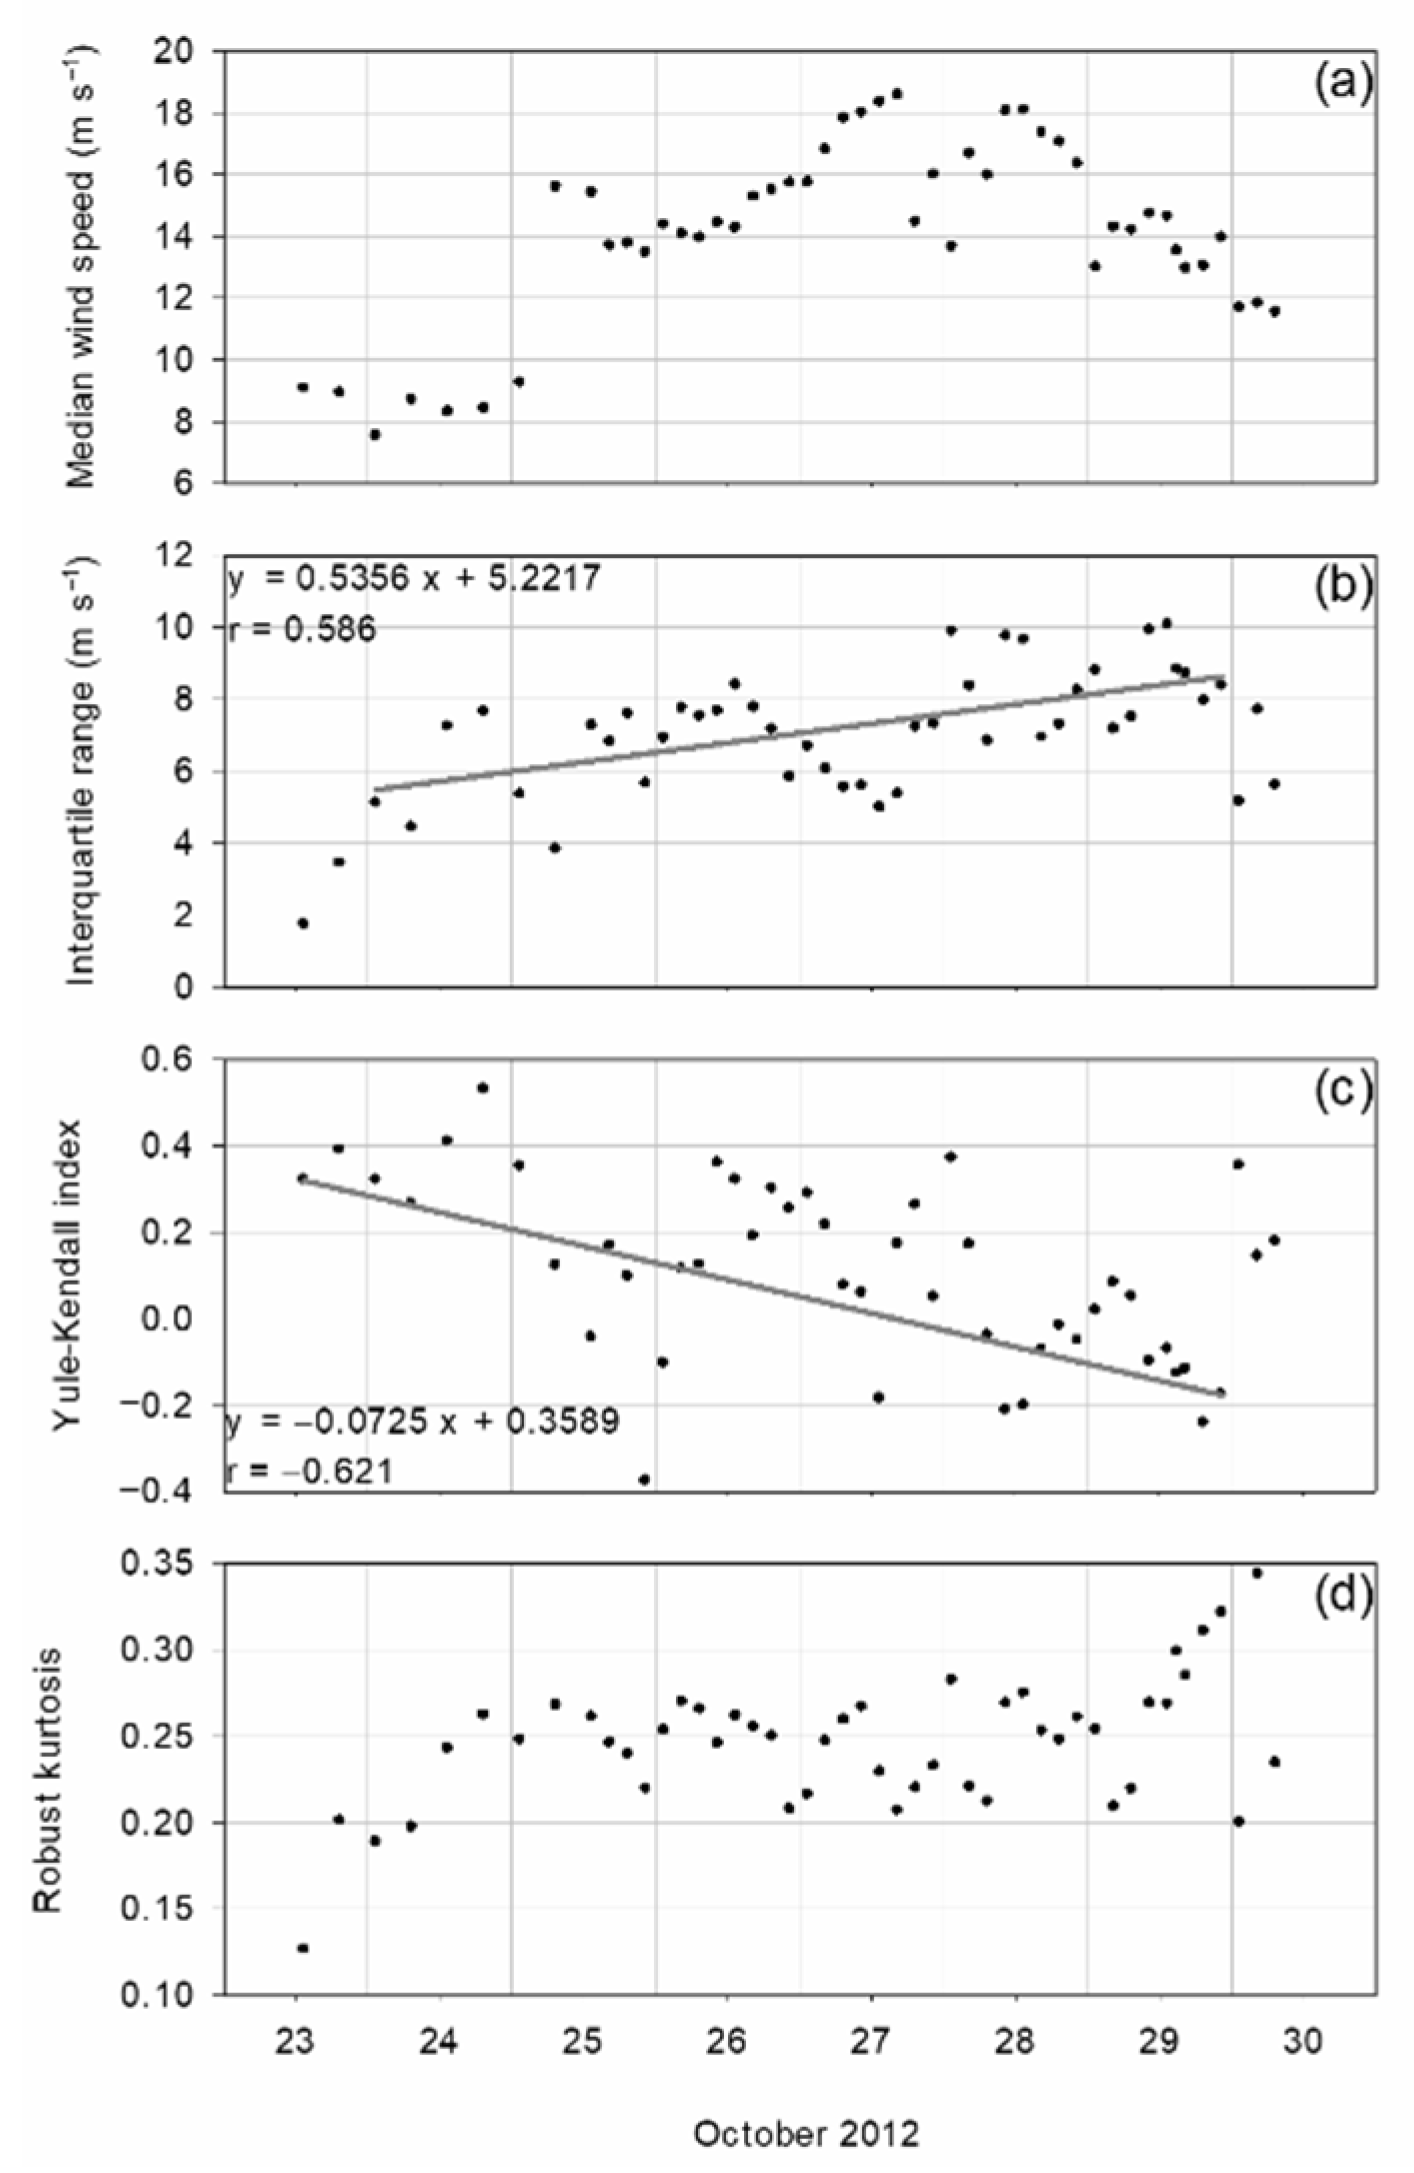
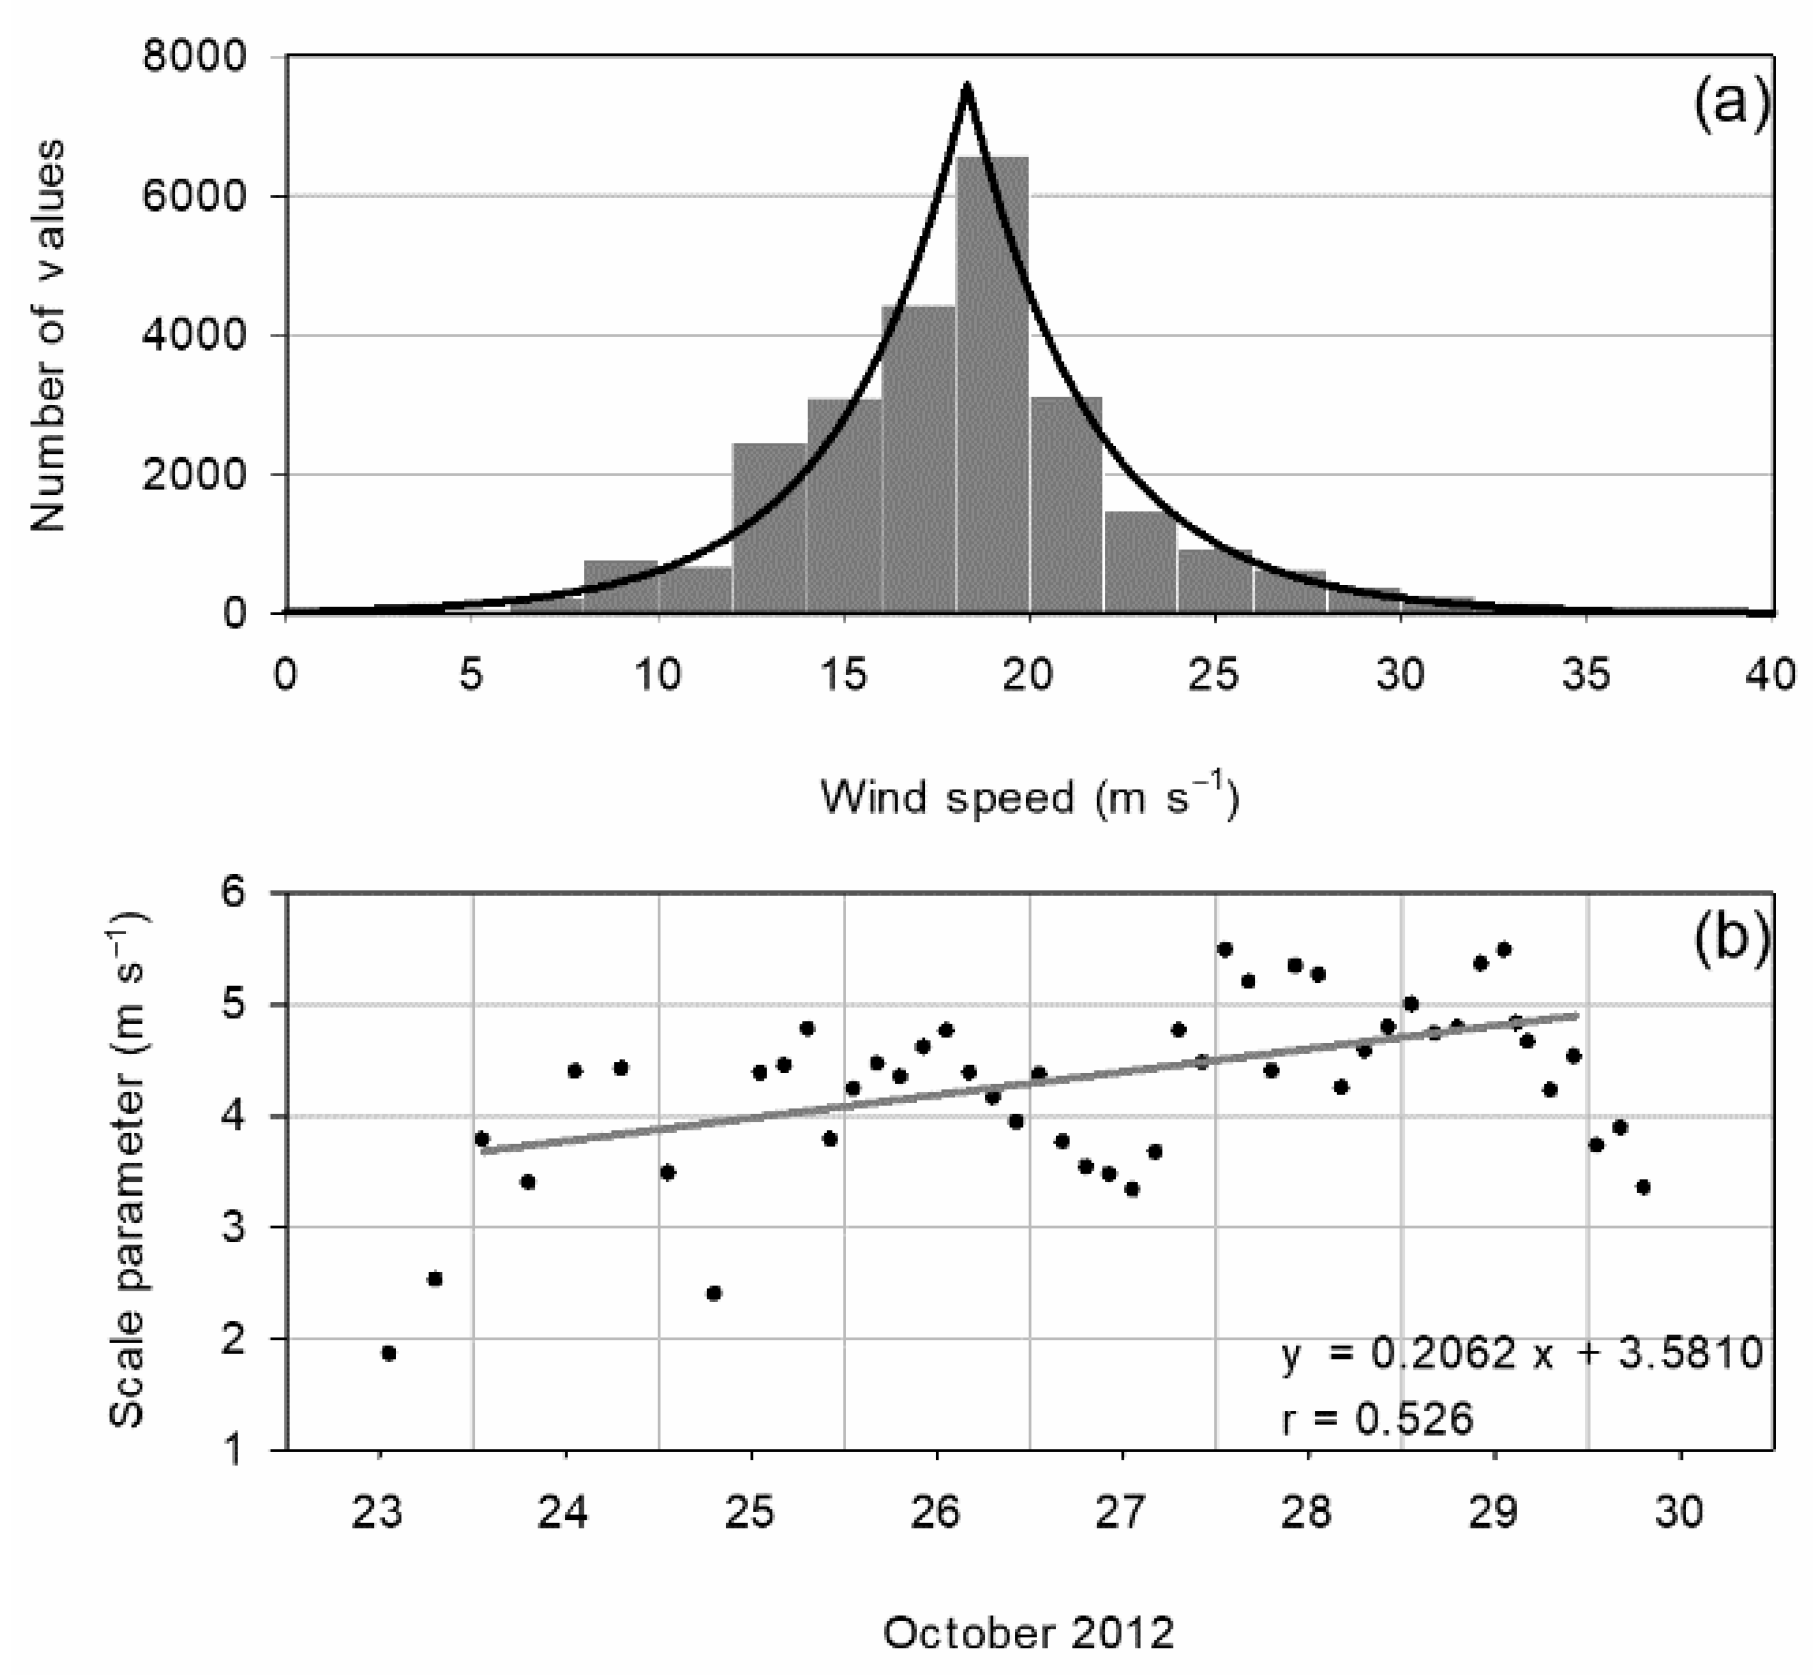
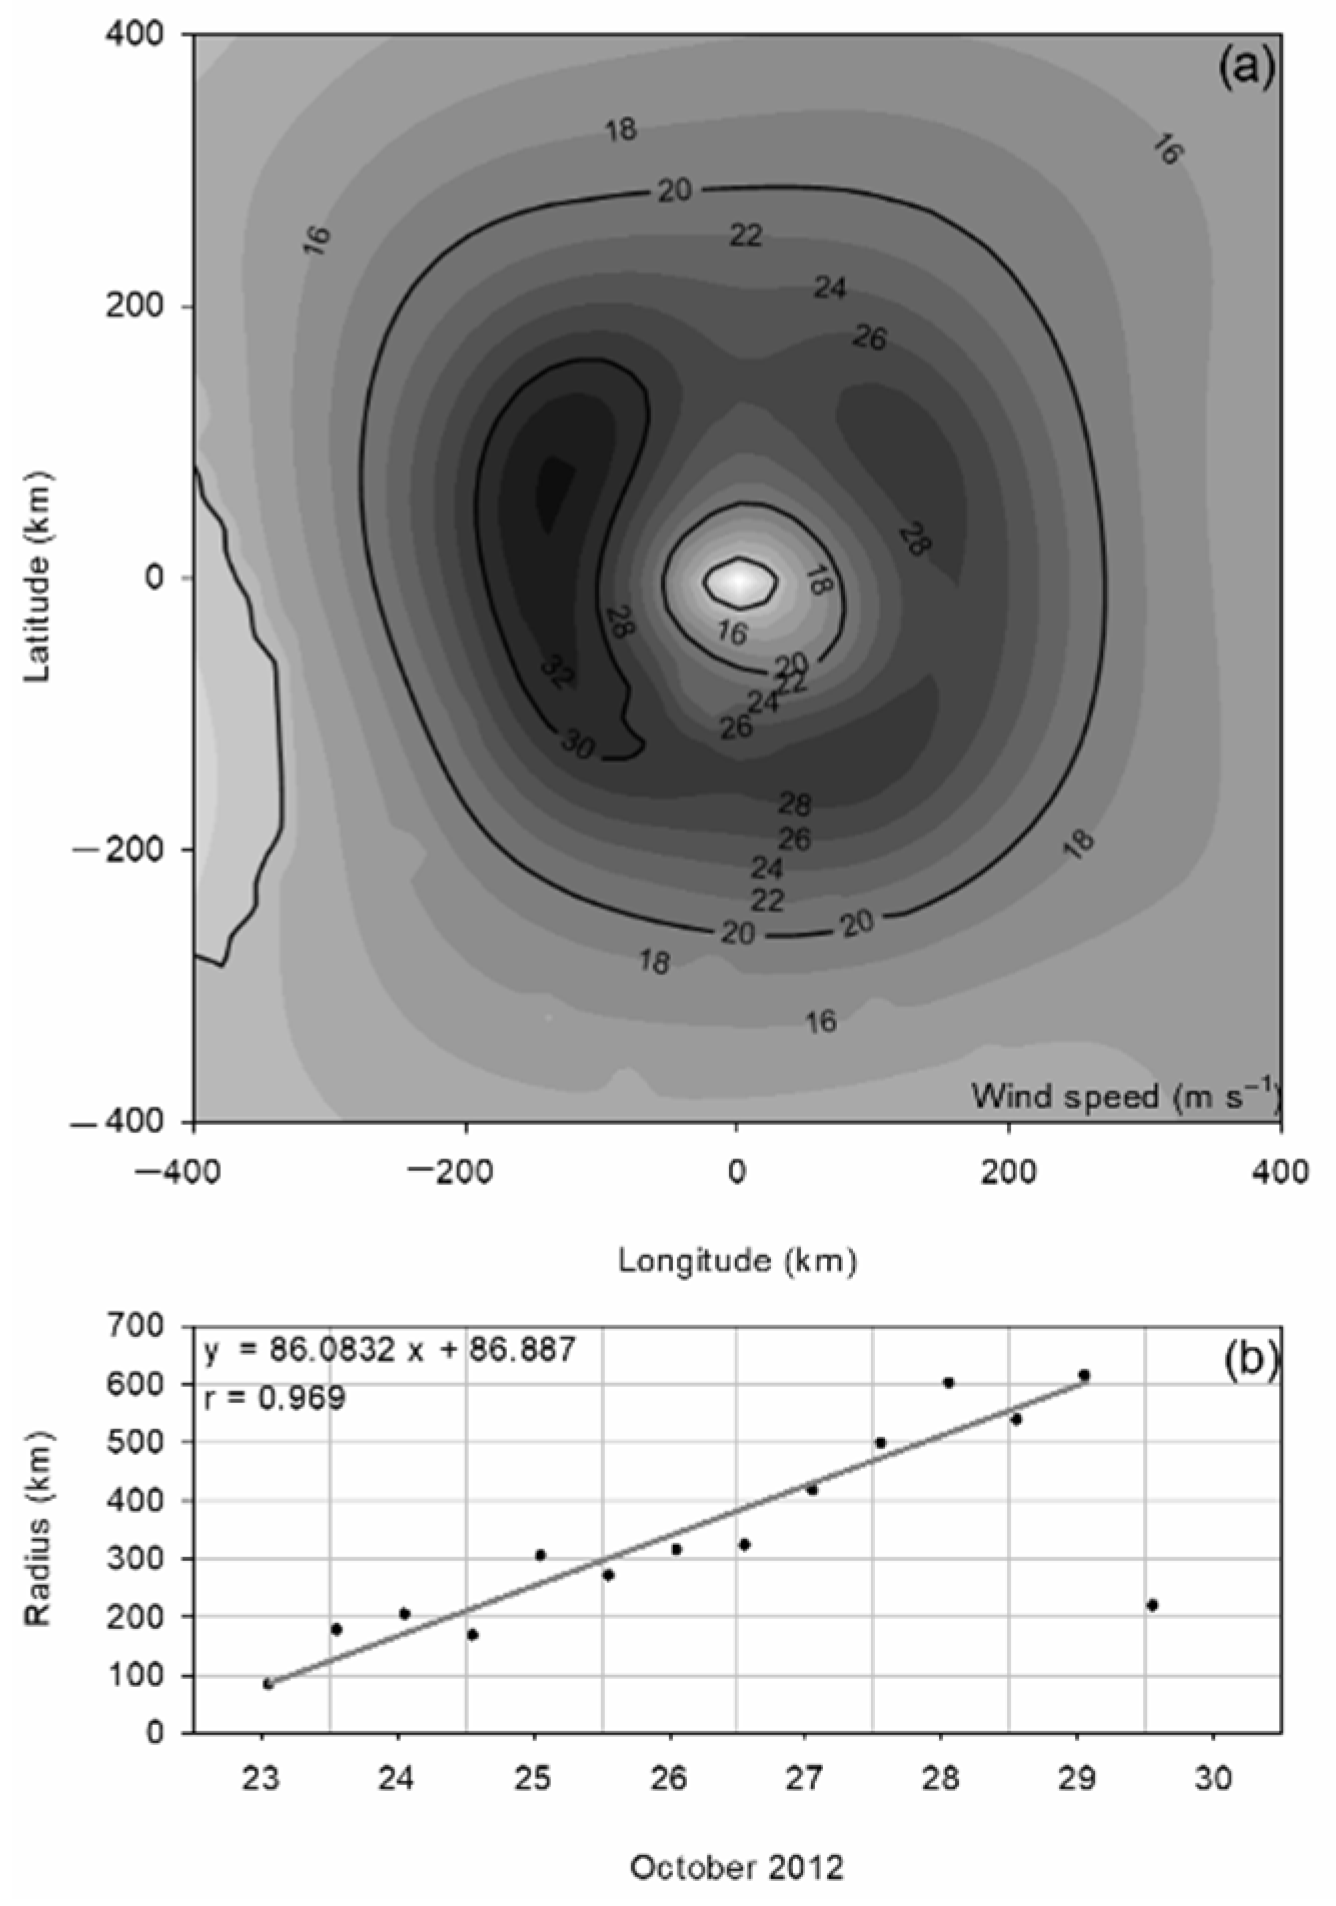
3.2.1. Wind Speed Analysis

The wind speed median presented in Figure 4a reveals a sharp transition on 25 October 2012, when it changed from around 9 m s−1 to nearly 16 m s−1. Moreover, a marked drop in wind speed was observed on late 27 and early 28 October 2012. However, the maximum wind speed remained above 30 m s−1 most of the time. The interquartile range presented a very soft lineal evolution from 24 October 2012 at around 5 m s−1, to 29 October 2012 with around 8 m s−1, seen in Figure 4b. The correlation coefficient of this fit is statistically significant at a 0.1% level. In a similar period, the Yule–Kendall index evolved linearly from positive skewness, around 0.4, to nearly symmetrical or even slightly left-skewed distributions, seen in Figure 4c. The correlation coefficient is also statistically significant at a 0.1% level for this variable. Finally, the robust kurtosis was similar to that of a Gaussian distribution, seen in Figure 4d.
Figure 5a shows an example of the wind speed histogram. Its shape describes extremely high frequencies in few central wind speed values bounded by low frequencies in the remaining wind speeds, with decreasing frequencies when the wind speed moves away from the central values. This shape suggests that the wind speed is similar in most of the region covered by the hurricane, and the Laplace distribution may suitably describe wind speed. One parameter of this distribution is the median wind speed, whose evolution was previously presented. The other parameter is the scale parameter, which may be calculated with Equation (4). Figure 5b shows its progression, where a slight linear trend with a rate of around 0.21 m s−1 each day was observed from 24 to 29 October 2012, revealing that the interval of frequent wind speeds grew wider over time, in agreement with the interquartile range. In any case, progression is somewhat irregular, with certain abrupt changes. However, the correlation coefficient is statistically significant at a 0.1% level.

3.2.2. Surface Analysis

Isotachs were calculated each twelve hours. By way of an example, Figure 6a shows the wind speed on 27 October 2012 at 1.30 UTC. From plots such as this, isotachs corresponding to the boundaries of the Saffir-Simpson scale were selected, and the surface where the hurricane reaches each category was calculated. Moreover, since the shape of the hurricane resembles a circle, the radius corresponding to the surface equal to, or higher than, a tropical storm was calculated and is presented in Figure 6b. This radius increases linearly at a rate of around 86 km per day, with a correlation coefficient that is statistically significant at a 0.1% level.

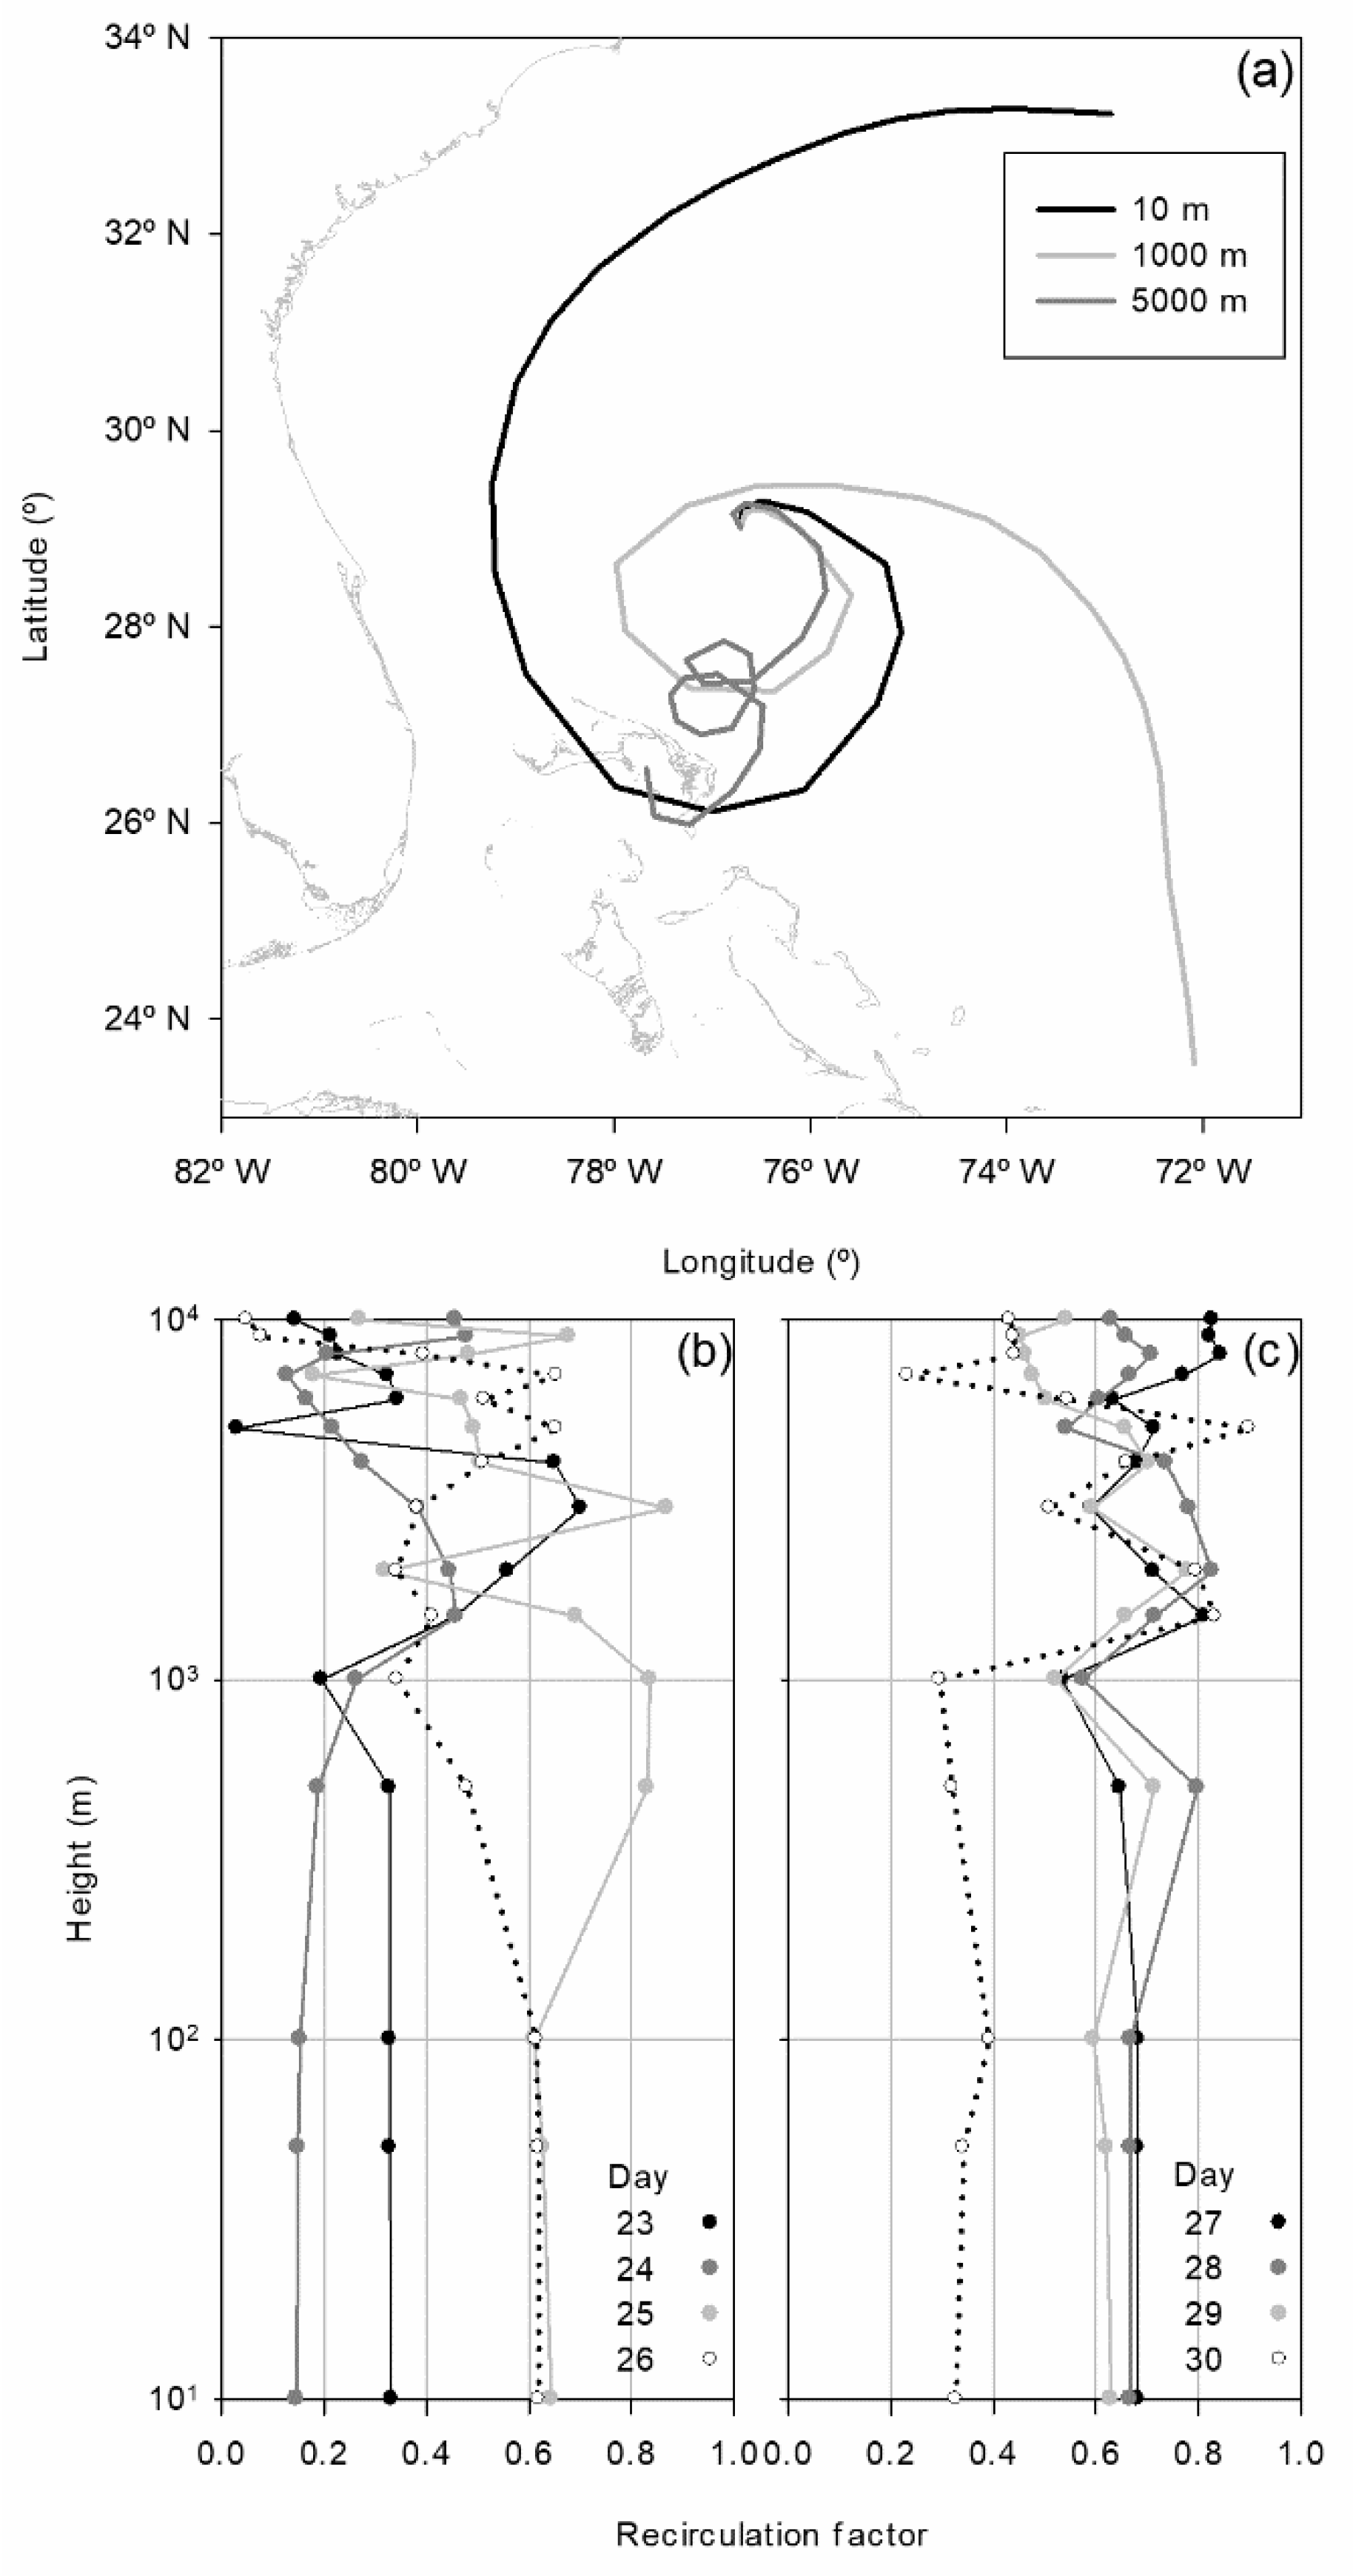
3.2.3. Recirculation Factor Analysis

Figure 7a presents the air parcel trajectories ending at the hurricane centre at 10, 1000, and 5000 m in height on 27 October 2012 at 13.30 GMT. Although recirculation is noticeable for these trajectories, the main difference is that trajectories at 10 and 1000 m are simpler, like spirals, than the 5000 m trajectory, which presents loops. This behaviour may be due to surface friction, which is more accentuated near the surface, causing lower wind speeds than those recorded in the mid troposphere. These high wind speeds and the composition of rotation and translation would be responsible for complex trajectories observed at this level. Moreover, Figure 7b,c presents the evolution of the recirculation factor in the whole troposphere, calculated from trajectories obtained with the METEX model, ending at the hurricane’s centre at selected times. From a practical point of view, the layer below 1000 m is the most interesting due to its impact on human life. The recirculation factor is relatively uniform in this layer and its values are relatively high (around 0.6) most of the time. In order to investigate the influence of the end point of the air parcel trajectories on the recirculation factor, these factors were also calculated for trajectories ending at a point whose latitude was 2° lower than the hurricane’s centre latitude, but with the same longitude. Although the resulting recirculation factors varied enormously, they were, on average, around 0.1 lower for these latter trajectories in the low atmosphere, from 10 to 500 m.

4. Discussion

4.1. Database Analysis

Chavas et al. [43] presented the spatial distribution of hurricane tracks on the Earth in the period 1999–2009 where the lowest number was observed over the Southern Pacific Ocean and Southern Indian Ocean. In the remaining basins, these trajectories were similar for the Atlantic and East Pacific basins. In both regions, hurricanes approached the continent from low latitudes, then veered and moved away from the continent to higher latitudes, with the greatest latitudes being reached in the Atlantic basin. However, hurricanes in the West Pacific basin were confined to low latitudes.
Delgado et al. [44] reanalysed the North Atlantic hurricane database for the period 1954 to 1963. They obtained an average of around 11 storms (tropical storms and hurricanes) per year, with the number varying between 7 and 16. This average was around six for hurricanes each year, ranging between three and nine, and around three per year for major hurricanes, ranging between none and five.
Most hurricanes described in Section 3.1 occur in the second part of the year. This result is in agreement with the study presented by Corporal-Lodangco and Leslie [45], who investigated tropical cyclones in the Philippine region during the period 1945–2011. They reported two seasons: the less active season, from January to May, with a median seasonal frequency of two, and the more active season, from June to December, with a median seasonal frequency of 15. However, although hurricane seasons are usually felt to exist, their start is not fixed since this may be influenced by atmospheric processes. For example, a significant delay in the start of the hurricane season in the western North Pacific was observed after a strong El Niño in the preceding winter [46].
Anomalies in the sea surface are responsible for changes in hurricane frequency. Wang et al. [47] investigated Atlantic hurricanes from 1951 to 2010 and concluded that warm anomalies in the sea surface temperature in wintertime in the main Atlantic development region are frequently followed by unusually active hurricane seasons. Moreover, the hurricane frequency may be affected by certain trends, since analyses of cyclone genesis frequency from October to December over the western North Pacific revealed a decreasing trend with two periods, the first from 1980 to 1995, with about ten hurricanes per year, seven of which could be assigned to the eastern region, and the second from 1996 to 2011, with about six hurricanes per year, where around four may be assigned to the western region [48]. Another factor that may impact on this frequency could be climate change, since analyses of the strength and distribution of hurricanes during the 2016 North Atlantic hurricane season revealed that said year was noticeable for a series of events never before observed, such as the observation site for a high category or the number of high category hurricanes in the same month [49].

4.2. Wind Speed

These measurements have occasionally been taken if the experimental device is near the hurricane route [50]. In these situations, the wind speed gradually increases to the maximum, and then decreases once the hurricane centre moves away from the experimental site. Although measurements are taken at a single point, they may be considered similar at sites that are an equal distance from the centre, since radial symmetry is assumed. Moreover, studies normally present the horizontal wind speed profile, where one maximum is reached at a certain distance [51], and this wind speed shape has occasionally been modelled [52,53].
Although analyses of wind speed distribution are not common, the current study considers the Laplace distribution of the wind speed due to the shape of the wind speed histogram. However, Cui and Caracoglia [54] used the Weibull distribution for annual wind speed maxima.

4.3. Radius

For US tropical cyclone forecast centres, estimating the maximum extent of the 17.5, 25.7, and 32.9 m s−1 (34, 50 and 64 kt, respectively) winds in compass quadrants (northeast, southeast, southwest, and northwest) surrounding the hurricane centre is critical [55,56]. These wind thresholds are known as gale-force, destructive, and hurricane-force, and the corresponding distances are called the “wind radii”. The average 17.5 m s−1 wind radius calculated in 2014–2015 in the western North Pacific basin was around 248 km, larger than those for the Atlantic and eastern North Pacific basins, which were around 176 and 152 km, respectively [57].
Chavas and Emanuel [58] analysed the azimuthally-averaged radius of 12 m s−1 wind, r12, and the radius of vanishing winds, r0, for a dataset covering the period 1999–2008. Their global median values were 197 and 423 km, respectively. Moreover, they presented these values in each basin. The largest radii were reached in the West Pacific basin, around 250 and 500 km, whereas the smallest values were observed in the East Pacific basin, slightly below 150 and 350 km.

4.4. Air Parcel Trajectories

Wind speed vertical profiles in the boundary layer modelled by Snaiki and Wu [59] revealed the noticeable influence of the surface below 300 m, where the change is around 5 m s−1. Shu et al. [60] presented the wind speed profile in the troposphere, with the maxima being reached at nearly 1000 m height and close to 35 m s−1.
Myers and Malkin [61] presented the spiral trajectory of air parcels in a hurricane and Niu et al. [62] considered its mathematical form by a logarithmic spiral. Spirals observed in trajectories at low altitudes may be attributed to friction with the surface, whereas loops in the mid troposphere may be due to a composition of the wind rotation and the hurricane displacement.

5. Conclusions

Most of the hurricanes in the HWind project were formed in the Atlantic basin, mainly between August and September, with the southern hemisphere being excluded. Only 24 of these hurricanes between 2005 and 2012 presented more than 20 files per hurricane, thus making detailed analyses possible. Most of these hurricanes occurred in 2005 and 2008. Among these, Hurricane Sandy was the most recent and had the greatest social impact due to its trajectory, which ran parallel to the US coast. For over half of its life cycle, it was Category 1 or even 2. The calculation of different statistics indicated that its median wind speed increased sharply, to around 6 m s−1, on 25 October 2012. However, the interquartile range increased linearly for most of its life cycle at a rate of 0.54 m s−1 per day and the Yule-Kendall index decreased slightly, revealing a symmetry evolution from right-skewed to nearly symmetrical or even left-skewed distributions. The robust kurtosis remained similar to that of the Gaussian distribution. The Laplace distribution was used for the wind speed, and its scale parameter increased linearly at a rate of 0.21 m s−1 per day. Assuming a circular shape, its radius for wind speed as at least a tropical storm was calculated, and a linear increase of around 86 km per day was observed.
Moreover, the recirculation factor remained around 0.6 close to the ground, although it reached even greater values at heights free from the surface influence. However, this factor should not replace the trajectory representation, since it may not be representative enough of trajectory shape, which is a spiral close to the ground but a loop in the mid-troposphere.
Finally, the database used has proved powerful enough to allow a detailed study of hurricanes, with the analysis presented in the current paper being extensible to other hurricanes in order to gain insights into evolution patterns, since it would be interesting to ascertain whether trends observed in certain statistics reflect general behaviours. Moreover, since all the files can be downloaded, their systematic analyses will improve the time resolution of calculations so as to achieve a full description of the hurricanes in this database. Additionally, specific regions could be selected in the files for particular spatial analyses.

Author Contributions

Conceptualization, methodology and writing—original draft preparation, I.A.P.; formal analysis and data curation, P.M.; writing—review and editing, M.d.l.Á.G. and N.P.; supervision, M.L.S. All authors have read and agreed to the published version of the manuscript.

Funding

This research received no external funding.

Institutional Review Board Statement

Not applicable.

Informed Consent Statement

Not applicable.

Data Availability Statement

Wind speed files are available from Risk Management Solutions, Inc. http://www.rms.com/models/hwind/legacy-archive (accessed on 1 June 2018). METEX simulations were performed on http://db.cger.nies.go.jp/metex/trajectory.html (accessed on 1 June 2018).

Conflicts of Interest

The authors declare no conflict of interest.

References

  1. Depietri, Y.; McPhearson, T. Changing urban risk: 140 years of climatic hazards in New York City. Clim. Chang. 2018, 148, 95–108. [Google Scholar] [CrossRef] [Green Version]
  2. Crowley, R.; Robeck, C.; Dompe, P. A three-dimensional computational analysis of bridges subjected to monochromatic wave attack. J. Fluids Struct. 2018, 79, 76–93. [Google Scholar] [CrossRef]
  3. Gallucci, M. Rebuilding Puerto Rico’s Grid: Eight months after Hurricane Maria, electricity is nearly restored—But that’s just the beginning. IEEE Spectr. 2018, 55, 30–38. [Google Scholar] [CrossRef]
  4. Hallowell, S.T.; Myers, A.T.; Arwade, S.R.; Pang, W.; Rawal, P.; Hines, E.M.; Hajjar, J.F.; Qiao, C.; Valamanesh, V.; Wei, K.; et al. Hurricane risk assessment of offshore wind turbines. Renew. Energy 2018, 125, 234–249. [Google Scholar] [CrossRef]
  5. He, Y.; Han, X.; Li, Q.; Zhu, H.; He, Y. Monitoring of wind effects on 600 m high Ping-An Finance Center during Typhoon Haima. Eng. Struct. 2018, 167, 308–326. [Google Scholar] [CrossRef]
  6. Murià-Vila, D.; Jaimes, M.A.; Pozos-Estrada, A.; López, A.; Reinoso, E.; Chávez, M.M.; Peña, F.; Sánchez-Sesma, J.; Lopez, O. Effects of hurricane Odile on the infrastructure of Baja California Sur, Mexico. Nat. Hazards 2018, 91, 963–981. [Google Scholar] [CrossRef]
  7. Huang, P.; Tao, L.; Gu, M.; Quan, Y. Experimental study of wind loads on gable roofs of low-rise buildings with overhangs. Front. Struct. Civ. Eng. 2018, 12, 300–317. [Google Scholar] [CrossRef]
  8. Monteclaro, H.; Quinitio, G.; Moscoso, A.D.; Napata, R.; Liberty, E.; Anraku, K.; Watanabe, K.; Ishikawa, S. Impacts of Typhoon Haiyan on Philippine capture fisheries and implications to fisheries management. Ocean Coast. Manag. 2018, 158, 128–133. [Google Scholar] [CrossRef]
  9. Schwartz, R.M.; Tuminello, S.; Kerath, S.M.; Rios, J.; Lieberman-Cribbin, W.; Taioli, E. Preliminary Assessment of Hurricane Harvey Exposures and Mental Health Impact. Int. J. Environ. Res. Public Health 2018, 15, 974. [Google Scholar] [CrossRef] [Green Version]
  10. Holland, G. A Revised Hurricane Pressure–Wind Model. Mon. Weather Rev. 2008, 136, 3432–3445. [Google Scholar] [CrossRef] [Green Version]
  11. Lin, L.; Weng, F. Estimation of Hurricane Maximum Wind Speed Using Temperature Anomaly Derived From Advanced Technology Microwave Sounder. IEEE Geosci. Remote Sens. Lett. 2018, 15, 639–643. [Google Scholar] [CrossRef]
  12. Liu, Y.; Chen, D.; Li, S.; Chan, P. Revised power-law model to estimate the vertical variations of extreme wind speeds in China coastal regions. J. Wind. Eng. Ind. Aerodyn. 2018, 173, 227–240. [Google Scholar] [CrossRef]
  13. Kendall, W.S. Barycentres and hurricane trajectories. In Geometry Driven Statistics; Dryden, I.L., Kent, J.T., Eds.; John Wiley & Sons: Hoboken, NJ, USA, 2015; pp. 146–160. [Google Scholar] [CrossRef] [Green Version]
  14. Mok, D.K.H.; Chan, J.C.L.; Chan, K.T.F. A 31-year climatology of tropical cyclone size from the NCEP Climate Forecast System Reanalysis. Int. J. Clim. 2018, 38, e796–e806. [Google Scholar] [CrossRef]
  15. Meyer, G.; Vitiello, G. On the molecular dynamics in the hurricane interactions with its environment. Phys. Lett. A 2018, 382, 1441–1448. [Google Scholar] [CrossRef] [Green Version]
  16. Hosseini, S.R.; Scaioni, M.; Marani, M. On the influence of global warming on atlantic hurricane frequency. Int. Arch. Photogramm. Remote Sens. Spat. Inf. Sci. ISPRS Arch. 2018, 42, 527–532. [Google Scholar] [CrossRef] [Green Version]
  17. Kossin, J.P. A global slowdown of tropical-cyclone translation speed. Nature 2018, 558, 104–107. [Google Scholar] [CrossRef]
  18. Rojo-Garibaldi, B.; Salas-De-León, D.A.; Sánchez, N.L.; Gómez, M.A.M. Hurricanes in the Gulf of Mexico and the Caribbean Sea and their relationship with sunspots. J. Atmos. Sol. Terr. Phys. 2016, 148, 48–52. [Google Scholar] [CrossRef]
  19. Fontenot, A.T.; El-Askary, H.M.; Garay, M.J.; Campbell, J.R.; Kalashnikova, O.V. Characterizing the Impact of Aerosols on Pre-Hurricane Sandy. IEEE J. Sel. Top. Appl. Earth Obs. Remote Sens. 2018, 11, 1378–1386. [Google Scholar] [CrossRef]
  20. Varlas, G.; Papadopoulos, A.; Katsafados, P. An analysis of the synoptic and dynamical characteristics of hurricane Sandy (2012). Theor. Appl. Clim. 2018, 131, 443–453. [Google Scholar] [CrossRef]
  21. Mattingly, K.S.; McLeod, J.T.; Knox, J.A.; Shepherd, J.M.; Mote, T.L. A climatological assessment of Greenland blocking conditions associated with the track of Hurricane Sandy and historical North Atlantic hurricanes. Int. J. Clim. 2014, 35, 746–760. [Google Scholar] [CrossRef]
  22. Qian, W.-H.; Huang, J.; Du, J. Examination of Hurricane Sandy’s (2012) structure and intensity evolution from full-field and anomaly-field analyses. Tellus A Dyn. Meteorol. Oceanogr. 2016, 68, 29029. [Google Scholar] [CrossRef]
  23. Galarneau, T.; Davis, C.A.; Shapiro, M.A. Intensification of Hurricane Sandy (2012) through Extratropical Warm Core Seclusion. Mon. Weather Rev. 2013, 141, 4296–4321. [Google Scholar] [CrossRef]
  24. Meixler, M.S. Assessment of Hurricane Sandy damage and resulting loss in ecosystem services in a coastal-urban setting. Ecosyst. Serv. 2017, 24, 28–46. [Google Scholar] [CrossRef]
  25. Mandigo, A.C.; Discenza, D.J.; Keimowitz, A.R.; Fitzgerald, N. Chemical contamination of soils in the New York City area following Hurricane Sandy. Environ. Geochem. Health 2015, 38, 1115–1124. [Google Scholar] [CrossRef] [PubMed]
  26. Rothenberger, M.; Armstrong, A.; Spitz, M. Social–Ecological system responses to Hurricane Sandy in the Hudson-Raritan Estuary. Ambio 2017, 47, 284–297. [Google Scholar] [CrossRef]
  27. Shin, J.H. Vortex Spinup Process in the Extratropical Transition of Hurricane Sandy (2012). J. Atmos. Sci. 2019, 76, 3589–3610. [Google Scholar] [CrossRef]
  28. Schiavone, J.; Gao, K.; Robinson, D.; Johnsen, P.; Gerbush, M. Large Roll Vortices Exhibited by Post-Tropical Cyclone Sandy during Landfall. Atmosphere 2021, 12, 259. [Google Scholar] [CrossRef]
  29. Bloemendaal, N.; Muis, S.; Haarsma, R.J.; Verlaan, M.; Apecechea, M.I.; de Moel, H.; Ward, P.J.; Aerts, J.C.J.H. Global modeling of tropical cyclone storm surges using high-resolution forecasts. Clim. Dyn. 2018, 52, 5031–5044. [Google Scholar] [CrossRef] [Green Version]
  30. Lee, J.-W.; Irish, J.L.; Bensi, M.T.; Marcy, D.C. Rapid prediction of peak storm surge from tropical cyclone track time series using machine learning. Coast. Eng. 2021, 170, 104024. [Google Scholar] [CrossRef]
  31. Kim, E.; Manuel, L. Simulation of Wind, Waves, and Currents During Hurricane Sandy for Planned Assessment of Offshore Wind Turbines. J. Offshore Mech. Arct. Eng. 2019, 141, 061904-15. [Google Scholar] [CrossRef]
  32. Ding, L.; Li, T.; Xiang, B.; Peng, M. On the Westward Turning of Hurricane Sandy (2012): Effect of Atmospheric Intraseasonal Oscillations. J. Clim. 2019, 32, 6859–6873. [Google Scholar] [CrossRef]
  33. Manganello, J.V.; Cash, B.A.; Swenson, E.T.; Iii, J.L.K. Assessment of Climatology and Predictability of Mid-Atlantic Tropical Cyclone Landfalls in a High-Atmospheric-Resolution Seasonal Prediction System. Mon. Weather Rev. 2019, 147, 2901–2917. [Google Scholar] [CrossRef]
  34. Powell, M.; Houston, S.H.; Amat, L.R.; Morisseau-Leroy, N. The HRD real-time hurricane wind analysis system. J. Wind. Eng. Ind. Aerodyn. 1998, 77-78, 53–64. [Google Scholar] [CrossRef]
  35. Powell, M.D.; Murillo, S.; Dodge, P.; Uhlhorn, E.; Gamache, J.; Cardone, V.; Cox, A.; Otero, S.; Carrasco, N.; Annane, B.; et al. Reconstruction of Hurricane Katrina’s wind fields for storm surge and wave hindcasting. Ocean Eng. 2010, 37, 26–36. [Google Scholar] [CrossRef]
  36. RMS. Risk Management Solutions, Inc. 2018. Available online: http://www.rms.com/models/hwind/legacy-archive (accessed on 1 June 2018).
  37. Zeng, J.; Matsunaga, T.; Mukai, H. METEX—A flexible tool for air trajectory calculation. Environ. Model. Softw. 2010, 25, 607–608. [Google Scholar] [CrossRef]
  38. Wilks, D.S. Statistical Methods in the Atmospheric Sciences, 4th ed.; Academic Press: Amsterdam, The Netherlands, 2019. [Google Scholar]
  39. Sachs, L. Applied Statistics; Springer: New York, NY, USA, 1982. [Google Scholar]
  40. Allwine, K.; Whiteman, C. Single-Station integral measures of atmospheric stagnation, recirculation and ventilation. Atmos. Environ. 1994, 28, 713–721. [Google Scholar] [CrossRef]
  41. Snyder, J.P. Map Projections—A Working Manual; US Government Printing Office: Washington, DC, USA, 1987. Available online: https://pubs.usgs.gov/pp/1395/report.pdf (accessed on 1 June 2018).
  42. NOAA. Tropical Cyclone Report, Hurricane Sandy. 2018. Available online: https://www.nhc.noaa.gov/data/tcr/AL182012_Sandy.pdf (accessed on 1 June 2018).
  43. Chavas, D.R.; Lin, N.; Dong, W.; Lin, Y. Observed Tropical Cyclone Size Revisited. J. Clim. 2016, 29, 2923–2939. [Google Scholar] [CrossRef]
  44. Delgado, S.; Landsea, C.W.; Willoughby, H. Reanalysis of the 1954–63 Atlantic Hurricane Seasons. J. Clim. 2018, 31, 4177–4192. [Google Scholar] [CrossRef] [Green Version]
  45. Corporal-Lodangco, I.L.; Leslie, L.M. Climatology of Philippine tropical cyclone activity: 1945-2011. Int. J. Clim. 2016, 37, 3525–3539. [Google Scholar] [CrossRef]
  46. Kim, D.; Kim, H.-S.; Park, D.-S.R.; Park, M.-S. Variation of the Tropical Cyclone Season Start in the Western North Pacific. J. Clim. 2017, 30, 3297–3302. [Google Scholar] [CrossRef]
  47. Wang, X.; Liu, H.; Foltz, G.R. Persistent influence of tropical North Atlantic wintertime sea surface temperature on the subsequent Atlantic hurricane season. Geophys. Res. Lett. 2017, 44, 7927–7935. [Google Scholar] [CrossRef]
  48. Choi, J.; Cha, Y.; Kim, T.; Kim, H. Interdecadal variation of tropical cyclone genesis frequency in late season over the western North Pacific. Int. J. Clim. 2017, 37, 4335–4346. [Google Scholar] [CrossRef]
  49. Collins, J.M.; Roache, D.R. The 2016 North Atlantic hurricane season: A season of extremes. Geophys. Res. Lett. 2017, 44, 5071–5077. [Google Scholar] [CrossRef] [Green Version]
  50. Wang, X.; Huang, C.; Huang, P.; Yu, X. Study on wind characteristics of a strong typhoon in near-ground boundary layer. Struct. Des. Tall Spéc. Build. 2016, 26, e1338. [Google Scholar] [CrossRef]
  51. Zhang, G.; Perrie, W.; Li, X.; Zhang, J. A Hurricane Morphology and Sea Surface Wind Vector Estimation Model Based on C-Band Cross-Polarization SAR Imagery. IEEE Trans. Geosci. Remote Sens. 2016, 55, 1743–1751. [Google Scholar] [CrossRef]
  52. Chavas, D.R.; Lin, N. A Model for the Complete Radial Structure of the Tropical Cyclone Wind Field. Part II: Wind Field Variability. J. Atmos. Sci. 2016, 73, 3093–3113. [Google Scholar] [CrossRef]
  53. Wijnands, J.S.; Qian, G.; Kuleshov, Y. Spline-Based modelling of near-surface wind speeds in tropical cyclones. Appl. Math. Model. 2016, 40, 8685–8707. [Google Scholar] [CrossRef]
  54. Cui, W.; Caracoglia, L. Exploring hurricane wind speed along US Atlantic coast in warming climate and effects on predictions of structural damage and intervention costs. Eng. Struct. 2016, 122, 209–225. [Google Scholar] [CrossRef] [Green Version]
  55. Knaff, J.A.; Sampson, C.R.; Chirokova, G. A Global Statistical–Dynamical Tropical Cyclone Wind Radii Forecast Scheme. Weather Forecast. 2017, 32, 629–644. [Google Scholar] [CrossRef] [Green Version]
  56. Reul, N.; Chapron, B.; Zabolotskikh, E.; Donlon, C.; Mouche, A.; Tenerelli, J.; Collard, F.; Piolle, J.-F.; Fore, A.; Yueh, S.; et al. A New Generation of Tropical Cyclone Size Measurements from Space. Bull. Am. Meteorol. Soc. 2017, 98, 2367–2385. [Google Scholar] [CrossRef]
  57. Sampson, C.R.; Fukada, E.M.; Knaff, J.; Strahl, B.R.; Brennan, M.J.; Marchok, T. Tropical Cyclone Gale Wind Radii Estimates for the Western North Pacific. Weather Forecast. 2017, 32, 1029–1040. [Google Scholar] [CrossRef]
  58. Chavas, D.R.; Emanuel, K.A. A QuikSCAT climatology of tropical cyclone size. Geophys. Res. Lett. 2010, 37. [Google Scholar] [CrossRef] [Green Version]
  59. Snaiki, R.; Wu, T. Modeling tropical cyclone boundary layer: Height-resolving pressure and wind fields. J. Wind Eng. Ind. Aerodyn. 2017, 170, 18–27. [Google Scholar] [CrossRef]
  60. Shu, Z.; Li, Q.; He, Y.; Chan, P. Vertical wind profiles for typhoon, monsoon and thunderstorm winds. J. Wind Eng. Ind. Aerodyn. 2017, 168, 190–199. [Google Scholar] [CrossRef]
  61. Myers, V.A.; Malkin, W. Some Properties of Hurricane Wind Fields as Deduced from Trajectories; US Department of Commerce: Washington, DC, USA, 1961. Available online: ftp://ftp.library.noaa.gov/noaa_documents.lib/NOAA_historic_documents/WB/National_Hurricane_Research_Project_Report/NHRP_49_1961.pdf (accessed on 1 June 2018).
  62. Niu, H.; Dong, G.; Ma, X.; Ma, Y. An analytical model of a typhoon wind field based on spiral trajectory. Proc. Inst. Mech. Eng. Part M J. Eng. Marit. Environ. 2016, 231, 818–827. [Google Scholar] [CrossRef]
Figure 1. (a) An example of one-day backward trajectory from B to A, together with the transport distance L. The wind run is the addition of distances Si. (b) Recirculation factors when the trajectories from B to A are circumference arcs. In this figure, AB is the transport distance. The lowest value of the recirculation factor corresponds to the run from A to B following a straight line. When the arc increases, so does the recirculation factor.
Atmosphere 12 01480 g001
Figure 2. (a) Number of hurricanes in the HWind project during the period 1994–2013 depending on their basin. Most of them are located in the Atlantic basin. (b) Monthly distribution of hurricanes, where the highest frequencies ranged from August to October. (c) Average annual number of files per hurricane in the period 1998–2013. The years 2005, 2006, and 2008 stood out due to their noticeable values against 1998, which was the year with the lowest file number.
Atmosphere 12 01480 g002
Figure 3. Trajectory of Hurricane Sandy based on the HWind files together with its category. Its location at the beginning of the corresponding day is also presented. During 27 and 28 October 2012, the trajectory was parallel to the coast. However, it turned west on 29 October 2012 to reach the coast following an infrequent landfall.
Atmosphere 12 01480 g003
Figure 4. (a) Median wind speed, where the sharp transition on 25 October 2012 was the most noticeable feature. (b) Interquartile wind speed range, showing a steady increase from 24 to 29 October 2012. (c) Yule–Kendall index of wind speed with a sharp dispersion of values and a decrease from slightly right-skewed to slightly left-skewed distributions. (d) Robust kurtosis of wind speed, where the dispersion of values increased with time (intercepts of linear fits were considered in the first file, on 23 October 2012 at 13.30 UTC, and slopes display the rate of change per day).
Atmosphere 12 01480 g004
Figure 5. (a) Wind speed histogram for 27 October 2012 at 13.30 UTC fitted to the Laplace distribution showing the noticeable values associated with the intermediate wind speeds. (b) Evolution of the scale parameter of the Laplace distribution, which presents some oscillations around the trend line.
Atmosphere 12 01480 g005
Figure 6. (a) Isotachs for 27 October 2012 at 1.30 UTC revealing the circular shape of some of them. (b) Evolution of the hurricane’s radius, assuming a circular shape for wind speed equal to, or higher than, that of a tropical storm. The linear increase was noticeable until 29 October 2012.
Atmosphere 12 01480 g006
Figure 7. (a) One-day backward air parcel trajectories calculated for selected heights on 27 October 2012 at 13.30 UTC. Trajectories are spirals near the ground. However, loops are obtained in the mid troposphere. (b,c) Profiles of the recirculation factor at selected dates (at 13.30 UTC, except on 30 October 2012, which is at 7.30 UTC). Nearly uniform factors are observed in the low atmosphere.
Atmosphere 12 01480 g007
Publisher’s Note: MDPI stays neutral with regard to jurisdictional claims in published maps and institutional affiliations.

