Article

A New Separation Methodology for the Maritime Sector Emissions over the Mediterranean and Black Sea Regions

1
Laboratory of Atmospheric Physics, Aristotle University of Thessaloniki, 54124 Thessaloniki, Greece
2
Royal Belgium Institute for Space Aeronomy (BIRA-IASB), 1180 Brussels, Belgium
3
EMODnet Human Activities, COGEA Srl, 00198 Rome, Italy
4
Royal Netherlands Meteorological Institute (KNMI), 3731 GA De Bilt, The Netherlands
5
TNO, Climate, Air and Sustainability, 3584 CB Utrecht, The Netherlands
*
Author to whom correspondence should be addressed.
Atmosphere 2021, 12(11), 1478; https://doi.org/10.3390/atmos12111478
Submission received: 12 October 2021 / Revised: 29 October 2021 / Accepted: 4 November 2021 / Published: 8 November 2021
(This article belongs to the Section Air Quality)

Abstract

:
The aim of this paper is to apply a new lane separation methodology for the maritime sector emissions attributed to the different vessel types and marine traffic loads in the Mediterranean and the Black Sea defined via the European Marine and Observation Data network (EMODnet), developed in 2016. This methodology is implemented for the first time on the Copernicus Atmospheric Monitoring Service Global Shipping (CAMS-GLOB-SHIP v2.1) nitrogen oxides (NOX) emissions inventory, on the Sentinel-5 Precursor Tropospheric Monitoring Instrument (TROPOMI) nitrogen dioxide (NO2) tropospheric vertical column densities, and on the LOTOS-EUROS (Long Term Ozone Simulation—European Operational Smog) CTM (chemical transport model) simulations. By applying this new EMODnet-based lane separation method to the CAMS-GLOB-SHIP v2.1 emission inventory, we find that cargo and tanker vessels account for approximately 80% of the total emissions in the Mediterranean, followed by fishing, passenger, and other vessel emissions with contributions of 8%, 7%, and 5%, respectively. Tropospheric NO2 vertical column densities sensed by TROPOMI for 2019 and simulated by the LOTOS-EUROS CTM have been successfully attributed to the major vessel activities in the Mediterranean; the mean annual NO2 load of the observations and the simulations reported for the entire maritime EMODnet-reported fleet of the Mediterranean is in satisfactory agreement, 1.26 ± 0.56 × 10¹⁵ molecules cm−2 and 0.98 ± 0.41 × 10¹⁵ molecules cm−2, respectively. The spatial correlation of the annual maritime NO2 loads of all vessel types between observation and simulation ranges between 0.93 and 0.98. On a seasonal basis, both observations and simulations show a common variability. The wintertime comparisons are in excellent agreement for the highest emitting sector, cargo vessels, with the observations reporting a mean load of 0.98 ± 0.54 and the simulations of 0.81 ± 0.45 × 10¹⁵ molecules cm−2 and correlation of 0.88. Similarly, the passenger sector reports 0.45 ± 0.49 and 0.39 ± 0.45 × 10¹⁵ molecules cm−2 respectively, with correlation of 0.95. In summertime, the simulations report a higher decrease in modelled tropospheric columns than the observations, however, still resulting in a high correlation between 0.85 and 0.94 for all sectors. These encouraging findings will permit us to proceed with creating a top-down inventory for NOx shipping emissions using S5P/TROPOMI satellite observations and a data assimilation technique based on the LOTOS-EUROS chemical transport model.

1. Introduction

The significance of the Mediterranean and Black Seas to the world shipping trade has been highlighted throughout the centuries. The Mediterranean Sea constitutes a crossroad of three continents and holds a prominent role in the European economic, geopolitical, and social landscape [1]. The Mediterranean and Black Seas, shown in Figure 1, compose of a semi-closed intercontinental marine system connected to the Atlantic Ocean with a coastline of 54,000 km, representing approximately 4% of the global ocean, while hosting a coastal population that exceeds 150 million inhabitants [2]. The Mediterranean can be divided into four sectors, the western Mediterranean, the Adriatic Sea, the Ionian and central Mediterranean, and the Aegean-Levantine Sea [3].
The main European ports in the Mediterranean are Marseille, Algeciras, and Valencia. Significant ports are also Barcelona, Venice, Trieste, and Piraeus. Regarding the Black Sea, the main ports are Istanbul, Constanta and Burgas [labelled in Figure 1]. Short sea shipping of goods in the Mediterranean, i.e., the transport of goods between ports, accounts for approximately 32% of the European Union (EU) short sea shipping, involving mainly cargo (58%) and container ships (22%). In the Black Sea, short shipping mainly involves cargo (89%) and container ships (6%). Mediterranean ports account for more than half (53%) of EU passenger seaborne traffic, with the main ports located in Greece (42%) and Italy (43%) [4,5]. Fishing constitutes a prominent activity in the Mediterranean Sea with the fishing fleet registering 45% of the total EU fishing fleet in 2019. When categorized by the number of vessels, Greece accounted for approximately ~20% of the total fishing vessels, followed by Italy with ~16% and Spain with ~12%.
As a result, the Mediterranean basin is dominated by maritime transport of various vessel types, which directly affect seaborne air quality. According to [6], ships have a large potential to significantly deteriorate air quality in coastal areas, with nearly 70% of global shipping emissions estimated to occur within 400 km from land. In EU waters, a larger share of emissions takes place closer to the shoreline, while the increased flow of commercial ships in and out of ports not only affects major ports, but also medium and small-scale ones [7]. In this direction, the International Maritime Organization (IMO) enacted the implementation of a global sulphur cap; according to which, EU member states will have to ensure that ships in all EU waters (except Sulphur Emission Control Areas—SECAS) use fuels of sulphur content no more than 0.5% [8]. Regarding the nitrogen oxides (NOX) emissions, limits on the emissions are implemented only for diesel engines of over 130 kW output power, according to Annex VI of the International Convention for the Prevention of Pollution from Ships (MARPOL), which came into force in July 2010 [9]. As a result, except for sulphur dioxide (SO2) emissions, strong reductions from shipping emissions in European seas are not to be expected based on current and foreseen future policies. With land-based sources expected to be reduced in the coming years, the importance of shipping emissions will grow in the future [7].
Previous relevant studies have mainly focused on describing the global, as well as European, total shipping emissions, with dedicated studies oriented around the Mediterranean and the Black Sea basin being scarce. More specifically, an increase of approximately 75% of the NOX shipping emissions between 1950 and 2001 was reported in [10]. An analysis with the TNO-MACC-II (Monitoring Atmospheric Composition and Climate) emission inventory over European seas has shown a decrease of approximately 4% and 26% of NOX and SO2 shipping emissions between 2003 and 2009 [11]. Modelled emissions originating from ship traffic in Europe using the Ship Traffic Assessment Model (STEAM), showed that shipping in the Mediterranean is responsible for 49% of the total SO2 shipping emissions in Europe for 2011 [12]. An updated version of the STEAM inventory (STEAM3) was developed to provide detailed global emissions of various shipping categories, which showed that cargo and tanker ships account for the majority of carbon dioxide (CO2) shipping emissions globally [13]. In the Mediterranean Sea, shipping emissions of particulate matter and NOX in four port cities (Patra, Brindisi, Venice, and Rijeka) were found to be of similar magnitude to road traffic emissions [14]. Finally, a comparative analysis of various emissions inventories over Europe for 2008, showed that shipping emissions of NOX and SO2 account for 16% and 11% of the total emissions, respectively, while highlighting significant differences in the emissions distribution over the Mediterranean [15]. A recent study of the emissions around the Malta-Sicily Channel during the 2020 COVID-19 (Coronavirus Disease 2019) pandemic restrictions, showed that shipping volumes remained the same, explaining the nearly constant air pollution levels measured at a monitoring station within the Malta Channel region [16].
The intuitive advantage of satellite measurements for the validation of shipping emission inventories is their spatial coverage. Previous studies have shown that estimation of nitrogen dioxide (NO2) columns originating from ships is feasible. NO2 tropospheric columns from the Ozone Monitoring Instrument (OMI) onboard the Aura satellite over the Mediterranean seem to detect the emissions originating from ships in the eastern Mediterranean, whereas in the western Mediterranean the detection is less accurate due to uncertain land-based emissions [17]. The magnitude of maritime emissions over the Chinese seas, calculated with an inversion algorithm based on OMI/Aura observations, was found to be in good agreement with the STEAM inventory [18]. Lastly, a recent study showed that on a cloud-free day with low wind speeds the Sentinel-5 Precursor/TROPOspheric Monitoring Instrument (S5P/TROPOMI) satellite measurements can reveal plume-like emission structures in tropospheric NO2 columns and are almost perfectly aligned with the ship tracks from the Automated Identification Signal (AIS) emitted by ships [19].
In this work, we evaluate the emissions reported by the Copernicus Atmospheric Monitoring Service Global Shipping (CAMS-GLOB-SHIP v2.1) emission inventory in the Mediterranean and Black Sea basin and use TROPOMI satellite observations and Long Term Ozone Simulation—European Operational Smog chemical transport model (LOTOS-EUROS CTM) simulations to differentiate the tropospheric NO2 vertical column densities, VCDs, originating from diverse shipping activities. The vessel density corresponding to various vessel types of the European Marine and Observation Data network (EMODnet) Human Activities database was used for the first time for the separation of the shipping lanes in accordance with the vessel category and thus enabled a speciation of the CAMS-GLOB-SHIP v2.1 NOX emissions, the TROPOMI and LOTOS-EUROS NO2 VCDs depending on each vessel type and shipping lane. These were studied on both an annual and a monthly basis in order to identify possible similar spatial patterns with the CAMS-GLOB-SHIP emissions and the LOTOS-EUROS simulations. The area of interest is separated into two domains, the Mediterranean and Black Sea domain (5° W–45° E and 30° N–49° N), and the Greek domain (19° E–30° E and 34° N–42° N) depicted in Figure 1.

2. Data and Methods

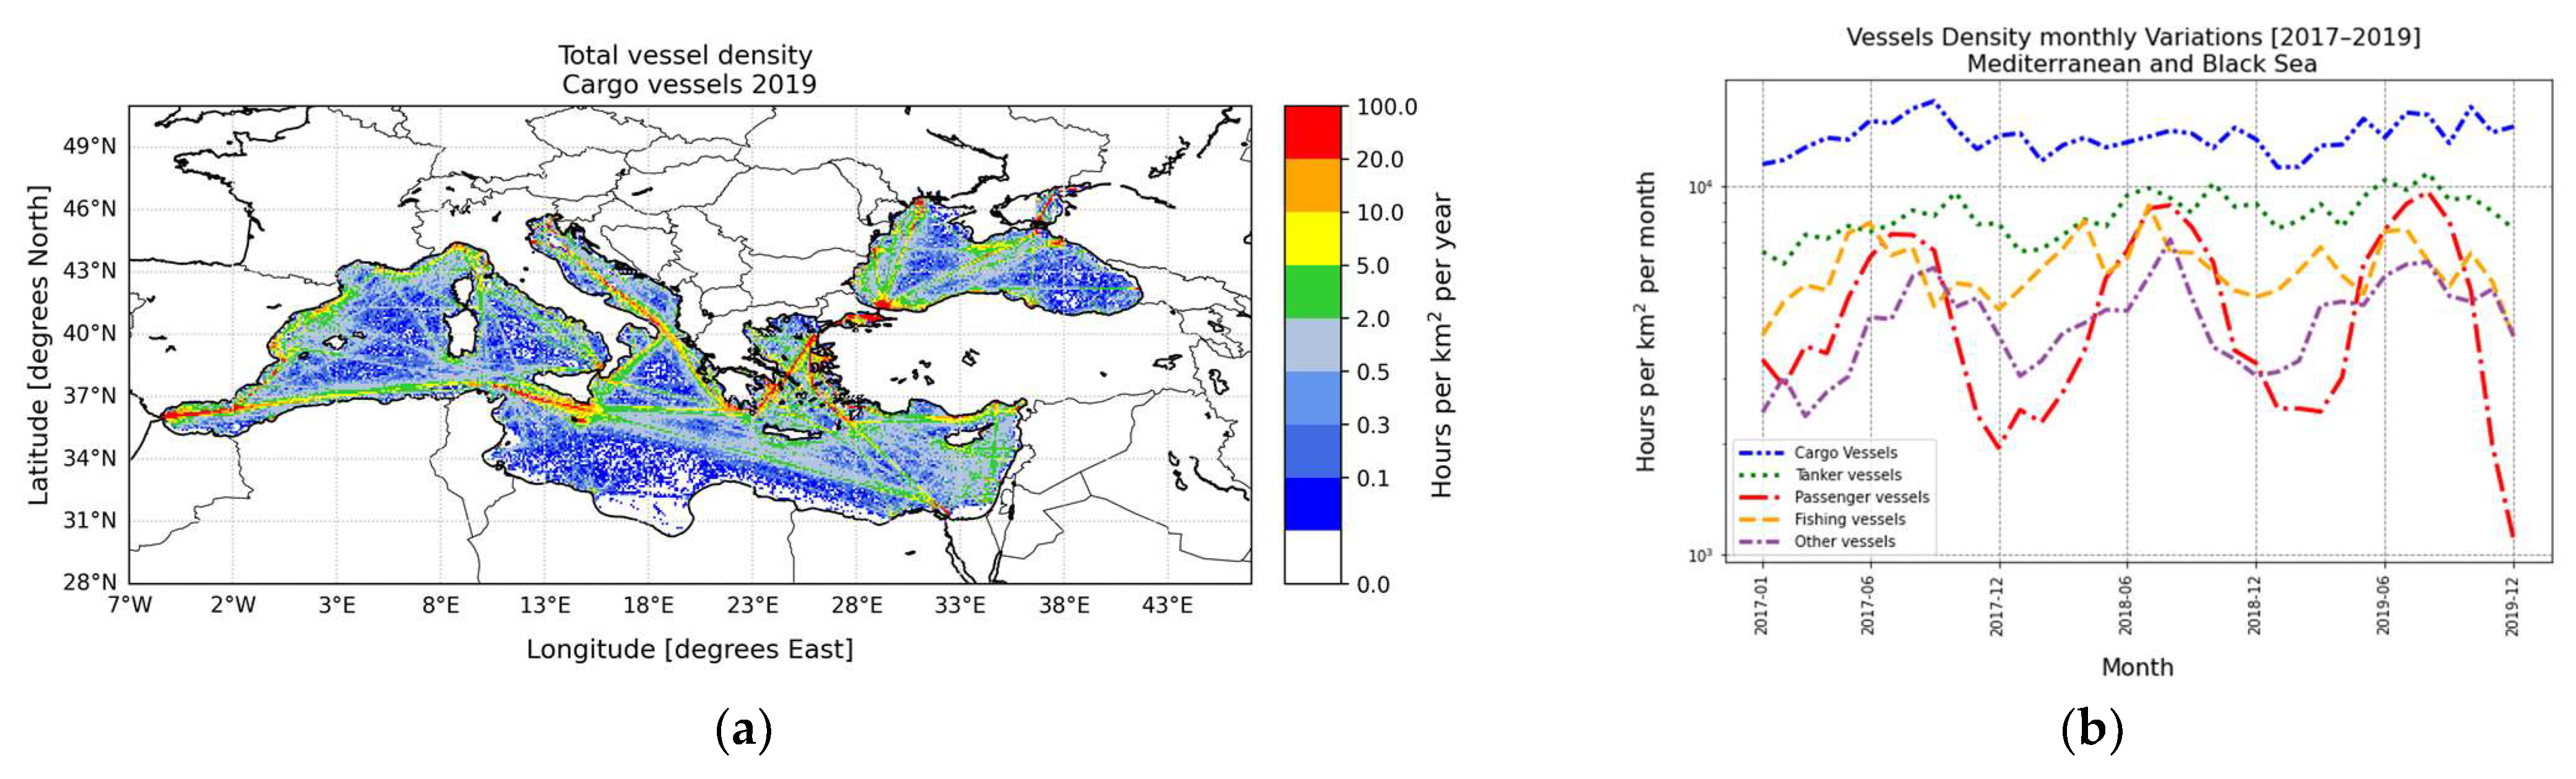
2.1. The EMODnet Database

EMODnet is a network of organizations supported by the European Union integrated maritime policy [20]. This network assembles European marine data products and metadata from diverse sources, which processes the data in a uniform way according to international standards and provides that information freely as interoperable data layers and data products. The data products are developed and are freely distributed by the EMODnet Human Activities portal in the framework of EMODnet as initiated by the European Commission. It aims to facilitate access to existing marine data on activities carried out in EU waters, by building a single-entry point for geographic information on 19 different themes [21]. Here, we use shipping vessel density, the time spent by a certain ship type within a 1 km2 grid cell per month [22], based on AIS. Data for the Mediterranean and the Black Sea domains were selected and converted to 0.1° × 0.1°. Five vessel categories, namely, passenger, cargo, tanker, fishing, and other (pleasure crafts, sailing, law, military enforcement, etc.) vessels are studied in this work.
Monthly vessel density data are publicly available from the EMODnet database [21], from 2017 to 2020. In the following analysis, we use the vessel density of 2017, 2018, and 2019. In Figure 2a, the cargo vessel density of 2019 is presented, while in Figure S1 the total vessel density and the other four categories are shown. Notably, the tanker vessel density (Figure S1b) shows a similar spatial distribution to the cargo vessels but with lower magnitude. Passenger vessel activity (Figure S1c) is more significant in the coasts of France, Italy, and Greece, whereas fishing vessel density (Figure S1d) is higher mainly offshore and especially in the Adriatic Sea. Finally, other vessel density (Figure S1e) shows significant lower magnitude compared to the other types and is detected mainly in the routes with higher cargo vessel density. Figure 2b shows the monthly variation of vessel density from January 2017 to December 2019 for all the vessel types studied here. Cargo and tanker vessels show similar variability with small seasonal fluctuations and weak inter-annual variability. On the contrary, passenger and other vessels show a seasonal pattern with lows in winter and highs in summer, while fishing vessels display a moderate seasonal variability. Table 1 summarizes the percentile distribution of vessel density per vessel type for the years 2017, 2018, and 2019. Cargo and tanker vessels account approximately for 58–60% of the total vessel density, while fishing, passenger, and other vessels account for 15–17%, 12–13%, and 11–13%, respectively.
In this work, we generate shipping emissions per vessel type using the vessel density of each reference year. More specifically, the total emissions of the CAMS-GLOB-SHIP v2.1 inventory are overlayed on the pixels of each vessel type. The emissions of every pixel are then weighted by the factor of contribution of each vessel category to the total vessel density for a specific time period. Ship tracks of different vessel types that are in the same pixel report NOX emissions of different magnitude with respect to the vessel activity. Thus, we are able to obtain NOX emissions for the abovementioned categories according to the EMODnet reported vessel density. Equation (1) describes in detail the applied methodology. The same methodology is also applied on the TROPOMI observations and the LOTOS-EUROS simulations.
Emissionsi,j,k = vessel densityi,j,k/total vessel densityj,k ∗ CGB_emissionsj,k
where:
  • Emissionsi,j,k: emissions per vessel type, pixel, and time period,
  • i: vessel type,
  • j: pixel,
  • k: time period,
  • vessel densityi,j,k: vessel density of each vessel type per pixel and time period,
  • total vessel denistyj,k: total vessel density per time period,
  • CBG_emissionsj,k: CAMS-GLOB-SHIP v2.1 emissions per time period.

2.2. The CAMS-GLOB-SHIP v2.1 Emissions Inventory

The CAMS-GLOB-SHIP v2.1 emissions inventory, publicly available from the ECCAD (Emissions of Atmospheric Compounds and Compilation of Ancillary Data database [23]), reports monthly gridded (0.1° × 0.1°) shipping emissions according to the latest version of the STEAM model [13]. It is based on global vessel density activity over 2014–2018, using signals from both terrestrial and satellite data from AIS. All vessels larger than 300 tons and all fishing vessels of 15 m and longer globally report their position with an interval of a few seconds, resulting in an availability of information on ship activities at an unprecedented detail [12]. The CAMS-GLOB-SHIP inventory is therefore based on time-dependent, high resolution, dynamic traffic patterns, which can also allow for the effects of changing conditions, such as marine and meteorological conditions (e.g., harsh winter conditions and sea ice cover) or weather routing [24]. Note that while both STEAM and EMODnet rely on AIS data, the methodologies of translating the AIS signal to emissions is quite different. STEAM shipping emissions are the result of AIS-based vessel specific activity and detailed technical knowledge of each vessel [13], while EMODnet-based emissions are depending on the density of a specific vessel category averaged for a longer period of time. Figure 3 shows the total annual emissions of all vessel types for 2019 (in tons per year). The major emitting lanes are easily distinguished as those crossing the Adriatic and the Aegean Sea to the Bosporus Strait. Significant emissions are also detected from the Gibraltar Strait to the Suez Canal and the Middle East coasts, along the Balearic Sea and the ports of Spain, France, and western Italy, as well as in the Black Sea.

2.3. The S5P/TROPOMI Tropospheric NO2 Vertical Column Densities

The European Space Agency (ESA) S5P satellite is a low Earth orbit polar satellite, carrying the TROPOMI instrument which has been providing information on air quality, climate, and ozone layer since 2018 [25]. TROPOMI is a passive, nadir-viewing spectrometer measuring wavelengths between the ultraviolet and short-wave infrared, with a very high spatial resolution of 3.5 × 7 km2, upgraded to 3.5 × 5.5 km2 in August 2019. The wavelength range for NO2 retrieval is 405–465 nm [26]. TROPOMI has an improved signal-to-noise ratio compared with previous space borne instruments and permits the detection of local emission sources from anthropogenic activity [27]. In this study, we use offline v1.2 and v1.3 TROPOMI tropospheric NO2 for 2019, available at the Copernicus Open Access Hub [28]. For the TROPOMI data production, an algorithm [26] similar to the data processing of the OMI NO2 data within the DOMINO (Dutch OMI NO2) and the FP7 Quality Assurance for Essential Climate Variable projects is used [29,30,31].
From the validation work within the TROPOMI Mission Performance Centre, which includes comparisons with OMI, ground-based MAX-DOAS, and Pandora instruments measurements it was found that the TROPOMI-reported NO2 is low in these versions of the dataset. The difference with OMI is especially pronounced in winter and more so for higher latitudes [32]. However, part of this bias for the ground-based instruments is related to the global scale a priori NO2 profile used based on the TM5-MP model. This will not impact on the comparisons shown further below to the LOTOS-EUROS simulation as the averaging kernels were applied there. The newer versions of the dataset, v1.4 (from December 2020 onwards) and v2.2 (from July 2021 onwards) report significantly higher columns.
For the purposes of this analysis, daily orbital files over the studied domains were gridded onto a 0.1° × 0.1° grid for 2019 and only cloud-free observations (i.e., with an associated quality assurance value of >0.75) corresponding to the open sea were used. We apply the EMODnet vessel density separation onto the TROPOMI tropospheric NO2 columns, resulting in VCDs per vessel category. We estimate the mean annual and monthly variability of the NO2 VCDs according to each vessel type, thus allowing us to determine the effects and the contribution of the individual shipping activities to the NO2 concentration in the Mediterranean and the Black Sea. It is evident from Figure 4a, that TROPOMI can detect the shipping lane from the Gibraltar Strait to the Suez Canal and the shipping lane crossing the Aegean Sea towards the Bosporus Strait. Observations are significantly enhanced near coastlines, due to the combination of inland and port emissions. The coastlines of Valencia and Barcelona show pronounced columns, as well as Marseille, Venice, Istanbul, and all along the coasts of Israel and Lebanon. In the Greek domain (Figure 4b), significant tropospheric NO2 columns are detected in the ports of Piraeus, Thessaloniki, and the coasts of Asia Minor while there is an obvious lane connecting Piraeus with the Bosporus Strait.

2.4. The LOTOS-EUROS CTM Simulations

The LOTOS-EUROS CTM simulations [33] can simulate distinct components (e.g., oxidants, secondary inorganic aerosols, primary aerosol, and heavy metals) in the troposphere [34]. The LOTOS-EUROS CTM is one of the nine chemistry models used by CAMS to provide daily forecasts of the main air pollutants (e.g., ozone, PM10, NO2) affecting air quality over Europe. The model has been used previously for a variety of air quality-oriented studies and lately as a validation method for satellite data. More specifically, a recent analysis studying the sensitivity of the OMI observed NO2 columns to anthropogenic emissions concluded that the contribution of the increasing shipping emissions in adjacent areas may mask a significant part of national emission reductions [35]. An evaluation of the model performance over Greece was recently conducted while, over high emitting locations such as power plants, the modelled columns were found to be highly spatially correlated (R = 0.95) with the TROPOMI tropospheric columns [36,37]. LOTOS-EUROS NO2 simulations were also performed in order to quantify the effects of the lockdown due to the COVID-19 pandemic over Greece as observed by TROPOMI [27].
In this work, we use the LOTOS-EUROS v02.02.001 version in order to study NO2 VCDs attributed to the maritime sector. Two model simulations were performed. The first one includes a larger area of Europe extending from 15° W to 45° E and from 30° N to 60° N at 0.25° × 0.25° for 2019. The second run consists of an internal area of the first domain and covers mainly the Mediterranean and Black Sea basin extending from 7° W to 45° E and from 30° N to 49° N at 0.1° × 0.1°, which is the resolution of CAMS-GLOB-SHIP v2.1. For the first, outer run, boundary and initial conditions are obtained from CAMS, a global near-real time (NRT) product at a 3-h temporal resolution and a spatial resolution of about 35 km. The second, inner run, was initialized by the output of the first. The TROPOMI observations have been re-gridded at the same resolution as the inner run. Both simulations were driven by the operational meteorological data from the European Centre for Medium Range Weather Forecasts (ECMWF) with a horizontal resolution of 7 × 7 km2 and a temporal resolution of 1 h for the surface variables and 3 h for the multi-level parameters [38]. Finally, anthropogenic emissions are taken from the CAMS-REG-AP v4.2 emissions inventory for 2017 [24], available at 0.1° × 0.1°. Note that both CAMS-GLOB-SHIP v2.1 and CAMS REG AP v4.2 are using the same methodology to generate shipping emissions. Finally, in order to compare the LOTOS-EUROS simulations with the TROPOMI observations, the model columns are reported after the satellite averaging kernels are applied to the original model profiles, as is common practice.

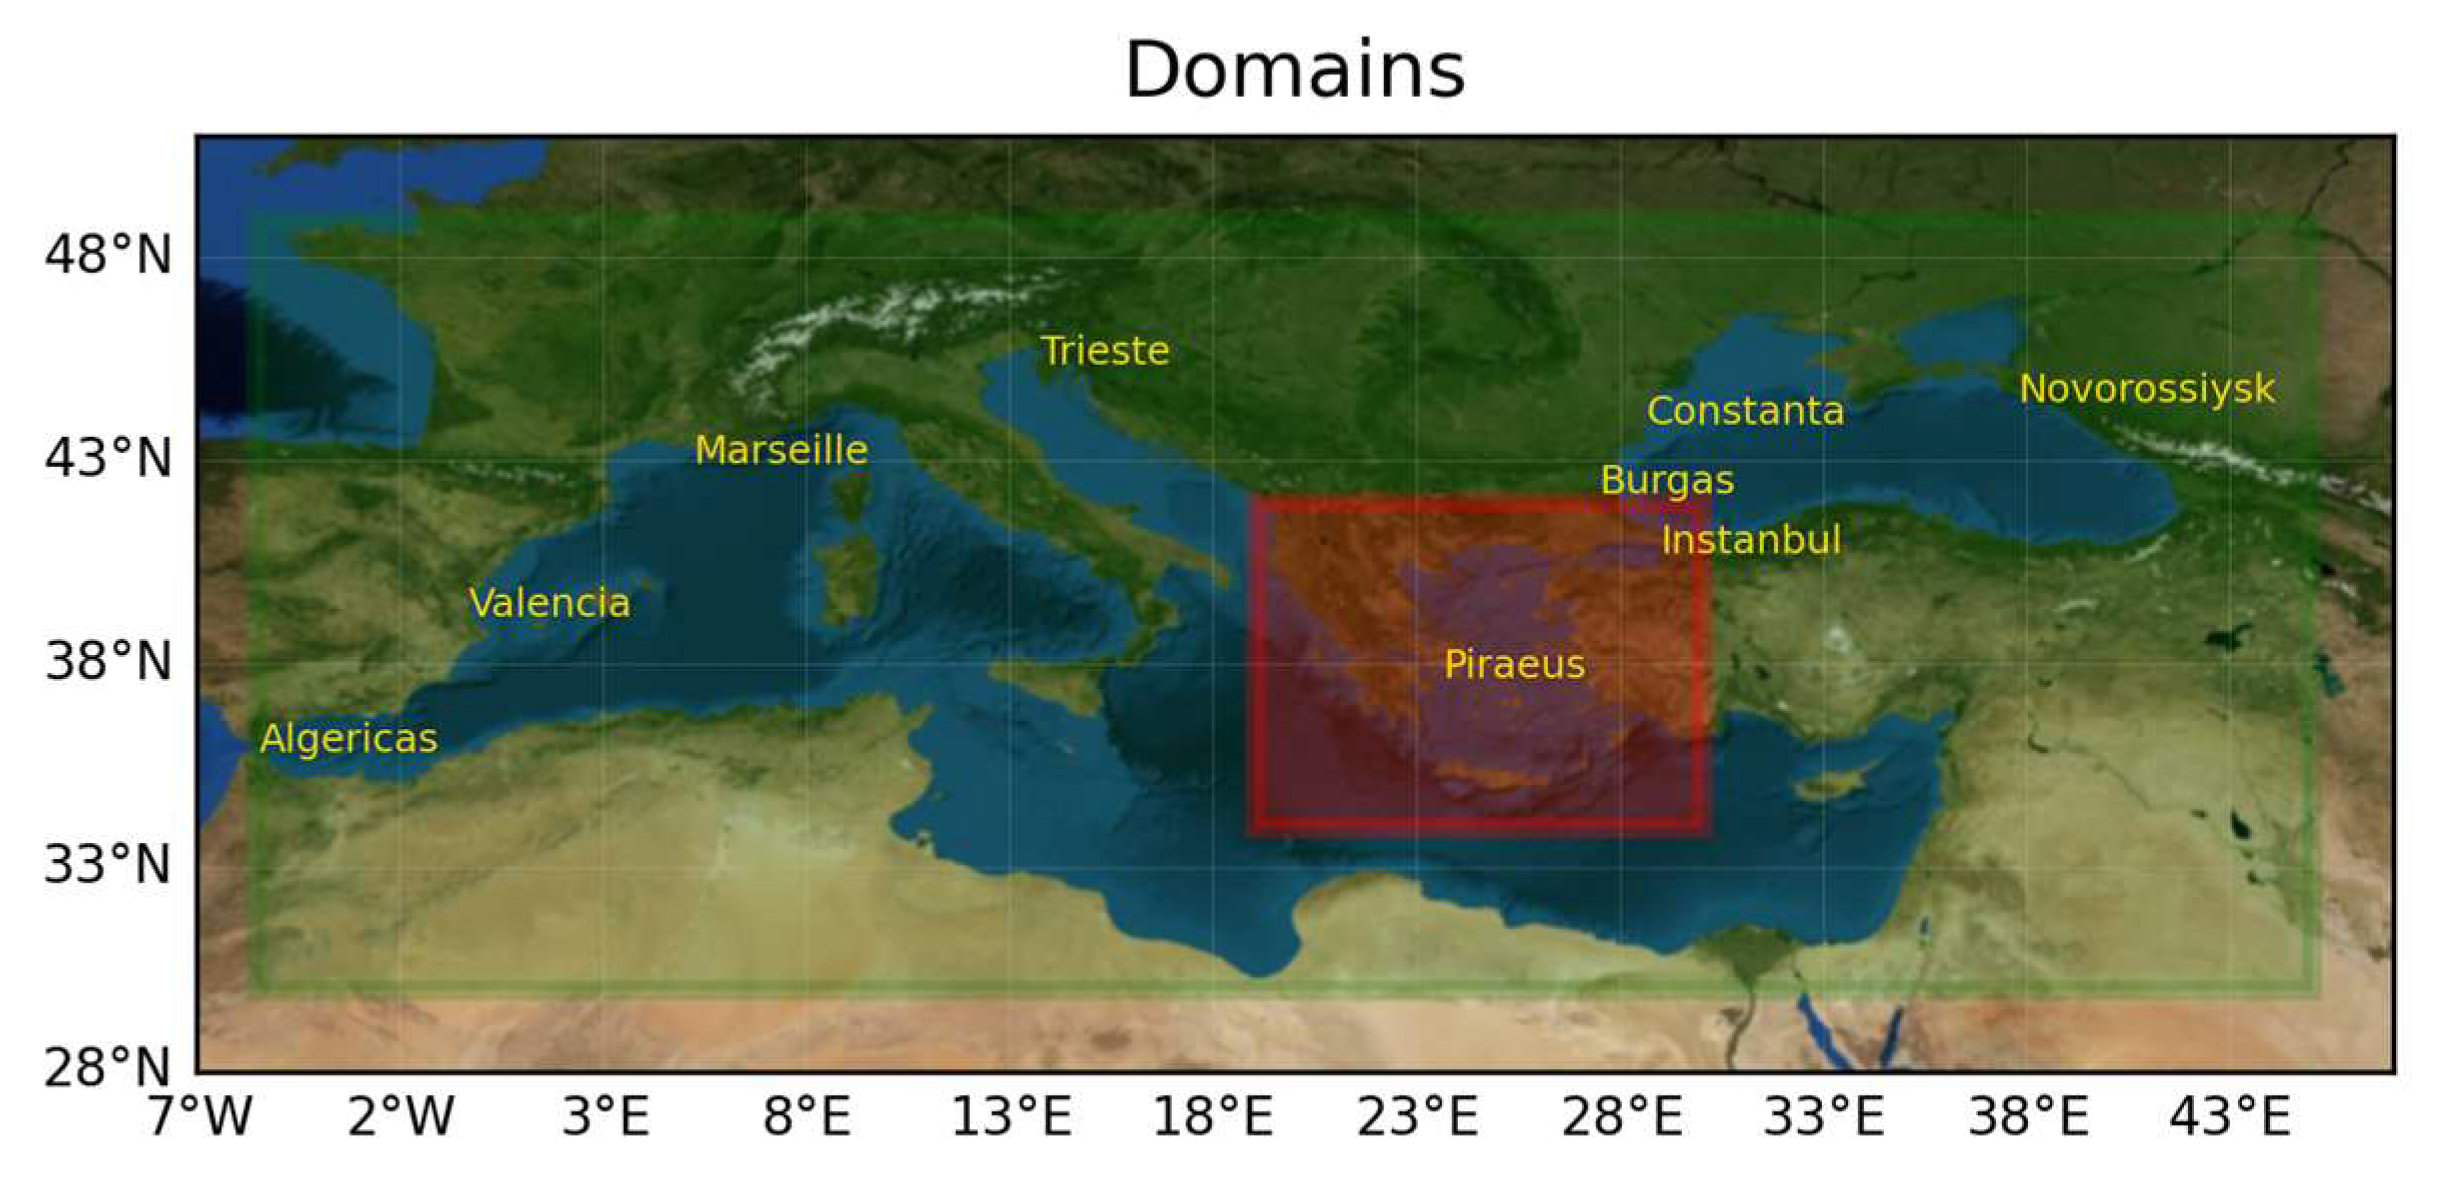
2.5. Roadmap of This Study

In the Results section, we use EMODnet vessel density database for years 2017, 2018, and 2019, as a new lane classification method to separate emitting lanes according to various vessel types and to estimate emissions per vessel types in the Mediterranean and the Black Sea basin. We implement this methodology to the CAMS-GLOB-SHIP v2.1 monthly NOX emissions in order to produce annual emissions per vessel type (Section 3.1.1) and to study their seasonal variability (Section 3.1.2). We then apply the same methodology to the mean annual and monthly TROPOMI and LOTOS-EUROS tropospheric NO2 VCDs for 2019 (Section 3.2.1) in order to identify shipping activity from satellite data and model simulations and to verify the effects of the new lane separation method to the NO2 seasonal variability (Section 3.2.2). Finally, in Section 4, we conclude and discuss the main findings of this analysis as well as provide recommendations for further work.

3. Results

3.1. Separation of CAMS-GLOB-SHIP Shipping Lanes Based on the EMODnet Dataset

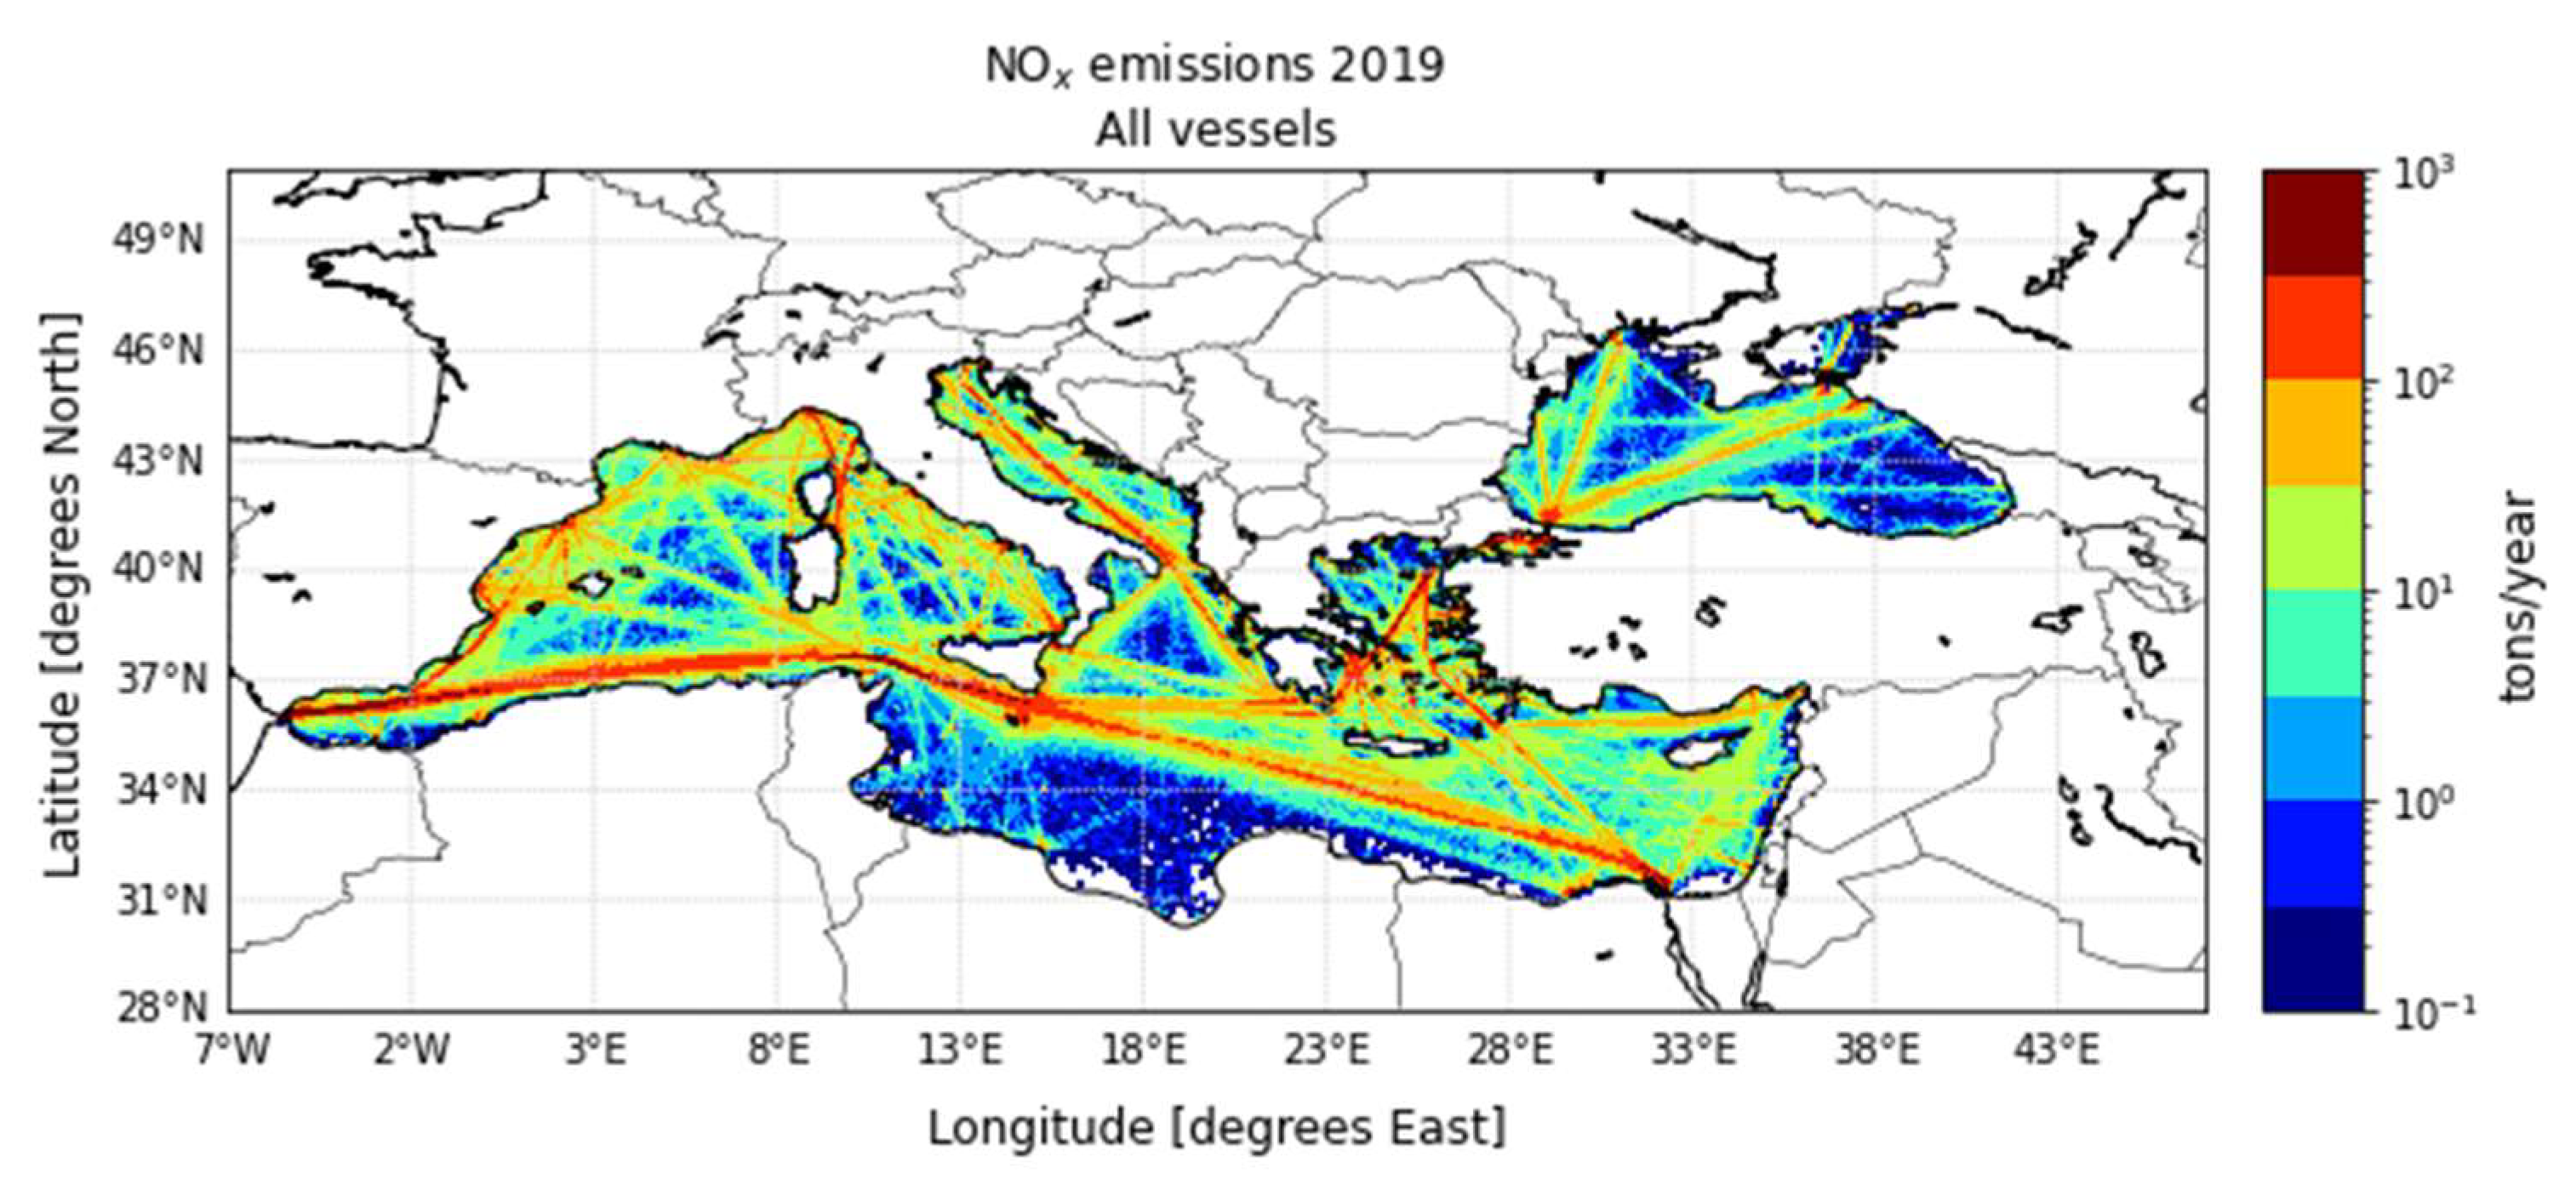
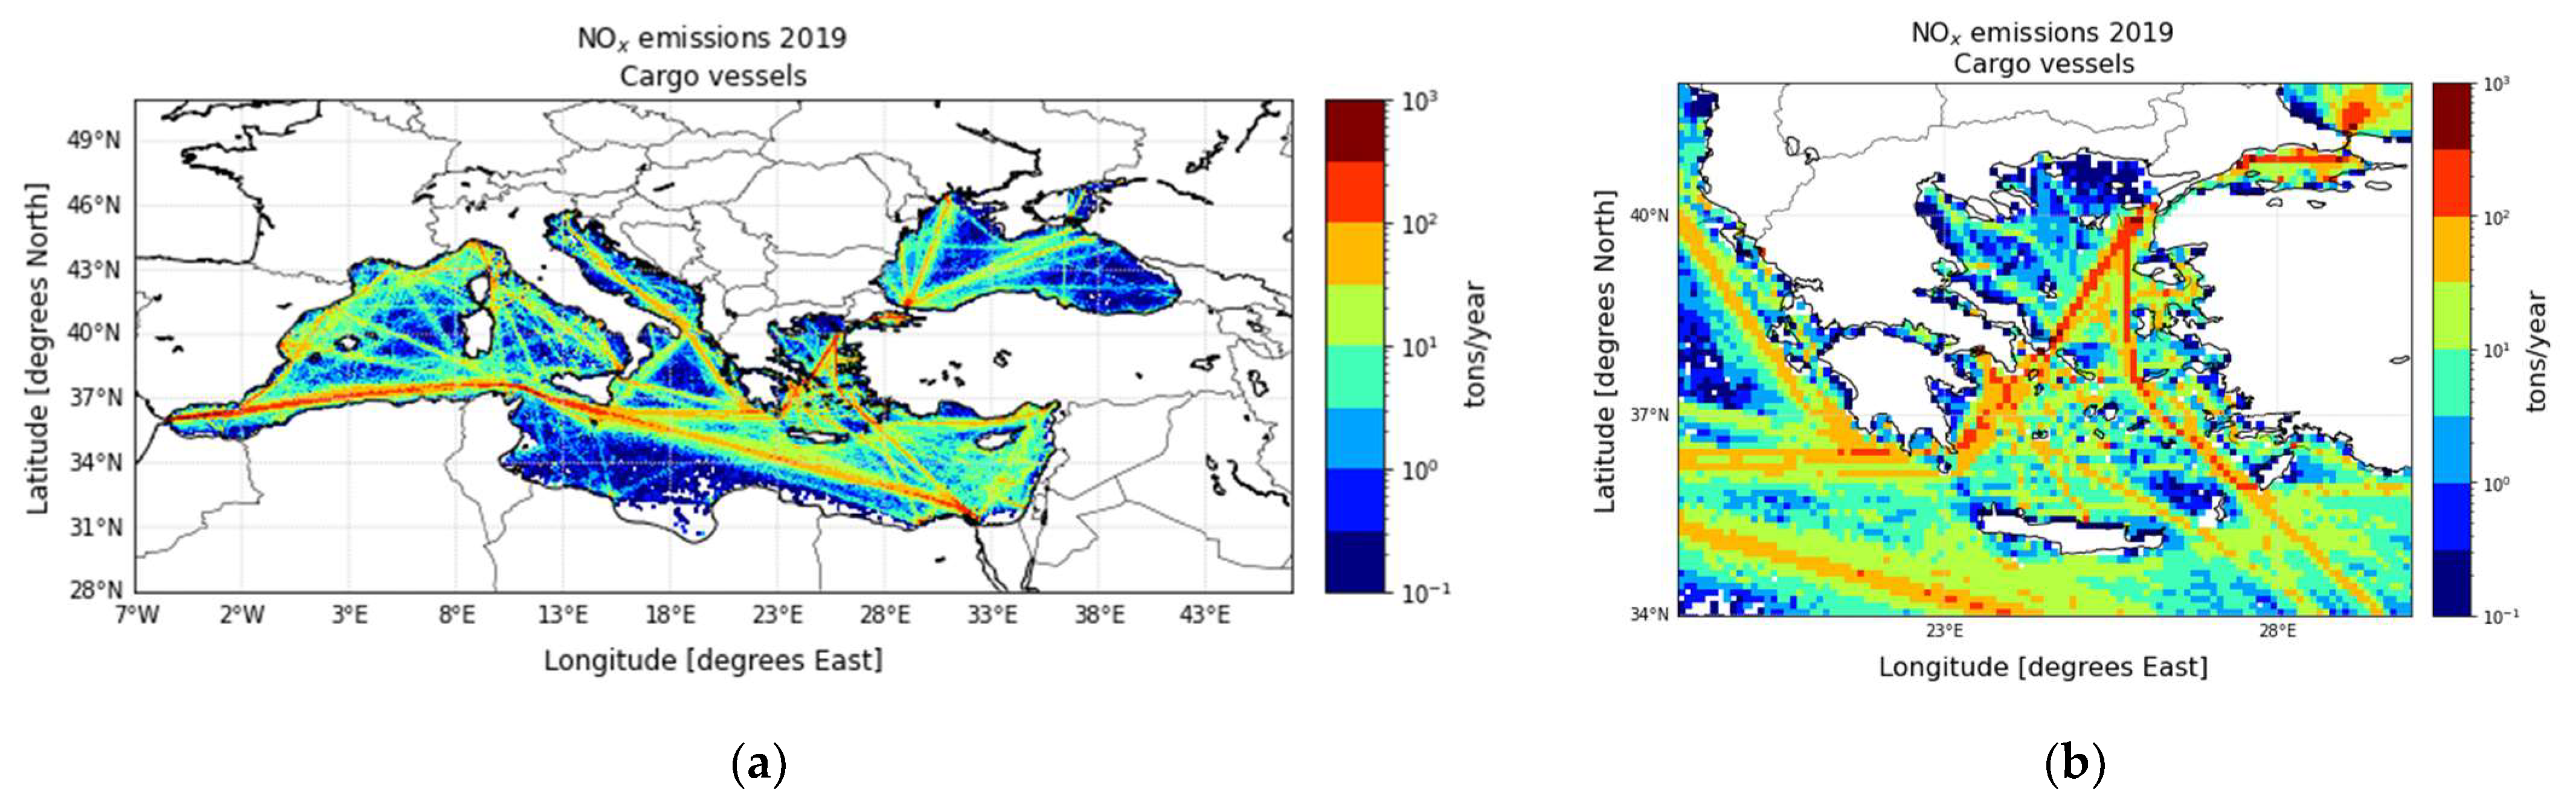
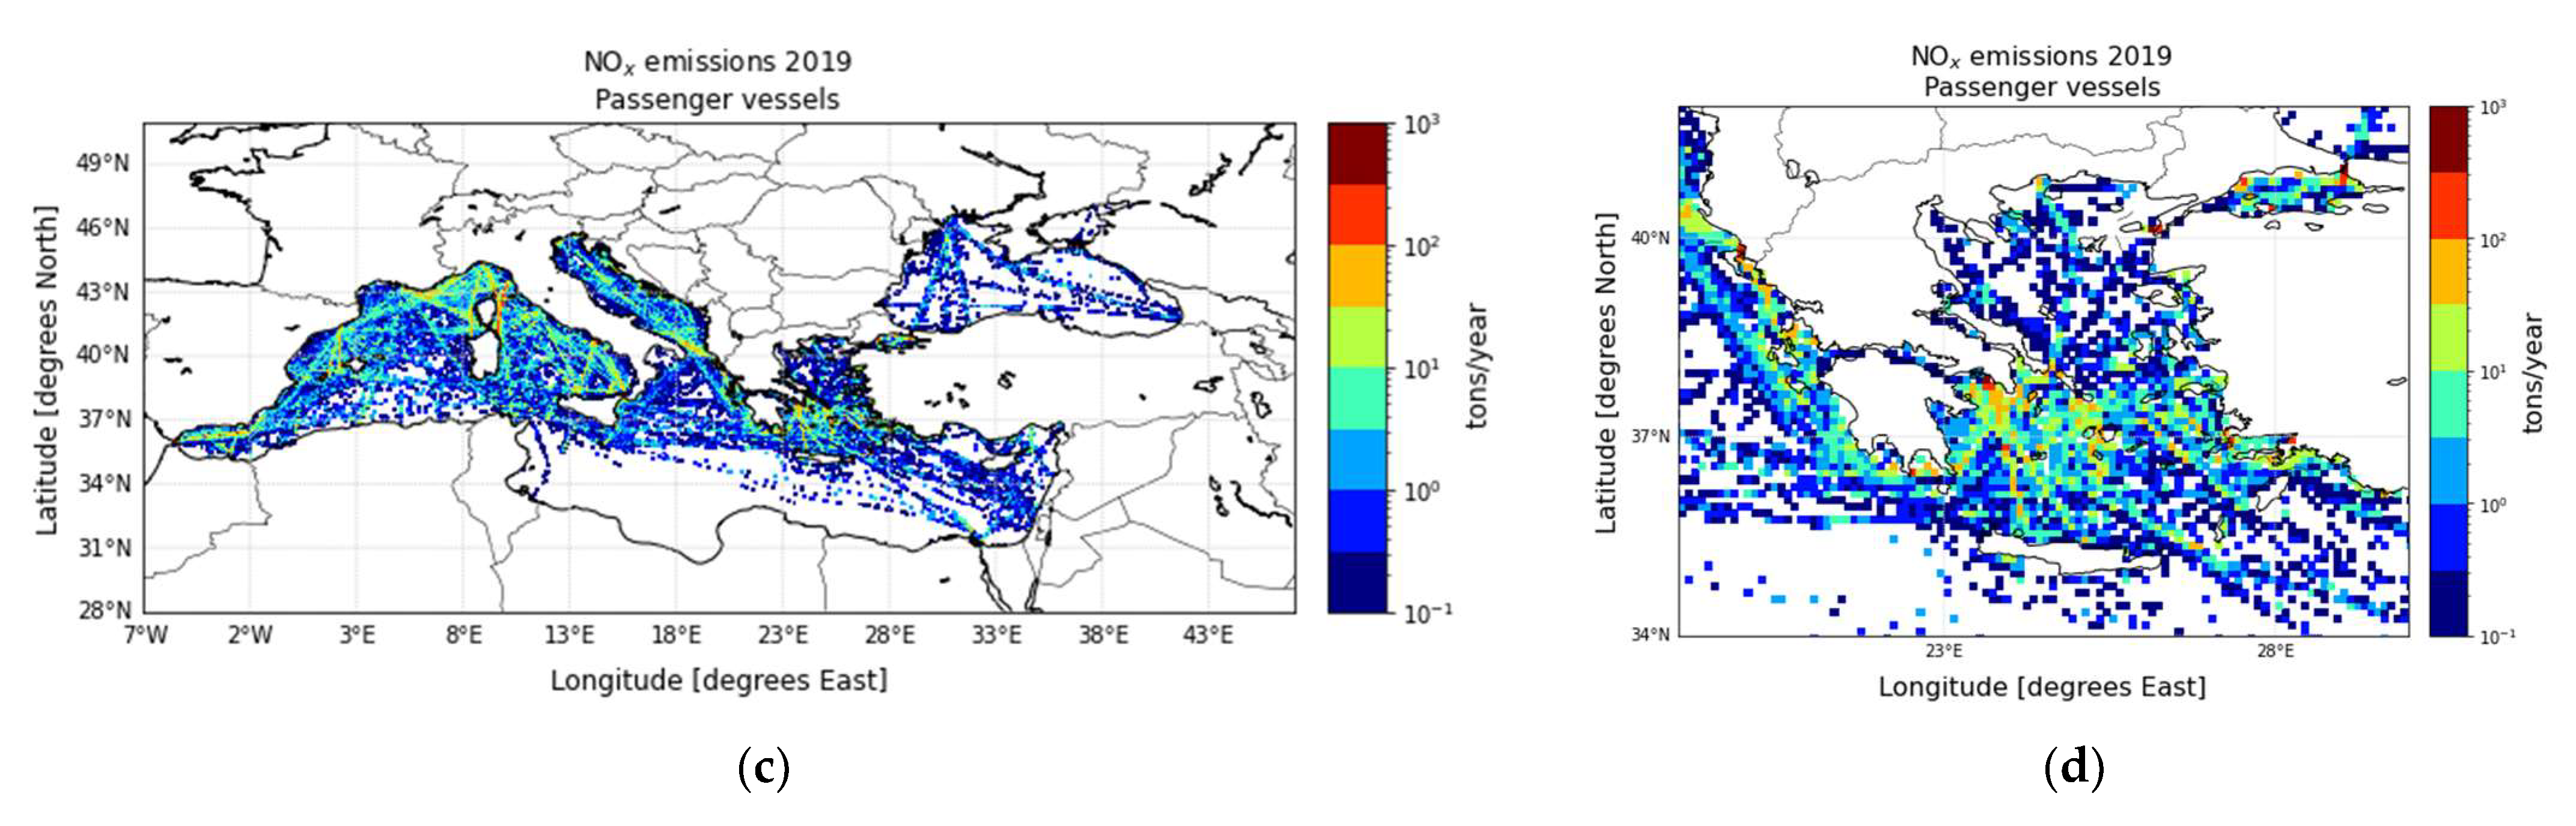
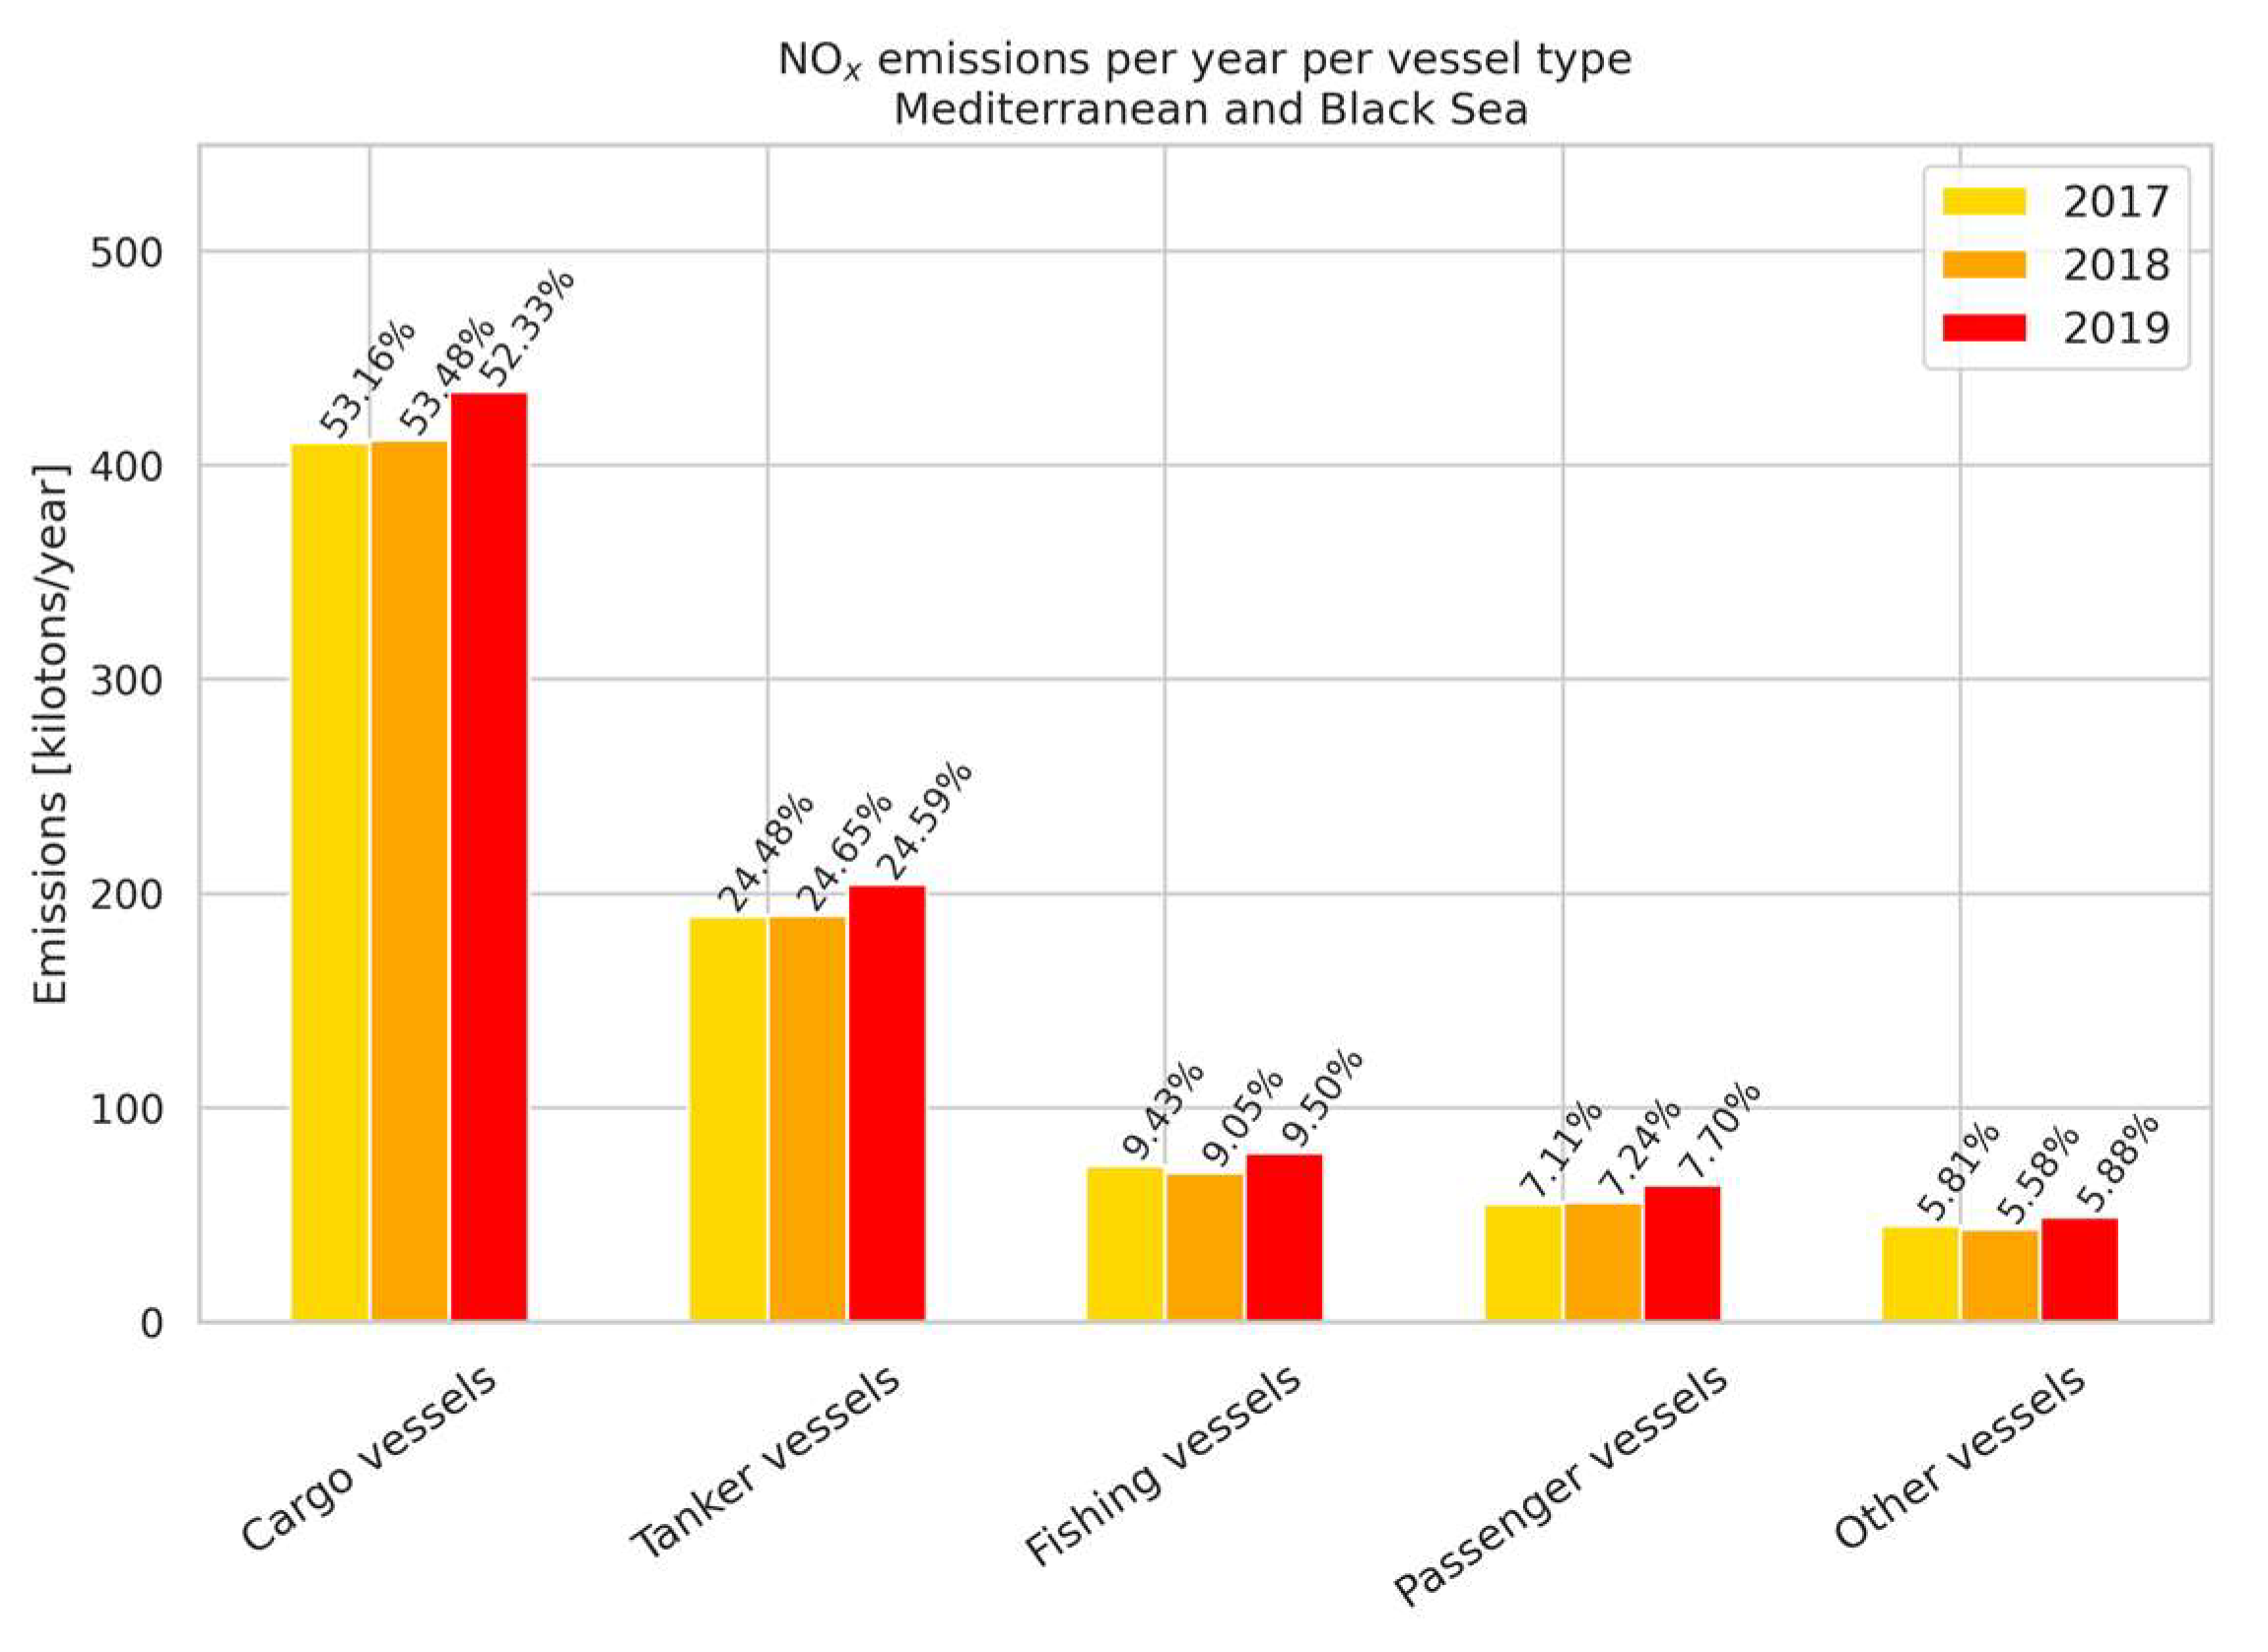
3.1.1. Annual Variability of the CAMS-GLOB-SHIP Emissions

Initially, the CAMS-GLOB-SHIP emissions were weighted according to the contribution of each vessel type to the total vessel density for every grid point, separately for each year, as per Equation (1). We applied those weights to the total emissions of 2017, 2018, and 2019 and reconstructed new emissions corresponding to the various vessel types for the Mediterranean and Black Sea basin. Figure 5 shows the NOX emissions of cargo and passenger vessels of the two domains for 2019, while tanker, fishing, and other types are shown in Figure S2. Cargo vessel emissions are, expectedly, higher along the shipping lane from Gibraltar to the Suez Canal and the Bosporus Strait (Figure 5a). High cargo activity and emissions are also spotted in the Adriatic and the Black Sea, with slightly lower emitting routes in the Balearic and the Levantine Seas. The passenger vessel emissions (Figure 5c) are mainly detected near the coastlines of Spain, France, and Italy. In the Greek domain (Figure 5b,d), significant passenger vessel emissions are detected in the lanes from Piraeus to Crete and Cyclades and along the Ionian Islands. Tanker vessel emissions (Figure S2a,b) are higher over the Gibraltar-Suez, Gibraltar-Bosporus and Adriatic Sea routes, with obvious lower emissions compared to the cargo vessels, while fishing emissions are higher in the coasts of east Italy, south Sicily, along the main ports of Valencia and Barcelona and some hotspots in the Greek domain near Piraeus port (Figure S2c,d).
Figure 6 shows the total annual CAMS-GLOB-SHIP NOX emissions in kilotons per vessel type and year in the Mediterranean and the Black Sea domain. For all years, the distribution of the emissions is similar. Cargo and tanker vessels account for approximately 77% (53% and 24%) of the total emissions, fishing vessels for 9%, and passenger and other vessels for 7% and 6%, respectively. Regarding the intercomparison of the annual emissions, the total emissions decrease from 2017 to 2018 by 0.3% and increase from 2017 to 2019 by approximately 7.5%. For the Greek domain (Figure S3), the contribution of the various vessel type emissions to the total emissions follows within ±3% the distribution of the Mediterranean and Black Sea domain. As to the interannual variability, the total emissions of all vessels also slightly decrease in 2018 by 0.5%, while they increase significantly in 2019 by 9.6% compared to 2017. It should be stressed here that the inner domain accounts for approximately 23% of the total Mediterranean and Black Sea shipping emissions, which further testifies to the significance of the area to the maritime sector and the total emission budget.

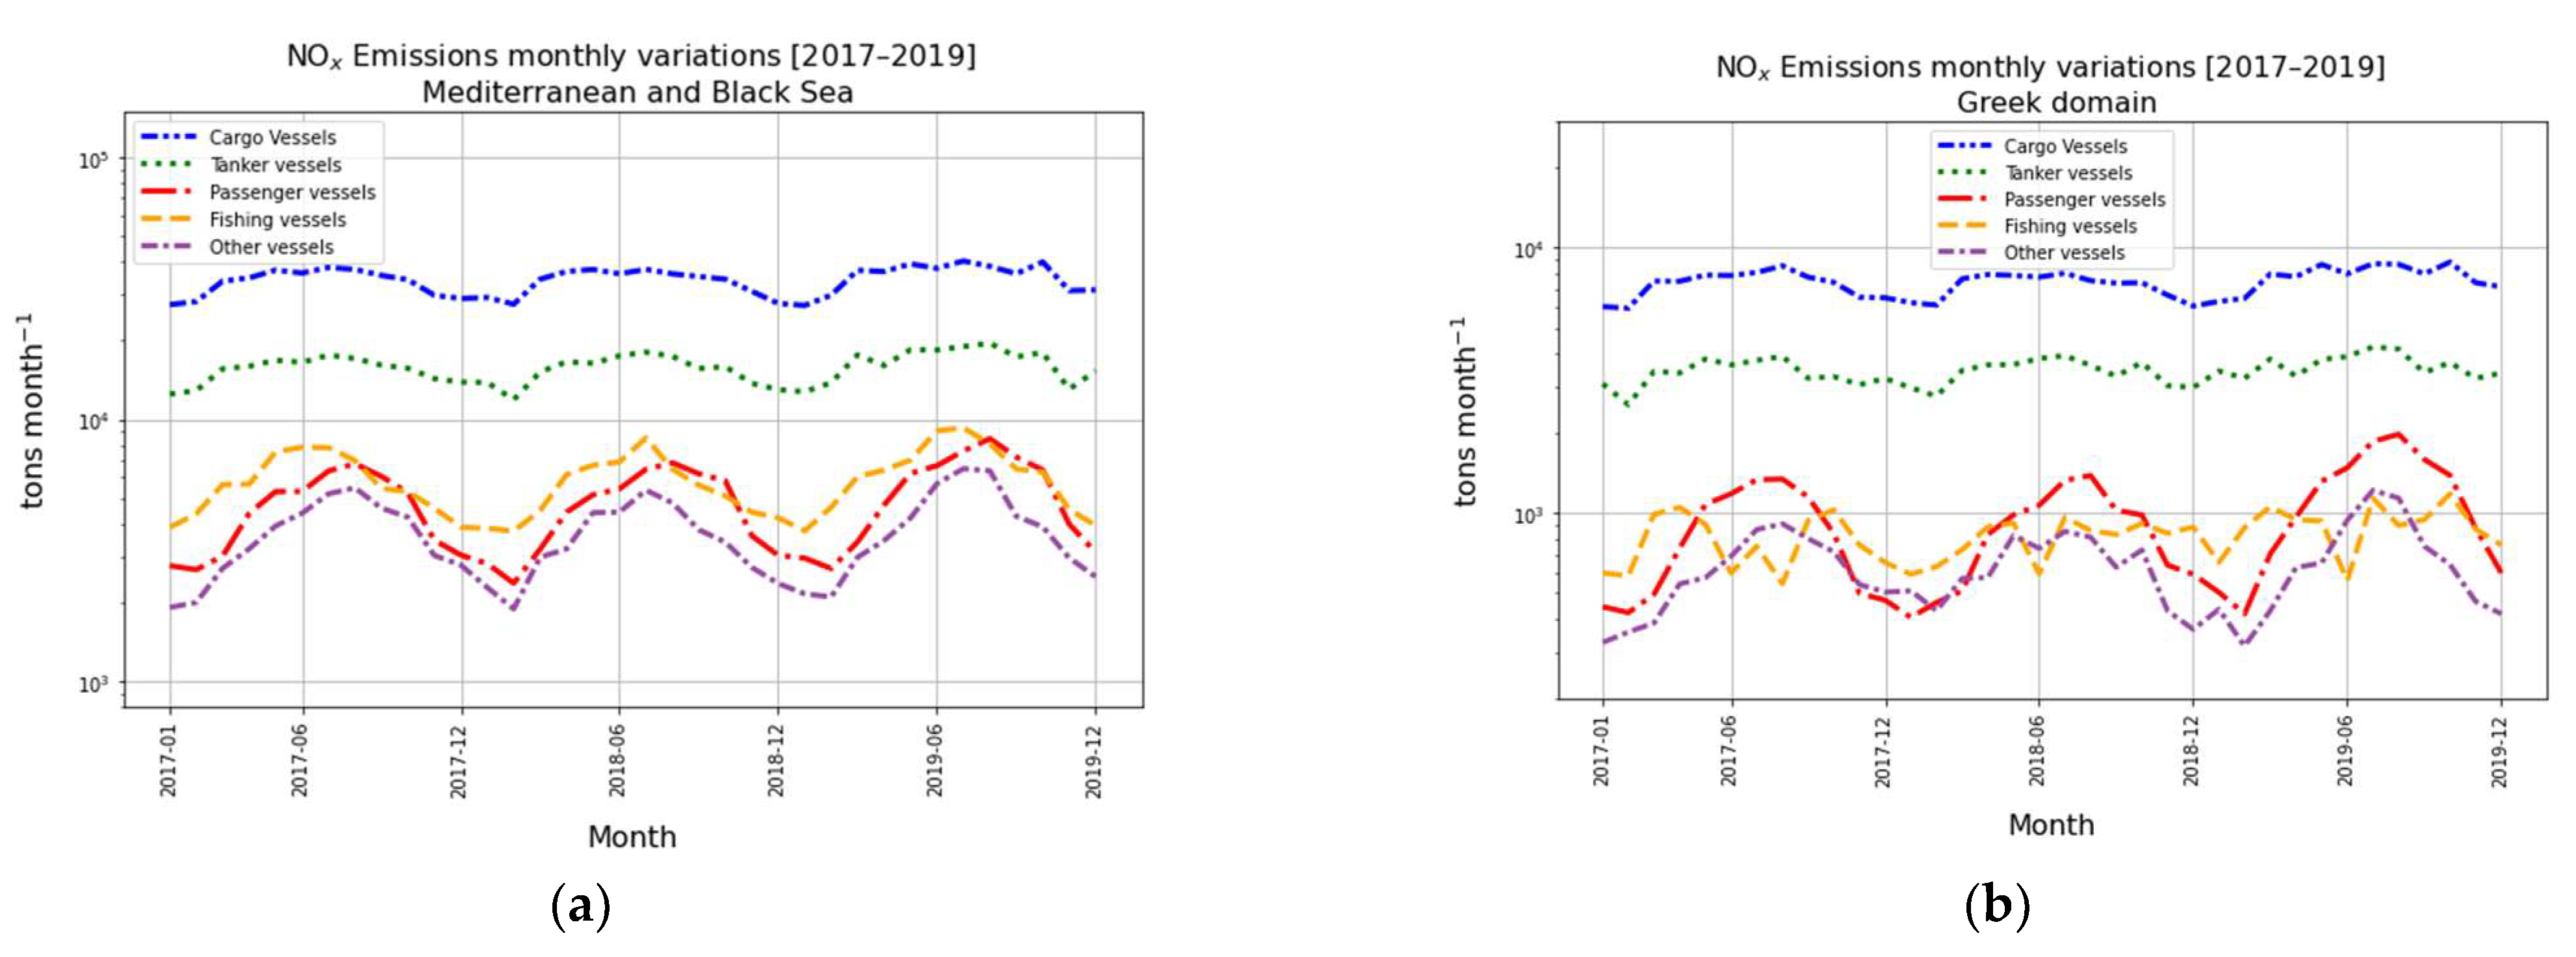
3.1.2. Seasonal Variability of the CAMS-GLOB-SHIP Emissions

In this section, we implemented the same methodology for the monthly emissions of the CAMS-GLOB-SHIP v2.1 inventory in order to study the seasonal variability of the emissions according to the vessel type. Figure 7a shows the time series of the emissions from January 2017 until December 2019 for all the vessel types in the Mediterranean and the Black Sea basin. Cargo and tanker vessels record the highest emissions and appear to have similar seasonal variability. More specifically, low values are found during the winter period between November and February, while emissions do not show significant fluctuations in the period from March until October, remaining relatively constant. Fishing, passenger, and other vessel emissions show a more pronounced seasonality, with lows during the wintertime period and highs during the summertime period.
For the Greek domain (Figure 7b), cargo and tanker vessels show identical seasonal variations with the Mediterranean and Black Sea domain. Passenger and other vessels also show similar variations with the outer domain, with 2019 passenger summer emissions being significantly higher compared to the previous years. On the contrary, fishing vessel emissions do not show any evident signs of seasonal variations similar to the passenger and other vessel types.
It is evident that by overlaying the weighted emissions on the various vessel type pixels, the inter-annual variability is quite similar for all EMODnet reference years. Both tanker and cargo vessel density and emissions do not show an apparent seasonality, which is obvious for the passenger, fishing, and other vessels. The fishing vessel speciation latter shows a seasonal variability mainly for the Mediterranean and Black Sea domain, which is not as strongly detectable for the Greek sub-domain.

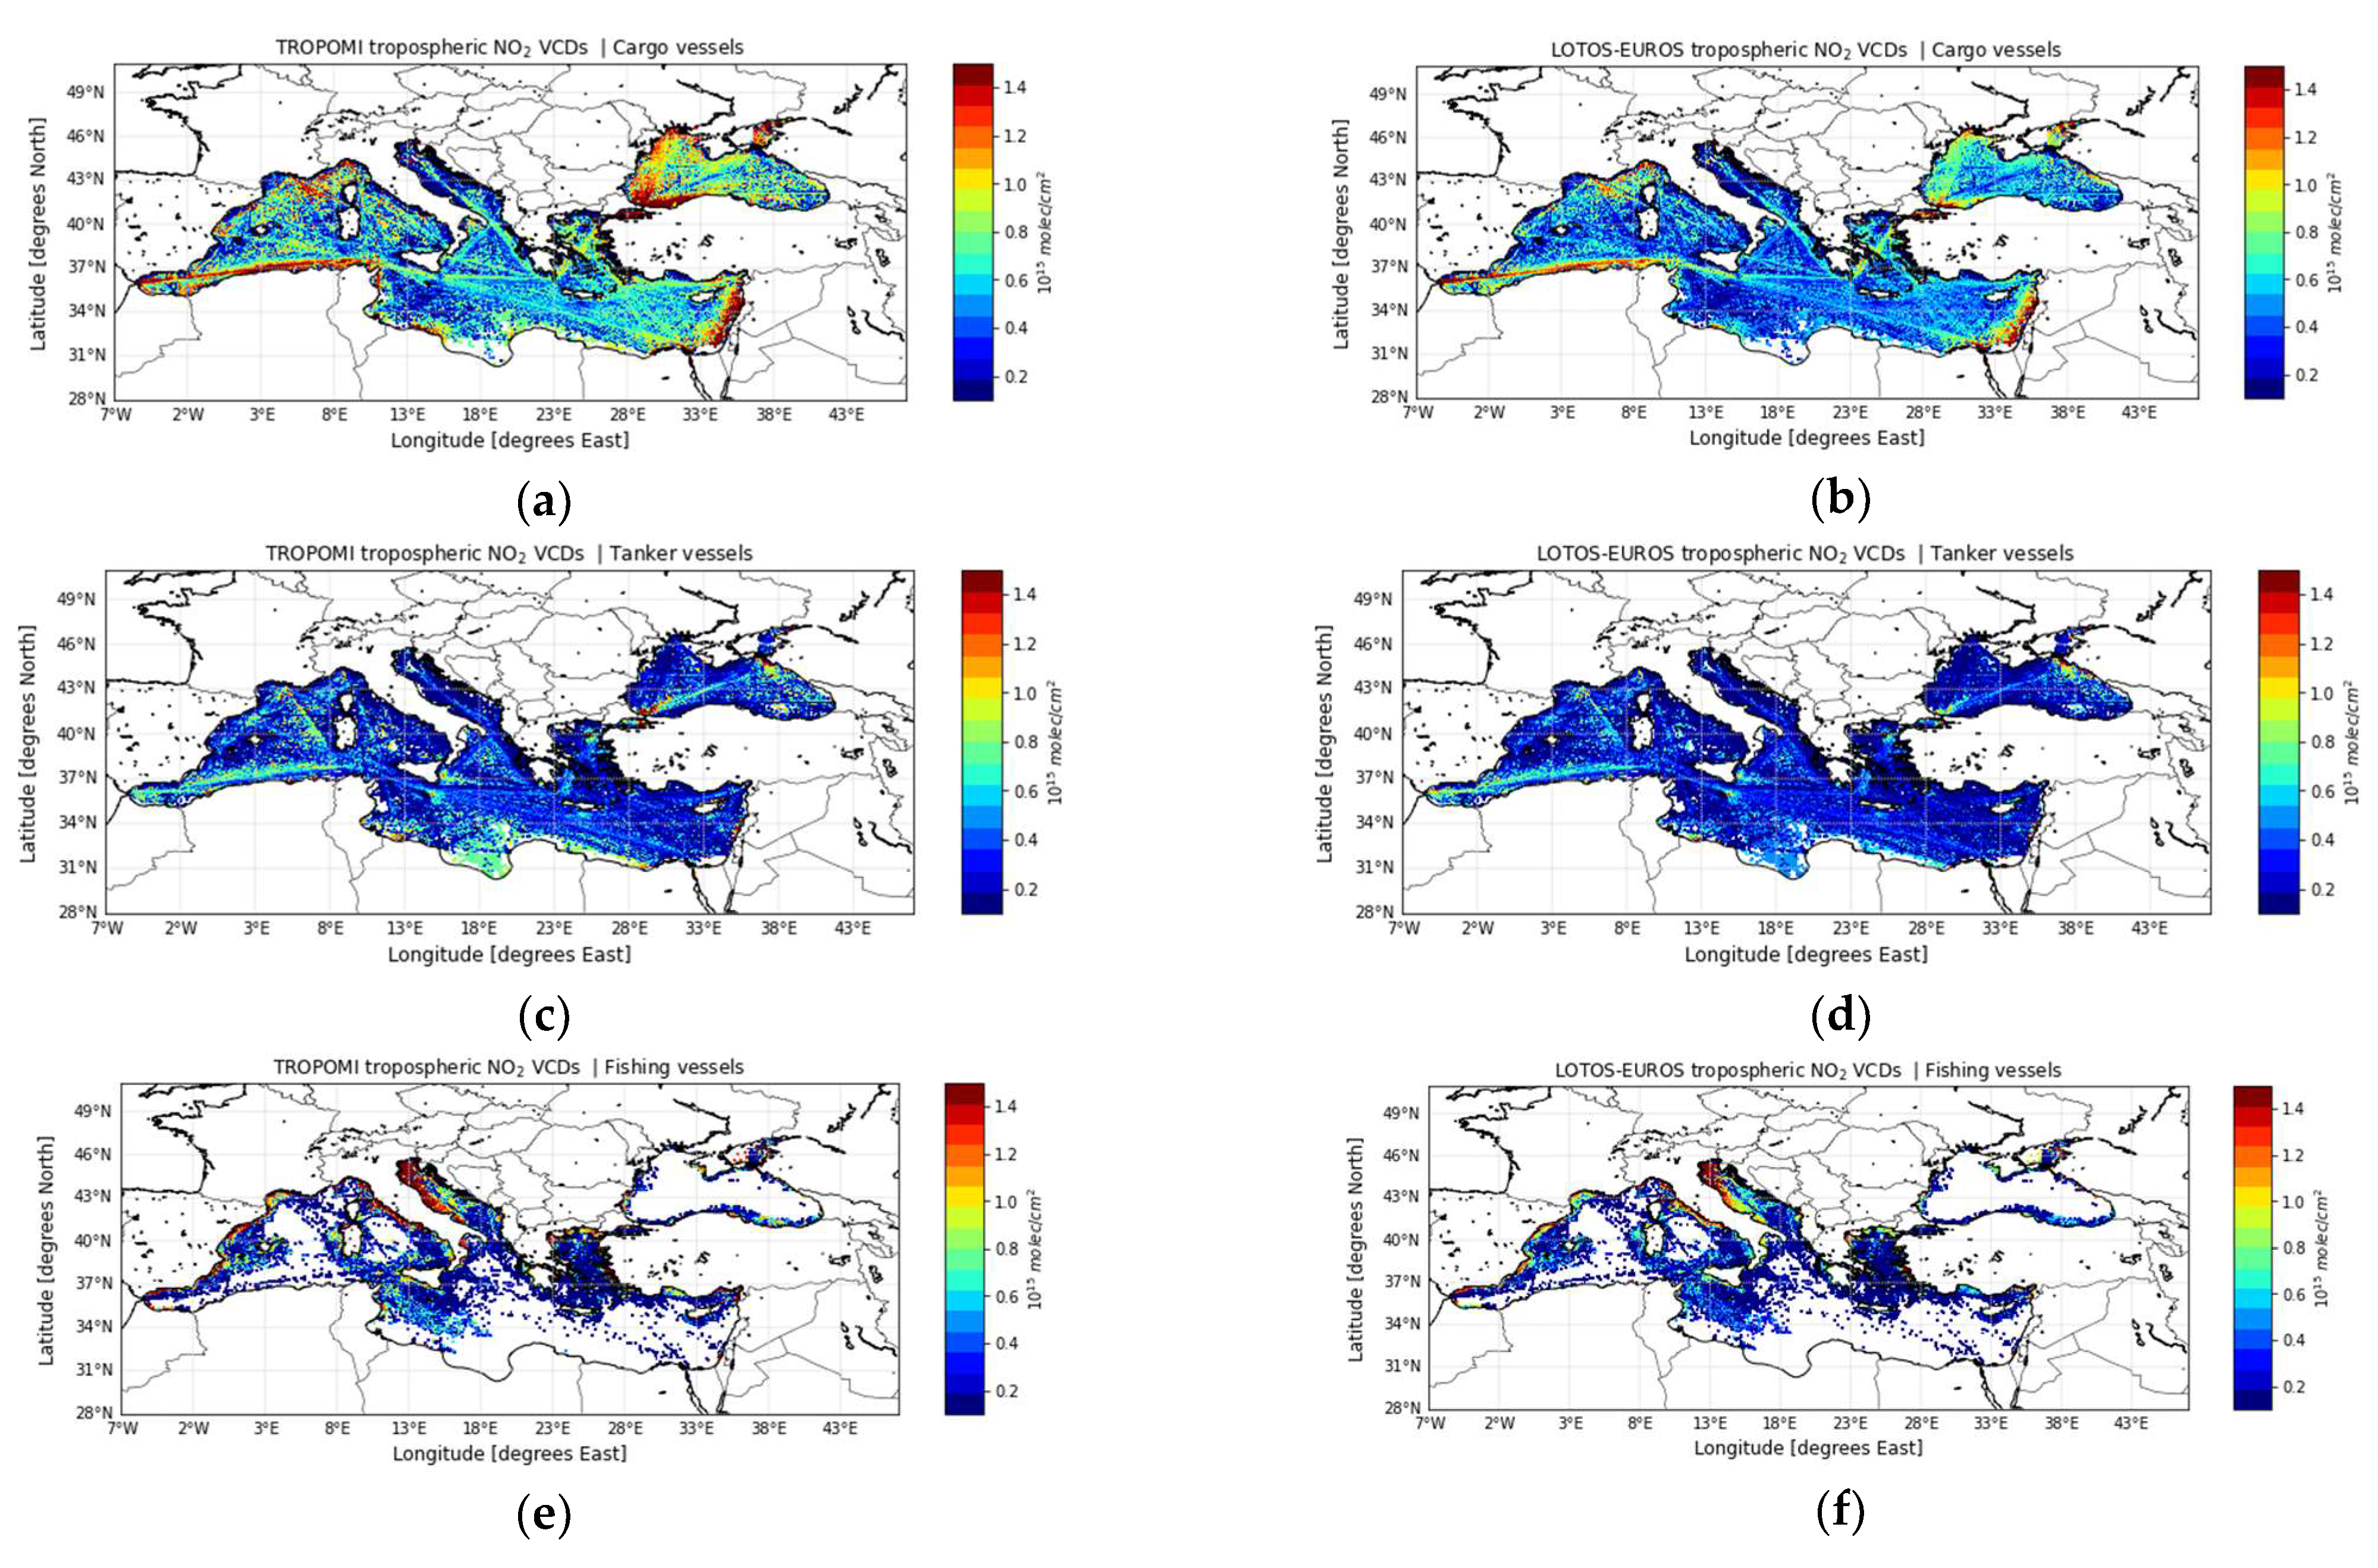
3.2. First Application of EMODnet Separations on TROPOMI Observations and LOTOS-EUROS Simulations

We applied the same methodology discussed above for the CAMS-GLOB-SHIP emission inventory (Equation (1)) to the TROPOMI mean tropospheric NO2 monthly and annual VCDs and the corresponding NO2 VCDs originating from the simulations of the LOTOS-EUROS CTM. We overlay the TROPOMI observation and the LOTOS-EUROS simulations on the EMODnet vessel specific tracks and weight the data with the vessel density contribution factor in order to identify the contribution of each shipping sector to the NO2 concentrations of the satellite and the model. The method seems to work significantly well for the cargo, tanker, and passenger vessels because their activity is located in the high seas and not offshore. As will be shown below, however, we report high NO2 concentrations from the fishing sector because it is mainly located offshore, and it is directly affected from the outflow of pollution from port cities and their harbors.

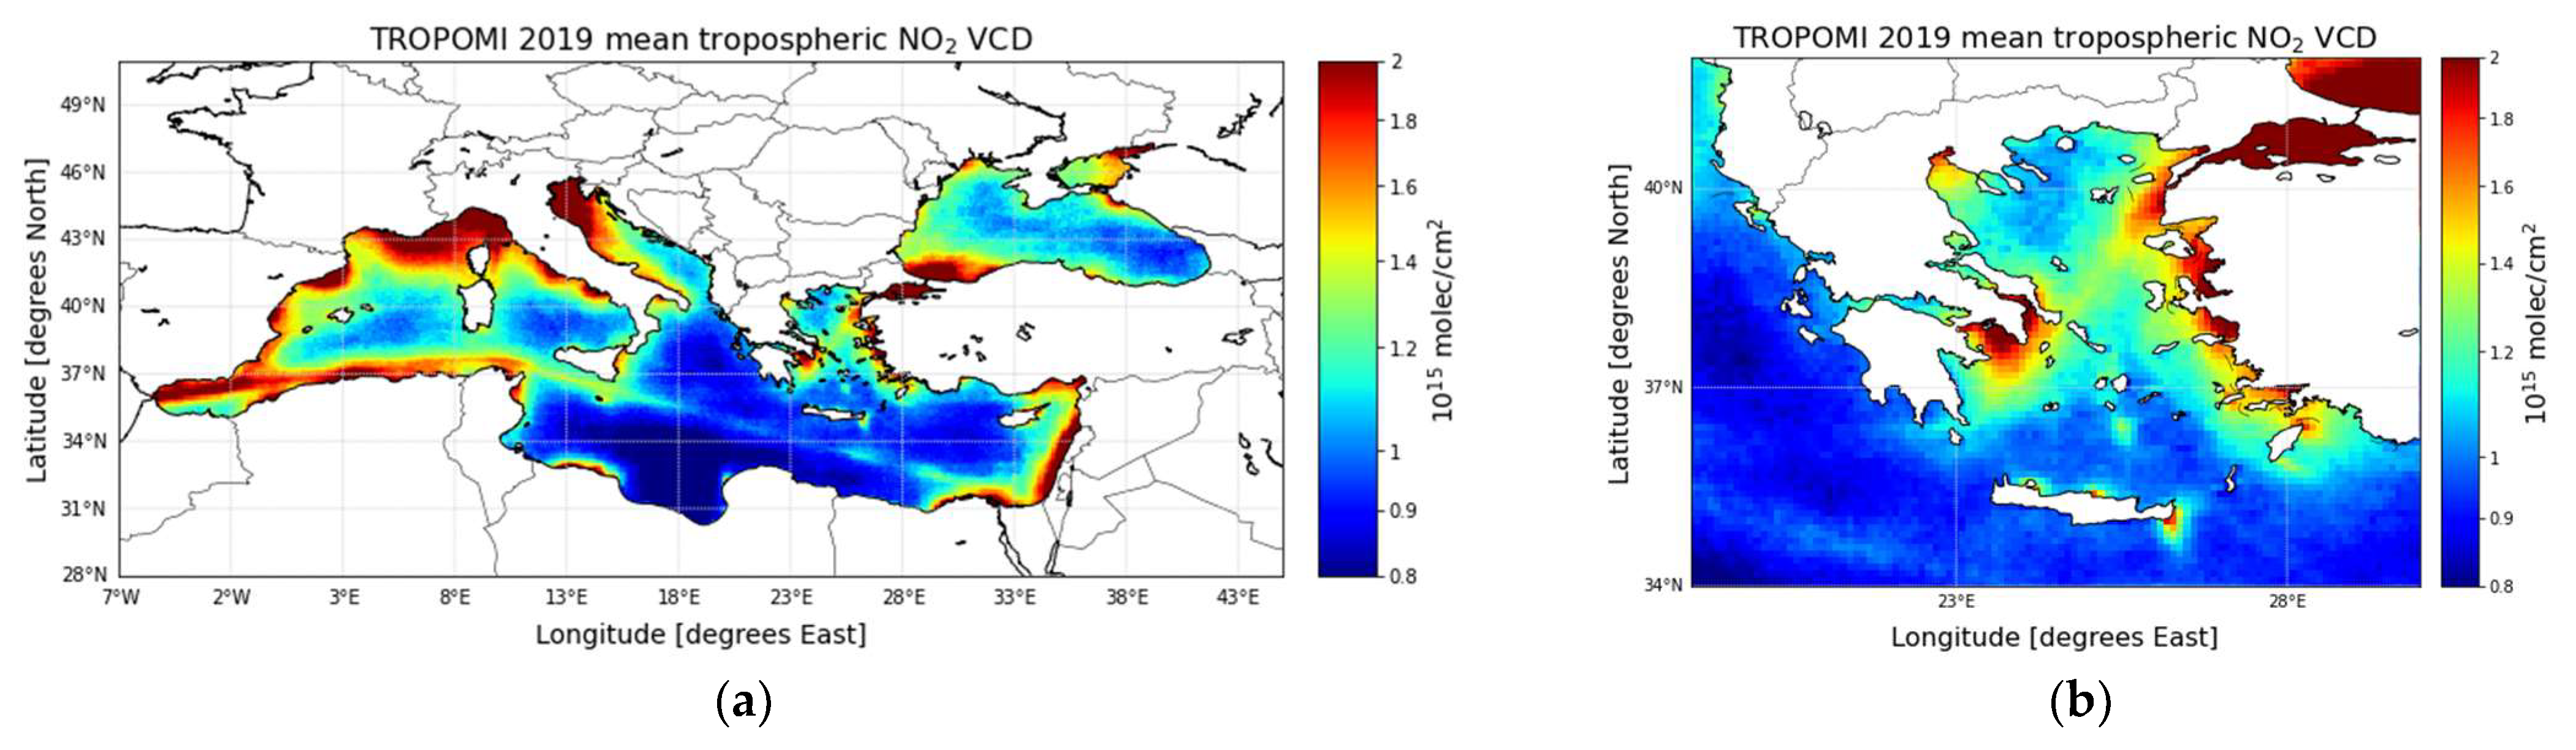
3.2.1. Annual Variability of the TROPOMI and LOTOS-EUROS VCDs

The TROPOMI tropospheric NO2 observations and the LOTOS-EUROS NO2 simulations were weighted for the first time according to the contribution of each EMODnet reported vessel type to the total vessel density, for 2019. The mean annual NO2 load is calculated by averaging the daily gridded sets first into monthly and then into annual, finally applying Equation (1). Between satellite and model data, the entire maritime EMODnet fleet of the Mediterranean is already in satisfactory agreement; 1.26 ± 0.56 × 10¹⁵ molecules cm−2 and 0.98 ± 0.41 × 10¹⁵ molecules cm−2, respectively. This further supports our intentions to extract updated maritime NOx emissions using these two datasets and a complementary data assimilation, and to hence possibly identify discrepancies depending on the type of vessel and their geographical location.
Figure 8 shows the tropospheric NO2 columns attributed to cargo, tanker, and fishing vessels from the TROPOMI instrument [left] and the LOTOS-EUROS CTM [right]. The major cargo and tanker lanes from Gibraltar to the Suez Canal, through the Bosporus Strait and in the Adriatic Sea, are present in both the satellite observations (Figure 8a,c) and the CTM simulations (Figure 8b,d). Note the enhancement of the tropospheric NO2 columns near the coastlines, whose possible origins are discussed further below. The heavy traffic load of the Greek Seas is shown in Figure S4a–d. Notably, the cargo route that crosses the Aegean Sea towards the Bosporus Strait shows significant NO2 concentrations, very similar to the CAMS-GLOB-SHIP lane separated emissions (c.f. Figure 5b).
Fishing vessel activity in the Mediterranean (Figure 8e,f) is higher near coastlines and shores and covers a plethora of coastal areas mainly along the eastern coasts of Italy and southwest coasts of Sicily and secondarily along the coastlines of Spain, France, and Greece (the Greek sub-domain is shown in Figure S4e,f). The enhancement of the NO2 columns near coastal areas may quite possibly be attributed to the direct effect of the inland emissions. This is true for both cargo and fishing vessels and is located over areas with higher urban NO2 concentrations, mainly port cities with significant anthropogenic activity such as Istanbul and Marseille. To investigate this premise, we compared the tropospheric NO2 columns over land and its closest seaborne pixel. We found that over a pixel in the port of Marseille the TROPOMI NO2 column is approximately 3.24 × 10¹⁵ molecules cm−2 and over the nearest sea pixel the NO2 column is 2.9 × 10¹⁵ molecules cm−2. For the same sea pixel, the mean tropospheric NO2 concentration attributable to cargo vessels is approximately 0.4 × 10¹⁵ molecules cm−2, while fishing vessel mean NO2 column is 1.4 × 10¹⁵ molecules cm−2. A more in-depth analysis of the fishing vessel attribution is planned, so as to attempt a comprehensive quantification of the effect of inland pollution compared to the coastal maritime contribution. We can however already note that the functionality of the implemented methodology by estimating the effects of different vessel types to the tropospheric NO2 columns from satellite data is indisputable.
In Table 2, the mean annual NO2 VCDs and the standard deviation of the mean for all selected vessel types for both the satellite observations and the CTM simulations are shown. Regarding the TROPOMI measurements, cargo vessels show the highest mean NO2 column (0.67 ± 0.43 × 10¹⁵ molecules cm−2), followed by the fishing vessels (0.47 ± 0.56 × 10¹⁵ molecules cm−2), while the third highest mean is recorded by the tanker vessels (0.35 ± 0.29 × 10¹⁵ molecules cm−2). The higher fishing mean NO2 concentration compared to the tanker vessels can be attributed to the absence of tanker activity offshore, which is mainly located in the high seas. Furthermore, the NO2 VCDs of tanker vessels are the net result of shipping activity and are not affected by inland and port activities. Passenger and other vessels record the lowest NO2 mean VCDs (0.20 ± 0.31 × 10¹⁵ molecules cm−2 and 0.15 ± 0.31 × 10¹⁵ molecules cm−2, respectively). Passenger vessel routes can be located mainly in the western Mediterranean between France, Italy, and Sardinia and in the Greek domain in the routes from Piraeus to Crete, while other vessels type NO2 columns are insignificant, and routes cannot be distinguished (not shown here).
On a promising note, the LOTOS-EUROS simulations show a similar distribution with the TROPOMI columns with respect to the magnitude of the columns attributed to each vessel type. As for the observational dataset, the highest NO2 columns are found for the cargo vessel lanes, followed by fishing and then the tanker lanes. Furthermore, we report an extremely high spatial correlation, over 0.9, between the measured and simulated tropospheric NO2 columns over the Mediterranean.
Concluding, the implementation of this methodology to the TROPOMI and LOTOS-EUROS NO2 columns results in a similar distribution of the shipping NO2 VCDs to the NOX CAMS-GLOB-SHIP shipping emissions. The only marked exceptions are the fishing vessels lanes, which appear to contribute more than the tanker vessels to the total emission budget, most likely due to the outflow of inland emissions.

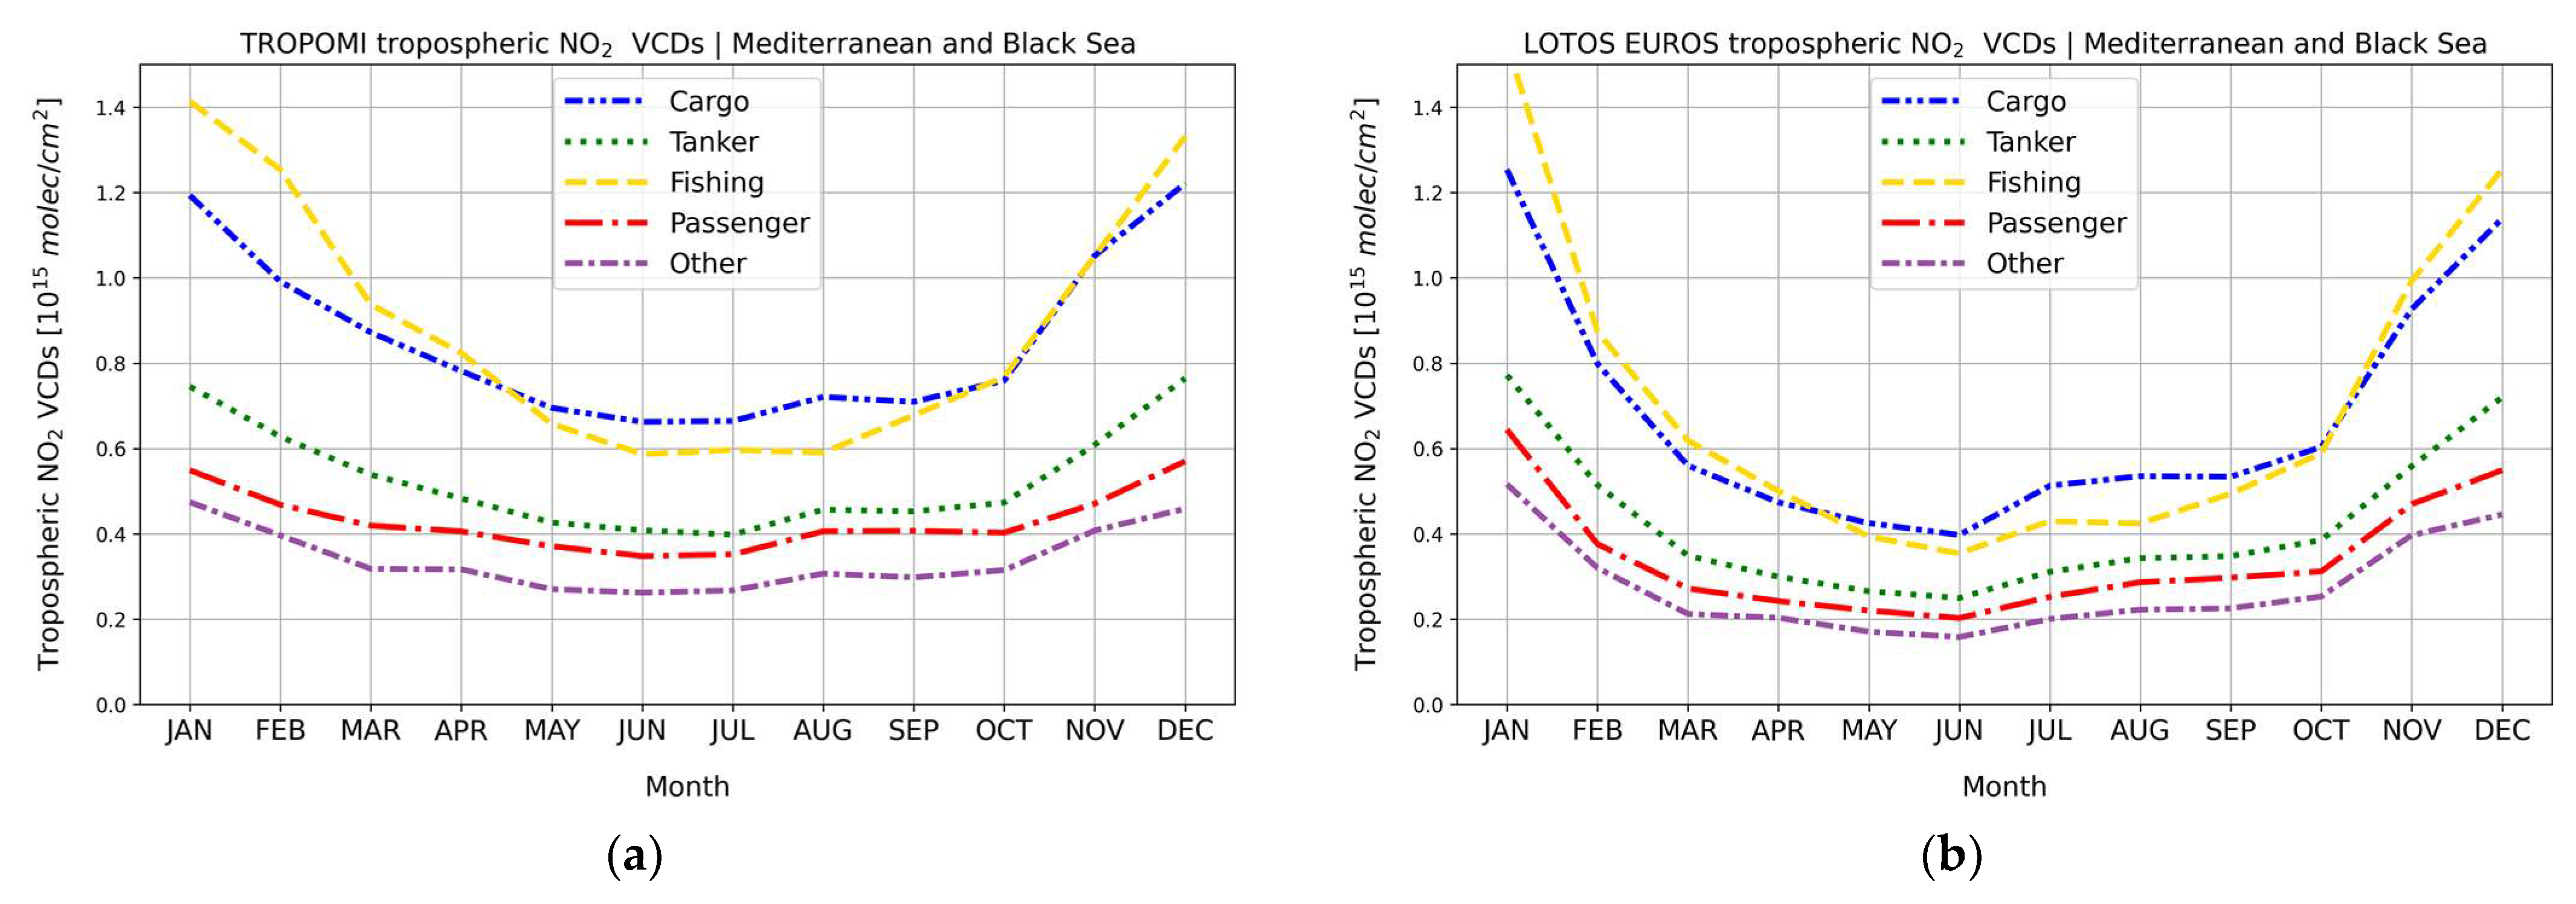
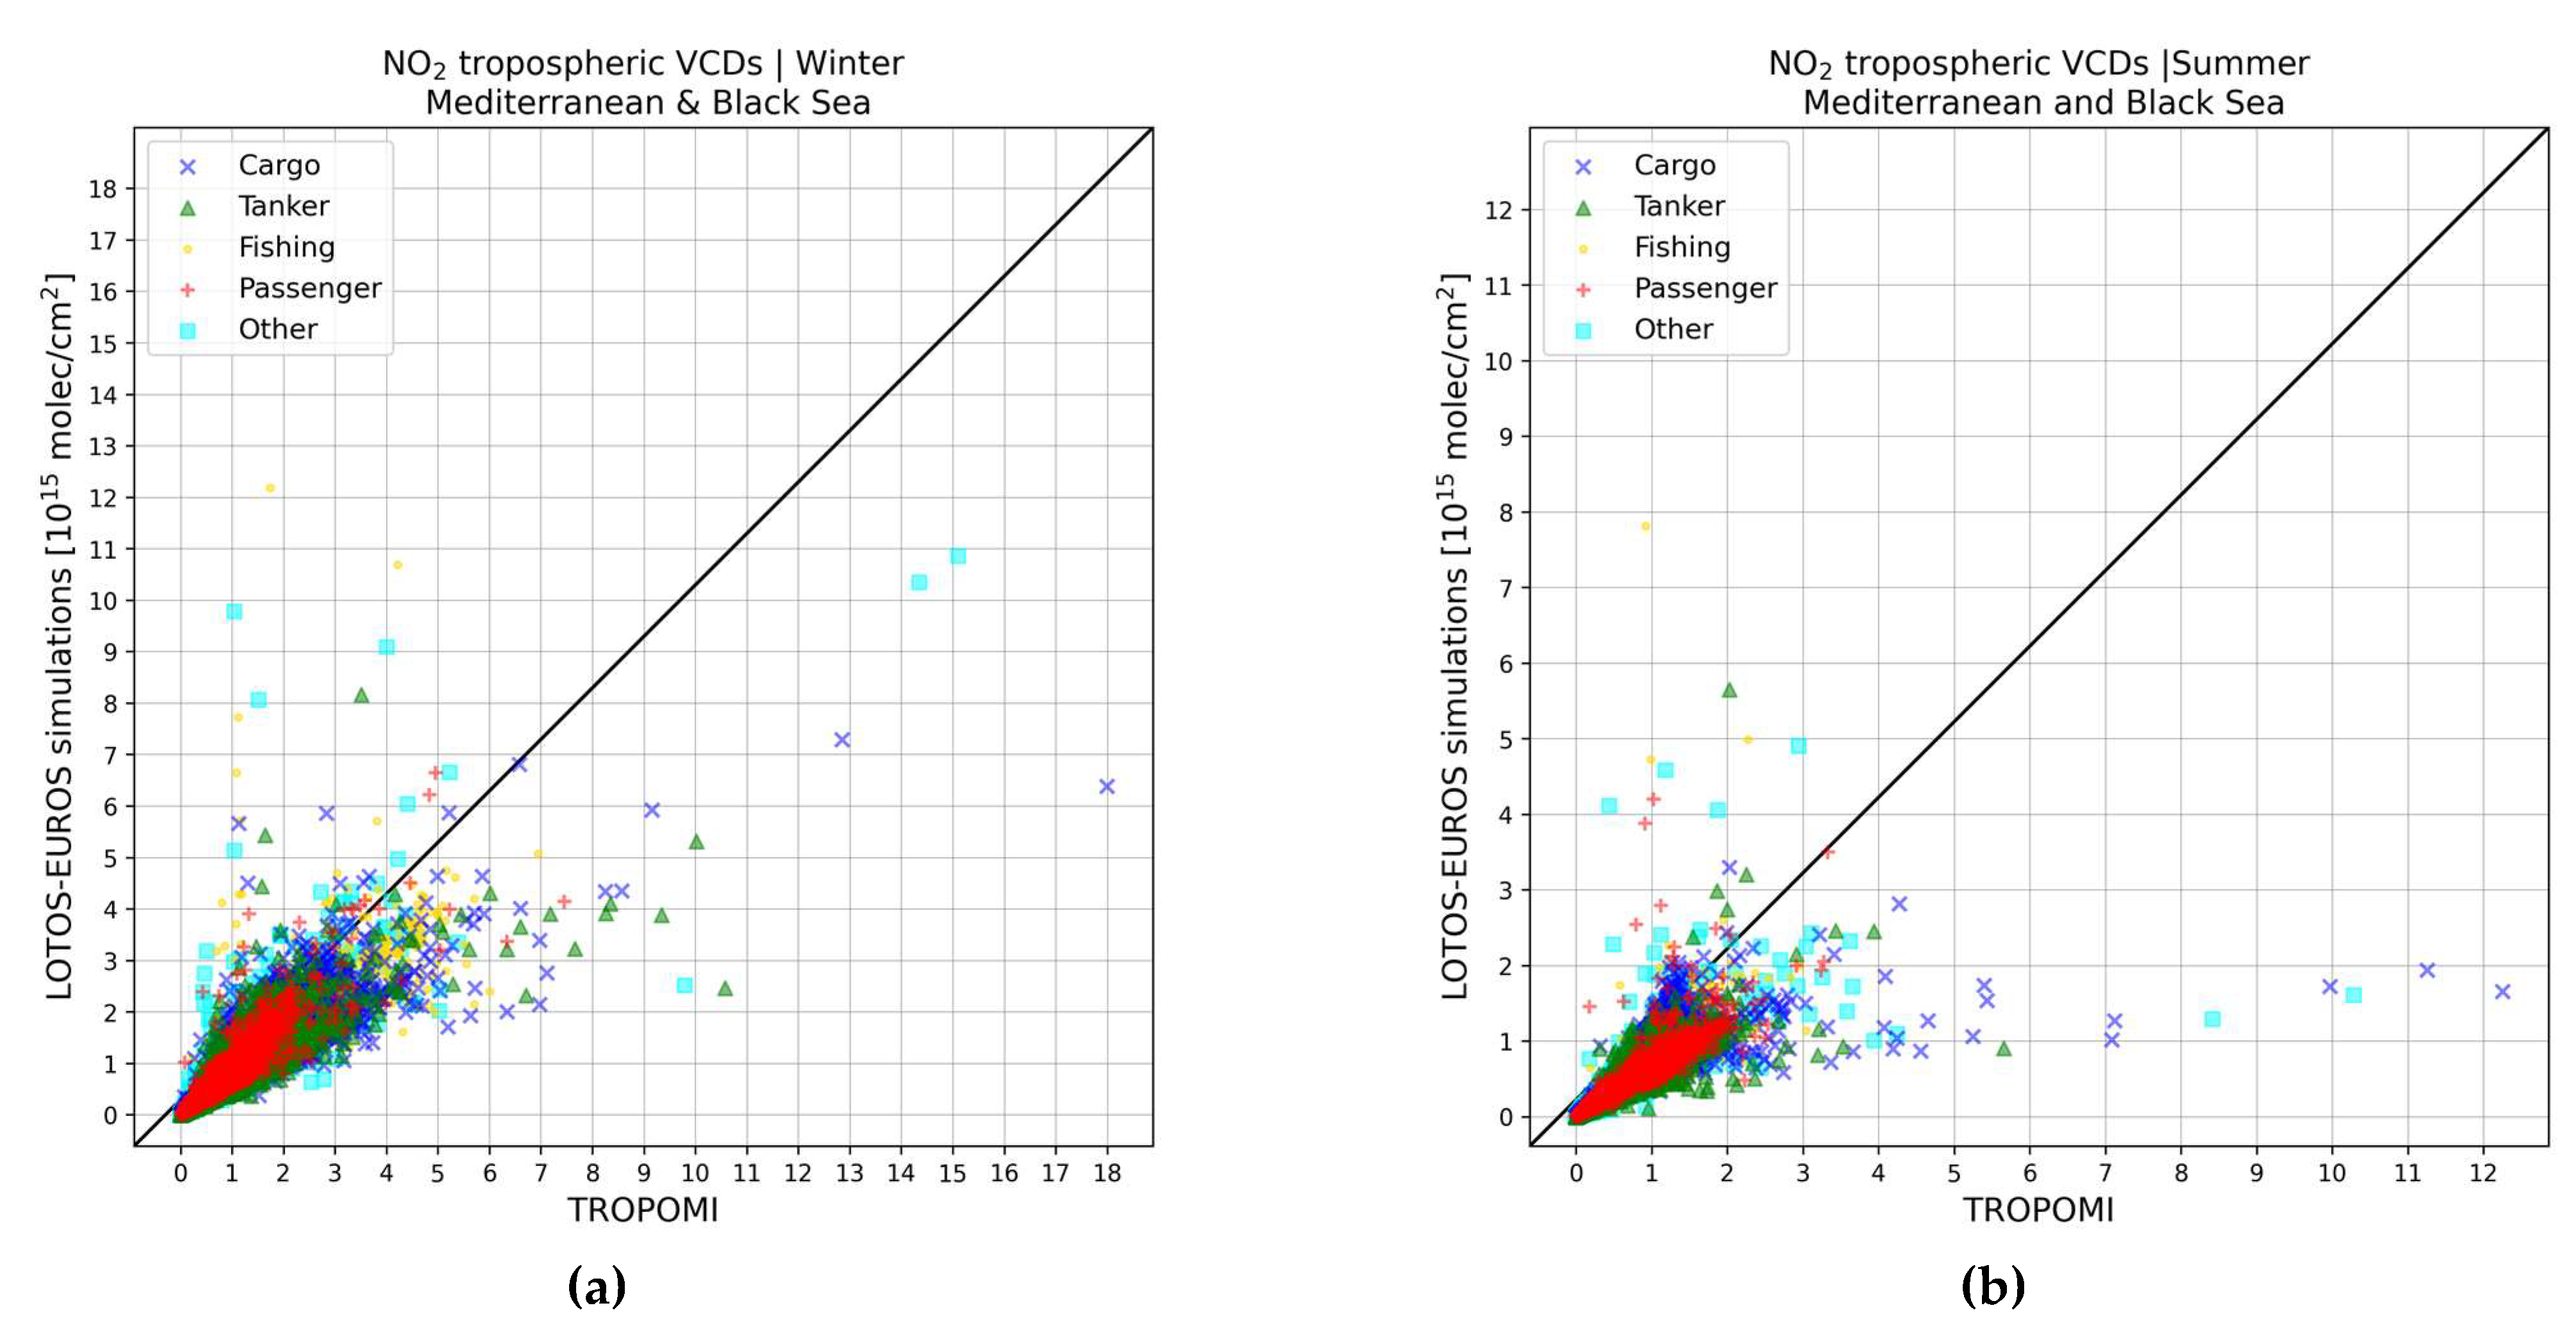
3.2.2. Seasonal Variability of the TROPOMI and LOTOS-EUROS VCDs

The seasonal variability of the TROPOMI tropospheric NO2 VCDS of the various vessel categories were also studied for both domains. The NO2 columns show a maximum in winter and a minimum in summer, when the NOX lifetime is higher and lower, respectively [39,40]. Studies oriented in the seasonal variability of TROPOMI NO2 VCDs originating from shipping activities have not yet been analyzed in depth.
Figure 9 shows the seasonal variability of the tropospheric NO2 VCDs of each vessel type for the Mediterranean and Black Sea domain from the retrievals of the TROPOMI instrument and the simulations of the LOTOS-EUROS CTM, respectively. The seasonal variability is apparent for all vessel types and both datasets, with higher NO2 loads during the wintertime period and lower values during the summertime period. Besides the obvious seasonal variation of the tropospheric NO2 columns, there are also evident variations that can be attributed to the vessel types and the vessel density, such as the increase in all activities in July and August, which responds to the higher vessel density reported in the EMODnet database (Figure 2b). LOTOS-EUROS simulations capture the same increase during the summer months, which is more evident for the passenger vessel NO2 VCDs, whereas in the remaining vessel types there is a flattening of the curve until early winter. Fishing vessel NO2 columns do not show similar variations during the summertime period since the activity is located near shores and is directly affected by inland and port activities and follows the variability of NO2 of inland regions [27,41]. Scatter plots of the seasonal comparisons are presented in Figure 10, for winter and summer per vessel type, while the statistics of the seasonal variability for the Mediterranean and Black Sea domain are presented in Table 3. The wintertime agreement between observations and simulations is found to be excellent regarding the mean reported loads and statistical markers. During the summertime months, even though the spatial correlation remains high, the mean loads reported by the LOTOS-EUROS simulations show a stronger decline than what is sensed by the satellite instrument. This finding will also form that basis of future work, where a data assimilation technique will be employed to investigate whether the inclusion of the TROPOMI observations in the modelling system is able to update the currently used CAMS-GLOB-SHIP emission inventory.
Regarding the Greek domain, similar findings are reported in Figure S5, where it is shown that seasonal variation of NO2 is more pronounced for the LOTOS-EUROS simulations, which is similar with the Mediterranean and Black Sea domain. The TROPOMI tropospheric NO2 seasonal variations are also present but with more fluctuations per month. The TROPOMI columns capture an increase in August regarding the passenger vessels, possibly due to the increased tourism of this period, which is not apparent in the LOTOS-EUROS simulations. Cargo vessels seem to peak in August for the TROPOMI observations, which is not evident for the model simulations. As for the entire domain studied, fishing vessel NO2 VCDs clearly depict the seasonality of NO2 for both datasets, with highs in winter and lows in summer, proving the direct effects of inland emissions to shipping activity near shores. The fact that the scatter plots (Figure S6) do not include as many outlier points, i.e., either misidentified pixels or missing pixels for some maritime activities, is also the reason for the extremely high spatial correlations between 0.9 and 0.97 for both seasons, depending on EMODnet vessel activity (see Table S1 for full statistics).
From the above, we can conclude that the implementation of this separation method and the connection of the NO2 VCDs to specific vessel types has shown that changes between months in the levels of tropospheric NO2 over the open seas can be attributed to specific vessels activities, thus offering new capabilities in the study of the maritime sector emissions from satellite data.

4. Discussion

In this study, the EMODnet database reporting monthly vessel density data for different maritime sectors was, for the first time, applied to the CAMS-GLOB-SHIP v2.1 NOX emissions inventory, the TROPOMI observed tropospheric NO2 columns, and the LOTOS-EUROS CTM simulations. The main aim was to demonstrate whether it is possible to similarly identify the emitted NO2 loads over the Mediterranean and Black Sea regions separated for cargo, tanker, passenger, and fishing activities, for both NOx emissions as well as on the measured and modelled NO2 columns.
With respect to the CAMS-GLOB-SHIP emission inventory, the distribution of the reported emissions for years 2017 to 2019 was shown to be similar with cargo and tanker vessels accounting for approximately 77% (53% and 24%) of the total emissions, fishing vessels for 9%, and passenger and other vessels for 7% and 6%, respectively. This distribution is not entirely followed by the observations and the simulations for year 2019, where the highest emitting lanes are first cargo (0.67 ± 0.43 and 0.51 ± 0.32 × 10¹⁵ molecules cm−2), then fishing (0.47 ± 0.56 and 0.37 ± 0.35 × 10¹⁵ molecules cm−2), followed by tanker (0.35 ± 0.29 and 0.27 ± 0.23 × 10¹⁵ molecules cm−2), and lastly by passenger and other vessels. This fact already demonstrates the impact of coastal anthropogenic emissions to the maritime-attributed pollution, since the outflow of traffic and industrial NOX emissions may be erroneously associated with fishing activities.
On a seasonal scale, apart from the NO2 columns, which were higher during wintertime and lower during summertime as expected, due to the photochemical processes which control the NOx lifetimes, the separation of the expected maritime pollution has further led to significant results. The fishing-attributed lanes show the highest observed and simulated NO2 loads for the winter months, while during summer the cargo lanes appear to contribute the most, with spatial correlation coefficients ranging between 0.88 and 0.91 for both seasons and marine activities. For all maritime sectors reported by EMODnet, the agreement is higher in wintertime with correlation slopes between 0.73 and 0.87, compared to 0.54 and 0.65 for summer months. Note that the model simulations are based on anthropogenic emissions from 2017 while the satellite observations and shipping emissions are obtained for 2019. We are expecting a major improvement in all statistical indicators when we will be able to use emissions from more recent years as input for the model simulations.
This work can be extended to generate a top-down emission inventory using the TROPOMI observations and data assimilation based on the LOTOS-EUROS. This technique has already been demonstrated successfully over point NOx emission sources [37]. The clear separation of maritime traffic in well-defined lanes crossing the Mediterranean Seas demonstrated in this work will allow us to apply the same data assimilation technique to update marine pollution-related emissions.

Supplementary Materials

The following are available online at www.mdpi.com/article/10.3390/atmos12111478/s1, Figure S1: Top: Total vessel density by EMODnet database (in hours per km2 per year) for all vessel types [left] and tanker vessels [right] for 2019. Middle: Total vessel density for passenger [left] and fishing vessels [right]. Bottom: Total vessel density for other vessels. Figure S2: Top: CAMS-GLOB-SHIP v2.1 NOX emissions (tons per year) in the Mediterranean and Black Sea domain [left column] and the Greek domain [right column] for tanker [top], fishing [middle], and other vessels [bottom] after the implementation of the new EMODnet lane separation methodology for 2019. Figure S3: CAMS-GLOB-SHIP v2.1 NOX emissions (in kilotons per year) in the Greek domain. Figure S4: Tropospheric NO2 vertical column densities (in 1015 molecules cm−2) classified according to the 2019 vessel density per vessel type in the Greek domain for the TROPOMI observations [left column] and the LOTOS-EUROS simulations [right column] for the cargo [top], tanker [middle], and fishing vessels [bottom]. Figure S5: Tropospheric NO2 vertical column densities (in 1015 molecules cm−2) seasonal variability according to the 2019 vessel density for the Greek domain for the TROPOMI observations [left] and the LOTOS-EUROS simulations [right]. Figure S6: Seasonal comparison between the tropospheric NO2 loads reported by TROPOMI and LOTOS-EUROS over the Greek domain per vessel type for winter [left column] and summer [right column]. Table S1: Seasonal statistics for the shipping activities sensed by TROPOMI and simulated by LOTOS-EUROS for the Greek domain.

Author Contributions

Conceptualization, M.-E.K. and D.B.; methodology, A.P. and M.-E.K.; software, A.P.; writing—original draft preparation, A.P. and M.-E.K.; writing—review and editing, by all authors; visualization, A.P. and I.S.; supervision, M.-E.K. and D.B. All authors have read and agreed to the published version of the manuscript.

Funding

This research has been financed by the European Union (European Regional Development Fund) and Greek national funds through the Operational Program “Competitiveness, Entrepreneurship and Innovation” (NSRF 2014–2020) by the “Panhellenic Infrastructure for Atmospheric Composition and Climate Change” project (MIS 5021516) implemented under the Action “Reinforcement of the Research and Innovation” Infrastructure.

Institutional Review Board Statement

Not applicable.

Informed Consent Statement

Not applicable.

Data Availability Statement

The S5P/TROPOMI observations are publicly available from the Copernicus Open Access Hub (https://scihub.copernicus.eu/, accessed on 12 October 2021, ESA, 2021). The CAMS-GLOB-SHIP v2.1, emissions data are publicly available from the Emissions of Atmospheric Compounds and Compilations of Ancillary Data (https://eccad.aeris-data.fr/, accessed on 12 October 2021, ECCAD, 2021). The EMODnet vessel density data are publicly available from the European Marine Observation and Data Network (https://www.emodnet-humanactivities.eu/, accessed on 12 October 2021, EMODnet, 2021). The LOTOS-EUROS CTM simulations shown in this work are performed with the version v02.02.001 and are available upon request.

Acknowledgments

We acknowledge the usage of modified Copernicus Sentinel data (2019–2020). Results presented in this work have been produced using the Aristotle University of Thessaloniki (AUTh) high-performance computing infrastructure and resources. Andreas Pseftogkas, Maria-Elissavet Koukouli, Ioanna Skoulidou, Dimitris Balis and Charikleia Meleti would like to acknowledge the support provided by the IT Center of the AUTh throughout the progress of this research work.

Conflicts of Interest

The authors declare no conflict of interest.

References

  1. Gaiser, L.; Hribar, D. Euro-Mediterranean region: Resurged geopolitical importance. Int. J. Euro-Med. Stud. 2012, 5, 57–69. [Google Scholar] [CrossRef] [Green Version]
  2. Poulos, S.E. The Mediterranean and Black Sea Marine System: An overview of its physico-geographic and oceanographic characteristics. Earth-Sci. Rev. 2020, 200, 103004. [Google Scholar] [CrossRef]
  3. Depellegrin, D.; Venier, C.; Kyriazi, Z.; Vassilopoulou, V.; Castellani, C.; Ramieri, E.; Bocci, M.; Fernandez, J.; Barbanti, A. Exploring Multi-Use potentials in the Euro-Mediterranean Sea space. Sci. Total Environ. 2019, 653, 612–629. [Google Scholar] [CrossRef] [PubMed]
  4. EUROSTAT. Maritime Transport Statistics—Short Sea Shipping of Goods—Statistics Explained. Available online: https://ec.europa.eu/eurostat/statistics-explained/index.php?title=Maritime_transport_statistics_-_short_sea_shipping_of_goods (accessed on 12 October 2021).
  5. EUROSTAT. Fishery Statistics. Available online: https://ec.europa.eu/eurostat/statistics-explained/index.php?title=Fishery_statistics (accessed on 12 October 2021).
  6. Endresen, Ø.; Sørgård, E.; Sundet, J.K.; Dalsøren, S.B.; Isaksen, I.S.A.; Berglen, T.F.; Gravir, G. Emission from inter-national sea transportation and environmental impact. J. Geosc. Res. 2003, 108, 4560. [Google Scholar] [CrossRef]
  7. European Environmental Agency. The Impact of International Shipping on European Air Quality and Climate Forcing, EEA Technical Report No 4/2013; Publications Office of the European Union: Luxembourg, 2013; ISBN 978-92-9213-357-3. ISSN 1725-2237. [Google Scholar] [CrossRef]
  8. International Maritime Organization. Annex 15-2019. Guidelines for Port State Control under MARPOL Annex VI Chapter 3. In International Convention for the Prevention of Pollution from Ships (MARPOL); International Maritime Organization: London, UK, 2019; Available online: https://www.imo.org/en/OurWork/IIIS/Pages/Port%20State%20Control.aspx (accessed on 12 October 2021).
  9. International Maritime Organization. MARPOL Annex VI-Prevention of Air Pollution from Ships National Workshop (virtual) on Ratification and Effective Implementation of MARPOL Annex VI for Algeria. In International Convention for the Prevention of Pollution from Ships (MARPOL); International Maritime Organization: London, UK, 2019; Available online: https://www.imo.org/en/OurWork/Environment/Pages/Air-Pollution.aspx (accessed on 12 October 2021).
  10. Eyring, V.; Köhler, H.W.; Van Aardenne, J.; Lauer, A. Emissions from international shipping: 1. The last 50 years. J. Geophys. Res. Space Phys. 2005, 110, 171–182. [Google Scholar] [CrossRef]
  11. Kuenen, J.J.P.; Visschedijk, A.J.H.; Jozwicka, M.; van der Gon, H.A.C.D. TNO-MACC_II emission inventory; a multi-year (2003–2009) consistent high-resolution European emission inventory for air quality modelling. Atmos. Chem. Phys. Discuss. 2014, 14, 10963–10976. [Google Scholar] [CrossRef] [Green Version]
  12. Jalkanen, J.-P.; Johansson, L.; Kukkonen, J. A comprehensive inventory of ship traffic exhaust emissions in the European sea areas in 2011. Atmos. Chem. Phys. Discuss. 2016, 16, 71–84. [Google Scholar] [CrossRef] [Green Version]
  13. Johansson, L.; Jalkanen, J.-P.; Kukkonen, J. Global assessment of shipping emissions in 2015 on a high spatial and temporal resolution. Atmos. Environ. 2017, 167, 403–415. [Google Scholar] [CrossRef]
  14. Merico, E.; Gambaro, A.; Argiriou, A.; Alebic-Juretic, A.; Barbaro, E.; Cesari, D.; Chasapidis, L.; Dimopoulos, S.; Dinoi, A.; Donateo, A.; et al. Atmospheric impact of ship traffic in four Adriatic-Ionian port-cities: Comparison and harmonization of different approaches. Transp. Res. Part D Transp. Environ. 2017, 50, 431–445. [Google Scholar] [CrossRef]
  15. Russo, M.; Leitao, J.; Gama, C.; Ferreira, J.; Monteiro, A. Shipping emissions over Europe: A state-of-the-art and comparative analysis. Atmos. Environ. 2018, 177, 187–194. [Google Scholar] [CrossRef]
  16. Saliba, M.; Azzopardi, F.; Muscat, R.; Grima, M.; Smyth, A.; Jalkanen, J.-P.; Johansson, L.; Deidun, A.; Gauci, A.; Galdies, C.; et al. Trends in Vessel Atmospheric Emissions in the Central Mediterranean over the Last 10 Years and during the COVID-19 Outbreak. J. Mar. Sci. Eng. 2021, 9, 762. [Google Scholar] [CrossRef]
  17. Marmer, E.; Dentener, F.; Van Aardenne, J.; Cavalli, F.; Vignati, E.; Velchev, K.; Hjorth, J.; Boersma, K.; Vinken, G.C.M.; Mihalopoulos, N.; et al. What can we learn about ship emission inventories from measurements of air pollutants over the Mediterranean Sea? Atmos. Chem. Phys. Discuss. 2009, 9, 6815–6831. [Google Scholar] [CrossRef] [Green Version]
  18. Ding, J.; van der A, R.J.; Mijling, B.; Jalkanen, J.-P.; Johansson, L.; Levelt, P.F. Maritime NOx Emissions Over Chinese Seas Derived from Satellite Observations. Geophys. Res. Lett. 2018, 45, 2031–2037. [Google Scholar] [CrossRef] [Green Version]
  19. Georgoulias, A.K.; Boersma, K.F.; Van Vliet, J.; Zhang, X.; van der A, R.; Zanis, P.; De Laat, J. Detection of NO2 pollution plumes from individual ships with the TROPOMI/S5P satellite sensor. Environ. Res. Lett. 2020, 15, 124037. [Google Scholar] [CrossRef]
  20. European Marine Observation and Data Network (EMODnet). Available online: https://emodnet.ec.europa.eu/en (accessed on 12 October 2021).
  21. European Marine Observation and Data Network (EMODnet). Human Activities. Available online: www.emodnet-humanactivities.eu (accessed on 12 October 2021).
  22. EU Vessel Density Map. Detailed Method. Available online: https://www.emodnet-humanactivities.eu/documents/Vessel%20density%20maps_method_v1.5.pdf (accessed on 12 October 2021).
  23. CAMS-GLOB-SHIP v2.1. Available online: https://eccad.aeris-data.fr/ (accessed on 12 October 2021).
  24. Granier, C.; Darras, S.; van der Gon, H.D.; Doubalova, J.; Elguindi, N.; Galle, B.; Gauss, M.; Guevara, M.; Jalkanen, J.P.; Kuenen, J.; et al. The Copernicus Atmosphere Monitoring Service Global and Regional Emissions (April 2019 Version) [Research Report]; Copernicus Atmosphere Monitoring Service: Reading, UK, 2019. [Google Scholar] [CrossRef]
  25. Veefkind, J.P.; Aben, I.; McMullan, K.; Förster, H.; de Vries, J.; Otter, G.; Claas, J.; Eskes, H.J.; de Haan, J.F.; Kleipool, Q.; et al. TROPOMI on the ESA Sentinel-5 Precursor: A GMES mission for global observations of the atmospheric composition for climate, air quality and ozone layer applications. Remote Sens. Environ. 2012, 120, 70–83. [Google Scholar] [CrossRef]
  26. Van Geffen, J.; Boersma, K.F.; Eskes, H.; Sneep, M.; ter Linden, M.; Zara, M.; Veefkind, J.P. S5P TROPOMI NO2 slant column retrieval: Method, stability, uncertainties and comparisons with OMI. Atmos. Meas. Tech. 2020, 13, 1315–1335. [Google Scholar] [CrossRef] [Green Version]
  27. Koukouli, M.E.; Skoulidou, I.; Karavias, A.; Parcharidis, I.; Balis, D.; Manders, A.; Segers, A.; Eskes, H.; van Geffen, J. Sudden changes in nitrogen dioxide emissions over Greece due to lockdown after the outbreak of COVID-19. Atmos. Chem. Phys. Discuss. 2021, 21, 1759–1774. [Google Scholar] [CrossRef]
  28. ESA. Copernicus Open Access Hub. Available online: https://scihub.copernicus.eu/ (accessed on 12 October 2021).
  29. Boersma, K.F.; Eskes, H.J.; Richter, A.; De Smedt, I.; Lorente, A.; Beirle, S.; van Geffen, J.H.G.M.; Zara, M.; Peters, E.; Van Roozendael, M.; et al. Improving algorithms and uncertainty estimates for satellite NO2 retrievals: Results from the quality assurance for the essential climate variables (QA4ECV) project. Atmos. Meas. Tech. 2018, 11, 6651–6678. [Google Scholar] [CrossRef] [Green Version]
  30. Boersma, K.F.; Eskes, H.J.; Dirksen, R.J.; van der A, R.J.; Veefkind, J.P.; Stammes, P.; Huijnen, V.; Kleipool, Q.; Sneep, M.; Claas, J.; et al. An improved tropospheric NO2 column retrieval algorithm for the Ozone Monitoring Instrument. Atmos. Meas. Tech. 2011, 4, 1905–1928. [Google Scholar] [CrossRef] [Green Version]
  31. Lambert, J.-C.; Keppens, A.; Kleipool, Q.; Langerock, B.; Sha, M.K.; Verhoelst, T.; Wagner, T.; Ahn, C.; Argyrouli, A.; Balis, D.; et al. S5P MPC Routine Operations Consolidated Validation Report Series. Version 12.01.00. In Quarterly Validation Report of the Copernicus Sentinel-5 Precursor Operational Data Products—#02 July 2018–February 2019; European Space Agency: Paris, France, 2021; p. 172. [Google Scholar]
  32. van Geffen, J.; Eskes, H.; Boersma, K.F.; Veefkind, J.P. TROPOMI ATBD of the Total and Tropospheric NO2 Data Products, S5P-KNMI-L2-0005-RP; Royal Dutch Meteorological Institute: Utrecht, The Netherlands, 2021. [Google Scholar]
  33. Manders, A.M.M.; Builtjes, P.J.H.; Curier, L.; van der Gon, H.A.C.D.; Hendriks, C.; Jonkers, S.; Kranenburg, R.; Kuenen, J.J.P.; Segers, A.J.; Timmermans, R.M.A.; et al. Curriculum vitae of the LOTOS–EUROS (v2.0) chemistry transport model. Geosci. Model Dev. 2017, 10, 4145–4173. [Google Scholar] [CrossRef] [Green Version]
  34. Schaap, M.; Timmermans, R.M.A.; Roemer, M.; Boersen, G.A.C.; Builtjes, P.J.H.; Sauter, F.J.; Velders, G.J.M.; Beck, J.P. The LOTOS-EUROS model: Description, validation and latest developments. Int. J. Environ. Pollut. 2008, 32, 270–290. [Google Scholar] [CrossRef]
  35. Schaap, M.; Kranenburg, R.; Curier, L.; Jozwicka, M.; Dammers, E.; Timmermans, R. Assessing the sensitivity of the OMI-NO2 product to emission changes across Europe. Remote. Sens. 2013, 5, 4187–4208. [Google Scholar] [CrossRef] [Green Version]
  36. Skoulidou, I.; Koukouli, M.-E.; Manders, A.; Segers, A.; Karagkiozidis, D.; Gratsea, M.; Balis, D.; Bais, A.; Gerasopoulos, E.; Stavrakou, T.; et al. Evaluation of the LOTOS-EUROS NO2 simulations using ground-based measurements and S5P/TROPOMI observations over Greece. Atmos. Chem. Phys. 2021, 21, 5269–5288. [Google Scholar] [CrossRef]
  37. Skoulidou, I.; Koukouli, M.-E.; Segers, A.; Manders, A.; Balis, D.; Stavrakou, T.; van Geffen, J.; Eskes, H. Changes in Power Plant NOx Emissions over Northwest Greece Using a Data Assimilation Technique. Atmosphere 2021, 12, 900. [Google Scholar] [CrossRef]
  38. Flemming, J.; Inness, A.; Flentje, H.; Huijnen, V.; Moinat, P.; Schultz, M.G.; and Stein, O. Coupling global chemistry transport models to ECMWF’s integrated forecast system. Geosci. Model Dev. 2009, 2, 253–265. [Google Scholar] [CrossRef] [Green Version]
  39. Van der A, R.J.; Peters, D.H.M.U.; Eskes, H.; Boersma, K.F.; Van Roozendael, M.; De Smedt, I.; Kelder, H.M. Detection of the trend and seasonal variation in tropospheric NO2 over China. J. Geophys. Res. 2006, 111, D12317. [Google Scholar] [CrossRef] [Green Version]
  40. Lamsal, L.N.; Martin, R.V.; van Donkelaar, A.; Celarier, E.A.; Bucsela, E.J.; Boersma, K.F.; Dirksen, R.; Luo, C.; Wang, Y. Indirect validation of tropospheric nitrogen dioxide retrieved from the OMI satellite instrument: Insight into the seasonal variation of nitrogen oxides at northern midlatitudes. J. Geophys. Res. 2010, 115, D05302. [Google Scholar] [CrossRef]
  41. Stavrakou, T.; Müller, J.-F.; Boersma, K.F.; De Smedt, I.; van der A, R.J. Assessing the distribution and growth rates of NOx emission sources by inverting a 10-year record of NO2 satellite columns. Geophys. Res. Lett. 2008, 35, L10801. [Google Scholar] [CrossRef]
Figure 1. The Mediterranean and Black Seas studied in this work (green box) as well as the Greek sub-domain (red box) (Created using background ArcGIS®).
Atmosphere 12 01478 g001
Figure 2. (a) Cargo vessel density for 2019 (in hours per km2 per year) by EMODnet for the Mediterranean and Black Sea regions; (b) Monthly variation of the vessel density over the study regions in 2017–2019.
Atmosphere 12 01478 g002
Figure 3. CAMS-GLOB-SHIP v2.1 2019 NOX emissions (tons per year).
Atmosphere 12 01478 g003
Figure 4. Annual mean TROPOMI tropospheric NO2 mean vertical column densities (1015 molecules cm−2) for (a) the Mediterranean and the Black Sea regions; (b) the Greek domain.
Atmosphere 12 01478 g004
Figure 5. CAMS-GLOB-SHIP NOX emissions (in tons per year) classified according to the vessel density per vessel type: (a) Cargo vessels in the Mediterranean and the Black Sea; (b) Cargo vessels in the Greek domain; (c) Passenger vessels in the Mediterranean and the Black Sea; (d) Passenger vessels in the Greek domain.
Atmosphere 12 01478 g005aAtmosphere 12 01478 g005b
Figure 6. CAMS-GLOB-SHIP NOX emissions (in kilotons y−1) per vessel type and year in the Mediterranean and the Black Sea.
Atmosphere 12 01478 g006
Figure 7. CAMS-GLOB-SHIP NOX emissions time series from 2017 to 2019 (in tons per month) classified according to the EMODnet vessel density data of all the available years: Cargo vessels in blue, tanker vessels in green, fishing vessels in orange, passenger vessels in red and other vessels in purple; (a) Mediterranean and Black Sea; (b) Greek domain.
Atmosphere 12 01478 g007
Figure 8. Tropospheric NO2 vertical column densities (in 1015 molecules cm−2) classified according to the 2019 vessel density per vessel type: (a) TROPOMI cargo; (b) LOTOS-EUROS cargo; (c) TROPOMI tanker; (d) LOTOS-EUROS tanker; (e) TROPOMI fishing; (f) LOTOS-EUROS fishing.
Atmosphere 12 01478 g008
Figure 9. Tropospheric NO2 vertical column densities (in 1015 molecules cm−2) seasonal variability according to the 2019 vessel density for the Mediterranean and Black Sea regions: (a) TROPOMI; (b) LOTOS-EUROS.
Atmosphere 12 01478 g009
Figure 10. Seasonal comparison between the tropospheric NO2 loads reported by TROPOMI and LOTOS-EUROS over the Mediterranean and Black Sea domain per vessel type: (a) Winter; (b) Summer.
Atmosphere 12 01478 g010
Table 1. Contribution of each category (in %) to the total vessel density by the EMODnet database for the Mediterranean and the Black Sea basin.
VesselsCargoTankerFishingPassengerOther
201738.75%21.06%15.87%12.69%11.09%
201835.44%22.50%16.91%13.68%11.47%
2019 36.01%23.23%15.45%12.78%12.53%
Table 2. Mean and standard deviation of the mean 2019 maritime TROPOMI & LOTOS-EUROS tropospheric NO2 columns in 1015 molecules cm−2 for the Mediterranean and the Greek domains, per lane type.
Lane TypeMediterranean |2019|
Maritime Tropospheric NO2 Column
(1015 Molecules cm−2)
Greece |2019|
Maritime Tropospheric NO2 Column
(1015 Molecules cm−2)
TROPOMILOTOS-EUROSTROPOMILOTOS-EUROS
Cargo0.67 ± 0.430.51 ± 0.320.67 ± 0.440.52 ± 0.30
Tanker0.35 ± 0.290.27 ± 0.230.31 ± 0.290.24 ± 0.21
Fishing0.47 ± 0.560.37 ± 0.35 0.34 ± 0.500.27 ± 0.39
Passenger0.20 ± 0.310.15 ± 0.260.17 ± 0.340.13 ± 0.25
Other0.15 ± 0.310.12 ± 0.250.10 ± 0.210.08 ± 0.15
Table 3. Seasonal statistics for the shipping activities sensed by TROPOMI and simulated by LOTOS-EUROS.
Mediterranean and Black Sea Domain
Winter Summer
TROPOMI
Mean NO2 *
LOTOS-EUROS
Mean NO2 *
RSlopeTROPOMI
Mean NO2 *
LOTOS-EUROS
Mean NO2 *
RSlope
Cargo0.98 ± 0.540.81 ± 0.450.880.730.71 ± 0.340.48 ± 0.210.850.54
Tanker0.66 ± 0.480.54 ± 0.400.890.740.47 ± 0.300.32 ± 0.210.920.64
Fishing0.90 ± 0.820.74 ± 0.730.900.800.56 ± 0.420.37 ± 0.300.910.64
Passenger0.45 ± 0.490.39 ± 0.450.950.870.35 ± 0.370.23 ± 0.250.940.65
Other0.43 ± 0.570.37 ± 0.520.900.820.32 ± 0.370.22 ± 0.250.900.61
* In 1015 molecules cm−2.
Publisher’s Note: MDPI stays neutral with regard to jurisdictional claims in published maps and institutional affiliations.

