Article

Microscopic Fungi in Big Cities: Biodiversity, Source, and Relation to Pollution by Potentially Toxic Metals

by
Maria V. Korneykova
1,2,*,
Anastasia S. Soshina
2,
Andrey I. Novikov
3,
Kristina V. Ivashchenko
1,4,
Olesya I. Sazonova
5,
Marina V. Slukovskaya
1,3,6,
Anna A. Shirokaya
3,
Viacheslav I. Vasenev
1,7,
Anna A. Vetrova
5 and
Olga Gavrichkova
8
1
Agrarian Technological Institute, Peoples’ Friendship University of Russia (RUDN University), 117198 Moscow, Russia
2
Institute of North Industrial Ecology Problems—Subdivision of the Federal Research Centre, Kola Science Centre, Russian Academy of Sciences, 184209 Apatity, Russia
3
I.V. Tananaev Institute of Chemistry and Technology of Rare Elements and Mineral Raw Materials, Kola Science Centre, Russian Academy of Sciences, 184209 Apatity, Russia
4
Federal Research Center “Pushchino Scientific Center for Biological Research of the Russian Academy of Sciences”, Institute of Physicochemical and Biological Problems in Soil Science, 142290 Pushchino, Russia
5
Federal Research Center “Pushchino Scientific Center for Biological Research of the Russian Academy of Sciences”, G.K. Skryabin Institute of Biochemistry and Physiology of Microorganisms, 142290 Pushchino, Russia
6
Laboratory of Nature-Inspired Technologies and Environmental Safety of the Arctic Region, Kola Science Centre, Russian Academy of Sciences, 184209 Apatity, Russia
7
Soil Geography and Landscape Group, Wageningen University, 6707 Wageningen, The Netherlands
8
Institute of Research on Terrestrial Ecosystems, National Research Council, 05010 Porano, Italy
*
Author to whom correspondence should be addressed.
Atmosphere 2021, 12(11), 1471; https://doi.org/10.3390/atmos12111471
Submission received: 10 October 2021 / Revised: 29 October 2021 / Accepted: 3 November 2021 / Published: 7 November 2021
(This article belongs to the Special Issue Bioaerosols: Composition, Meteorological Impact, and Transport)

Abstract

:
For the first time, a mycological analysis of outdoor urban environment (air, leaves, sealed surfaces) was carried in the cities of subarctic (Murmansk) and temperate (Moscow) climatic zones. The chemical composition of dust deposited on leaves of dominant tree species was taken as an indicator of the air quality. Assessment of the complex impact of factors (climate zone, type of substrate, anthropogenic load) on the quantitative and qualitative parameters of mycobiome was performed. Compared to Moscow, Murmansk was characterized by an increased number and concentrations of pollutants in the deposited dust. The number of culturable airborne fungi in Murmansk was substantially lower than in Moscow. Half of the species belonged to the opportunistic in both cities. Most dangerous opportunistic fungi were absent in the air of recreational zones but present on leaves surface and in road dust in all assessed zones of the cities. Dust chemical composition affected the diversity of fungi species. While the relationship of biological parameters with concentration of potentially toxic metals was generally negative, Cd increased the fraction of opportunistic fungi in road dust. The study revealed an importance of substrate in determining the sensitivity of outdoor mycobiome to pollution and highlighted its biological characteristics sensitive to climate.

1. Introduction

In recent years, due to an increase in scale and speed of urbanization, and considerable growth of urban population, attention has been paid to study the ecology of urban agglomerations [1,2,3]. Large cities are anthropogenic ecosystems that differ from natural one in many factors: climate, physicochemical properties of soil and air, type and structure of vegetation, structure of microorganism communities, degree of pollution, and others. Fine dust or particulate matter has been recognized as one of the most harmful pollutants associated with the urban environment [4]. The spatial structure of cities is generally divided into functional zones: recreational, residential, and industrial/business. As a rule, functional zoning determines a degree of anthropogenic impact on ecosystems and can have a strong effect on structure and functioning of their biological components, vegetation, and microorganisms [5,6]. Air quality monitoring in cities executed by the local authorities does not always provide a sufficient spatial coverage. Urban trees accumulate a significant amount of dust on leaf surface and, given the distribution of green infrastructure in the cities, have been proposed as an excellent indicator of the local air quality in terms of pollutants type, amount and origin [7,8,9].
Although city dwellers pass a major part of the proper time indoors, the microbial community they are exposed to originates primarily from the outdoor environment [10]. Assessment of potentially pathogenic (opportunistic) fungi interaction with urban environmental conditions is important for densely populated agglomerations. Airborne opportunistic fungi are responsible for an increase in the incidence of secondary mycoses, allergies, asthma attacks, and numerous infections [11,12,13,14,15,16]. They can cause human diseases especially in people with weakened immunity or who are otherwise sensitive to a wide range of allergenic and toxigenic biological materials [17,18]. It was shown that dust particles and their composition can affect the number and the biodiversity of airborne microorganisms [19,20,21]. On the one hand, dust particles can add to the survival and dispersion of microorganisms, providing nutrients and protection from adverse factors (e.g., UV radiation) [22]. On the other hand, individual chemical constituents of dust can produce toxic effects in certain groups of microorganisms [21]. An increase in the fraction of airborne pathogenic bacteria was observed with the worsening of the air quality [20]. Little is known regarding the response of airborne pathogenic fungi to the pollution grade, since the majority of the studies on pathogenic mycobiome have been performed in the indoor environment [23,24,25,26,27,28,29].
Green infrastructure is one of the sources of microorganisms for the airborne environment [30,31]. It carries a specific community of microorganisms, phyllosphere, and can introduce and exchange spores and particles of fungal mycelium with the environment, shaping the diversity of airborne fungi. The phyllosphere fungi can effectively reduce air pollution in cities through the biodegradation of pollutants on leaves [32,33,34]. However, opportunistic fungi have been also found in phyllosphere microbiome [35]. Another important source of dust and associated microscopic fungi to the urban air are sealed surfaces (asphalt, concrete pavements, buildings, etc.). The extension of sealed surfaces in urban agglomerations is huge, making contact transmission of related mycobiome directly to humans very probable. The response of airborne, phyllosphere, and sealed surface mycobiome to the pollution in terms of diversity, pathogenicity, and functioning is poorly studied. Meanwhile, recent findings suggest a direct connection between outdoor air pollution grade and epidemiologic situation [36,37,38]. Hence, the need for a deeper understanding of the diversity and spatial–temporal dynamics of microorganisms is becoming more and more relevant. Very few studies address particularities of the airborne microorganisms considering different climatic zones [39,40,41] and urban functional zoning [42,43]. Few studies evaluated the dust fungi of several substrates, so that source/sink relationships could be considered [10,22].
Methods to study the quantitative and qualitative composition of the microscopic fungi in the environment vary from culturable approaches [25,42,44,45,46,47,48], direct microscopy [44,46,49] to molecular genetic methods of analysis [39,50,51,52,53]. DNA-based methods allow for deeper and more accurate taxonomic description of microbial communities of interest in confronting a culturable one [54]. However, most often dead, active, and potentially active units are not distinguishable with such characterization. Meanwhile, only active and potentially active microorganisms are relevant for biogeochemical processes and are capable of impacting human health [55]. From this point of view, the culturable approach allows a portion of active mycobiome to be isolated with potentially direct impact on city dwellers and hence was considered as suitable for the scopes of the current study.
Our research aimed to investigate mycological composition of dust, including the assessment of the proportion of opportunistic fungi species, in urban ecosystems with different climatic characteristics (Murmansk and Moscow, Russian Federation). In particular, we hypothesized:
1. Within each city, diversity and quantity of fungi will differ between zones with different anthropogenic load estimated as concentration of the potentially toxic metals on the surface of leaves. To test, sampling was performed in different urban functional zones: recreational, residential, and traffic, where contrasting anthropogenic load is expected;
2. The substrate hosting the fungal urban community will impact its diversity and quantity. Sensitivity of fungal community to pollution will be substrate-specific. To test, fungi were sampled from three urban substrates: air, surface of urban trees, and sealed surfaces;
3. Fungal community in subarctic climatic zone (Murmansk) will differ from fungal community in temperate zone (Moscow) in terms of diversity and quantity. To test, sampling was performed in two cities at comparable autumn conditions, anticipating sampling in Murmansk in respect to Moscow;
4. Response of opportunistic fungi to factors taken in consideration will differ from the response of the rest of mycobiome since they possess different optimum conditions for growth and different resistance to stress.

2. Materials and Methods

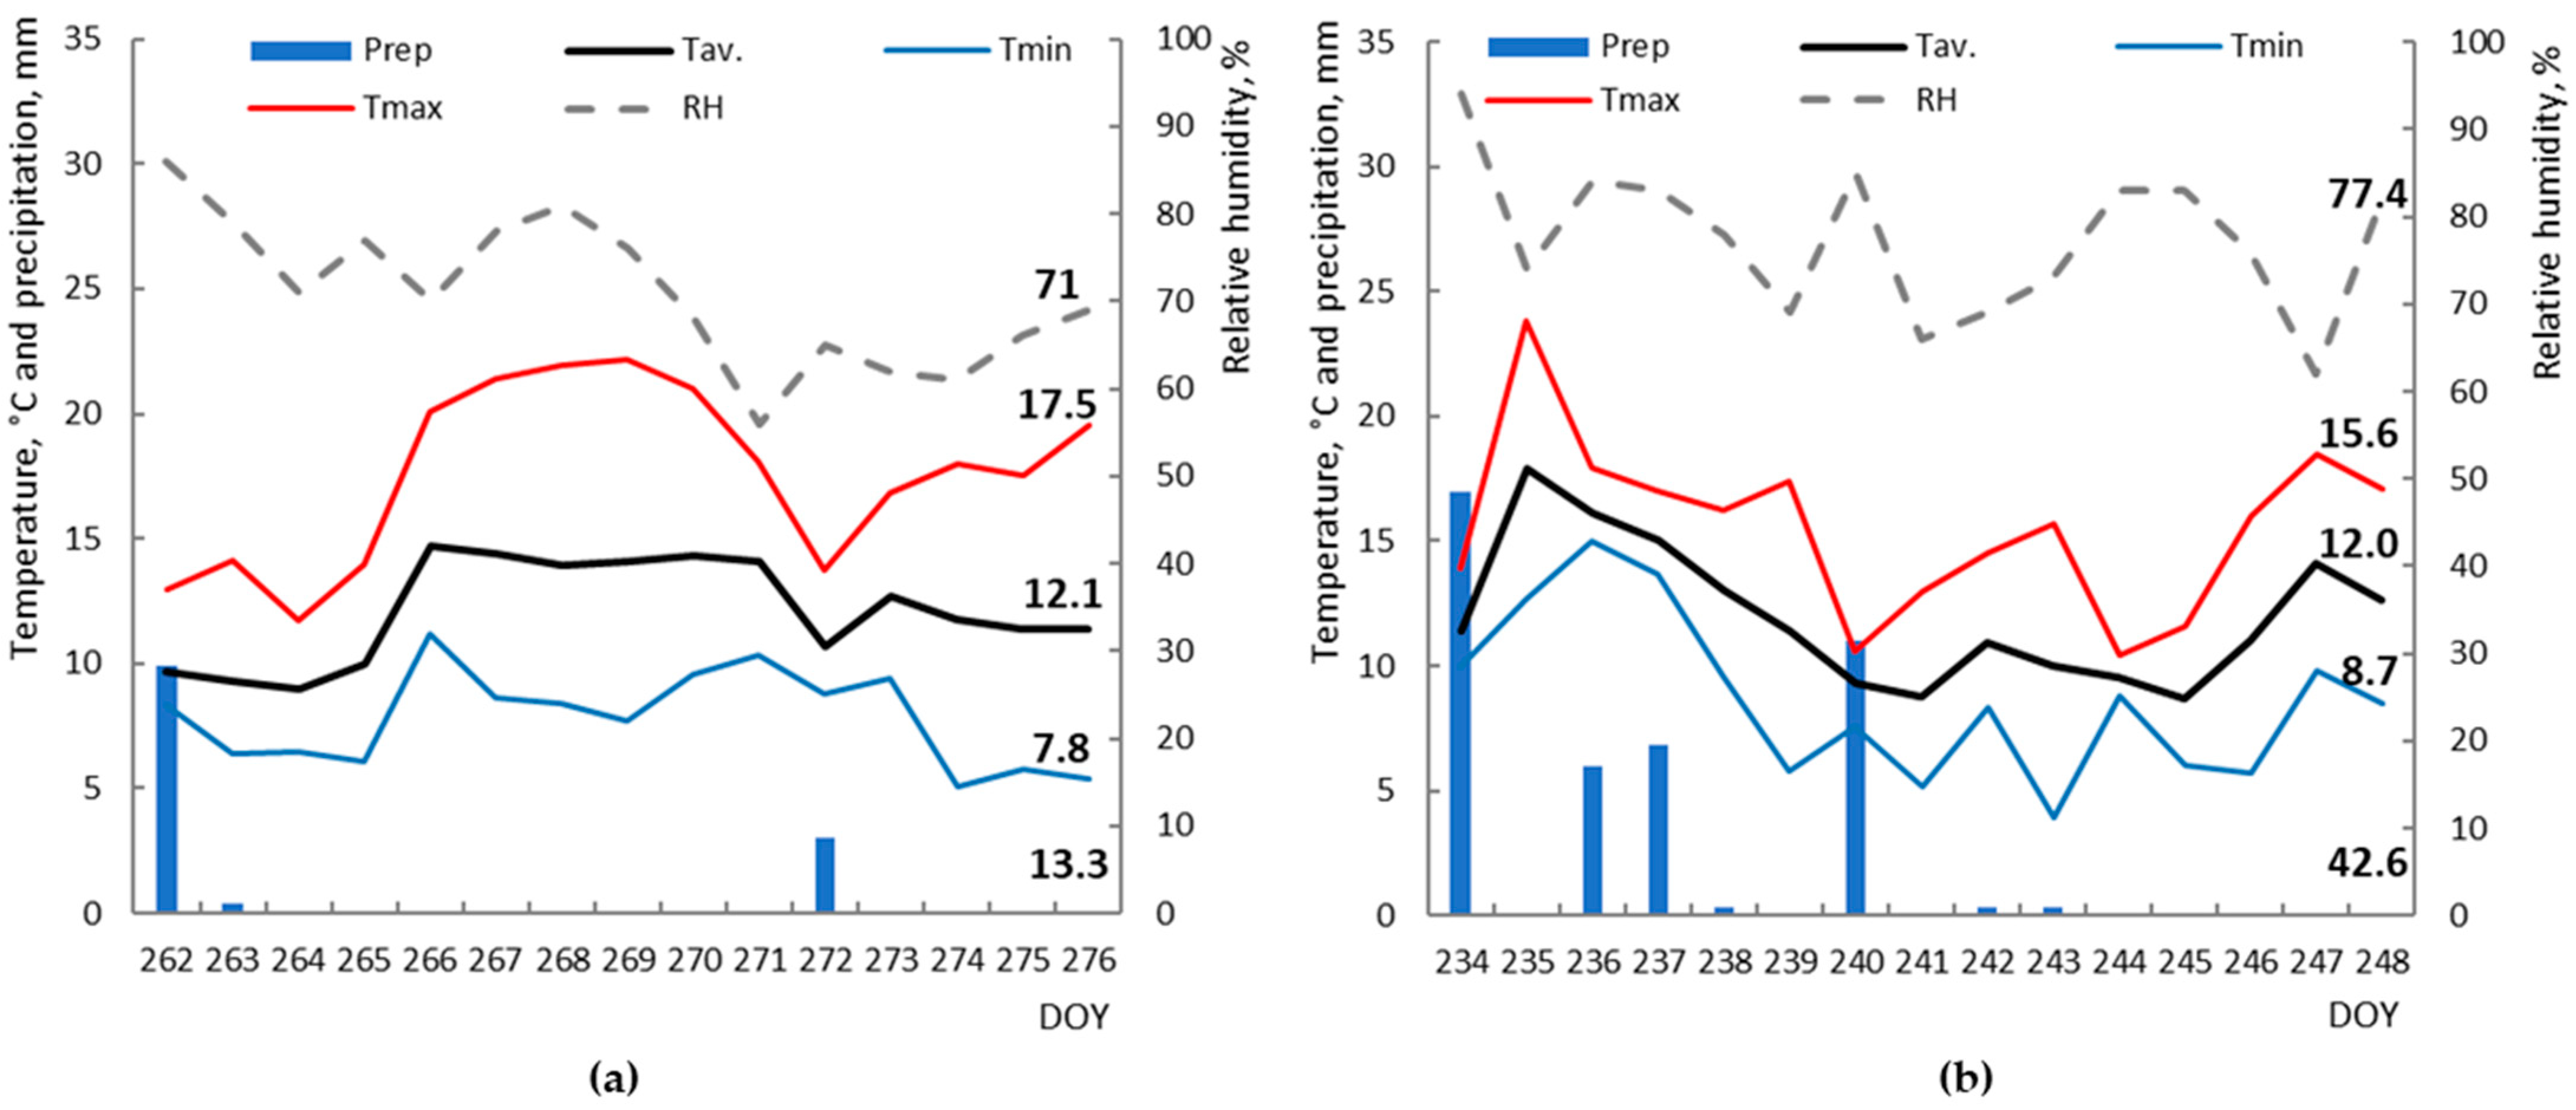
2.1. Climatic Characteristics of Research Areas

The study was carried out in two big cities (>250,000 inhabitants), Murmansk and Moscow, located in two climatic zones: subarctic (Murmansk) and temperate continental (Moscow). Murmansk is the biggest city beyond the Arctic Circle in terms of urban population. The city’s climate is formed in the immediate vicinity of the Barents Sea, under the influence of the warm, non-freezing North Atlantic Current. The average annual temperature is −0.4 °C. The average annual wind speed is 4.4 m/s. On average, about 601 mm of precipitation falls per year [56,57].
Moscow is a megapolis, the largest city in Russia. The climate of Moscow is temporally continental, with a clearly pronounced seasonality. The average annual temperature is +5.8 °C, the average annual wind speed is 2.3 m/s, and the average annual air humidity is 76%. During the year, 600–800 mm of atmospheric precipitation falls in Moscow and the adjacent territory, with most of it falling in the summer months [56,57].
Sampling was carried out at the end of the growing season in September with the restoration of the post-vacational traffic rates typical for autumn. To ensure similar seasonality and phenological stage of vegetation, in Murmansk sampling was performed earlier than in Moscow. Comparable meteorological conditions between two cities characterized the two weeks’ period prior to the sampling (Figure 1). Average air temperature (Tav) was similar between Moscow and Murmansk and amounted to 12 °C. Variation of minimum temperatures (Tmin) was more pronounced in Murmansk. Averaged maximum temperatures (Tmax) were two degrees higher in Moscow. Murmansk was characterized by higher precipitations.

2.2. Site Description

The research was carried out in three functional zones in each city differing from each other in the level of anthropogenic load: a traffic zone, a residential zone, and a recreational zone (Table 1). To ensure a clear anthropogenic gradient, data from local air quality monitoring stations were utilized to search for the adequate sites in Moscow [58]. For Murmansk, assessment was based on the counting of the traffic load and visual assessment of the areas. Chemical composition of dust collected from leaf surfaces of trees was used to support the choice. In each site, three replicated plots were localized randomly.

2.3. Sampling

The object of the research was dust and associated microscopic fungi. Three substrates were sampled in each plot: air, birch leaves, and sealed surfaces (asphalt road). Sampling of material was perfomed in a rainless period (at least 5 days), in order to reduce the influence of this meteorological component between cities and to allow dust to accumulate on leaves and sealed surfaces (Figure 1) [8].
Air sampling was carried out with the aspirator “PU-1B” (Khimko, Russia) at a height of 1.5 m (human height) on nutrient media (wort-agar nutrient medium and Sabouraud dextrose agar) in 3 replicates for each selected site. Aspirators are designed for automatic sampling of biological aerosols during sanitary control of air [44,46]. The device provides aerosol sampling onto a dense nutrient medium by impaction sedimentation. In traffic and residential sites 250 L of air during each sampling were collected; in recreational sites 500 L of air were sampled each time. The calculation of the fungi number in 1 m3 of air was carried out according to the formula
C = P × K,
where C—number of airborne fungi per 1 m3, P—number of fungal colonies on the dish, K—K is a coefficient per 1 m3 (K = 4, if V = 250 mL, K = 2, if V = 500 mL).
Birch leaves (Betula pendula Erhr.) were sampled from mature trees of the same physiological state. Representative birch tree was selected in each plot of which 150 leaves were collected at a height of 1.5–2.5 m. The leaf sampling was carried out in sterile gloves, leaves were placed into sterile plastic bags and transported in a cooler bag to the lab where immediately processed.
Road dust was collected with a pre-sterilized brush into sterile test tubes from an area of 1 m2 in each plot. In Murmansk, it was not possible to collect dust in the recreational zone due to the onset of rain.

2.4. Preparation of a Suspension for Analysis

For biological characterization, freshly picked leaves (leaf area not less than 250 cm2) were placed in an empty sterile Petri dish and sterile non-distilled water (15 mL) was added. Petri dishes with leaves and water were placed on a rotator at 300 rpm for 30 min to thoroughly wash off the dust. The area of leaves was registered.
For chemical analyses of dust, freshly picked leaves (leaf area not less than 500 cm2) were placed in sterile flasks with 50 mL of distilled water and shacked on a rotator at 300 rpm for 30 min to thoroughly wash off the dust. Solution was then filtered through 100-μm mesh to eliminate coarse impurities and placed at 65 °C in the oven allowing water to fully evaporate. The precipitate was weighted and processed on its chemical composition. The area of leaves was registered.
To obtain a sample of dust from asphalt, the material selected with a brush was sieved through a sieve with a mesh size of 100 μm. An aliquot of dust (0.7 g) was placed in a 15-mL falcon and 7 mL of sterile undistilled water was added; after that, the suspension was stirred on a rotator at 300 rpm for 30 min. For chemical analyses, the same amount of dust was utilized.

2.5. Chemical Analysis

Pollution level was assessed by analyzing the concentration of potentially toxic metals in dust deposited on leaves surface (qualitative contamination) and relating it to the area of leaves (quantitative contamination). A weighed portion of precipitate was placed to the polypropylene test tubes DigiTUBEs (SCP Science) with a capacity of 50 cm3, 15 cm3 of HNO3 65% was poured into them. Test tubes were kept at a temperature of 95 °C for 3–4 h. After cooling, 0.5 mL of hydrogen peroxide was added, then it was heated again at a temperature of 95 °C for one hour, after which the sample solution was cooled and brought to a volume of 50 cm3 with deionized water.
ELAN 9000 DRC-e (Perkin Elmer,, Waltham, MA USA) mass spectrometer with inductively coupled plasma (ICP MS) was used for the solution analysis. Multi-element ICP-MS Calibration STD—№ 1 (Perkin Elmer, Waltham, MA, USA), IV-STOK-21, IV-STOK-29, IV-STOK-28, and IV-STOK-26 (Inorganic Ventures, Christiansburg, VA, USA) were used for ICP MS tuning and calibration. The accuracy of the calibration characteristic was assessed with CRM-SOIL-A and CWW-TM standard samples.

2.6. Microbiological Analysis

The number of colony-forming units (CFU) and the diversity of culturable microfungi were determined on a wort-agar nutrient medium with an addition of lactic acid (4 mL/L) and Sabouraud dextrose agar [59]. The incubation temperatures were +27 and +37 ° C (to isolate opportunistic fungi that can grow at human body temperature) for 7–14 days. Microscopic fungi were identified by cultural and morphological characters (Olympus CX41 microscope) using standard keys [60,61,62]. For strains isolated as sterile mycelium, identification was carried out based on the analysis of the region of ribosomal genes ITS1-5.8S-ITS2 rDNA. Sequencing of DNA regions was performed using a BigDye Terminator V. 3.1 Cycle Sequencing Kit (Applied Biosystems, Waltham, MA, USA) with subsequent analysis of the reaction products on an Applied Biosystems 3130l Genetic Analyzer sequencer at the Syntol Research and Production Center (Moscow). The species name and taxonomy were checked using the CABI Bioscience Databases [63].
The isolated species of microscopic fungi were classified as opportunistic according to the classification of de Hoog et al. [64]. Opportunistic fungi were divided into three groups, in accordance with their potential danger to human health: BSL1, BSL2, and BSL3 as the degree of pathogenicity increases.

2.7. Statistical Analysis

Statistical analysis and visualization of experimental data were carried out in the R 4.0.3 software package (R Core Team, Vienna, Austria) and in the Microsoft Office Excel software. The significance of differences in experimental data between the studied options (independent groups) was assessed using the Student’s t-test with unequal sample variances and the Welch two-sample t-test with equal sample variances. In case of an abnormal distribution of the sample, determined using the Shapiro–Wilk normality test, the samples as a whole were compared using the Wilcoxon–Mann–Whitney test. The reliability of the influence of chemical parameters on biological ones was determined using one-way analysis of variance (ANOVA) and correlation analysis (Pearson’s correlation coefficient). The analysis of the qualitative similarity of the species composition was carried out using cluster analysis based on the presence/absence of a fungi species, implemented in a vegan package. The “nearest neighbor” method was used to construct the dendrogram. The influence of factors on the studied trait was assessed using multivariate analysis of variance. The significance level was 0.05.

3. Results

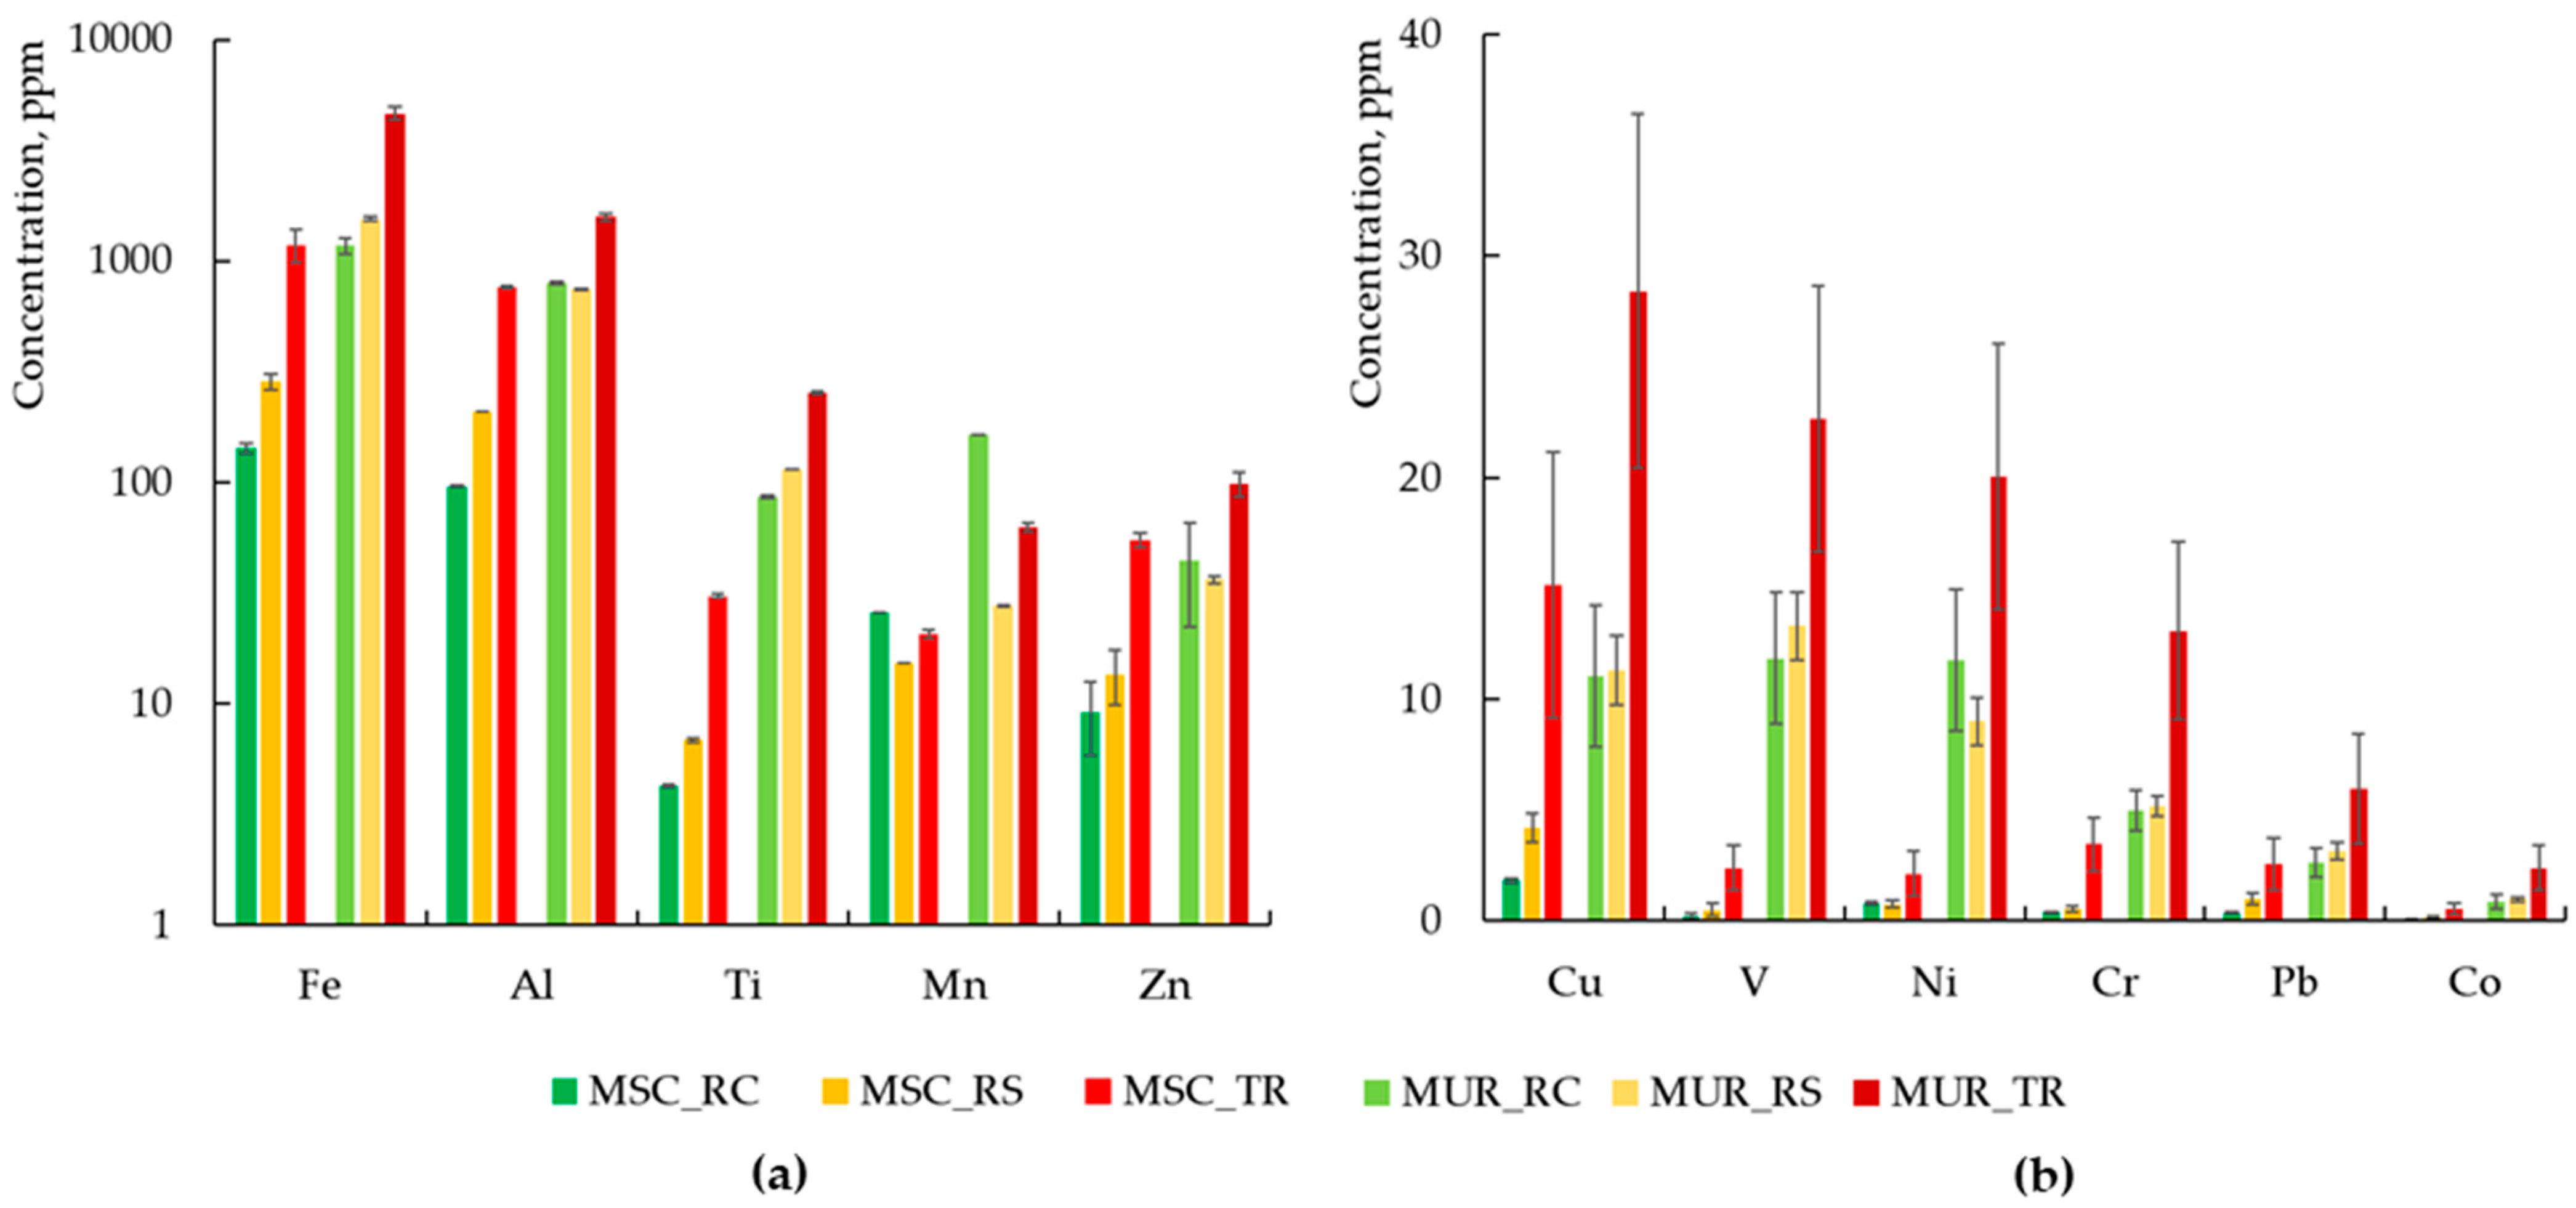
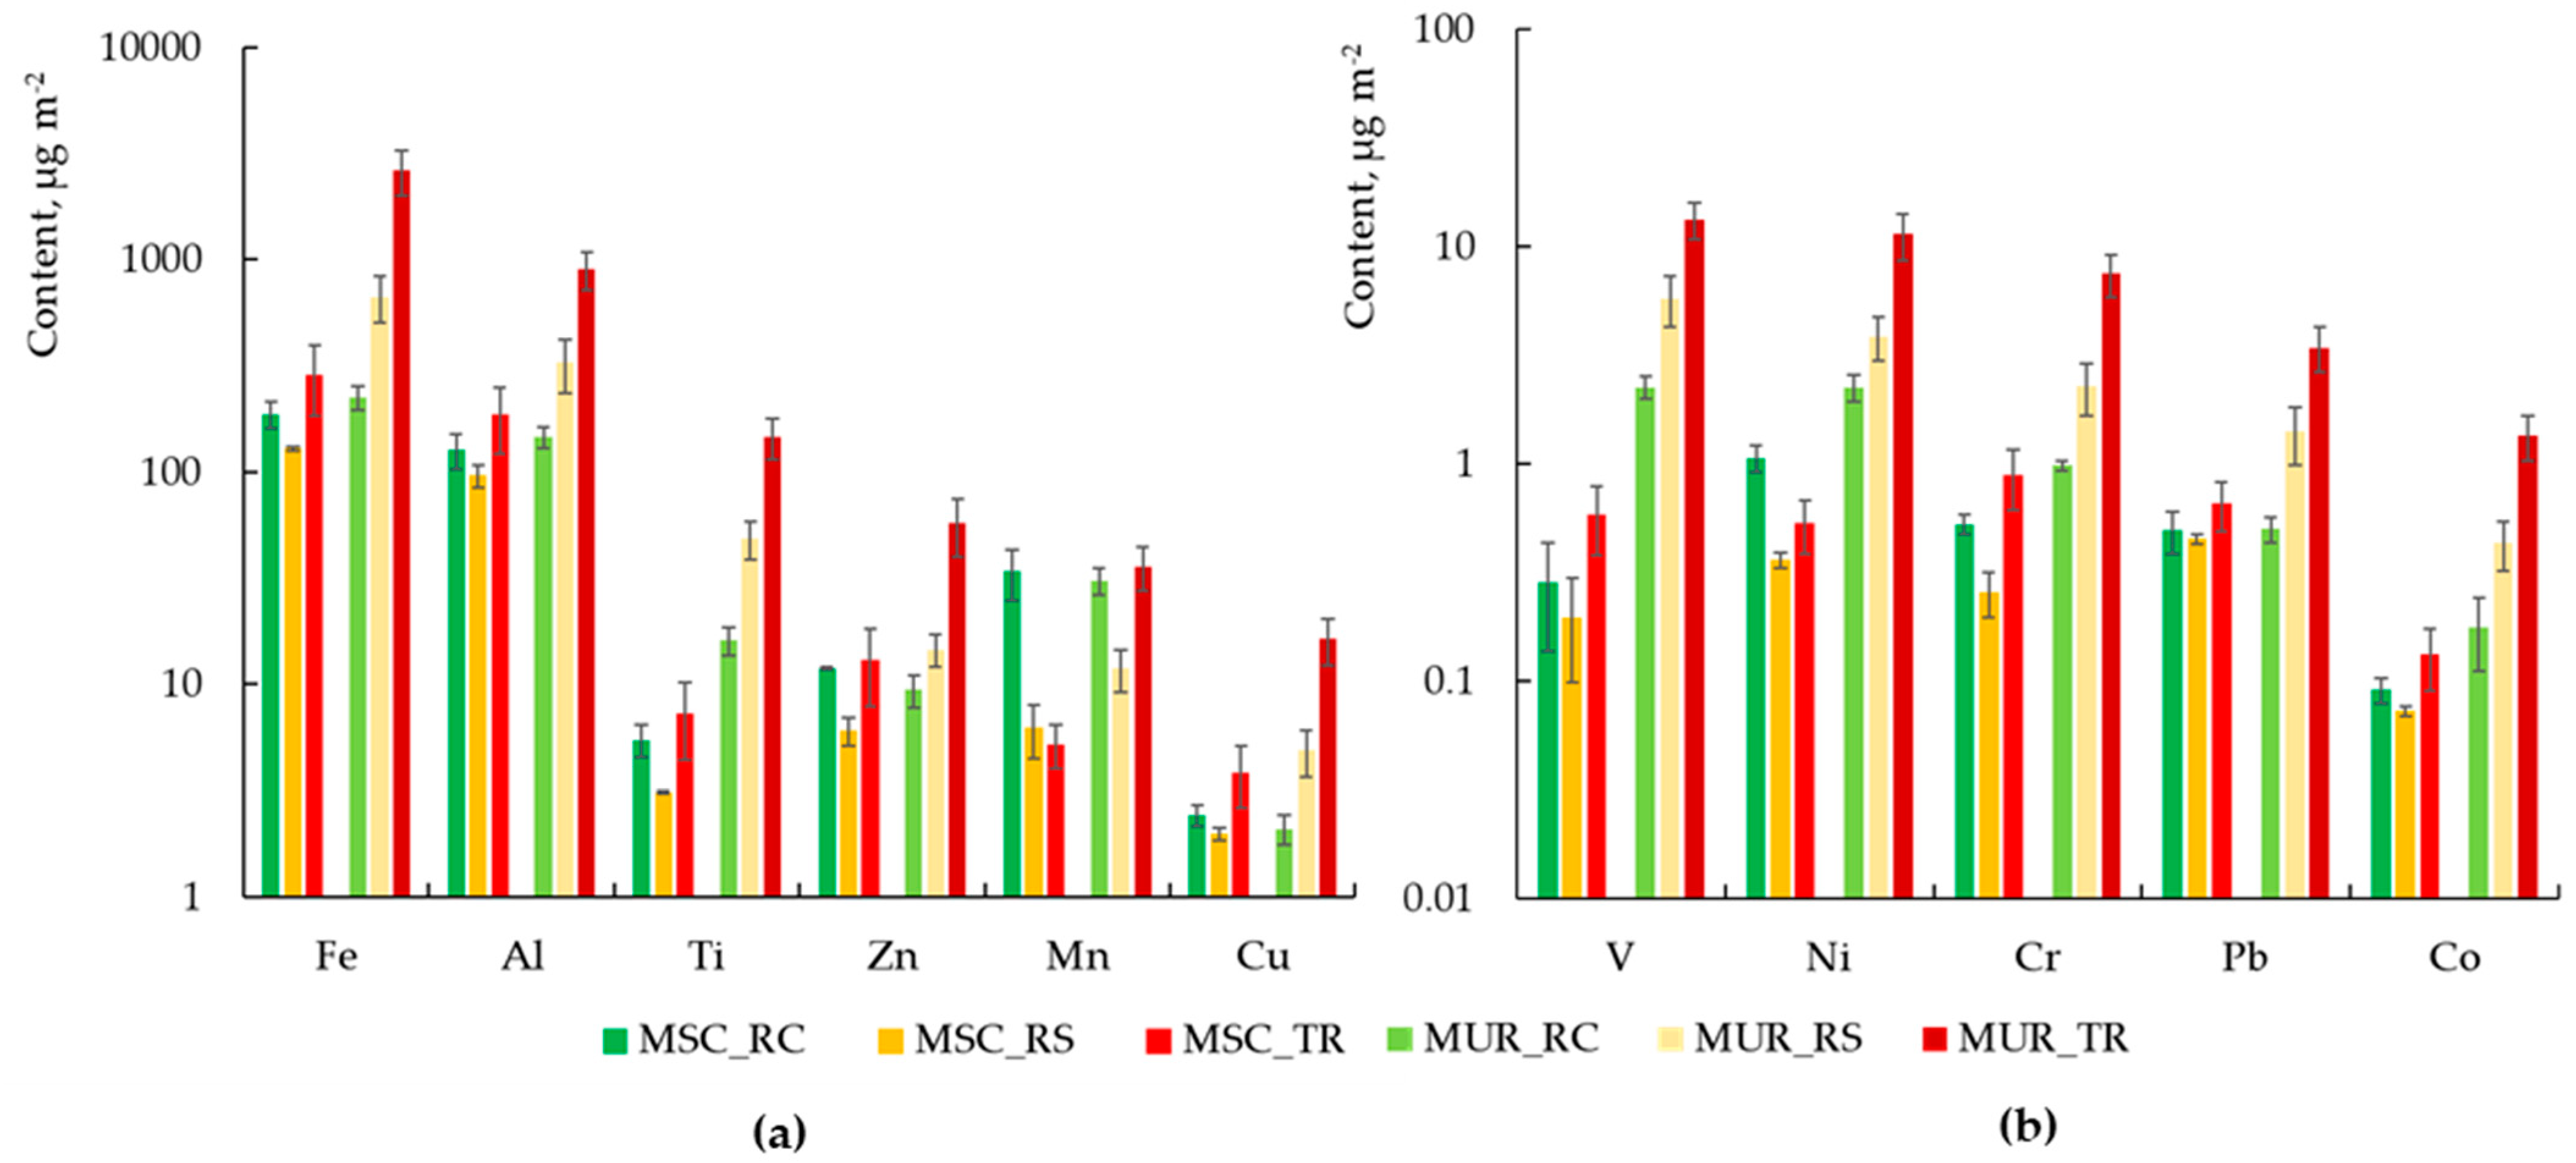
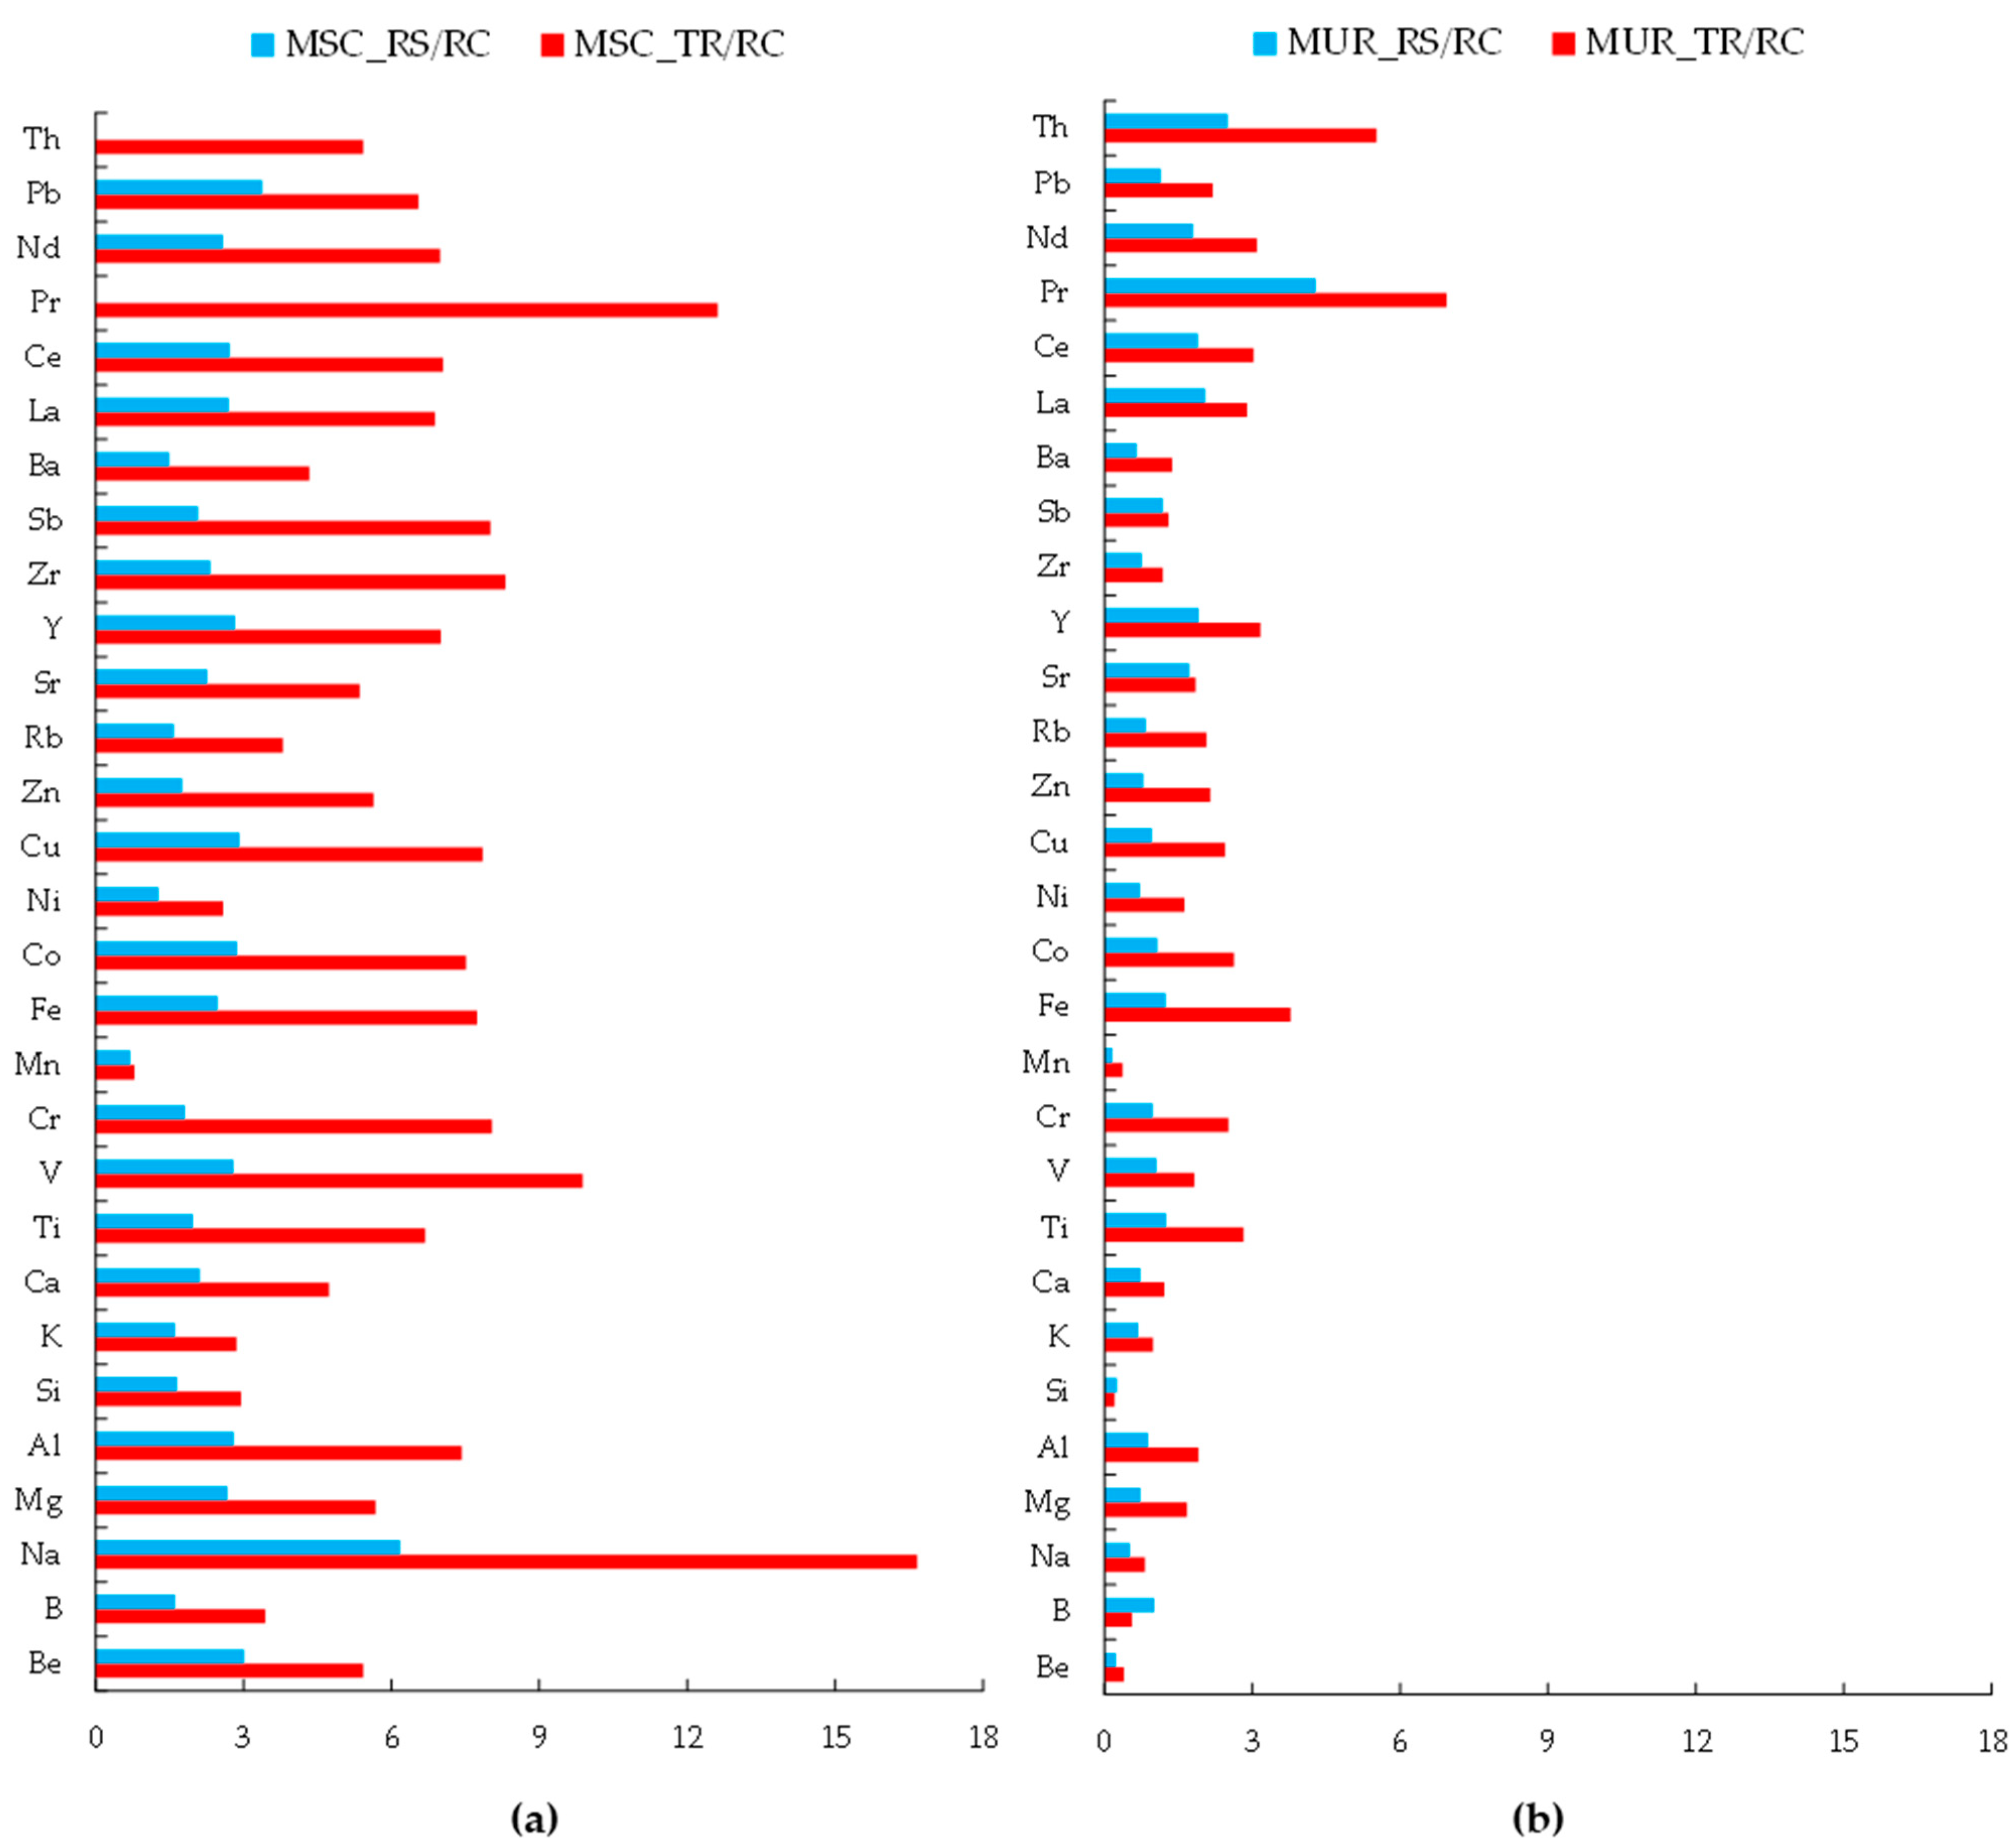
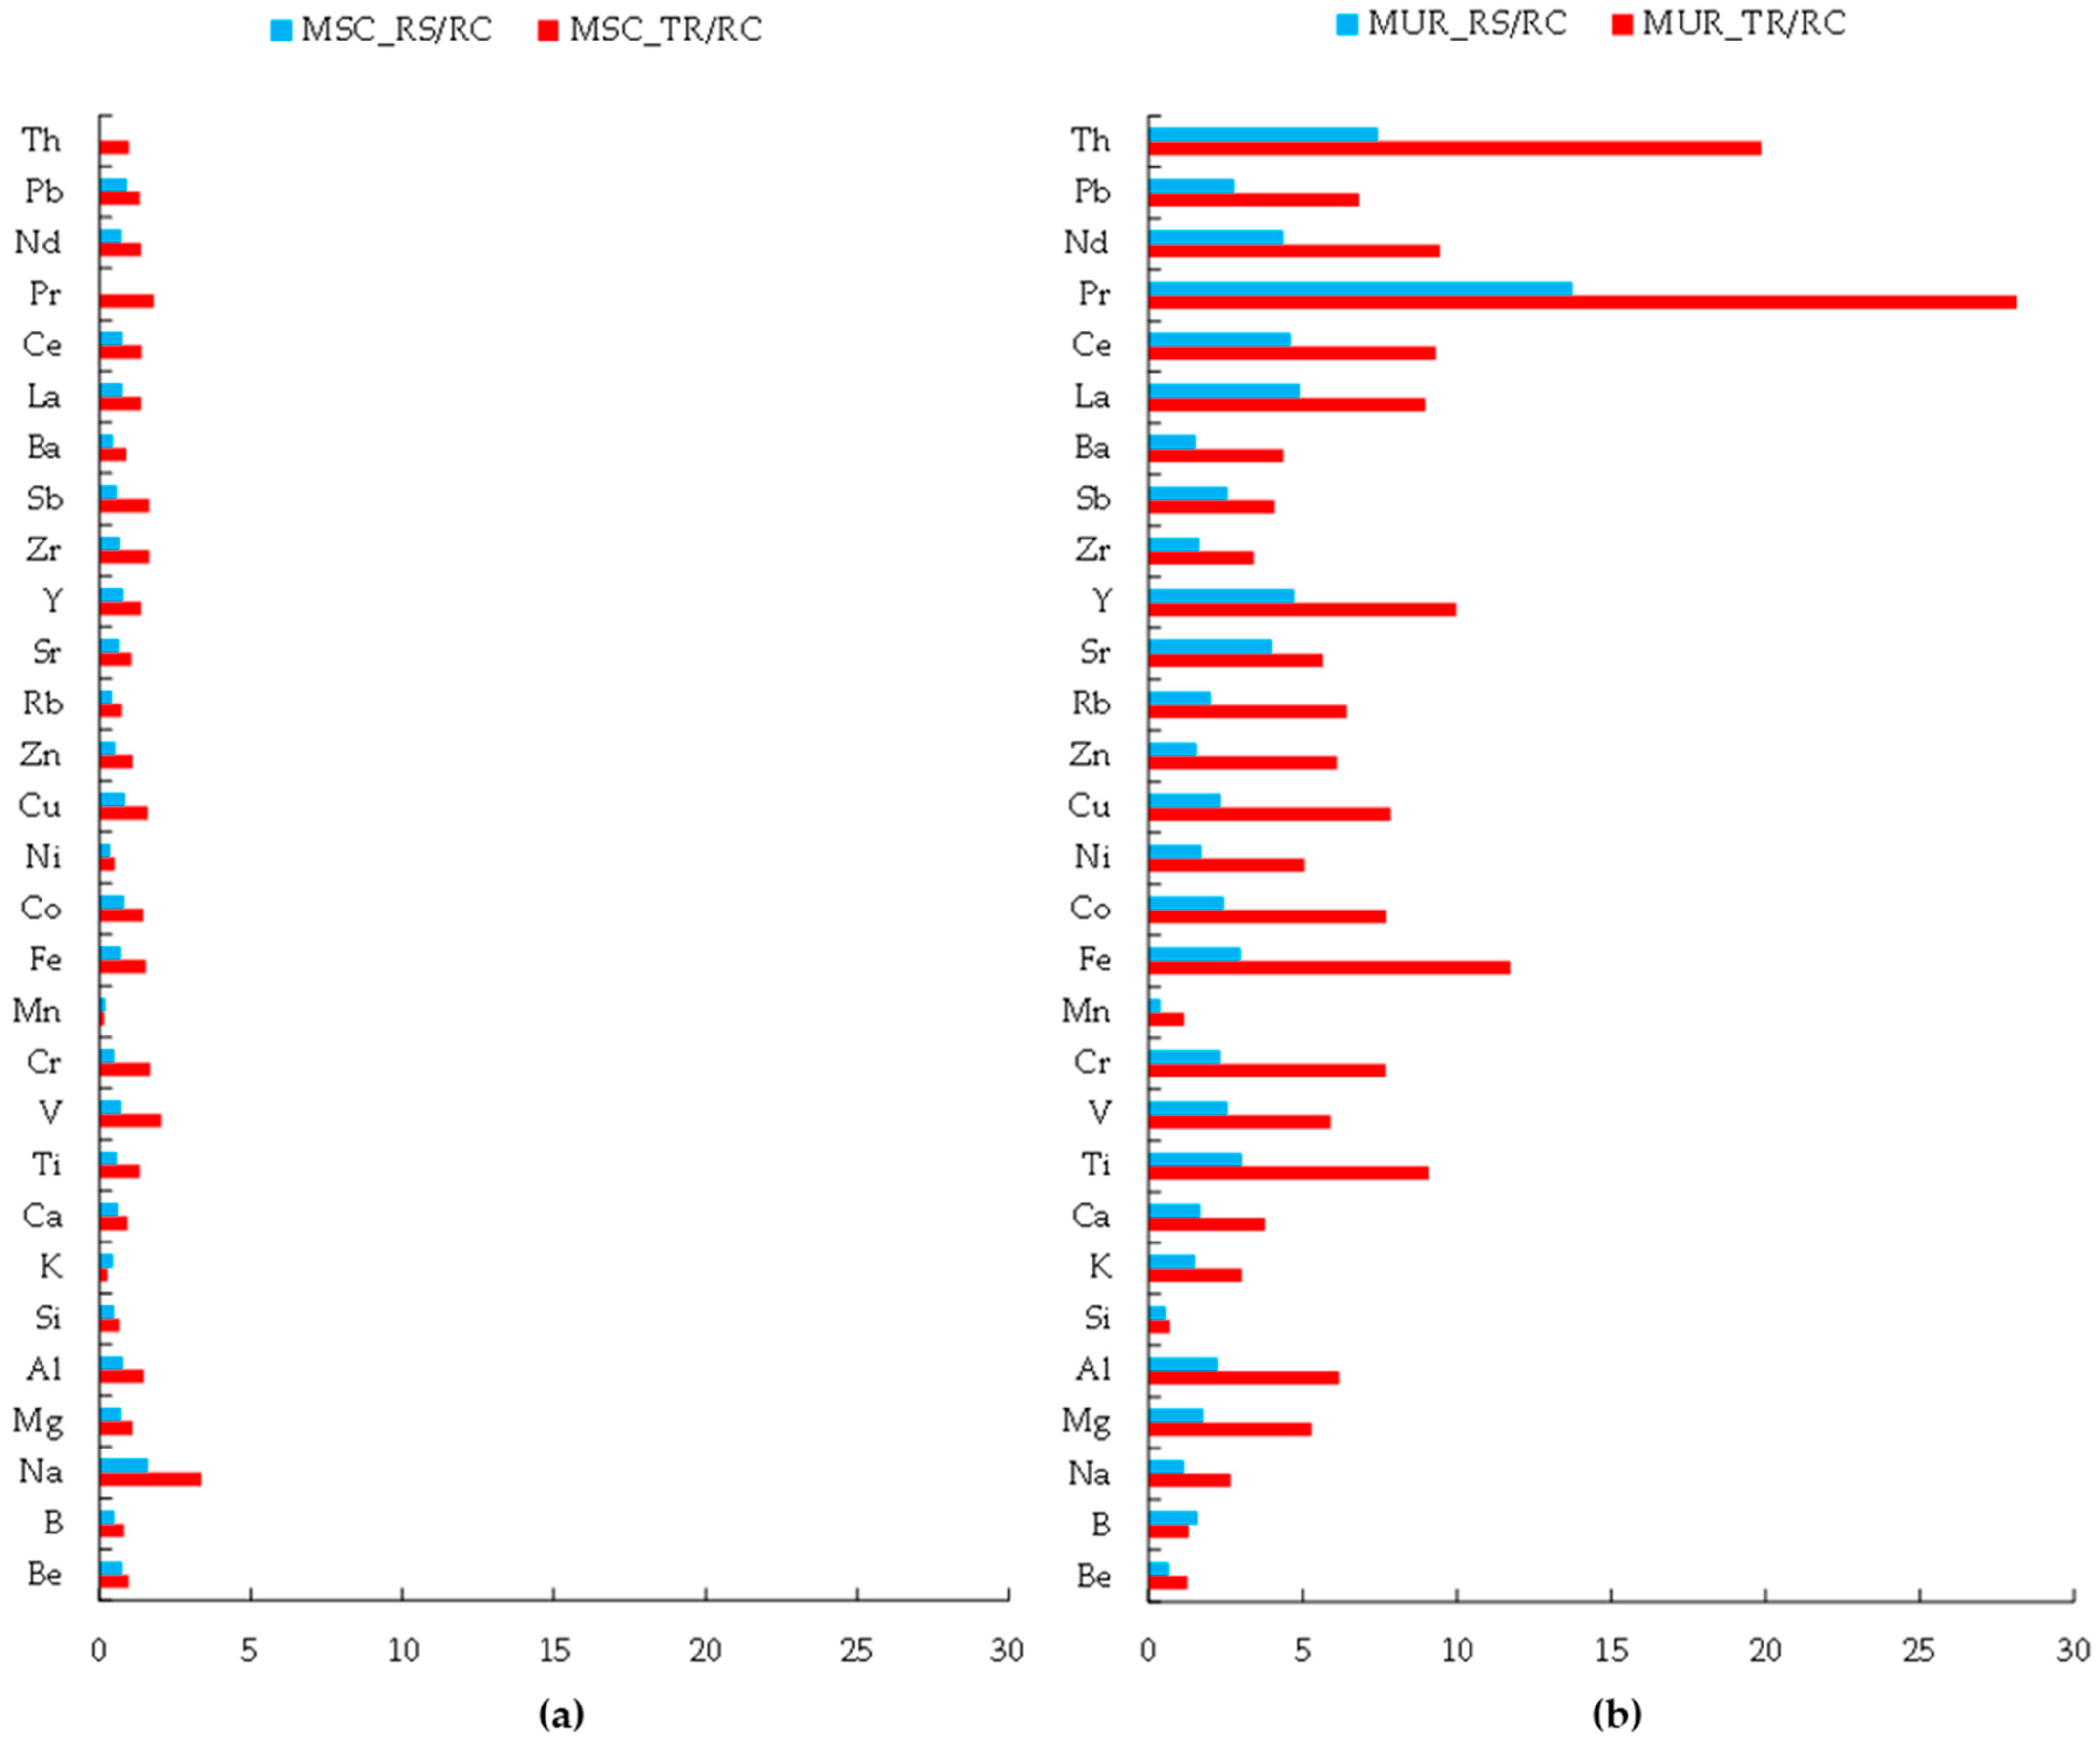
3.1. Chemical Composition of Dust in Two Cities

In general, Murmansk was characterized by a higher diversity of chemical elements in dust: on average 28 chemical elements were found in Moscow versus 34 in Murmansk, highlighting more pollutants’ sources in the last city. The contamination of the leaf surface was assessed by two indicators: qualitative contamination (concentration of chemical elements in ppm) and quantitative contamination (content of chemical elements in mg/m2 of leaf surface).
  • Qualitative Contamination
The coefficient of variation (CV, n = 18) for studied elements varied in the range of 1.01–1.57 for PTE (potentially toxic elements, V, Cr, Mn, Fe, Co, Ni, Cu, Zn, Mo, Cd, Pb), and 0.67–2.45 for REE (rare earth elements, La, Ce, Pr, Nd, Sm, Eu, Gd, Dy). Concentrations of the most of PTE in dust washed out from leaves varied between three functional zones in Moscow in the row RC < RS < TR (Figure 2). In Murmansk, the differences between residential and recreational zones were less pronounced, while traffic zone was characterized by highest concentrations among all analyzed locations in both cities. Despite the remoteness from the center, the investigated recreational zone in Murmansk was more susceptible to the anthropogenic influence of air pollution sources than in Moscow. Thus, the median excess of PTE content in leaves in Murmansk relative to Moscow was 3.8, 5.4, and 8.2, for traffic, residential, and recreational zones, respectively.
The content of PTE in the leaves’ dust in Moscow in the traffic and residential zones differed from the recreational zone content compared to Murmansk (Figure 3a). In Moscow, the median value of the ratio between the content for elements showed in Figure 3 for the traffic/recreational and residential/recreational zones was 6.7 and 2.3, respectively. For Murmansk, these ratios were much lower: just 1.9 and 1.0, suggesting more homogenic distribution of pollutants between three zones (Figure 3b).
  • Quantitative analysis
The data regarding the concentration of individual elements in leaf dust did not give a complete picture on the real level of air pollution by dust in each zone and city in particular, due to the difference in street management including dry and wet roads cleaning. At the same time, the data on the elements’ content in washes calculated per m2 of leaves surface provided information about current air pollution by PTE (Figure 4).
The content of elements also varied between functional zones and cities, and CV (n = 18) was in the range of 0.70–1.57 for PTE, and 1.29–2.45 for REE. The pollution of the leaf surface by PTE in the Murmansk traffic zone was much higher than in the Moscow one. For residential and recreational areas, this tendency persisted but was less pronounced. In Moscow, the differences between zones in qualitative contamination (Figure 2) leveled out after recalculation per leaf area (Figure 5a). The content of chemical elements per leaf area in Murmansk traffic and residential zones exceeded their content in the recreational zone 7.0 and 2.9 times, respectively. In Moscow, this excess amounted only 1.3 and 0.6 times (Figure 5). This finding indicates extremely high air pollution near roads in the Murmansk central part.
Thus, the traffic zone was the primary source of pollutants in both cities. However, a thorough cleaning of principal roads carried out in Moscow decreased the amount of resuspended dust which was deposited on leaves in traffic zone. Less dust was also transferred for a long distance from the pollution source. In Murmansk, road cleaning is carried out less frequently, leading to the dust accumulation on sealed surfaces and further spreading throughout the territory, which was confirmed by the similar chemical composition of leaves’ dust between all zones.

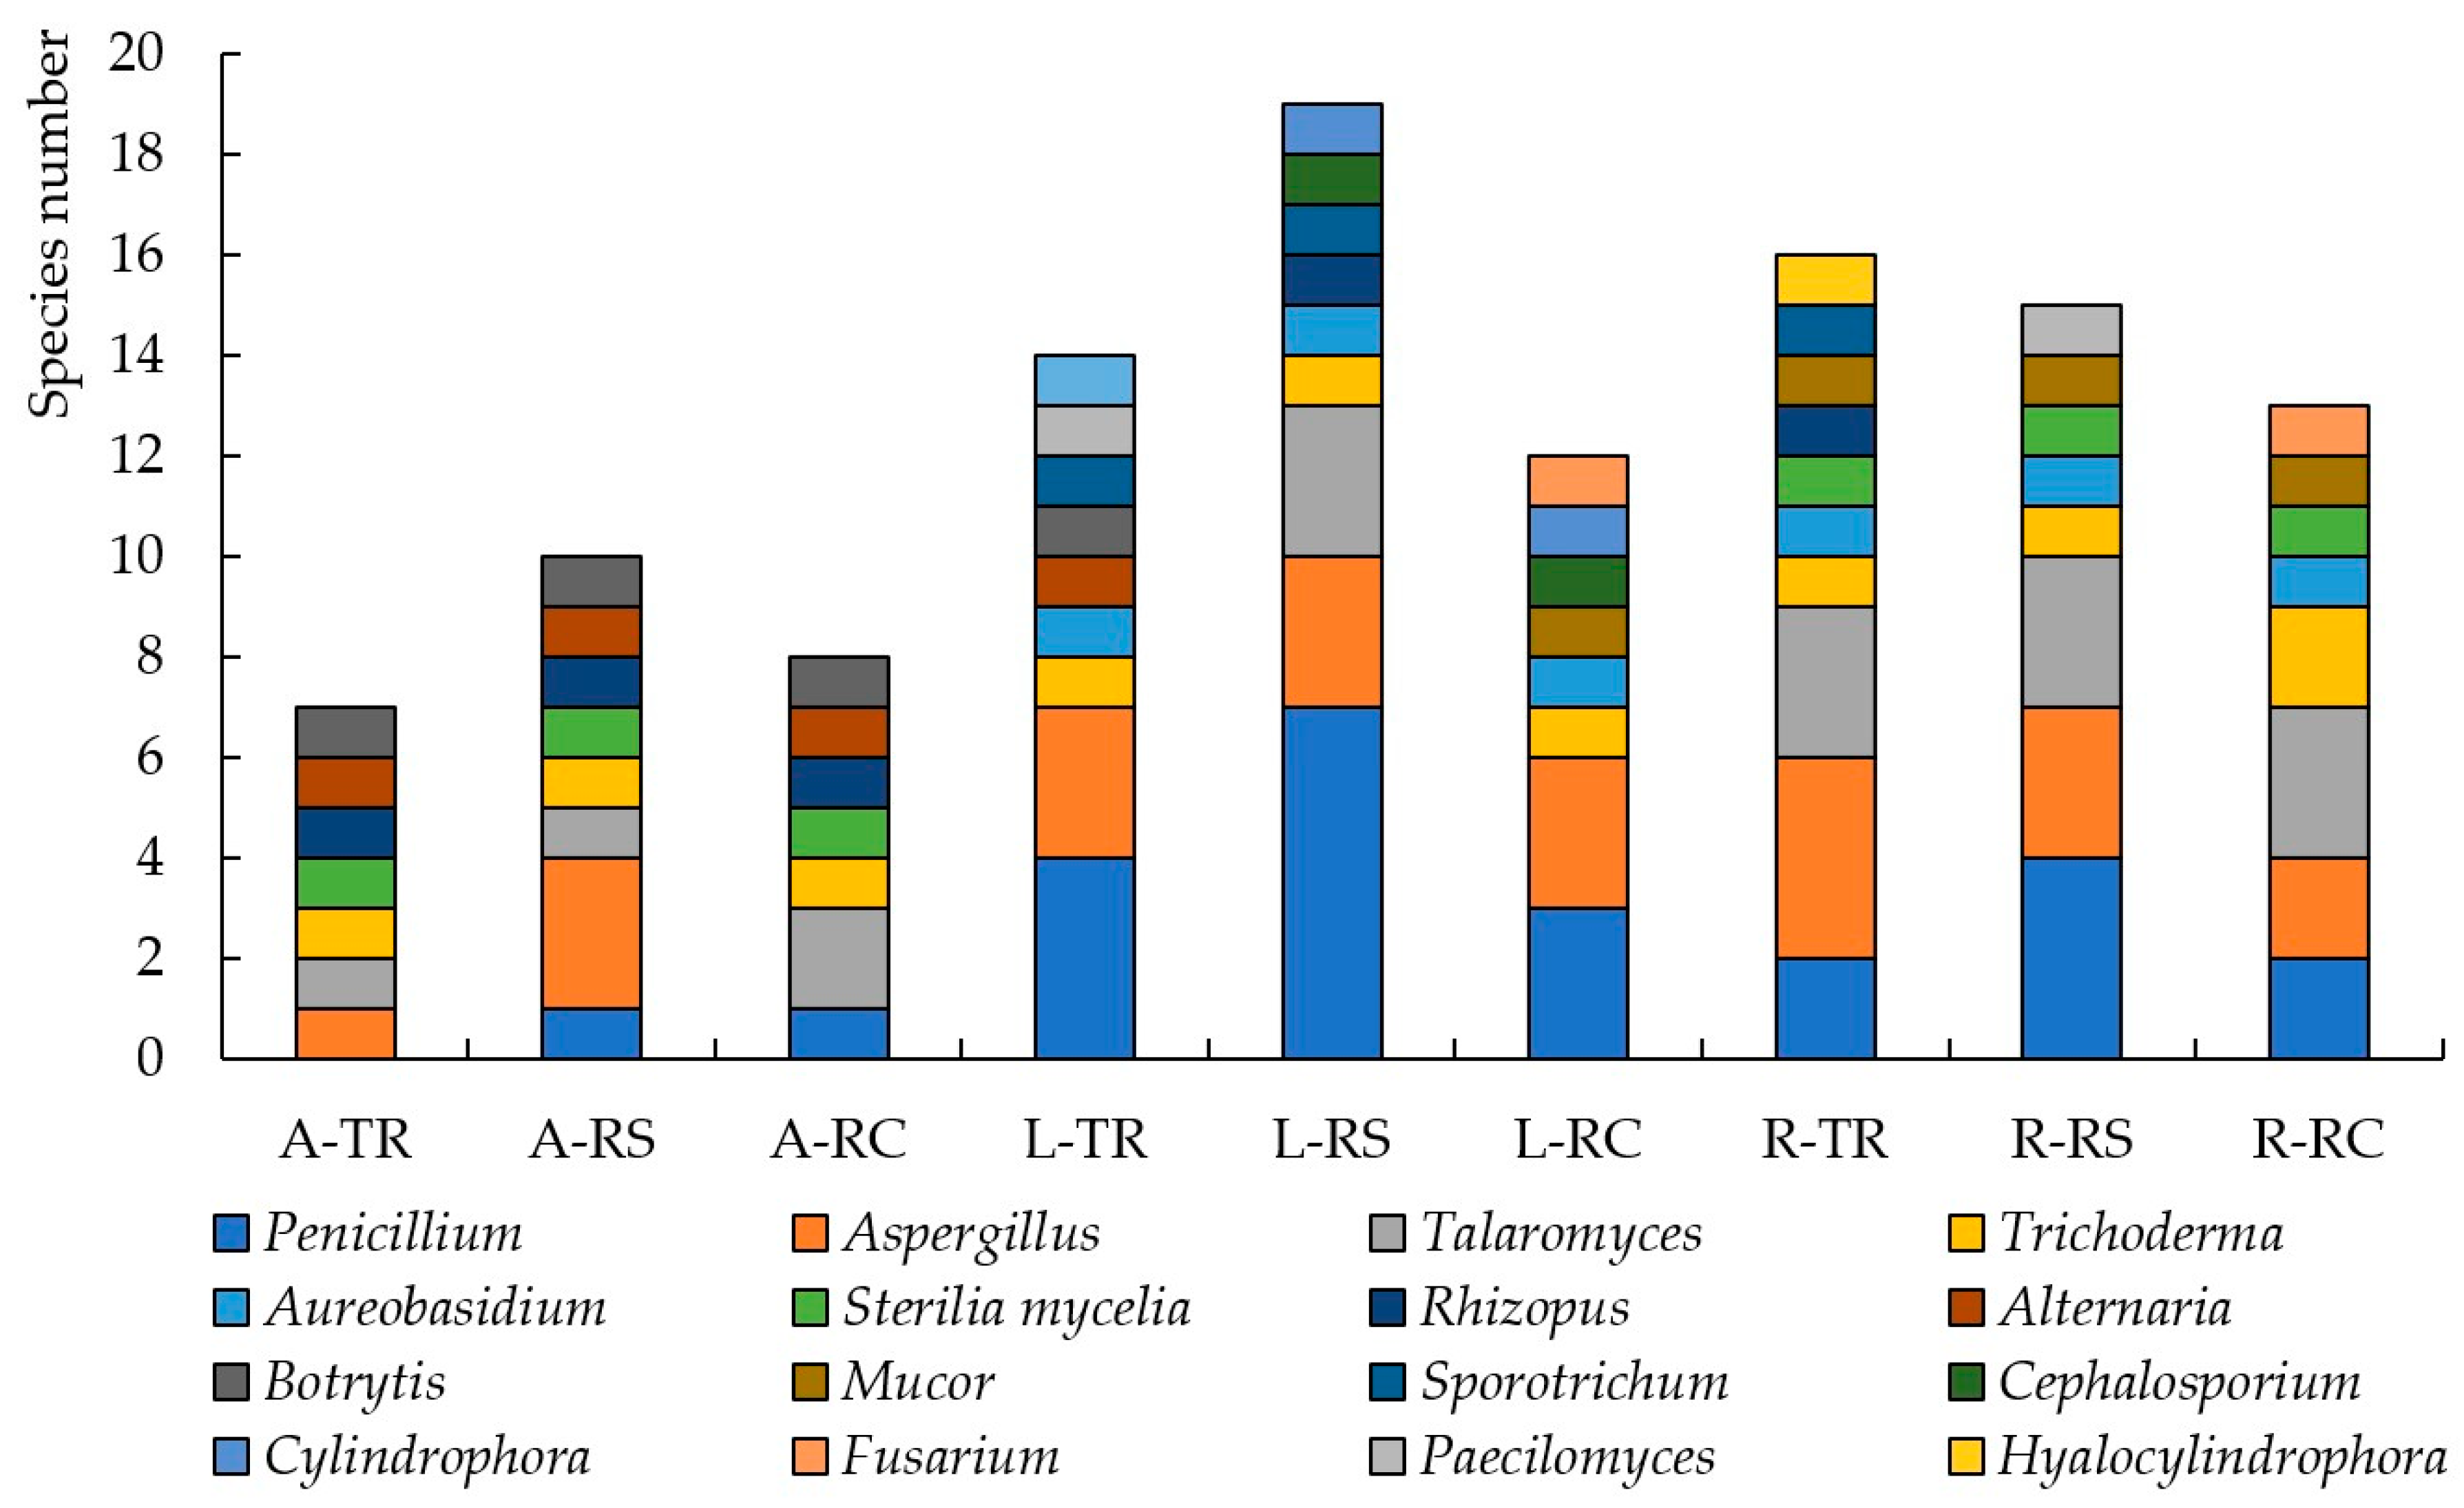
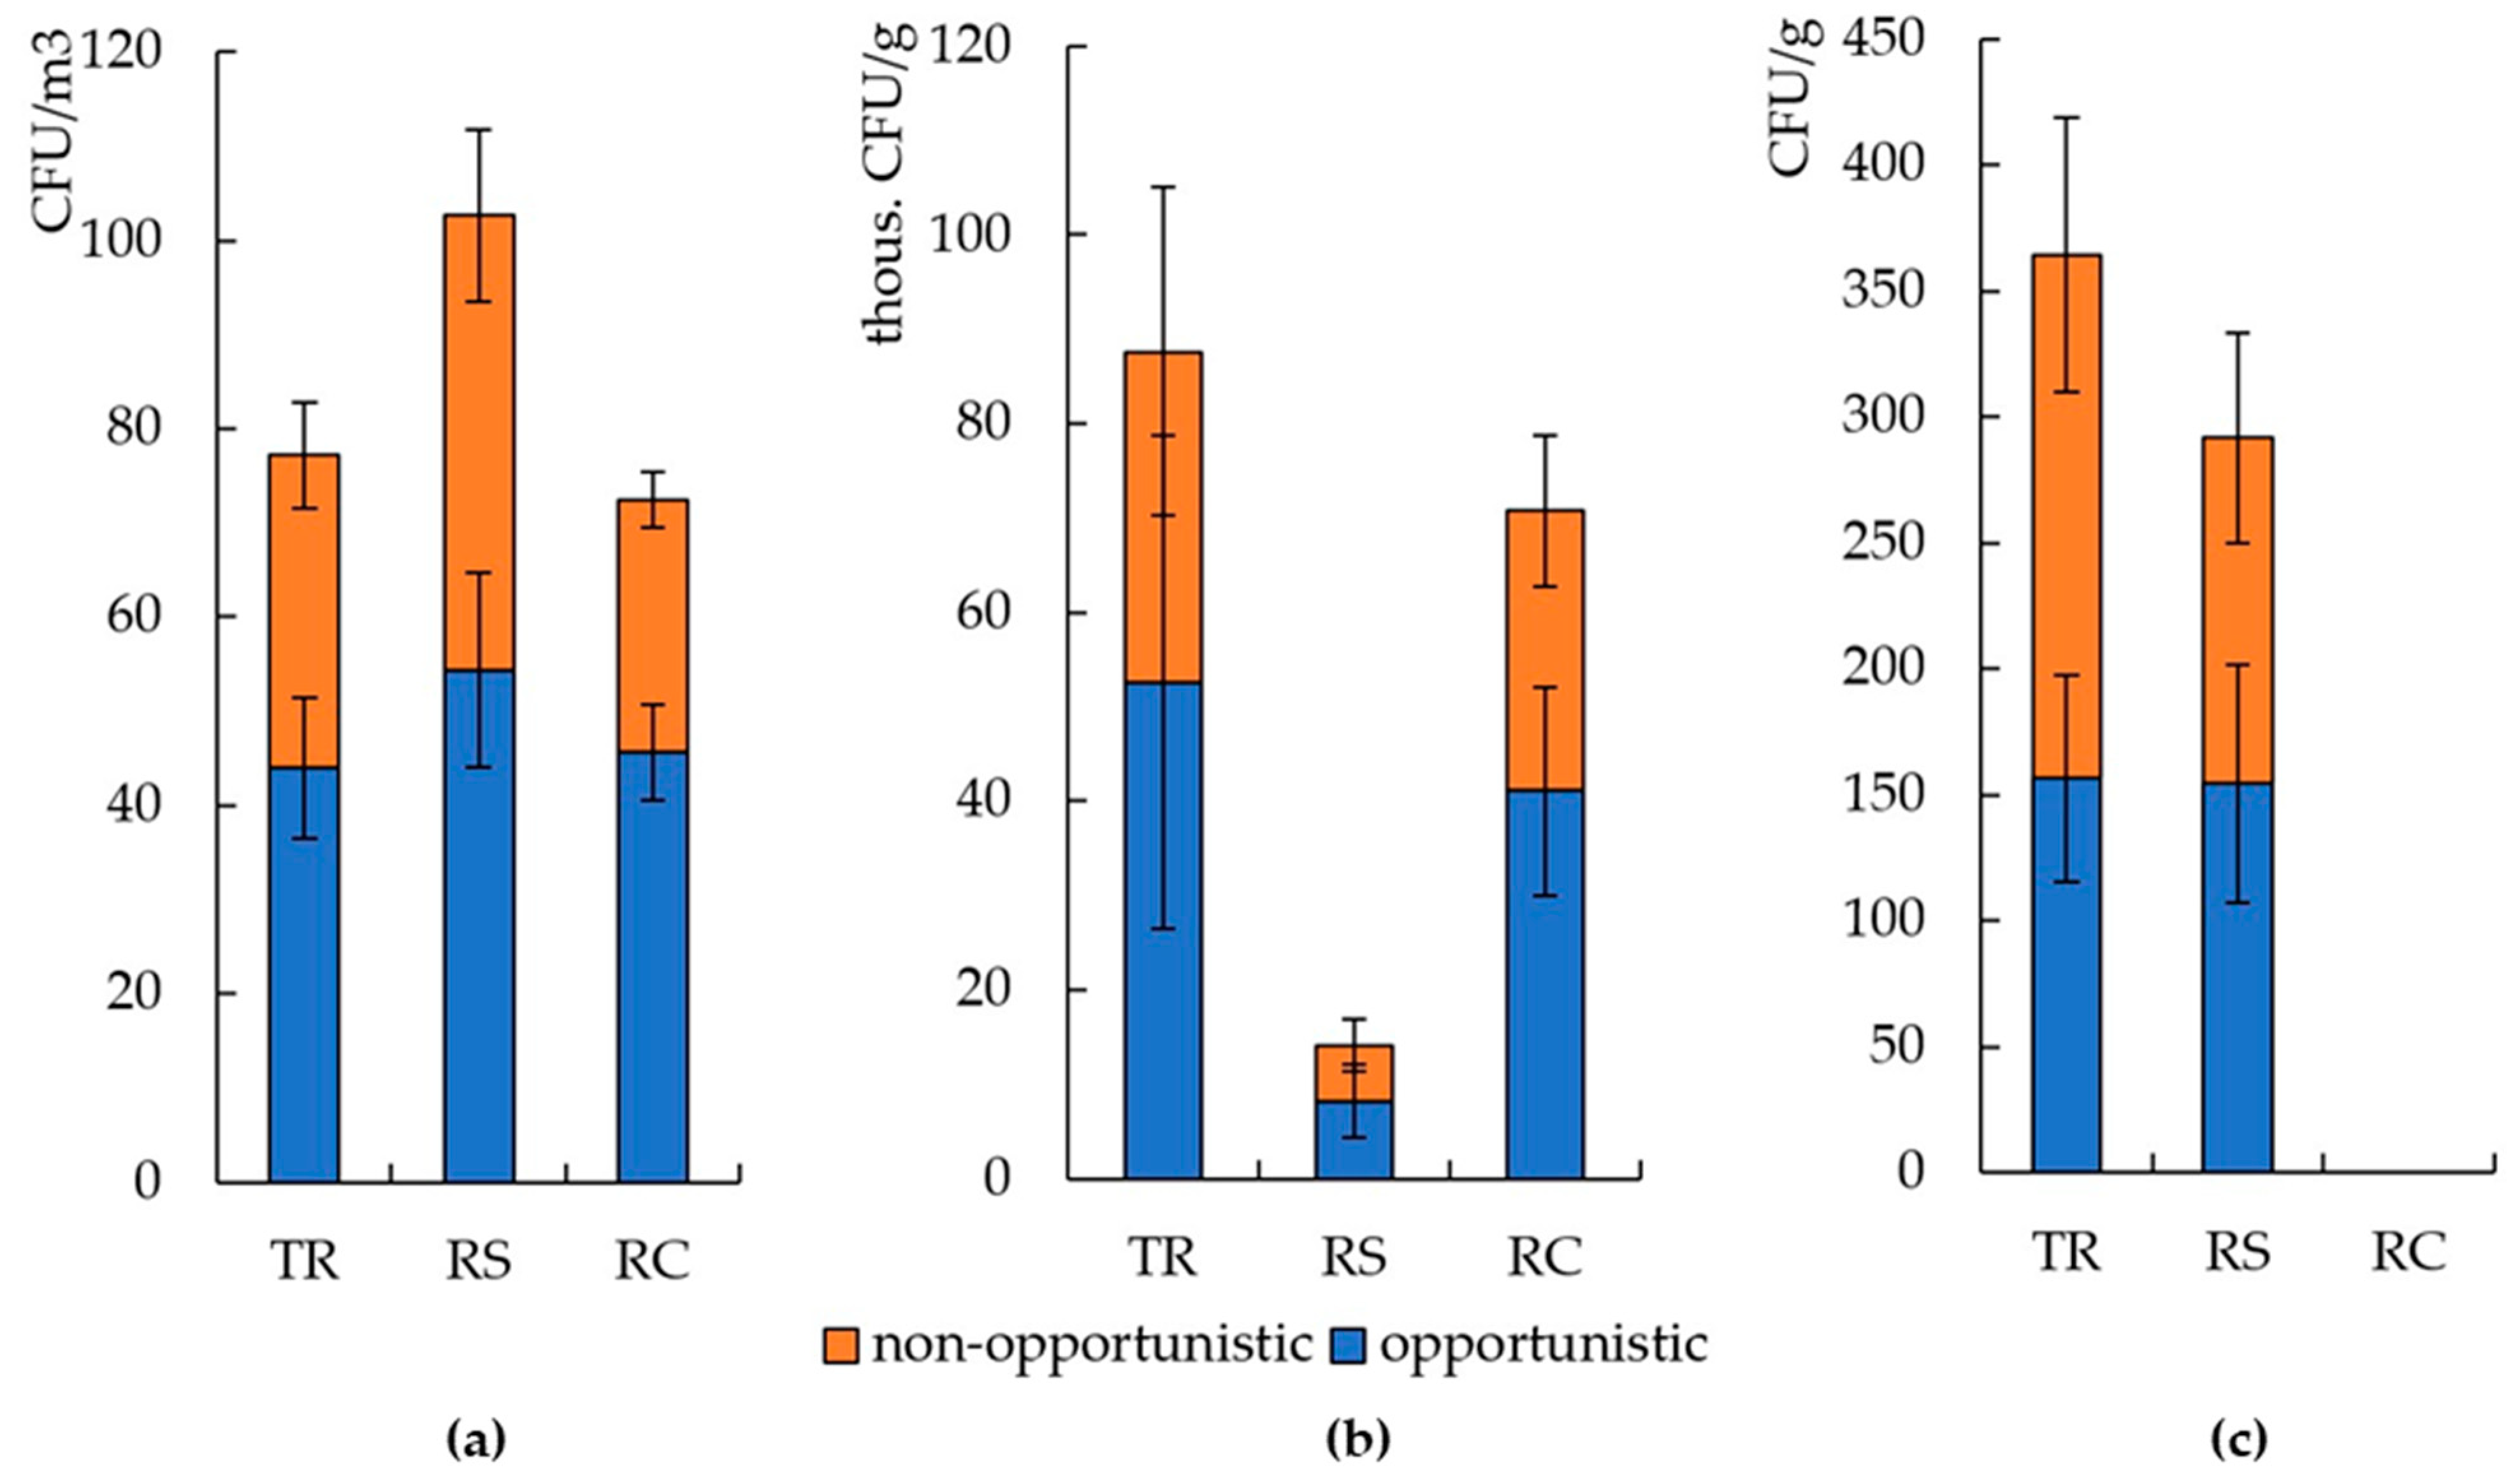
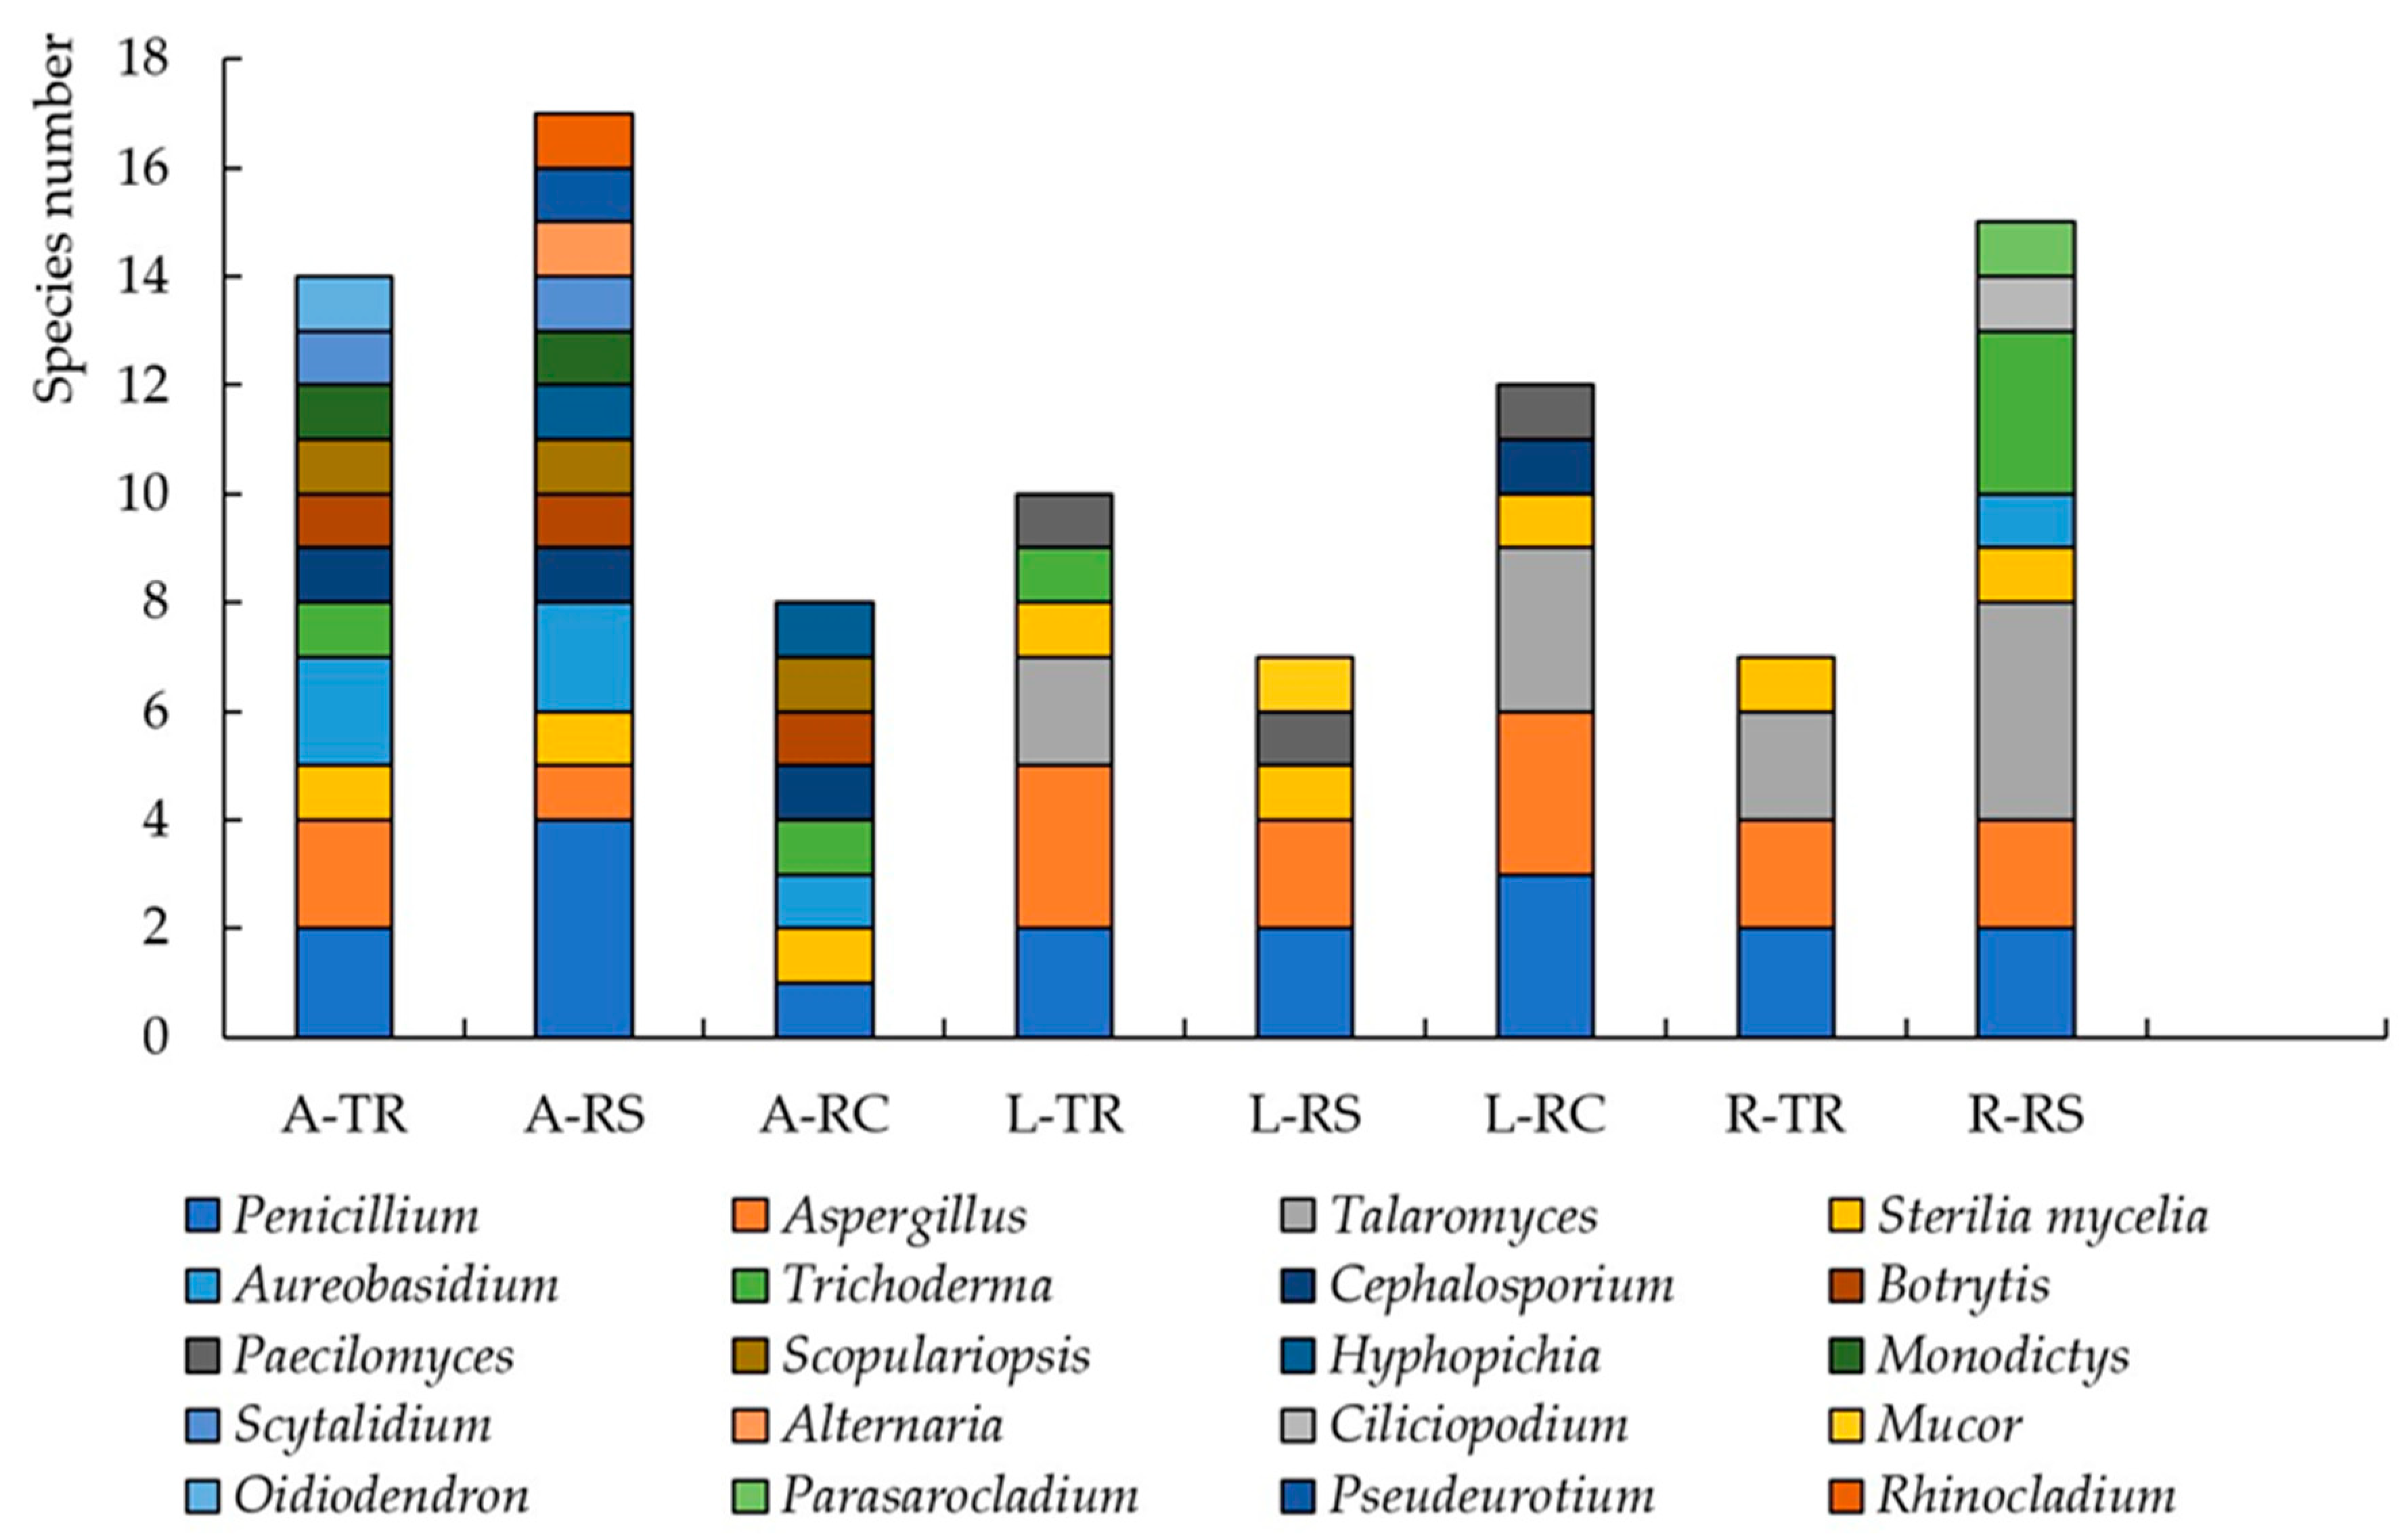
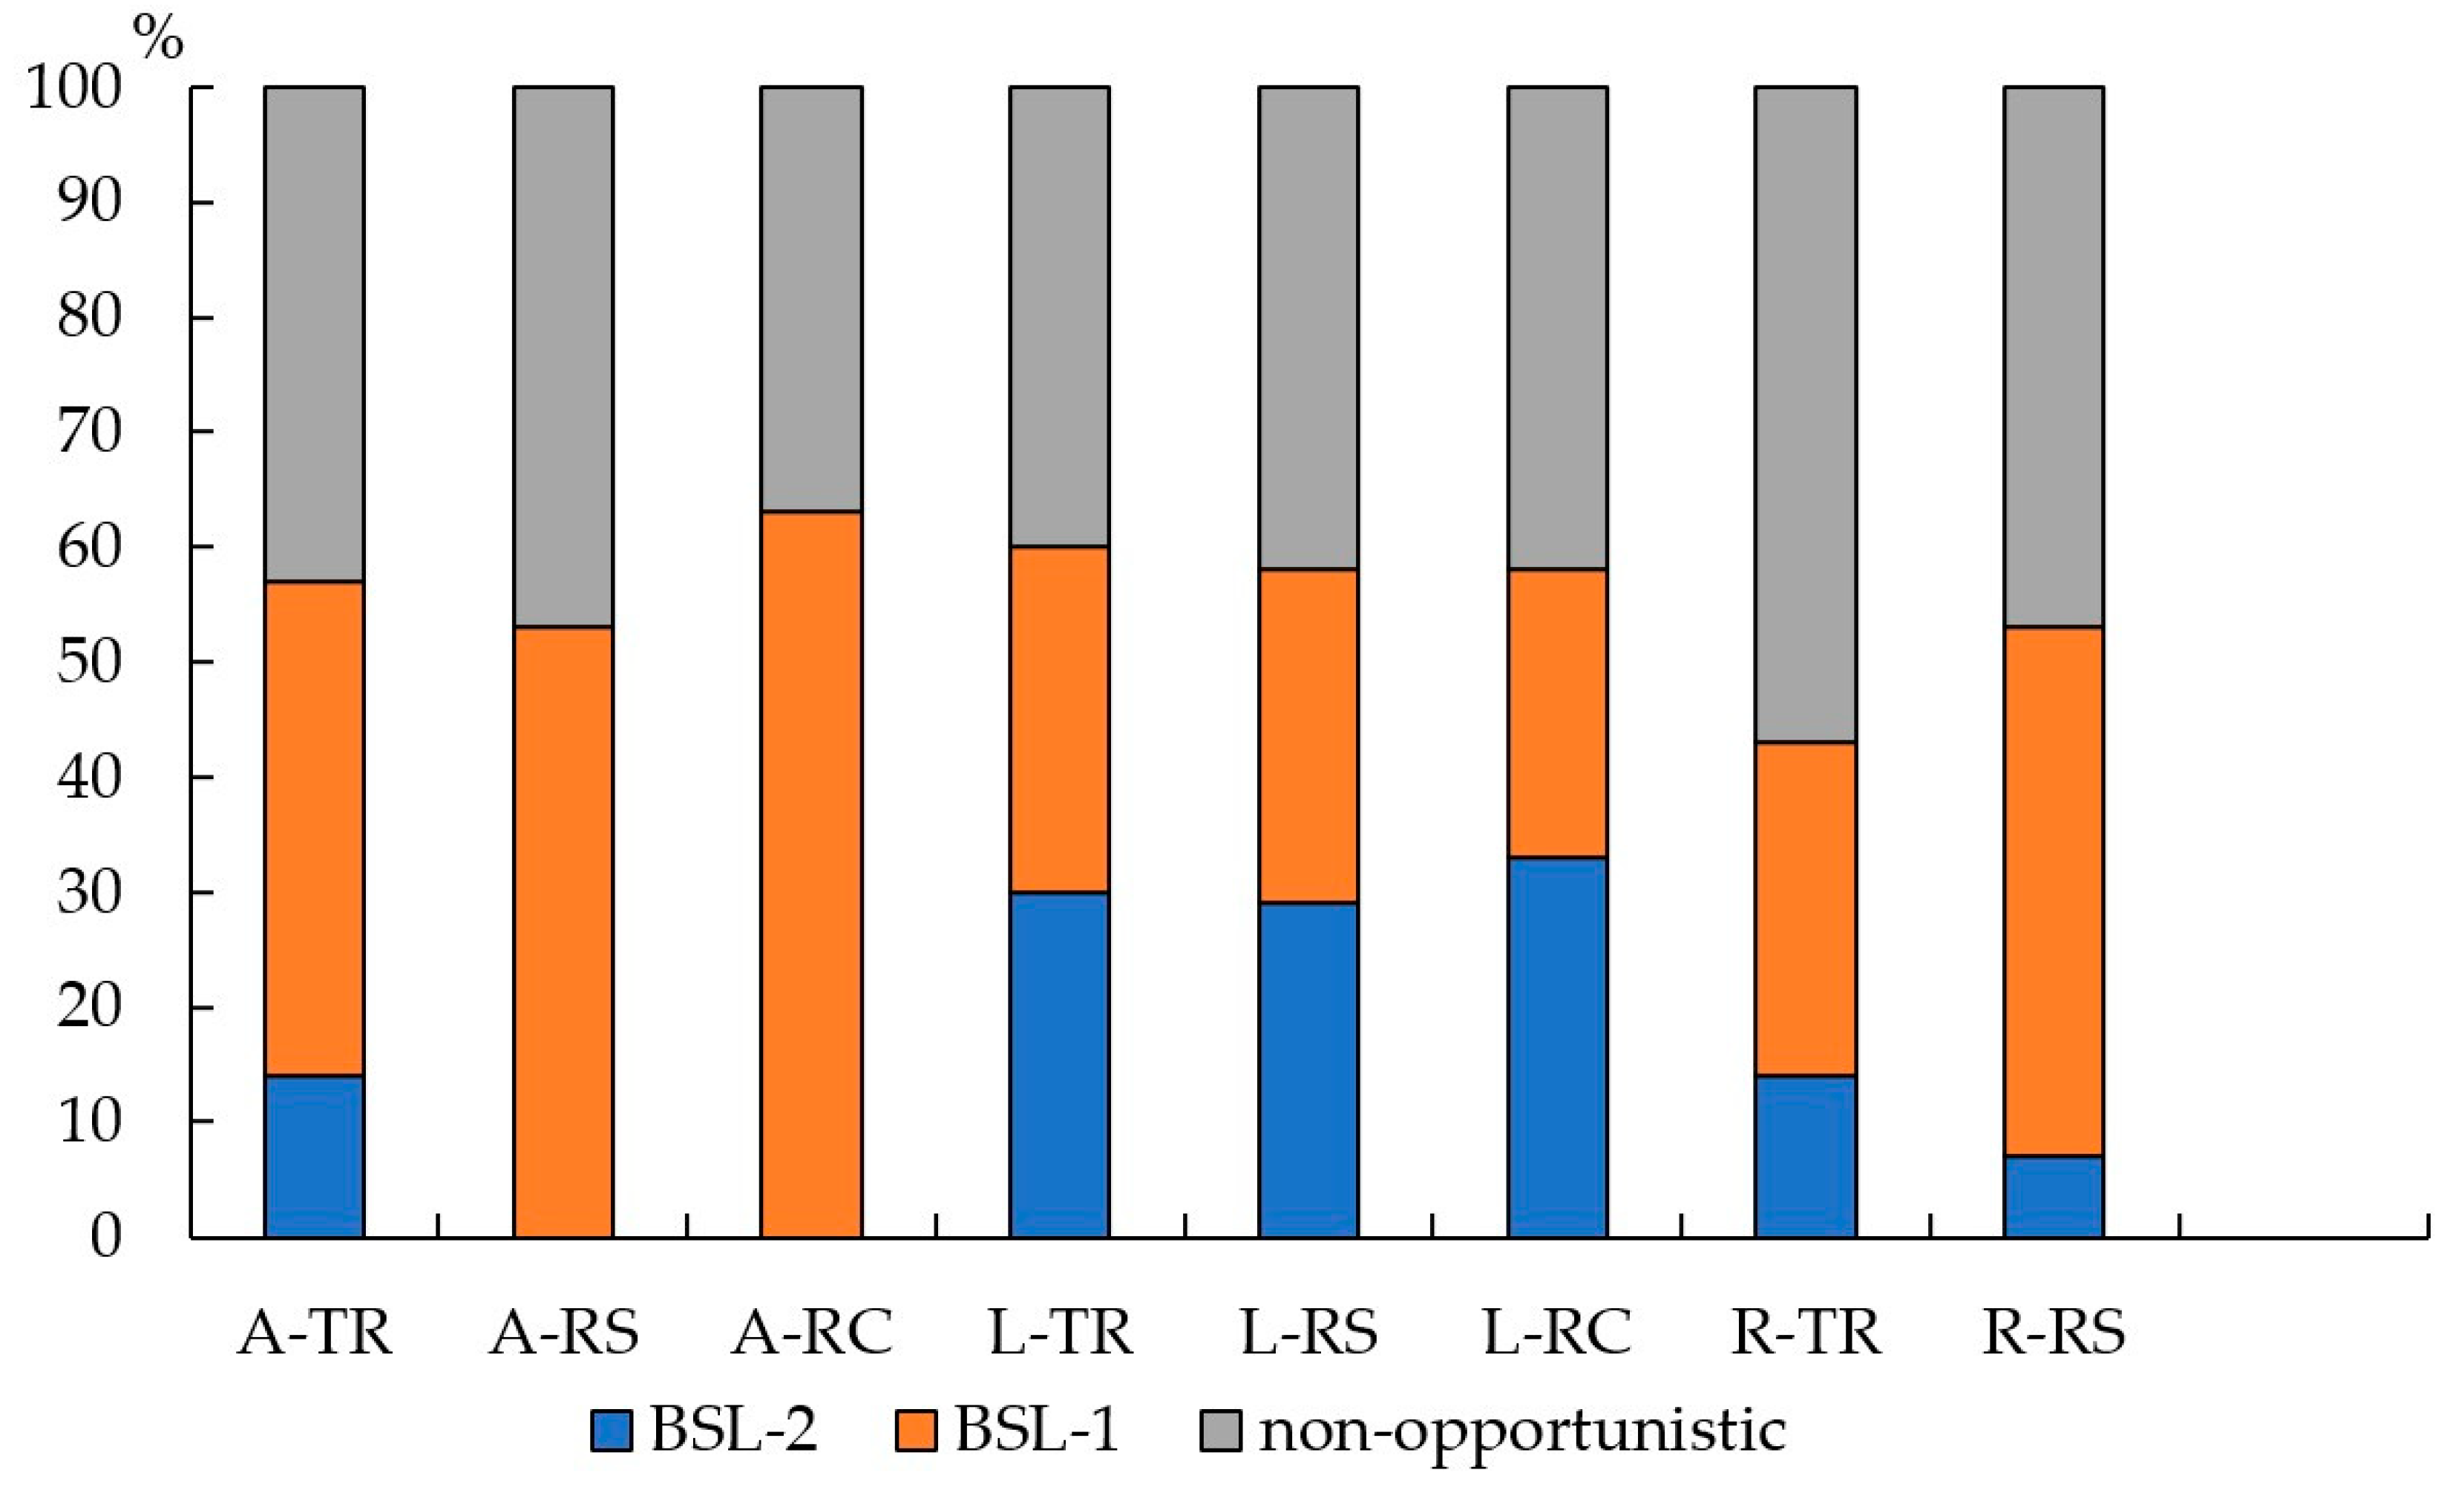
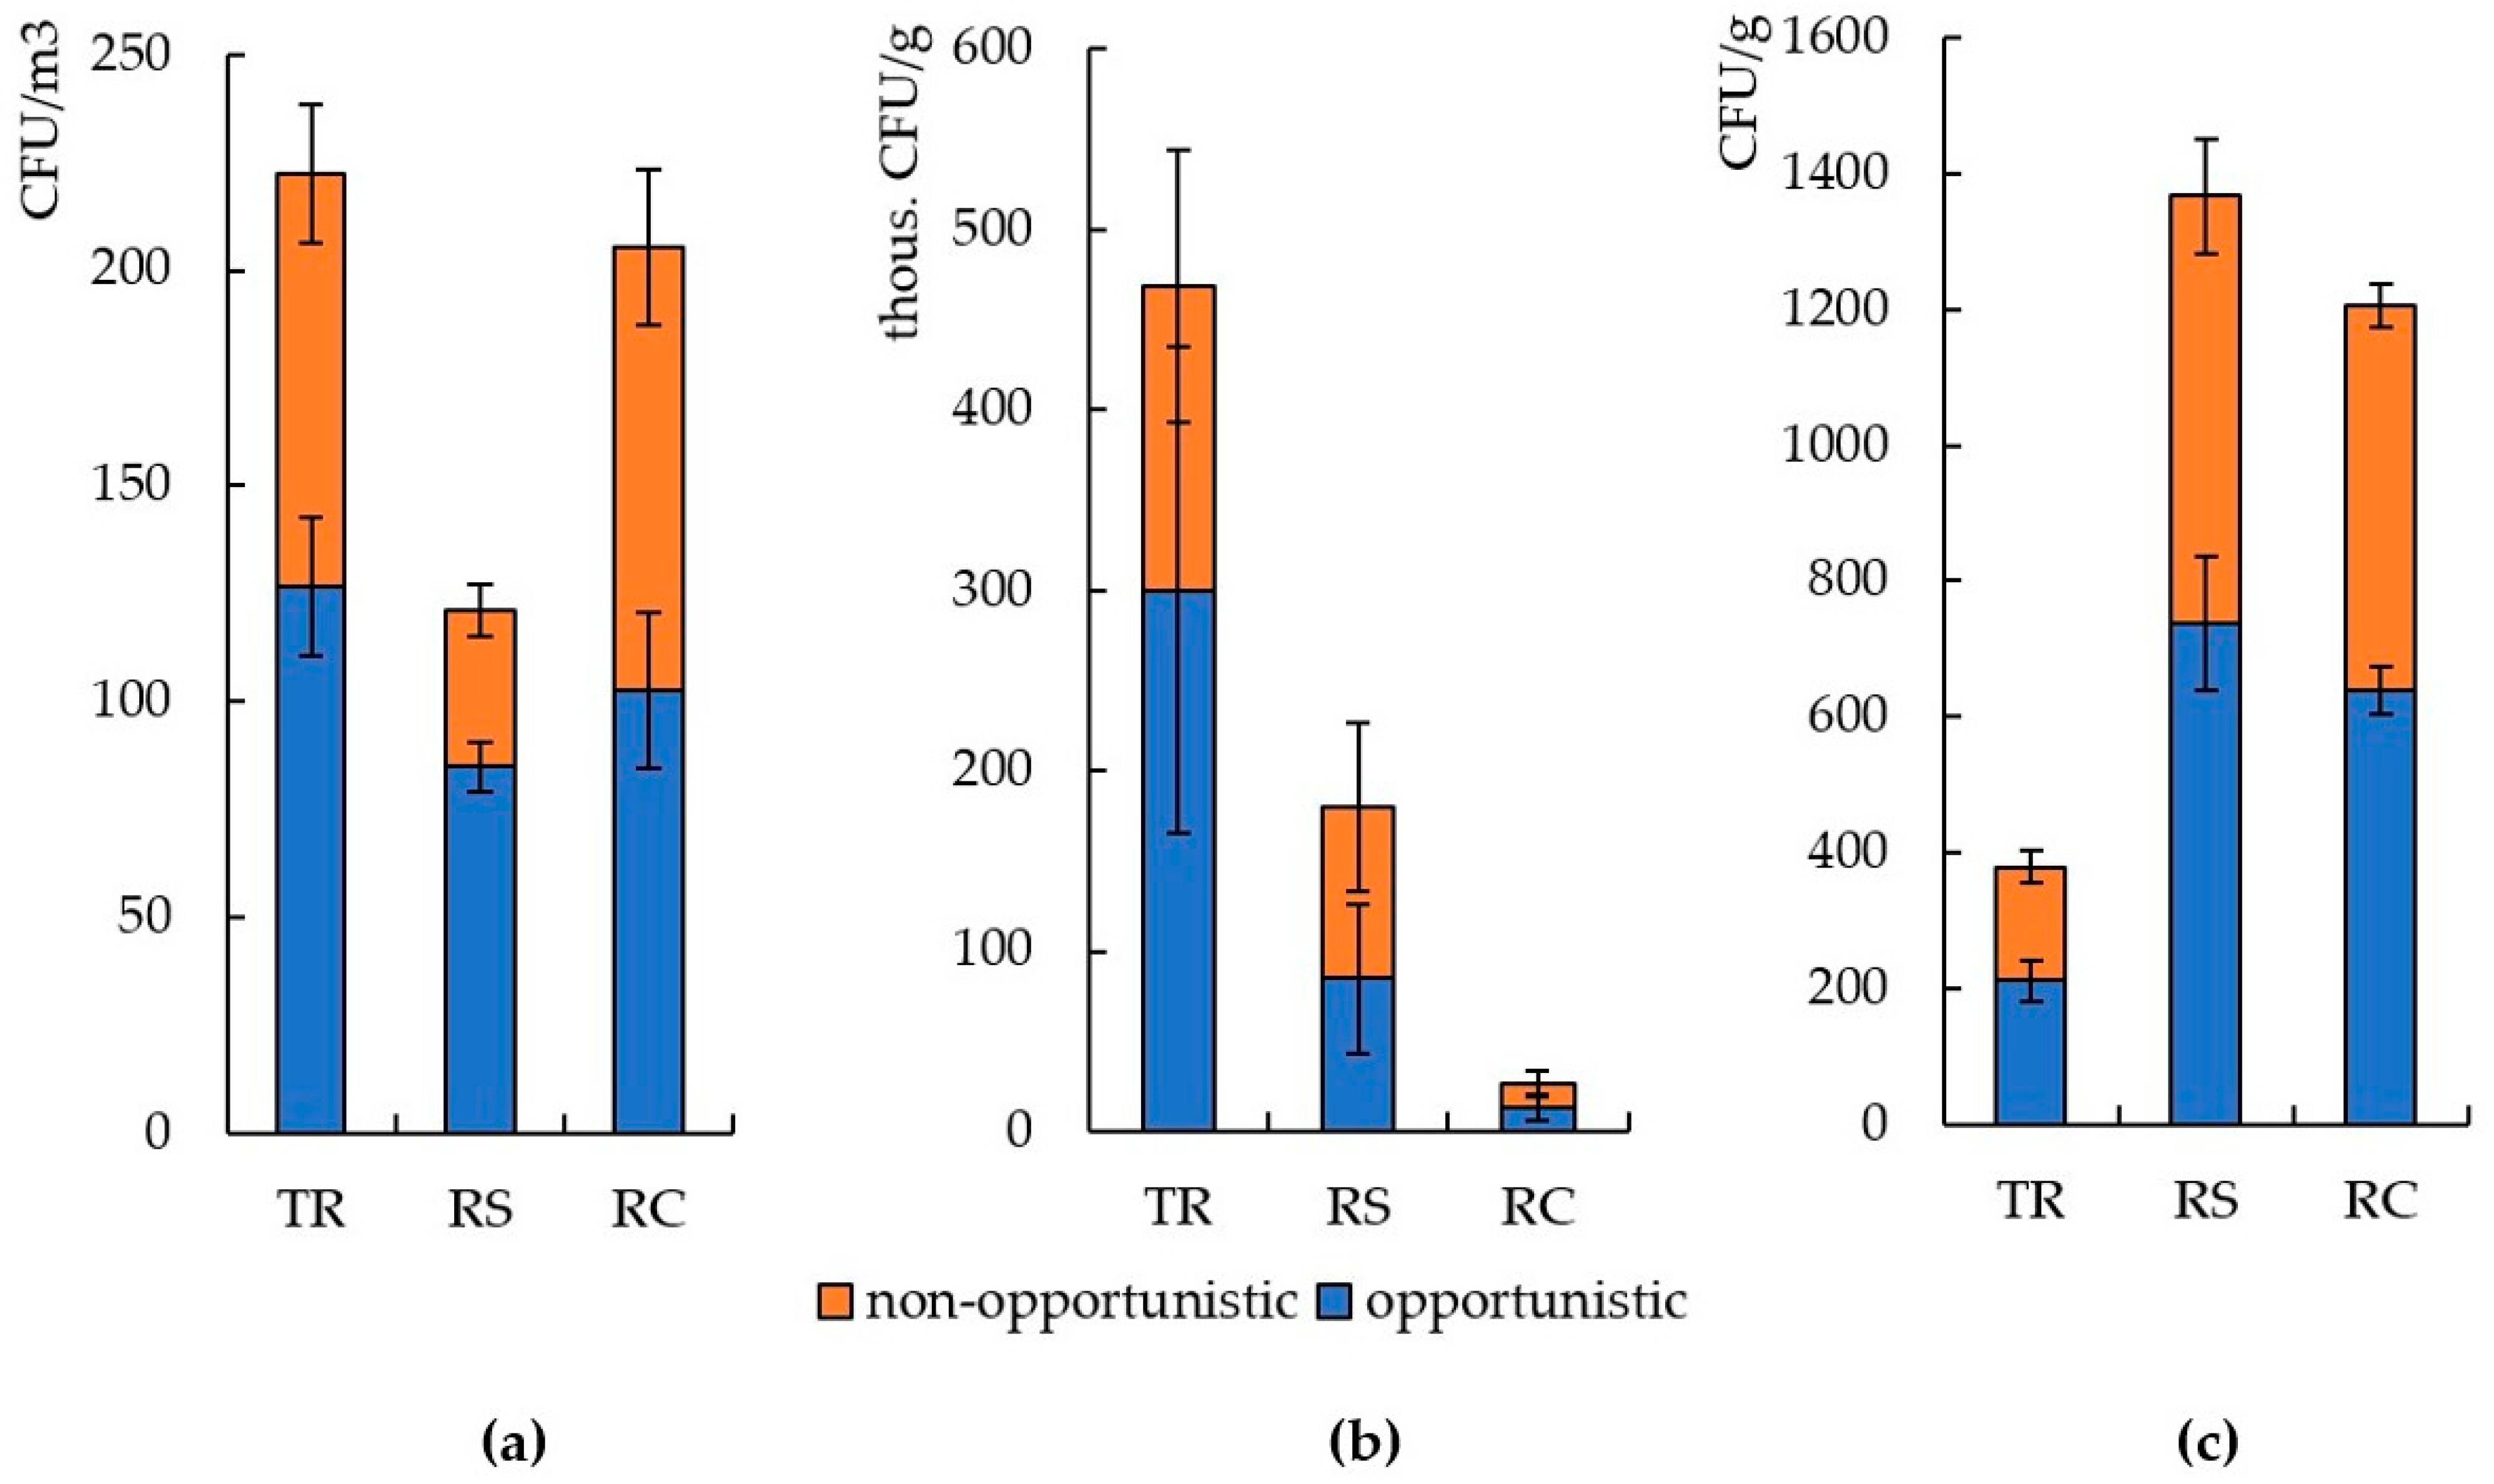
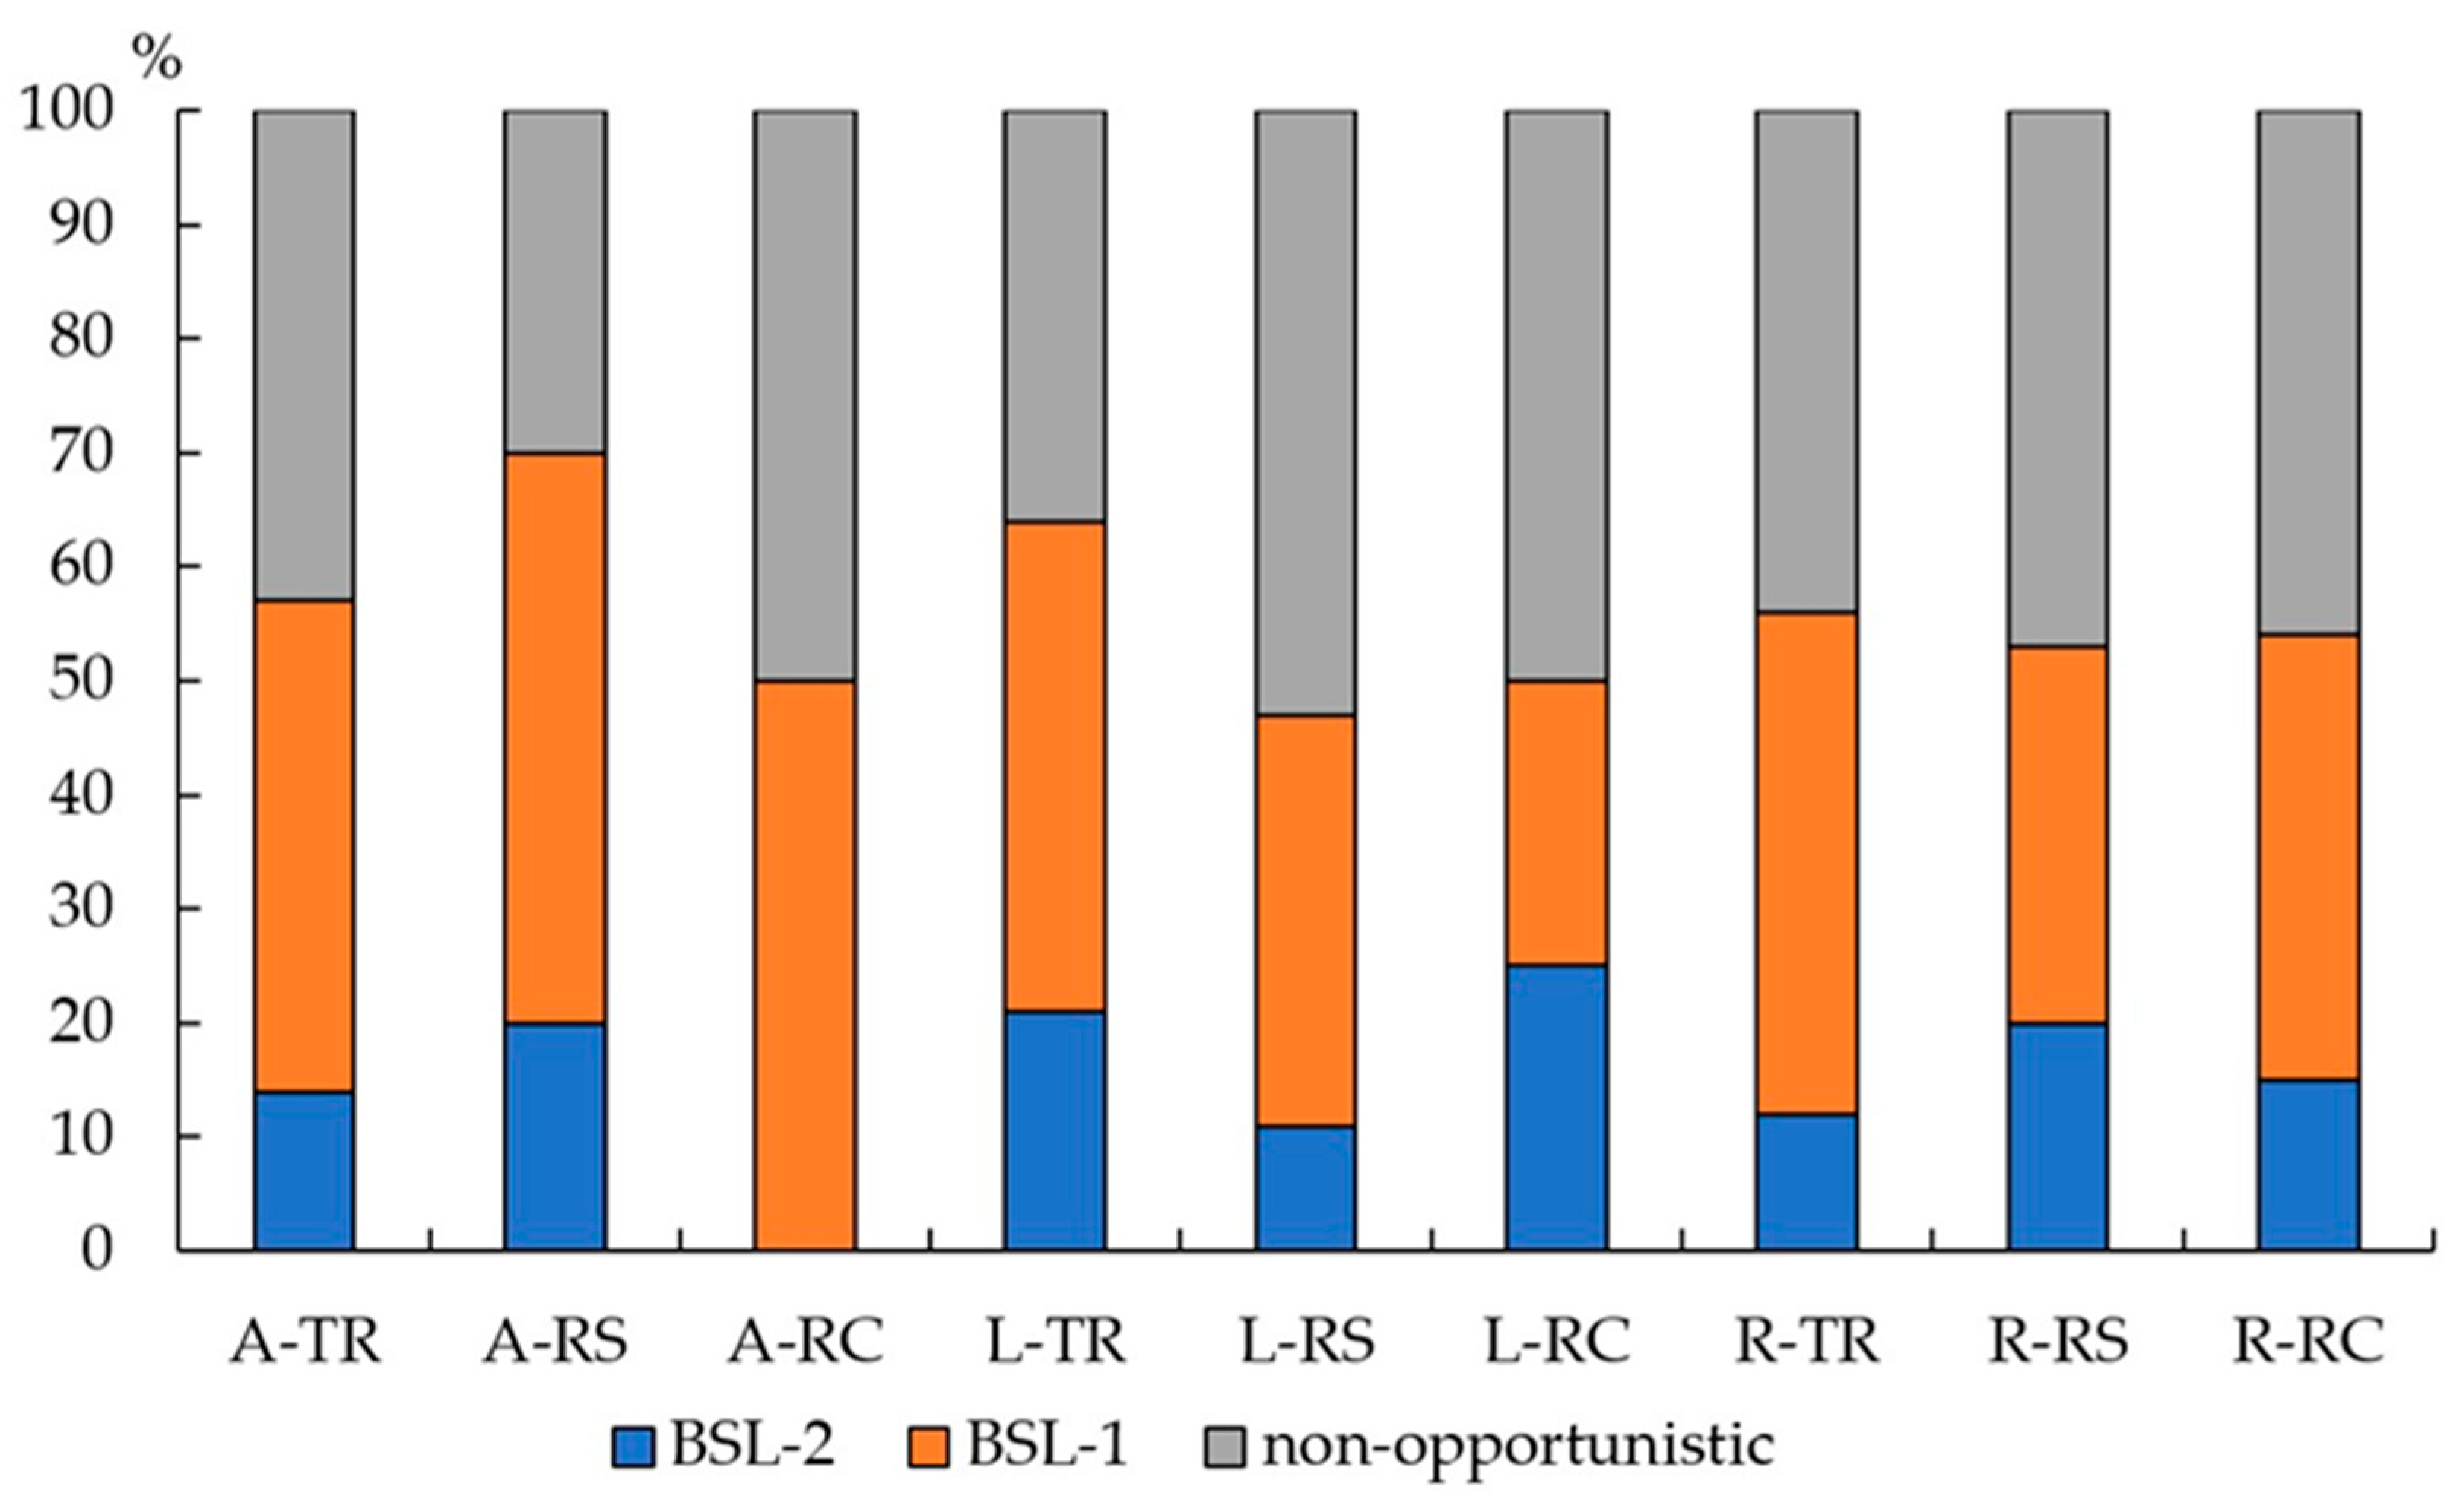
3.2. The Number and Diversity of Microscopic Fungi in Moscow

The number of airborne fungi of different functional zones of Moscow varied from 121 to 222 CFU/m3. The smallest number was measured in residential zone (p < 0.05), the largest in traffic and recreational zones. In the residential zone, almost 70% of the detected species belonged to opportunistic fungi; this number was lower in traffic zone (57%) and in the recreational zone (50%), although differences between zones were not significant (Figure 6a).
The number of fungi detected on the leaves surface in traffic zone reached 469,000 CFU/g of dust, and in the residential zone it was 2.5 times less (180,000 CFU/g, p = 0.1937 > 0.05). In the recreational zone, the number was minimal −27,000 CFU/g (Figure 6b, p < 0.05). However, the portion of opportunistic fungi is almost the same in all functional zones and amounted to 45–65% of the total number of identified species, reaching the highest value near the road.
The number of microscopic fungi in road dust in Moscow varied from 379 CFU/g in the traffic zone to 1367 CFU/g in the residential zone (Figure 6c). In the recreational zone, a high content of fungi was also identified −1206 CFU/g. The portion of opportunistic fungi in all zones was close to 50% of the total detected.
In total, 43 species of microscopic fungi belonging to 3 phyla (Ascomycota, Basidiomycota, Mucoromycota), 7 classes (Agaricomycetes, Dothideomycetes, Eurotiomycetes, Leotiomycetes, Mucoromycetes, Saccharomycetes, Sordariomycetes), 8 orders (Dothideales, Eurotiales, Helotiales, Hypocreales, Mucorales, Pleosporales, Polyporales, Saccharomycetales), 10 families (Aspergillaceae, Bionectriaceae, Hypocreaceae, Mucoraceae, Nectriaceae, Phanerochaetaceae, Pleosporaceae, Rhizopodaceae, Saccotheciaceae, Sclerotiniaceae), 16 genera (Alternaria, Aspergillus, Aureobasidium, Botrytis, Cephalosporium, Cylindrophora, Fusarium, Hyalocylindrophora, Hyphopichia, Mucor, Paecilomyces, Penicillium, Rhizopus, Sporotrichum, Talaromyces, Trichoderma), and two types of sterile mycelium were revealed.
In the recreational zone, the diversity of fungi was represented by 7 species in the air, 12 on the leaf surface, and 12 species in the road dust. In the residential zone were identified 9, 19, and 14 species, respectively; in traffic zone 6, 14, and 15 species, respectively (Figure 7).
In the residential zone, an increase in the diversity of airborne fungi of the genus Aspergillus was noted. Noteworthy is the fact that Aspergillus fumigatus species predominate in abundance in the residential zone (Table 2). The species Alternaria tenuissima and Botritis cinerea dominated in the recreational zone, and Alternaria tenuissima and Talaromyces flavus in the traffic zone.
In leaves and roads dust, the species diversity of fungi was higher than in the city air (Figure 7). Aureobasidium pullulans dominated on the leaf surface in all zones, and a high abundance of P. melinii and Aspergillus flavus was also noted in the recreational zone (Table 2). In the road dust of residential and traffic zones, the greatest variety of fungi g. Aspergillus was revealed. In the residential zone, A. niger prevailed in abundance; in traffic and recreational zones Trichoderma koningii dominated.
Fungi of the BSL-1 group were isolated from the air of recreational zone, while in the residential and traffic zones, fungi of more pathogenic BSL-2 group were isolated as well. Their portion amounted to 15–20% of the total species found (Figure 8). In contrast to the air, fungi of BSL-1 and BSL-2 groups were found on leaves and in the road dust in all assessed zones of Moscow. On the leaves surface, the portion of opportunistic fungi was high in the recreational and traffic zones, where the maximum diversity of fungi g. Aspergillus also was revealed. In road dust the largest number of BSL-2 fungi was noted in the residential zone.

3.3. The Number and Diversity of Microscopic Fungi in Murmansk

The number of airborne fungi in Murmansk varied among three zones between 72 and 103 CFU/m3 with highest number measured in residential zone (Figure 9a, p = 0.52). On leaves surface the number of fungi was in the range 14–88,000 CFU/g with highest number measured in the traffic zone and a minimum in a residential zone (Figure 9b, p = 0.25). In road dust were measured 292 and 364 CFU/g respectively in residential and traffic zones (Figure 9c). The portion of airborne opportunistic fungi in all zones ranged from 53 to 63%, with a minimum in the residential zone with no significant differences between the zones. The portion of opportunistic fungi on the leaves surface was also similar between functional zones and amounted to 58–60% of the total number of isolated species (Figure 9b). Despite the high number of fungi measured in road dust in traffic zone, the portion of opportunistic fungi was the smallest (43%) here, while in the residential zone it amounted to 53% of the total number of isolated species (Figure 9c).
In total, 41 species of microscopic fungi belonging to 2 phyla (Ascomycota, Mucoromycota), 6 classes (Dothideomycetes, Eurotiomycetes, Leotiomycetes, Mucoromycetes, Saccharomycetes, Sordariomycetes), 9 orders (Dothideales, Eurotiales, Helotiales, Hypocreales, Microascales, Mucorales, Pleosporales, Saccharomycetales, Thelebolales), 11 families (Aspergillaceae, Hypocreaceae, Microascaceae, Mucoraceae, Myxotrichaceae, Nectriaceae, Pleosporaceae, Pseudeurotiaceae, Saccotheciaceae, Sarocladiaceae, Sclerotiniaceae), 19 genera (Alternaria, Aspergillus, Aureobasidium, Botrytis, Cephalosporium, Ciliciopodium, Hyphopichia, Monodictys, Mucor, Oidiodendron, Paecilomyces, Parasarocladium, Penicillium, Pseudeurotium, Rhinocladium, Scopulariopsis, Scytalidium, Talaromyces, Trichoderma), and 1 sterile mycelia were revealed.
The species diversity of airborne fungi of the residential and traffic zones was represented by 13 and 16 species, respectively. In contrast to the air, the smallest amount of fungi on the leaves surface was found in the residential zone, and the largest in the recreational zone. In the leaf surface, the diversity of culturable fungi was represented by 6 and 9 species, respectively, and in road dust, 14 and 6 species (Figure 10). In the residential zone, the appearance of fungi gg. Trichoderma, Aureobasidium, Ciliciopodium, Parasarocladium was noted. However, the fungi Talaromyces ruber dominated in both zones. In Murmansk, 7 species were identified in the air of the recreational zone, and 11 species were found on the leaves surface (Figure 10).
The most pathogenic genus Aspergillus, as well as other dangerous BSL-2 species, were found in the air in traffic zone of Murmansk (Figure 11). Here, the prevailing airborne species differed between the zones: in the traffic zone it was Cephalosporium glutineum, in the residential one, Scopulariopsis candida and Scytalidium flavobrunneum, and in the recreational, Trichoderma koningii and Aureobasidium pullulans (Table 2). On the surface of leaves in Murmansk, no differences were found in the contribution of the BSL-1 and BSL-2 opportunistic fungi between different functional zones (Figure 11). In road dust, the opportunistic fungi were revealed both in residential and traffic zones; however, their portion was higher near roads.

3.4. Correlations and Multivariate Analyses

According to the results of multivariate analysis of variance, a statistically significant effect of the type of substrate on the number of microscopic fungi was revealed at p = 0.0240. The mutual action of the city (climate) and the functional zone also significantly affects the number of fungi p = 0.0410.
The climatic factor significantly affects the number of isolated species at p = 0.02924 (an increase in the diversity of fungi from north to south). In addition, the combined influence of climate and substrate significantly affects the number of isolated species at p = 0.00211. The type of functional zone (p = 0.0481) has a significant effect on the portion of opportunistic fungi, while the type of substrate and climate did not have a significant effect. The strength of the influence of the type of functional zone on the portion of opportunistic fungi is 21%.
Results of correlation analyses between chemical characteristics of dust and analyzed biological parameters are given in Table 3 and Table 4. Generally, all the observed relations were characterized by a negative sign with the exclusion of species richness of airborne fungi which was positively correlated with a number of chemical species found in the sites. A strong positive relation was also found between fraction of BSL-1 group in the road dust and concentration of Cd. Fungi of leaves surface were less sensitive to chemical characteristics of dust in confront to airborne fungi and road dust fungi. Concentration of elements in urban dust (qualitative contamination) was a more sensitive parameter in respect to content of individual elements in the environment (pollutants quantity). Negative correlations found with some chemical species, as for example elements from the lanthanide group, could be driven by a city effect, because the concentrations of these chemical elements in Murmansk dust were much higher than in Moscow. Especially such correlations were pronounced for total amount of airborne and road dust fungi, highlighting the importance of city/climate effect for these biologic parameters.
Cluster analysis of the species composition of microfungal complexes in the air, on the surface of leaves, and in road dust revealed both similarities and differences among functional zones and cities (Figure 12). The species composition of microfungi formed three large clusters, in which the air mycobiome in Murmansk, and leaf surfaces in Moscow formed separate clusters. The third cluster combined the rest of the substrates and functional zones. It can be seen that mycobiomes of different functional zones, but of the same substrate within the same climatic region, are close to each other.

4. Discussion

4.1. Effect of Climate and Pollution across Cities

In general, only 31% of species were common for two climatic zones, while in the group of opportunistic species, 43% of fungi coincided. This could be due to the tendency to identify “southern” species in the northern regions in anthropogenically disturbed territories, including urban ecosystems [65,66,67,68,69]. In Murmansk, the largest number of fungal species belonged to the genera Aspergillus, Penicillium, and Talaromyces. In Moscow, the largest number of species belonged to general Aspergillus, Penicillium, Talaromyces, and Trichoderma. Fungi belonging to these genera are known for their ability to cause diseases in humans and animals, such as lung and skin infections, systemic mycoses, peritonitis, and lymphadenitis [64].
The number of culturable airborne fungi, fungi on the surface of leaves and in road dust in subarctic Murmansk was generally 1–2 orders of magnitude lower than in Moscow. This pattern persists if compared with other large cities with warmer than Murmansk climates. The number of airborne fungi of St. Petersburg varied from 300–800 CFU/m3 in summer, in some periods reaching 1400 CFU/m3 [70]; in Moscow, from 50 to 1500 CFU/m3 [17,20]; Badajoz (Spain), up to 2000 CFU/g3 [19]; and Dublin (Ireland), from 30 to 6700 CFU/m3 [11]. Climatic conditions in the period of sampling can play a role for the amount of airborne fungi present. In September, Murmansk is characterized by lower night and day temperatures and shorter day light period compared to Moscow [56,57]. However, in the current experimental design, the anticipation of the autumn sampling in Murmansk allowed us to achieve comparable climatic conditions in terms of average, minimum, and maximum temperatures between the two cities. Hence, the effect of the instantaneous meteorological variation could be excluded, pointing more to geographic or climatic zone influence. Murmansk is also an industrial city with multiple anthropogenic sources of contaminants [71]. Higher concentrations and amount of dust in Murmansk can also drive the between city differences in fungi amount, alongside the climate zone. Indeed, the increase in a number of airborne microorganisms was observed for the air of intermediate quality, while in clean and heavily contaminated air its amount declined [20,48]. However, concentration of PTE was comparable for some of the zones between Moscow and Murmansk (e.g., recreational and residential zone in Murmansk with traffic zone in Moscow), whereas the number of fungi was several times lower in the northern city, thus supporting the climatic zone hypothesis. Despite the lower number of fungi in all studied substrates in Murmansk, their species diversity was comparable to that in Moscow: 41 and 43 species, including 23 and 20 of opportunistic fungi, respectively. Species richness (number of species) of airborne fungi was positively correlated with number of chemical species (elements) found in urban dust, pointing to dust as a substrate function which supports the biodiversity [72,73]. In Murmansk, the higher variety of chemical elements was found in urban dust, highlighting major sources of contaminants compared to Moscow. Power plants, industries, railway, naval, and road transport contribute to anthropogenic emissions here [71]. Simultaneously, the fraction of pathogenic species in the detected pool of fungi declined with an increase of the variety of pollutants. Differential response of pathogenic and total microorganisms pool in respect to the level of contamination was previously reported [20].
The largest number of fungi species in Murmansk was isolated from the air (22 species), while in Moscow the greatest species diversity was found on leaves and in the road dust. The fungi community on leaves was characterized by different sensitivity to pollution grade in respect to airborne microorganisms and road dust. Leaf surface mycobiome was largely insensitive to pollution. We can suggest a buffering function for leaves, ensuring resistance of proper fungi community to PTE. Indeed, the capacity of leaves to regulate the phylloplane environment conditions have been highlighted [74]. In fact, such buffering was not confirmed for road dust, where the relation with assessed contaminants was primary negative for all analyzed biological parameters. While dust can execute a substrate function in the air and on the sealed surface where nutrients are lacking and hence simultaneous toxic effects could be expected, the mycobiome of leaves can rely on the nutrients input provided by the leaf.
An increase of the fraction of BSL-1 group with Cd contamination was observed for the road dust. While Cd is considered toxic for plants, animals, and microorganisms [75,76], stimulatory effects in the low-dose range have been also reported for soil microorganisms [77]. We can hypothesize that a non-toxic threshold is different between opportunistic and non-opportunistic fungi.

4.2. Functional Zones

In different functional zones of Murmansk, no difference was found either in the total number of airborne fungi or for the opportunistic fungi. In Murmansk, the species diversity of airborne fungi of the residential and traffic zones was richer than in Moscow. Thus, the greatest diversity of airborne fungal species in Moscow and Murmansk was observed in the residential area, and the smallest in the recreational area. The structure of the dominance of communities of airborne fungi in cities differed for different functional zones.
The portion of opportunistic fungi was 53–63% in all studied areas. In Moscow, the largest portion of opportunistic fungi was noted in the residential and traffic areas, up to 50–70% of the total number of species; however, the total number of airborne fungi in the residential area was the smallest. Although not related to the concentration of singular pollutants, the fungi of the most dangerous BSL-2 group appeared in the traffic area in both cities, which may indicate a greater resistance of these species to anthropogenic load [13,47,78]. No fungi of this group were found in the air of the recreational zone either in Moscow or in Murmansk. It can be hypothesized that a considerable concentration of green infrastructure in the recreational zone execute a phytoncidal effect on the mycobiota belonging to this pathogenic group. Such effects were confirmed in laboratory experiments [79,80]. However, similar patterns were not observed for leaves and road dust, where fungi of BSL-2 group were present in all functional zones. Less dust and nutrient content in the air may also limit the spread of this group of microorganisms in the air.
While in Moscow 2.5 times more microfungi were isolated from the surface of leaves near roads and 7 times more in the residential zone compared to the recreational zone, in Murmansk their large number was found only near the roads. In the residential zone, on the contrary, the lowest number of fungi was noted. However, in cities of both climatic zones, the portion of opportunistic fungi on the leaf surface was 50–60% of the total number of species in different functional zones, a pattern highlighted by other authors [79,81]. Fungi of the BSL-2 group were isolated in all zones of both cities, and their greatest number was found on plants in the recreational zone. This may be caused by the movement of fungal spores from the most polluted areas of the city to the park zone, which was previously noted by other authors [42]. On the surface of leaves, both in Moscow and in Murmansk, differences in the composition of dominant species between different functional zones were not revealed. In Moscow, the dominant species was Aureobasidium pullulans, and in Murmansk Penicillium corylophilum.
In Moscow, in the road dust, the minimum number of microfungi was noted, while in Murmansk was the maximum noted. This result can be explained by the regular washing of the roads in the transport zone of Moscow [82], which is not carried out in residential and recreational zones. In Murmansk, in the residential area, the number of microfungi is two times lower than near roads. However, in Moscow in the traffic area, a high portion of opportunistic fungi was noted (56%), while in Murmansk, it was only 43%. BSL-2 fungi were identified in all zones of both cities.

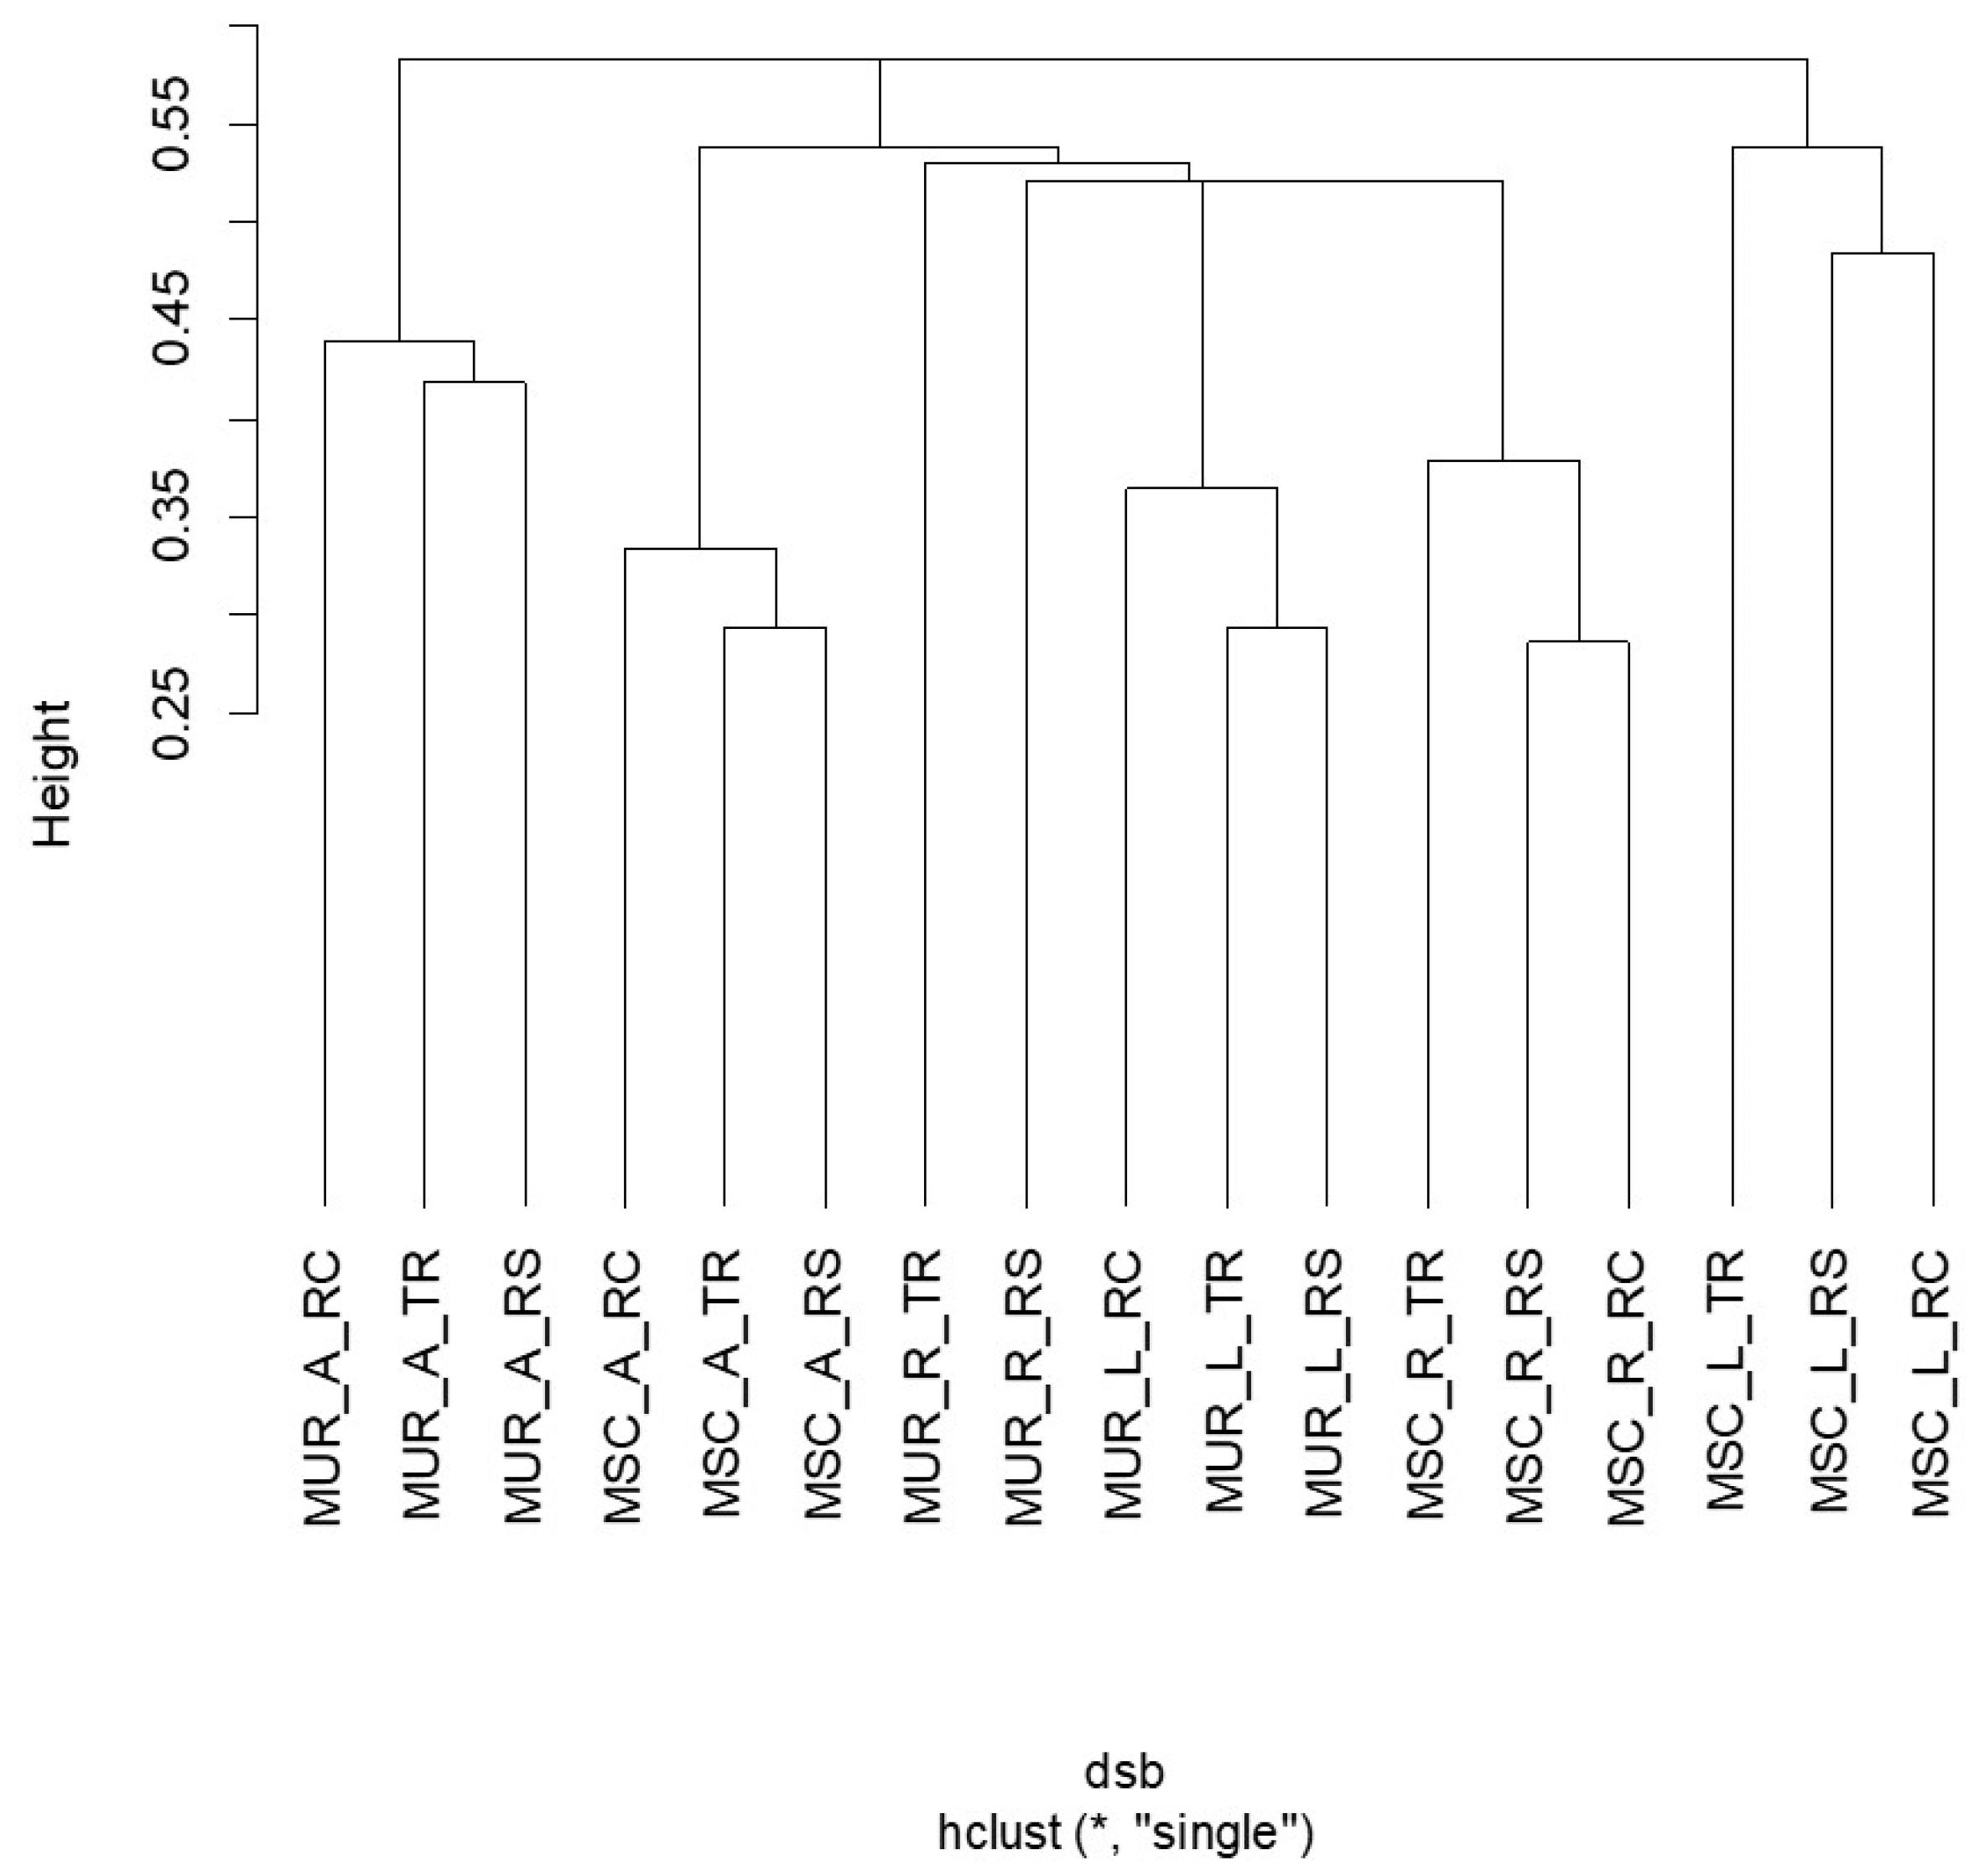
4.3. Species Composition Clustering

Clustering and multivariate analyses revealed the importance of the type of substrate and climatic zone for the species composition of the mycobiome. Each substrate (air, surface of leaves, road dust) could be characterized as a different habitat for microscopic fungi with different energy availability and particular environmental conditions. The air is characterized by aridity, increased UV irradiation, and a lack of nutrients. Here, major survival rates were expected for xerophilic resistant fungi. The surface of leaves was more favorable for the development of fungi due to the presence of an additional source of nutrition—plant secretions, favorable temperature, and moisture rates [8,83]. Road dust is characterized by an abundance of dust-related organic matter and inorganic compounds, which can serve as a nutrient substrate for fungi. The proximity to soil also contributes to the abundance and diversity of microfungi in road dust [77]. Due to these features, microscopic fungi occupy different ecological niches on different types of substrates, where they form unique complexes characterized by different numbers and species composition. The significant influence of the climatic zone on the number of microfungi may be associated with the general trend of an increase in the number and diversity of fungi, including conditionally pathogenic ones, from north to south, also noted in the works of other authors [84].

5. Conclusions

Quantitative and qualitative parameters of the mycobiome in the air, on the surface of leaves and in the road dust was analyzed in different functional zones characterized by contrasting anthropogenic load of two big cities located in temperate and subarctic climate. It was found that environmental pollution grade in these cities differed substantially both in chemical composition and amount of dust as demonstrated by dust accumulated by birch crowns. A lower number of micromycetes was revealed in all studied substrates in Murmansk compared to Moscow, but the species richness of micromycete communities was comparable for two cities. In both cities, the largest number of species belonged to the genera Penicillium, Aspergillus, Talaromyces, and Trichoderma. About half of the isolated species were identified as potentially pathogenic. The most dangerous species belonging to the BSL-2 (Aspergillus flavus, A. fumigatus, and Paecilomyces variotii) group were found in the transport and residential areas of both cities; this trend was especially clear for Moscow. The type of substrate and the climatic factor had a more significant effect on the number, species diversity of microfungi and the number of opportunistic species compared to functional zoning. Still, diversity and number of species were sensitive to concertation of individual pollutants between cities and functional zones. Positive and negative effects were observed. In general, the air in the recreational zone of both cities can be considered as the safest for humans due to the absence of BSL-2 fungi. However, a significant number of opportunistic species were found on leaf surfaces and in the road dust in all the zones. As a recommendation to city dwellers, it could be suggested to minimize a direct contact with the surface of plant leaves and road surfaces, which could be especially important for preschool children, in order to reduce the likelihood of interaction with opportunistic fungi as potentially hazardous to human health.

Author Contributions

Conceptualization, M.V.K., O.G.; methodology, M.V.K., O.G., A.I.N.; software, A.S.S.; validation, M.V.K., M.V.S., O.G.; formal analysis, A.S.S., A.I.N., M.V.S., O.G; investigation, M.V.K., A.S.S., A.I.N., K.V.I., O.I.S., A.A.S., A.A.V., O.G.; resources, O.I.S., A.S.S., A.A.V.; data curation, K.V.I.; writing—original draft preparation, M.V.K., M.V.S.; writing—review and editing, O.G., V.I.V.; visualization, M.V.K.; supervision, O.G.; project administration, O.G.; funding acquisition, O.G., V.I.V. All authors have read and agreed to the published version of the manuscript.

Funding

The field work in Murmansk was supported by State scientific program AAAA-A18-118021490070-5, in Moscow—by the RUDN University Strategic Academic Leadership Program. The chemical and microbiological research has been supported by Russian Foundation for Basic Research # 19-05-50112.

Institutional Review Board Statement

Not applicable.

Informed Consent Statement

Not applicable.

Data Availability Statement

Data set available on request to corresponding authors.

Acknowledgments

The authors thank Ermakova Anastasia for help with quantification of leaf surfaces, Aleksey Ryazanov for help with Moscow sampling, and Vladimir Myazin for help with Murmansk sampling.

Conflicts of Interest

The authors declare have no conflict of interest. This article does not contain any research involving humans and animals as research objects.

References

  1. Morel, J.L.; Chenu, C.; Lorenz, K. Ecosystems services provided by soil of urban, industrial, traffic, mining, and military areas (SUITMAs). J. Soils Sediments 2015, 15, 1659–1666. [Google Scholar] [CrossRef]
  2. Steffan, J.J.; Brevik, E.C.; Burgess, L.C.; Cerdà, A. The effect of soil on human health: An overview. Eur. J. Soil Sci. 2018, 69, 159–171. [Google Scholar] [CrossRef] [Green Version]
  3. Vasenev, V.; Kuzyakov, Y. Urban soils as hot spots of anthropogenic carbon accumulation: Review of stocks, mechanisms and driving factors. Land. Degrad. Dev. 2018, 29, 1607–1622. [Google Scholar] [CrossRef]
  4. WHO. Ambient Air Pollution: A Global Assessment of Exposure and Burden of Deseas; WHO: Geneva, Switzerland, 2016. [Google Scholar]
  5. Ivashchenko, K.V.; Ananyeva, N.; Vasenev, V.I.; Kudeyarov, V.; Valentini, R. Biomass and respiration activity of soil microorganisms in anthropogenically transformed ecosystems (Moscow region). Eurasian Soil Sci. 2014, 47, 892–903. [Google Scholar] [CrossRef]
  6. Sarzhanov, D.A.; Vasenev, V.I.; Sotnikova, Y.L.; Tembo, A.; Vasenev, I.; Valentini, R. Short-term dynamics and spatial heterogeneity of CO2 emission from the soils of natural and urban ecosystems in the Central Chernozemic Region. Eurasian Soil Sci. 2015, 48, 416–424. [Google Scholar] [CrossRef]
  7. Escobedo, F.J.; Kroeger, T.; Wagner, J.E. Urban forests and pollution mitigation: Analyzing ecosystem services and disservices. Environ. Pollut. 2011, 159, 2078–2087. [Google Scholar] [CrossRef] [PubMed]
  8. Baldacchini, C.; Castanheiro, A.; Maghakyan, N.; Sgrigna, G.; Verhelst, J.; Alonso, R.; Amorim, J.H.; Bellan, P.; Bojović, D.; Breuste, J.; et al. How Does the Amount and Composition of PM Deposited on Platanus acerifolia Leaves Change Across Different Cities in Europe? Environ. Sci. Technol. 2017, 51, 1147–1156. [Google Scholar] [CrossRef] [PubMed]
  9. Baldacchini, C.; Sgrigna, G.; Clarke, W.; Tallis, M.; Calfapietra, C. An ultra-spatially resolved method to quali-quantitative monitor particulate matter in urban environment. Environ. Sci. Pollut. Res. 2019, 26, 18719–18729. [Google Scholar] [CrossRef]
  10. Adams, R.I.; Bateman, A.C.; Bik, H.M.; Meadow, J.F. Microbiota of the indoor environment: A meta-analysis. Microbiome 2015, 3, 1–18. [Google Scholar] [CrossRef] [Green Version]
  11. O’Gorman, C.M.; Fuller, H.T. Prevalence of culturable airborne spores of selected allergenic and pathogenic fungi in outdoor air. Atmos. Environ. 2008, 42, 4355–4368. [Google Scholar] [CrossRef]
  12. Chakrabarti, H.S.; Das, S.; Gupta-Bhattacharya, S. Outdoor airborne fungal spora load in a suburb of Kolkata, India: Its variation, meteorological determinants and health impact. Int. J. Environ. Health Res. 2012, 22, 37–50. [Google Scholar] [CrossRef]
  13. Korneykova, M.V.; Lebedeva, E.V. Opportunistic Fungi in the Polluted Soils of Kola Peninsula. Geogr. Environ. Sustain. 2018, 11, 125–137. [Google Scholar] [CrossRef] [Green Version]
  14. Salem, H.; Gardner, D.E. Health aspects of bioaerosols. In Atmospheric Microbial Aerosols; Lighthart, B., Mohr, A.J., Eds.; Springer: Boston, MA, USA, 1994; pp. 304–330. [Google Scholar] [CrossRef]
  15. Beasley, R. The burden of asthma with specific reference to the United States. J. Allergy Clin. Immunol. 2002, 109, S482–S489. [Google Scholar] [CrossRef]
  16. Isolauri, E.; Huurre, A.; Salminen, S.; Impivaara, O. The allergy epidemic extends beyond the past few decades. Clin. Exp. Allergy 2004, 34, 1007–1010. [Google Scholar] [CrossRef]
  17. Burge, H.A.; Rogers, C.A. Outdoor allergens. Environ. Health Perspect. 2000, 108, 653–659. [Google Scholar] [CrossRef] [Green Version]
  18. Ross, M.A.; Curtis, L.; Scheff, P.A.; Hryhorczuk, D.O.; Ramakrishnan, V.; Wadden, R.A.; Persky, V.W. Association of asthma symptoms and severity with indoor bioaerosols. Allergy 2000, 55, 705–711. [Google Scholar] [CrossRef] [PubMed]
  19. Innocente, E.; Squizzato, S.; Visin, F.; Facca, C.; Rampazzo, G.; Bertolini, V.; Gandolfi, I.; Franzetti, A.; Ambrosini, R.; Bestetti, G. Influence of seasonality, air mass origin and particulate matter chemical composition on airborne bacterial community structure in the Po Valley, Italy. Sci. Total Environ. 2017, 593–594, 677–687. [Google Scholar] [CrossRef]
  20. Liu, H.; Zhang, X.; Zhang, H.; Yao, X.; Zhou, M.; Wang, J.; He, Z.; Zhang, H.; Lou, L.; Mao, W.; et al. Effect of air pollution on the total bacteria and pathogenic bacteria in different sizes of particulate matter. Environ. Pollut. 2018, 233, 483–493. [Google Scholar] [CrossRef] [PubMed]
  21. Zhai, Y.; Li, X.; Wang, T.; Wang, B.; Li, C.; Zeng, G. A review on airborne microorganisms in particulate matters: Composition, characteristics and influence factors. Environ. Int. 2018, 113, 74–90. [Google Scholar] [CrossRef]
  22. Salawu-Rotimi, A.; Lebre, P.H.; Vos, H.C.; Fister, W.; Kuhn, N.; Eckardt, F.D.; Cowan, D.A. Gone with the Wind: Microbial Communities Associated with Dust from Emissive Farmlands. Microb. Ecol. 2021, 82, 859–869. [Google Scholar] [CrossRef] [PubMed]
  23. Antropova, A.B.; Mokeeva, V.L.; Bilanenko, E.N.; Chekunova, L.N.; Zheltikova, T.M.; Petrova-Nikitina, A.D. Aeromycota of Moscow dwellings. Mikol. Fitopatol. 2003, 37, 1–11. (In Russian) [Google Scholar]
  24. Yegorova, L.N.; Klimova, Y.A. Saprotrophic micromycetes in the air of various rooms in Vladivostok. Uspekhi Meditsinskoy Mikol. 2005, 5, 64–67. (In Russian) [Google Scholar]
  25. Abbasi, F.; Samaei, M.R. The effect of temperature on airborne filamentous fungi in the indoor and outdoor space of a hospital. Environ. Sci. Pollut. Res. 2018, 26, 16868–16876. [Google Scholar] [CrossRef] [PubMed]
  26. Chegini, F.M.; Baghani, A.N.; Hassanvand, M.S.; Sorooshian, A.; Golbaz, S.; Bakhtiari, R.; Ashouri, A.; Joubani, M.N.; Alimohammadi, M. Indoor and outdoor airborne bacterial and fungal air quality in kindergartens: Seasonal distribution, genera, levels, and factors influencing their concentration. Build. Environ. 2020, 175, 106690. [Google Scholar] [CrossRef]
  27. Guo, K.; Qian, H.; Zhao, D.; Ye, J.; Zhang, Y.; Kan, H.; Zhao, Z.; Deng, F.; Huang, C.; Zhao, B.; et al. Indoor exposure levels of bacteria and fungi in residences, schools, and offices in China: A systematic review. Indoor Air 2020, 30, 1147–1165. [Google Scholar] [CrossRef] [PubMed]
  28. Pyrri, I.; Tripyla, E.; Zalachori, A.; Chrysopoulou, M.; Parmakelis, A.; Kapsanaki-Gotsi, E. Fungal contaminants of indoor air in the National Library of Greece. Aerobiologia 2020, 36, 387–400. [Google Scholar] [CrossRef]
  29. Wu, D.; Zhang, Y.; Tian, Y.; Li, A.; Li, Y.; Xiong, J.; Gao, R. On-site investigation of the concentration and size distribution characteristics of airborne fungi in a university library. Environ. Pollut. 2020, 261, 114138. [Google Scholar] [CrossRef] [PubMed]
  30. Bowers, R.M.; Clements, N.; Emerson, J.; Wiedinmyer, C.; Hannigan, M.; Fierer, N. Seasonal Variability in Bacterial and Fungal Diversity of the Near-Surface Atmosphere. Environ. Sci. Technol. 2013, 47, 12097–12106. [Google Scholar] [CrossRef] [PubMed]
  31. Be, N.A.; Thissen, J.; Fofanov, V.Y.; Allen, J.; Rojas, M.; Golovko, G.; Fofanov, Y.; Koshinsky, H.; Jaing, C.J. Metagenomic Analysis of the Airborne Environment in Urban Spaces. Microb. Ecol. 2014, 69, 346–355. [Google Scholar] [CrossRef] [Green Version]
  32. Gandolfi, I.; Canedoli, C.; Imperato, V.; Tagliaferri, I.; Gkorezis, P.; Vangronsveld, J.; Schioppa, E.P.; Papacchini, M.; Bestetti, G.; Franzetti, A. Diversity and hydrocarbon-degrading potential of epiphytic microbial communities on Platanus x acerifolia leaves in an urban area. Environ. Pollut. 2016, 220, 650–658. [Google Scholar] [CrossRef] [PubMed]
  33. Sazonova, O.I.; Sokolov, S.; Prisyazhnaya, N.V.; Izmalkova, T.Y.; Kosheleva, I.A.; Boronin, A.M. Epiphytic microorganisms degrading aromatic hydrocarbons from the phyllosphere of urban woody plants. Microbiology 2017, 86, 82–88. [Google Scholar] [CrossRef]
  34. Franzetti, A.; Gandolfi, I.; Bestetti, G.; Schioppa, E.P.; Canedoli, C.; Brambilla, D.; Cappelletti, D.; Sebastiani, B.; Federici, E.; Papacchini, M.; et al. Plant-microorganisms interaction promotes removal of air pollutants in Milan (Italy) urban area. J. Hazard. Mater. 2020, 384, 121021. [Google Scholar] [CrossRef] [PubMed]
  35. Ovchinnikova, T.A.; Tkachenko, M.A. Micromycetes of Phylloplane of Woody Plants in the Urban Environment in Autumn. Proc. Young Sci. Spec. Samara Univ. 2018, 1, 41–45. [Google Scholar]
  36. Setti, L.; Passarini, F.; De Gennaro, G.; Barbieri, P.; Perrone, M.G.; Piazzalunga, A.; Borelli, M.; Palmisani, J.; Di Gilio, A.; Piscitelli, P.; et al. The potential role of particulate matter in the spreading of COVID-19 in Northern Italy: First evidence-based research hypotheses. MedRxiv 2020. [Google Scholar] [CrossRef]
  37. Yao, Y.; Pan, J.; Wang, W.; Liu, Z.; Kan, H.; Qiu, Y.; Meng, X.; Wang, W. Association of particulate matter pollution and case fatality rate of COVID-19 in 49 Chinese cities. Sci. Total Environ. 2020, 741, 140396. [Google Scholar] [CrossRef]
  38. Yair, Y.; Yair, Y.; Rubin, B.; Confino-Cohen, R.; Rosman, Y.; Shachar, E.; Rottem, M. First reported case of thunderstorm asthma in Israel. Nat. Hazards Earth Syst. Sci. 2019, 19, 2715–2725. [Google Scholar] [CrossRef] [Green Version]
  39. Barberán, A.; Ladau, J.; Leff, J.W.; Pollard, K.S.; Menninger, H.L.; Dunn, R.; Fierer, N. Continental-scale distributions of dust-associated bacteria and fungi. Proc. Natl. Acad. Sci. USA 2015, 112, 5756–5761. [Google Scholar] [CrossRef] [Green Version]
  40. Lee, J.Y.; Park, E.H.; Lee, S.; Ko, G.; Honda, Y.; Hashizume, M.; Deng, F.; Yi, S.M.; Kim, H. Airborne bacterial communities in three east Asian cities of China, South Korea, and Japan. Sci. Rep. 2017, 7, 1–8. [Google Scholar] [CrossRef] [Green Version]
  41. Dietzel, K.; Valle, D.; Fierer, N.; U’Ren, J.M.; Barberán, A. Geographical Distribution of Fungal Plant Pathogens in Dust Across the United States. Front. Ecol. Evol. 2019, 7, 304. [Google Scholar] [CrossRef] [Green Version]
  42. Ivanova, A.M.; Kirtsideli, I.Y. Microfungi from air at St.-Petersburg. Nov. Sist. Nizshikh Rasteniy 2005, 39, 136–141. (In Russian) [Google Scholar]
  43. Wuyts, K.; Smets, W.; Lebeer, S.; Samson, R. Green infrastructure and atmospheric pollution shape diversity and composition of phyllosphere bacterial communities in an urban landscape. FEMS Microbiol. Ecol. 2020, 96, fiz173. [Google Scholar] [CrossRef]
  44. Marfenina, O.Y.; Makarova, N.V.; Ivanova, A.Y. Opportunistic moulds in soils and upper soil air layers in megalopolis (on an example of region Tushino, Moscow). Mikol. Fitopatol. 2011, 45, 397–407. (In Russian) [Google Scholar]
  45. Fernández-Rodríguez, S.; Tormo-Molina, R.; Maya-Manzano, J.M.; Silva-Palacios, I.; Gonzalo-Garijo, Á. Outdoor airborne fungi captured by viable and non-viable methods. Fungal Ecol. 2014, 7, 16–26. [Google Scholar] [CrossRef]
  46. Marfenina, O.Y.; Kolosova, Y.D.; Glagolev, M.V. Number of fungal diaspores deposited from surface air layers at the areas with different vegetation cover in Moscow City. Mikol. I Fitopatol. 2016, 50, 379–385. (In Russian) [Google Scholar]
  47. Korneykova, M.V.; Evdokimova, G.A. Microbiota of the ground air layers in natural and industrial zones of the Kola Arctic. J. Environ. Sci. Health Part A 2017, 53, 271–277. [Google Scholar] [CrossRef]
  48. Elmassry, M.M.; Ray, N.; Sorge, S.; Webster, J.; Merry, K.; Caserio, A.; Vecellio, D.J.; Kruczek, C.; Dowd, S.; Ardon-Dryer, K.; et al. Investigating the culturable atmospheric fungal and bacterial microbiome in West Texas: Implication of dust storms and origins of the air parcels. FEMS Microbes 2020, 1, xtaa009. [Google Scholar] [CrossRef]
  49. Perrino, C.; Marcovecchio, F. A new method for assessing the contribution of Primary Biological Atmospheric Particles to the mass concentration of the atmospheric aerosol. Environ. Int. 2016, 87, 108–115. [Google Scholar] [CrossRef]
  50. Fierer, N.; Liu, Z.; Rodríguez-Hernández, M.; Knight, R.; Henn, M.; Hernandez, M.T. Short-Term Temporal Variability in Airborne Bacterial and Fungal Populations. Appl. Environ. Microbiol. 2008, 74, 200–207. [Google Scholar] [CrossRef] [Green Version]
  51. Frohlich-Nowoisky, J.; Pickersgill, D.A.; Despres, V.R.; Poschl, U. High diversity of fungi in air particulate matter. Proc. Natl. Acad. Sci. USA 2009, 106, 12814–12819. [Google Scholar] [CrossRef] [PubMed] [Green Version]
  52. Abrego, N.; Norros, V.; Halme, P.; Somervuo, P.; Ali-Kovero, H.; Ovaskainen, O. Give me a sample of air and I will tell which species are found from your region: Molecular identification of fungi from airborne spore samples. Mol. Ecol. Resour. 2018, 18, 511–524. [Google Scholar] [CrossRef] [Green Version]
  53. Liu, H.; Hu, Z.; Zhou, M.; Hu, J.; Yao, X.; Zhang, H.; Li, Z.; Lou, L.; Xi, C.; Qian, H.; et al. The distribution variance of airborne microorganisms in urban and rural environments. Environ. Pollut. 2019, 247, 898–906. [Google Scholar] [CrossRef] [PubMed]
  54. Stephens, B.; Adams, R.I.; Bhangar, S.; Bibby, K.; Waring, M.S. From commensalism to mutualism: Integrating the microbial ecology, building science, and indoor air communities to advance research on the indoor microbiome. Indoor Air 2015, 25, 1–3. [Google Scholar] [CrossRef] [Green Version]
  55. Blagodatskaya, E.; Kuzyakov, Y. Active microorganisms in soil: Critical review of estimation criteria and approaches. Soil Biol. Biochem. 2013, 67, 192–211. [Google Scholar] [CrossRef]
  56. Climate-Data.org. Climate Data for Cities Worldwide. 2021. Available online: https://ru.climate-data.org/ (accessed on 15 February 2021).
  57. Weather Online Ltd. Meteorological Services. 2021. Available online: https://www.weatheronline.co.uk/ (accessed on 15 February 2021).
  58. Mosecomonitoring Site. 2020. Available online: https://mosecom.mos.ru/home-page/ (accessed on 15 August 2020).
  59. Zvyagintsev, D.G. Methods of Soil Microbiology and Biochemistry; P.C. MGU: Moscow, Russia, 1991. (In Russian) [Google Scholar]
  60. Klich, M.A. Identification of Common Aspergillus Species; CBS Fungal Biodiversity Centre: Utrecht, The Netherlands, 2002. [Google Scholar]
  61. Domsch, K.H.; Gams, W.; Anderson, T.H. Compendium of Soil Fungi, 2nd ed.; IHW–Verlag: Eching, Germany, 2007. [Google Scholar]
  62. Seifert, K.; Morgan-Jones, G.; Gams, W.; Kendrick, B. The Genera of Hyphomycetes; CBS, Reus: Utrecht, The Netherlands, 2011. [Google Scholar]
  63. Index Fungorum. A Nomenclatural Database. 2021. Available online: http://www.indexfungorum.org (accessed on 3 March 2021).
  64. de Hoog, G.S.; Guarro, J.; Gené, J.; Figueras, M.J. Atlas of Clinical Fungi, 3rd ed.; Reus: Utrecht, The Netherlands, 2019. [Google Scholar]
  65. Еvdokimova, G.A. Ecological-Microbiological Foundations of Soil Protection in the Far North; P.C. The Kola Science Centre of the Russian Academy of Sciences: Apatity, Russia, 1995. (In Russian) [Google Scholar]
  66. Kireyeva, N.A.; Miftakhova, A.M.; Bakayeva, M.D.; Vodopyanov, V.V. Complexes of Soil Microscopic Fungi under Technogenic Conditions; P.C. Gilem: Ufa, Russia, 2005. (In Russian) [Google Scholar]
  67. Marfenina, O.Y. Anthropogenic Ecology of Soil Fungi; P.C. Meditsina dlya vsekh: Moscow, Russia, 2005. (In Russian) [Google Scholar]
  68. Khabibullina, F.M. Soil Mycobiota of Natural and Anthropogenically Disturbed Ecosystems in the North-East of the European Part of Russia. Ph.D. Dissertation, P.C. Komi Scientific Center (Ural Branch of the Russian Academy of Sciences), Syktyvkar, Russia, 2009. (In Russian). [Google Scholar]
  69. Korneykova, M.V.; Еvdokimova, G.A.; Lebedeva, Y.V. The complexes of potentially pathogenic microscopic fungi in anthropogenic polluted soils of Kola North. Mikol. Fitopatol. 2012, 46, 322–328. (In Russian) [Google Scholar]
  70. Bogomolova, Y.V.; Velikova, T.D.; Goryayeva, A.G.; Ivanova, A.M.; Kirtsideli, I.Y.; Lebedeva, Y.V.; Mamayeva, N.Y.; Panina, L.K.; Popikhina, Y.A.; Smolyanitskaya, O.L.; et al. Microfungi in the Air of Saint Petersburg; P.C. Khimizdat: Saint Peterburg, Russia, 2012. (In Russian) [Google Scholar]
  71. Novikov, A.I.; Shirokaya, A.A.; Drogobuzhskaya, S.V.; Gaponenkov, I.A. Elemental analysis of suspended atmospheric particles in the city by inductively coupled plasma atomic emission spectrometry. In Arkticheskiye Issledovaniya: Ot Ekstensivnogo Osvoyeniya k Kompleksnomu Razvitiyu [Arctic Research: From Extensive Development to Integrated Development]: Materialy II Mezhdunarodnoy Nauchno-Prakticheskoy Konferentsii; Publishing Center A3 +: Arkhangelsk, Russia, 2020; pp. 391–395. (In Russian) [Google Scholar]
  72. Xie, W.-Y.; Su, J.-Q.; Zhu, Y.-G. Arsenite Oxidation by the Phyllosphere Bacterial Community Associated withWolffia australiana. Environ. Sci. Technol. 2014, 48, 9668–9674. [Google Scholar] [CrossRef] [PubMed]
  73. Sangthong, S.; Suksabye, P.; Thiravetyan, P. Air-borne xylene degradation by Bougainvillea buttiana and the role of epiphytic bacteria in the degradation. Ecotoxicol. Environ. Saf. 2016, 126, 273–280. [Google Scholar] [CrossRef]
  74. Gilbert, K.J.; Renner, T. Acid or base? How do plants regulate the ecology of their phylloplane? AoB Plants 2021, 13, plab032. [Google Scholar] [CrossRef]
  75. Xiao, L.; Yu, Z.; Liu, H.; Tan, T.; Yao, J.; Zhang, Y.; Wu, J. Effects of Cd and Pb on diversity of microbial community and enzyme activity in soil. Ecotoxicology 2020, 29, 551–558. [Google Scholar] [CrossRef]
  76. Mourato, M.; Pinto, F.; Moreira, I.; Sales, J.; Leitão, I.; Martins, L.L. The effect of Cd stress in mineral nutrient uptake in plants. In Cadmium Toxicity and Tolerance in Plants; Academic Press: Cambridge, MA, USA, 2019; pp. 327–348. [Google Scholar] [CrossRef]
  77. Fan, D.; Sun, J.; Liu, C.; Wang, S.; Han, J.; Agathokleous, E.; Zhu, Y. Measurement and modeling of hormesis in soil bacteria and fungi under single and combined treatments of Cd and Pb. Sci. Total Environ. 2021, 783, 147494. [Google Scholar] [CrossRef] [PubMed]
  78. Marfenina, O.Y.; Fomicheva, G.M. Potentially pathogenic filamentous fungi in the human environment. Modern tendencies. In Mikologiya Segodnya; Dyakov, Y.T., Sergeyev, Y.V., Eds.; Natsionalnaya akademiya: Moscow, Russia, 2007; pp. 235–266. (In Russian) [Google Scholar]
  79. Nagaki, M.; Narita, T.; Ichikawa, H.; Kawakami, J.; Nakane, A. Antibacterial and antifungal activities of isoprenoids. Trans. Mater. Res. Soc. Jpn. 2011, 36, 55–58. [Google Scholar] [CrossRef] [Green Version]
  80. Kurkina, Y.; Esina, E.; Barskova, A. Phytoncidal activity of essential oils of medicinal plants to some strains of mold fungi. J. Agric. Environ. 2020, 1, 1–4. [Google Scholar] [CrossRef]
  81. Hui, N.; Jumpponen, A.; Francini, G.; Kotze, D.J.; Liu, X.; Romantschuk, M.; Strömmer, R.; Setälä, H. Soil microbial communities are shaped by vegetation type and park age in cities under cold climate. Environ. Microbiol. 2017, 19, 1281–1295. [Google Scholar] [CrossRef] [PubMed]
  82. Resolution of 09.11.1999 No. 1018 On Approval of the Rules for the Sanitary Maintenance of Territories, the Organization of Cleaning and Ensuring Cleanliness and Right in Moscow (as Amended on 2 February 2017); The Government of Moscow: Moscow, Russia, 1999. (In Russian)
  83. Zelenskaya, M.S.; Sidelnikova, M.V.; Panova, Y.G.; Pautov, A.A.; Krylova, E.G.; Pagoda, Y.O.; Vlasov, D.Y. Phylloplane fungi in the urban environment. Biosfera 2017, 9, 136–151. (In Russian) [Google Scholar]
  84. Carlile, M.J.; Watkinson, S.C.; Gooday, G.W. The Fungi, 2nd ed.; Academic Press: San Diego, CA, USA; San Francisco, CA, USA; New York, NY, USA; Boston, MA, USA, 2001. [Google Scholar]
Figure 1. Meteorological conditions in Moscow (a) and Murmansk (b) two weeks prior to the sampling. Numbers above the lines are the average values for each of the parameter for the considered period, in case of precipitation—the sum of the precipitations.
Atmosphere 12 01471 g001
Figure 2. Concentration of potentially toxic elements (PTE) typical for the urban areas—(a) Fe, Al, Ti, Mn, Zn, Cu; and (b) V, Ni, Cr, Pb, Co in leaf dust in Moscow (MSC) and Murmansk (MUR) in recreational (RC), residential (RS), and traffic (TR) zones.
Atmosphere 12 01471 g002
Figure 3. The ratio of the element content (ppm) in traffic and residential zones to their content in recreational zone: (a) Moscow and (b) Murmansk.
Atmosphere 12 01471 g003
Figure 4. Content of potentially toxic elements (PTE)—(a) Fe, Al, Ti, Mn, Zn, Cu; and (b) V, Ni, Cr, Pb, Co in leaf dust in Moscow (MSC) and Murmansk (MUR) in recreational (RC), residential (RS), and traffic (TR) zones.
Atmosphere 12 01471 g004
Figure 5. The ratio of the element content (µg∙m−2) in traffic and residential zones to their content in recreational zone in (a) Moscow, (b) Murmansk.
Atmosphere 12 01471 g005
Figure 6. The number of airborne fungi (a), fungi in leaves surface (b), and in road dust (c) in different functional zones of Moscow: TR—traffic zone, RS—residential zone, RC—recreational zone.
Atmosphere 12 01471 g006
Figure 7. Diversity of fungi in the air (A), in leaf surface (L), and in road dust (R) in different functional zones in Moscow. TR—traffic zone, RS—residential zone, RC—recreational zone. Each bar is the sum of all species found in three replicated plots of each zone.
Atmosphere 12 01471 g007
Figure 8. The portion of fungi of different pathogenicity groups in the air (A), in leaf surface (L) and in road dust (R) in different functional zones in Moscow. TR—traffic zone, RS—residential zone, RC—recreational zone.
Atmosphere 12 01471 g008
Figure 9. The number of airborne fungi (a), fungi in leaves surface (b), and in road dust (c) in different functional zones in Murmansk. TR—traffic zone, RS—residential zone, RC—recreational zone.
Atmosphere 12 01471 g009
Figure 10. Diversity of fungi in the air (A), in leaves surface (L), and in road dust (R) in different functional zones in Murmansk: TR—traffic zone, RS—residential zone, RC—recreational zone. Each bar is the sum of all species found in three replicated plots of each zone.
Atmosphere 12 01471 g010
Figure 11. The portion of fungi of different pathogenicity groups in the air (A), in leaf surface (L), and in road dust (R) in different functional zones in Murmansk: TR—traffic zone, RS—residential zone, RC—recreational zone.
Atmosphere 12 01471 g011
Figure 12. Dendrogram of the fungal species composition similarity in different functional zones of Moscow and Murmansk. X—options; MSC—Moscow; MUR—Murmansk; A—air; L—leaf dust; R—road dust; TR—transport area, RS—residential area, RC—recreational area. Y: distance between options based on the Sørensen–Chekanovsky coefficient.
Atmosphere 12 01471 g012
Table 1. Sites description in Murmansk and Moscow.
IndexTrafficResidentialRecreational
Murmansk
Coordinates68°57′36.0″ N 33°03′50.1″ E68°58′44.2″ N 33°05′36.8″ E68°57′36.0″ N 33°03′50.1″ E
DescriptionCrossing major highways;
Proximity of the railway track;
Proximity of a combined heat and power plant running on heavy fuel oil
Inter-house territory;
Road transport—parking, carriageway;
Houses: 5-storey, 2-storey
The territory of the ski sports complex with a closed passage for motor transport;
Remoteness from major highways
Location of treesProtective strip between the highway and the pedestrian sidewalkHouse greeningBackground forest
Dominating tree speciesBetula pubescens Ehrh.
Sorbus aucuparia L.
Betula pubescens Ehrh.
Populus tremula L.
Sorbus aucuparia L.
Betula pubescens Ehrh.
Salix spp.
Moscow
Coordinates55°71′86.5″ N, 37°57′01.4″ E55°71′54.4″ N, 37°60′70.2″ E55°70′93.0″ N 37°52′82.0″ E
Description- Crossing major highways;
-Proximity of fuel stations
- Inter-house territory;
- Road transport—parking, carriageway;
- Houses: 4-storey
- Territories close to the university botanical garden
- Remoteness from major highways
Location of treesProtective strip between the highway and the pedestrian sidewalkHouse greeningUrban park area
Dominating tree speciesBetula pendula Roth.
Betula pubescens Ehrh
Acer platanoides L.
Tilia cordata Mill.
Picea abies L.
Betula pendula Roth
Betula pubescens Ehrh.
Acer platanoides L.
Acer negundo L.
Tilia cordata Mill.
Picea abies L.
Betula pendula Roth
Betula pubescens Ehrh.
Malus sylvestris
Acer platanoides L.
Acer negundo L.
Picea abies L.
Table 2. Taxonomic diversity and abundance (%) of opportunistic fungi.
SpeciesMoscowMurmansk
AirLeavesRoadAirLeavesRoad
TRRSRCTRRSRCTRRSRCTRRSRCTRRSRCTRRS
Ascomycota Pezizomycotina Dothideomycetes Dothideomycetidae Dothideales Saccotheciaceae
Aureobasidium melanogenum (Herm.–Nijh.) Zalar, Gostinčar, and Gunde–Cim. 24
A. pullulans (de Bary and Löwenthal) G. Arnaud 87632351185222 2
Pleosporomycetidae Pleosporales Pleosporaceae
Alternaria atra (Preuss) Woudenb. and Crous 8
A. tenuissima (Kunze) Wiltshire25734<1
Eurotiomycetes Eurotiomycetidae Eurotiales Aspergillaceae
Aspergillus candidus Link 37
A. flavipes (Bainier and R. Sartory) Thom and Church 4
A. flavus Link<15 282377 2 71312 2
A. fumigatus Fresen. 21 <1211141132 4 42
A. niger Tiegh. 16 13117236 42
A. terreus Thom 2
A. versicolor (Vuill.) Tirab. 1
Paecilomyces variotii Bainier 1 1 334
Penicillium aurantiogriseum Dierckx 1 11
P. chrysogenum Thom 14 1
P. expansum Link <1
P. griseofulvum Dierckx <1 1
P. sp 32 26
P. spinulosum Thom 17 2
Talaromyces helicus (Raper and Fennell) C.R. Benj. <1 2 6 1245
T. purpureogenus Samson, N. Yilmaz, Houbraken, Spierenb., Seifert, Peterson, Varga, and Frisvad 3 2 5
T. rugulosus (Thom) Samson, N. Yilmaz, Frisvad, and Seifert 4 1
Sordariomycetes Hypocreomycetidae Hypocreales Hypocreaceae
Trichoderma aureoviride Rifai 1 8
T. glaucum E.V. Abbott 15
T. koningii Oudem.221 2210296 22
T. viride Pers. <1<18 5
Nectriaceae
Fusarium sp. 2 12
Microascales Microascaceae
Scopulariopsis candida Vuill. 162518
Saccharomycotina Saccharomycetes Saccharomycetidae Saccharomycetales Incertae sedis
Hyphopichia burtonii (Boidin, Pignal, Lehodey, Vey & Abadie) Arx and Van der Walt 1 11
Mucoromycota Mucoromycotina Mucoromycetes Incertae sedis Mucorales Mucoraceae
Mucor hiemalis Wehmer 7
Rhizopodaceae
Rhizopus stolonifer (Ehrenb.) Vuill.1141 2 1
Note: bold—dominant species.
Table 3. Correlation coefficient between chemical dust characteristics and biological parameters. Concentration of elements is expressed in µg g−2 of dust. Significant correlations are marked with color: Blue corresponds to negative correlation and red to positive. Numbers refer to r value.
Element Concentration µg g−1
Subsrate ParametersDust WeightN. of ElementsWeight of ElementsLiBeBCrFeCoNiCuZnGaRbSrYZrNbMoCdSnSbCsBaLanthanideHfWPbThUTiVMnNaMgAlSiKCa
AirQuantity total 0.5 0.60.6 0.60.60.5 0.60.6 0.50.5 0.60.6 0.50.5
Quantity opportunistic 0.60.6 0.60.60.60.60.60.6 0.70.70.70.6 0.5 0.60.6 0.60.6 0.60.6 0.60.7 0.5
Species richness 0.5
Fraction BSL-2
Fraction BSL-1 0.5 0.6 0.6 0.6
LeavesQuantity total
Quantity opportunistic
Species richness 0.5 0.5 0.5 0.5
Fraction BSL-2 0.5
Fraction BSL-1
Road Quantity total 0.70.6 0.60.50.60.50.60.50.50.60.70.60.60.6 0.6 0.60.6 0.60.60.6 0.60.6 0.60.60.6
Quantity opportunistic 0.6 0.60.5 0.5 0.5 0.5 0.5 0.5
Species richness 0.6 0.6 0.5 0.6 0.6 0.6 0.5 0.6 0.50.6
Fraction BSL-2 0.6 0.5 0.50.5 0.50.50.60.6 0.6 0.50.6 0.60.60.6 0.50.6 0.50.5
Fraction BSL-1 0.7
Table 4. Correlation coefficient between chemical dust characteristics and biological parameters. Content of elements is expressed in µg m−2 of leaf surface. Significant correlations are marked with color: Blue corresponds to negative correlation and red to positive. Numbers refer to r value.
Element Concentration µg m−2
Subsrate ParametersDust WeightN. of ElementsWeight of ElementsLiBeBCrFeCoNiCuZnGaRbSrYZrNbMoCdSnSbCsBaLanthanideHfWPbThUTiVMnNaMgAlSiKCa
AirQuantity total
Quantity opportunistic 0.6 0.60.50.60.50.5 0.5 0.6 0.5 0.5
Species richness 0.5
Fraction BSL-2
Fraction BSL-1 0.6 0.6 0.6 0.70.7 0.6 0.6
LeavesQuantity total
Quantity opportunistic
Species richness
Fraction BSL-2
Fraction BSL-1
Road Quantity total 0.7 0.60.60.60.5 0.7 0.6 0.5 0.5 0.5 0.6 0.5
Quantity opportunistic 0.6 0.5 0.5 0.6
Species richness 0.60.60.7 0.60.60.60.60.5 0.70.60.70.6 0.7 0.60.60.7 0.70.60.6 0.60.7 0.60.6
Fraction BSL-2 0.6 0.5 0.50.5 0.5 0.60.60.50.6 0.50.6 0.60.60.6 0.50.6 0.60.50.5
Fraction BSL-1 0.7
Publisher’s Note: MDPI stays neutral with regard to jurisdictional claims in published maps and institutional affiliations.

