Article

Evaluation of Areal Monthly Average Precipitation Estimates from MERRA2 and ERA5 Reanalysis in a Colombian Caribbean Basin

by
Jean Vega-Durán
1,
Brigitte Escalante-Castro
1,
Fausto A. Canales
1,*,
Guillermo J. Acuña
2,3 and
Bartosz Kaźmierczak
4,*
1
Department of Civil and Environmental, Universidad de la Costa, Calle 58 #55-66, Barranquilla 080002, Colombia
2
Department of Civil and Environmental Engineering, Instituto de Estudios Hidráulicos y Ambientales, Universidad del Norte, Km. 5 Vía Puerto Colombia, Barranquilla 081007, Colombia
3
Facultad de Ingeniería Sanitaria y Ambiental, Universidad Pontificia Bolivariana, Cra. 6 #97A-99, Montería 230002, Colombia
4
Department of Water Supply and Sewerage Systems, Faculty of Environmental Engineering, Wroclaw University of Science and Technology, 50-370 Wroclaw, Poland
*
Authors to whom correspondence should be addressed.
Atmosphere 2021, 12(11), 1430; https://doi.org/10.3390/atmos12111430
Submission received: 17 September 2021 / Revised: 25 October 2021 / Accepted: 27 October 2021 / Published: 29 October 2021
(This article belongs to the Special Issue Extreme Hydro-Climate Events: Past, Present, and Future)

Abstract

:
Global reanalysis dataset estimations of climate variables constitute an alternative for overcoming data scarcity associated with sparsely and unevenly distributed hydrometeorological networks often found in developing countries. However, reanalysis datasets require detailed validation to determine their accuracy and reliability. This paper evaluates the performance of MERRA2 and ERA5 regarding their monthly rainfall products, comparing their areal precipitation averages with estimates based on ground measurement records from 49 rain gauges managed by the Institute of Hydrology, Meteorology, and Environmental Studies (IDEAM) and the Thiessen polygons method in the Sinu River basin, Colombia. The performance metrics employed in this research are the correlation coefficient, the bias, the normalized root mean square error (NRMSE), and the Nash–Sutcliffe efficiency (NSE). The results show that ERA5 generally outperforms MERRA2 in the study area. However, both reanalyses consistently overestimate the monthly averages calculated from IDEAM records at all time and spatial scales. The negative NSE values indicate that historical monthly averages from IDEAM records are better predictors than both MERRA2 and ERA5 rainfall products.

1. Introduction

Appropriate knowledge of the rainfall regime in a watershed is a determining factor in quantifying and adequately managing the water resources available for irrigation of crops, domestic consumption, industrial uses, environmental flows, and planning actions to control or minimize the impact of floods, and erosive processes. Because of its ability to produce surface runoff and recharge groundwater, rainfall is likely the most critical variable in hydrological studies [1]. Reliable and spatially well-distributed hydrological information covering an extended period is fundamental for adequate water resource management, accurate modeling, and effective planning related to variability and climate change [2,3,4]. Usually, the most precise source of reliable precipitation records corresponds to the rain gauges [5]; however, in large parts of the world, especially in developing countries, hydrometeorological networks rarely follow the standards of the World Meteorological Organization (WMO) [6], and systematic or human-made errors might affect them. Therefore, correctly operated rainfall gauges are usually scarce and scattered over vast areas [7,8]. Additionally, records commonly present significant gaps, and the maintenance of the stations is an expensive and onerous enterprise that is proportional to the network’s size [9,10].
Estimations from satellite data and reanalysis datasets are low-cost alternatives to overcome this absence of data, both of which have advantages and limitations. The scientific literature shows no clear consensus on the usability of the reanalysis and the satellite datasets, as their accuracy varies depending on specific products, location, and variables under analysis [11,12]. Their principal shared advantage is their extensive spatial coverage and temporal resolution. Satellite data can provide intra-hourly resolution, and besides the sensor characteristics, their data acquisition and accuracy depend on atmospheric conditions and technical issues [10]. The satellite data gathering and processing procedures are in constant evolution to solve these shortcomings, as they are particularly relevant regarding estimations in complex terrains, coastlines, high latitudes, and the capturing of precipitation extremes, which is crucial for flood management [5,13].
On the other hand, reanalysis data combine multiple sources to generate constant data assimilation schemes and models that produce consistent time series (usually in map form) of numerous essential climate variables at once [14,15,16]. The previously mentioned spatiotemporal resolution has allowed reanalysis datasets to be considered a proxy to ground measurements in hydrological and atmospheric modeling [11,16,17,18], and even a direct data source for renewable energy research [19,20,21,22]. Still, they require calibration to assess their accuracy and to obtain meaningful time series [13,15].
In Colombia, gridded products from satellite estimations dominate studies dealing with indirect precipitation measurements. For instance, the Climate Hazards Group InfraRed Precipitation with Stations data version 2.0 (CHIRPS v2.0), developed by the University of California in Santa Barbara and the American Geological Service [23,24], has been employed to evaluate rainfall patterns in different Colombian regions [25,26,27,28]. This choice was justified because the CHIRPS v2.0 dataset utilized information from 338 IDEAM (Institute of Hydrology, Meteorology, and Environmental Studies) rainfall stations to calibrate their estimations, resulting in high correlation values (R = 0.97) and a moderate mean average error (MAE = 38 mm) [29].
In contrast, reanalysis precipitation products remain relatively unexplored in studies related to Colombian watersheds. A Scopus document search with the query string (TITLE-ABS-KEY(reanalysis Colombia)) AND (rainfall OR precipitation) showed only a total of 24 results in August 2021. This paper assesses the performance of two reanalysis rainfall products in a river basin in the Colombian Caribbean. The choice of the dataset was based on this paper’s corresponding authors’ research interests and previous publications [19,21,30,31,32], including the ERA5 reanalysis from the European Center for Medium-Range Weather Forecasts (ECMWF) [33], and the Modern-Era Retrospective Analysis for Research and Applications, Version (MERRA2), with the latter being produced by NASA’s Global Modeling and Assimilation Office (GMAO) [34]. Other authors have also simultaneously included MERRA2 and ERA5 in performance evaluations of indirect rainfall estimations in similar studies across the world [35,36,37,38].
The current research interest in verifying the validity and accuracy of reanalysis datasets is associated with their relative novelty, cost-effectiveness, and potential to manage uncertainty and understand better hydrometeorological variables. With this background, this paper aims to answer the following research question: Do the MERRA2 and ERA5 global reanalysis datasets reproduce the spatially distributed monthly average rainfall estimations found through Thiessen polygons in the Sinu River basin, Colombia? To answer this question, and based on similar previous studies in other regions of the world [8,17,39,40,41], we will use the correlation coefficient, the bias, the normalized root mean square error (NRMSE), and the Nash–Sutcliffe efficiency (NSE) as performance metrics in this assessment. The results provide insights into the potential of these two reanalyses for hydrologic modeling or climatological studies.

2. Materials and Methods
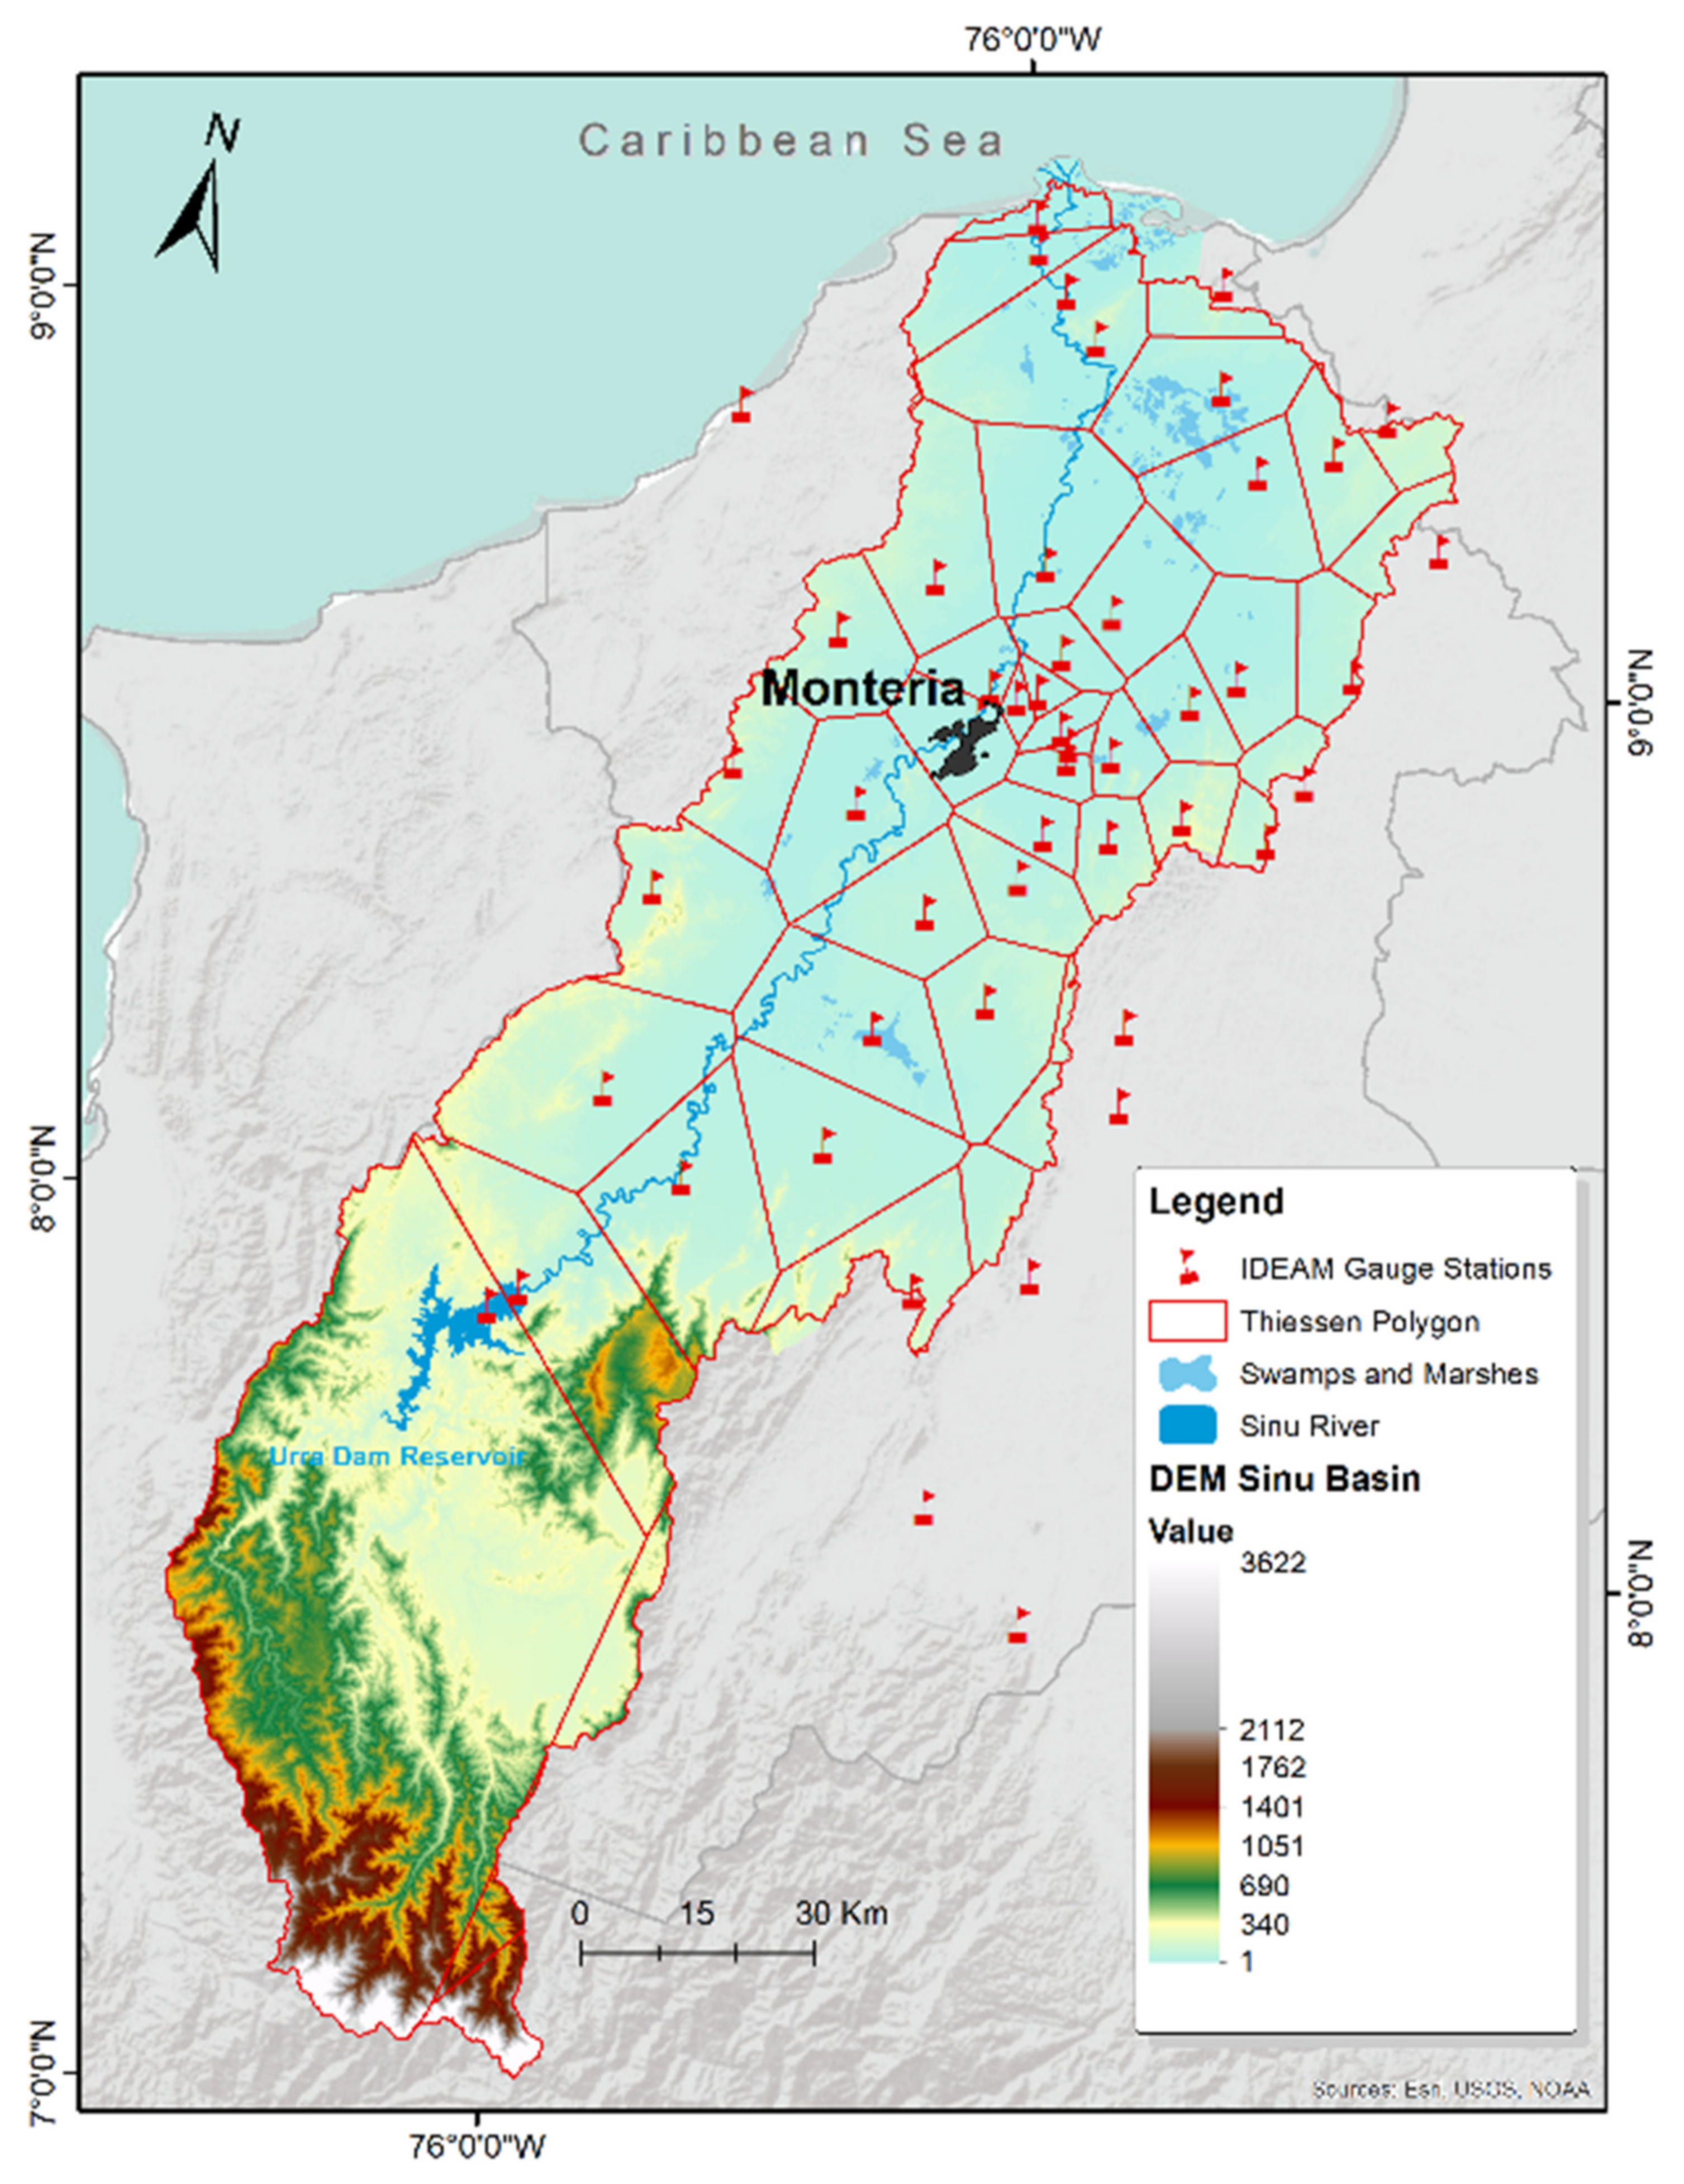
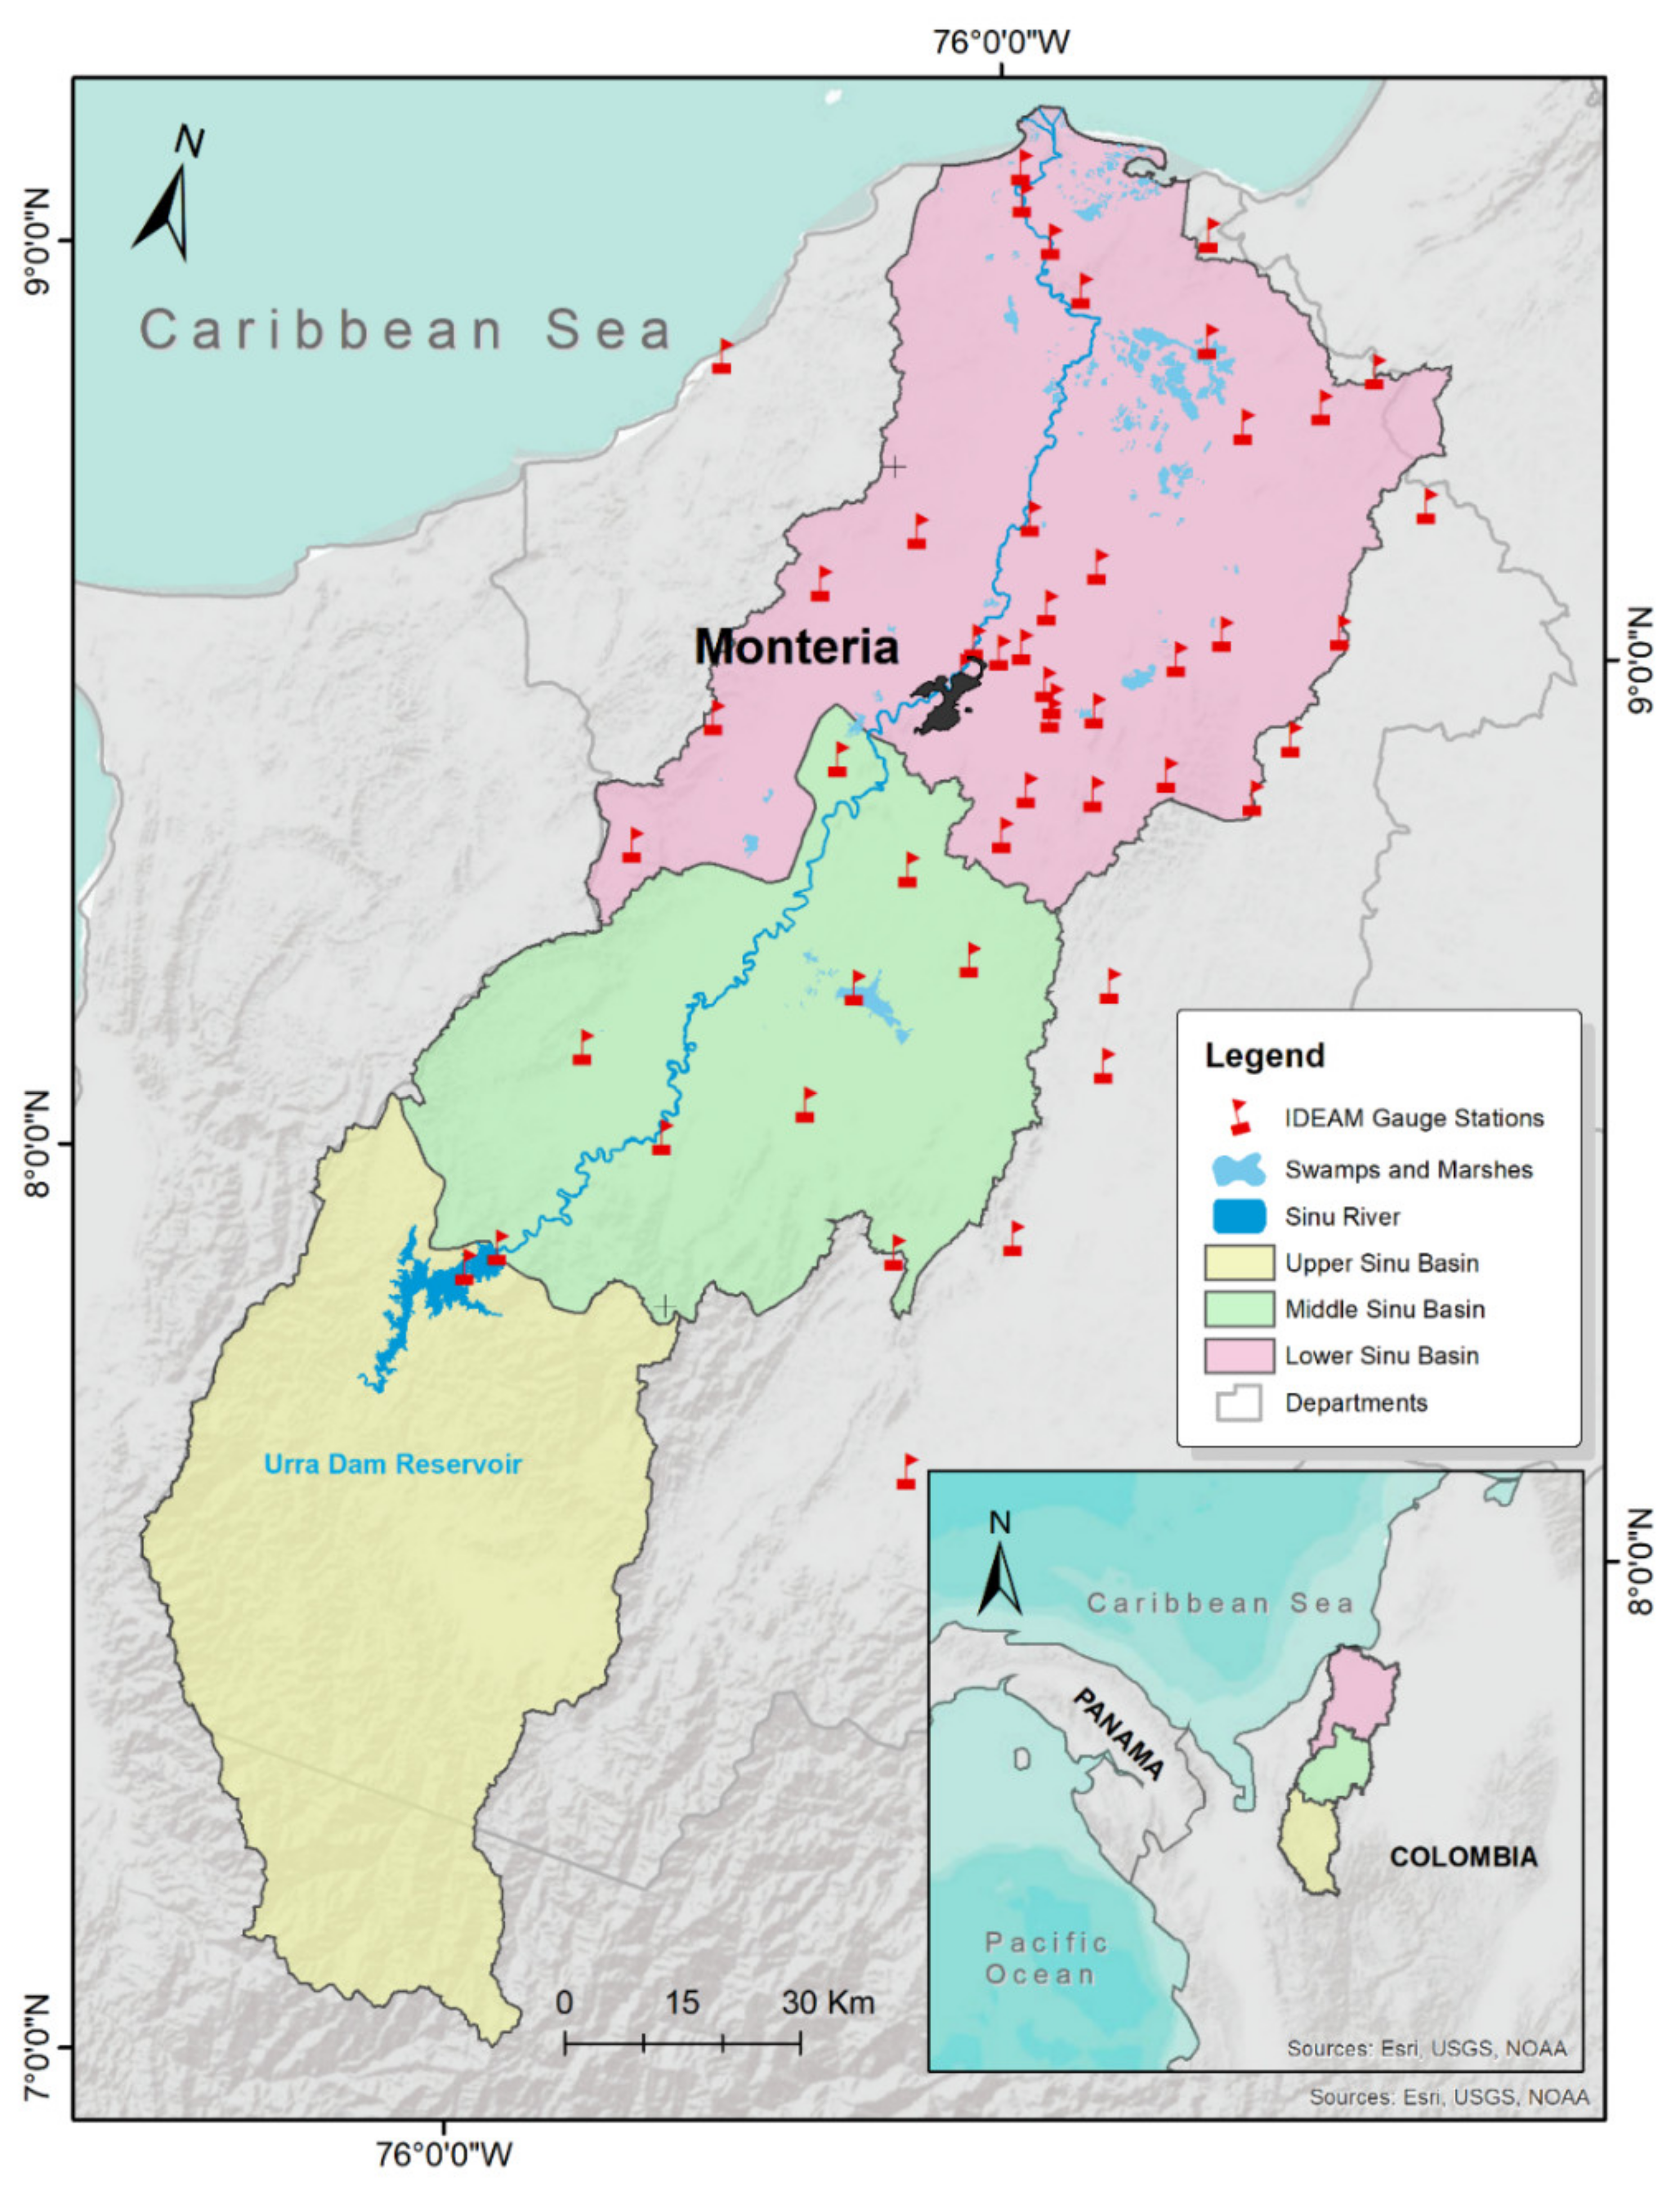
2.1. Study Area

Located in the northwestern part of Colombia, as shown in Figure 1, the Sinu River basin covers approximately 13,950 km2, extending between coordinates 7°05′ N and 9°30′ N and between 75°15′ W and 76°35′ W [42]. Having a south to north direction and being about 438 km long, the Sinu river has its source in the Paramillo Massif and is the third most important river out of those discharging in the Colombian Caribbean [43]. It is the primary water system in the Cordoba Department, and the annual flooding of its valley is essential for agricultural and livestock activities in one of the most fertile regions in Colombia [44].
Based on its physical and biotic characteristics, the Autonomous Regional Corporation of the Valleys of Sinú and San Jorge (CVS) considers the watershed divided into three subbasins: Upper, Middle, and Lower Sinú [43]. According to official maps, about 33% of the watershed area corresponds to the Upper Sinu, 28% to the Middle Sinu, and 39% to the Lower Sinu [45,46,47]. The Urrá hydropower dam defines the Upper Sinú subbasin, which has a reservoir covering an area of 74 km2, capable of providing approximately 4% of Colombia’s total annual electricity demands. This subbasin also includes a significant portion (~83%) of the 4600 km2 of the Paramillo National Natural Park and is the home of the indigenous Embera-Katio community. This isolated area is characterized by low government presence and investment; subsistence-level agriculture; extreme poverty; and ethnic, social, and political conflicts [48]. The Middle Sinú subbasin begins downstream of the Urrá dam and extends up to the proximities of the town of San Pelayo and part of Monteria, the capital city of the Córdoba Department. Besides extensive swamps and marshes, the Lower Sinú subbasin presents relatively fertile soils of alluvial origin, primarily used for agriculture and livestock [44]. This subbasin also includes Monteria’s metropolitan area.
As in most of the country, the precipitation regime in the Sinu River basin follows a unimodal distribution, with a dry season between December and March and a rainy season extending from April to November, with the latter accounting for more than 80% of the total annual rainfall [42]. A short dry period called “Veranillo de San Juan” occurs between July and August in the Colombian Caribbean. This midsummer drought is characterized by an increase in the northeast trade winds, which temporarily reduces rainfall [49], and its effects are likely influenced by the warm east Pacific waters and low-level jets at 15° N over the Caribbean [50]. In the Lower and Middle Sinú, the average annual precipitation ranges between 1000 mm/year and 2000 mm/year, with temperatures above 24 °C over the year. In the Upper Sinú, rainfall variates between 2000 mm/year and 4000 mm/year [51], with temperatures between 6 °C and 24 °C, increasing from the highest part of the basin to the area of the Urrá dam [43].
The Cordoba Department has been a conflict zone since the 1950s, suffering from the presence of illegal armed groups, including the Revolutionary Armed Forces of Colombia (FARC) and the People’s Liberation Army (EPL). Even with peace agreements and demobilization processes, criminal bands still operate in the area, aiming to control the zone and its cocaine production and distributions routes [52]. This situation interferes with new investments and the optimal management of the hydrometeorological network in the department, especially in the Upper Sinu. As previously mentioned, this basin region includes the Urrá hydropower dam and a large portion of the Paramillo National Natural Park, both significant landmarks of the country and heavily dependent on the available water resources and precipitation patterns in the watershed.

2.2. Datasets

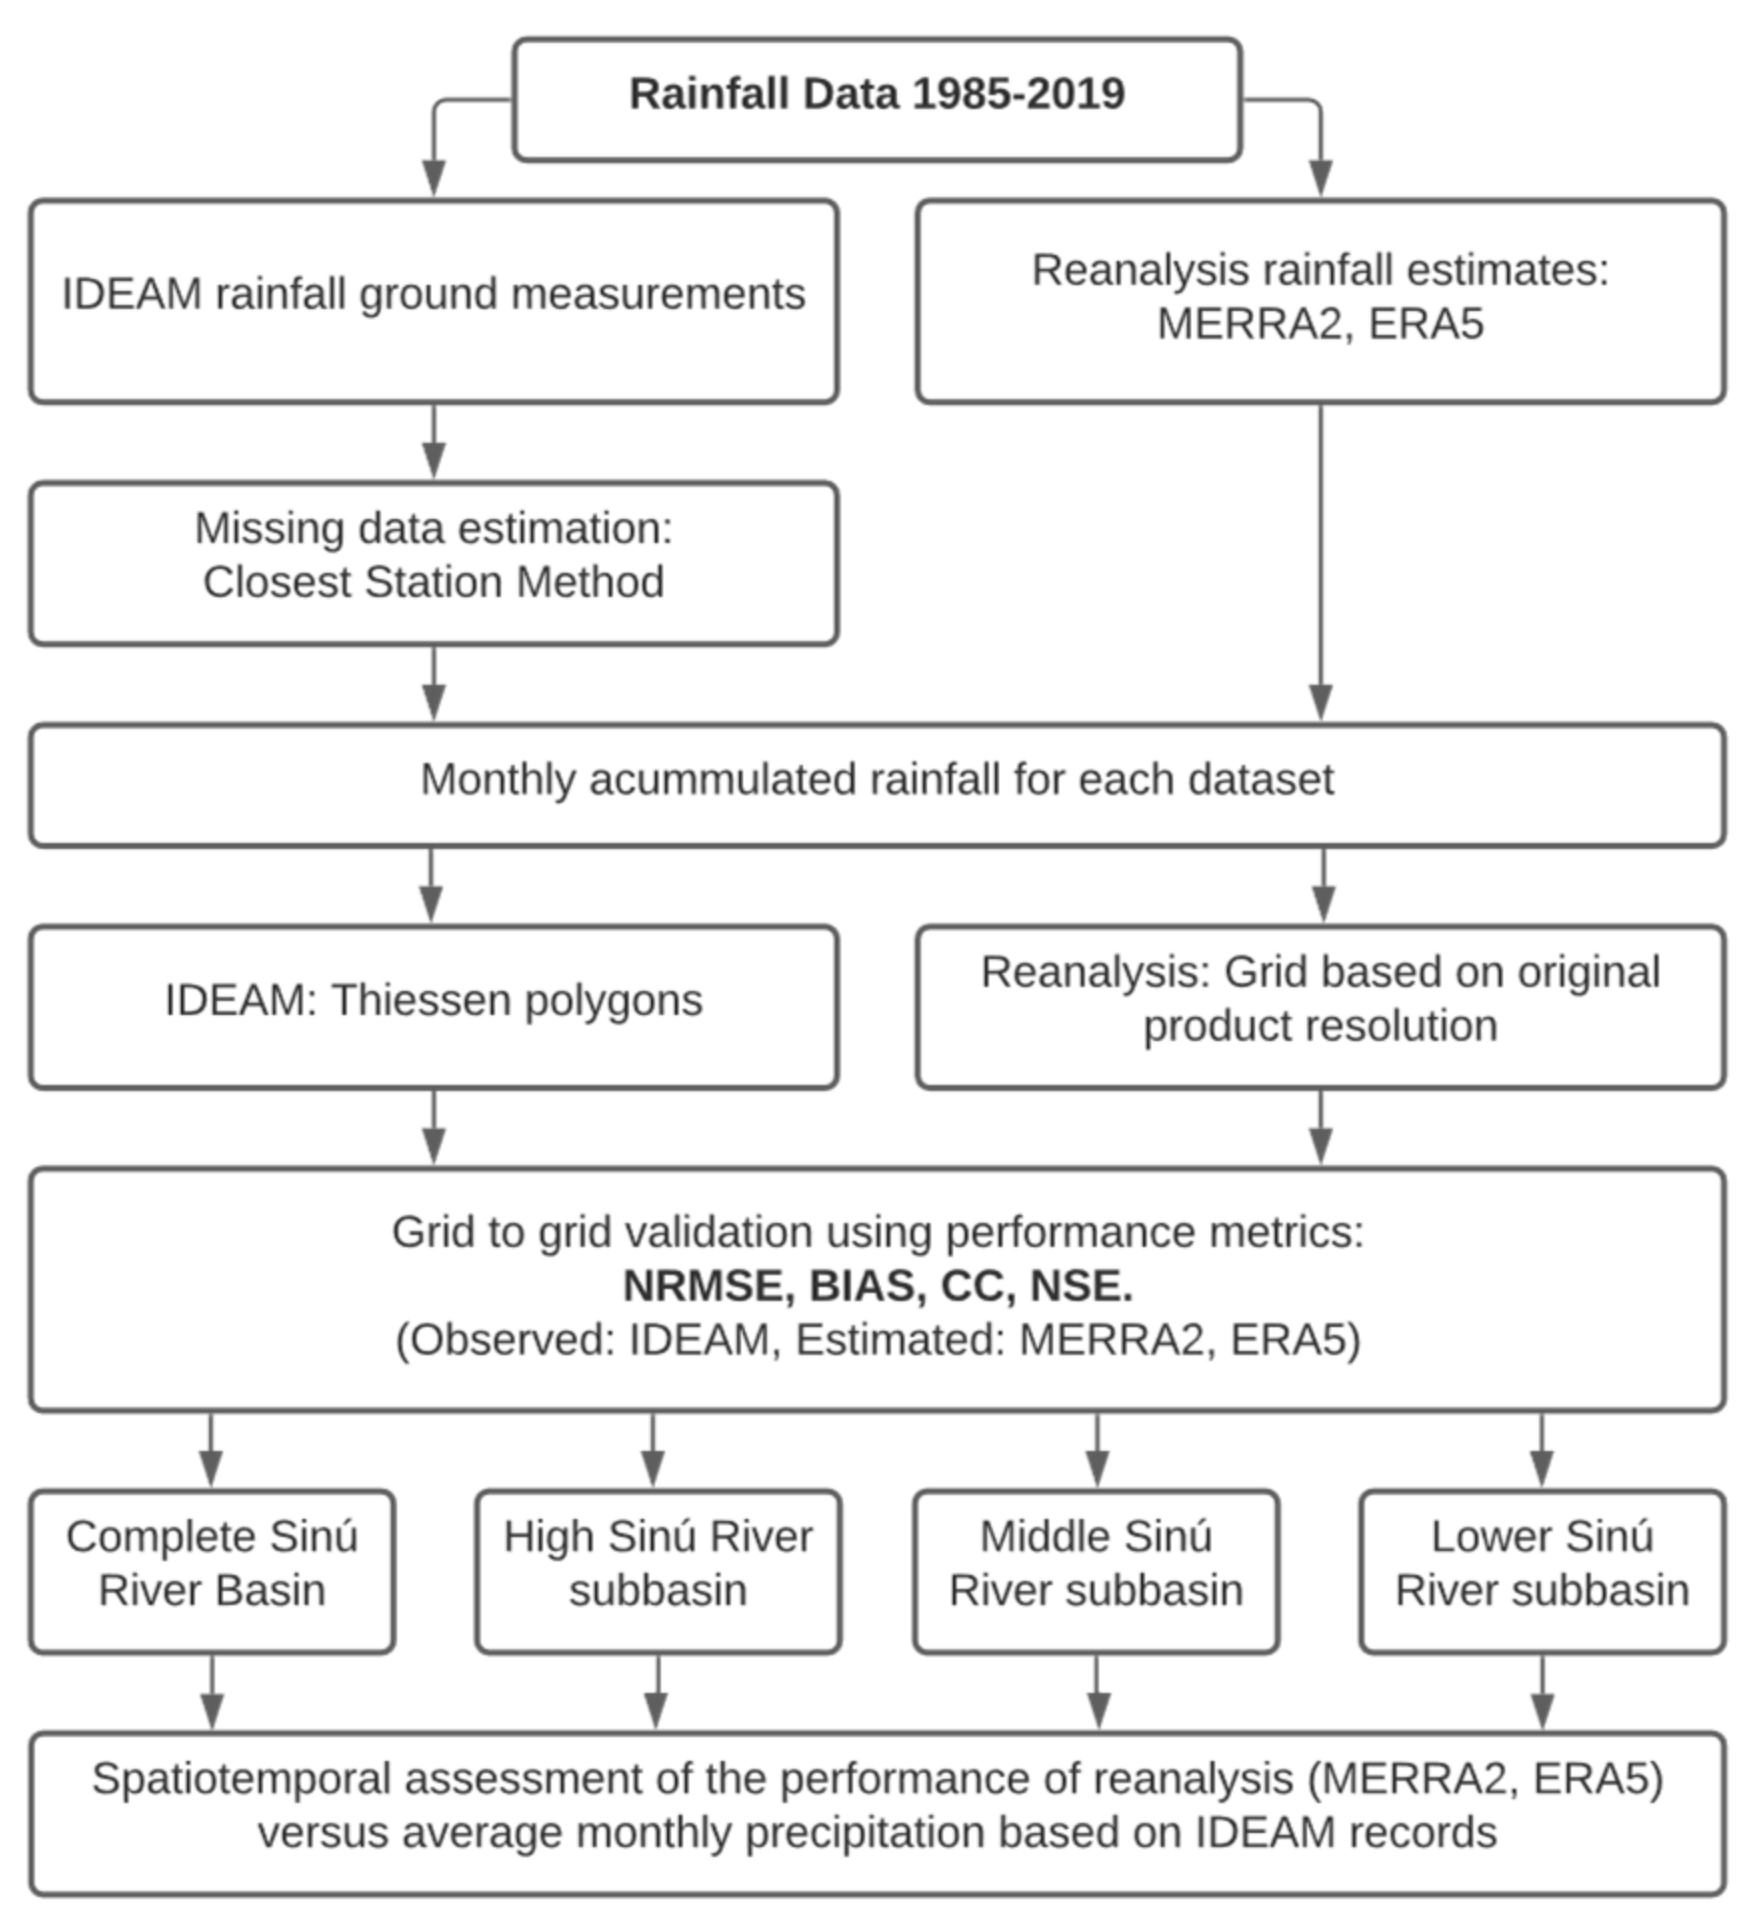
2.2.1. Observed Rainfall

The observed rainfall for this study corresponds to a set of available daily precipitation time series over the period between 1985 and 2019, registered at 49 hydrometeorological stations in the Sinu River basin and its proximities. This information is freely available at the IDEAM [53], the institution responsible for administering and supervising the Colombian hydrometeorological network and the quality of its records [54]. The selection of these stations followed two criteria: (1) the missing values must not exceed 10% of the time series; (2) their Thiessen polygons (or Voronoi diagrams) cover a fraction of the Sinu River basin. Appendix A presents the main characteristics of these stations (Table A1), as well as the elevation map and resulting Thiessen polygons for the Sinú River watershed (Figure A1).

2.2.2. MERRA2

Produced by NASA’s Global Modeling and Assimilation Office (GMAO), the Modern-Era Retrospective Analysis for Research and Applications, Version 2 (MERRA2), has been in operation since 2015 [55]. MERRA2 uses the Goddard Earth Observing System Version 5 (GOES-5). Similarly to its predecessor (MERRA), the reanalysis model focuses on conducting a historic climate analysis, providing estimations based on numerous satellite observations, general circulation models, and ground measurements from hydrometeorological stations across the globe to parameterize initial conditions [35,41]. Other improvements compared to MERRA include the assimilation of aerosol observations—a more accurate representation of the stratosphere, water cycle, and cryospheric processes—and minimizing biases and the occurrence of falsely detected trends [55]. The MERRA2 data are freely available on the Goddard Earth Sciences Data and Information Services Center [34]. The dataset starts in 1980, with a temporal resolution of one hour or lower, at a 0.5° × 0.625° spatial resolution [11].

2.2.3. ERA5

In March 2019, the European Center for Medium-Range Weather Forecasts (ECMWF) released the ERA5 reanalysis to replace their ERA-Interim product, one of the best performing products in hydrological studies [56,57]. ERA5 estimations are based on the Integrated Forecasting System (IFS) Cycle 41r2, and this reanalysis incorporates new input variables, such as sea surface temperature, sea ice, and aerosols, aiming at making it appropriate for climate simulation. The ERA5 data is freely available on the ECMWF website [33], with precipitation estimates from 1979 onwards, although for some meteorological variables the dataset provides information for the period since 1950 [35,56]. ERA5 has a maximum temporal resolution of one hour and a 0.25° × 0.25° spatial resolution [16].

2.3. Method

This paper conducts a performance evaluation of the two selected gridded reanalysis rainfall products against the average precipitation over the Sinú River basin estimated through tessellation based on IDEAM records for years 1985–2019. Figure 2 shows the steps followed in this research to validate the MERRA2 and ERA5 rainfall products.
First, the missing data in the IDEAM total daily precipitation time series are completed using the closest station method, which consists of multiplying the corresponding value from the nearest station by the ratio of the long-term precipitation average between the missing site value to the mean at the closest station. Then, the accumulated monthly rainfall for each IDEAM station is employed to create the Thiessen polygons [58] and the corresponding areal estimation of the average precipitation over the Sinú River watershed, using a spatial resolution of approximately 0.14 km2 per grid cell. Similarly, the gridded precipitation datasets from MERRA2 and ERA5 allow the monthly rainfall areal estimates obtained from these reanalyses to be validated, using the nearest neighbor method to create the finer grids for both datasets with minimal changes in the information. This study employs four statistical metrics to evaluate the performance of the MERRA2 and ERA 5 reanalysis datasets to match the average monthly precipitation estimations in the Sinú River basin through areal methods based on IDEAM records. These metrics are the normalized root mean square error (NRMSE), bias (BIAS), Spearman correlation coefficient (ρS), and Nash–Sutcliffe efficiency coefficient (NSE). The selection of these performance measures is based on their robustness, applicability, and recommended usage in similar research studies worldwide [8,11,17,39,59]. Over the following lines, we briefly describe these metrics and their equations, where O corresponds to observed data (IDEAM), E indicates the reanalysis dataset under comparison (MERRA2 or ERA5), and N is the available data points i = 1, 2, …, N (months).
  • NRMSE: The normalized version of the root mean square error (RMSE) in terms of the average of measured data allows datasets to be compared with different scales and provides a better idea of the reliability of the reanalysis datasets [39]. When NRMSE < 0.50, the estimations are deemed reliable. On the other hand, an NRMSE ≥ 0.50 denotes unreliable estimates for the corresponding region and season [60]. NRMSE values range from 0.00 to +∞.
    NRMSE = 1 N i = 1 N O i E i 2 O ¯   .
  • BIAS: With an optimum value of 0, this metric reflects the average tendency of the estimations datasets to overestimate (positive bias) or underestimate (negative bias) the observed data records [8,61,62].
    BIAS = i = 1 N E i O i i = 1 N O i   .  
  • ρS: The simple definition for correlation coefficients is that they are metrics that quantify the strength of the linear association between two bivariate variables—in our case, reanalysis rainfall and observed rainfall. Correlation measures the degree to which a change in one variable tends to match a shift in the other [63]. The Spearman’s rank correlation coefficient (ρS), also known as the Spearman’s Rho, can be defined as similar to the Pearson correlation (or simple correlation), although it uses the ranks instead of the actual values. This modification allows the relationship between two variables that do not follow a normal distribution or are affected by extreme values to be assessed, such as the time series employed in this research. The ρS values of −1.00, 0.00, and +1.00 indicate that reanalysis and observed rainfall are negatively, poorly, and positively correlated, respectively [39].
    ρ S = i = 1 N Rank E i Rank   E ¯ · Rank O i Rank   O ¯ i = 1 N Rank E i Rank   E ¯ 2 · i = 1 N Rank O i Rank   O ¯ 2 1 / 2 ·
  • NSE: This normalized statistic quantifies the relative magnitude of the residual variance, or mean square error, compared to the measured data variance (IDEAM observations) [61,64]. An NSE = 1 would imply a perfect match between estimates and observed rainfall. An NSE value of 0 indicates that the estimations are only as good as the mean of the observations, while negative NSE values denote a poor match between the datasets, indicating that the mean square error between measurements and estimates is higher than the mean of the measurement dataset [39,63].
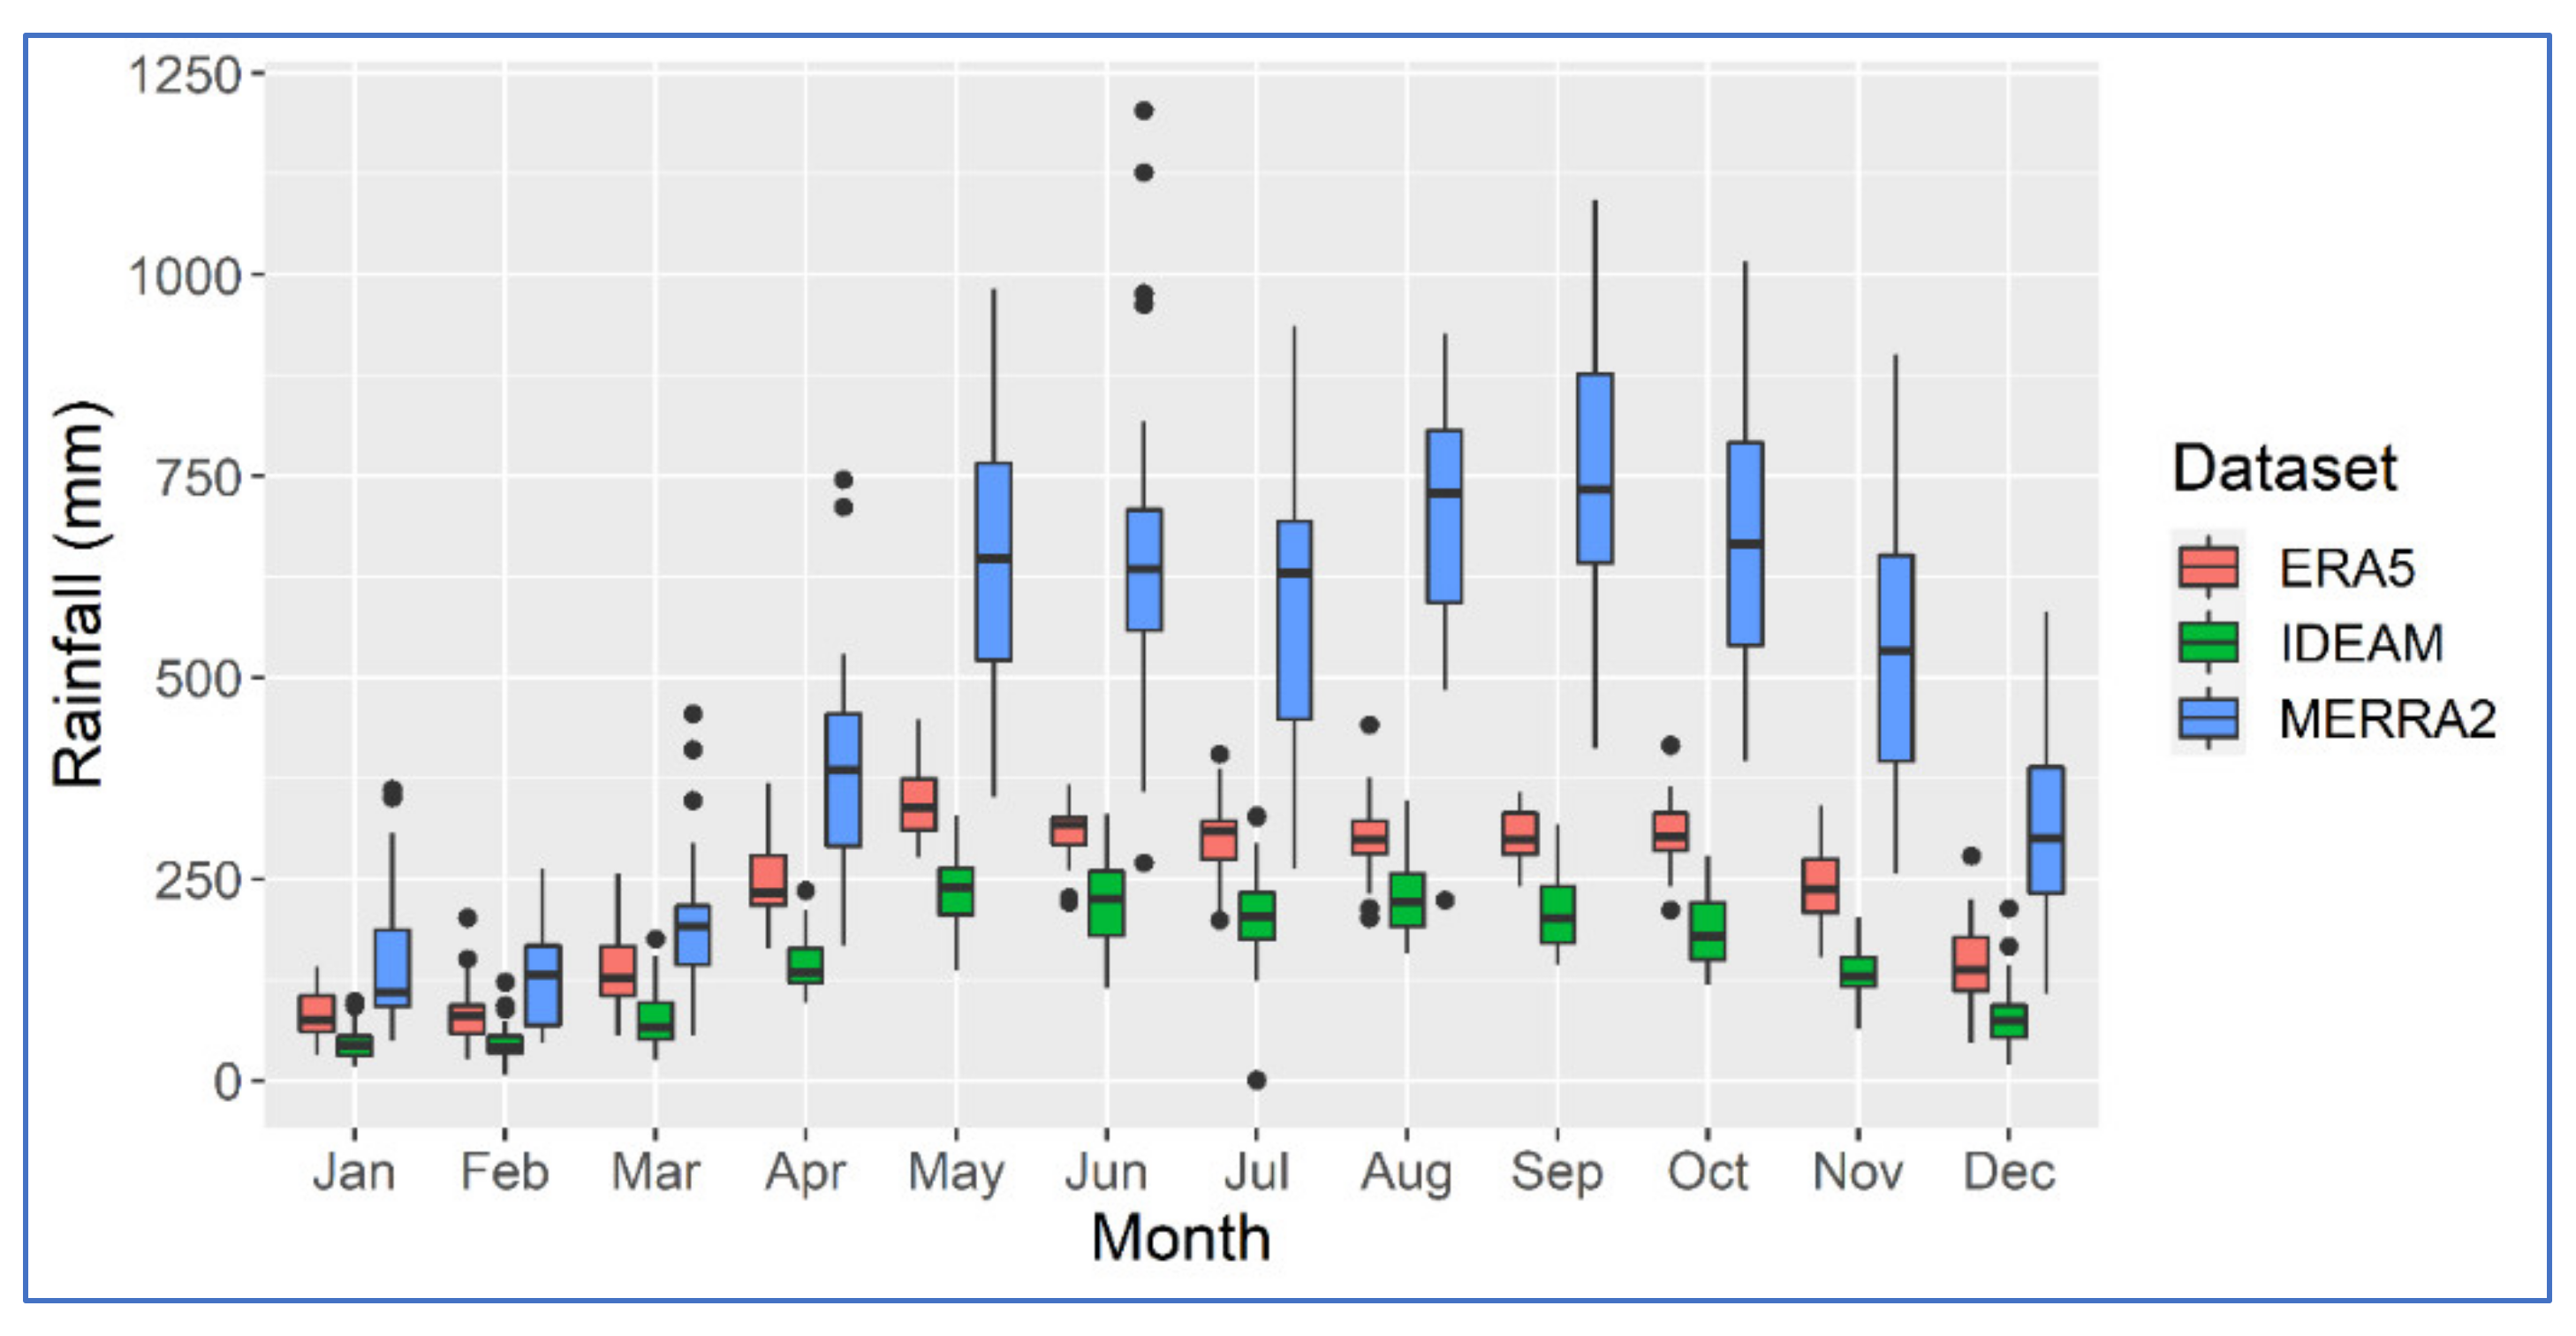
    NSE = 1 i = 1 N E i O i 2 i = 1 N O i O ¯ 2 ·
In an approach similar to Lemma et al. [39], we assess the performance of the two reanalysis datasets in the Sinú River basin for the whole area and each subbasin. This consideration will allow the performance of the metrics in these areas to be compared with different densities in terms of hydrometeorological stations (see Table A1).

3. Results

3.1. Complete Sinú River Basin

Table A1 indicates that the density of the hydrometeorological network for the whole Sinú River basin is 271 km2/station on average, with a standard deviation of 511 km2/station. This wide range is observable in Figure A1, with the Upper Sinu subbasin being the most scarce in terms of stations, a common feature in mountainous areas [8,65]. The Lower Sinú subbasin exhibits the highest density of meteorological stations.
In terms of precipitation over the 13,950 km2 of the Sinú River watershed, the estimations from the Thiessen method indicate a normally distributed regime, with an annual average of 1810 mm/y and a standard deviation of 194 mm/y. Figure 3 displays the monthly rainfall behavior for the three datasets. It shows that the two reanalysis products can follow and represent the dry and rainy seasons in the watershed, including the “Veranillo de San Juan” phenomenon around July–August, although with significant biases. Even if both datasets have their largest bias in November, the results in Table 1 reveal that biases and NRMSE values of ERA5 and MERRA2 compared to IDEAM are opposed; ERA5 tends toward higher overestimations during the dry season, while MERRA2 exhibits higher values of these two performance metrics mainly during the rainy season. For all the subbasins and time scales (individual months, total annual, and the complete time series between 1985 and 2019), the negative NSE values suggest that the averages from IDEAM are closer to the IDEAM values than the reanalysis estimations [63].
The match between interannual variability results indicate moderate correlation (ρS in Table 1) for the complete 1985–2019 time series (see Figure 4), even if this does not translate to the individual months or cumulative annuals. It is worth highlighting that many individual months exhibit insignificant correlations and even anticorrelations for the whole basin and subbasins for some months.
Figure 4 shows that in the Sinú River basin, both MERRA2 and ERA5 present their maximum correlation values in the coastal region and the minima in the most elevated parts of the watershed and near the Urra reservoir. The largest ρS variability appears in the upper subbasin. The low correlation patch in the proximities of the Urra reservoir in Figure 4a,b suggests an anomaly in the ERA5 rainfall estimations in this area. Figure 4b,c show that in the Middle and Lower Sinú subbasins, the lowest ρS values are located in the influence area of Loma Verde Station (13050030) (see Table A1), suggesting that the consistency of the IDEAM records in this station should be revised.

3.2. Upper Sinú River Basin

The Upper Sinú encompasses only four meteorological stations that satisfy the adopted eligibility criterion of missing values not exceeding 10% of the time series. All of these stations are conventional (non-recording). The Campo Bello weather station accounts for approximately 3600 km2 (>80% of the subbasin), with the other relevant rain gauges in the subbasin located in the proximities of the Urrá Dam. The average density of stations in the subbasin (1401 km2/station) is well above the 250 km2/station recommended by the WMO [6] for conventional stations in mountain areas.
Based on the IDEAM records and the Thiessen method, the average precipitation in the Upper Sinú is 2481 mm/y, with a standard deviation of 381 mm/y. These values are in line with those found in previous studies in the subbasin [43,51,66]. As evidenced in Table 2, this subbasin exhibits the lowest correlation for the complete series for both reanalyses, and it also presents the highest biases and NRMSE values for MERRA2, which overestimates more than four times the rainfall during the rainy season. Additionally, Figure 5 shows that there is no correspondence between the wetter months for the three datasets.

3.3. Middle Sinú River Basin

Sixteen Thiessen polygons cover the Middle Sinú subbasin, i.e., approximately one station every 240 km2. Based on the WMO recommendations for interior plains and urban areas [6], the density of the rain gauge network in this region suggests a relatively well-instrumented subbasin; however, as signaled by the standard deviation of 202 stations/km2, this average is influenced by the presence of Monteria, the capital of the department, and the weather stations within it. The areal estimation based on IDEAM records for 1985–2019 results in average rainfall of 1633 mm/y, with a standard deviation equal to 158 mm/year, as in previous reports [43,66]. Similar to the Upper Sinu, Figure 6 illustrates that both MERRA2 and ERA5 significantly overestimate the precipitation in September and October.
As previously found for the whole basin, Table 3 confirms that on average, MERRA2 estimations have lower biases in the dry season than in the rainy season, opposite to ERA5. Both reanalysis datasets are able to represent the “Veranillo de San Juan” in July, which is more visible for MERRA2.

3.4. Lower Sinú River Basin

The density of the rain gauge network in this coastal subbasin is around 160 km2/station on average, with a standard deviation of 115 km2/station, which is adequate based on the WMO recommendations regarding minimum densities [6]. The areal estimation using the Thiessen method with IDEAM records results in average rainfall of 1392 mm/y, with a standard deviation equal to 170 mm/year, as in previous reports based on individual stations and areal estimations [42,43,67].
Likely because of the higher presence of rain gauges to feed the reanalysis models and topographical characteristics, Table 4 and Figure 4 demonstrate that this subbasin presents the highest correlations and the lowest biases and NRMSE values of the four cases. Still, the negative NSE values indicate that the averages of the ground measurements are closer to the actual values than the reanalysis estimations [63], even if some NRMSE values are below 0.50 [60]. Based on the medians, Figure 7 shows that ERA5 reproduces the rainfall behavior (in terms of the dryer and wetter months) of the IDEAM records better than MERRA2, whose wettest month corresponds to September for all subbasins.

4. Discussion

The rain gauge network in the Sinú River basin follows the pattern shown in most South American watersheds [13], i.e., the network is denser closer to the coastline and alongside the main river courses. One of the main reasons for this is how the populations are distributed in South America, as it is difficult to install and operate a large number of stations in mostly uninhabited areas unless the stations are highly automated. These sparsely settled zones typically coincide with deserts, polar regions, or tropical forests [6]—in our case, the Paramillo National Natural Park. Nevertheless, it is worth mentioning that IDEAM [53] has records of at least 14 additional precipitation gauges in the Upper Sinú subbasin, although they did not satisfy the adopted eligibility criterion of missing values not exceeding 10% of the time series between 1985 and 2019, as they were decommissioned in the 1990s and 2000s.
The irregular distribution of stations likely induces higher uncertainty and biases in the regional rainfall estimates, as Clarke et al. [68] explained. Our results support this statement, as the parallel performance of the two reanalysis datasets under consideration in this study exhibit better results as the hydrometeorological network gets denser, even if the results do not accurately represent the areal estimations based on IDEAM records. Both MERRA2 and ERA5 described the overall precipitation regime in the Sinú River basin, as the dry and rainy seasons can be easily differentiated, and they follow similar behavior to that estimated using the Thiessen method and IDEAM records, including the seasonal pattern represented by the “Veranillo de San Juan” phenomenon. Some authors argue that evaluations using Thiessen polygons and other areal estimations methods are better suited for areas covered with numerous and uniformly distributed stations [39], although this is not a restriction [8,56,69,70].
For the upper basin of the Sinú River, in which the Campo Bello station represents >80% of the watershed area, the results obtained were highly unreliable. In addition to the inclusion of more stations (although they would present gaps greater than those admitted in this research), more advanced geostatistical interpolation methods could allow better estimates in this type of region with vast height differences and a low density of stations. For instance, Kriging methods use additional parameters (e.g., topography) to improve accuracy in estimating spatial and temporal rainfall variability, which in some studies has duplicated that from using Thiessen polygons [71].
The datasets under analysis do not follow a normal distribution, which is the primary justification for using Spearman’s ρS instead of Pearson’s correlation coefficient as conducted in other studies [20,41,72]. The ability of the reanalyses to describe the dry and rainy seasons in the Sinú River basin results in moderate correlation values [71] for the entire time series in the four spatial scales considered. As evidenced by the correlation results for the individual months, this long-term correlation might be misleading, mainly if the novice researcher or consultant uses them directly to reconstruct specific events such as extreme floods or droughts. Other authors [68,73] express a similar warning regarding the inadequacy of correlation-based metrics as the only statistic to evaluate the goodness-of-fit of hydrological models.
Regarding the relative magnitude, both reanalysis datasets consistently overestimate the areal rainfall averages calculated from the Thiessen polygons at all spatial and time scales. ERA5 presents lower biases than MERRA2, but contrary to the latter, it performs better during the dry months, similar to the behavior observed in Turkey for ERA5 by Amjad et al. [74]. MERRA2 exhibits its worst performance in the Upper Sinú subbasin, as all bias values indicate that estimations from this reanalysis product are at least twice as big as the values estimated from the IDEAM time series. This poor performance by MERRA2 in scarcely instrumented and complex areas follows findings from previous studies for other world regions, such as those by Pedreira et al. [41], Quagraine et al. [35], and Mao et al. [75]. On the other hand, the ERA5 performance for monthly rainfall estimations in mountain areas has shown mixed results. For instance, Gleixner et al. [76] and Amjad et al. [74] found that ERA5 shows substantial differences in areas with larger slopes in Asia and Africa, while Tarek et al. [56] indicate that this reanalysis product provided adequate input for hydrological simulation in mountainous regions of North America. In the Alps area, both MERRA2 and ERA (although ERA-Interim) precipitation products exhibited the highest biases in the continent in a study comparing five satellite and reanalysis datasets [17]. Consequently, other authors have evaluated how including the elevation in the interpolation of areal precipitation estimates could improve reanalysis performance, with their results often showing no significant differences [70]. In our case, the lowest correlation corresponds to the Upper Sinú, but NRMSE and bias values only show slight differences between the three subbasins.
An additional cross-correlation analysis sought to identify the similarity of information between peak values—in this case the annual cycles of the datasets—to determine whether there were time shifts (also called lags) between them [77]. Within a 50-month window, the analysis found statistically significant (at a 10% level) cross-correlation results between IDEAM and ERA5 at lags −24, −12, 0, 12, and 24, as expected from the monomodal precipitation regime in the Sinú River basin. When MERRA2 is compared to IDEAM and ERA5, the significant lags occurred at −24, −13, −12, −1, 0, 11, 12, and 24. The lags −13, −1, and 11 suggest that for some years, MERRA2 rainfall peak estimations are shifted by a month contrasted with IDEAM and ERA5, which partially explains the behavior in Figure 3, Figure 5, Figure 6 and Figure 7. This type of lag in reanalysis rainfall estimates has been previously reported in the literature [76].
Rain gauges remain the most accurate and reliable measurements, even if they are subject to systematic and human-made errors [5,6]; thus, investments in the national hydrometeorological networks are essential for adequate water and natural resource planning and management. Our results indicate that both reanalysis datasets are inaccurate in reproducing the rainfall estimations from rain gauges in the Sinú River basin; however, the literature suggests that a point-to-point approach [39], the use of bias correction techniques [78,79], mathematical regression, and geostatistics [8] might improve their performance. These adjustments might allow them to serve as boundary conditions or create scenarios for integrated modeling of natural processes, as they offer consistent time series of multiple hydrometeorological variables [17,56,76,80].

5. Conclusions

Reanalysis datasets have become relevant among scientists because of their cost-effectiveness, ample spatial coverage, and their long and consistent time series for multiple hydrometeorological variables. However, their low spatial resolution and variable accuracy across world regions are their most significant drawbacks compared with satellite data or ground measurements. This paper statistically evaluated the performance of MERRA2 and ERA5 reanalysis rainfall products in the Sinú River basin, comparing the average monthly precipitation estimated from these gridded datasets with the areal estimation of monthly precipitation through Thiessen polygons based on IDEAM records from 49 hydrometeorological stations. The four statistical metrics (ρS, NRMSE, bias, and NSE) used in this evaluation were chosen based on previous studies conducted across the world. ERA5 generally outperformed MERRA2; however, both reanalyses consistently overestimated the monthly averages calculated from IDEAM records at all time and spatial scales. The negative NSE values indicate that historical monthly averages from IDEAM records are better predictors than both MERRA2 and ERA5 rainfall products, even if both reanalyses show modest correlations with IDEAM. Therefore, these two reanalysis datasets have limited application for hydrologic modeling or climatological studies regarding rainfall estimations in this area.
The three different densities of the rain gauge network and the similar size of each subbasin make for an interesting case study for similar studies with additional satellite or reanalysis products and hydrometeorological variables. Instead of Thiessen polygons, point-to-point validation and employing different spatial interpolation techniques such as Kriging could provide further insights regarding the performance of reanalysis in this basin. Besides the previously mentioned assessment of other variables, future follow-up studies might include evaluating how regressions, other bias correction techniques described in the literature, and additional mathematical and statistical techniques could improve the performance of these reanalysis datasets in this basin.

Author Contributions

Conceptualization, F.A.C. and G.J.A.; methodology, F.A.C. and G.J.A. supervision, F.A.C.; investigation, F.A.C., J.V.-D. and B.E.-C.; validation, F.A.C. and G.J.A.; formal analysis, J.V-D., B.E.-C., G.J.A., B.K. and F.A.C.; writing—original draft preparation, J.V.-D., B.E.-C., G.J.A., B.K. and F.A.C.; writing—review and editing, F.A.C. and B.K. All authors have read and agreed to the published version of the manuscript.

Funding

This research received no external funding.

Institutional Review Board Statement

Not applicable.

Informed Consent Statement

Not applicable.

Data Availability Statement

The data presented in this study are openly available in the following sources: (a) The MERRA2 data are freely available on the Goddard Earth Sciences Data and Information Services Center [34]; (b) The ERA5 data is freely available on the ECMWF website [33]; c) Records from the hydrometeorological stations in the Sinu River basin are freely available at the IDEAM website [53].

Acknowledgments

The authors would like to thank IDEAM for kindly providing the time series employed in this paper.

Conflicts of Interest

The authors declare no conflict of interest.

Appendix A. IDEAM Stations and Thiessen Polygons

Table A1 presents the main characteristics of the hydrometeorological stations employed for validating the precipitation estimates from MERRA2 and ERA5 in the Sinú River basin. Figure A1 displays the resulting Thiessen polygons and the watershed’s elevation map.
Table A1. Characteristics of the IDEAM’s hydrometeorological stations employed for validating reanalysis datasets in the Sinú River basin. The elevation is given in meters above sea level (masl). Stations that include the suffix Aut signify automatically recording stations.
Station Name [IDEAM CODE]Latitude (Degrees)Longitude (Degrees)Elevation (masl)Thiessen Polygon Area (km2)Area in Lower Sinú (%)Area in Middle Sinú (%)Area in Upper Sinú (%)
AEROPUERTO LOS GARZONES [13035501]8.826−75.8252025.918100
AGUAS MOHOSAS [13070450]9.251−75.4927576.958100
BOCA DE LA CEIBA [13070070]8.830−75.8562090.732100
BUENOS AIRES [13060020]8.476−75.76555314.776 100
BUENOS AIRES 1 [13070170]8.773−75.750956.499100
CALLEMAR [13070120]8.698−75.67895128.330100
CAMPO BELLO [13015030]7.983−76.233783972.089 0.5999.41
CARAMELO [13060030]8.266−75.90460459.341 100
CARRILLO [13070180]8.984−75.83220385.131100
CARRIZAL [13070110]8.682−75.75440111.28299.910.09
CENTRO ALEGRE [25015010]8.181−75.63217099.290 100
CERETE [13070050]8.890−75.7862094.646100
CHIMA [13075010]9.151−75.62220319.723100
CHINU—AUT [25020470]9.118−75.39312587.128100
CIENAGA DE ORO [13077070]8.873−75.62610144.375100
COLOMBOY [25025170]8.741−75.49912551.013100
COROZA 2 [13070190]8.805−75.765945.094100
CRISTO REY—AUT [12045020]9.071−76.224153.249100
DOCTRINA LA [13080060]9.300−75.8834467.361100
GALAN [13055030]8.659−75.97330372.64955.8444.16
LIMON EL [13070010]9.336−75.9383187.366100
LOMA VERDE [13050030]8.502−76.175100407.42554.2745.73
MARACAYO [13065020]8.411−75.88425426.3750.0199.99
MOMIL [13070020]9.234−75.68820328.587100
PEZVAL [13040030]8.262−76.16980641.702 100
PLANETA RICA—AUT [25025190]8.399−75.5849066.321 100
PUERTO LIBERTADOR [25010010]7.890−75.68055216.258 100
RABOLARGO [13070040]8.951−75.74219228.119100
REPRESA URRA [13015040]8.014−76.203300675.751 55.4744.53
SABANAL [13070280]8.789−75.7511013.320100
SAHAGUN [25020140]8.951−75.45260147.691100
SAJONIA HACIENDA—AUT [25020600]8.490−75.60110022.3260.0199.99
SALADO EL [13075020]8.914−75.58240238.833100
SAN ANTERITO [13060010]8.558−75.86175261.5561.9498.06
SAN ANTONIO [13080010]8.936−75.95350342.045100
SAN BERNARDO [13085030]9.371−75.9492274.134100
SAN CARLOS [13070090]8.791−75.7016093.644100
SAN FRANCISCO [25010100]8.129−75.760160259.788 100
SANTA CRUZ HACIENDA [13050020]8.668−76.124220218.157100
SANTA LUCIA [13050010]8.849−76.045120258.157100
SANTA ROSA [13070100]8.741−75.601140120.803100
TAMPA [13070290]8.625−75.76720181.12675.6724.33
TIERRALTA [13030010]8.187−76.053100559.329 99.660.34
TREMENTINO [25021210]8.818−75.47413662.723100
TURIPANA [13075030]8.840−75.8022031.465100
UNIV DE CORDOBA [13075050]8.794−75.86215172.213100
URE [25010060]7.788−75.538200119.650 100
VENECIA [13070430]9.195−75.54150186.400100
VILLA MARCELA [13070440]9.352−75.7194085.684100
Figure A1. Thiessen polygons and elevation map of the Sinú River basin.
Atmosphere 12 01430 g0a1

References

  1. Bertoni, J.C.; Tucci, C.E.M. Precipitação. In Hidrologia: Ciência e Aplicação; Tucci, C.E.M., Ed.; Editora da UFRGS/ABRH: Porto Alegre, Brazil, 2004; pp. 177–241. ISBN 8570256639. [Google Scholar]
  2. Canales, F.A.; Gwoździej-Mazur, J.; Jadwiszczak, P.; Struk-Sokołowska, J.; Wartalska, K.; Wdowikowski, M.; Kaźmierczak, B. Long-Term Trends in 20-Day Cumulative Precipitation for Residential Rainwater Harvesting in Poland. Water 2020, 12, 1932. [Google Scholar] [CrossRef]
  3. Nkiaka, E.; Nawaz, N.R.; Lovett, J.C. Evaluating global reanalysis precipitation datasets with rain gauge measurements in the Sudano-Sahel region: Case study of the Logone catchment, Lake Chad Basin. Meteorol. Appl. 2017, 24, 9–18. [Google Scholar] [CrossRef]
  4. Lozano Sandoval, G.; Monsalve Durango, E.A.; García Reinoso, P.L.; Rodríguez Mejía, C.A.; Gómez Ospina, J.P.; Triviño Loaiza, H.J. Environmental Flow Estimation Using Hydrological and Hydraulic Methods for the Quindío River Basin: WEAP as a Support Tool. Inge CUC 2015, 11, 34–48. [Google Scholar] [CrossRef] [Green Version]
  5. Dingman, S.L. Physical Hydrology, 3rd ed.; Waveland Press, Inc.: Long Grove, IL, USA, 2015; ISBN 9781478611189. [Google Scholar]
  6. World Meteorological Organization. Guide to Hydrological Practice. Volume I: Hydrology—From Measurement to Hydrological Information; World Meteorological Organization: Geneva, Switzerland, 2008; ISBN 9789263101686. [Google Scholar]
  7. Condom, T.; Martínez, R.; Pabón, J.D.; Costa, F.; Pineda, L.; Nieto, J.J.; López, F.; Villacis, M. Climatological and Hydrological Observations for the South American Andes: In situ Stations, Satellite, and Reanalysis Data Sets. Front. Earth Sci. 2020, 8, 1–20. [Google Scholar] [CrossRef] [Green Version]
  8. Yu, Z.; Wu, J.; Chen, X. An approach to revising the climate forecast system reanalysis rainfall data in a sparsely-gauged mountain basin. Atmos. Res. 2019, 220, 194–205. [Google Scholar] [CrossRef]
  9. Thornton, P.E.; Running, S.W.; White, M.A. Generating surfaces of daily meteorological variables over large regions of complex terrain. J. Hydrol. 1997, 190, 214–251. [Google Scholar] [CrossRef] [Green Version]
  10. Ramirez Camargo, L.; Gruber, K.; Nitsch, F. Assessing variables of regional reanalysis data sets relevant for modelling small-scale renewable energy systems. Renew. Energy 2019, 133, 1468–1478. [Google Scholar] [CrossRef]
  11. Chawla, I.; Mujumdar, P.P. Evaluating rainfall datasets to reconstruct floods in data-sparse Himalayan region. J. Hydrol. 2020, 588, 125090. [Google Scholar] [CrossRef]
  12. Sun, S.; Shi, W.; Zhou, S.; Chai, R.; Chen, H.; Wang, G.; Zhou, Y.; Shen, H. Capacity of satellite-based and reanalysis precipitation products in detecting long-term trends across Mainland China. Remote Sens. 2020, 12, 2902. [Google Scholar] [CrossRef]
  13. Blacutt, L.A.; Herdies, D.L.; de Gonçalves, L.G.G.; Vila, D.A.; Andrade, M. Precipitation comparison for the CFSR, MERRA, TRMM3B42 and Combined Scheme datasets in Bolivia. Atmos. Res. 2015, 163, 117–131. [Google Scholar] [CrossRef] [Green Version]
  14. Bojanowski, J.S.; Vrieling, A.; Skidmore, A.K. A comparison of data sources for creating a long-term time series of daily gridded solar radiation for Europe. Sol. Energy 2014, 99, 152–171. [Google Scholar] [CrossRef]
  15. Dee, D.; Fasullo, J.; Shea, D.; Walsh, J. National Center for Atmospheric Research The Climate Data Guide: Atmospheric Reanalysis: Overview & Comparison Tables. Available online: https://climatedataguide.ucar.edu/climate-data/atmospheric-reanalysis-overview-comparison-tables (accessed on 6 June 2021).
  16. Hersbach, H.; Bell, B.; Berrisford, P.; Hirahara, S.; Horányi, A.; Muñoz-Sabater, J.; Nicolas, J.; Peubey, C.; Radu, R.; Schepers, D.; et al. The ERA5 global reanalysis. Q. J. R. Meteorol. Soc. 2020, 146, 1999–2049. [Google Scholar] [CrossRef]
  17. Springer, A.; Eicker, A.; Bettge, A.; Kusche, J.; Hense, A.; Mahto, S.S.; Pandey, A.C.; Huang, B.; Cubasch, U.; Li, Y.; et al. Evaluation of the Water Cycle in the European COSMO-REA6 Reanalysis Using GRACE. Water 2017, 9, 289. [Google Scholar] [CrossRef]
  18. Nguyen, T.H.; Masih, I.; Mohamed, Y.A.; van der Zaag, P. Validating rainfall-runoff modelling using satellite-based and reanalysis precipitation products in the sre pok catchment, the mekong river basin. Geosciences 2018, 8, 164. [Google Scholar] [CrossRef] [Green Version]
  19. Jurasz, J.; Canales, F.A.; Kies, A.; Guezgouz, M.; Beluco, A. A review on the complementarity of renewable energy sources: Concept, metrics, application and future research directions. Sol. Energy 2020, 195, 703–724. [Google Scholar] [CrossRef]
  20. Ramirez Camargo, L.; Schmidt, J. Simulation of multi-annual time series of solar photovoltaic power: Is the ERA5-land reanalysis the next big step? Sustain. Energy Technol. Assess. 2020, 42, 100829. [Google Scholar] [CrossRef]
  21. Canales, F.A.; Jurasz, J.K.; Guezgouz, M.; Beluco, A. Cost-reliability analysis of hybrid pumped-battery storage for solar and wind energy integration in an island community. Sustain. Energy Technol. Assess. 2021, 44, 101062. [Google Scholar]
  22. Kapica, J.; Canales, F.A.; Jurasz, J. Global atlas of solar and wind resources temporal complementarity. Energy Convers. Manag. 2021, 246, 114692. [Google Scholar] [CrossRef]
  23. Hurtado-Montoya, A.F.; Mesa-Sánchez, Ó.J. Reanalysis of monthly precipitation fields in Colombian territory. Dyna 2014, 81, 251. [Google Scholar] [CrossRef]
  24. Dinku, T.; Funk, C.; Peterson, P.; Maidment, R.; Tadesse, T.; Gadain, H.; Ceccato, P. Validation of the CHIRPS satellite rainfall estimates over eastern Africa. Q. J. R. Meteorol. Soc. 2018, 144, 292–312. [Google Scholar] [CrossRef] [Green Version]
  25. Urrea, V.; Ochoa, A.; Mesa, O. Seasonality of Rainfall in Colombia. Water Resour. Res. 2019, 55, 4149–4162. [Google Scholar] [CrossRef]
  26. Fernandes, K.; Muñoz, A.G.; Ramirez-Villegas, J.; Agudelo, D.; Llanos-Herrera, L.; Esquivel, A.; Rodriguez-Espinoza, J.; Prager, S.D. Improving seasonal precipitation forecasts for agriculture in the orinoquía Region of Colombia. Weather Forecast. 2020, 35, 437–449. [Google Scholar] [CrossRef]
  27. Urrea, V.; Ochoa, A.; Mesa, O. Validación de la base de datos de precipitación CHIRPS para Colombia a escala diaria, mensual y anual en el período 1981–2014. In Proceedings of the XXVII Congreso Latinoamericano de Hidráulica, Lima, Peru, 28–30 September 2016; p. 11. [Google Scholar]
  28. Morales-Acuña, E.; Linero-Cueto, J.R.; Canales, F.A. Assessment of Precipitation Variability and Trends Based on Satellite Estimations for a Heterogeneous Colombian Region. Hydrology 2021, 8, 128. [Google Scholar] [CrossRef]
  29. Funk, C.; Peterson, P.; Landsfeld, M.; Pedreros, D.; Verdin, J.; Shukla, S.; Husak, G.; Rowland, J.; Harrison, L.; Hoell, A.; et al. The climate hazards infrared precipitation with stations—A new environmental record for monitoring extremes. Sci. Data 2015, 2, 1–21. [Google Scholar] [CrossRef] [PubMed] [Green Version]
  30. Jurasz, J.; Beluco, A.; Canales, F.A. The impact of complementarity on power supply reliability of small scale hybrid energy systems. Energy 2018, 161, 737–743. [Google Scholar] [CrossRef]
  31. Canales, F.A.; Jurasz, J.; Kies, A.; Beluco, A.; Arrieta-Castro, M.; Peralta-Cayón, A. Spatial representation of temporal complementarity between three variable energy sources using correlation coefficients and compromise programming. MethodsX 2020, 7, 100871. [Google Scholar] [CrossRef] [PubMed]
  32. Canales, F.A.; Jurasz, J.; Beluco, A.; Kies, A. Assessing temporal complementarity between three variable energy sources through correlation and compromise programming. Energy 2020, 192, 116637. [Google Scholar] [CrossRef] [Green Version]
  33. Copernicus Climate Change Service (C3S) ERA5: Fifth Generation of ECMWF Atmospheric Reanalyses of the Global Climate. Available online: https://cds.climate.copernicus.eu/cdsapp#!/home (accessed on 25 May 2021).
  34. National Aeronautics and Space Administration Goddard Earth Sciences Data and Information Services Center (GES DISC). Available online: https://disc.gsfc.nasa.gov/datasets?project=MERRA-2 (accessed on 11 November 2020).
  35. Quagraine, K.A.; Nkrumah, F.; Klein, C.; Klutse, N.A.B.; Quagraine, K.T. West African summer monsoon precipitation variability as represented by reanalysis datasets. Climate 2020, 8, 111. [Google Scholar] [CrossRef]
  36. Zandler, H.; Haag, I.; Samimi, C. Evaluation needs and temporal performance differences of gridded precipitation products in peripheral mountain regions. Sci. Rep. 2019, 9, 15118. [Google Scholar] [CrossRef] [Green Version]
  37. Huang, L.; Mo, Z.; Liu, L.; Zeng, Z.; Chen, J.; Xiong, S.; He, H. Evaluation of Hourly PWV Products Derived From ERA5 and MERRA-2 Over the Tibetan Plateau Using Ground-Based GNSS Observations by Two Enhanced Models. Earth Space Sci. 2021, 8, e2020EA001516. [Google Scholar]
  38. Mahto, S.S.; Mishra, V. Does ERA-5 Outperform Other Reanalysis Products for Hydrologic Applications in India? J. Geophys. Res. Atmos. 2019, 124, 9423–9441. [Google Scholar] [CrossRef]
  39. Lemma, E.; Upadhyaya, S.; Ramsankaran, R.A.A.J. Investigating the performance of satellite and reanalysis rainfall products at monthly timescales across different rainfall regimes of Ethiopia. Int. J. Remote Sens. 2019, 40, 4019–4042. [Google Scholar] [CrossRef]
  40. Ghatak, D.; Zaitchik, B.; Kumar, S.; Matin, M.A.; Bajracharya, B.; Hain, C.; Anderson, M. Influence of precipitation forcing uncertainty on hydrological simulations with the NASA South Asia Land Data Assimilation System. Hydrology 2018, 5, 57. [Google Scholar] [CrossRef] [Green Version]
  41. Pedreira, A.L.; Biudes, M.S.; Machado, N.G.; Vourlitis, G.L.; Geli, H.M.E.; Dos Santos, L.O.F.; Querino, C.A.S.; Ivo, I.O.; Neto, N.L. Assessment of remote sensing and reanalysis estimates of regional precipitation over Mato Grosso, Brazil. Water 2021, 13, 333. [Google Scholar]
  42. Martínez-Acosta, L.; Medrano-Barboza, J.P.; López-Ramos, Á.; López, J.F.R.; López-Lambraño, Á.A. SARIMA approach to generating synthetic monthly rainfall in the Sinú river watershed in Colombia. Atmosphere 2020, 11, 602. [Google Scholar] [CrossRef]
  43. Corporación Autónoma Regional de los Valles del Sinú y San Jorge (CVS). Fases de Prospección y Formulación del Plan de Ordenamiento y Manejo Integral de la Cuenca Hidrográfica del RÍO SINÚ (POMCA-RS); CVS: Montería, Colombia, 2006. [Google Scholar]
  44. Marrugo-Negrete, J.; Pinedo-Hernández, J.; Díez, S. Assessment of heavy metal pollution, spatial distribution and origin in agricultural soils along the Sinú River Basin, Colombia. Environ. Res. 2017, 154, 380–388. [Google Scholar] [CrossRef]
  45. Bedoya, M.Á. Valoración del Servicio Ecosistémico de Provisión de Agua Hacia Diferentes Sectores con Relación a la Cuenca del Río Sinú—Parque Nacional Natural Paramillo; Parques Nacionales Naturales—Subdirección de Sostenibilidad y Negocios Ambientales: Bogotá, DC, USA, 2016. [Google Scholar]
  46. Instituto Geográfico Agustín Codazzi (IGAC) Sistema de Información Geográfica para la Planeación y el Ordenamiento Territorial. Available online: https://sigot.igac.gov.co/ (accessed on 15 May 2021).
  47. Autoridad Nacional de Licencias Ambientales Reporte de Alertas Subzonas Hidrográficas: Río Sinú y Alto San Jorge; ANLA: Bogotá DC, USA, 2019.
  48. Égré, D.; Senécal, P. Social impact assessments of large dams throughout the world: Lessons learned over two decades. Impact Assess. Proj. Apprais. 2003, 21, 215–224. [Google Scholar] [CrossRef] [Green Version]
  49. Andrade, C.A.; Barton, E.D. Eddy development and motion in the Caribbean Sea. J. Geophys. Res. Ocean. 2000, 105, 26191–26201. [Google Scholar] [CrossRef] [Green Version]
  50. Poveda, G.; Waylen, P.R.; Pulwarty, R.S. Annual and inter-annual variability of the present climate in northern South America and southern Mesoamerica. Palaeogeogr. Palaeoclimatol. Palaeoecol. 2006, 234, 3–27. [Google Scholar] [CrossRef]
  51. Corporación Autónoma Regional de los Valles del Sinú y San Jorge (CVS). Funsostenible Actualización del Plan General de ordenación forestal del Departamento de Córdoba; CVS: Montería, Colombia, 2019. [Google Scholar]
  52. Garcia Corrales, L.M.; Avila Rangel, H.; Gutierrez Llantoy, R. Land-use and socioeconomic changes related to armed conflicts: A Colombian regional case study. Environ. Sci. Policy 2019, 97, 116–124. [Google Scholar] [CrossRef]
  53. IDEAM Consulta y Descarga de Datos Hidrometeorológicos. Available online: http://dhime.ideam.gov.co/atencionciudadano/ (accessed on 10 October 2020).
  54. Arrieta-Castro, M.; Donado-Rodríguez, A.; Acuña, G.J.; Canales, F.A.; Teegavarapu, R.S.V.; Kaźmierczak, B. Analysis of Streamflow Variability and Trends in the Meta River, Colombia. Water 2020, 12, 1451. [Google Scholar] [CrossRef]
  55. Gelaro, R.; McCarty, W.; Suárez, M.J.; Todling, R.; Molod, A.; Takacs, L.; Randles, C.A.; Darmenov, A.; Bosilovich, M.G.; Reichle, R.; et al. The modern-era retrospective analysis for research and applications, version 2 (MERRA-2). J. Clim. 2017, 30, 5419–5454. [Google Scholar] [CrossRef]
  56. Tarek, M.; Brissette, F.P.; Arsenault, R. Evaluation of the ERA5 reanalysis as a potential reference dataset for hydrological modelling over North America. Hydrol. Earth Syst. Sci. 2020, 24, 2527–2544. [Google Scholar] [CrossRef]
  57. Beck, H.E.; Vergopolan, N.; Pan, M.; Levizzani, V.; van Dijk, A.I.J.M.; Weedon, G.P.; Brocca, L.; Pappenberger, F.; Huffman, G.J.; Wood, E.F. Global-scale evaluation of 22 precipitation datasets using gauge observations and hydrological modeling. Hydrol. Earth Syst. Sci. 2017, 21, 6201–6217. [Google Scholar] [CrossRef] [Green Version]
  58. Tucci, C.E.M. Hidrologia: Ciência e Aplicação; Editora da UFRGS/ABRH: Porto Alegre, Brazil, 2007; ISBN 978-85-7025-924-0. [Google Scholar]
  59. Wang, N.; Liu, W.; Sun, F.; Yao, Z.; Wang, H.; Liu, W. Evaluating satellite-based and reanalysis precipitation datasets with gauge-observed data and hydrological modeling in the Xihe River Basin, China. Atmos. Res. 2020, 234, 104746. [Google Scholar] [CrossRef]
  60. Chen, F.; Li, X. Evaluation of IMERG and TRMM 3B43 monthly precipitation products over mainland China. Remote Sens. 2016, 8, 472. [Google Scholar] [CrossRef] [Green Version]
  61. Zambrano-Bigiarini, M. Goodness-of-Fit Functions for Comparison of Simulated and Observed Observed Hydrological Time Series. R Package Version 0.4-0. Available online: https://cran.r-project.org/web/packages/hydroGOF/index.html (accessed on 5 May 2021).
  62. Tang, X.; Zhang, J.; Gao, C.; Ruben, G.B.; Wang, G. Assessing the uncertainties of four precipitation products for SWAT modeling in Mekong River Basin. Remote Sens. 2019, 11, 304. [Google Scholar] [CrossRef] [Green Version]
  63. Rodda, H.J.E.; Little, M.A. Understanding Mathematical and Statistical Techniques in Hydrology. An Example-Based Approach; John Wiley & Sons, Ltd.: Hoboken, NJ, USA, 2015; ISBN 978-1-4443-3549-1. [Google Scholar]
  64. Nash, J.E.; Sutcliffe, J.V. River flow forecasting through conceptual models part I—A discussion of principles. J. Hydrol. 1970, 10, 282–290. [Google Scholar] [CrossRef]
  65. Zhang, F.; Zhang, H.; Hagen, S.C.; Ye, M.; Wang, D.; Gui, D.; Zeng, C.; Tian, L.; Liu, J. Snow cover and runoff modelling in a high mountain catchment with scarce data: Effects of temperature and precipitation parameters. Hydrol. Process. 2015, 29, 52–65. [Google Scholar] [CrossRef]
  66. Valbuena Gaviria, D.L. Geomorfología y Condiciones Hidráulicas del Sistema Fluvial del río Sinú. Integración Multiescalar. 1945–1999–2016; Universidad Nacional de Colombia: Bogotá, Colombia, 2017. [Google Scholar]
  67. Ruiz-Ochoa, M.; Bernal, G.; Polanía, J. Influencia Del Río Sinú Y El Mar Caribe En El Sistema Lagunar De Cispatá. Bol. Investig. Mar. Costeras 2008, 37, 31–51. [Google Scholar] [CrossRef]
  68. Clarke, R.T.; Buarque, D.C.; de Paiva, R.C.D.; Collischonn, W. Issues of spatial correlation arising from the use of TRMM rainfall estimates in the Brazilian Amazon. Water Resour. Res. 2011, 47, W05539. [Google Scholar] [CrossRef] [Green Version]
  69. Liu, J.; Duan, Z.; Jiang, J.; Zhu, A.X. Evaluation of three satellite precipitation products TRMM 3B42, CMORPH, and PERSIANN over a subtropical watershed in China. Adv. Meteorol. 2015, 2015, 151239. [Google Scholar] [CrossRef] [Green Version]
  70. Ward, E.; Buytaert, W.; Peaver, L.; Wheater, H. Evaluation of precipitation products over complex mountainous terrain: A water resources perspective. Adv. Water Resour. 2011, 34, 1222–1231. [Google Scholar] [CrossRef]
  71. Buytaert, W.; Celleri, R.; Willems, P.; De Bièvre, B.; Wyseure, G. Spatial and temporal rainfall variability in mountainous areas: A case study from the south Ecuadorian Andes. J. Hydrol. 2006, 329, 413–421. [Google Scholar] [CrossRef]
  72. Caroletti, G.N.; Coscarelli, R.; Caloiero, T. Validation of satellite, reanalysis and RCM data of monthly rainfall in Calabria (Southern Italy). Remote Sens. 2019, 11, 1625. [Google Scholar] [CrossRef] [Green Version]
  73. Legates, D.R.; McCabe, G.J. Evaluating the use of goodness-of-fit measures in hydrologic and hydroclimatic model validation. Water Resour. Res. 1999, 35, 233–241. [Google Scholar] [CrossRef]
  74. Amjad, M.; Yilmaz, M.T.; Yucel, I.; Yilmaz, K.K. Performance evaluation of satellite- and model-based precipitation products over varying climate and complex topography. J. Hydrol. 2020, 584, 124707. [Google Scholar] [CrossRef]
  75. Mao, R.; Wang, L.; Zhou, J.; Li, X.; Qi, J.; Zhang, X. Evaluation of various precipitation products using ground-based discharge observation at the Nujiang River basin, China. Water 2019, 11, 2308. [Google Scholar] [CrossRef] [Green Version]
  76. Gleixner, S.; Demissie, T.; Diro, G.T. Did ERA5 improve temperature and precipitation reanalysis over East Africa? Atmosphere 2020, 11, 996. [Google Scholar] [CrossRef]
  77. Derrick, T.R.; Thomas, J.M. Time-Series Analysis: The cross-correlation function. In Innovative Analyses of Human Movement; Stergiou, N., Ed.; Human Kinetics Publishers: Champaign, IL, USA, 2004; pp. 189–205. [Google Scholar]
  78. Luo, M.; Liu, T.; Meng, F.; Duan, Y.; Frankl, A.; Bao, A.; De Maeyer, P. Comparing bias correction methods used in downscaling precipitation and temperature from regional climate models: A case study from the Kaidu River Basin in Western China. Water 2018, 10, 1046. [Google Scholar] [CrossRef] [Green Version]
  79. Garibay, V.M.; Gitau, M.W.; Kiggundu, N.; Moriasi, D.; Mishili, F. Evaluation of Reanalysis Precipitation Data and Potential Bias Correction Methods for Use in Data-Scarce Areas. Water Resour. Manag. 2021, 35, 1587–1602. [Google Scholar] [CrossRef]
  80. Jung, H.C.; Getirana, A.; Policelli, F.; McNally, A.; Arsenault, K.R.; Kumar, S.; Tadesse, T.; Peters-Lidard, C.D. Upper Blue Nile basin water budget from a multi-model perspective. J. Hydrol. 2017, 555, 535–546. [Google Scholar] [CrossRef] [Green Version]
Figure 1. Location of the Sinu River basin and subbasins. The dark area in the lower subbasin corresponds to the metropolitan area of Monteria.
Atmosphere 12 01430 g001
Figure 2. Diagram representing the method adopted in this research to assess MERRA2 and ERA5 rainfall products in the Sinú River basin and subbasins.
Atmosphere 12 01430 g002
Figure 3. Average monthly rainfall in the whole Sinú River basin based on the three datasets for 1985–2019. In this boxplot, the extremes of the box are the first (Q1) and third (Q3) quartiles; the bar indicates the median; the whiskers correspond to Q1—1.5 IQR (interquartile range) and Q3 + 1.5 IQR. The points are potential outliers.
Atmosphere 12 01430 g003
Figure 4. Correlation (ρS) maps for the study area: (a) Correlation between MERRA2 and ERA5; (b) Correlation between IDEAM and ERA5; (c) Correlation between IDEAM and MERRA2.
Atmosphere 12 01430 g004
Figure 5. Average monthly rainfall in the Upper Sinú River basin based on the three datasets for 1985–2019. In this boxplot, the extremes of the box are the first (Q1) and third (Q3) quartiles; the bar indicates the median; the whiskers correspond to Q1—1.5 IQR and Q3 + 1.5 IQR. The points are potential outliers.
Atmosphere 12 01430 g005
Figure 6. Average monthly rainfall in the Middle Sinú River basin based on the three datasets for 1985–2019. In this boxplot, the extremes of the box are the first (Q1) and third (Q3) quartiles; the bar indicates the median; the whiskers correspond to Q1—1.5 IQR and Q3 + 1.5 IQR. The points are potential outliers.
Atmosphere 12 01430 g006
Figure 7. Average monthly rainfall in the Lower Sinú River basin based on the three datasets for 1985–2019. In this boxplot, the extremes of the box are the first (Q1) and third (Q3) quartiles; the bar indicates the median; the whiskers correspond to Q1—1.5 IQR and Q3 + 1.5 IQR. The points are potential outliers.
Atmosphere 12 01430 g007
Table 1. Performance results for the tested reanalysis products for average areal rainfall estimations in the whole Sinú River basin for 1985–2019.
Time ScaleOBSERVED: IDEAM vs. ESTIMATES: MERRA2OBSERVED: IDEAM vs. ESTIMATES: ERA5
ρSNRMSEBIASNSEρSNRMSEBIASNSE
Jan0.132 2.889 2.303 −41.843 0.528 0.942 0.765 −3.553
Feb0.317 2.268 1.862 −20.536 0.632 0.924 0.733 −2.576
Mar0.427 1.898 1.597 −17.209 0.816 0.978 0.846 −3.841
Apr0.590 1.836 1.655 −53.417 0.519 0.778 0.720 −8.776
May−0.037 1.879 1.732 −105.142 0.094 0.516 0.450 −7.000
Jun0.373 2.142 1.969 −86.448 −0.121 0.488 0.410 −3.541
Jul0.331 2.039 1.881 −50.935 0.243 0.566 0.462 −2.997
Aug0.070 2.124 2.020 −95.291 0.334 0.387 0.309 −2.197
Sep−0.141 2.794 2.658 −186.425 0.158 0.524 0.469 −5.580
Oct−0.271 2.831 2.657 −158.160 0.122 0.692 0.629 −8.499
Nov0.210 3.381 3.115 −216.470 0.565 0.851 0.808 −12.765
Dec0.503 3.179 2.917 −41.152 0.753 0.868 0.798 −2.141
Annual0.378 2.232 2.176 −446.237 0.405 0.560 0.544 −27.187
Complete0.536 2.538 2.128 −16.956 0.633 0.661 0.519 −0.219
Table 2. Performance results for the tested reanalysis products for average areal rainfall estimations in the Upper Sinú River basin for 1985–2019.
Time ScaleOBSERVED: IDEAM vs. ESTIMATES: MERRA2OBSERVED: IDEAM vs. ESTIMATES: ERA5
ρSNRMSEBIASNSEρSNRMSEBIASNSE
Jan0.0474.3803.577−85.1020.3810.9230.716−2.827
Feb0.3453.2052.706−38.5010.5910.8820.711−1.992
Mar0.5322.6502.340−27.9620.5140.9850.814−3.000
Apr0.4642.9932.730−101.3920.2510.8080.646−6.465
May0.0512.9502.753−103.291−0.2710.5760.339−2.972
Jun0.1393.3183.051−112.184−0.2640.5040.288−1.614
Jul0.0322.9902.705−128.263−0.2350.5410.326−3.225
Aug−0.0773.3703.174−107.7430.2320.5070.296−1.464
Sep0.0994.4764.252−234.4090.2180.6820.576−4.470
Oct−0.1224.5524.279−165.530−0.0050.7200.516−3.165
Nov0.3385.5545.140−293.8610.3390.9190.749−7.076
Dec0.3474.8854.296−98.8370.5570.8020.624−1.692
Annual0.2583.4913.384−532.4020.0450.5640.514−12.914
Complete0.4893.9683.384−53.7970.5660.6940.514−0.675
Table 3. Performance results for the tested reanalysis products for average areal rainfall estimations in the Middle Sinú River basin for 1985–2019.
Time ScaleOBSERVED: IDEAM vs. ESTIMATES: MERRA2OBSERVED: IDEAM vs. ESTIMATES: ERA5
ρSNRMSEBIASNSEρSNRMSEBIASNSE
Jan0.1753.6731.361−44.2480.5200.9200.633−1.836
Feb0.2151.1910.703−2.9200.4981.0270.634−1.916
Mar0.4941.1860.740−5.1460.7750.9100.737−2.619
Apr0.5541.1310.887−15.9450.5070.7850.714−7.158
May0.0011.4261.195−45.0830.0070.4910.398−4.463
Jun0.3561.5021.244−31.0880.0290.3980.277−1.254
Jul0.0841.3231.079−27.1050.1440.4580.319−2.371
Aug0.1381.3791.252−35.3400.1380.3590.215−1.459
Sep−0.1042.2392.061−109.4190.1000.5110.433−4.744
Oct−0.1762.3622.137−75.3820.0800.7340.643−6.385
Nov0.3622.8492.548−99.7490.4150.9380.885−9.921
Dec0.4982.1961.789−16.5750.7000.9320.836−2.166
Annual0.3301.5181.453−253.3660.2800.5080.480−27.440
Complete0.5151.9401.453−10.7170.6310.6270.480−0.222
Table 4. Performance results of the tested reanalysis products for average areal rainfall estimations in the Lower Sinú River basin for 1985–2019.
Time ScaleOBSERVED: IDEAM vs. ESTIMATES: MERRA2OBSERVED: IDEAM vs. ESTIMATES: ERA5
ρSNRMSEBIASNSEρSNRMSEBIASNSE
Jan0.3260.9860.330−1.8080.4551.7551.002−7.884
Feb0.2701.0210.365−2.8980.5281.6200.974−8.821
Mar0.4850.9660.485−2.4990.7061.6660.995−9.397
Apr0.4300.7580.402−4.1880.6410.8880.765−6.117
May0.3900.8970.718−16.2900.3720.6650.584−8.485
Jun0.1631.0430.812−19.6650.3310.7450.678−9.542
Jul0.0841.3231.079−27.1050.1440.4580.319−2.371
Aug0.0681.0410.890−21.6450.4430.4560.344−3.339
Sep−0.1261.2891.096−27.8380.0960.4690.359−2.817
Oct−0.0391.3751.150−48.6630.4870.7410.692−13.433
Nov0.5141.2481.086−11.8410.4270.9350.783−6.211
Dec0.5561.5061.099−5.0900.7321.1821.007−2.754
Annual0.3240.9240.863−57.8580.6470.6670.604−29.709
Complete0.5721.2590.863−3.1530.6690.7780.604−0.586
Publisher’s Note: MDPI stays neutral with regard to jurisdictional claims in published maps and institutional affiliations.

