Article

Investigation of Atmospheric Conditions Associated with a Storm Surge in the South-West of Iran

1
Department of Environmental Science, Persian Gulf Research Institute, Persian Gulf University, Bushehr 7516913817, Iran
2
Environmental Science Department, University of South Florida, St. Petersburg, FL 33701, USA
3
Department of Geography, Yazd University, Yazd 8915818411, Iran
4
Institute for Atmospheric Sciences-Weather and Climate, Department of Physics, University of Iceland and Icelandic Meteorological Office (IMO), Bustadavegur 7, IS-108 Reykjavik, Iceland
5
Institute of Agrophysics, Polish Academy of Sciences, Doświadczalna 4, 20-290 Lublin, Poland
*
Authors to whom correspondence should be addressed.
Atmosphere 2021, 12(11), 1429; https://doi.org/10.3390/atmos12111429
Submission received: 14 October 2021 / Revised: 26 October 2021 / Accepted: 27 October 2021 / Published: 29 October 2021
(This article belongs to the Section Meteorology)

Abstract

:
Severe thunderstorms are often accompanied by strong vertical air currents, temporary wind gusts, and heavy rainfall. The development of this atmospheric phenomenon over tropical shallow water zones, such as bays, can lead to intensification of atmospheric disturbances and produce a small-scale storm surge. Here, the storm surge that occurred on 19 March 2017 in the Persian Gulf coastal area has been investigated. Air temperature, precipitation, mean sea level pressure, wave height, wind direction, wind speed, geopotential height, zonal components, meridional winds, vertical velocity, relative humidity, and specific humidity obtained from the European Centre for Medium-Range Weather Forecasts (ECMWF) and Global Forecast System (FNL) were used to implement the Weather Research and Forecasting (WRF) model. The results showed that the main cause of the storm surge was the occurrence of a supercell thunderstorm over the Persian Gulf. The formation of this destructive phenomenon resulted from a downburst under Cumulonimbus cloud and high-velocity air subsidence, after collision with the sea surface coinciding with the high tide. This caused a severe, yet temporary, gust, which in turn caused the creation of the four waves of 3.1 m height along the coast of Bandar Dayyer.

1. Introduction

Variations in atmospheric pressure are responsible for fluctuations in sea level, with high-pressure areas reducing the level of water, and low-pressure areas raising it. The order of sea-level response to pressure changes is approximately 0.1 m for every 10 mbar [1]. Usually, tidal predictions take into account seasonal variations, however, it is short-term variations that are responsible for deviations from predicted levels. Furthermore, onshore winds tend to raise the level of the coastal waters, while offshore winds are responsible for the opposite effect, which is most visible when such phenomena as cyclonic storms and tropical cyclones are occurring [2]. Numerical modeling of hurricane wind fields has been commonly applied in extreme wind and surge prediction and risk assessment [3]. A storm surge is induced by the storm surface wind stress and atmospheric pressure perturbations. Since the effect of pressure is relatively small, surges are mainly driven by wind stress, especially over shallow water in coastal areas [4]. Usually, the stronger the wind profile, the larger the storm surge is. The surge is mainly determined by the inner and outer eyewall regions of the wind profiles. A quite accurate storm surge prediction can be achieved using forecasts of the wind speed [5]. Besides wind speed, the water level is also influenced by pressure gradients, however, they have a less direct effect on creating a storm surge, especially in shallow water areas [5]. Winds that initiate a storm surge cannot be created by a downburst, whereas a storm surge may appear in regions with highly elevated water levels [6]. In such conditions, precipitation and cooling during the micro-physical processes cause the movement and acceleration of downdraft airflow. Nearly 5% of thunderstorms are microbursts [7]. Severe microbursts can cause destructive winds with a maximum speed up to 270 km/h, often occurring in less than 5 min [7]. Some of the mechanisms that are known for the formation of convective downdrafts include drag exerted on air by precipitation, negative buoyancy due to cooling when precipitation evaporates into sub-saturated air, or cooling when latent heat is supplied to melt ice at the freezing level [8]. Microbursts can occur with or without precipitation (wet or dry, respectively), which can produce a virga [8,9,10]. Wet microbursts with heavy rainfall often have a high reflection on the radar [11]. It is possible to determine whether the microbursts will be dry or wet from the vertical profiles of the atmospheric temperature and humidity [12]. Wet microbursts are downbursts that are accompanied by exceptional precipitation [13]. They are formed in thunderstorms with significant vertical growth and an environment having a mean value of the available convective potential energy and vertical gradients above the equivalent of the potential temperature [14,15]. Dry microbursts, on the other hand, are primarily formed from the negative buoyancy force due to evaporation and melting of hydrometeors [9,16,17,18]. For the dry microbursts, the cloud base is usually located at a level of 800 hPa, whereas for the wet microbursts it is usually below 800 hPa [9]. The WMSI (Wet Microburst Severity Index) can be used to predict the maximum wind gusts of a microburst occurrence by convective activity [19]. It can be also used for microburst strength forecasting and, indirectly, for predicting the water level rise following the appearance of a microburst [19]. Predictions of winds, and thus surges, can be performed in real-time using advanced numerical weather forecasting models [20,21].
The northwesterly shamal wind blowing over the Persian Gulf countries causes cold dry weather over the region, which results in cold fronts and eddies, which, in turn, create favorable conditions for the formation of thunderstorms [22,23]. Mojarad et al. [24] demonstrated that most thunderstorm events in Iran form over the coastal regions of the Persian Gulf. Additionally, the most frequent occurrence of storm events along the Persian Gulf coasts is observed in Bushehr province [25]. On 19 March 2017, at 8:00 a.m. local time (04:30 UTC), four waves with a height of approximately 3.1 m approached the coast of Bandar Dayyer from the southwest direction. There were deaths and injuries associated with this storm surge, along with 390 billion Riyals in damage (approximately equivalent to 10 million US dollars) to the infrastructure of the Bandar Dayyer. The same event had an impact on Assaluyeh city on the same day, but the damage was minimal. According to various reports from the relevant organizations, this was the first reported incident of this nature on the coasts of Bushehr province. Due to the rarity of such events and few reliable reports on thunderstorm activity in the region, the present study investigates the atmospheric causes of this incident. In general, this research aims to study the atmospheric causes of storm surge using the data on thunderstorms and microbursts recorded by the meteorological radar of Bushehr.

2. Materials and Methods

2.1. Study Area

Bandar Dayyer (Figure 1) is located in the southern part of Bushehr province. In the present study, data from the Dayyer synoptic station were used. The latitude and longitude of the station are 27°50′ N and 51°56′ E, and its elevation is 4 m a.s.l. Based on Köppen’s climate classification, Bandar Dayyer is an arid region. The climate in the area is warm and dry, with a mean annual temperature of 27.1 °C. The mean annual maximum and minimum temperatures are 31.9 °C and 22.2 °C, respectively. Temperature varies from 17.1 °C in January to 34.7 °C in July. Mean annual rainfall in the period from 1993 to 2014 was equal to 218.9 mm. Maximum monthly precipitation occurs in January, with 77 mm on average, and no detectable precipitation is observed in the period from May to September. The mean annual relative humidity is 55.7%, the average wind speed is 14.7 km/h and the prevailing wind direction is 315° (NW). The mean sea level pressure is equal to 1009 millibars [26].

2.2. Methods

2.2.1. Data

In the present study, data from Bandar Dayyer Synoptic Station, European Center for Medium-Range Weather Forecasts (ECMWF) (window from 20° to 40° N and 30° to 65° E), Global Forecast System (FNL), and visible band images from Moderate Resolution Imaging Spectroradiometer (MODIS) sensor, built to NASA specifications by Santa Barbara Remote Sensing, Goleta, CA, USA and meteorological radar images of Bushehr were examined. Parameters analyzed include sea level pressure, geopotential height, temperature, dew point temperature, zonal and meridional wind components, wind velocity, vertical velocity, and relative and specific humidity. Additionally, data from the buoy of Bushehr was collected, and from it, the specifications of waves during storm surges were obtained, including the rotation period (40 s), wave height (3.1 m), and a number of waves (4). Initially, for the best illustration of the atmospheric flow patterns on the day of the event, 0.125-degree ECMWF data, the maps of the mean sea-level pressure and geopotential height, vertical velocity, specific humidity, and jet streams for 850, 500, and 300 hPa were visualized. Since the outflow profile of thunderstorms is very different from the synoptic boundary layer wind profile [27,28], the WRF model is used to display finer details.

2.2.2. WRF Model

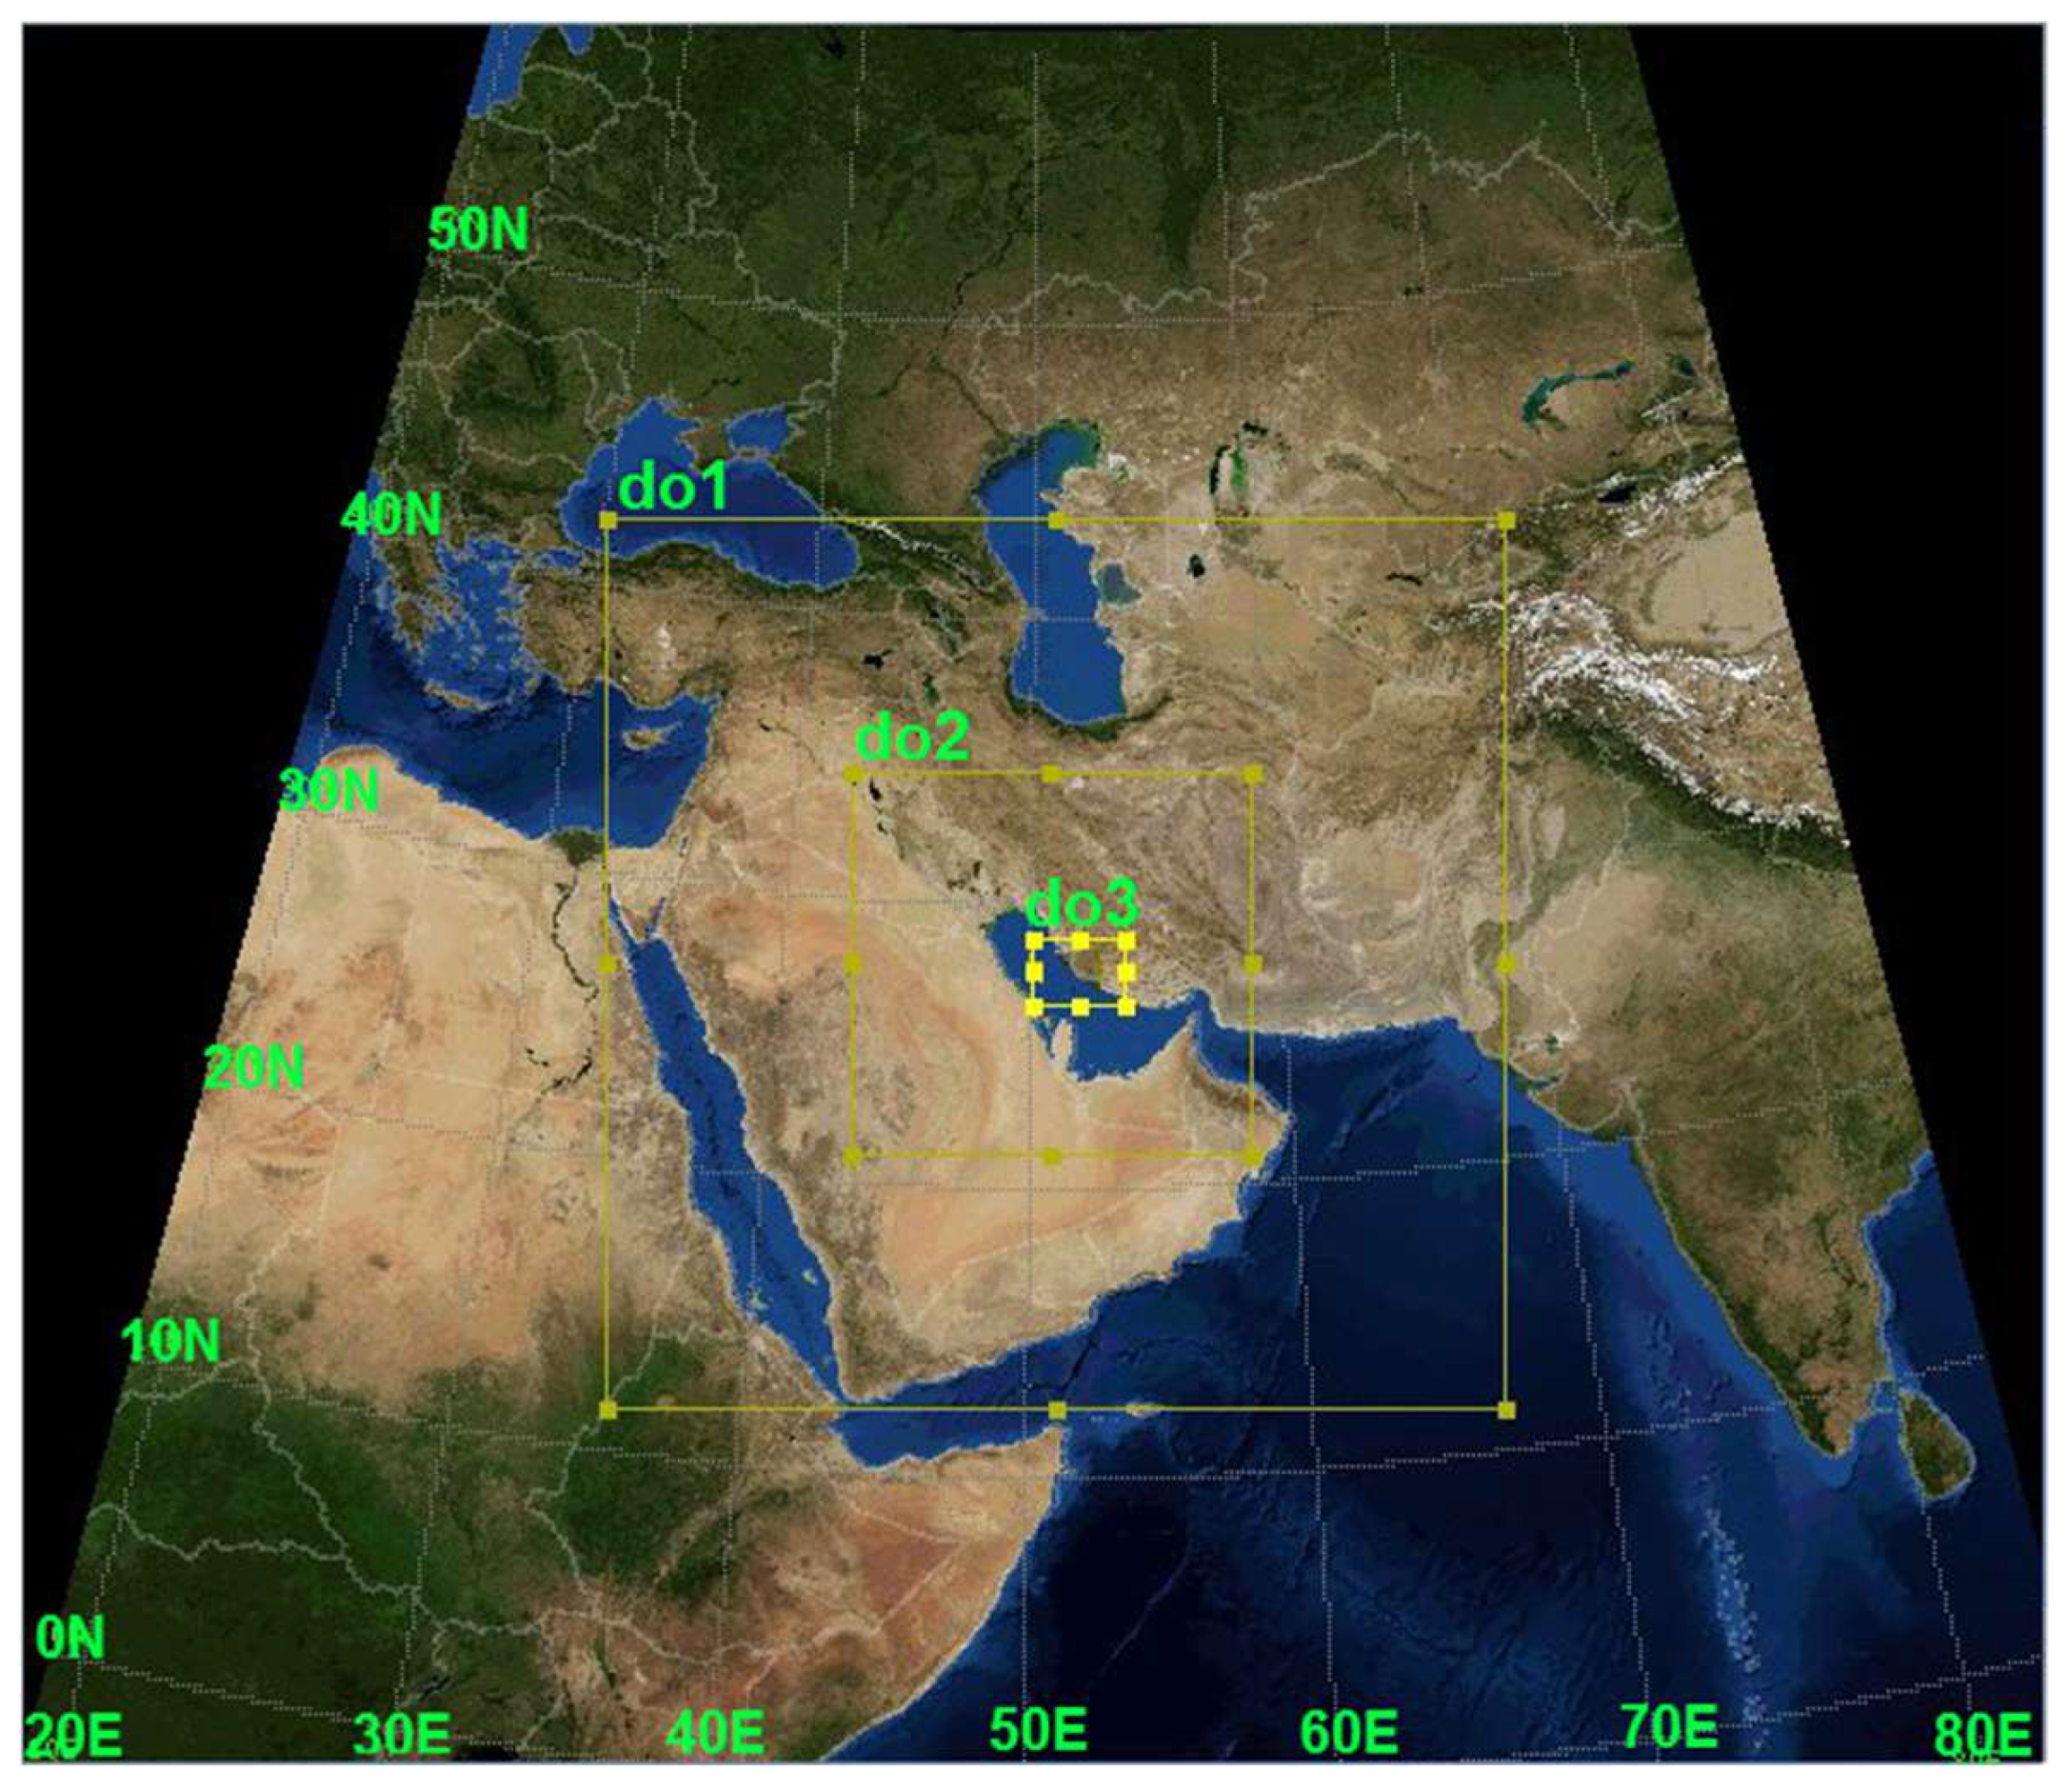
The Weather Research and Forecasting (WRF) model, developed by the National Center for Atmospheric Research (NCAR), is a framework used for the numerical prediction of weather in the mesoscale [29]. To run the model, a domain first needs to be defined. Four nested domains were defined following a two-way nesting strategy, with a spatial resolution of 36 (D01), 12 (D02), and 4 km (D03). Each domain had 100 × 100 grid points in the latitudinal and longitudinal directions. The area of each domain is shown in Figure 2. The WRF model offers several solvers of the physical and chemical equations, enabling optimization of the model for a specific weather phenomenon and a study area. For microphysics parameterization, radiation (shortwave/longwave), land surface, surface layer, PBL, and cumulus formation the Thompson six-class microphysics scheme, Dudhia/RRTM, the Noah Land Surface Model, Monin Obokhov, YSU, and Kain-Fritsch were selected, respectively.
In the event of thunderstorms, two of the most important components are vertical velocity (here, a positive sign was assumed for the upward movements, and negative for the downward movements) and wind shear. The vertical velocity ω and w are related to each other by the equation:
ω = d p d t = p t + v   p + w p z
The hydrostatic equation is then used to replace p z :
ω = ρ g w + p t + v   p .
where ρ is the air density, υ is the wind speed in m/s, and g is the gravity acceleration of the Earth equal to 9.8 m/s2. Since the time intervals of local pressure variations, especially in outsized atmospheric systems, are essentially equal to or less than 10 hPa per day, and are usually smaller than this time interval due to the pseudo-sense property of the large-scale atmospheric motion, it can therefore be assumed that the Equation (2) can be simplified by removing the last two terms and the linear relationship between ω and w is then obtained [30]:
ω = ρ g w .
The wind shear is an essential part of the geostrophic wind profile in a hydrostatic and instability atmosphere, and the relationship between geostrophic vertical wind shear and temperature gradient is obtained by the thermal wind relation:
v g p = p ( 1 f k × p Φ ) = R f p k × p T
where p is pressure (here assumed as vertical), v g 1 f k × p Φ is the geostrophic wind, Φ is geopotential height, R is the gas constant for dry air, k is the vertical unit vector, and f is the Coriolis parameter or frequency.

3. Results and Discussion

Large-scale meteorological patterns play a primary role in individual weather events because they are synoptic-scale patterns in thermodynamic fields [31]. To investigate the overall state of the atmosphere, firstly the weather maps extracted from ECMWF data were examined, and then a more detailed analysis of the atmosphere in the studied area using the WRF model was performed and the outputs from it were analyzed.

3.1. Analysis of Synoptic Maps

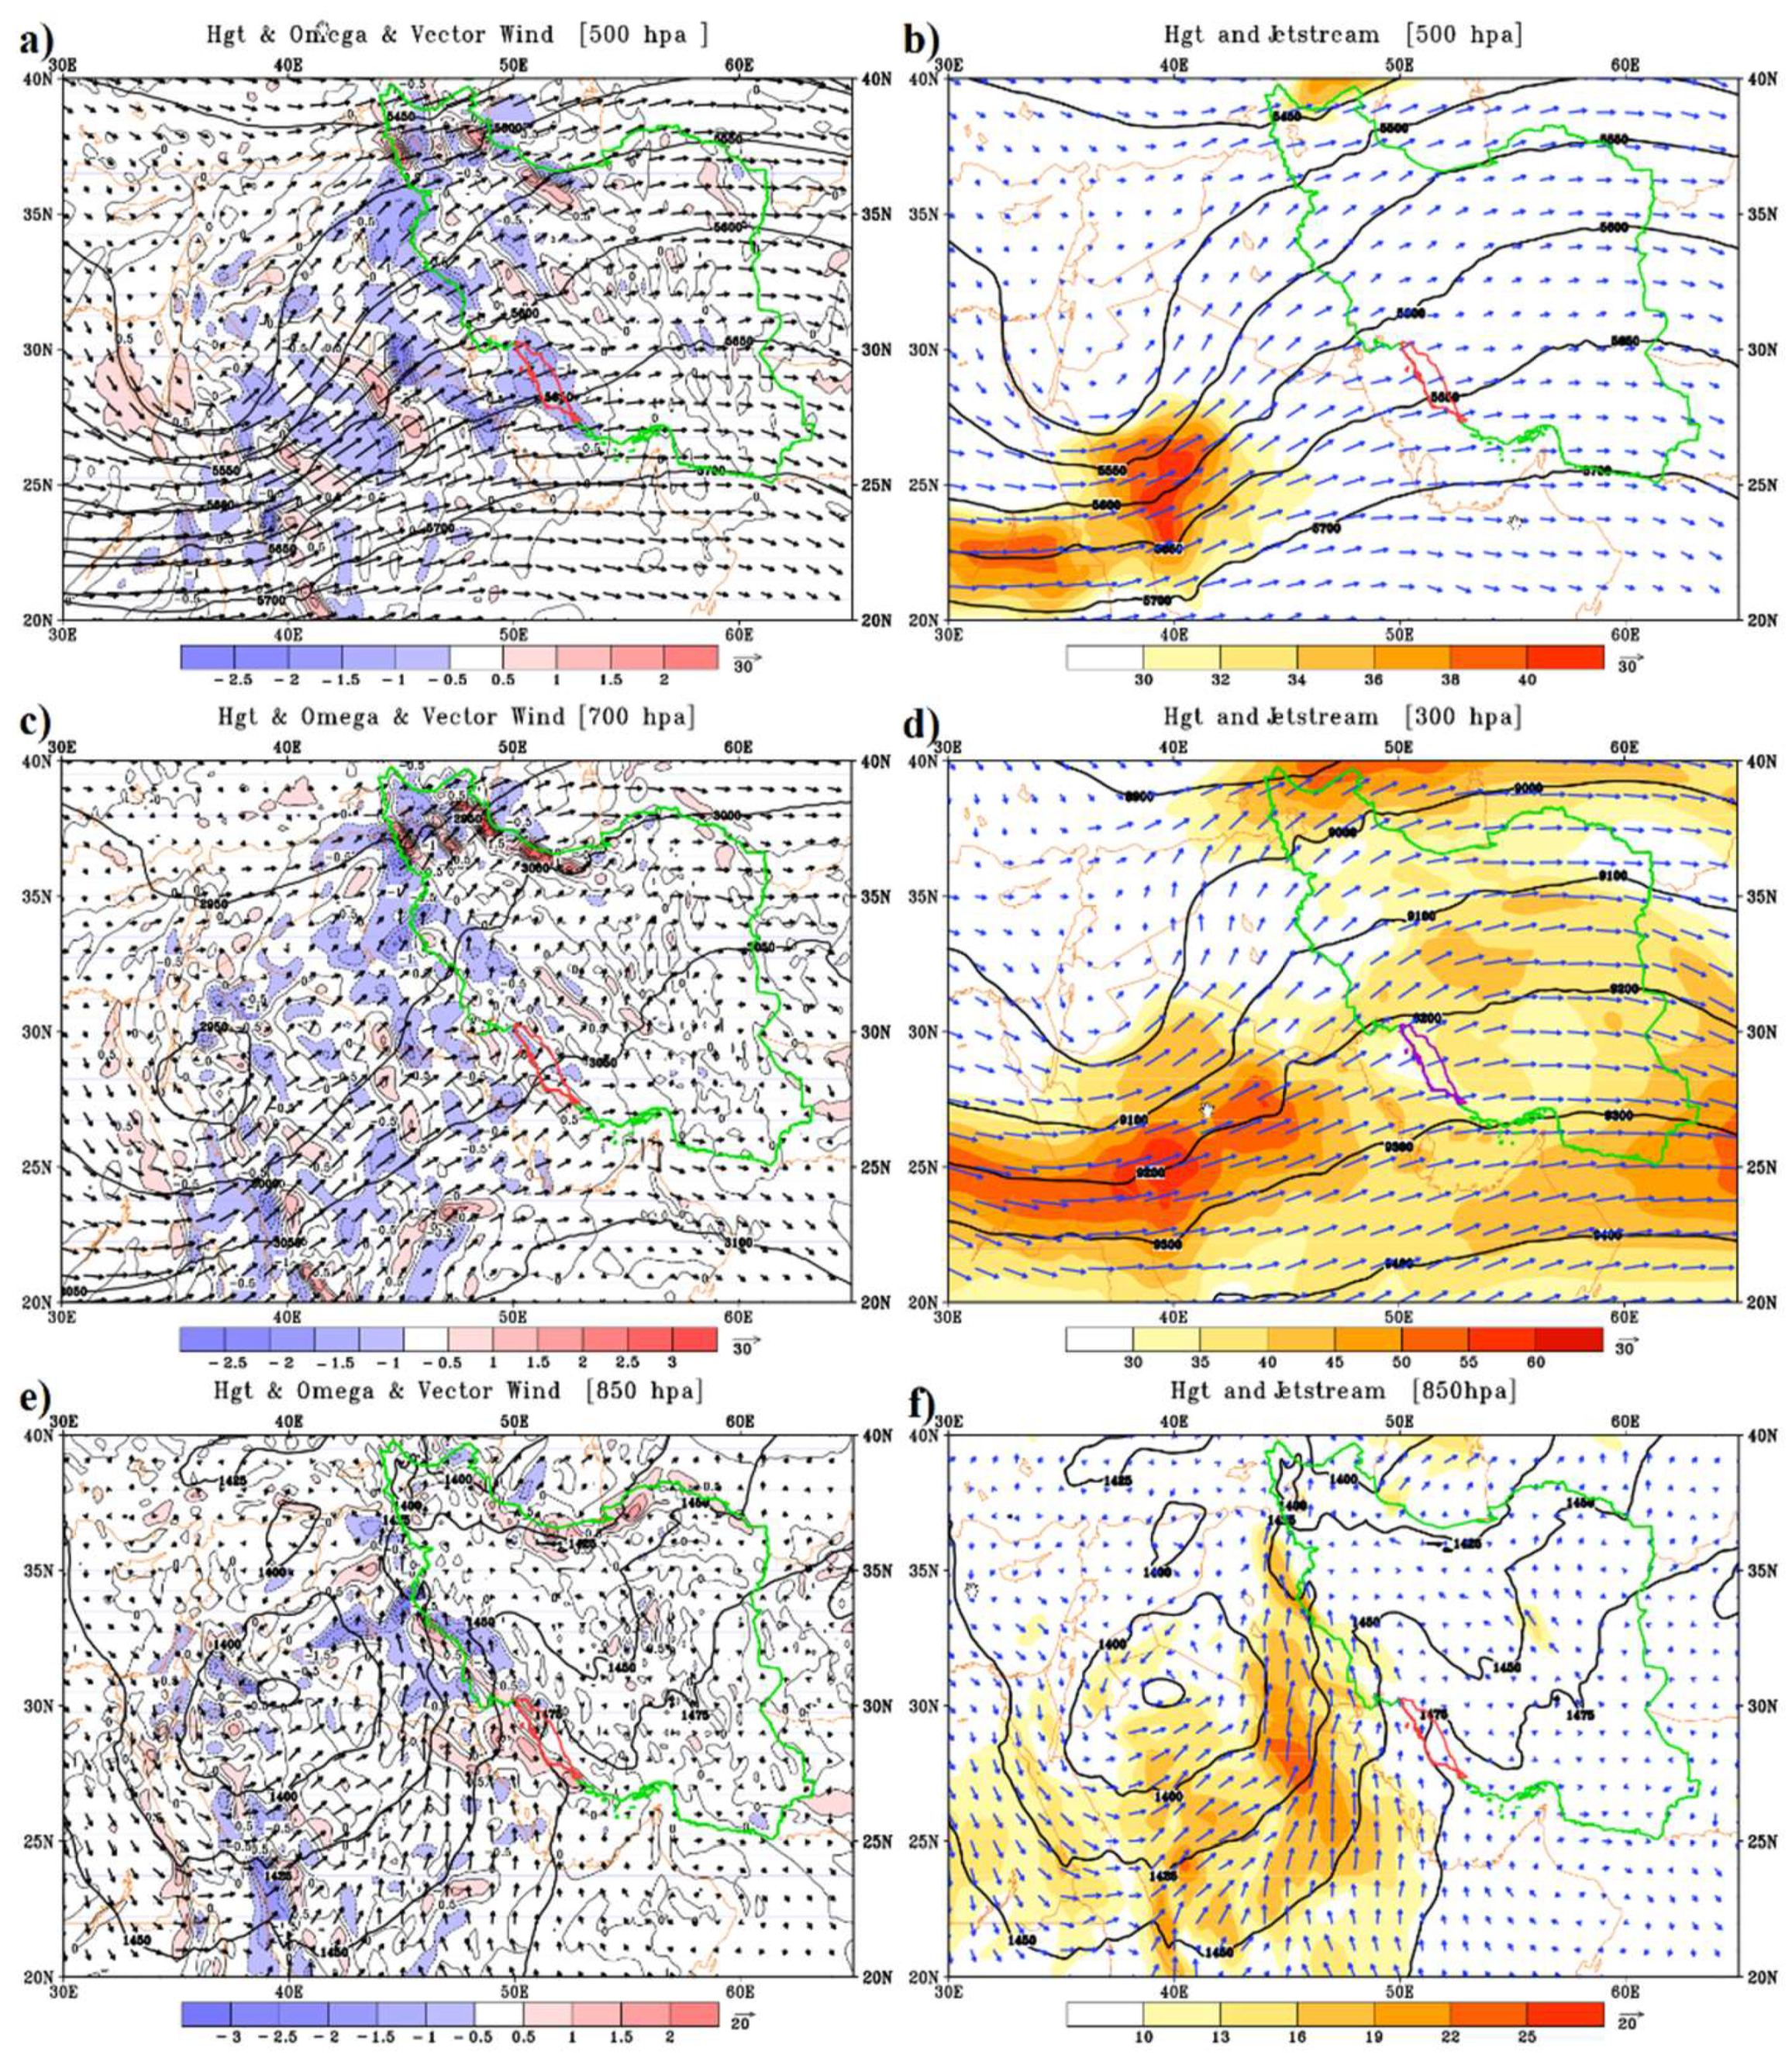
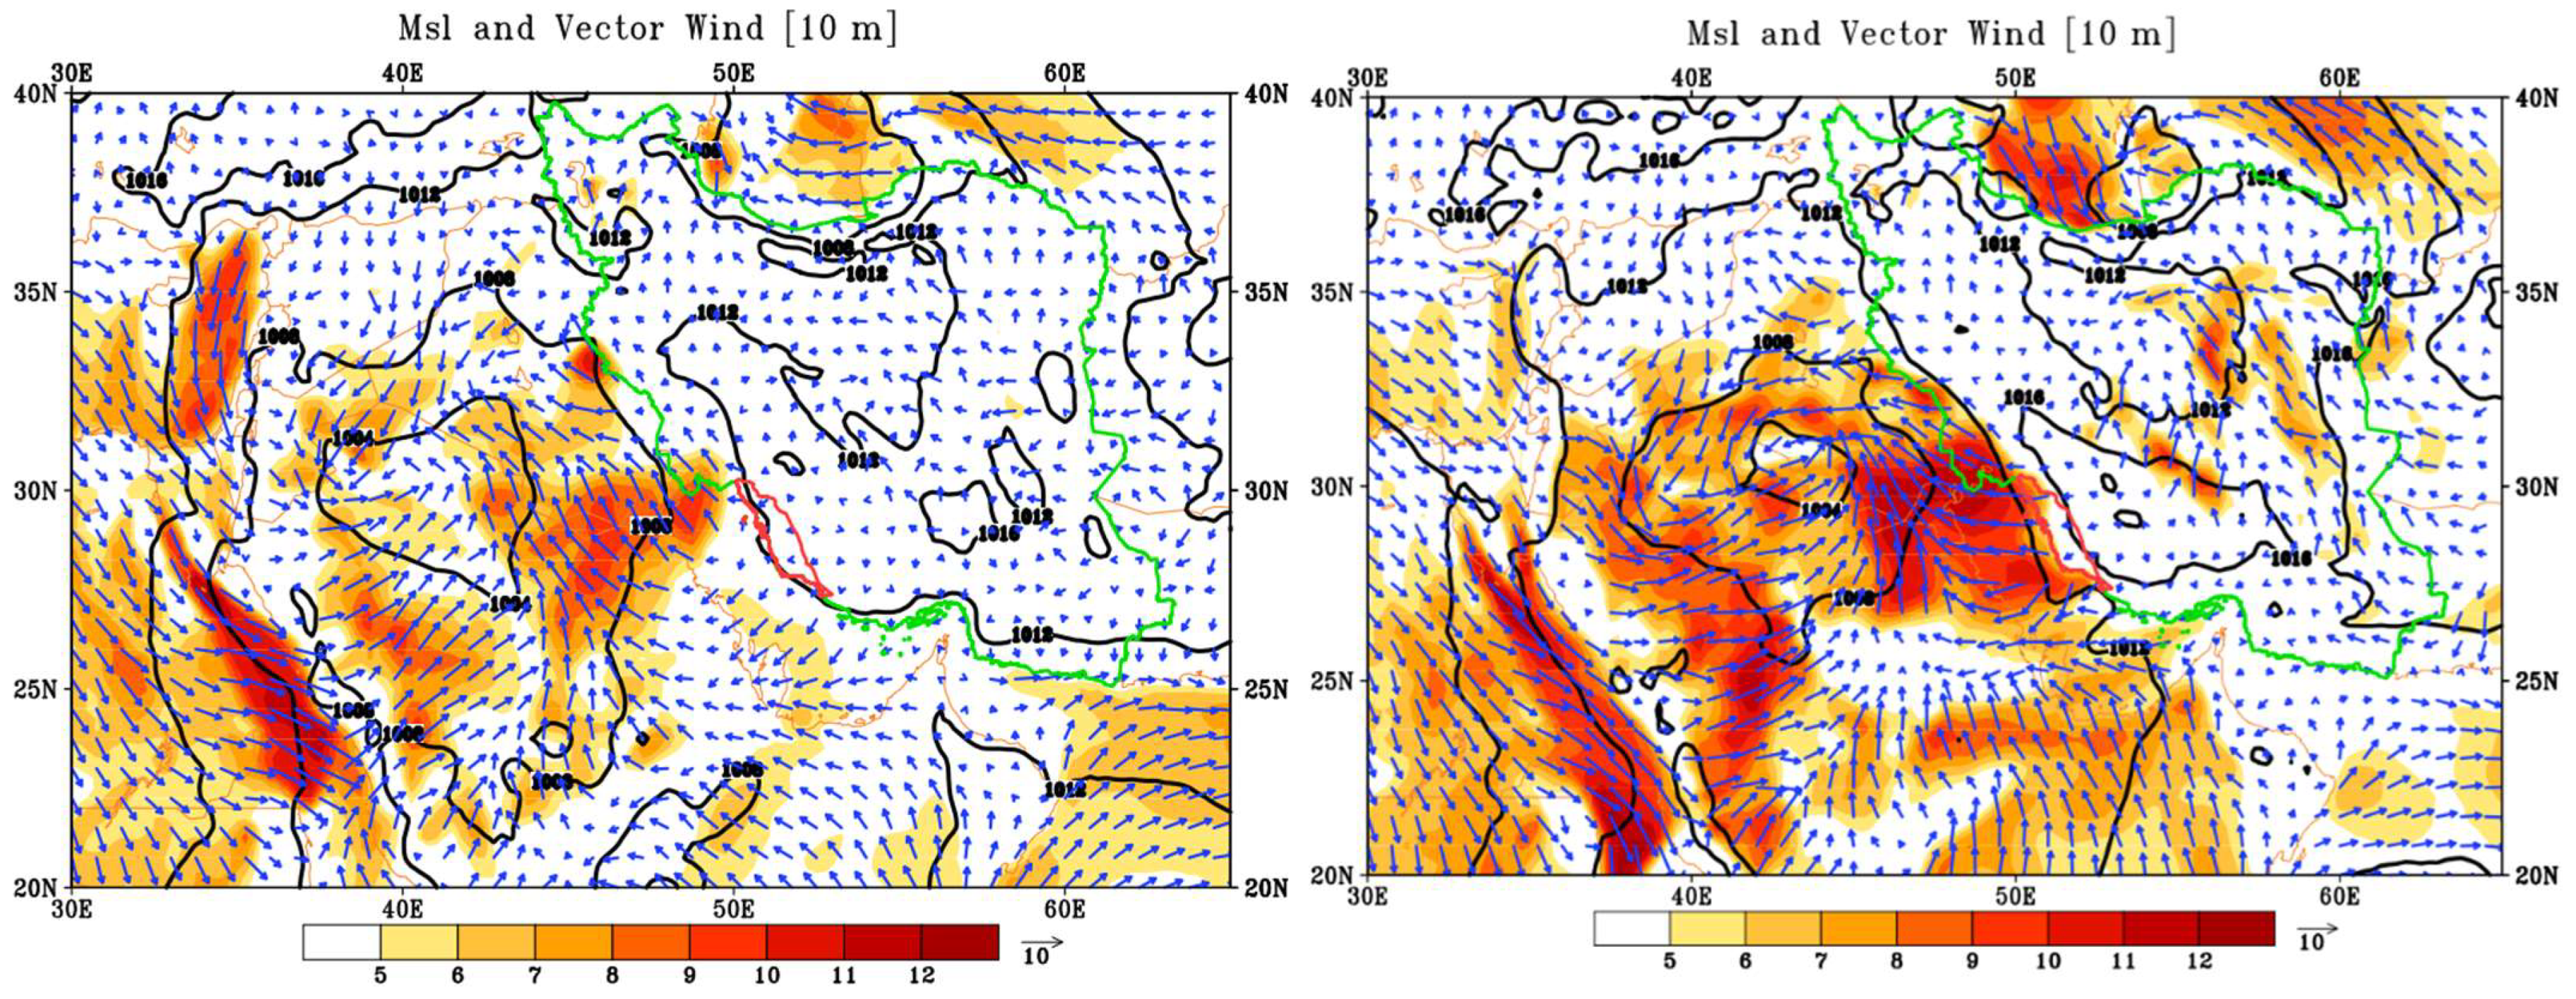
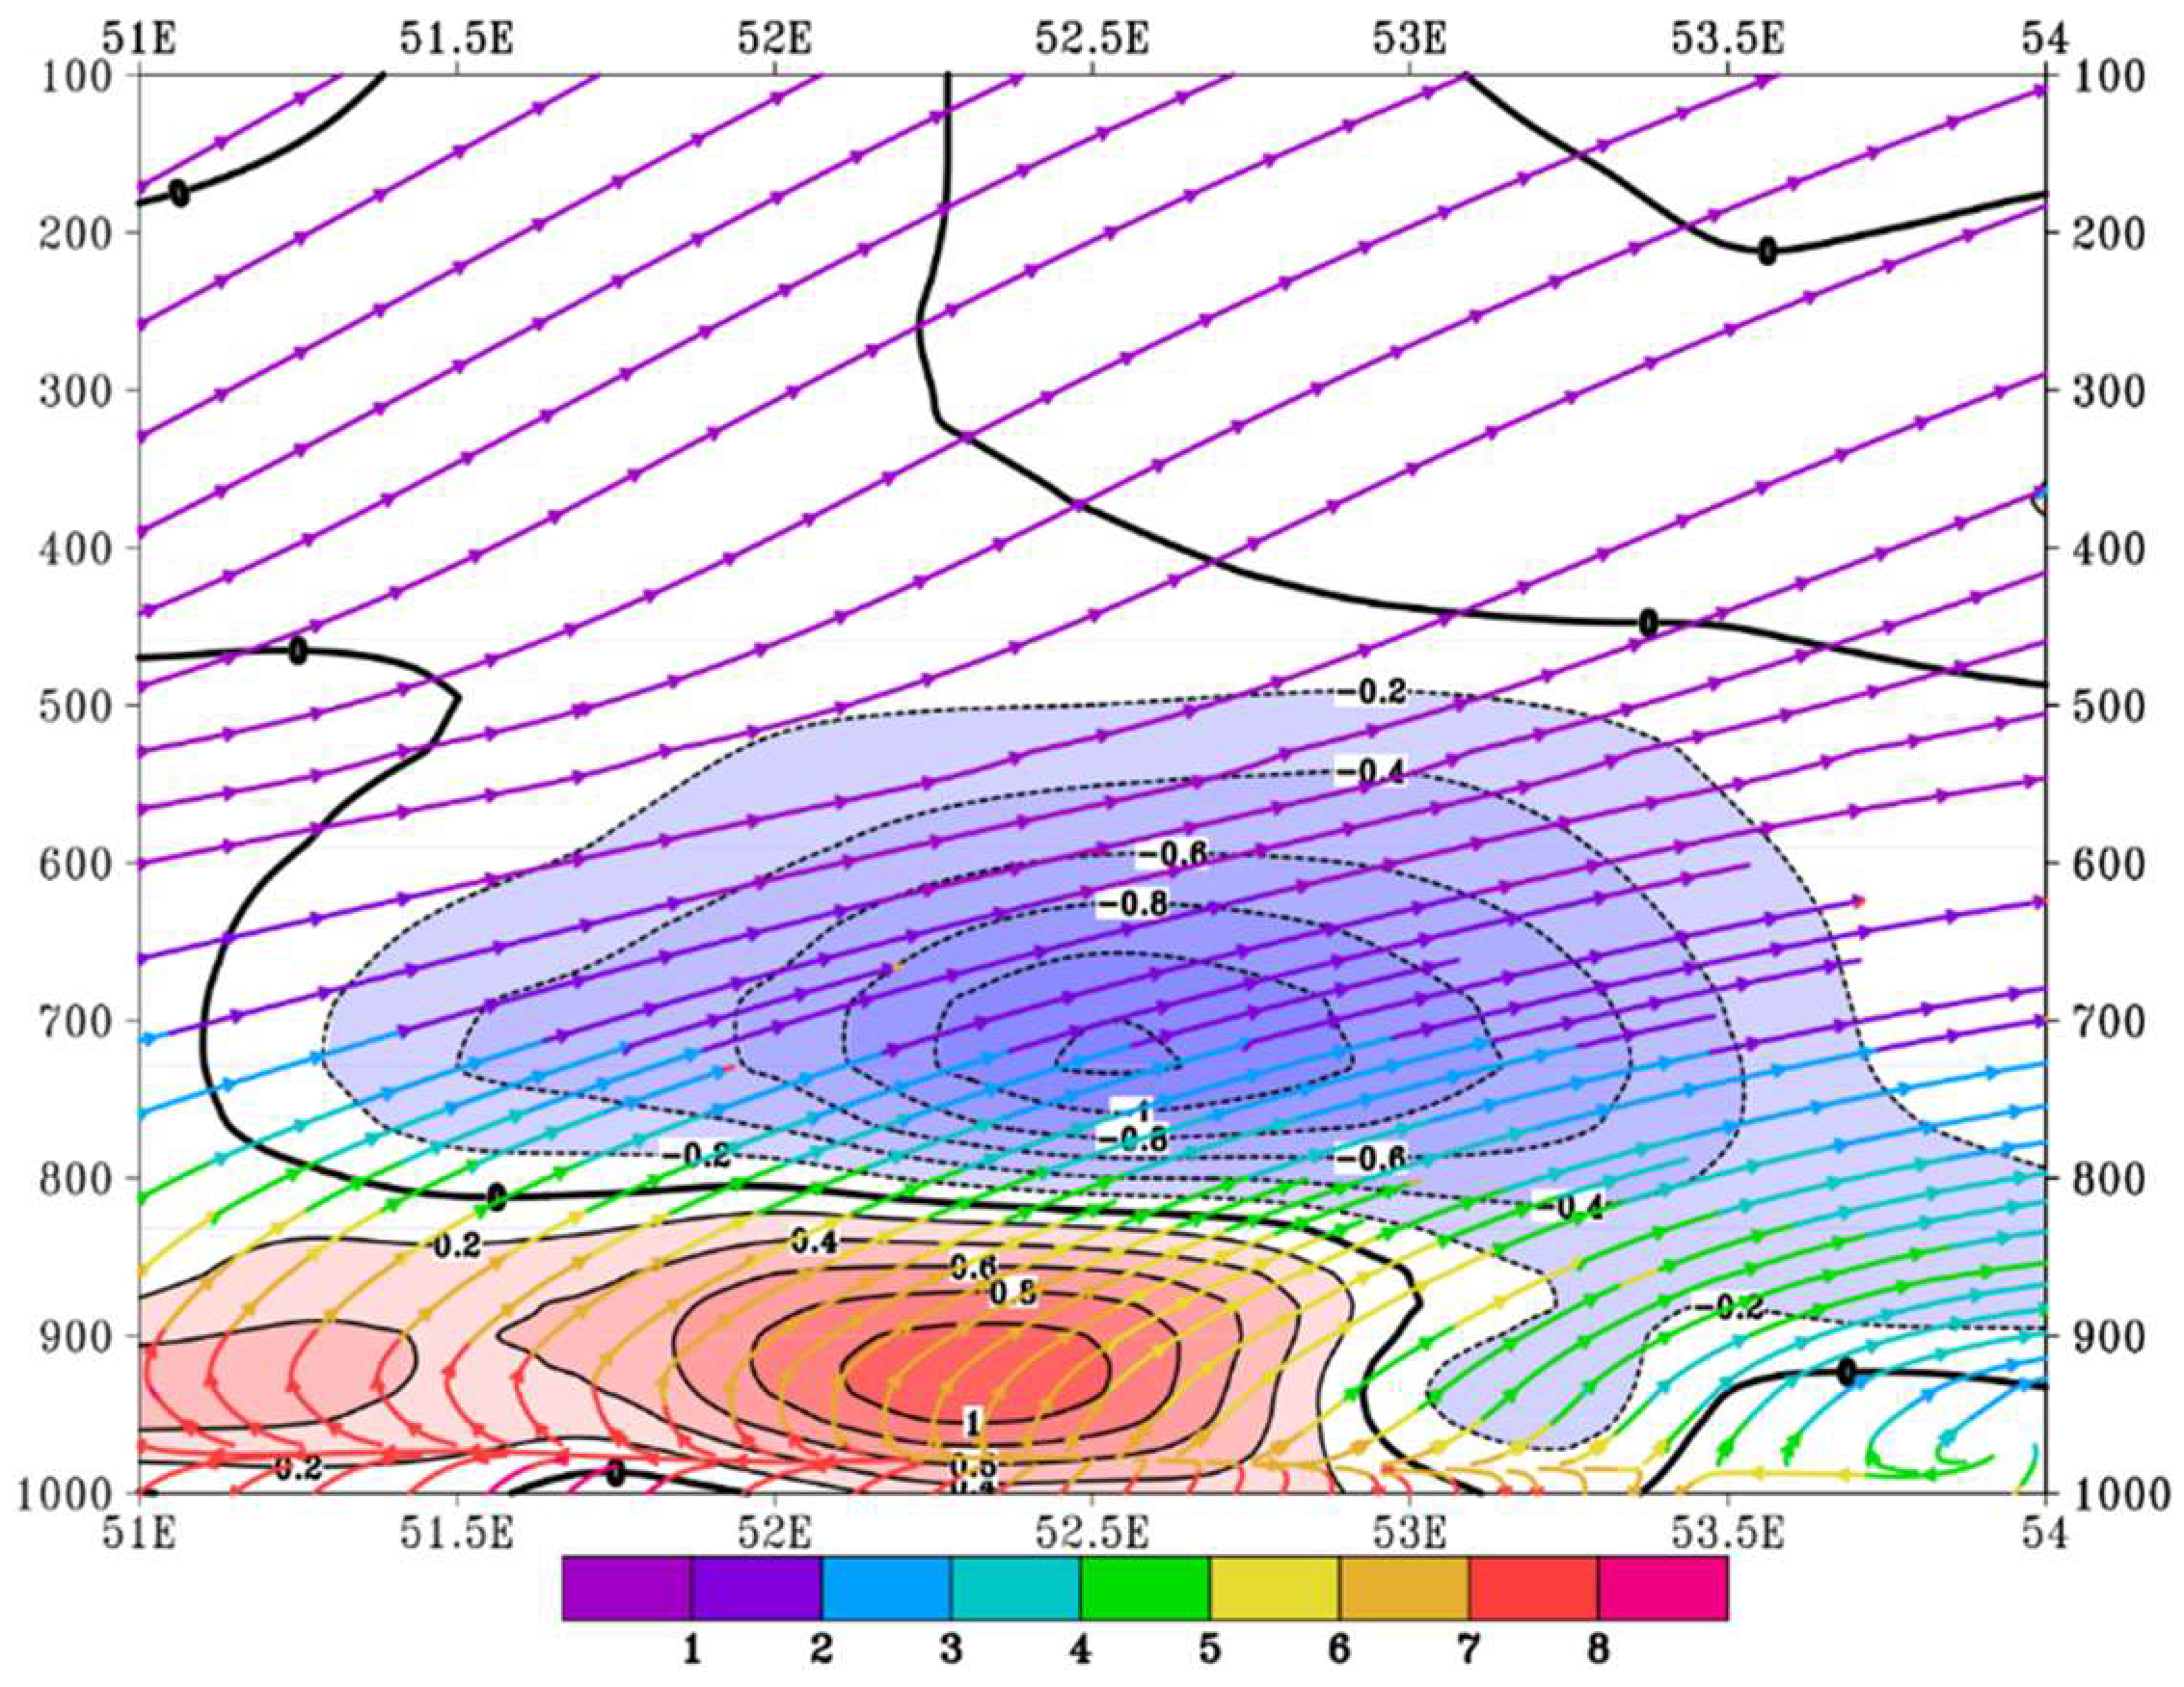
In Figure 3, the maps of the geopotential height (HGT) and the vertical velocity of 500 hPa (a), a jet stream of 500 hPa (b) the geopotential height and the vertical velocity of 700 hPa (c), a jetstream of 300 hPa (d), geopotential height and vertical velocity of 850 hPa (e) and a jet stream of 850 hPa (f) for 19 March 00:00 UTC are presented. In Figure 4, the maps of the mean sea-level pressure for 19 March at 00:00 UTC and 06:00 UTC are plotted. In Figure 5, the maximum reflectivity (MAX) (a) and Plan Position Indicator (PPl) (b) from Bushehr Meteorological Radar are presented. In Figure 6, vertical profiles of the velocity (Pa s–1) and moisture advection (10−5 g kg−1 s−1) in the studied area are illustrated.
In front of the trough, which was located on the east coast of the Persian Gulf (Figure 3a,c), a warm advection was created, which destabilized the situation in the Persian Gulf coast by activating the low-pressure center (Figure 4). The above conditions have created deep convections and consequently have caused the formation and intensification of thunderstorms parallel to the eastern coast of the Persian Gulf (Figure 5 (top)).
Buoyancy and vertical pressure gradient effects are two essential factors causing vertical accelerations in convective storms [32]. Moreover, McCaul and Weisman [33] showed that buoyancy effects are not as important for supercell thunderstorms as dynamic pressure effects. The positioning of the jet stream at 300, 500, and 850 hectopascals (hPa) (Figure 3b,d,f) with a maximum velocity of 55, 40, and 24 m/s, respectively, in the west of the studied area, led to an exacerbation of the instability and eventually, to the formation of cumulonimbus (CB) clouds and deep supercell thunderstorms in the studied area (Figure 5 (top)). The above conditions most likely caused a change in the value of vertical velocity in the eastern side of the trough before the onset of the thunderstorm and the destructive waves caused by it. The vertical velocity values at 850, 700 and 500 hPa were −1.2, −0.8, and −1.5 Pa·s−1, respectively (Figure 3a,c,e). The sea level pressure maps (Figure 4) it show that the presence of a dynamic anticyclone with 1016 hPa pressure in the south-west of Iran caused much more moisture advection in the study site, as maximum specific humidity reached up to 9 g/kg at 1000 hPa level and 7 g/kg at 700 hPa level (Figure 6). The values of vertical velocity were negative at 00 UTC on 19 March, before the occurrence of the wave event, and created favorable rising conditions due to the divergences created at the upper levels of the atmosphere. On the other hand, the simultaneous occurrence of a cyclonic circulation to the north and a convergent flow of humidity in the southern parts of Iraq, Kuwait, and part of Saudi Arabia led to the formation of the cold front (Figure 7) and deep convections in the study area, which in turn may be a cause for the formation of a squall line longer than 100 km (Figure 5 (top)). It was already shown that when the mid-level winds are close to geostrophic and show strong vorticity, ideal conditions for frontogenesis formation occurs [34,35,36].
The radar images (top panel of Figure 5) show that the thickness of the cumulonimbus clouds in the huge convection cell was approximately 15 km and their base was about 1 km a.s.l. The severe subsidence of cold air under clouds (downburst) and its collision with warm air near the ground might be the reason for the creation of a gusty front. The PPIV radar image (bottom panel of Figure 5) showed the appearance of the highly amplified wind velocity (gusty) when the intense lightning in front of the squall line occurred.
The flashes of lightning routinely precede severe weather phenomena like wind, hail, and tornadoes by tens of minutes. The fast expansion of the updraft (as indicated by increased maximum reflectivity of 56 dBZ and increased velocity of 30 m/s), which usually creates severe weather aloft and assists the ice production process, and in turn forces lightning activity, probably had a crucial effect on the cloud electrification, and induced the lightning strikes [37]. Between 00:00 and 06:00 UTC on 19 March 2017, lightning flash density was about 3 per km2 and the maximum spatial radius of the lightning flashes was about 5 km. The lightning rates and other unusual electrical phenomena in supercell storms are likely much greater than in ordinary thunderstorms [38]. In this particular case, the creation of the flashes of lightning developed bidirectionally [39], with leaders with positive and negative ends propagating outward in opposite directions from the starting point [39]. Between the first cloud to a ground lightning strike and the first 25 dBZ radar echo passed only around 15–30 min.
To sum up, the causes of the severe weather, squall line, and positive cloud to ground lightning were the low-level jet axis feeding warm moist air from the south-southwest, approaching the dry line marking the edge of the humid air, and severe tropospheric shear in a veering flow. Because these conditions were taking place over the sea, they created huge waves and raised the water level to an abnormal value.

3.2. Analysis of the WRF Model Results

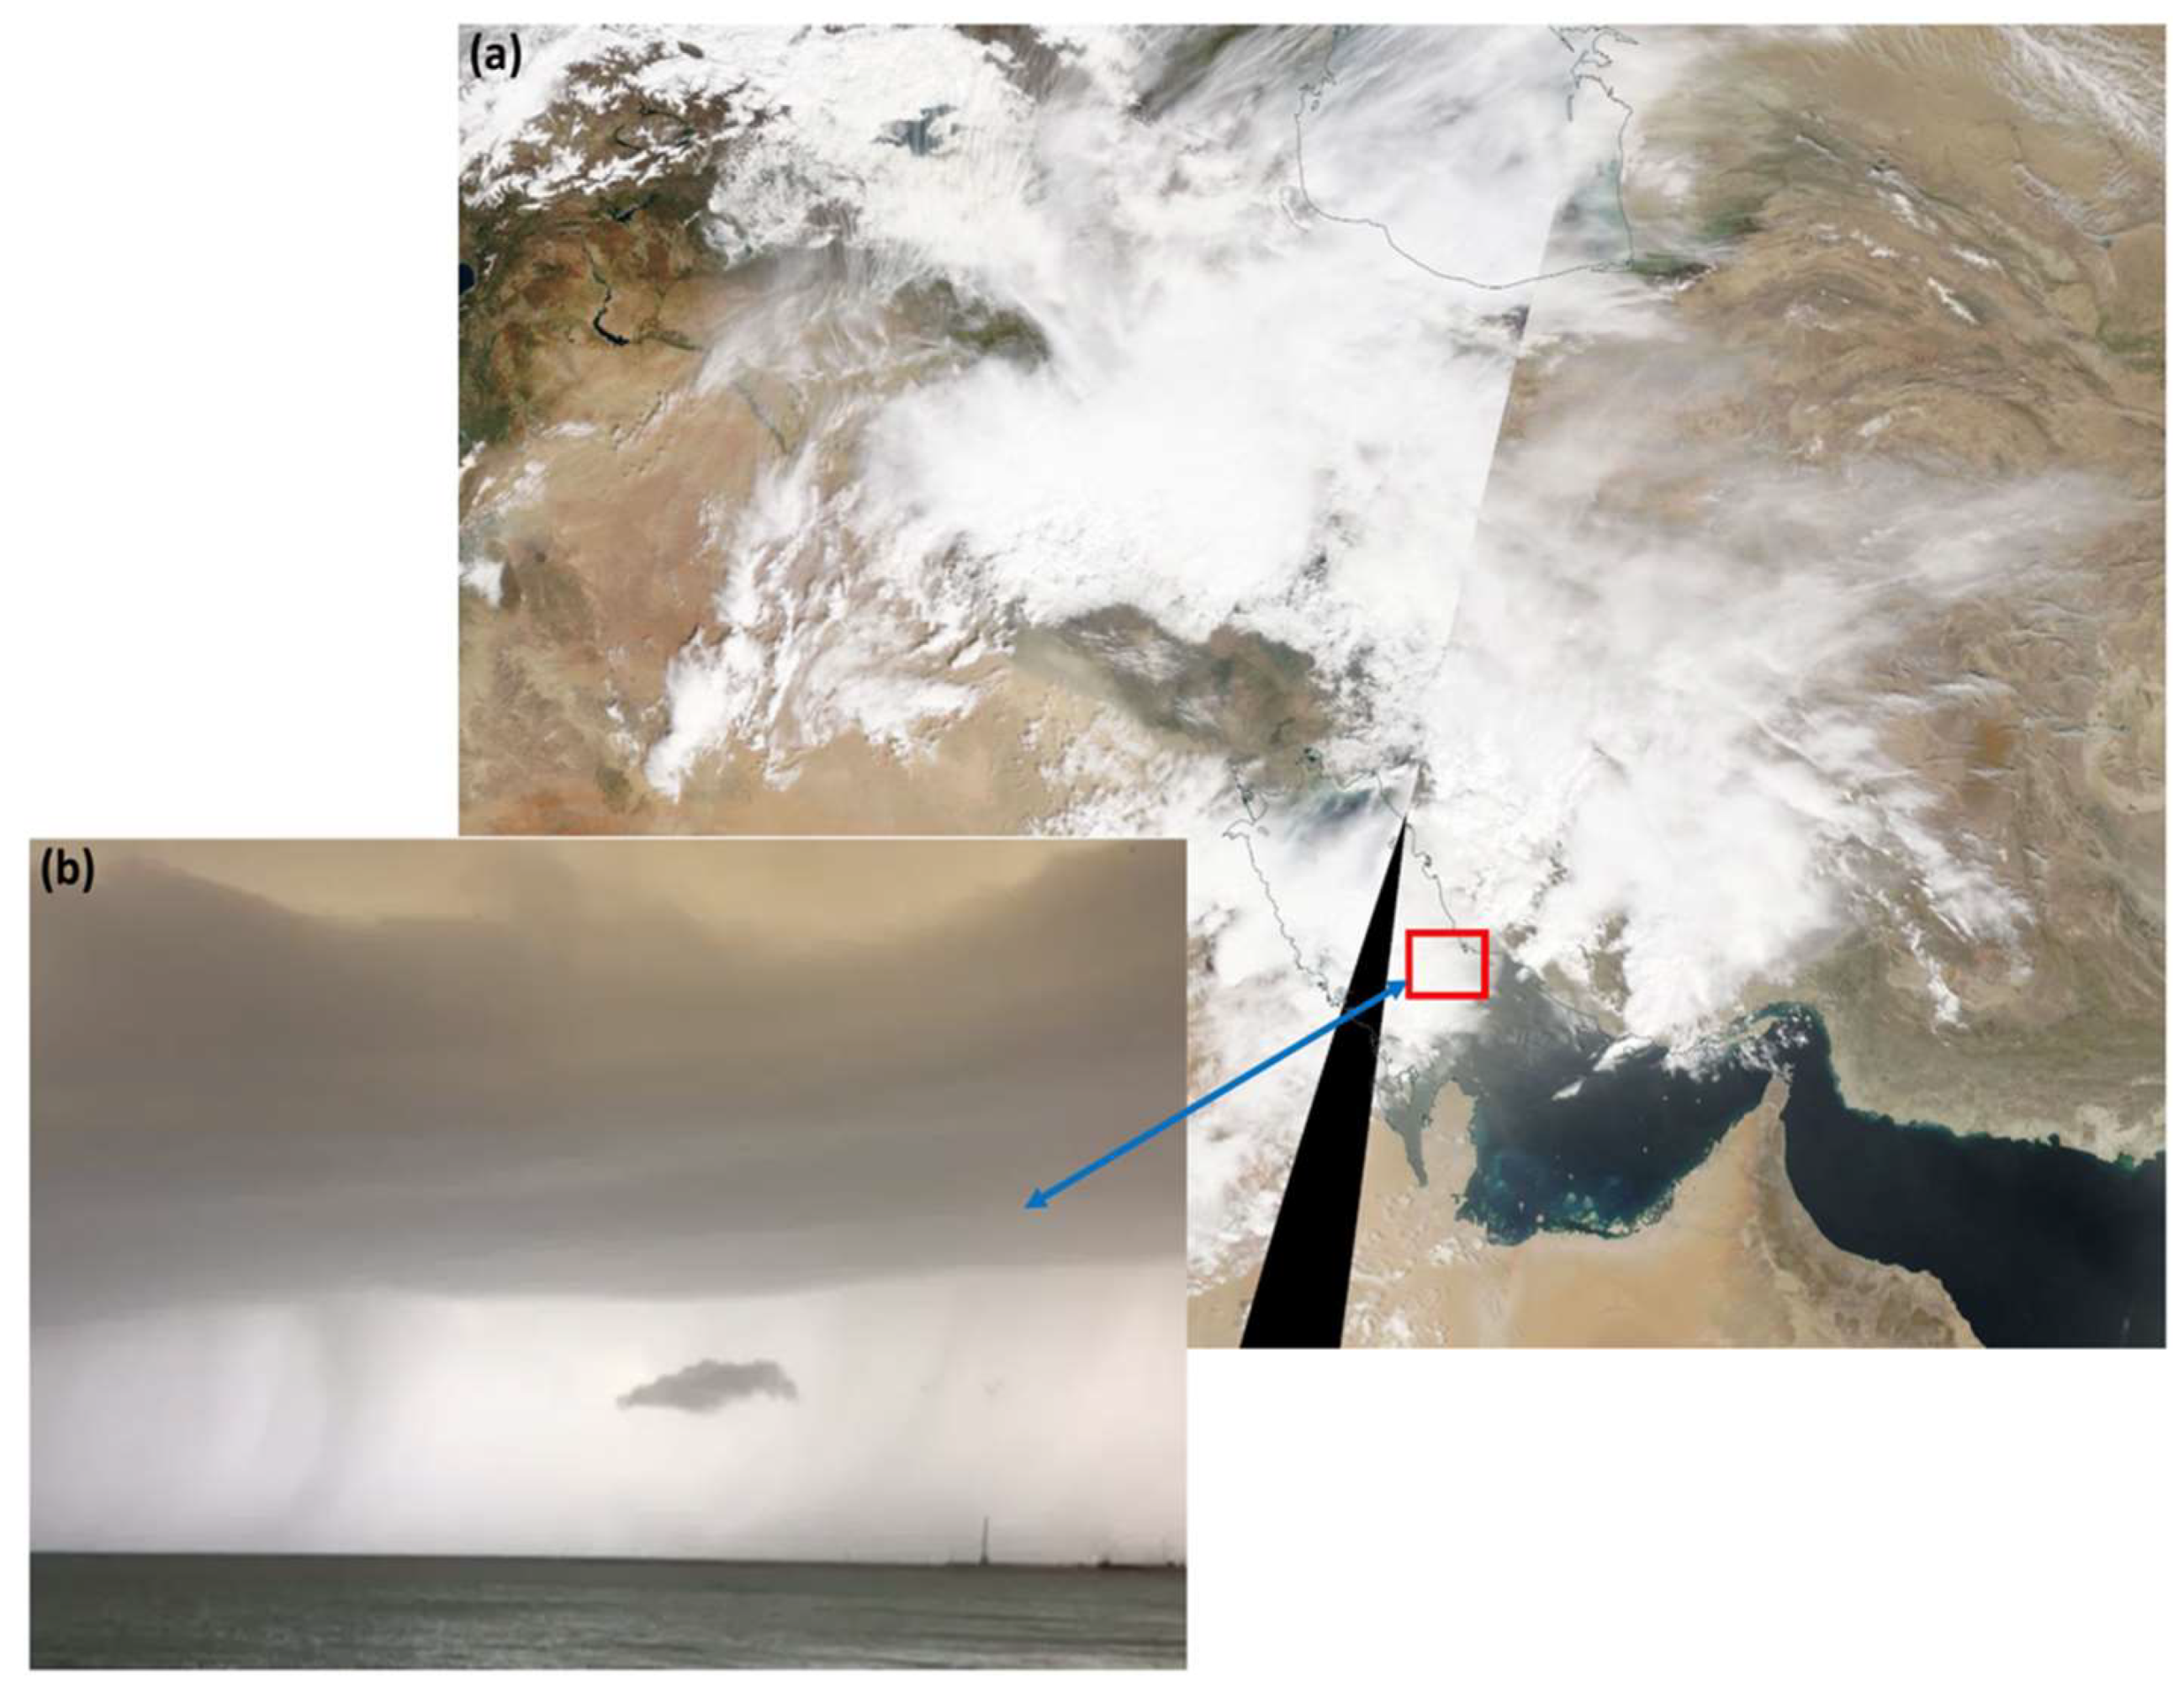
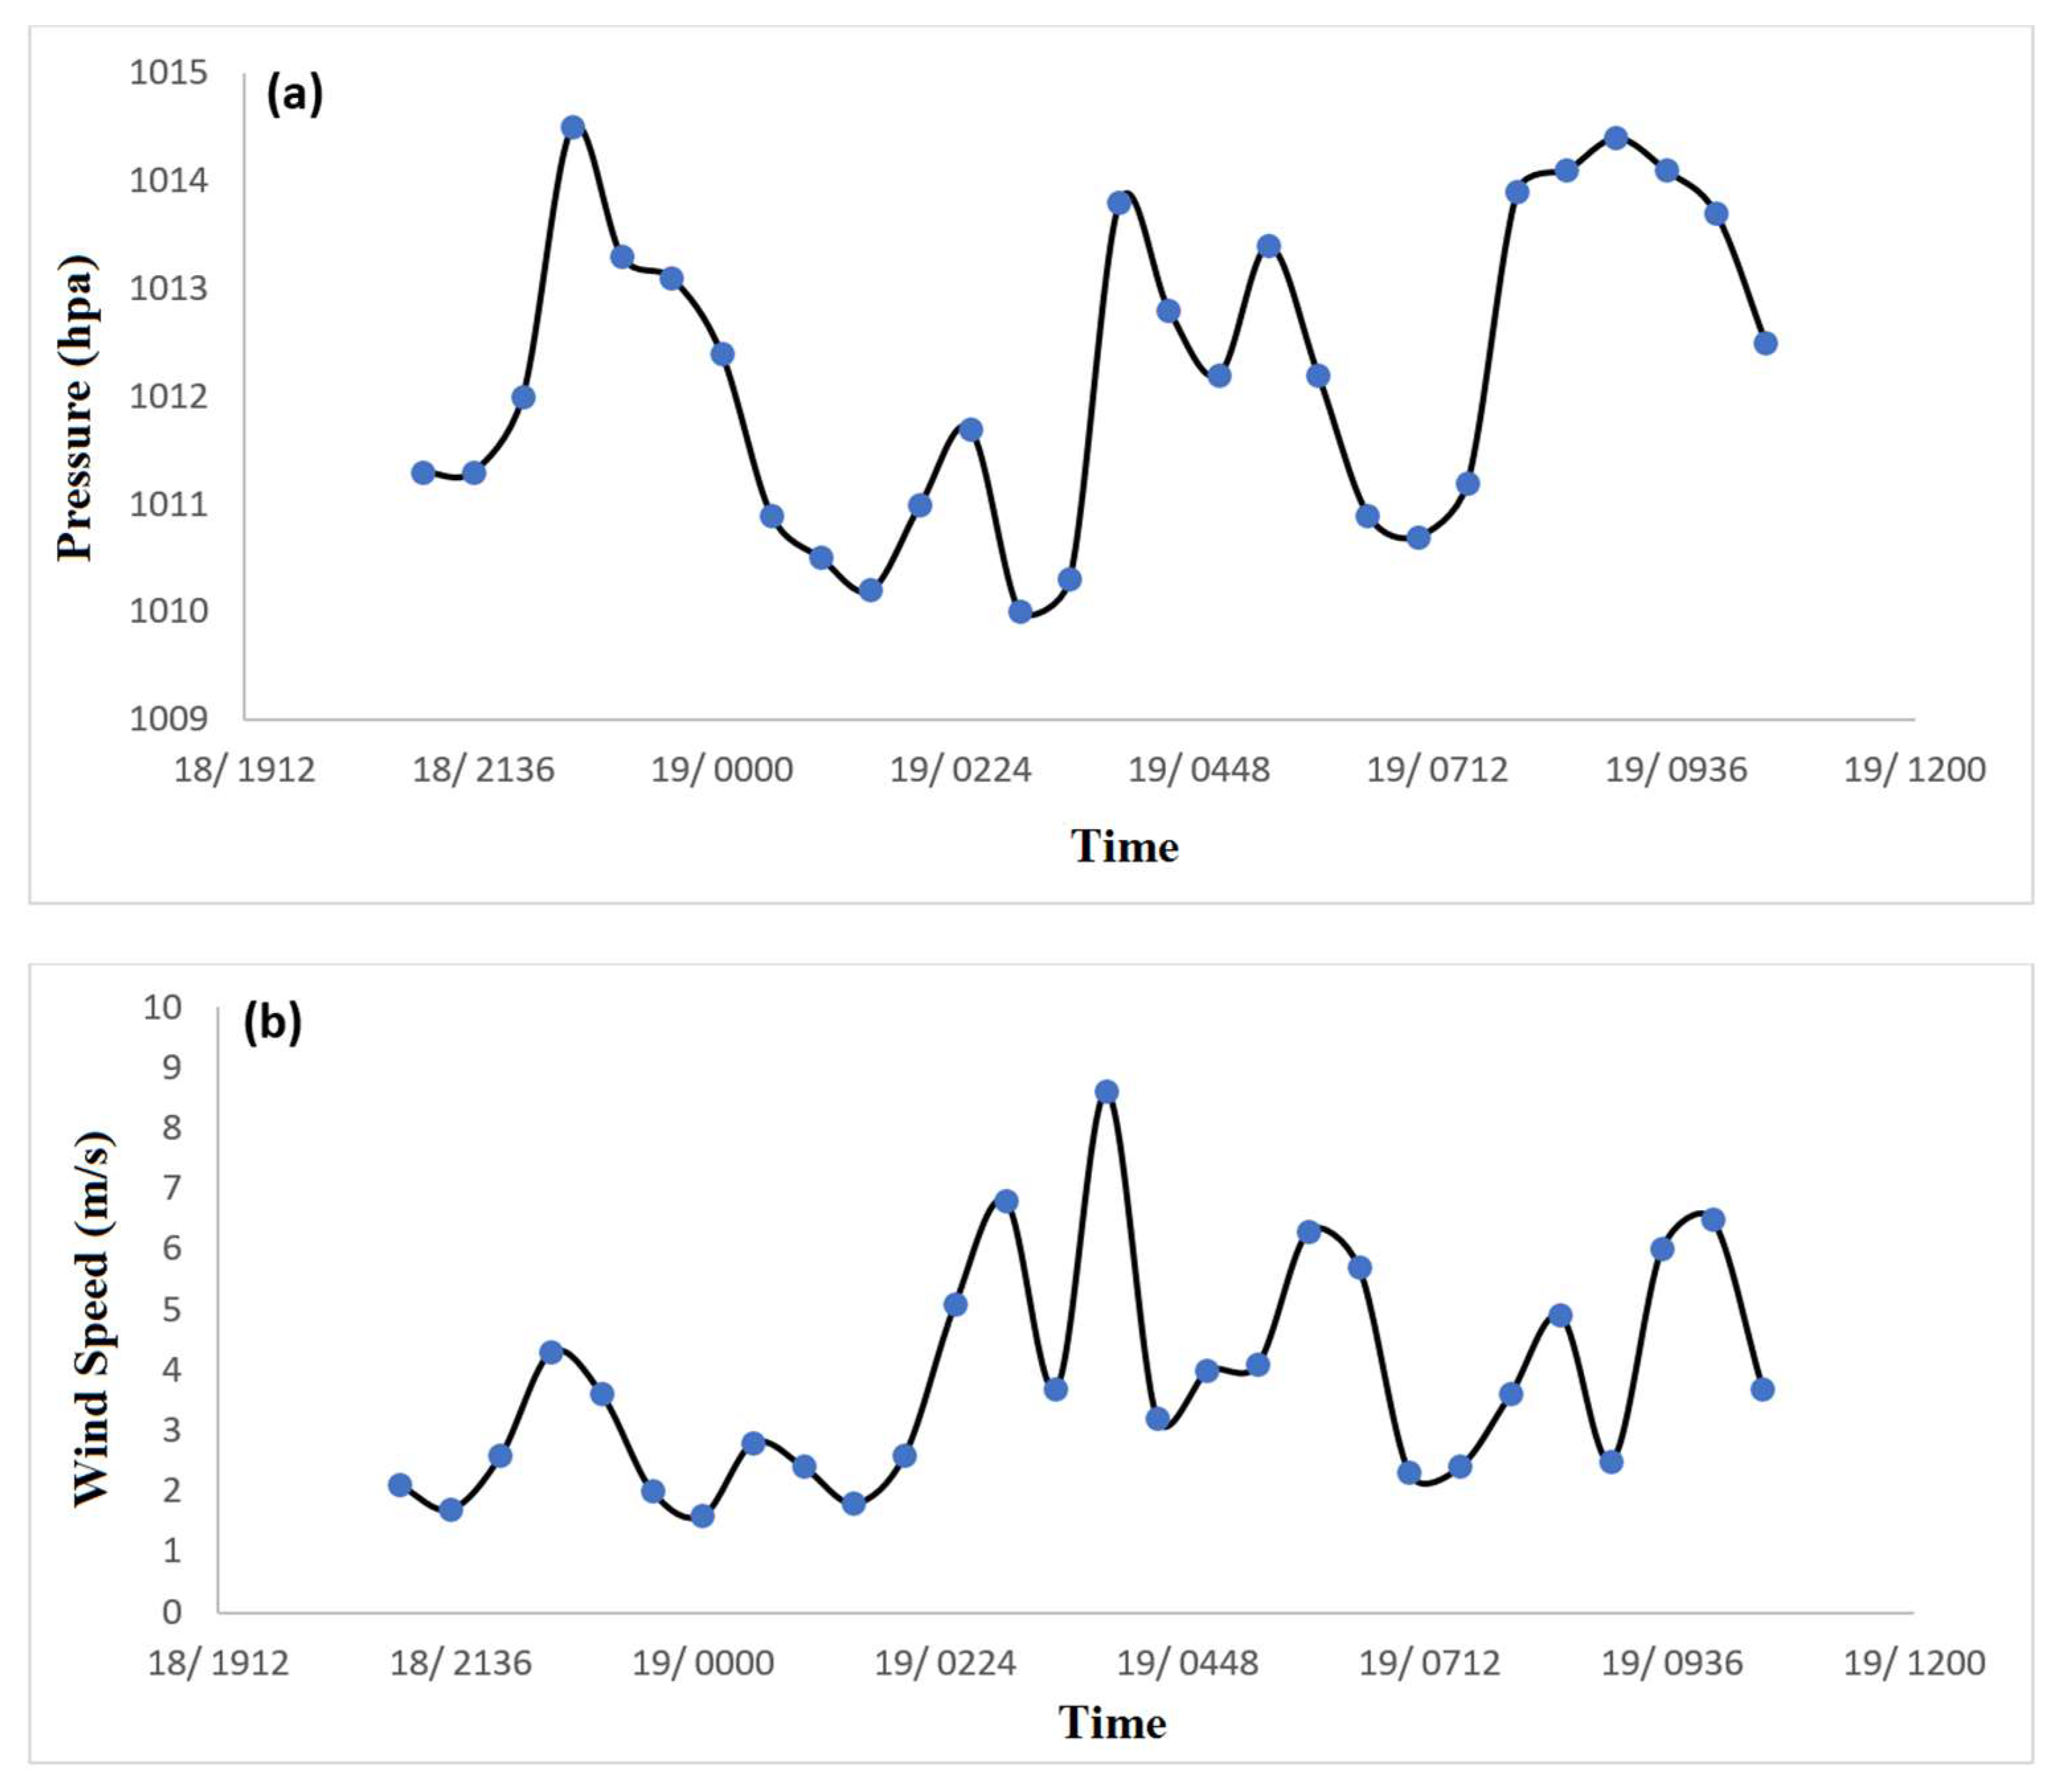
Figure 8 shows the changes in the pressure (panel a) and wind speed (panel b) from 6 h before to 6 h after the storm surge incident. At 3:30 UTC (i.e., the closest time to the storm surge incidence) the Bandar Dayyer station recorded an atmospheric pressure of 1012 hPa near the coast and the wind speed dropped from 7 m/s to 3.5 m/s (Figure 8b). In contrast, the wind shear in the vertical profile was probably a cause for the curving of the upstream and downstream flow axis, which ultimately was the reason for the creation of the new cells along the gust front by the upstream flows (Figure 5, top panel). Descending cold air caused the formation of a high-pressure center at the sea surface. In addition, the temperature gradient between the high-pressure center and ambient air in the lower altitudes, and also the temperature gradient among thunderstorm cells in upper atmosphere levels, produced a destructive wind with a high velocity. Rising warm moist air on the gust front created a mass of clouds called “shelf clouds” in the region (Figure 7b). As it is shown in Figure 5 (top panel), due to the very powerful gust front and its instability, a well-defined storm line formed in a progressive frontier region. The rate of expansion for these fronts is usually between 5 and 15 m/s, creating straight-line winds, in which velocity and depth are somewhat controlled by the mass continuity requirement. The frontogenesis and updraft flow occurred in the front plane, whereas a horizontal gradient of potential temperature occurred in the wind convergence zone, which is consistent with Sawyer’s [40] findings. The thunderstorm formed downdraft flows due to the mixing of raindrops with ambient air that was relatively dry. Under such conditions, the air was not saturated, and this led to the evaporation of raindrops and the absorption of latent heat, which eventually caused the air to cool down and increased the negative buoyancy in the atmosphere. Such downbursts are known as strong wind gust generators [14,41,42]. The damaging convective wind events are typically created by a broad range of environmental factors which create the wet, hybrid, and dry microburst [43]. Investigations of the microbursts that occurred between 15 May and 9 August 1982 suggested that they had a life span of about 5 to 15 min, with severe winds lasting from 2 to 4 min [44].
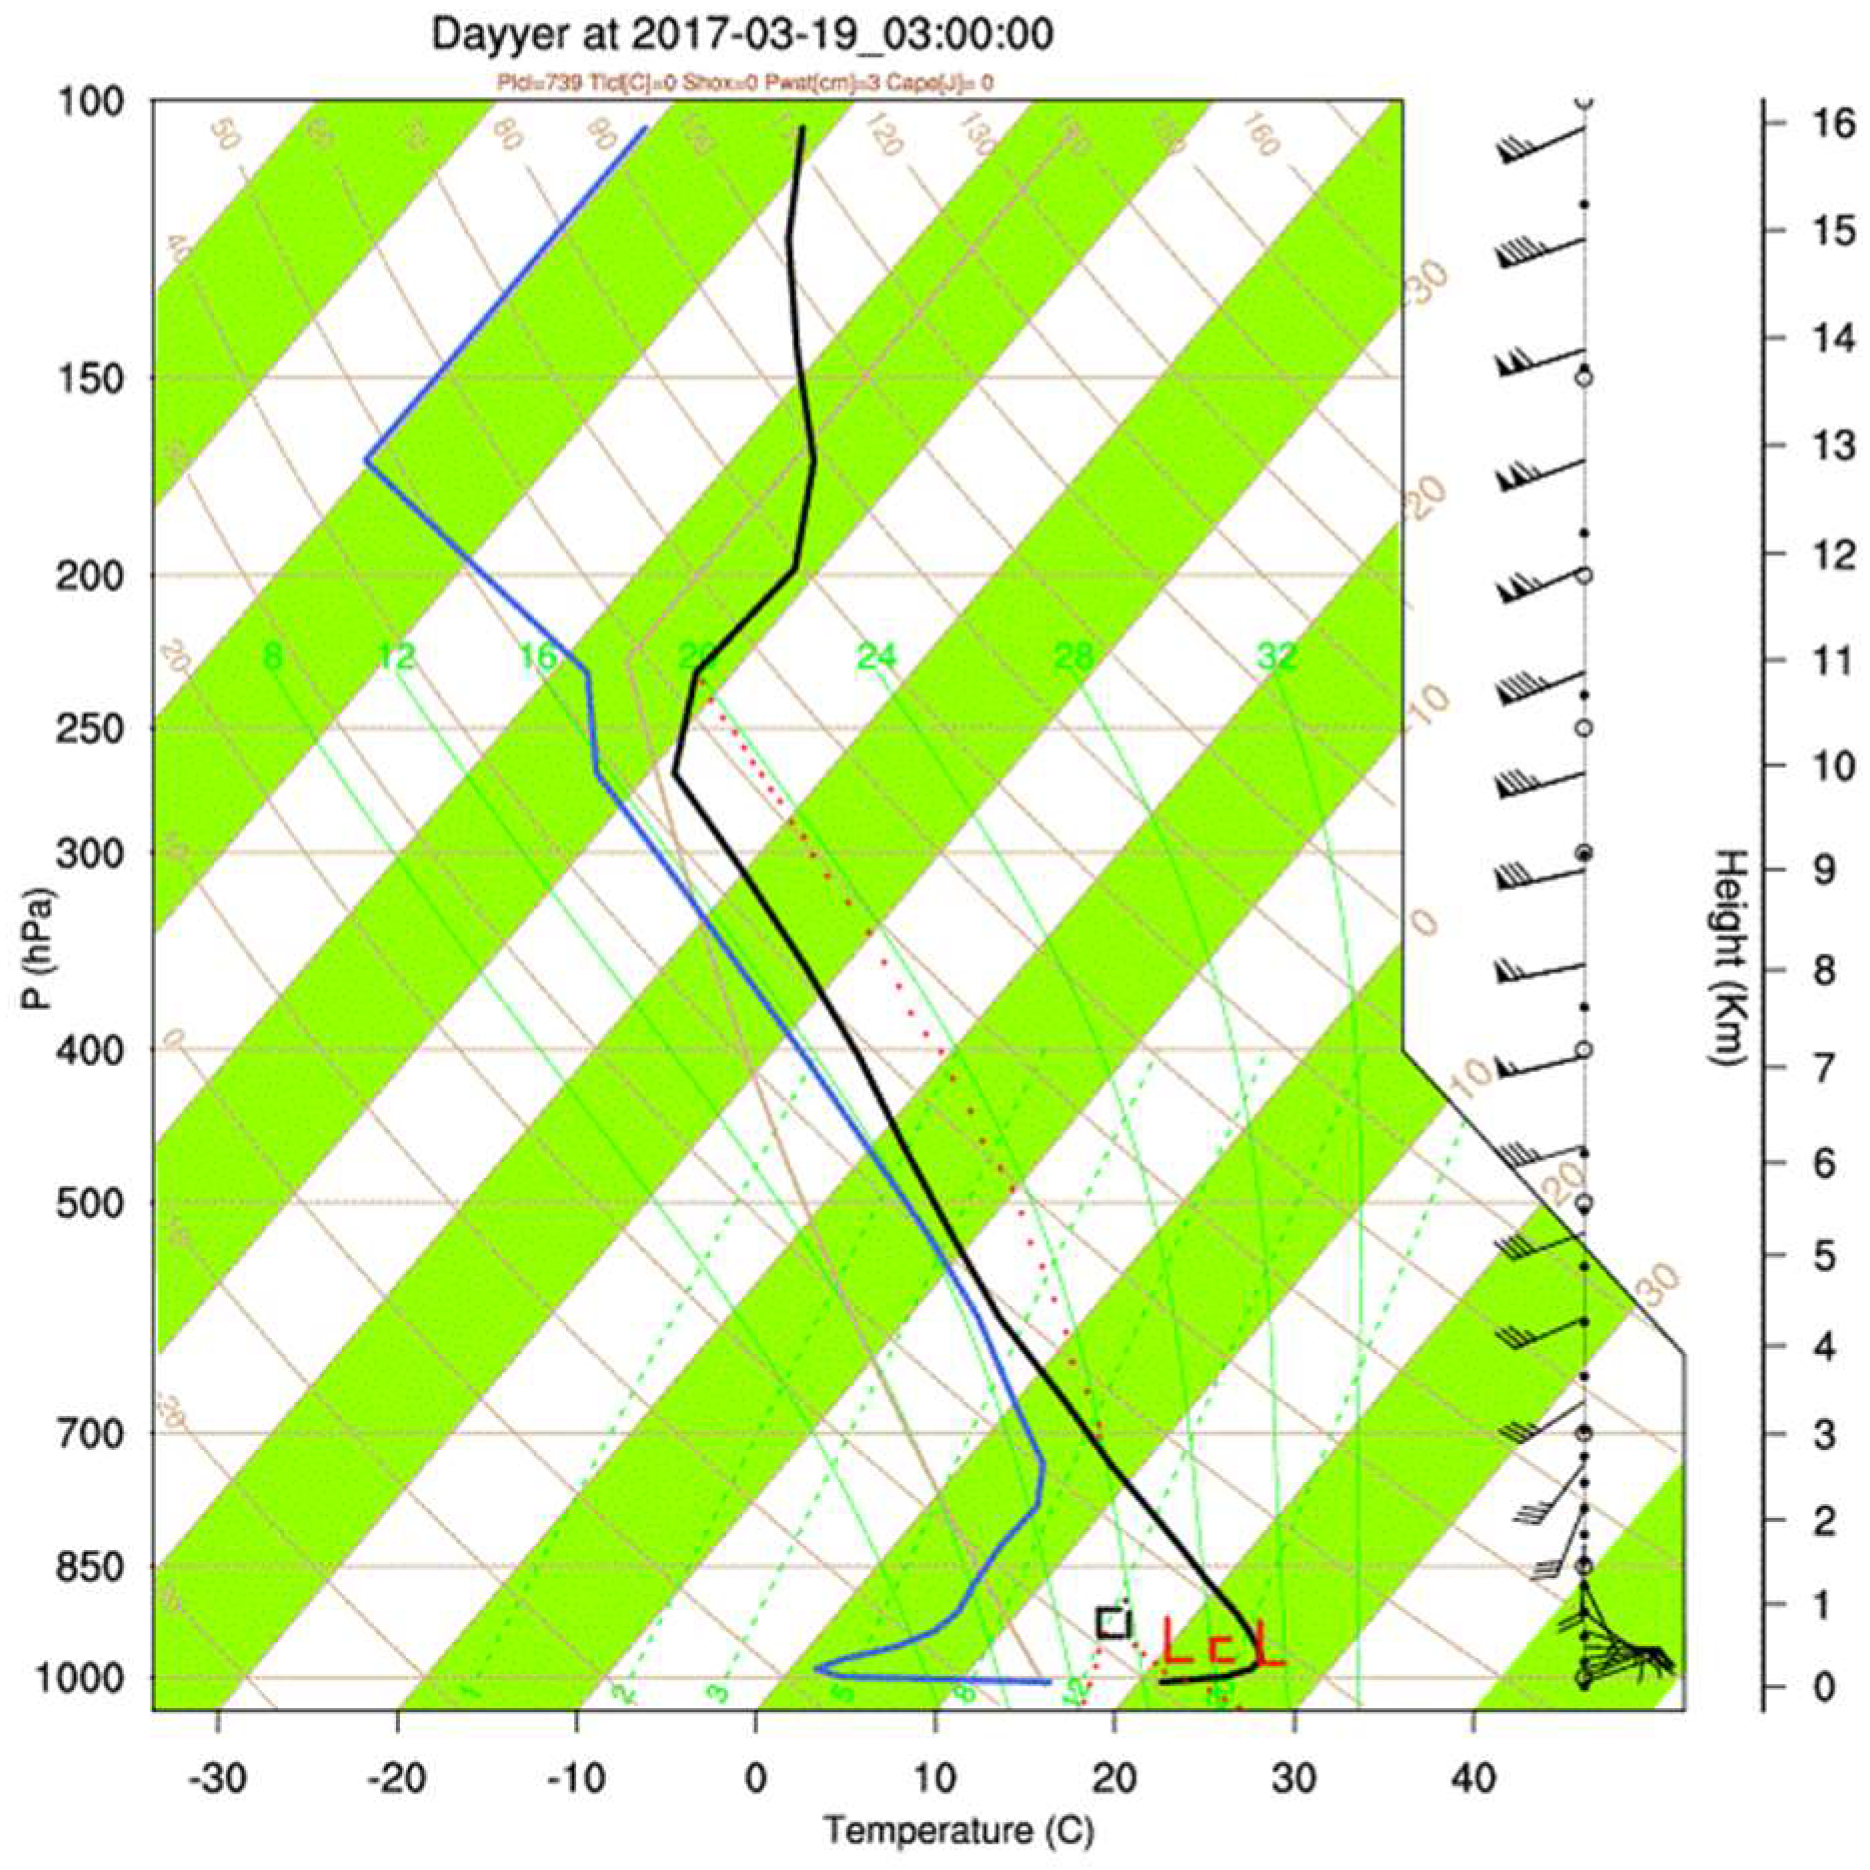
The wind profiles presented in Figure 9 show that a relatively strong cold advection under 800 hPa, along with strong moisture advection near the surface, made the atmosphere unstable and prone to statically unstable conditions. However, the strong southwesterly wind at upper levels probably inhibited deep convection. The environmental lapse rate temperature contour shows that in the initial boundary layer, the temperature inversion conditions prevail in the hours before the onset of a thunderstorm, and very high energy was stored in the boundary layer (Figure 9). As the front raised, the warm and humid air at the border layer quickly climbed to the front of the cold front and triggered severe thunderstorms in the area. The existence of a temperature inversion and extreme air stability in the first 500 m of the atmosphere might lead to an accumulation of moisture in the underlying layer (with a mixing ratio of 11 g·kg−1 of humidity and a dew point temperature of 16–18 °C) and consequently, to an increase in the environmental lapse rate before the storm event, indicating high atmospheric instability in the studied area. Such conditions caused the LCL (lifted condensation level) indicator, and the cloud base formed below 800 hPa. Due to the decrease in temperature and the presence of cold air at the upper levels of the atmosphere, the instabilities increased. The environmental lapse rate temperature contour is well distorted to the left in the Skew-T chart (Figure 9).
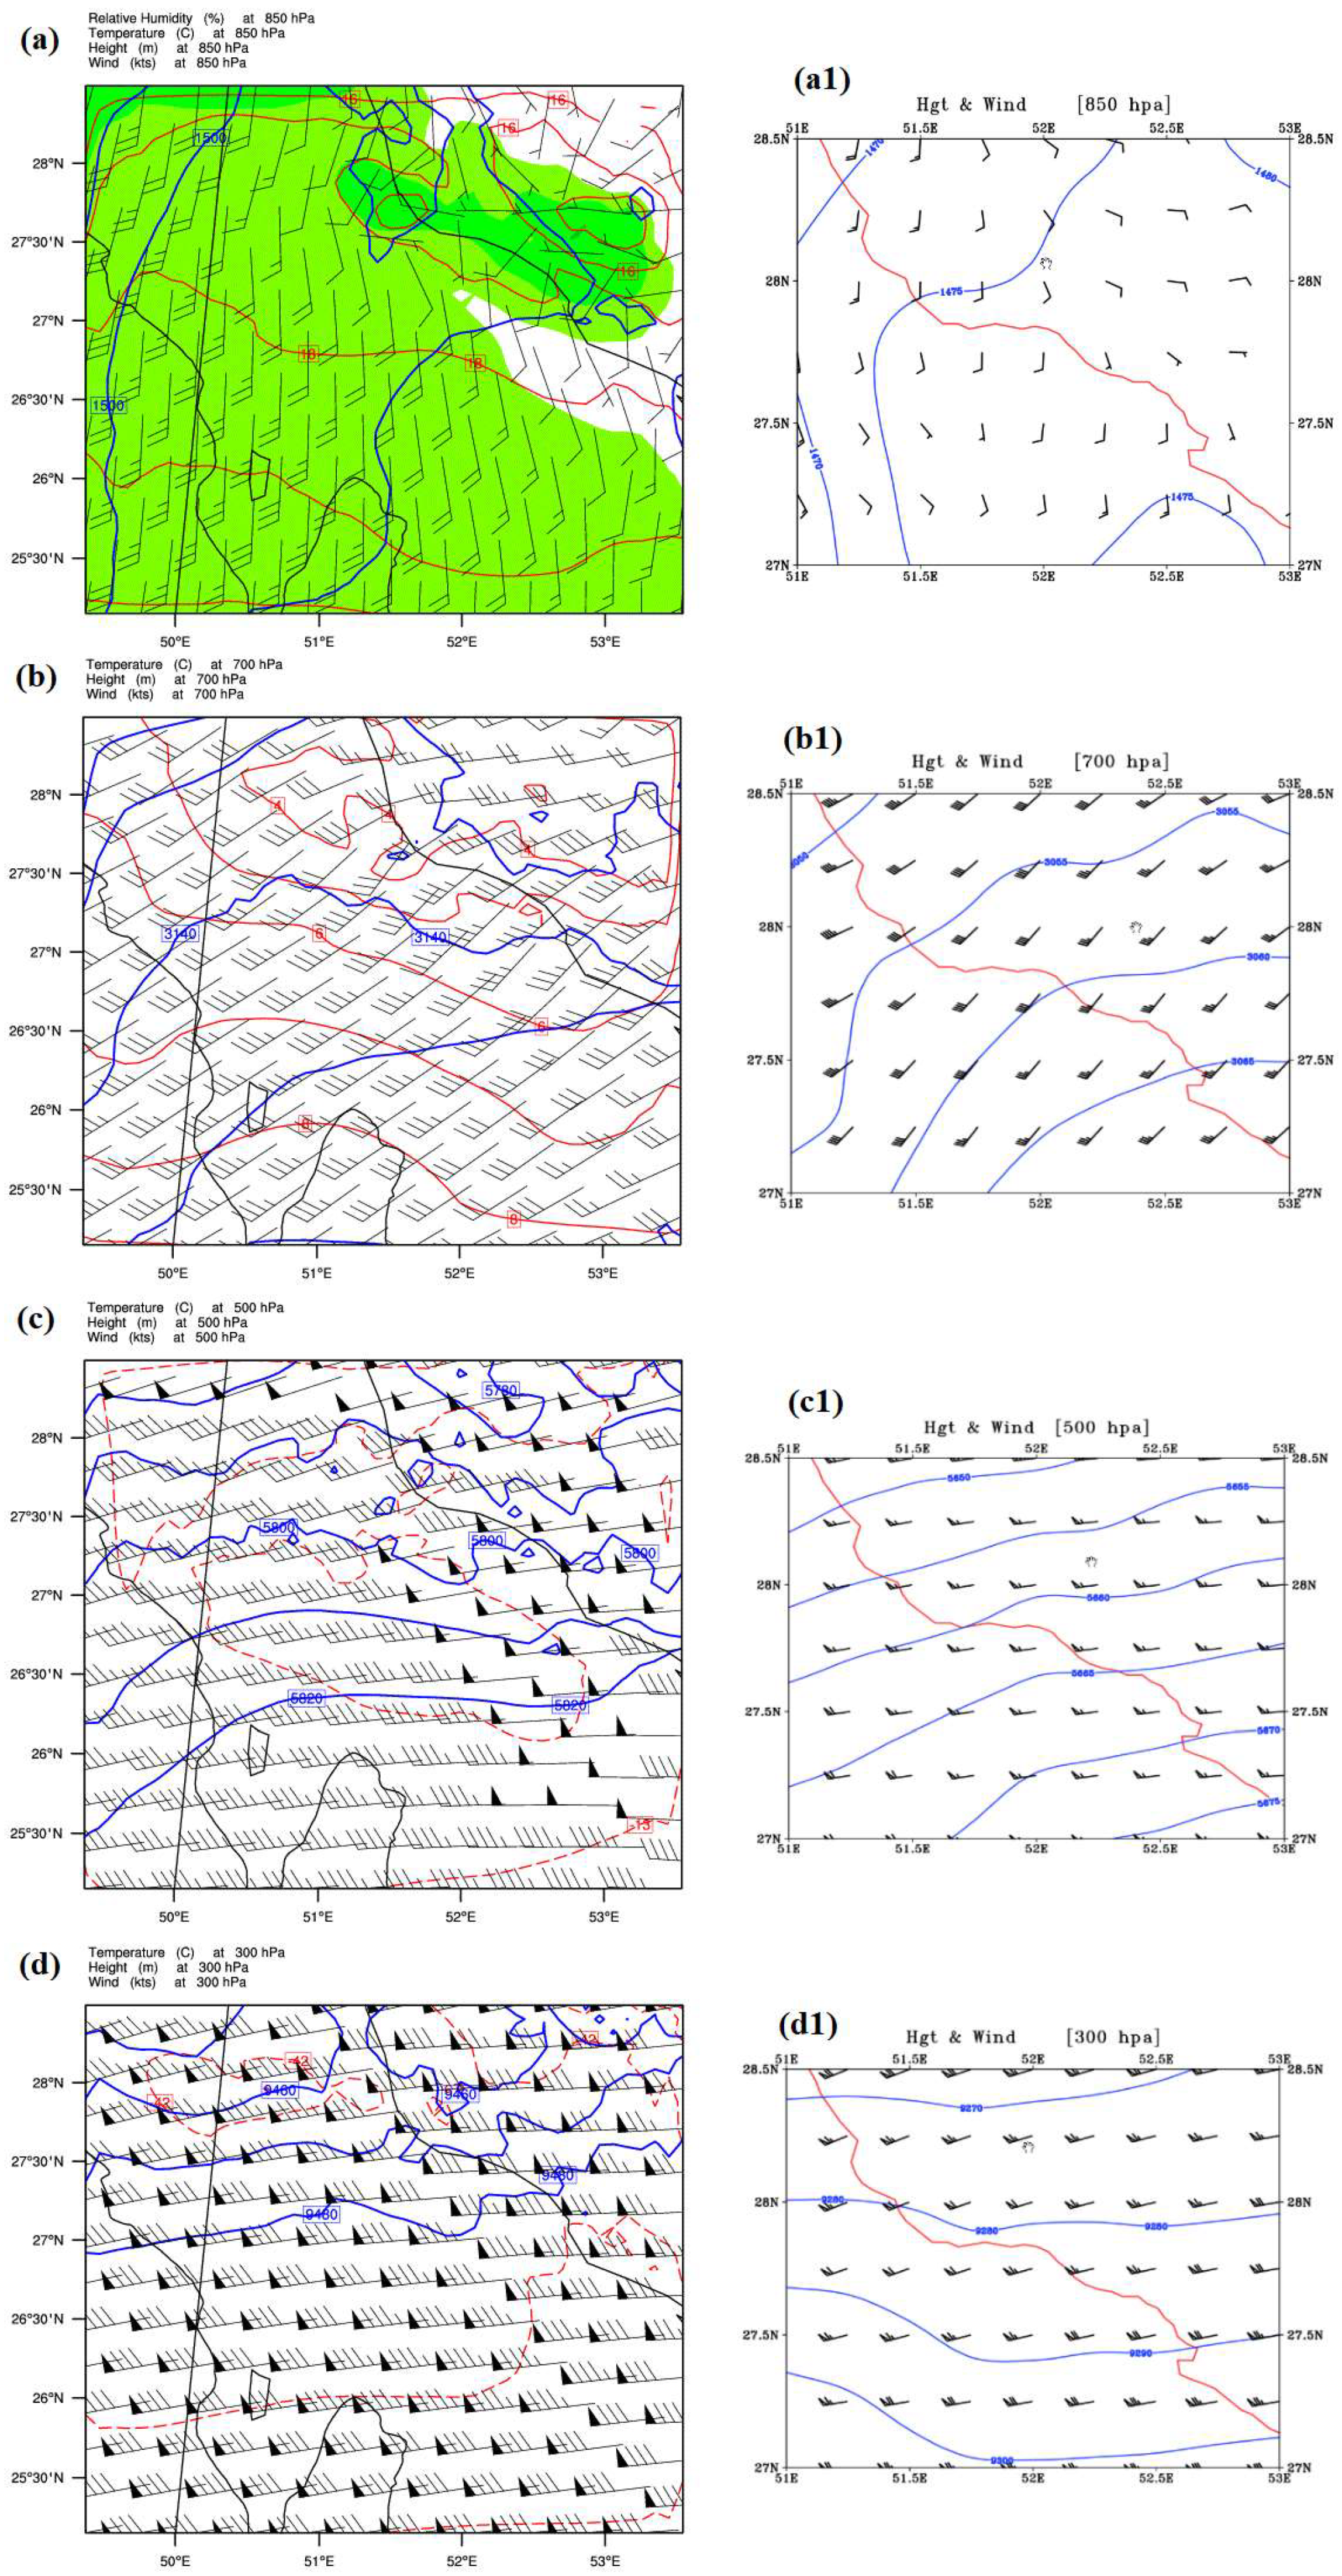
In Figure 10, the geopotential height, wind direction and speed, and isotherm contours at different pressure levels are presented. The maximum wind speed at 850 hPa at the site of the incident, at 3:00 UTC, was 20 knots and had a southerly direction (Figure 10a). The maximum wind speed value reached 35 knots at 700 hPa, 50 knots at 500 hPa, and 85 knots at 300 hPa (Figure 10b,c,d). The investigation of the boundary layer status indicates that the dew point temperature was from 16 to 18 °C (Figure 9), which suggests that it was very humid and warm. This created favorable conditions for the severe thunderstorms in the region [45]. The more wind and storms blow on the sea, the more sea-level rise, which is due to the creation of shear stress. Sea levels also increase when the storm surge occurrence is synchronized with the high tide. Based on Buoy data, on 19 March the four waves were observed. The waves’ altitude and rotation period were 3.1 m and 40 s, respectively. In addition, high tide elevation was 2 m when the waves formed. Tidal data indicate that the maximum height of the tide occurred at 08:00 local time in the morning of 19 March when the squall line (Figure 5, top panel) and gust storm were passing through the study area. Therefore, the storm surge was caused by the coincidence of maximum tide time and the thunderstorm occurrence.

4. Conclusions

Concerning the broad impacts of thunderstorms and storm surge incidents on the economy and society, examination of the reasons for the occurrence of such phenomena is very important to improve the forecasting services awareness of the synoptic-scale patterns, and the presence of warning signs in the synoptic data [46,47]. The composite patterns created by spatial analyses employing ECMWF information and the WRF model on basic mass and thermodynamic fields can pave the way for pattern recognition for diagnostic and prognostic goals [48,49].
This study aimed to analyze whether atmospheric conditions associated with a storm surge can be recognized. The primary conclusions are:
(1)
At the time of the severe and destructive thunderstorm on the east coast of the Persian Gulf, atmospheric conditions of instability in the synoptic-scale (i.e., geopotential height of 850 to 300 hPa) and the micro scale (the strong vertical wind shear) were present.
(2)
Increase in the vertical wind shear and the flow of jet stream at a pressure of 850 to 300 hPa had caused activation of the low-pressure center and its northern displacement on the east coast of the Persian Gulf.
(3)
The existence of a temperature inversion and extreme air stability in the first 500 m from the ground surface caused the accumulation of moisture and increased the dew point temperature, which, as a consequence, reduced the difference between air temperature and dew point temperature.
(4)
Suitable moisture conditions (especially in the lower level of the troposphere) had led to the development of a supercell storm, CB clouds, and ultimately to the downburst and the intensification of air descent in the studied area.
(5)
Higher amplification of the mid-level pattern, with more powerful upper- and mid-level flow was discovered in a jet, which amplified vertical movement forcing.
The findings of this work are relevant in weather forecasting, where the role and impact of the wind shear and mid-level humidity, along with a buoyancy measure, including the Lifted Index or CAPE, should be considered. An additional potential advantage of this work is the discovered parameterization of cumulus, which allows the inclusion of wind shear impacts, leading to more precise attempts to create proxies for thunderstorms from numerical models of weather and climate prediction. Although thunderstorms occur frequently at the study site, in conjunction with the above mentioned meteorological conditions they may cause a recurrence of the storm surge in the Persian Gulf coastal area.
The association between local topographic/micro-climate variations and the findings presented in this research may be further explored in the following research. For such topics, an analysis at the mesoscale combined with high-resolution modeling must be used. Concerning the evident large-scale impact of the destabilization procedures presented in this research, the implementation of the recurring synoptic patterns to the mesoscale can result in enhanced forecasts for the prediction of the storm surge incidents.

Author Contributions

Conceptualization, E.A. and H.E.; methodology, E.A. and H.E.; software, E.A., H.E., J.M.S., I.R. and H.O.; formal analysis, E.A., H.E., J.M.S., I.R. and H.O.; investigation E.A., H.E., J.M.S., I.R. and H.O.; writing—original draft preparation E.A., H.E., J.M.S., I.R. and H.O.; validation, J.K. and P.B.; interpretation, J.K. and P.B.; writing—review and editing, J.K. and P.B. All authors have read and agreed to the published version of the manuscript.

Funding

This research was supported by Vedurfelagid, Rannis and Rannsoknastofa i vedurfraedi.

Institutional Review Board Statement

Not applicable.

Informed Consent Statement

Not applicable.

Data Availability Statement

Data and material available after contacting Iman Rousta by e-mail: [email protected], accessed on 17 May 2021.

Acknowledgments

The authors wish to thank the Meteorological Organization of Bushehr province for their help and for sharing the Radar images and meteorological data.

Conflicts of Interest

The authors declare no conflict of interest. The funders had no role in the design of the study; in the collection, analyses, or interpretation of data; in the writing of the manuscript, or in the decision to publish the results.

References

  1. Ponte, R.M.; Salstein, D.A.; Rosen, R.D. Sea level response to pressure forcing in a barotropic numerical model. J. Phys. Oceanogr. 1991, 21, 1043–1057. [Google Scholar] [CrossRef] [Green Version]
  2. Hopley, D. Coastal changes produced by tropical cyclone Althea in Queensland; December 1971. Aust. Geogr. 1974, 12, 445–456. [Google Scholar] [CrossRef]
  3. Watson, P.L.; Koukoula, M.; Anagnostou, E. Influence of the characteristics of weather information in a thunderstorm-related power outage prediction system. Forecasting 2021, 3, 541–560. [Google Scholar] [CrossRef]
  4. Flather, R.A. Storm surges. In Encyclopedia of Ocean Sciences; Steele, J., Thorpe, S., Turekian, K., Eds.; Elsevier: Amsterdam, The Netherlands, 2001; pp. 2882–2892. [Google Scholar]
  5. Schwab, D.J. Simulation and forecasting of Lake Erie storm surges. Mon. Weather Rev. 1978, 106, 1476–1487. [Google Scholar] [CrossRef] [Green Version]
  6. Mason, D. Investigation of Convective Downburst Hazards to Marine Transportation. arXiv 2007, arXiv:physics/0701230. [Google Scholar]
  7. Sengupta, A.; Sarkar, P.P. Experimental measurement and numerical simulation of an impinging jet with application to thunderstorm microburst winds. J. Wind. Eng. Ind. Aerodyn. 2008, 96, 345–365. [Google Scholar] [CrossRef]
  8. Moyo, E.N.; Nangombe, S.S. Southern Africa’s 2012–13 violent storms: Role of climate change. Procedia IUTAM 2015, 17, 69–78. [Google Scholar] [CrossRef] [Green Version]
  9. Wakimoto, R.M. Forecasting dry microburst activity over the high plains. Mon. Weather Rev. 1985, 113, 1131–1143. [Google Scholar] [CrossRef] [Green Version]
  10. Roberts, R.D.; Wilson, J.W. A proposed microburst nowcasting procedure using single-Doppler radar. J. Appl. Meteorol. Climatol. 1989, 28, 285–303. [Google Scholar] [CrossRef] [Green Version]
  11. Lin, Y.-J.; Hughes, R.G.; Pasken, R.W. Subcloud-layer kinematic and dynamic structures of a microburst-producing thunderstorm in Colorado determined from JAWS dual-doppler measurements. Bound.-Layer Meteorol. 1987, 39, 67–86. [Google Scholar] [CrossRef]
  12. Jariwala, S.A. Experimental simulation of a density-driven downburst translating within a turbulent boundary layer. Electron. Thesis Diss. Repos. 2021, 7656, 1–108. [Google Scholar]
  13. Proctor, F.H. Numerical simulations of an isolated microburst. Part II: Sensitivity experiments. J. Atmos. Sci. 1989, 46, 2143–2165. [Google Scholar] [CrossRef] [Green Version]
  14. Atkins, N.T.; Wakimoto, R.M. Wet microburst activity over the southeastern United States: Implications for forecasting. Weather Forecast. 1991, 6, 470–482. [Google Scholar] [CrossRef] [Green Version]
  15. Sabziparvar, A.A.; Mir Mousavi, S.H.; Karampour, M.; Doostkamian, M.; Haghighi, E.; Rousta, I.; Olafsson, H.; Sarif, M.O.; Gupta, R.D.; Moniruzzaman, M.; et al. Harmonic analysis of the spatiotemporal pattern of thunderstorms in Iran (1961–2010). Adv. Meteorol. 2019, 2019, 1612503. [Google Scholar] [CrossRef] [Green Version]
  16. Srivastava, R. A simple model of evaporatively driven dowadraft: Application to microburst downdraft. J. Atmos. Sci. 1985, 42, 1004–1023. [Google Scholar] [CrossRef] [Green Version]
  17. Mahoney, W.P., III; Rodi, A.R. Aircraft measurements on microburst development from hydrometeor evaporation. J. Atmos. Sci. 1987, 44, 3037–3051. [Google Scholar] [CrossRef] [Green Version]
  18. Wakimoto, R.; Kingsmill, D.; Kessinger, C. Visual and dual-Doppler analysis of low-reflectivity microbursts. In Proceedings of the 24th Conference on Radar Meteorology, Tallahassee, FL, USA, 27–31 March 1989; pp. 77–80. [Google Scholar]
  19. Pryor, K.L.; Ellrod, G.P. WMSI—A new index for forecasting wet microburst severity. J. Operat. Meteorol. 2004, 25, 25. [Google Scholar]
  20. Colle, B.A.; Buonaiuto, F.; Bowman, M.J.; Wilson, R.E.; Flood, R.; Hunter, R.; Mintz, A.; Hill, D. New York City’s vulnerability to coastal flooding: Storm surge modeling of past cyclones. Bull. Am. Meteorol. Soc. 2008, 89, 829–842. [Google Scholar] [CrossRef] [Green Version]
  21. Lin, N.; Smith, J.A.; Villarini, G.; Marchok, T.P.; Baeck, M.L. Modeling extreme rainfall, winds, and surge from Hurricane Isabel (2003). Weather Forecast. 2010, 25, 1342–1361. [Google Scholar] [CrossRef]
  22. El-Sabh, M.; Murty, T. Storm surges in the Arabian Gulf. Nat. Hazards 1989, 1, 371–385. [Google Scholar] [CrossRef]
  23. Thoppil, P.G.; Hogan, P.J. Persian Gulf response to a wintertime shamal wind event. Deep Sea Res. Part I Oceanogr. Res. Pap. 2010, 57, 946–955. [Google Scholar] [CrossRef] [Green Version]
  24. Mojarrad, F.; Koshki, S.; Masoompour, J.; Miri, M. Analysis of thunderstorm instability indexes in Iran using reanalysis data. J. Spat. Anal. Environ. Hazards 2018, 4, 33–48. [Google Scholar]
  25. Masoompour Samakosh, J. Statistical-synoptic analysis of thunderstorm in the Southern Coast of Iran. J. Earth Space Phys. 2016, 42, 697–708. [Google Scholar]
  26. Etemadi, H.; Smoak, J.M.; Abbasi, E. Spatiotemporal pattern of degradation in arid mangrove forests of the Northern Persian Gulf. Oceanologia 2021, 63, 99–114. [Google Scholar] [CrossRef]
  27. Kim, J.; Hangan, H. Numerical simulations of impinging jets with application to downbursts. J. Wind. Eng. Ind. Aerodyn. 2007, 95, 279–298. [Google Scholar] [CrossRef]
  28. Mason, M.S.; Fletcher, D.; Wood, G. Numerical simulation of idealised three-dimensional downburst wind fields. Eng. Struct. 2010, 32, 3558–3570. [Google Scholar] [CrossRef]
  29. Kramer, M.; Heinzeller, D.; Hartmann, H.; van den Berg, W.; Steeneveld, G.-J. Assessment of MPAS variable resolution simulations in the grey-zone of convection against WRF model results and observations. Clim. Dyn. 2020, 55, 253–276. [Google Scholar] [CrossRef] [Green Version]
  30. Stull, R.B.; Ahrens, C.D. Meteorology for Scientists and Engineers; Brooks/Cole: Pacific Grove, CA, USA, 2000. [Google Scholar]
  31. Barlow, M.; Gutowski, W.J.; Gyakum, J.R.; Katz, R.W.; Lim, Y.-K.; Schumacher, R.S.; Wehner, M.F.; Agel, L.; Bosilovich, M.; Collow, A.; et al. North American extreme precipitation events and related large-scale meteorological patterns: A review of statistical methods, dynamics, modeling, and trends. Clim. Dyn. 2019, 53, 6835–6875. [Google Scholar] [CrossRef] [Green Version]
  32. Rotunno, R.; Klemp, J. On the rotation and propagation of simulated supercell thunderstorms. J. Atmos. Sci. 1985, 42, 271–292. [Google Scholar] [CrossRef]
  33. McCaul, E.W., Jr.; Weisman, M.L. Simulations of shallow supercell storms in landfalling hurricane environments. Mon. Weather Rev. 1996, 124, 408–429. [Google Scholar] [CrossRef] [Green Version]
  34. Gidel, L.T. Simulation of the differences and similarities of warm and cold surface frontogenesis. J. Geophys. Res. Oceans 1978, 83, 915–928. [Google Scholar] [CrossRef]
  35. Rousta, I.; Doostkamian, M.; Taherian, A.M.; Haghighi, E.; Ghafarian Malamiri, H.R.; Ólafsson, H. Investigation of the spatio-temporal variations in atmosphere thickness pattern of Iran and the Middle East with special focus on precipitation in Iran. Climate 2017, 5, 82. [Google Scholar] [CrossRef] [Green Version]
  36. Rousta, I.; Javadizadeh, F.; Dargahian, F.; Ólafsson, H.; Shiri-Karimvandi, A.; Vahedinejad, S.H.; Doostkamian, M.; Monro Vargas, E.R.; Asadolahi, A. Investigation of vorticity during prevalent winter precipitation in Iran. Adv. Meteorol. 2018, 2018, 6941501. [Google Scholar] [CrossRef] [Green Version]
  37. Williams, E.R. The electrification of severe storms. In Severe Convective Storms; Springer: Berlin/Heidelberg, Germany, 2001; pp. 527–561. [Google Scholar]
  38. Vonnegut, B.; Weyer, J.R. Luminous phenomena in nocturnal tornadoes. Science 1966, 153, 1213–1220. [Google Scholar] [CrossRef]
  39. Mazur, V. A physical model of lightning initiation on aircraft in thunderstorms. J. Geophys. Res. Atmos. 1989, 94, 3326–3340. [Google Scholar] [CrossRef]
  40. Sawyer, J.S. The vertical circulation at meteorological fronts and its relation to frontogenesis. Proc. Math. Phys. Eng. Sci. 1956, 234, 346–362. [Google Scholar]
  41. Fujita, T.T. Downbursts: Meteorological features and wind field characteristics. J. Wind. Eng. Ind. Aerodyn. 1990, 36, 75–86. [Google Scholar] [CrossRef]
  42. Proctor, F.; Bowles, R. Three-dimensional simulation of the Denver 11 July 1988 microburst-producing storm. Meteorol. Atmospheric Phys. 1992, 49, 107–124. [Google Scholar] [CrossRef]
  43. Wakimoto, R.M. Convectively driven high wind events. In Severe Convective Storms; Springer: Berlin/Heidelberg, Germany, 2001; pp. 255–298. [Google Scholar]
  44. Wilson, J.W.; Roberts, R.D.; Kessinger, C.; McCarthy, J. Microburst wind structure and evaluation of Doppler radar for airport wind shear detection. J. Appl. Meteorol. Climatol. 1984, 23, 898–915. [Google Scholar] [CrossRef] [Green Version]
  45. Rahimi, Y.G.; Abbasi, E.; Farajzadeh, M. Analysis of the effect of Tropical Cyclone Phet on the occurrence of heavy rainfall and floods in Chabahar, Iran. Weather 2015, 70, 348–352. [Google Scholar] [CrossRef] [Green Version]
  46. Prein, A.F.; Liu, C.; Ikeda, K.; Bullock, R.; Rasmussen, R.M.; Holland, G.J.; Clark, M. Simulating North American mesoscale convective systems with a convection-permitting climate model. Clim. Dyn. 2020, 55, 95–110. [Google Scholar] [CrossRef] [Green Version]
  47. Poujol, B.; Prien, A.F.; Molina, M.J.; Muller, C. Dynamic and thermodynamic impacts of climate change on organized convection in Alaska. Clim. Dyn. 2021, 56, 2569–2593. [Google Scholar] [CrossRef]
  48. Abbasi, E.; Etemadi, H. Numerical modeling of atmospheric phenomena causes a water logging in coastal areas of the Persian Gulf. J. Environ. Sci. Technol. 2021, 23, 103–114. [Google Scholar]
  49. Abbasi, E.; Etemadi, H.; Smoak, J.M.; Amouniya, H.; Mahoutchi, M.H. Dust storm source detection using ANP and WRF models in southwest of Iran. Arab. J. Geosci. 2021, 14, 1529. [Google Scholar] [CrossRef]
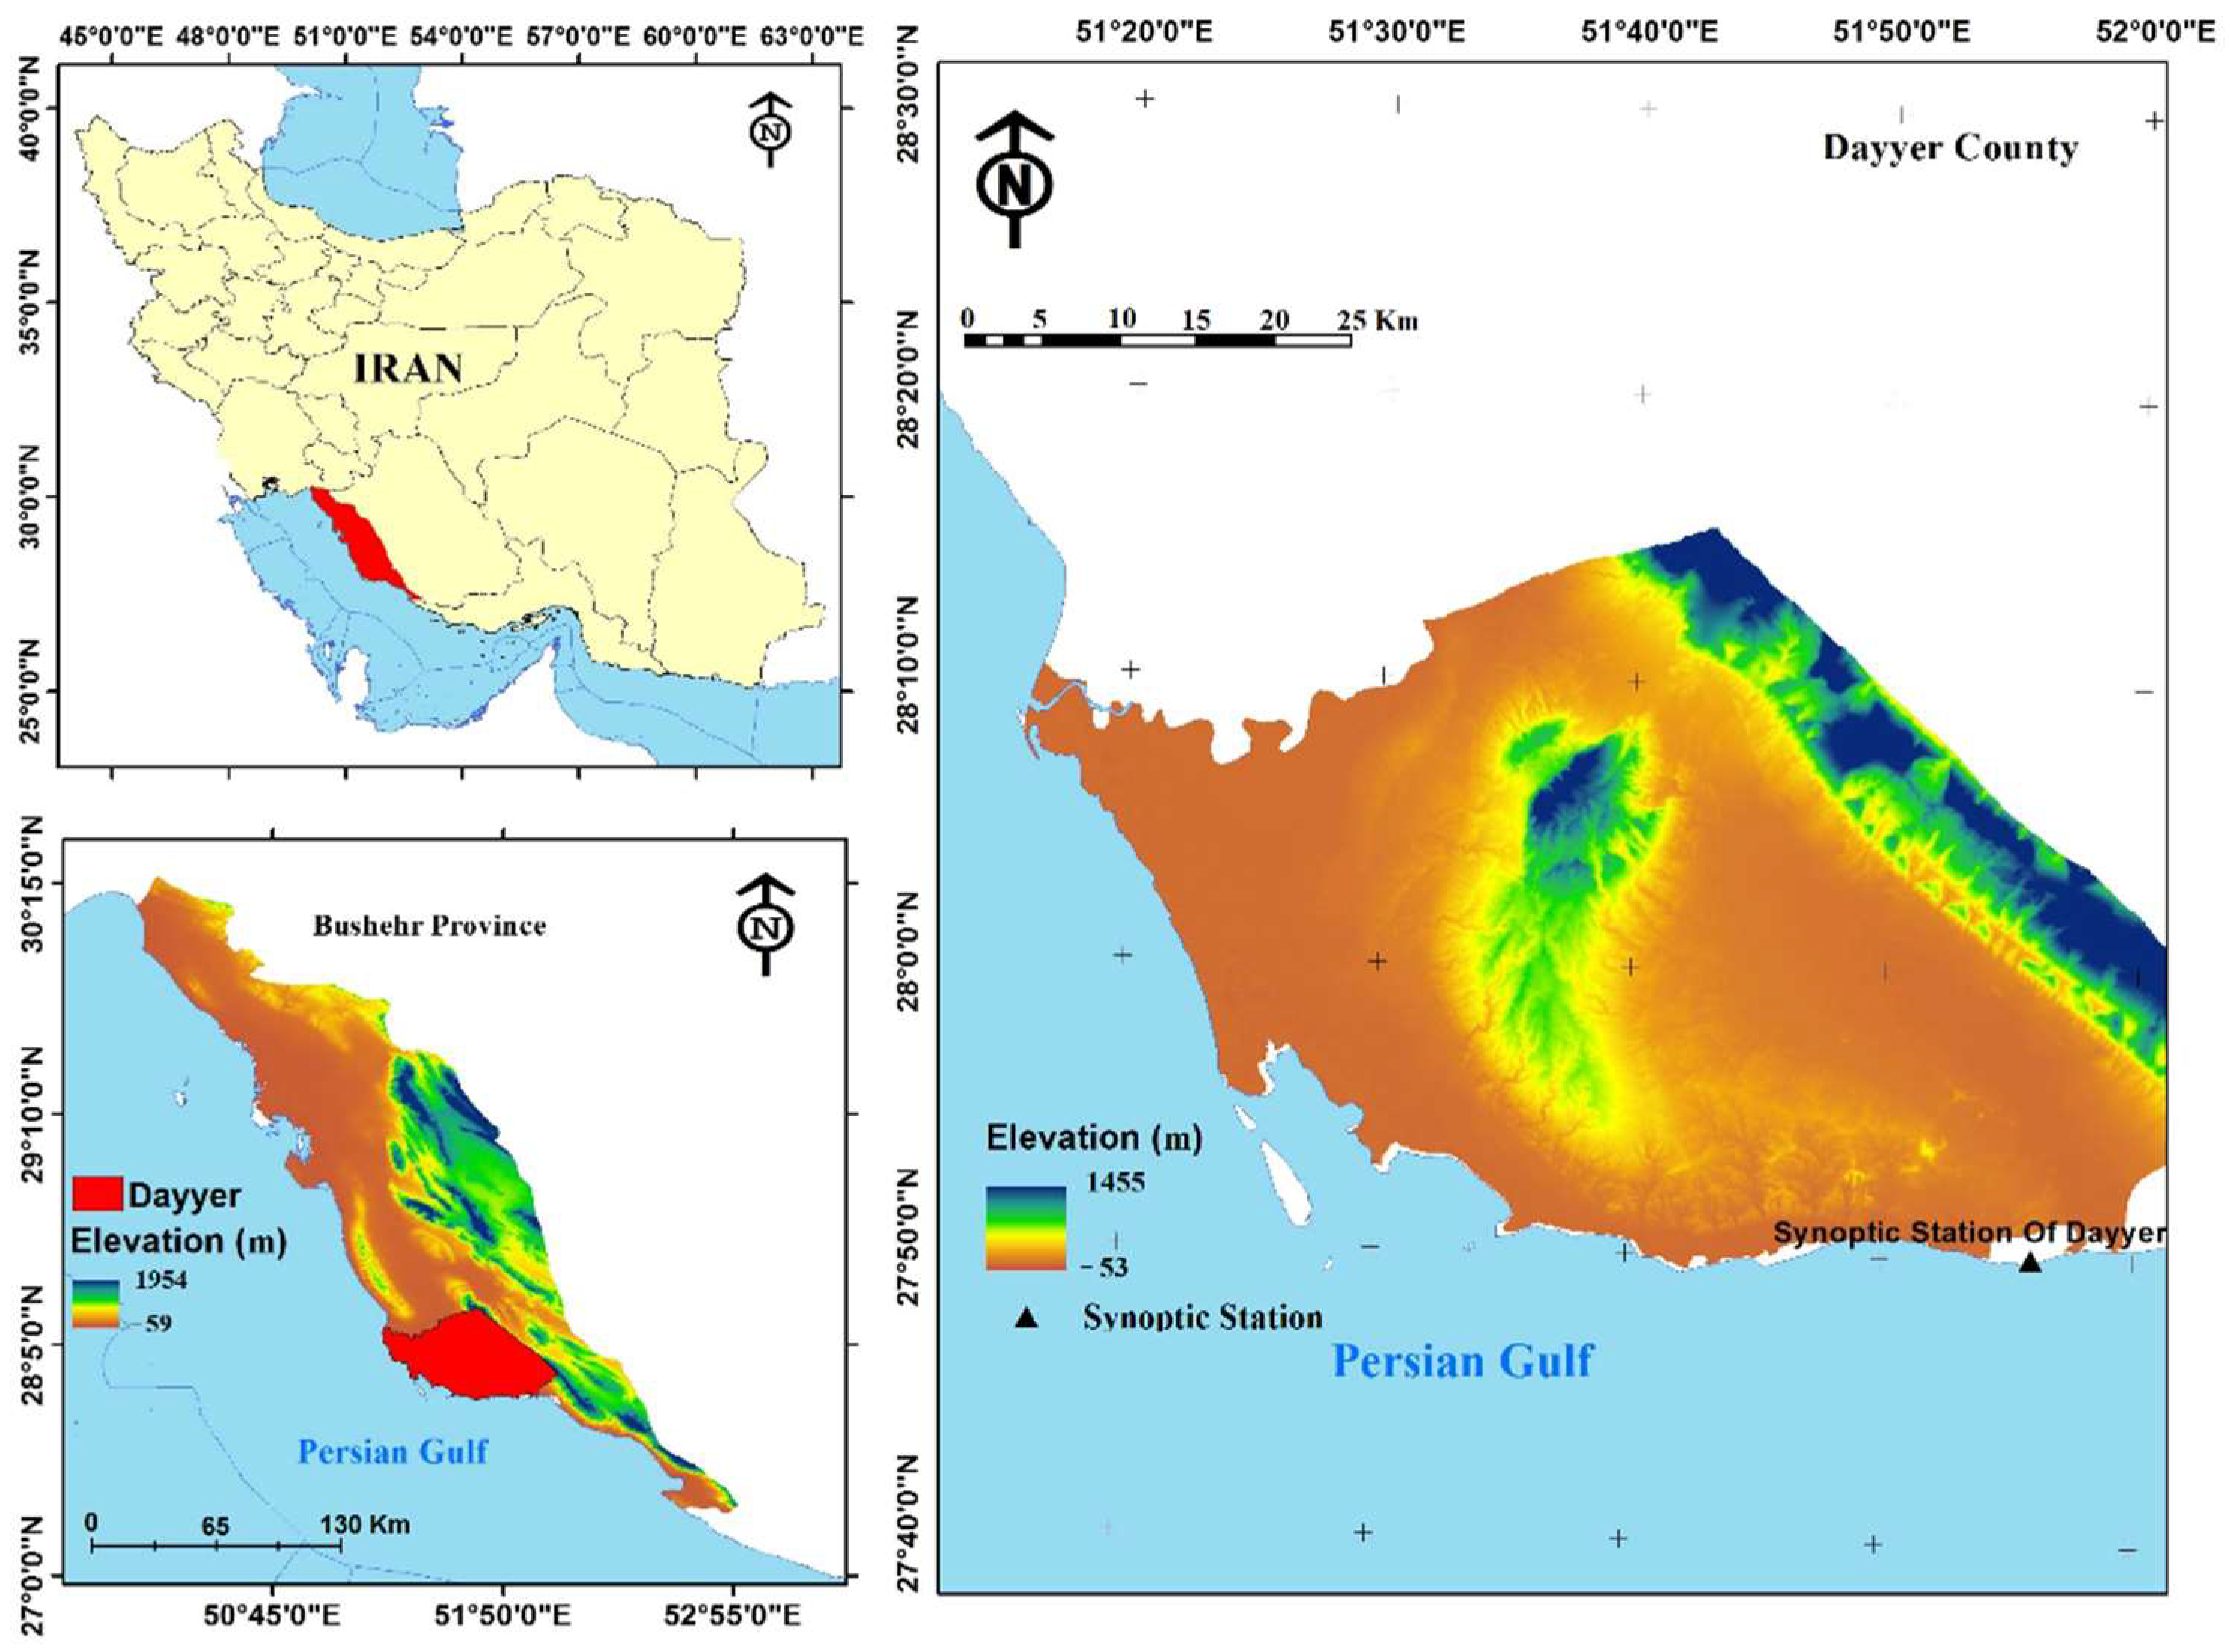
Figure 1. Location of Bushehr Province in Iran (top left panel) and Dayyer County in Bushehr Province (bottom left panel), supplemented by the map presenting the elevation of the study area (right panel). Location of the Dayyer synoptic station is indicated by the black triangle.
Atmosphere 12 01429 g001
Figure 2. A map presenting the domains selected for the implementation of the WRF model. The yellow boxes indicate the domains used in the WRF model.
Atmosphere 12 01429 g002
Figure 3. The maps of the geopotential height (HGT) (contours) and the vertical velocity (shaded) of 500 hPa (a), a jet stream (shaded) of 500 hPa (b) the geopotential height (contours), and the vertical velocity (shaded) of 700 hPa (c), a jetstream (shaded) of 300 hPa (d), geopotential height (contours) and vertical velocity (shaded) of 850 hPa (e) and a jet stream (shaded) of 850 hPa (f) on 19 March for 00:00 UTC. The vectors indicate the direction of the wind.
Atmosphere 12 01429 g003
Figure 4. The maps of the mean sea-level pressure and vector wind on 19 March for 00:00 (left panel) and 06:00 UTC (right panel). Contours indicate the sea level pressure value, while the arrows represent wind speed (color, and the length of vectors) and direction (arrows on vectors).
Atmosphere 12 01429 g004
Figure 5. Maximum reflectivity (MAX) (top panel, in dBZ as presented in the color scale at right of the top panel) and Plan Position Indicator (PPl) (bottom panel, in m/s as presented in the color scale at right of the bottom panel) from the Bushehr Meteorological Radar on 19 March for 04:00 UTC.
Atmosphere 12 01429 g005
Figure 6. The vertical profiles of velocity (Pa s–1) (shaded) and moisture advection (10−5 g Kg−1 s−1) (streamline) on 19 March for 00:00 UTC. Solid bold black lines indicate the vertical velocity having 0 value, solid black lines indicate the vertical velocity with positive values, and the black dashed lines indicate the vertical velocity with negative values. The scale bar indicates the specific humidity value (g/kg).
Atmosphere 12 01429 g006
Figure 7. The map from the visible band of MODIS sensor for 3:45 UTC on 19 March 2017 (a), the image of the shelf clouds and CB formed on the studied area taken at 3:15 UTC (b). The red rectangle indicates the study area (image source: authors).
Atmosphere 12 01429 g007
Figure 8. Half hourly pressure (a) and wind variations (b) at the synoptic station of Bandar Dayyer on 18–19 March before and after the event.
Atmosphere 12 01429 g008
Figure 9. The Skew-T chart for 51°10′ E and 27°30′ N for 3:00 UTC of 19 March. The solid black line presents the temperature profile, while the solid blue line presents the dew point temperature profile. The black rectangle indicates the lifted condensation level.
Atmosphere 12 01429 g009
Figure 10. Geopotential height (blue lines), wind direction and wind speed (vectors), and isotherm contours (black lines) at 850 (a), 700 (b), 500 (c), and 300 (d) hPa. Panels from (a1) to (d1) present the same quantities with higher resolution for the coastline affected by the storm surge.
Atmosphere 12 01429 g010
Publisher’s Note: MDPI stays neutral with regard to jurisdictional claims in published maps and institutional affiliations.