
Dynamic Characteristics of the Circulation and Diurnal Spatial Cycle of Outgoing Longwave Radiation in the Different Phases of the Madden–Julian Oscillation during the Formation of the South Atlantic Convergence Zone


Abstract
:1. Introduction
2. Materials and Methods
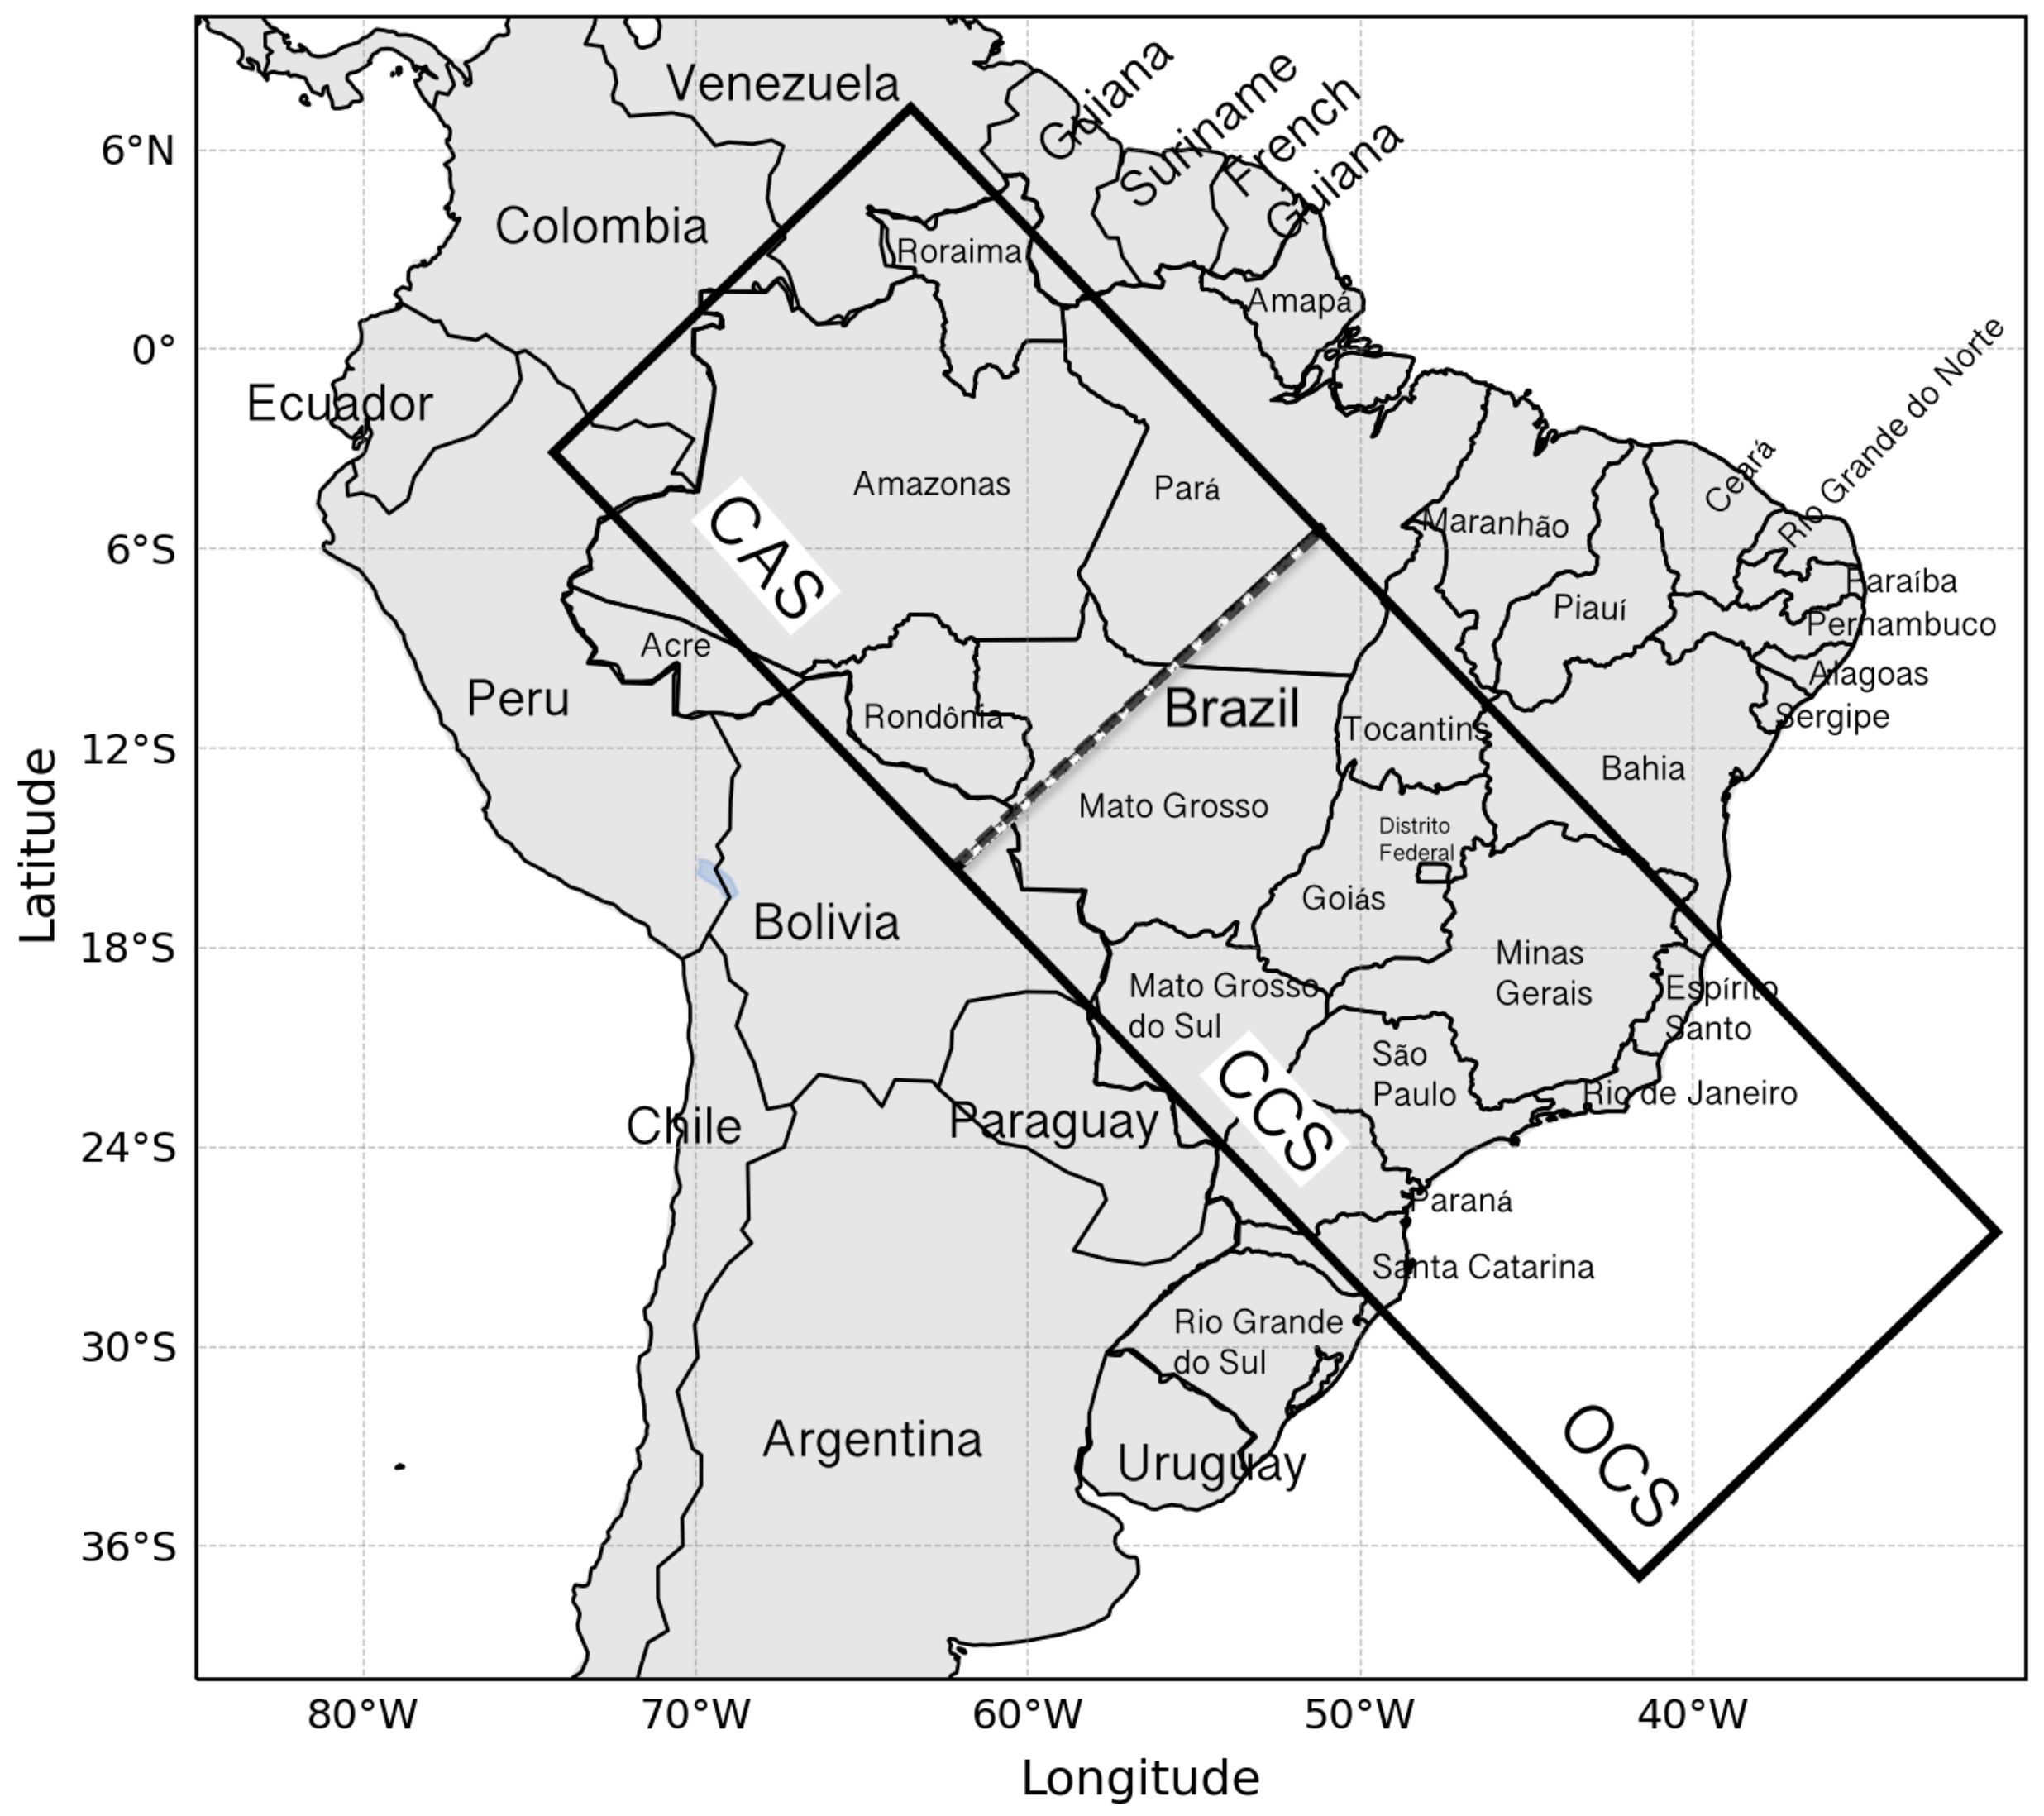
2.1. Area
2.2. Datasets
2.3. SACZ Events

| Days (SACZ) | Month/Year | Duration (days) | MJO Phase | Source of Identification |
|---|---|---|---|---|
| 14–18 | January/1999 | 5 | active | Herdies et al. [45] |
| 24–28 | February/1999 | 5 | active | Herdies et al. [45] |
| 01–08 | December/2000 | 8 | unfavorable | CPTEC/INPE |
| 13–19 | January/2003 | 7 | active | Rosa et al. [44] |
| 11–16 | December/2005 | 6 | unfavorable | Rosa et al. [44] |
| 22–02 | Jan./Feb/2006 | 9 | transition | Rosa et al. [44] |
| 12–17 | February/2007 | 5 | transition | CPTEC/INPE |
| 11–21 | December/2008 | 11 | unfavorable | Rosa et al. [44] |
| 20–24 | January/2009 | 5 | active | Quadro et al. [36] |
| 09–16 | February/2011 | 8 | unfavorable | CPTEC/INPE |
| 11–16 | January/2011 | 6 | unfavorable | CPTEC/INPE |
| 13–18 | January/2012 | 6 | unfavorable | Rosa et al. [44] |
| 22–25 | January/2015 | 4 | active | CPTEC/INPE |
| 28–02 | Feb./Mar./2016 | 4 | active | Rosa et al. [44] |
| 16–19 | January/2017 | 4 | transition | CPTEC/INPE |
| 11–15 | December/2017 | 4 | transition | CPTEC/INPE |
| 22–26 | February/2018 | 5 | active | CPTEC/INPE |
2.4. Methodology
3. Results
3.1. Dynamic Circulation of the Meteorological Variables before, during, and after the SACZ
3.1.1. Composites of the Active Phase of MJO
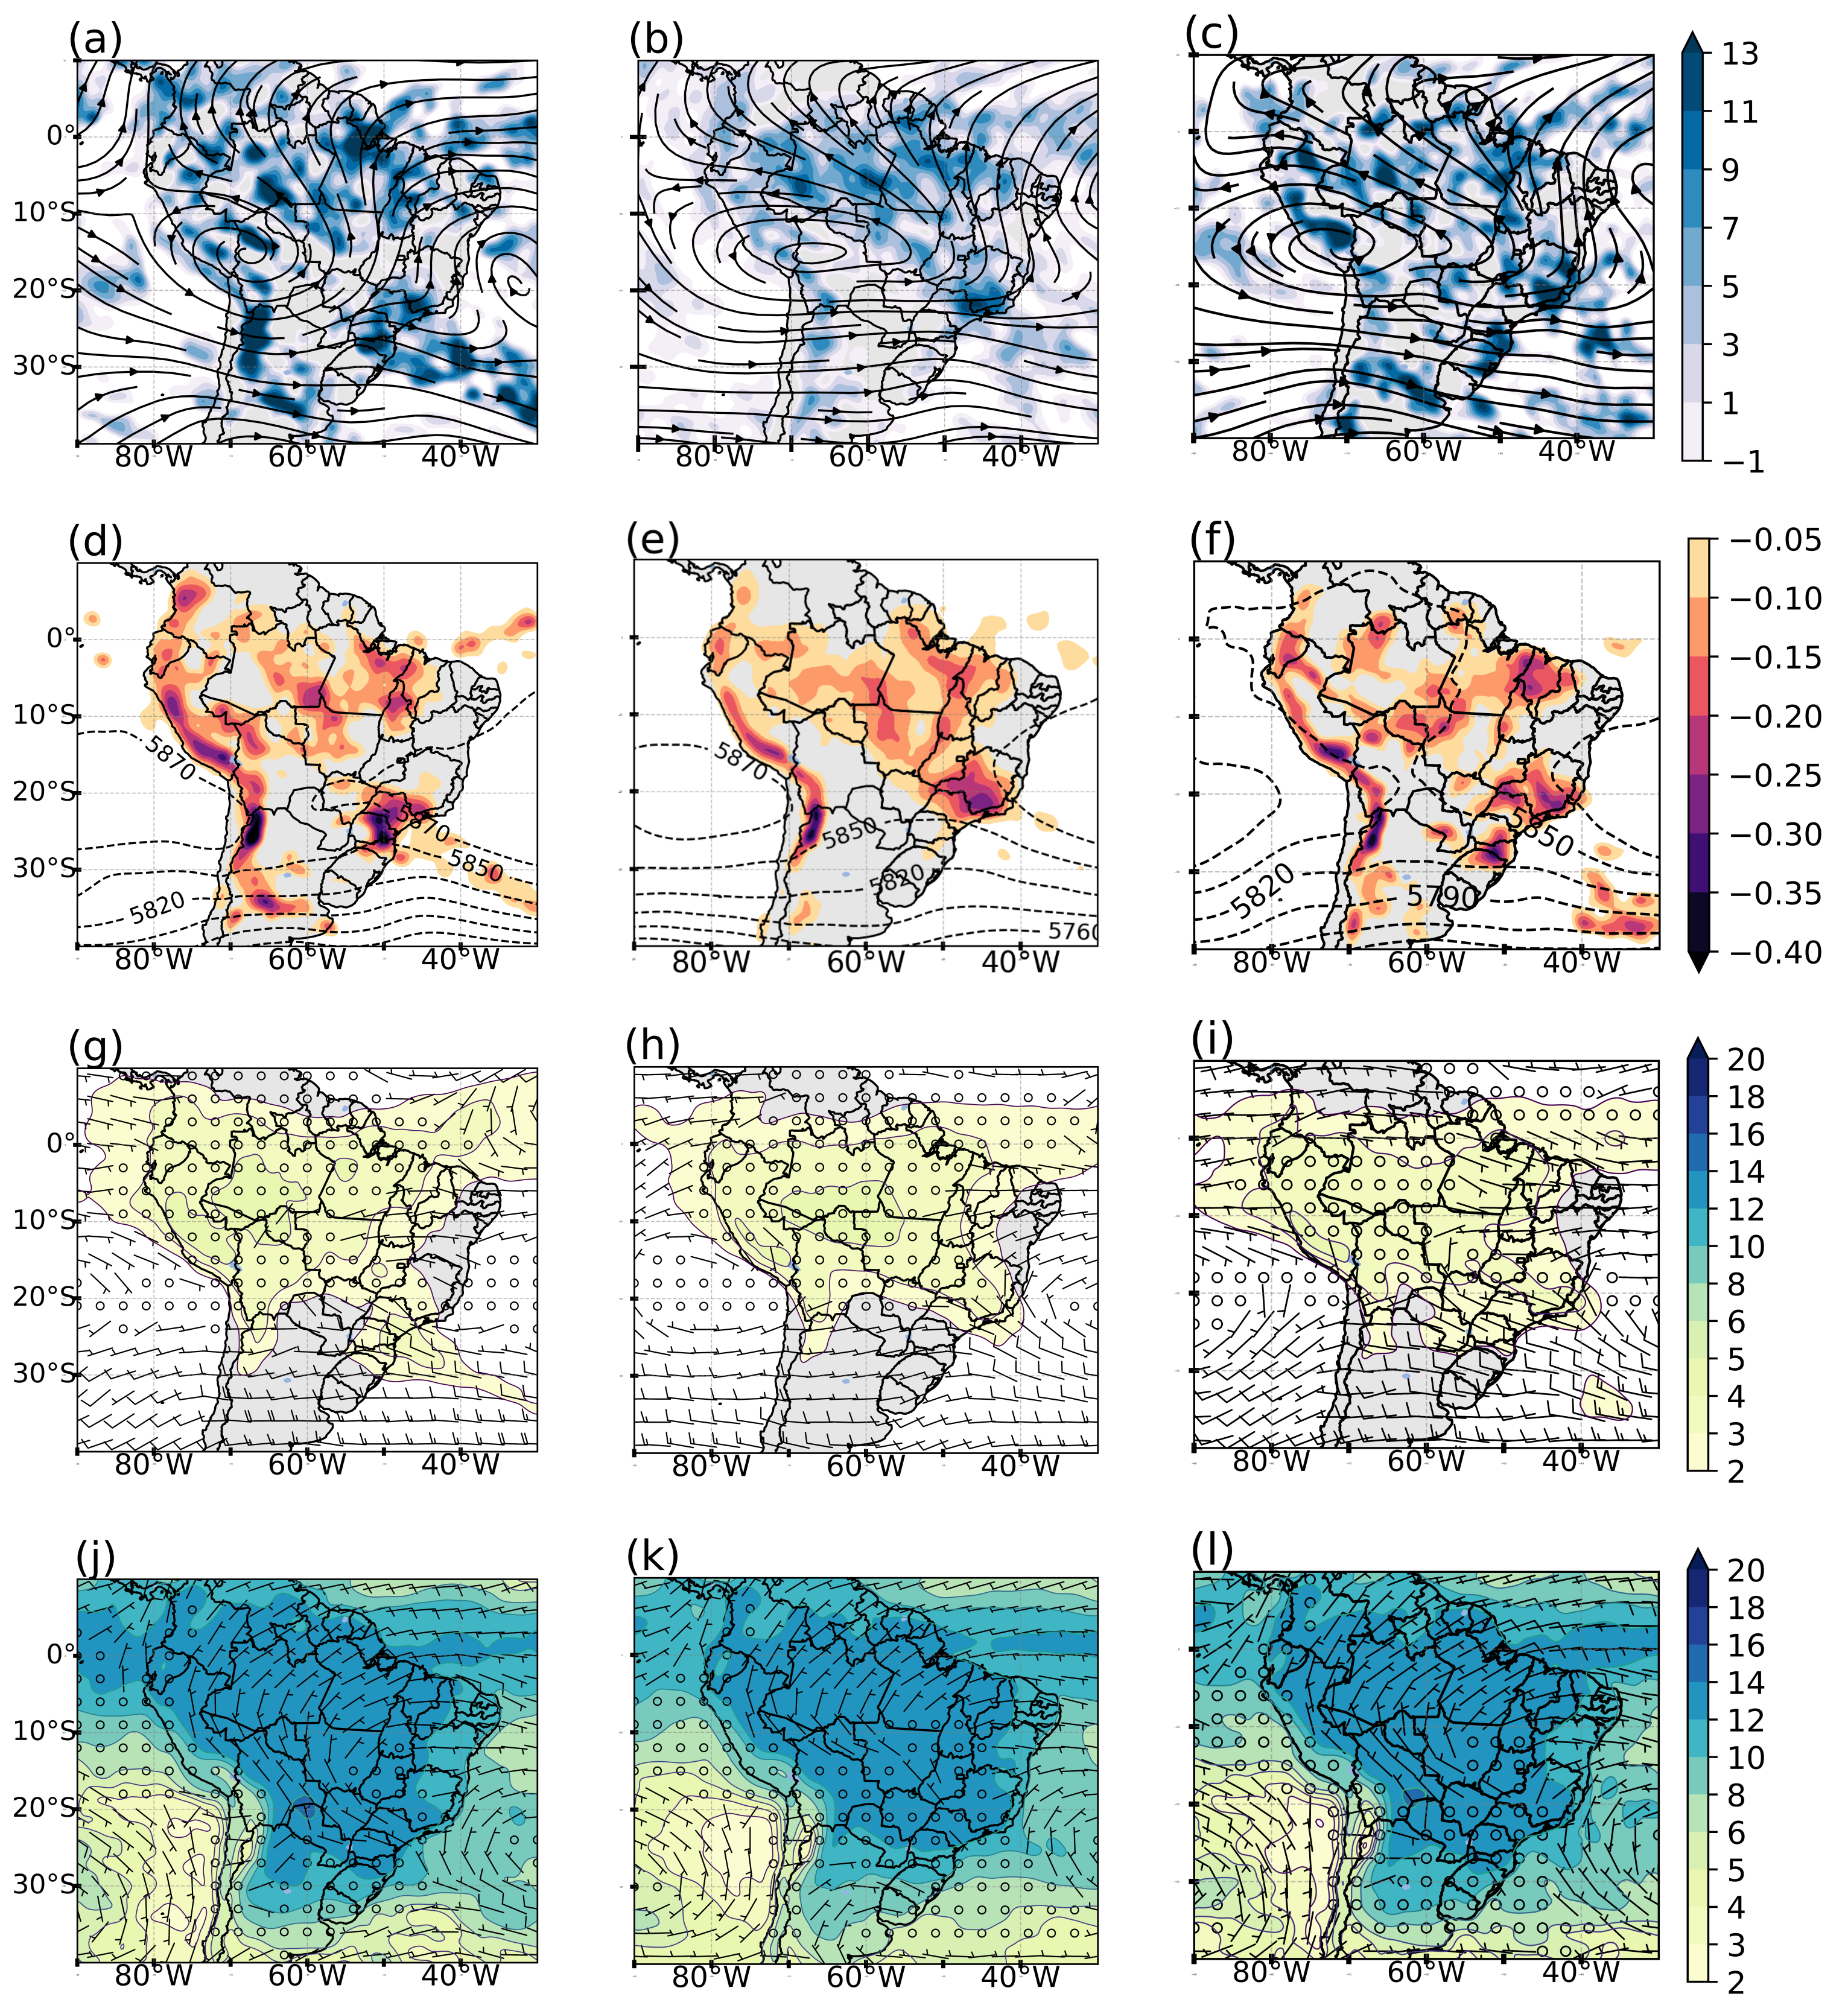
- Upper level (250 hPa)The composites of the days prior (Figure 2a) to the formation of the SACZ shows the predominant presence of BH between 10 and 20 S and a TNB with the associated vortex over the AO—standard circulation found in the southern hemisphere during the summer [50]. The regions with positive horizontal divergence values were located over the northern and northeastern parts of Brazil, where there were flow difluence areas. During the SACZ days (0D, Figure 2b), the BH lengthened zonally, and the TNB shifted north from its previous position. Areas of positive horizontal divergence reduced in intensity (). It is clearly shown that these areas of divergence represent the low-level convergence band, oriented in the northwest–southeast direction, which is classic of the SACZ. In Figure 2c, after the SACZ event (+2D), the center of the BH moves to the west, and the alignment of the wind divergence band becomes disfigured, indicating SACZ mischaracterization. Therefore, we observed that the BH/TNB systems and the midlatitude trough influence the spatial variability in the SACZ, providing dynamic support for the configuration. Furthermore, ascending vertical movement can be observed at medium levels (Figure 2e) along the difluence region at high levels. This corroborates the convergence at low levels along the moisture transport band from the Amazon region and from the region between the subtropical highs.
- Medium level (500 hPa)In Figure 2d (−3D), the negative values of omega occur over almost all of SA, mainly over the north, central-west, and southeast regions of Brazil. The geopotential height shows a slight trough with the axis positioned at 45 W, and the South Atlantic Ocean (SASH) and South Pacific Ocean (SPSH) subtropical highs are misconfigured. In the field of specific moisture (Figure 2g), the values range from 3 to 4 , the most significant of which are found in the western part of the Amazon (4 to 6 ). During the occurrence of the SACZ (0D), the negative values of vertical velocity became evenly distributed over the SACZ region (Figure 2e), and in the field of geopotential height, the trough widened and the subtropical highs organized, forming a well-established system. The same feature can also be observed in the wind field and specific moisture (Figure 2h), with moisture transport coming from the northwest side of the SASH at the ocean–continent interface and driving moisture convergence over the continent in the SACZ region. Another important aspect is the displacement of the significant specific humidity core to parts of the Brazilian states of Amazonas, Mato Grosso, and Rondônia. The structured and continuous band of negative omega values disappeared over the continent (Figure 2f), leaving only scattered nuclei. Showing behavior similar to the geopotential height are specific humidity and winds (Figure 2i), indicating the distortion of the convergence band at low levels.
- Lower level (850 hPa)At low levels, the organization of the SACZ cloudiness band depended on the wind and humidity flow for −3D (Figure 2j); we observed the trade winds entering the continent and changing direction to the southern part of the continent upon encountering the Andes Mountains, which is known as the low level jet (LLJ). However, at 20 S, the LLJ divided into two branches: one toward the north of Argentina and the other toward the southeast region of Brazil. The specific moisture ranged from 10 to 14 across the continent, while over the adjacent AO, it reduces to between 8 and 12 . This variable does not show an abrupt change in the different phases of setting up SACZ episodes. The main change in this atmospheric level occurs in the wind direction, as shown in Figure 2k (0D). The LLJ bifurcation that occurred on the previous day is not verified in this figure, as there is only one predominant wind direction, helping to organize the moisture channel over the SACZ region. This represents one of the main characteristics of the formation of the SACZ, corroborating the findings of many other works [17,45,51]. In the composites of +2D (Figure 2l), the wind flow over the state of Rondônia was in a north–south direction, which distinguishes the LLJ on the slopes of the Andes Mountains but with a branch still directed toward the SACZ region.
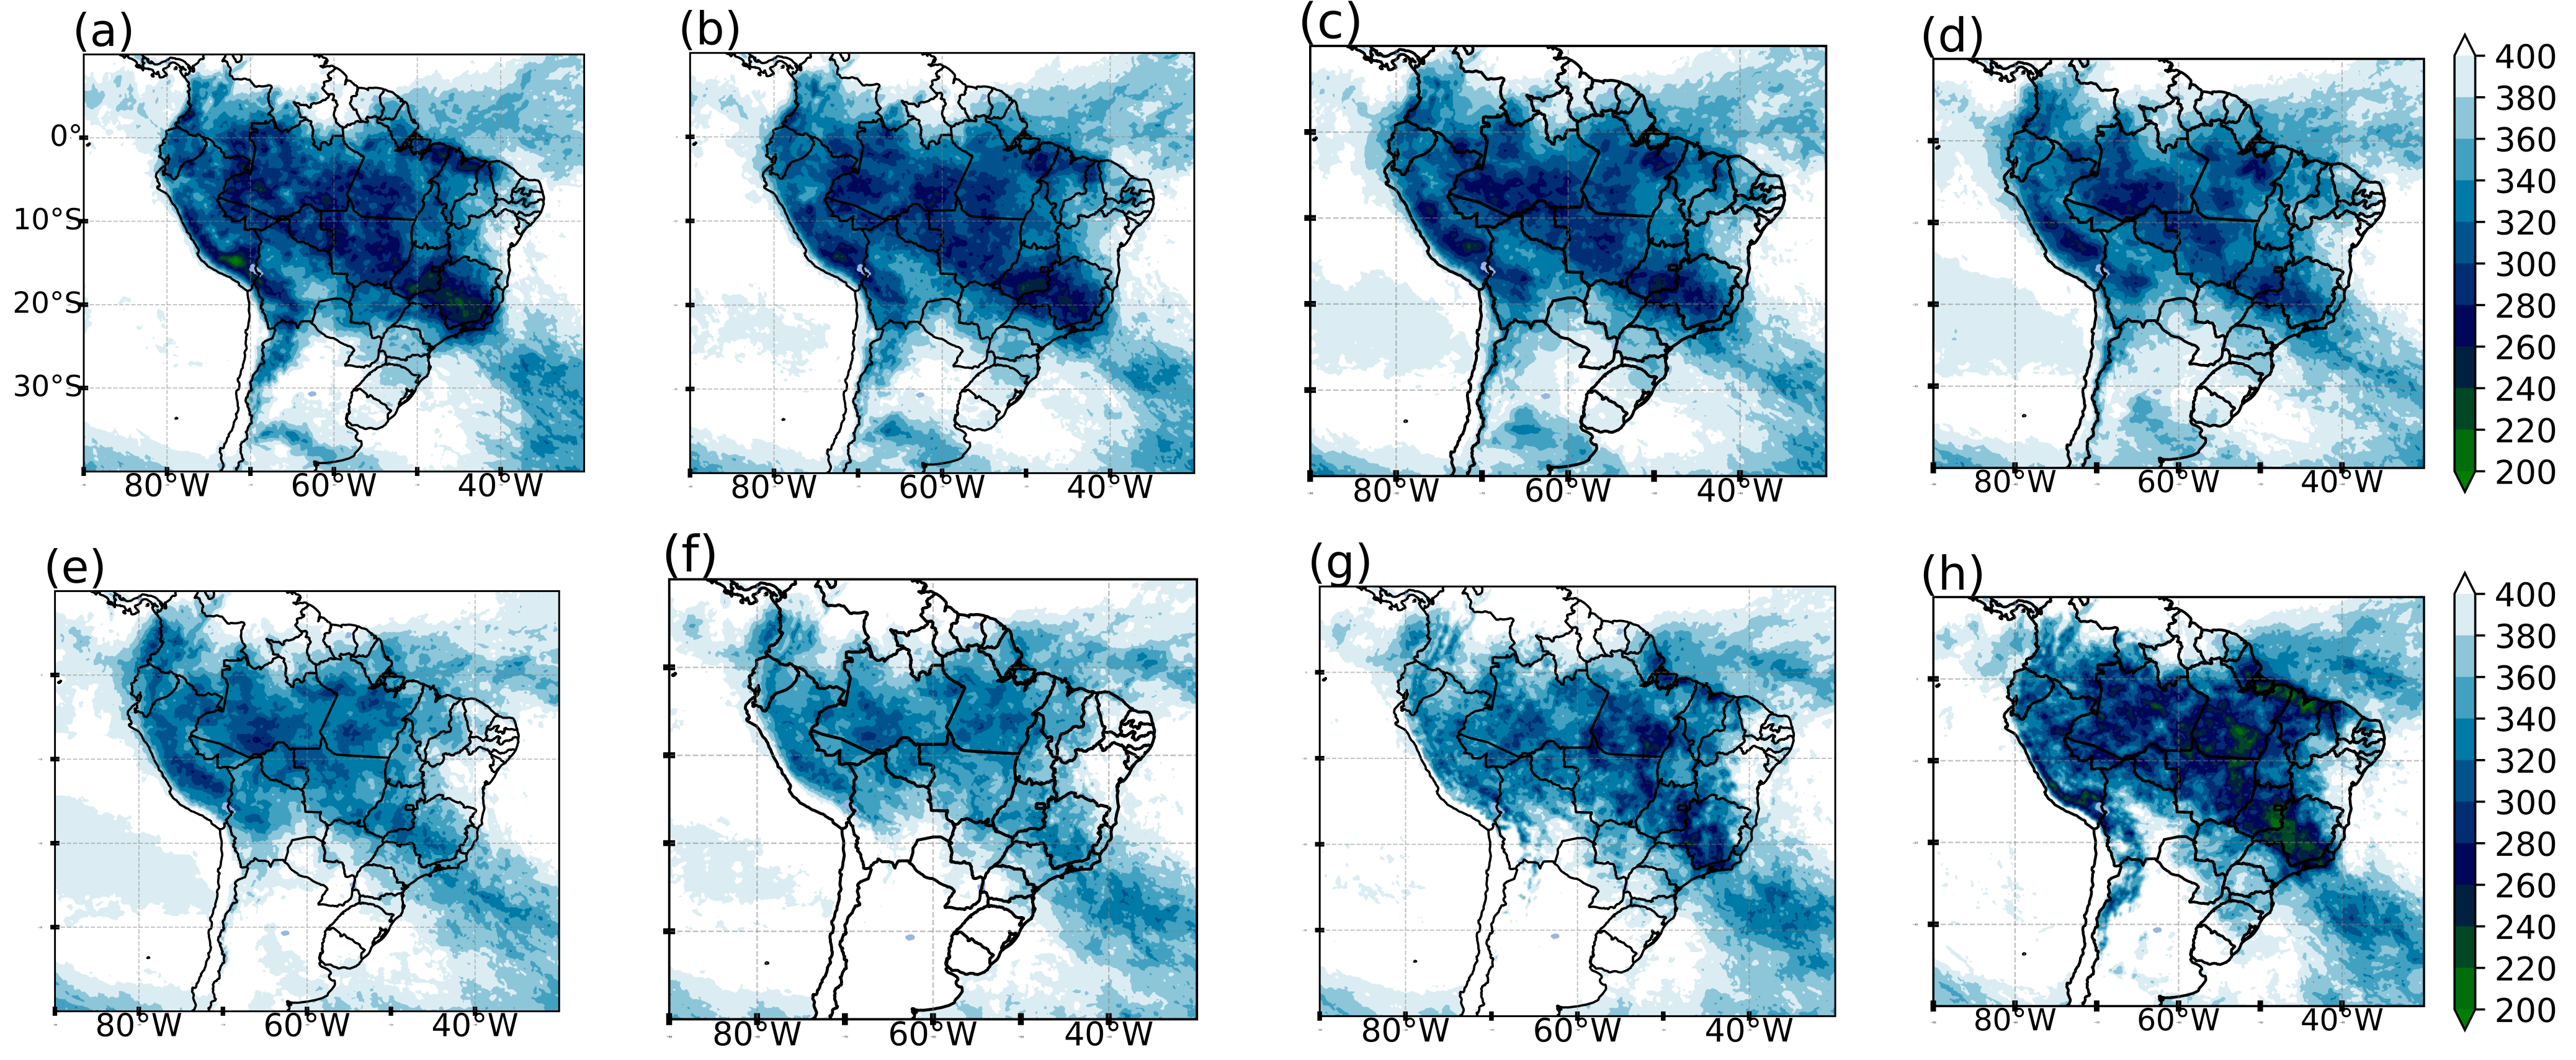
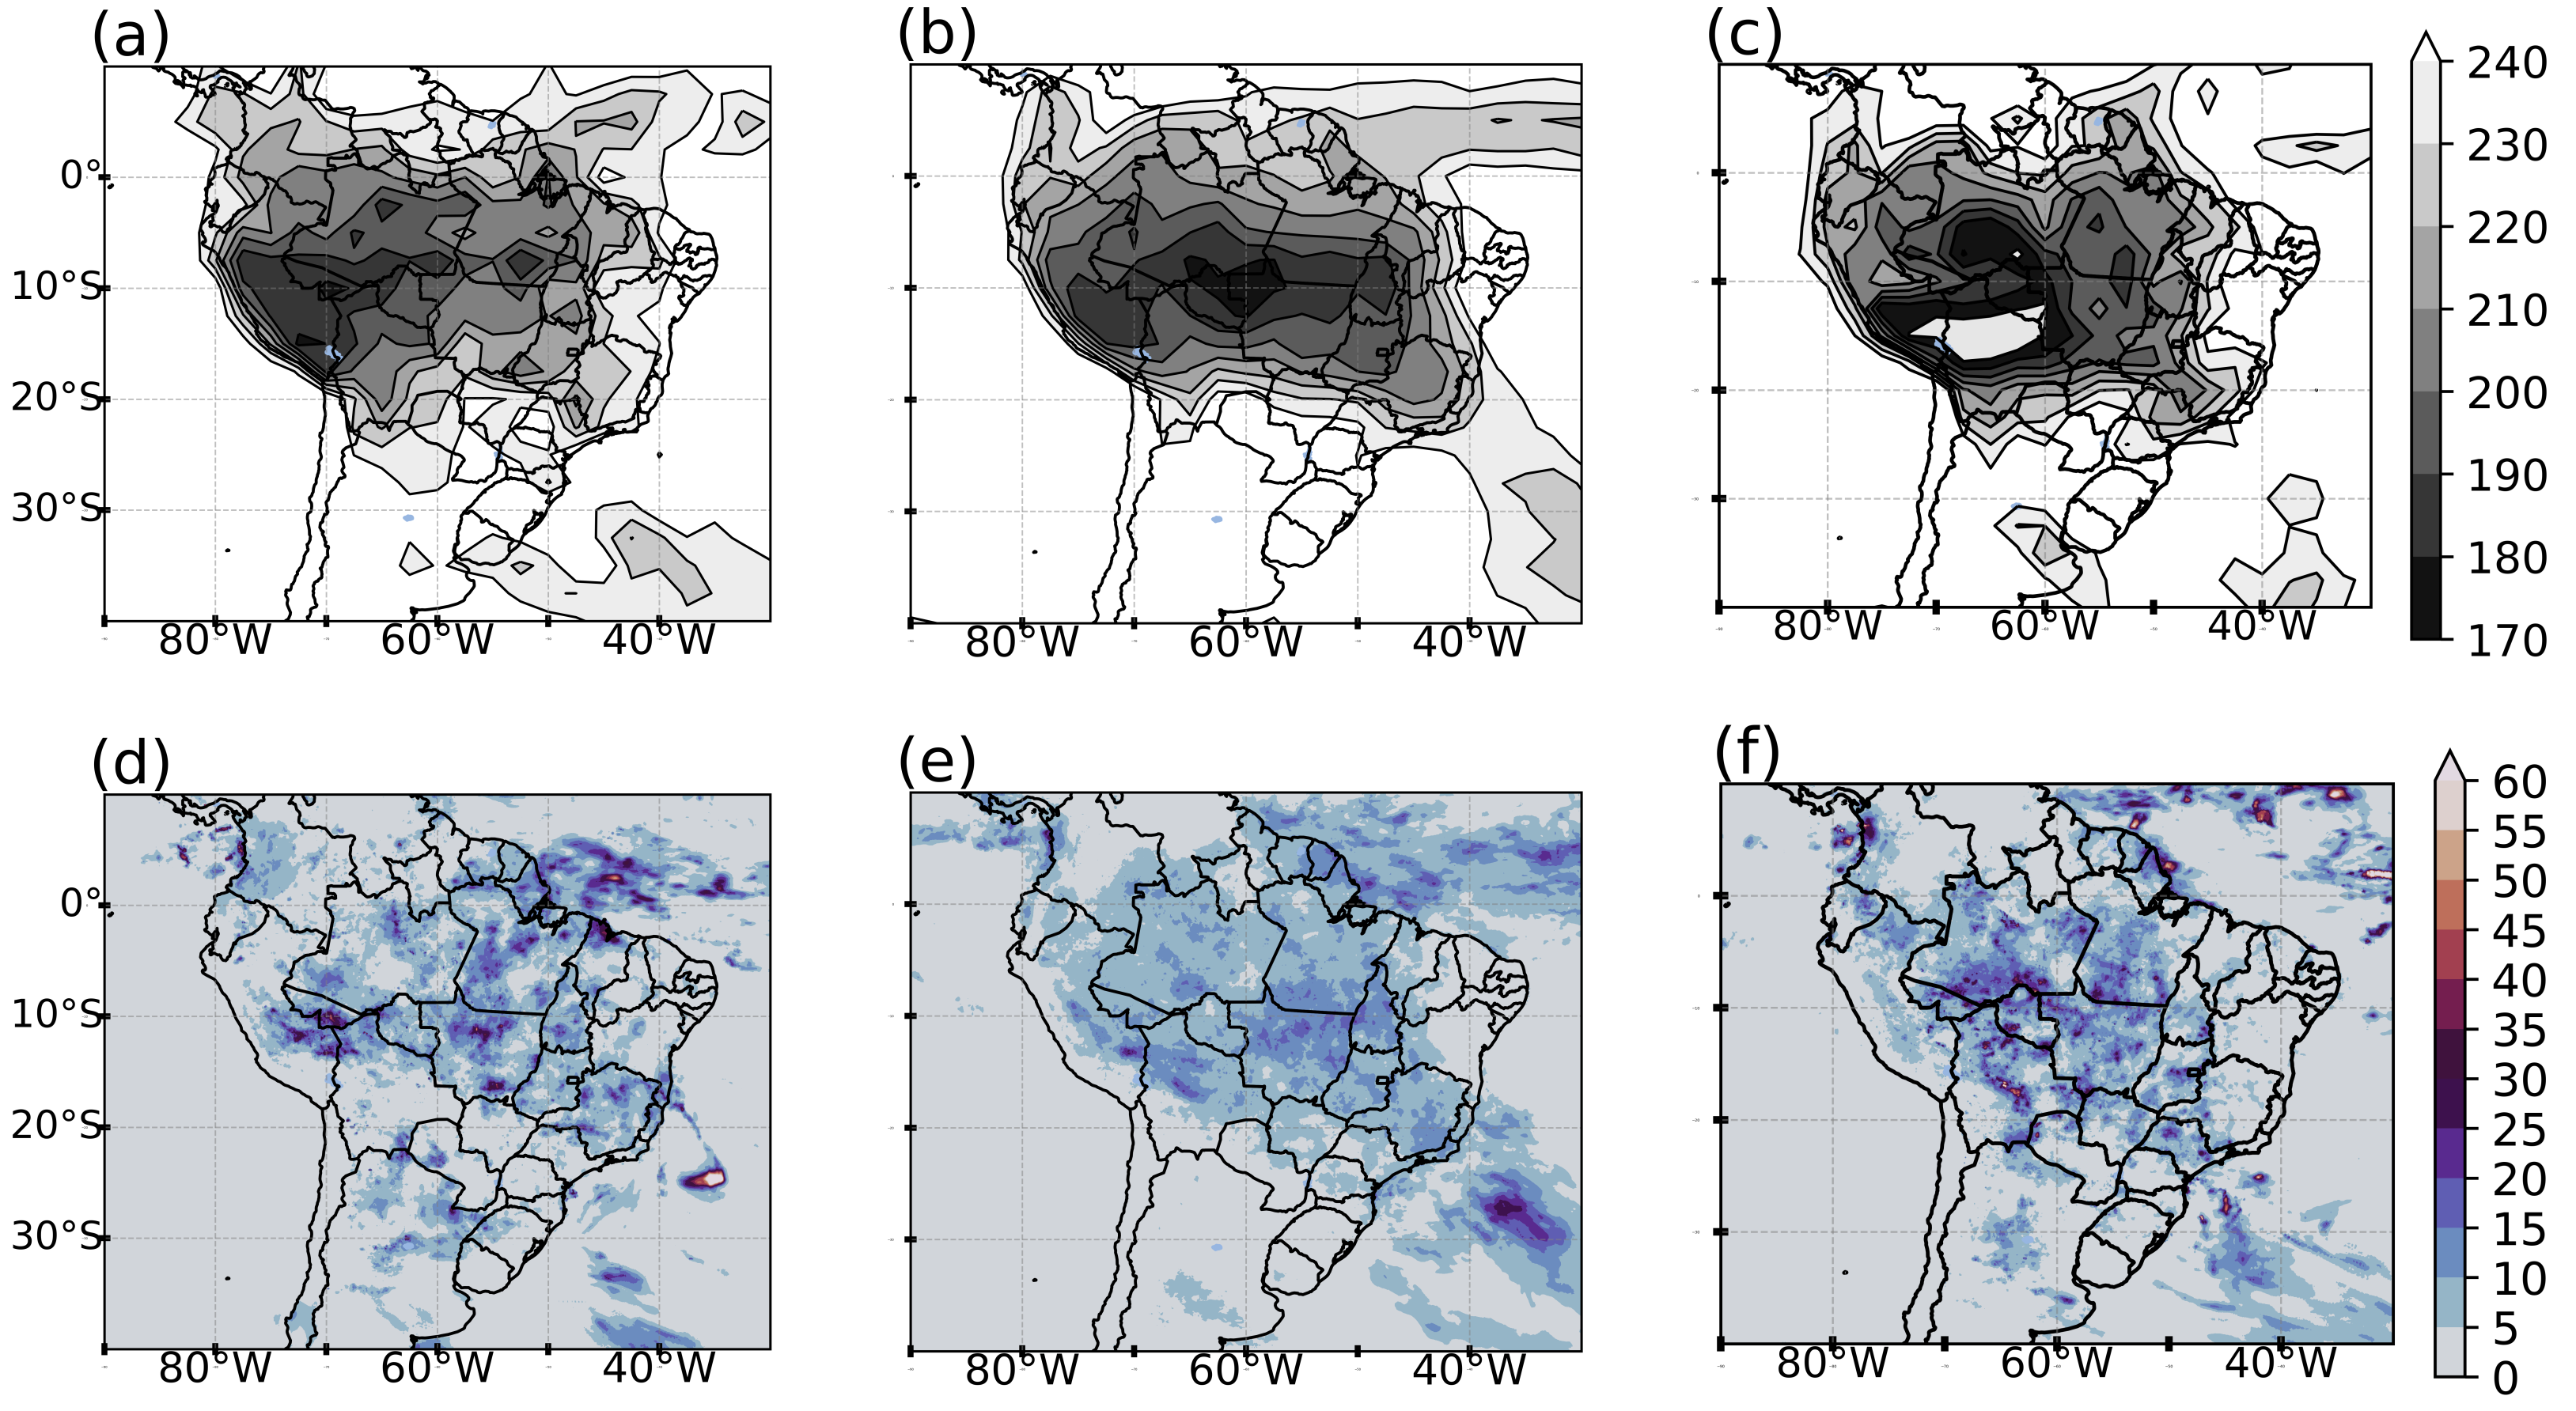
- OLR and PrecipitationThe OLR field (Figure 3a) for −3D shows intense values below 210 north of 20 S with an extension to the southern and southeastern part of the country, as well as on the ITCZ. The precipitation variable spatially agrees with the OLR fields (Figure 3d). The composites of 0D (Figure 3b) shows a structured OLR behavior, with a wider range of convective activity in the northwest–southeast direction, indicative of the SACZ cloudiness band. The same behavior can be observed for more intense values of OLR (<200 ) from the west of the states of Amazonas to Goiás. Precipitation cores (Figure 3e) above 30 can be observed in the southwest of the AO and in the coast of the state of Amapá over the ITCZ region. After the SACZ event (+2D), an OLR band remains from the north to the southeast but with values above 210 (Figure 3d), whereas for precipitation (Figure 3f), the intense values localize over the coast of the southern region of Brazil, characteristic of the passage of a frontal system with intense convective activity.
3.1.2. Composite of the Unfavorable Phase of the MJO
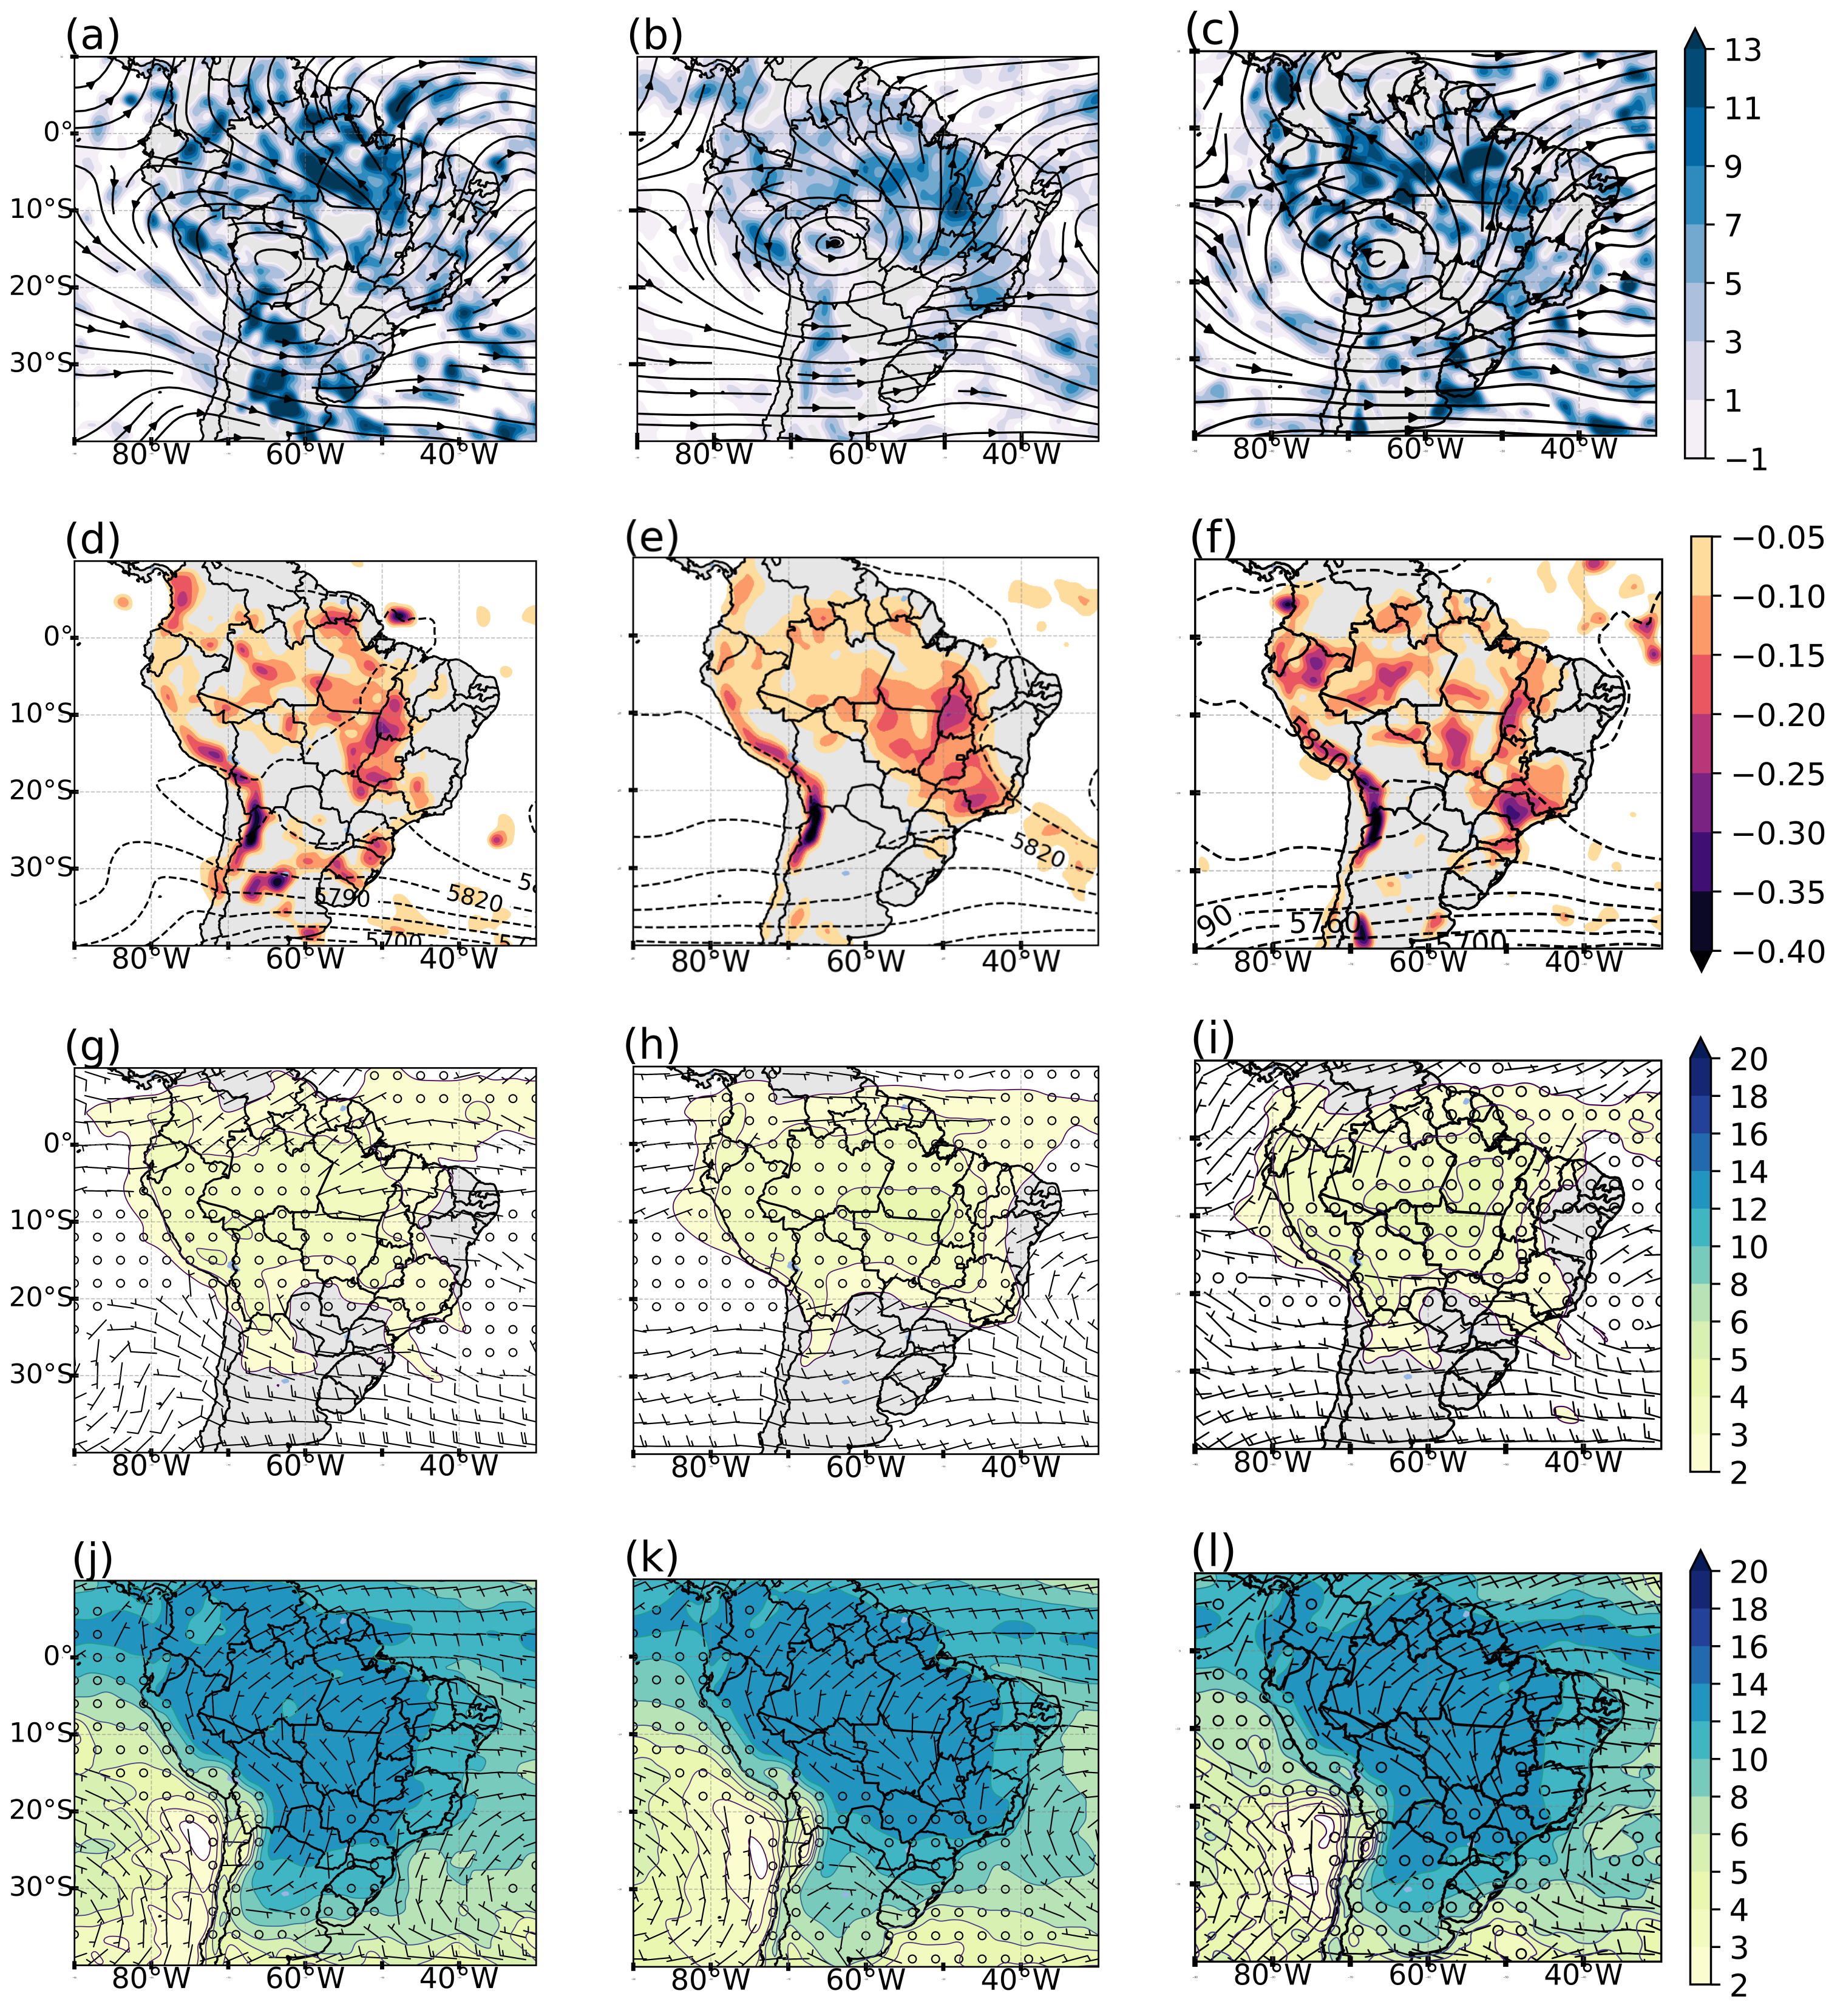
- Upper level (250 hPa)The pattern of the behavior of meteorological variables at the upper levels does not differ much from the composites of the active phase of the MJO. The main distinct characteristics are found in the configuration of the BH on 0D (Figure 4b), which is broader and more symmetrical. In addition to a pronounced mid-latitude trough that extends to the north of the state of São Paulo, the positive regions of horizontal divergence confirm the SACZ over the continent with a discontinuity over the ITCZ. On +2D (Figure 4c), the emphasis is on the presence of the trough but without the associated vortex.
- Medium level (500 hPa)The day before SACZ formation, subtropical highs were poorly configured (Figure 4d) and intense negative omega values were found in the interior of the continent and in the Andes Mountains. However, on 0D (Figure 4e), this variable was more organized and agrees with the regions of divergence at the upper levels. Likewise, specific moisture values did not vary much; only the spatial behavior with values above 2 (Figure 4h) remained on the continent, differing from the active phase of the MJO. This organized characteristic of moisture in the middle of the troposphere emphasizes the continental SACZ and denotes the intense role of moisture convergence at low levels. Furthermore, this result agrees with those of Carvalho et al. [17], who found cold phase years of the ENSO can contribute to the occurrence of continental SACZ. All events in this study occurred in La Niña years, indicating a possible influence of interannual variability on this spatial behavior. In composites 0D (Figure 4e), a wide trough with an axis at 50 W reaches the southern region of the country, possibly related to a cold front that propagates to the southeast region of the country, helping to organize the SACZ moisture channel. For the +2D composites (Figure 4f), the trough reduces in amplitude and reaches the north of the state of Rio Grande do Sul, while the subtropical highs penetrate more into the continent.
- Lower level (850 hPa)During an unfavorable phase of the MJO, in the −3D composites (Figure 4j), an intense and well-configured LLJ can be observed, with a bifurcation occurring at 10 S, with the specific moisture over the continent ranging from 10 to 14 . In the composites of days with SACZ (Figure 4k), the organization of the LLJ is directed to the southeast region, as well as the northern part of the SASH. This wind and humidity contribute to forming the convergence band and aligning it in the northwest–southeast direction. Figure 4l (+2D) shows that the flow is maintained toward southeastern Brazil and another toward northern Argentina, which limits the direction of moisture to only the SACZ region, in addition the supporting the northern branch of the winds, as it shifts its core further east, suggesting the weakening of the convergence zone.
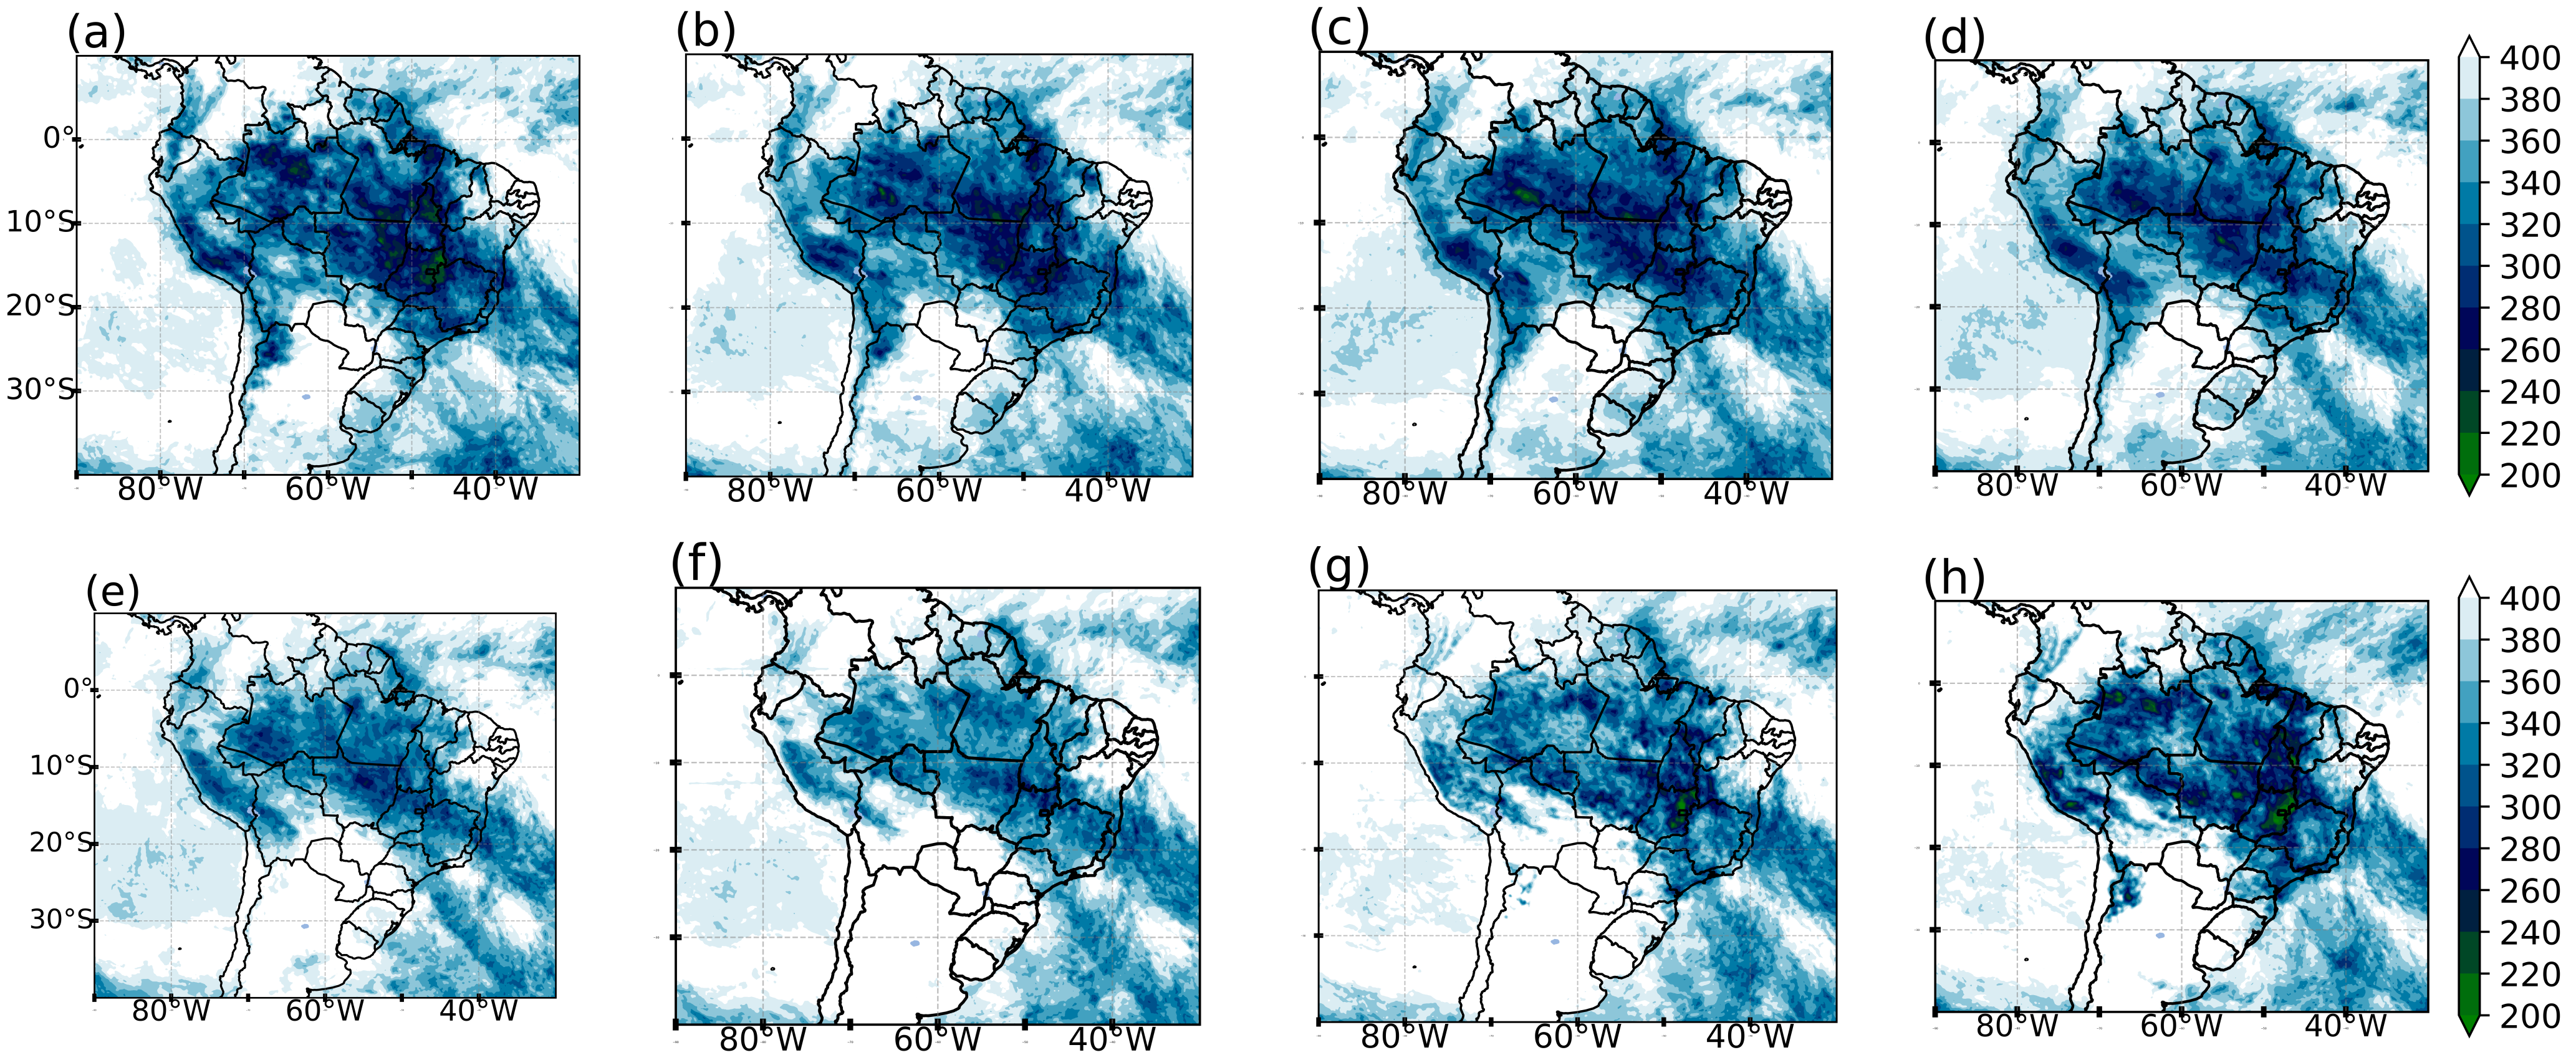
- OLR and PrecipitationThe OLR composites for day −3D (Figure 5a) show more intense nuclei west of the Amazon, with values around 190 . It can be observed in this field that the highest values (210–220 ) expand over the continent, which resembles the organization of the SACZ, which is characteristically also accompanied by the precipitation field (Figure 5d). For events in 0D (Figure 5b), the convergence band from the western part of the continent to the adjacent AO is verified. In this composites, the lowest OLR values are found over the continent, and the intense center, previously located in western Amazonian, is now elongated zonally up to the state of Tocantins, in agreement with the precipitation field (Figure 5e), whose daily average is 30 . Figure 5c in +2D, the expressive OLR values recede to the western Amazon region, and the convergence band in the northwest–southeast direction disappears. Precipitation presents point centers with more intense rates in the ITCZ region (Figure 5f) and over the Amazon–Bolivia border.
3.1.3. Composite of Transition (Unfavorable–Active) Phase of the MJO
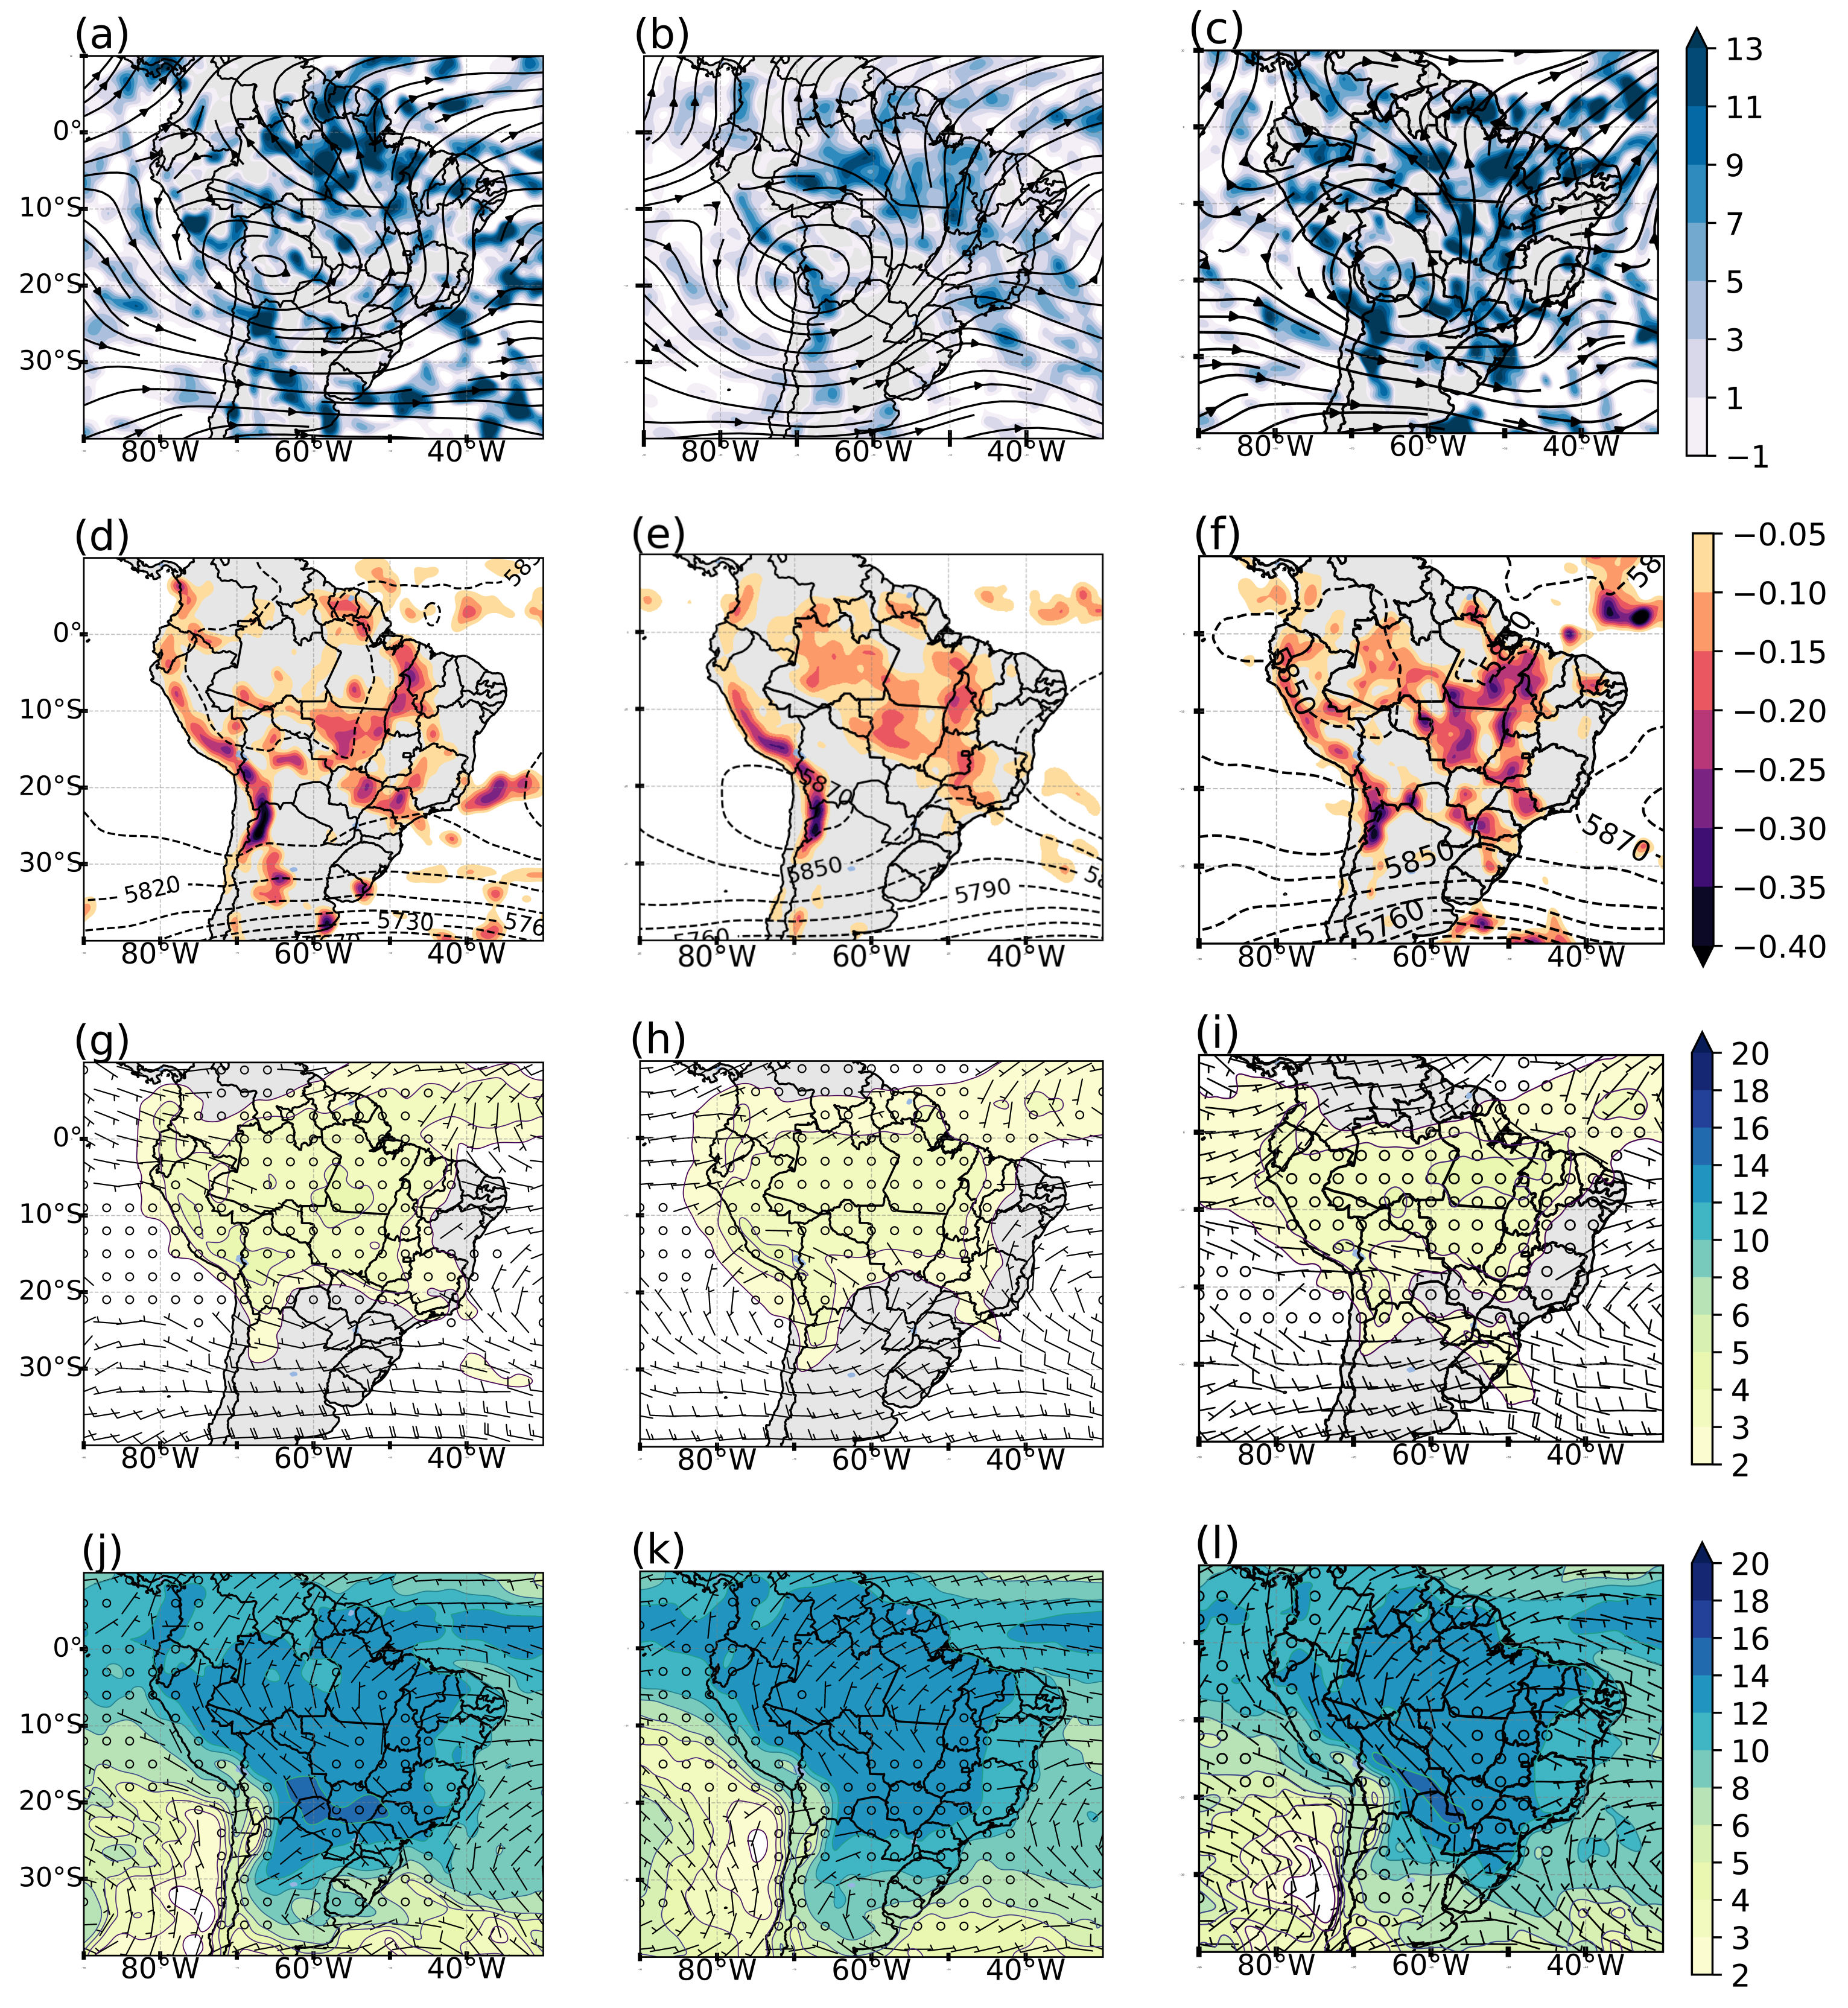
- Upper level (250 hPa)Figure 6a (−3D) shows the southernmost center of the BH at 18 S, 65 W, and the TNB leaning over the continent, different from the patterns described above. Positive divergence values are significant ( s), especially in the northern region. At 42 W, a trough is formed in the western flow over the AO. In the composites of SACZ events at 0D (Figure 6b), the BH intensifies and becomes more symmetrical, consequently reinforcing the trough at mid-latitudes. Positive divergence values persist, mainly in the areas of difluence between the two systems (BH and TNB) and in front of the trough axis around 50 W. This provides a long zone of oriented convergence of the north to southeast of Brazil. On +2D (Figure 6c), BH expands to the south, and extensive areas of intense positive values of horizontal divergence spread across the continent and ocean, disorganizing the SACZ.
- Medium level (500 hPa)Figure 6d,g for −3D day shows that the subtropical highs are not configured, but a broad trough occurs in the southeast and south regions of Brazil. The specific humidity has significant values at this level, which suggests support of a convergence band. Conversely, negative values of the vertical velocity are distributed over a part of Brazil and continuously over the Andes mountain range from the coast of Colombia to the north of Argentina. The composites for the SACZ days (Figure 6e) show the well-configured subtropical highs, with the SPSH located in the inland of the continent. Between these two systems, the trough reaches the north of the state of São Paulo, and the omega indicates negative values organized over the continent if compared to −3D (Figure 6d). The presence of subtropical highs is evident as a broad band of specific moisture that narrows toward the southeast of the country, possibly due to the stretching of the trough. For +2D, Figure 6f,i show that the subtropical highs are positioned further away from the continent, along with the trough, which reduces in amplitude; the vertical velocity intensifies with an area in agreement with the horizontal divergence region.
- Lower level (850 hPa)The behavior of the wind the day before the SACZ in Figure 6j shows the direction of the wind from north to south over the states of Amazonas and Pará. An LLJ is observed along the east side of the Andes, but with a branch to the east at 18 S. Figure 6k shows a clear change in the direction in the wind in the northwestern part of the Amazon region. At that point, it changes from north to east, directing moisture to the SACZ region. Contrary to this behavior, the return of flow in the northern direction of Argentina is observed only in Figure 6l, contributing to the transport of moisture in that region, which characterizes the weakening of the convergence zone in the typical region. The specific humidity does not show wide variations in the values in the different stages of the SACZ.
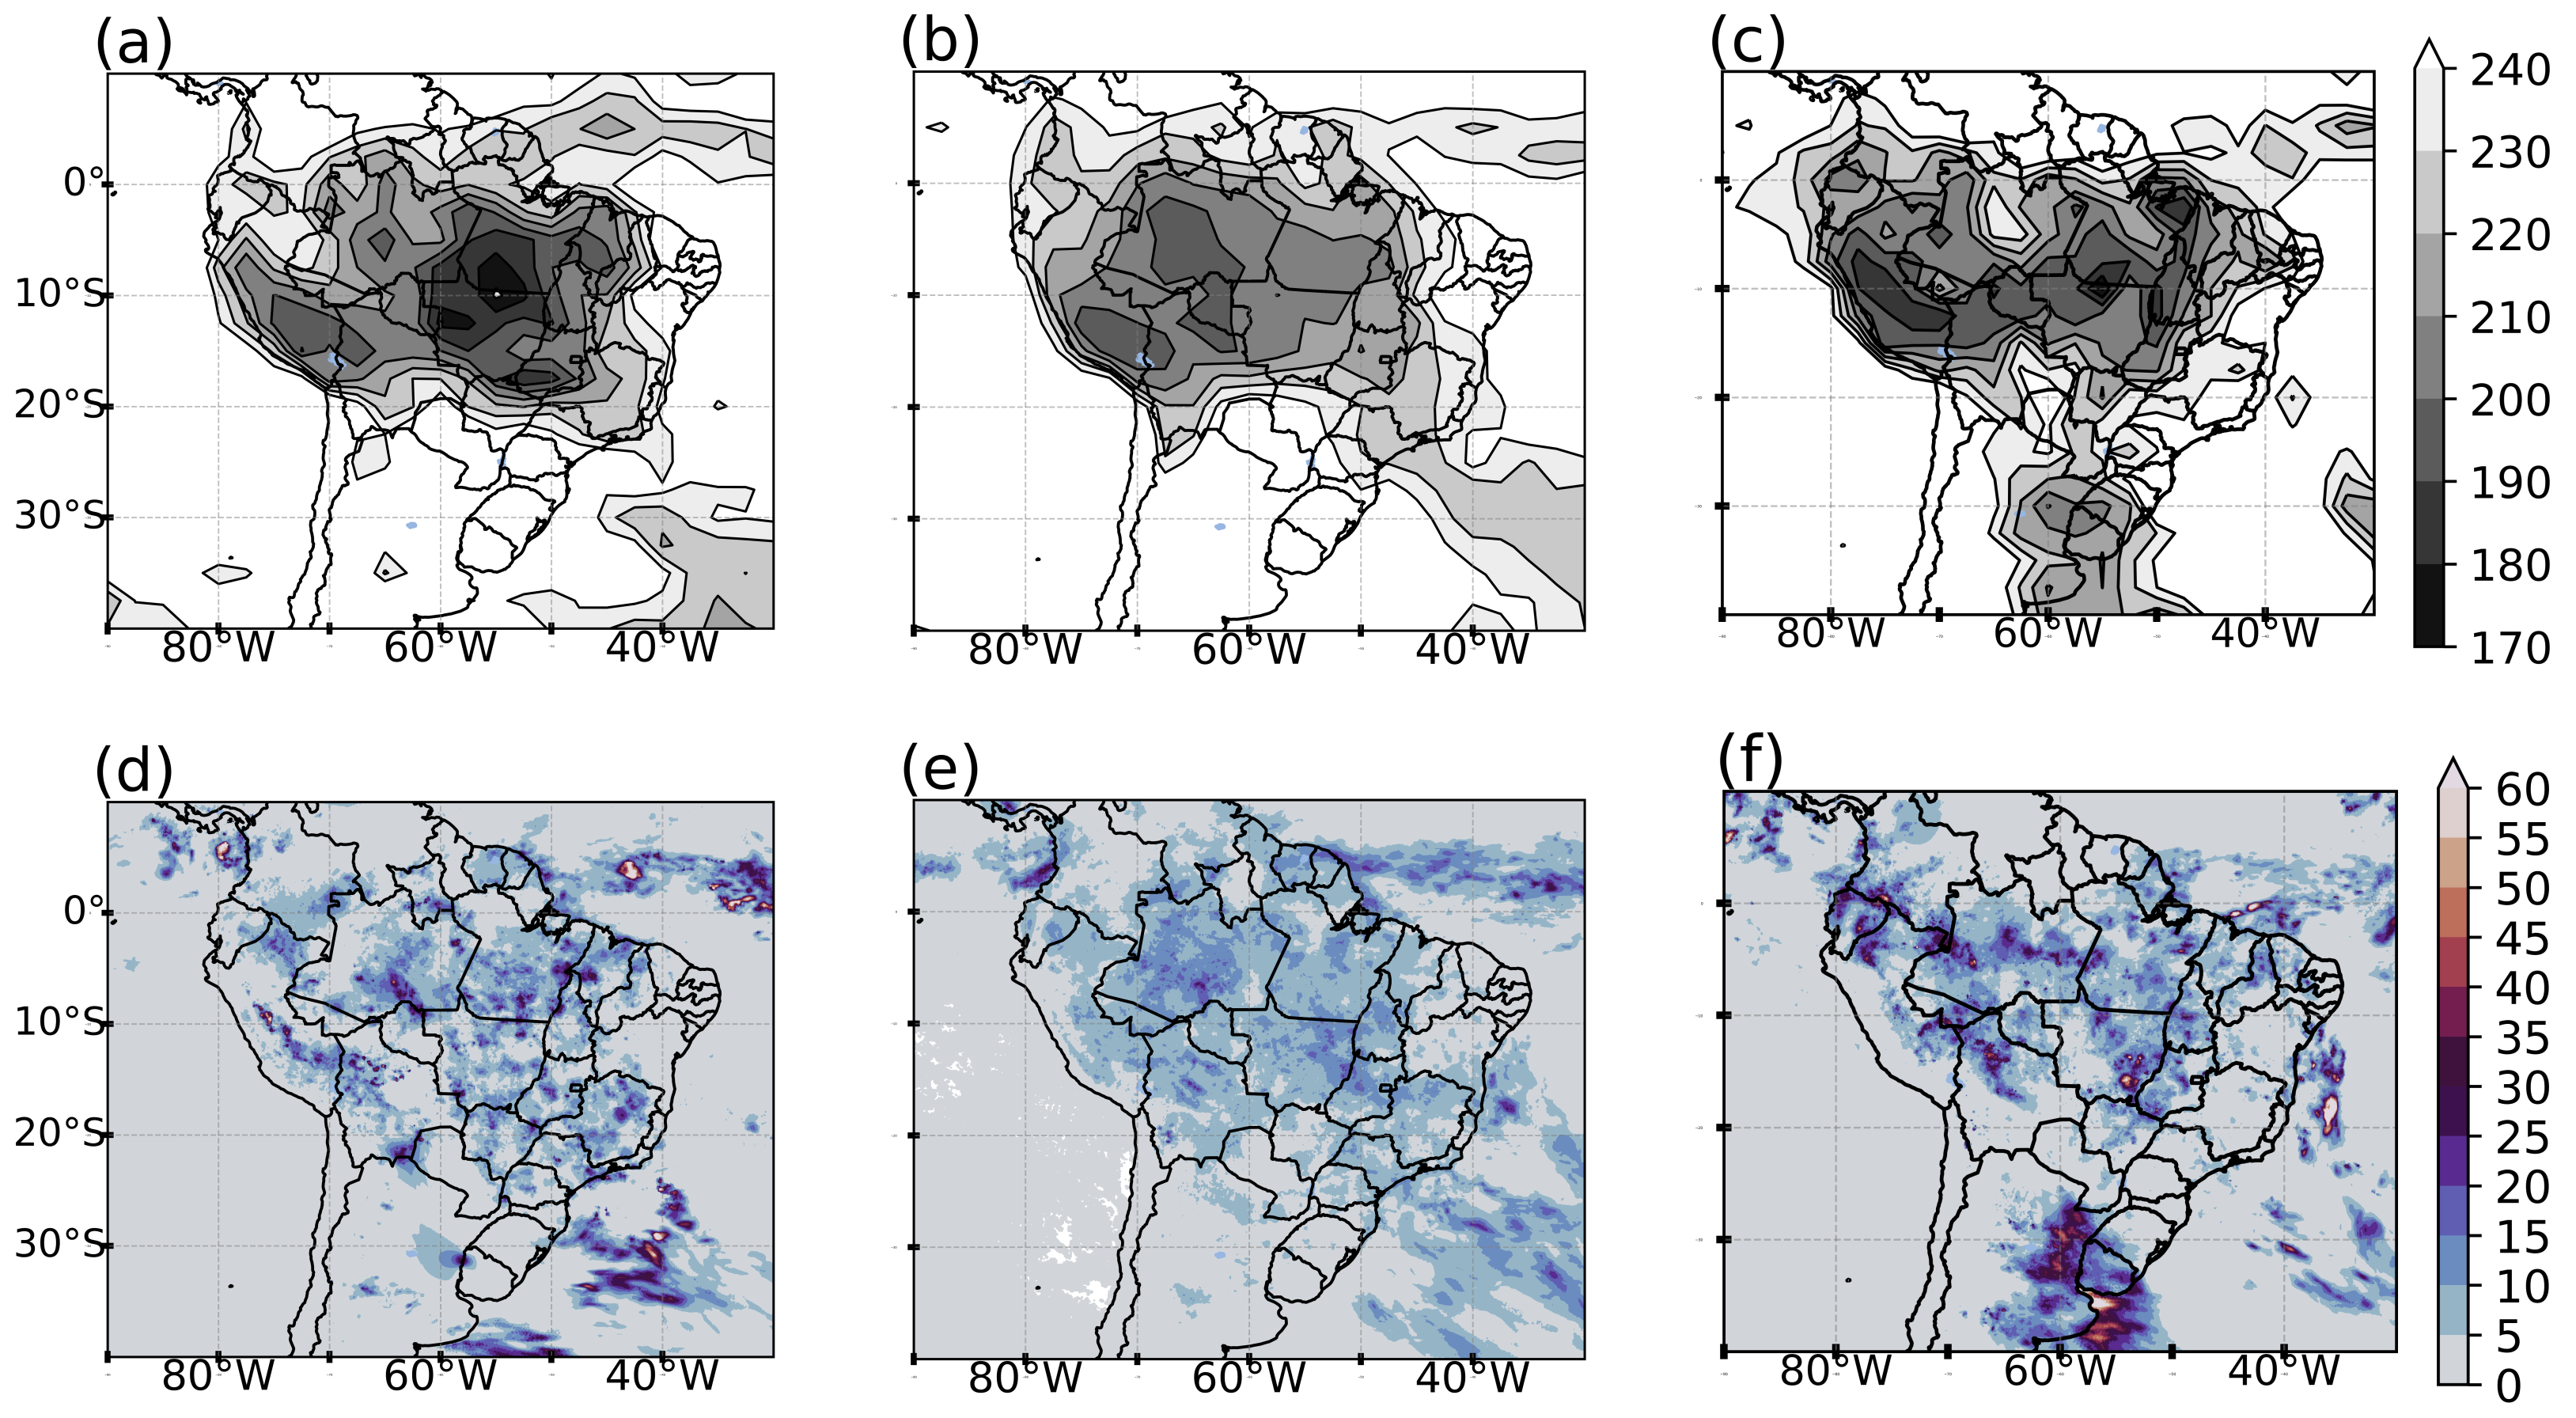
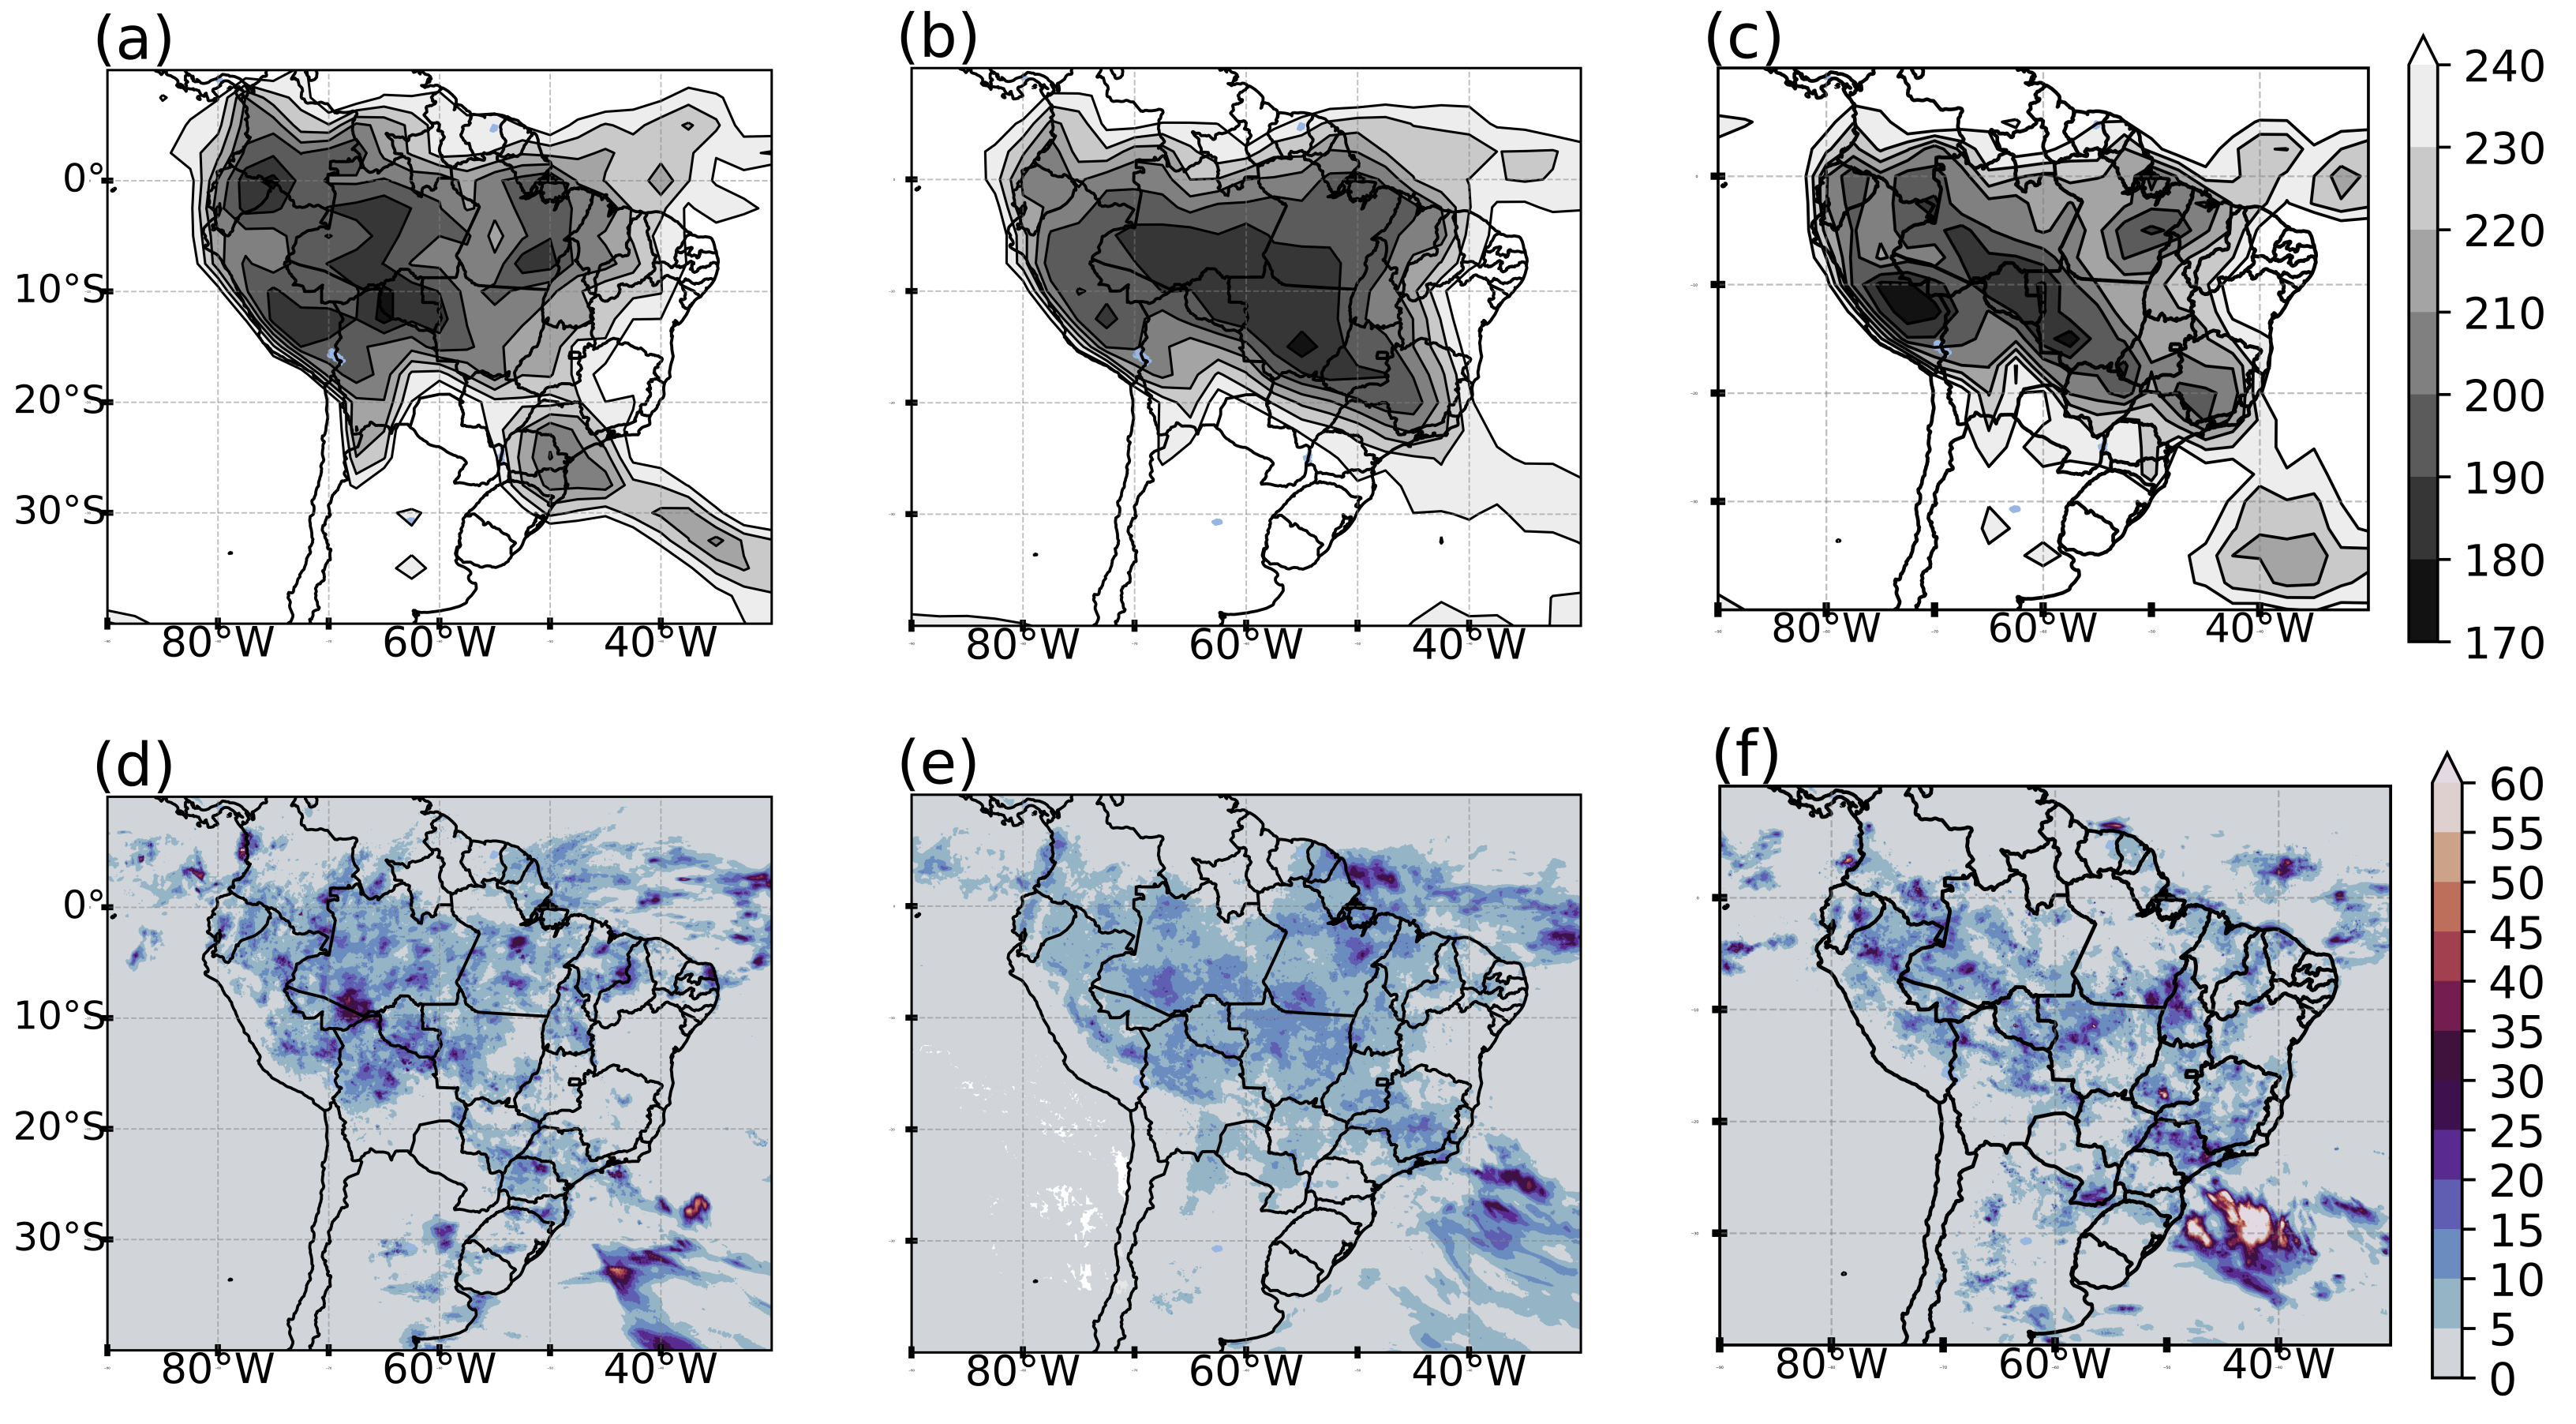
- OLR and PrecipitationThe pattern for the MJO transition phase in −3D (Figure 7a) shows a band of cloudiness in the northwest–southeast direction but with a small discontinuity over the AO. Minimum OLR values of 190 were found over north and central-west Brazil, whose fields are aligned with the precipitation distribution (Figure 7d). Figure 8b shows a more spatially homogeneous OLR field, characterizing a more southern SACZ with less intense nuclei than the previous patterns. The intense precipitation values (Figure 7e) agree with the OLR fields with centers over the western Amazon region. Composites of the day after SACZ (Figure 7c) also differ from the patterns of the active and unfavorable phases of the MJO; the two patterns indicate the occurrence of the SACZ in the northwest–southeast direction. In this case, this is not observed: there is only one sudden shift southwards. This can be explained by the arrival and formation of a frontal system that is positioned to the south of Uruguay, whose expressive values are observed in the rain field (Figure 7f), in addition to a discontinuous band over the oceanic SACZ.
3.2. Diurnal Cycle of the OLR
4. Discussion and Conclusions
Author Contributions
Funding
Institutional Review Board Statement
Informed Consent Statement
Data Availability Statement
Acknowledgments
Conflicts of Interest
Abbreviations
| AO | Atlantic Ocean |
| BH | Bolivian High |
| CAS | Continental Amazonian SACZ |
| CCS | Continental Coastal SACZ |
| CSL | Coast Squall Line |
| CPTEC | Center for Weather Forecasting and Climate Studies |
| DSA | Satellite and Environmental Systems Division |
| ECMWF | European Center for Medium-Range Weather Forecasts |
| ENSO | El Niño-South Oscillation |
| GPM | Global Precipitation Measurement |
| IMERGE | Integrated MultiSatellite Retrievals for GPM |
| INPE | National Institute for Space Research |
| ITCZ | Intertropical Convergence Zone |
| LLJ | Low Level Jet |
| MCS | Mesoscale Convective System |
| MJO | Madden–Julian Oscillation |
| NOAA | National Oceanic and Atmospheric Administration |
| OCS | Oceanic SACZ |
| OLR | Outgoing Longwave Radiation |
| PSA | Pacific South-America |
| RMM | Real-Time Multivariate Index |
| SA | South America |
| SAMS | South American Monsoon System |
| SACZ | South Atlantic Convergence Zone |
| SASH | South Atlantic South High |
| SL | Squall Line |
| SPSH | South Pacific South High |
| TNB | Trough Northeast of Brazil |
| TRMM | Tropical Rainfall Measuring Mission |
References
- Zhou, J.; Lau, K. Does a monsoon climate exist over South America? J. Clim. 1998, 11, 1020–1040. [Google Scholar] [CrossRef]
- Nogué-Paegle, J.; Mechoso, C.R.; Fu, R.; Cook, K.H.; Liebmann, B. Progress in Pan American CLIVAR research: Understanding the South American Monsoon. Meteorologica. 2002, 27, 1–30. [Google Scholar]
- Gan, M.; Kousky, V.; Ropelewski, C. The South America monsoon circulation and its relationship to rainfall over west-central Brazil. J. Clim. 2004, 17, 47–66. [Google Scholar] [CrossRef] [Green Version]
- Marengo, J.A.; Soares, W.R.; Saulo, C.; Nicolini, M. Climatology of the low-level jet east of the Andes as derived from the NCEP–NCAR reanalyses: Characteristics and temporal variability. J. Clim. 2004, 17, 2261–2280. [Google Scholar] [CrossRef] [Green Version]
- Kousky, V.E. Pentad outgoing longwave radiation climatology for the South American sector. Rev. Bras. Meteor 1988, 3, 217–231. [Google Scholar]
- Horel, J.D.; Hahmann, A.N.; Geisler, J.E. An investigation of the annual cycle of convective activity over the tropical Americas. J. Clim. 1989, 2, 1388–1403. [Google Scholar] [CrossRef] [Green Version]
- Silva Dias, P.L.; Schubert, W.H.; DeMaria, M. Large-scale response of the tropical atmosphere to transient convection. J. Atmos. Sci. 1983, 40, 2689–2707. [Google Scholar] [CrossRef]
- Figueroa, S.N.; Satyamurty, P.; Da Silva Dias, P.L. Simulations of the summer circulation over the South American region with an eta coordinate model. J. Atmos. Sci. 1995, 52, 1573–1584. [Google Scholar] [CrossRef] [Green Version]
- Madden, R.A.; Julian, P.R. Detection of a 40–50 day oscillation in the zonal wind in the tropical Pacific. J. Atmos. Sci. 1971, 28, 702–708. [Google Scholar] [CrossRef]
- Kodama, Y. Large-scale common features of subtropical precipitation zones (the Baiu frontal zone, the SPCZ, and the SACZ) Part I: Characteristics of subtropical frontal zones. J. Meteorol. Soc. Jpn. Ser. II 1992, 70, 813–836. [Google Scholar] [CrossRef] [Green Version]
- Kodama, Y.M. Large-scale common features of sub-tropical convergence zones (the Baiu Frontal Zone, the SPCZ, and the SACZ) Part II: Conditions of the circulations for generating the STCZs. J. Meteorol. Soc. Jpn. Ser. II 1993, 71, 581–610. [Google Scholar] [CrossRef] [Green Version]
- Nogués-Paegle, J.; Mo, K.C. Alternating wet and dry conditions over South America during summer. Mon. Weather Rev. 1997, 125, 279–291. [Google Scholar] [CrossRef]
- Liebmann, B.; Kiladis, G.N.; Marengo, J.; Ambrizzi, T.; Glick, J.D. Submonthly convective variability over South America and the South Atlantic convergence zone. J. Clim. 1999, 12, 1877–1891. [Google Scholar] [CrossRef] [Green Version]
- Carvalho, L.M.; Jones, C.; Liebmann, B. Extreme precipitation events in southeastern South America and large-scale convective patterns in the South Atlantic convergence zone. J. Clim. 2002, 15, 2377–2394. [Google Scholar] [CrossRef] [Green Version]
- Nieto Ferreira, R.; Chao, W.C. Aqua-planet simulations of the formation of the South Atlantic convergence zone. Int. J. Climatol. 2013, 33, 615–628. [Google Scholar] [CrossRef] [Green Version]
- Paegle, J.N.; Byerle, L.A.; Mo, K.C. Intraseasonal modulation of South American summer precipitation. Mon. Weather Rev. 2000, 128, 837–850. [Google Scholar] [CrossRef]
- Carvalho, L.M.; Jones, C.; Liebmann, B. The South Atlantic convergence zone: Intensity, form, persistence, and relationships with intraseasonal to interannual activity and extreme rainfall. J. Clim. 2004, 17, 88–108. [Google Scholar] [CrossRef] [Green Version]
- Zhang, C. Madden–Julian oscillation: Bridging weather and climate. Bull. Am. Meteorol. Soc. 2013, 94, 1849–1870. [Google Scholar] [CrossRef]
- Knutson, T.R.; Weickmann, K.M. 30–60 day atmospheric oscillations: Composite life cycles of convection and circulation anomalies. Mon. Weather Rev. 1987, 115, 1407–1436. [Google Scholar] [CrossRef]
- Madden, R.A.; Julian, P.R. Description of global-scale circulation cells in the tropics with a 40–50 day period. J. Atmos. Sci. 1972, 29, 1109–1123. [Google Scholar] [CrossRef]
- Chen, G. Diversity of the Global Teleconnections Associated with the Madden–Julian Oscillation. J. Clim. 2021, 34, 397–414. [Google Scholar] [CrossRef]
- Kousky, V.E.; Kayano, M.T. Principal modes of outgoing longwave radiation and 250-mb circulation for the South American sector. J. Clim. 1994, 7, 1131–1143. [Google Scholar] [CrossRef] [Green Version]
- De Souza, E.B.; Ambrizzi, T. Modulation of the intraseasonal rainfall over tropical Brazil by the Madden–Julian oscillation. Int. J. Climatol. J. R. Meteorol. Soc. 2006, 26, 1759–1776. [Google Scholar] [CrossRef]
- Cunningham, C.A.C.; Cavalcanti, I.F.d.A. Intraseasonal modes of variability affecting the South Atlantic Convergence Zone. Int. J. Climatol. 2006, 26, 1165–1180. [Google Scholar] [CrossRef]
- Alvarez, M.S.; Vera, C.S.; Kiladis, G.N.; Liebmann, B. Influence of the Madden Julian Oscillation on precipitation and surface air temperature in South America. Clim. Dyn. 2016, 46, 245–262. [Google Scholar] [CrossRef]
- Casarin, D.; Kousky, V. Anomalias de precipitação no sul do Brasil e variações na circulação atmosférica. Rev. Bras. Meteorol. 1986, 1, 83–90. [Google Scholar]
- Vera, C.; Higgins, W.; Amador, J.; Ambrizzi, T.; Garreaud, R.; Gochis, D.; Gutzler, D.; Lettenmaier, D.; Marengo, J.; Mechoso, C.; et al. Toward a unified view of the American monsoon systems. J. Clim. 2006, 19, 4977–5000. [Google Scholar] [CrossRef]
- Grimm, A.M. Madden–Julian Oscillation impacts on South American summer monsoon season: Precipitation anomalies, extreme events, teleconnections, and role in the MJO cycle. Clim. Dyn. 2019, 53, 907–932. [Google Scholar] [CrossRef]
- Mayta, V.C.; Ambrizzi, T.; Espinoza, J.C.; Silva Dias, P.L. The role of the Madden–Julian oscillation on the Amazon Basin intraseasonal rainfall variability. Int. J. Climatol. 2019, 39, 343–360. [Google Scholar] [CrossRef]
- Vitorino, M.I.; da Silva Dias, P.; Ferreira, N. Observational study of the seasonality of the submonthly and intraseasonal signal over the tropics. Meteorol. Atmos. Phys. 2006, 93, 17–35. [Google Scholar] [CrossRef]
- Alves, J.; Barbosa, A.C.; Silva, E.M.; Vasconcelos Junior, F.d.C.; Silva, M.L.d.; Santos, A.; Lira, M.A.; Sombra, S.S. Convective Intraseasonal Oscillations beteween Indian-Pacific and Northeasth Brazil Regions: Some Observational and Models Characteristics. Rev. Bras. Meteorol. 2018, 33, 193–206. [Google Scholar] [CrossRef]
- Ohsawa, T.; Ueda, H.; Hayashi, T.; Watanabe, A.; Matsumoto, J. Diurnal variations of convective activity and rainfall in tropical Asia. J. Meteorol. Soc. Jpn. Ser. II 2001, 79, 333–352. [Google Scholar] [CrossRef] [Green Version]
- Zhou, L.; Wang, Y. Tropical Rainfall Measuring Mission observation and regional model study of precipitation diurnal cycle in the New Guinean region. J. Geophys. Res. Atmos. 2006, 111. [Google Scholar] [CrossRef] [Green Version]
- Mori, S.; Hamada, J.I.; Sakurai, N.; Fudeyasu, H.; Kawashima, M.; Hashiguchi, H.; Syamsudin, F.; Arbain, A.A.; Sulistyowati, R.; Matsumoto, J.; et al. Convective systems developed along the coastline of Sumatera Island, Indonesia, observed with an X-band Doppler radar during the HARIMAU2006 campaign. J. Meteorol. Soc. Jpn. Ser. II 2011, 89, 61–81. [Google Scholar] [CrossRef] [Green Version]
- Fajary, F.R.; Hadi, T.W.; Yoden, S. Contributing factors to spatiotemporal variations of Outgoing Longwave Radiation (OLR) in the tropics. J. Clim. 2019, 32, 4621–4640. [Google Scholar] [CrossRef]
- Quadro, M.F.L.d.; Silva Dias, M.A.; Gonçalves, L.G.; Herdies, D.L.; Berbery, E.H. Análise Climatológica da precipitação e do Transporte de umidade na região da ZCAS através da Nova geração de reanálises. Rev. Bras. Meteorol. 2012, 27, 152–162. [Google Scholar] [CrossRef] [Green Version]
- Hersbach, H.; Bell, B.; Berrisford, P.; Hirahara, S.; Horányi, A.; Muñoz-Sabater, J.; Nicolas, J.; Peubey, C.; Radu, R.; Schepers, D.; et al. The ERA5 global reanalysis. Q. J. R. Meteorol. Soc. 2020, 146, 1999–2049. [Google Scholar] [CrossRef]
- Huffman, G.J.; Bolvin, D.T.; Braithwaite, D.; Hsu, K.; Joyce, R.; Xie, P.; Yoo, S.H. NASA global precipitation measurement (GPM) integrated multi-satellite retrievals for GPM (IMERG). Algorithm Theor. Basis Doc. Version 2015, 4, 30. [Google Scholar]
- Huffman, G.J.; Bolvin, D.T.; Nelkin, E.J. Integrated Multi-satellitE Retrievals for GPM (IMERG) technical documentation. NASA/GSFC Code 2015, 612, 47. [Google Scholar]
- Huffman, G.J.; Bolvin, D.T.; Nelkin, E.J. Day 1 IMERG Final Run Release Notes; NASA/GSFC: Greenbelt, MD, USA, 2015.
- Rozante, J.R.; Moreira, D.S.; de Goncalves, L.G.G.; Vila, D.A. Combining TRMM and surface observations of precipitation: Technique and validation over South America. Weather Forecast. 2010, 25, 885–894. [Google Scholar] [CrossRef] [Green Version]
- Ceballos, J.C.; Lima, W.F.A.; Souza, J.M.d. Outgoing longwave radiation at the top of the atmosphere: Preliminary assessment using GOES-8 Imager data. Rev. Bras. GeofiSica 2003, 21, 53–64. [Google Scholar] [CrossRef]
- Grimm, A.M.; Natori, A.A. Climate change and interannual variability of precipitation in South America. Geophys. Res. Lett. 2006, 33. [Google Scholar] [CrossRef] [Green Version]
- Rosa, E.B.; Pezzi, L.P.; Quadro, M.F.L.D.; Brunsell, N. Automated Detection Algorithm for SACZ, Oceanic SACZ and their Climatological Features. Front. Environ. Sci. 2020, 8, 18. [Google Scholar] [CrossRef]
- Herdies, D.L.; da Silva, A.; Silva Dias, M.A.; Nieto Ferreira, R. Moisture budget of the bimodal pattern of the summer circulation over South America. J. Geophys. Res. Atmos. 2002, 107, LBA-42. [Google Scholar] [CrossRef]
- Wheeler, M.C.; Hendon, H.H. An all-season real-time multivariate MJO index: Development of an index for monitoring and prediction. Mon. Weather Rev. 2004, 132, 1917–1932. [Google Scholar] [CrossRef]
- Alvarez, M.S.; Vera, C.S.; Kiladis, G.N. MJO modulating the activity of the leading mode of intraseasonal variability in South America. Atmosphere 2017, 8, 232. [Google Scholar] [CrossRef] [Green Version]
- Shimizu, M.H.; Ambrizzi, T.; Liebmann, B. Extreme precipitation events and their relationship with ENSO and MJO phases over northern South America. Int. J. Climatol. 2017, 37, 2977–2989. [Google Scholar] [CrossRef]
- Grimm, A.M.; Hakoyama, L.R.; Scheibe, L.A. Active and break phases of the South American summer monsoon: MJO influence and subseasonal prediction. Clim. Dyn. 2021, 56, 3603–3624. [Google Scholar] [CrossRef]
- Kousky, V.E.; Gan, M.A. Upper tropospheric cyclonic vortices in the tropical South Atlantic. Tellus 1981, 33, 538–551. [Google Scholar] [CrossRef] [Green Version]
- Jones, C.; Waliser, D.E.; Gautier, C. The influence of the Madden–Julian oscillation on ocean surface heat fluxes and sea surface temperature. J. Clim. 1998, 11, 1057–1072. [Google Scholar] [CrossRef]
- Mota, M.; NOBRE, C.A. Relação da variabilidade da energia potencial convectiva disponível (CAPE) com a precipitação e a alta da Bolívia durante a campanha Wet-AMC/LBA. Rev. Bras. Meteorol. 2006, 21, 344–355. [Google Scholar]
- Cohen, J.C.; Silva Dias, M.A.; Nobre, C.A. Environmental conditions associated with Amazonian squall lines: A case study. Mon. Weather Rev. 1995, 123, 3163–3174. [Google Scholar] [CrossRef]
- Garstang, M.; Massie Jr, H.L.; Halverson, J.; Greco, S.; Scala, J. Amazon coastal squall lines. Part I: Structure and kinematics. Mon. Weather Rev. 1994, 122, 608–622. [Google Scholar] [CrossRef] [Green Version]
- Kousky, V.E. Diurnal rainfall variation in northeast Brazil. Mon. Weather Rev. 1980, 108, 488–498. [Google Scholar] [CrossRef] [Green Version]
- Ninomiya, K. Similarity and difference between the South Atlantic convergence zone and the Baiu frontal zone simulated by an AGCM. J. Meteorol. Soc. Jpn. Ser. II 2007, 85, 277–299. [Google Scholar] [CrossRef] [Green Version]
- Nielsen, D.M.; Belém, A.L.; Marton, E.; Cataldi, M. Dynamics-based regression models for the South Atlantic Convergence Zone. Clim. Dyn. 2019, 52, 5527–5553. [Google Scholar] [CrossRef] [Green Version]
- Navarra, A.; Stern, W.F.; Miyakoda, K. Reduction of the Gibbs Oscillation in Spectral Model Simulations. J. Clim. 1994, 7, 1169–1183. [Google Scholar] [CrossRef] [Green Version]
- Liebmann, B.; Smith, C.A. Description of a complete (interpolated) outgoing longwave radiation dataset. Bull. Am. Meteorol. Soc. 1996, 77, 1275–1277. [Google Scholar]


Publisher’s Note: MDPI stays neutral with regard to jurisdictional claims in published maps and institutional affiliations. |
© 2021 by the authors. Licensee MDPI, Basel, Switzerland. This article is an open access article distributed under the terms and conditions of the Creative Commons Attribution (CC BY) license (https://creativecommons.org/licenses/by/4.0/).
Share and Cite
Viana, L.P.; Manco, J.A.A.; Herdies, D.L. Dynamic Characteristics of the Circulation and Diurnal Spatial Cycle of Outgoing Longwave Radiation in the Different Phases of the Madden–Julian Oscillation during the Formation of the South Atlantic Convergence Zone. Atmosphere 2021, 12, 1399. https://doi.org/10.3390/atmos12111399
Viana LP, Manco JAA, Herdies DL. Dynamic Characteristics of the Circulation and Diurnal Spatial Cycle of Outgoing Longwave Radiation in the Different Phases of the Madden–Julian Oscillation during the Formation of the South Atlantic Convergence Zone. Atmosphere. 2021; 12(11):1399. https://doi.org/10.3390/atmos12111399
Chicago/Turabian StyleViana, Liviany P., Jhonatan A. A. Manco, and Dirceu Luis Herdies. 2021. "Dynamic Characteristics of the Circulation and Diurnal Spatial Cycle of Outgoing Longwave Radiation in the Different Phases of the Madden–Julian Oscillation during the Formation of the South Atlantic Convergence Zone" Atmosphere 12, no. 11: 1399. https://doi.org/10.3390/atmos12111399
APA StyleViana, L. P., Manco, J. A. A., & Herdies, D. L. (2021). Dynamic Characteristics of the Circulation and Diurnal Spatial Cycle of Outgoing Longwave Radiation in the Different Phases of the Madden–Julian Oscillation during the Formation of the South Atlantic Convergence Zone. Atmosphere, 12(11), 1399. https://doi.org/10.3390/atmos12111399