Abstract
In this work, we verified the formation of the South Atlantic Convergence Zone (SACZ) during the active, unfavorable, and transition phases of the Madden–Julian Oscillation (MJO), as well as the diurnal spatial variability in the estimated Outgoing Longwave Radiation (OLR) data. The real-time multivariate index (RMM) and the composites of meteorological variables were used, along with the temporal average of the estimated OLR data. All the different patterns for the average period of SACZ showed classic behavior: well-organized and with meteorological variables in phases throughout the troposphere. However, some differences were evident in the organization of each phase of the MJO: at 200 hPa, the Bolivian High (BH) was more flattened during the active phase pattern than in the unfavorable and transition phases, being wider and with a wavier trough embedded in the western flow; at medium levels, the subtropical highs appeared more defined and with a very wide trough; the trough supported the frontal systems on the surface and, together with the subtropical highs, concentrated all the moisture in this layer. In the OLR dataset, the formation of the Coast Squall Line (CSL) occurred during SACZ events in the active phase and MJO transition, whereas in the unfavorable phase, this system was not observed.
1. Introduction
During austral summer, some atmospheric features are striking, such as anticyclonic circulation at high atmospheric levels in South America (SA), known as the Bolivian High (BH), accompanied by a trough in the vicinity of the northeast region of Brazil (TNB), sometimes with an associated cyclonic vortex. At low atmospheric levels, the South Atlantic Convergence Zone (SACZ) appears as a dominant feature of the South American Monsoon System (SAMS) [1,2,3,4] in the austral summer and is responsible for heavy rains over the South American continent. The development of the SAMS begins during the spring with convective centers moving from Northwestern Amazonia to Southeastern Brazil in mid-October [5,6].
BH has been discussed in many studies [1,7,8] as a warm-center anticyclone formed the combination of latent heat release by convective activity in Amazonia and radiative warming from the Bolivian altiplano. The TNB, with the associated cyclonic vortex, has a center of pressure cooler than its periphery and mass convergence in the western sector at low levels [9]. The SACZ is configured by a convergence band oriented in the northwest–southeast direction, which is aided by synoptic systems of midlatitudes, providing high precipitation rates over the midwest and southeast regions of Brazil and extending from southern Amazonia to the adjacent Atlantic Ocean (AO) [10,11,12,13,14,15]. As an atmospheric system that occurs mainly in the austral summer, the SACZ is also influenced by different scales of climatic variability during its formation process, either in its position or in its intensity [16,17]. One of these scales is intraseasonal, which is mainly determined by the Madden–Julian Oscillation (MJO). The MJO can significantly affect global weather and climate systems [18] because it is a wave moving eastward along the equatorial belt, with convective anomalies starting in the Indian Ocean a varied time period between 30 and 60 days [9,19,20]. One way in which the MJO affects the global weather and climate systems is through teleconnections [21], caused by the diabatic warming of the MJO, which can induce Rossby wave trains that propagate from the tropics to the extratropics, forming global teleconnections in both hemispheres ([19,21]
Over SA, these effects can also be observed in southeast SA (SESA) [5,17,22,23,24,25] and adjacent to the AO by subtropical convection anomalies in the southern central Pacific associated with the South Pacific Convergence Zone (SPCZ) [5,12,26,27,28], Amazon Basin [29], and Northeast Brazil [23,30,31]. In addition to these effects on the intraseasonal scale, there is interannual variability due to the El Niño–South Oscillation (ENSO) phases: the positive phase of the ENSO contributes to the persistence of more than three days of SACZ over the oceanic part; La Niña and neutral events tend to occur over the continent [17].
The effects of climate variability can affect the SACZ and the diurnal tropical convection cycle, which is the dominant mode of convective activity [32]. The effects include rainfall in the morning (ocean) or evening (land) depending on the surface characteristics (continent and ocean) due to the different heat capacities of the two surfaces and related local land–sea circulations [33]. Coastal regions over the tropics have different characteristics in terms of convective activity, as long bands of heavy rain can form along the coast, showing variability in rainfall [34]. Outgoing longwave radiation (OLR) data have been used as proxies for convective cloud activity, with low (high) values indicating enhanced (suppressed) convection [35]. However, due to the large territorial extension with considerable convective activity, the tropical region needs data to help with understanding the variability in and behavior of convective systems that cause precipitation over the continent, especially in the SACZ regions. In this sense, datasets for estimating OLR and precipitation satellites are essential to filling this gap. Furthermore, the structure of mesoscale convective systems (MCSs), especially those formed on the coastal regions and their interaction with intraseasonal variability and/or monsoons during SACZ, has not been analyzed in previous studies. As such, these studies are essential to determining the formation of these convective systems using the high temporal frequency of the integrated OLR and precipitation dataset.
Although the main spatial meteorological characteristics of the SACZ operating in South America during the austral summer are extensively documented in the literature, objective descriptions of the dynamic evolution of its convective activity aligned with the MJO phases and the diurnal cycle with high temporal resolution satellite data are lacking. Furthermore, in the favorable phase of the MJO, a convective increase occurs over SA during SACZ episodes, but we do not know what happens in the unfavorable phase of the MJO or the main dynamic characteristics of these different processes.
The main objective of this study was to verify the behavior of meteorological variables before, during, and after SACZ events that occur in the active, unfavorable, and transition phases of the MJO in SA, along with the spatial variability in OLR resulting from these events and phases. The remainder of this paper is organized as follows: In Section 2, we describe the datasets and methodology. The dynamics of circulation related to SACZ in the different phases of the MJO and the diurnal cycle of the OLR are outlined in Section 3 and Section 4 presents the discussion and conclusions.
2. Materials and Methods
2.1. Area
The area chosen for this research comprises the mean position of the SACZ, which extends from the Amazon Basin to the southeast region of Brazil (Figure 1). According to Carvalho et al. [17] and Quadro et al. [36], the area can be divided into three subregions on the basis of the maximum convective activity (OLR < 200 ) and maximum (Amazon) and minimum (coast and ocean) subseasonal variability: Continental Amazon SACZ (CAS), Continental Coastal SACZ (CCS), and Oceanic SACZ (OCS). However, for comparison with other works and for the sake of simplicity, we use the denominations of continental SACZ (Amazonian and Coastal) and Oceanic (Figure 1). For the Continental and Oceanic SACZ regions, some studies [17,24] identified different intraseasonal signal interactions; for example, in the oceanic and continental (Coastal) SACZ, the Pacific South American (PSA) wave train pattern was observed, which favored the seesaw mode of convection enhancement/suppression in eastern tropical/subtropical SA, whereas in continental Amazon, the mode was consistent with the evolution of the MJO.
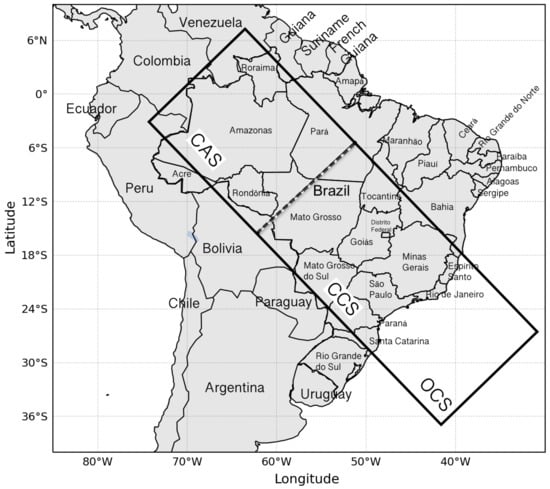
Figure 1.
Description of the study area of the average position of the SACZ over SA and its subregions named: Continental SACZ (Amazonian and Coastal) and Ocean SACZ (OCS). In this map, the dotted lines indicate the division of the SACZ Continental region.
2.2. Datasets
The datasets were analyzed for the period from 1999 to 2018 for the events presented in Table 1. We used a reanalysis of the European Center for Medium-Range Weather Forecasts (ECMWF), Version 5 (ERA5), with a significantly enhanced horizontal resolution of 31 km, compared to 80 km for ERA-Interim, and an hourly output throughout [37], whose results were analyzed from 21 UTC. This time was chosen because it was verified in the OLR data, from the Satellite and Environmental Systems Division from the Center for Weather Forecasting and Climatic Studies belonging to the National Institute for Space Research (DSA/CPTEC/INPE, in Portuguese) database, that the greatest convective activity occurred during this period. The variables used to assess the large-scale circulation and dynamic processes were the zonal (u) and meridional (v) components of the wind, geopotential height, omega (w), horizontal wind divergence, and specific humidity for the low (850 hPa), medium (500 hPa), and high (250 hPa) levels of the troposphere.
For rainfall estimates, we used the satellite-based Global Precipitation Measurement (GPM)-Integrated Multi-satellite Retrievals for GPM (IMERG), Version 6, whose spatial resolution is 0.1 degrees [38,39,40]. The GPM-IMERG data used in this study (Rozante et al. [41]), hereafter referred to as MERGE, use the interpolation technique for the precipitation variable over SA that combines data from surface observations: more than 2500 data than the first version and without the bias of satellite precipitation estimates on a daily time scale. Previously, MERGE combined estimation data from the Tropical Rainfall Measuring Mission (TRMM) satellite, but due to intermittent data, it was replaced by GPM-IMERG.
NOAA’s OLR data can correctly indicate convective activities with sufficient spatial resolution around the globe, but they cannot capture the processes of convection evolution or the decay processes of convection embedded in diurnal variability due to their low temporal frequency in the equatorial tropics. Thus, OLR data from the DSA of very high temporal resolution (3 h) were used to verify the diurnal space cycle in the SA and, consequently, the SACZ events in the different phases of the MJO. The estimated OLR data are based on the works of Ceballos et al. [42], which show consistency with the National Center for Environmental Prediction’s (NCEP) data, having high-quality and mainly covering extensive areas of SA every 3 h.
2.3. SACZ Events
SACZ is one of the important meteorological phenomena acting during SAMS, which is defined as a northwest–southeast band of cloudiness over SA [43], characterized by continuous rain with a typical duration of 4 days that impacts regions during its action. Its range presents spatial-temporal variability shaped by local or remote factors. In the context of the intraseasonal time scale, the onset, duration, and location of SACZ events are modulated. In other words, a convection anomaly in the SPCZ associated with one of the MJO phases can trigger convection over the SACZ, intensifying high-level troughs over the southeast of SA [13].
SACZ events were identified by two means: the first was to use the monthly Climanalysis bulletin (http://climanalise.cptec.inpe.br/~rclimanl/boletim/, accessed on 10 October 2021) published by CPTEC/INPE. These online reports only correspond to the years 1996–2014; therefore, it was necessary to update the events until 2018 using another technical report also provided by the same center. The second mode of recognition was through the study presented by Rosa et al. [44], who proposed an objective, simplified, and automatic method to detect SACZ episodes based on satellites measuring OLR and confirming the related cases and adding the newly found cases, resulting in 17 (Table 1), which coincided in the austral summer.

Table 1.
Identification of the 17 SACZ events with their respective MJO phase and each source of recognition.
Table 1.
Identification of the 17 SACZ events with their respective MJO phase and each source of recognition.
| Days (SACZ) | Month/Year | Duration (days) | MJO Phase | Source of Identification |
|---|---|---|---|---|
| 14–18 | January/1999 | 5 | active | Herdies et al. [45] |
| 24–28 | February/1999 | 5 | active | Herdies et al. [45] |
| 01–08 | December/2000 | 8 | unfavorable | CPTEC/INPE |
| 13–19 | January/2003 | 7 | active | Rosa et al. [44] |
| 11–16 | December/2005 | 6 | unfavorable | Rosa et al. [44] |
| 22–02 | Jan./Feb/2006 | 9 | transition | Rosa et al. [44] |
| 12–17 | February/2007 | 5 | transition | CPTEC/INPE |
| 11–21 | December/2008 | 11 | unfavorable | Rosa et al. [44] |
| 20–24 | January/2009 | 5 | active | Quadro et al. [36] |
| 09–16 | February/2011 | 8 | unfavorable | CPTEC/INPE |
| 11–16 | January/2011 | 6 | unfavorable | CPTEC/INPE |
| 13–18 | January/2012 | 6 | unfavorable | Rosa et al. [44] |
| 22–25 | January/2015 | 4 | active | CPTEC/INPE |
| 28–02 | Feb./Mar./2016 | 4 | active | Rosa et al. [44] |
| 16–19 | January/2017 | 4 | transition | CPTEC/INPE |
| 11–15 | December/2017 | 4 | transition | CPTEC/INPE |
| 22–26 | February/2018 | 5 | active | CPTEC/INPE |
Most of the events in 1999 to 2018 represent the classical formation of the SACZ found in the literature, such as in Herdies et al. [45] and Quadro et al. [36]. SACZ events were organized from the MJO influence phase and in similar quantities. Of the total events, most occurred during the active phases (7), followed by unfavorable (6) and transition phases (4).
2.4. Methodology
To relate the SACZ events to the phases of the Madden–Julian Oscillation (MJO), the real-time multivariate index (RMM) defined by Wheeler and Hendon [46] and information available from the Bureau of Meteorological Research Center (BMRC) were used. According to several studies [17,47,48,49], the indexes that contribute to convective activity in SA are phases 1, 2, 7, and 8; therefore, in this study, they are referred as “the active phase of the MJO”. Similarly, the unfavorable phases are the “unfavorable phase of the MJO” (0 and from 3 to 6) and the “transition phase MJO”, indicating when SACZ occurs between the unfavorable phase and the active phase of the MJO. Thus, it was possible to verify the influence of MJO on the development of the SACZ, even in the unfavorable phases, for the occurrence of convection in summer in SA.
To verify the dynamic behavior of meteorological variables in relation to the different phases of the MJO and thus highlight the main characteristics, several composites were constructed: three days before (−3D), during (the average period of days for each SACZ event (0D) (Table 1)), and two days later (+2D) for the occurrence of the convergence zone. For example, in the SACZ event that occurred between 11 December and 21 December 2008, day 0D is the average of this 11 day period, while days −3D and +2D refer to days 8 and 23 December 2008, respectively.
3. Results
The main characteristics of the upper, medium, and lower levels of the tropospheric circulation over tropical SA during the active, unfavorable, and transition phases of MJO are described in this section.
3.1. Dynamic Circulation of the Meteorological Variables before, during, and after the SACZ
3.1.1. Composites of the Active Phase of MJO
- Upper level (250 hPa)The composites of the days prior (Figure 2a) to the formation of the SACZ shows the predominant presence of BH between 10 and 20 S and a TNB with the associated vortex over the AO—standard circulation found in the southern hemisphere during the summer [50]. The regions with positive horizontal divergence values were located over the northern and northeastern parts of Brazil, where there were flow difluence areas. During the SACZ days (0D, Figure 2b), the BH lengthened zonally, and the TNB shifted north from its previous position. Areas of positive horizontal divergence reduced in intensity (). It is clearly shown that these areas of divergence represent the low-level convergence band, oriented in the northwest–southeast direction, which is classic of the SACZ. In Figure 2c, after the SACZ event (+2D), the center of the BH moves to the west, and the alignment of the wind divergence band becomes disfigured, indicating SACZ mischaracterization. Therefore, we observed that the BH/TNB systems and the midlatitude trough influence the spatial variability in the SACZ, providing dynamic support for the configuration. Furthermore, ascending vertical movement can be observed at medium levels (Figure 2e) along the difluence region at high levels. This corroborates the convergence at low levels along the moisture transport band from the Amazon region and from the region between the subtropical highs.
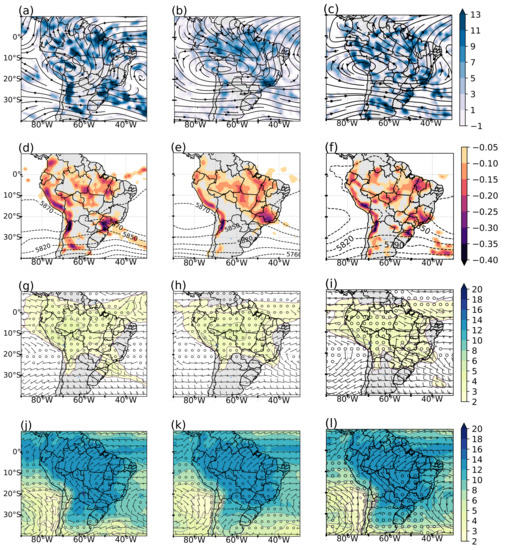 Figure 2. Composites of the streamlines and horizontal divergence of wind () at 250 hPa (a–c), geopotential height and omega () at 500 hPa (d–f), specific humidity () and winds at 500 hPa (g–i), and at 850 hPa (j–l) for −3D (left), 0D (center), and +2D (right) panels of the SACZ events during the active phase of the MJO.
 - Medium level (500 hPa)In Figure 2d (−3D), the negative values of omega occur over almost all of SA, mainly over the north, central-west, and southeast regions of Brazil. The geopotential height shows a slight trough with the axis positioned at 45 W, and the South Atlantic Ocean (SASH) and South Pacific Ocean (SPSH) subtropical highs are misconfigured. In the field of specific moisture (Figure 2g), the values range from 3 to 4 , the most significant of which are found in the western part of the Amazon (4 to 6 ). During the occurrence of the SACZ (0D), the negative values of vertical velocity became evenly distributed over the SACZ region (Figure 2e), and in the field of geopotential height, the trough widened and the subtropical highs organized, forming a well-established system. The same feature can also be observed in the wind field and specific moisture (Figure 2h), with moisture transport coming from the northwest side of the SASH at the ocean–continent interface and driving moisture convergence over the continent in the SACZ region. Another important aspect is the displacement of the significant specific humidity core to parts of the Brazilian states of Amazonas, Mato Grosso, and Rondônia. The structured and continuous band of negative omega values disappeared over the continent (Figure 2f), leaving only scattered nuclei. Showing behavior similar to the geopotential height are specific humidity and winds (Figure 2i), indicating the distortion of the convergence band at low levels.
- Lower level (850 hPa)At low levels, the organization of the SACZ cloudiness band depended on the wind and humidity flow for −3D (Figure 2j); we observed the trade winds entering the continent and changing direction to the southern part of the continent upon encountering the Andes Mountains, which is known as the low level jet (LLJ). However, at 20 S, the LLJ divided into two branches: one toward the north of Argentina and the other toward the southeast region of Brazil. The specific moisture ranged from 10 to 14 across the continent, while over the adjacent AO, it reduces to between 8 and 12 . This variable does not show an abrupt change in the different phases of setting up SACZ episodes. The main change in this atmospheric level occurs in the wind direction, as shown in Figure 2k (0D). The LLJ bifurcation that occurred on the previous day is not verified in this figure, as there is only one predominant wind direction, helping to organize the moisture channel over the SACZ region. This represents one of the main characteristics of the formation of the SACZ, corroborating the findings of many other works [17,45,51]. In the composites of +2D (Figure 2l), the wind flow over the state of Rondônia was in a north–south direction, which distinguishes the LLJ on the slopes of the Andes Mountains but with a branch still directed toward the SACZ region.
- OLR and PrecipitationThe OLR field (Figure 3a) for −3D shows intense values below 210 north of 20 S with an extension to the southern and southeastern part of the country, as well as on the ITCZ. The precipitation variable spatially agrees with the OLR fields (Figure 3d). The composites of 0D (Figure 3b) shows a structured OLR behavior, with a wider range of convective activity in the northwest–southeast direction, indicative of the SACZ cloudiness band. The same behavior can be observed for more intense values of OLR (<200 ) from the west of the states of Amazonas to Goiás. Precipitation cores (Figure 3e) above 30 can be observed in the southwest of the AO and in the coast of the state of Amapá over the ITCZ region. After the SACZ event (+2D), an OLR band remains from the north to the southeast but with values above 210 (Figure 3d), whereas for precipitation (Figure 3f), the intense values localize over the coast of the southern region of Brazil, characteristic of the passage of a frontal system with intense convective activity.
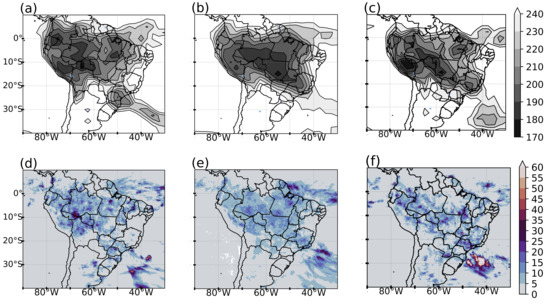 Figure 3. Composites of the OLR () (a–c) and precipitation () (d–f) for −3D (left), 0D (center), and +2D (right) panels of the SACZ events during the active phase of the MJO.
3.1.2. Composite of the Unfavorable Phase of the MJO
- Upper level (250 hPa)The pattern of the behavior of meteorological variables at the upper levels does not differ much from the composites of the active phase of the MJO. The main distinct characteristics are found in the configuration of the BH on 0D (Figure 4b), which is broader and more symmetrical. In addition to a pronounced mid-latitude trough that extends to the north of the state of São Paulo, the positive regions of horizontal divergence confirm the SACZ over the continent with a discontinuity over the ITCZ. On +2D (Figure 4c), the emphasis is on the presence of the trough but without the associated vortex.
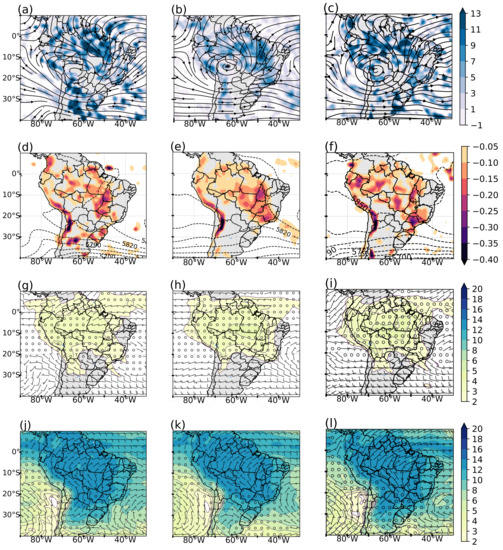 Figure 4. Composites of the streamlines and horizontal divergence of wind () at 250 hPa (a–c), geopotential height and omega () at 500 hPa (d–f), specific humidity () and winds at 500 hPa (g–i) and at 850 hPa (j–l) for −3D (left), 0D (center), and +2D (right) panels of the SACZ events during the unfavorable phase of the MJO.
 - Medium level (500 hPa)The day before SACZ formation, subtropical highs were poorly configured (Figure 4d) and intense negative omega values were found in the interior of the continent and in the Andes Mountains. However, on 0D (Figure 4e), this variable was more organized and agrees with the regions of divergence at the upper levels. Likewise, specific moisture values did not vary much; only the spatial behavior with values above 2 (Figure 4h) remained on the continent, differing from the active phase of the MJO. This organized characteristic of moisture in the middle of the troposphere emphasizes the continental SACZ and denotes the intense role of moisture convergence at low levels. Furthermore, this result agrees with those of Carvalho et al. [17], who found cold phase years of the ENSO can contribute to the occurrence of continental SACZ. All events in this study occurred in La Niña years, indicating a possible influence of interannual variability on this spatial behavior. In composites 0D (Figure 4e), a wide trough with an axis at 50 W reaches the southern region of the country, possibly related to a cold front that propagates to the southeast region of the country, helping to organize the SACZ moisture channel. For the +2D composites (Figure 4f), the trough reduces in amplitude and reaches the north of the state of Rio Grande do Sul, while the subtropical highs penetrate more into the continent.
- Lower level (850 hPa)During an unfavorable phase of the MJO, in the −3D composites (Figure 4j), an intense and well-configured LLJ can be observed, with a bifurcation occurring at 10 S, with the specific moisture over the continent ranging from 10 to 14 . In the composites of days with SACZ (Figure 4k), the organization of the LLJ is directed to the southeast region, as well as the northern part of the SASH. This wind and humidity contribute to forming the convergence band and aligning it in the northwest–southeast direction. Figure 4l (+2D) shows that the flow is maintained toward southeastern Brazil and another toward northern Argentina, which limits the direction of moisture to only the SACZ region, in addition the supporting the northern branch of the winds, as it shifts its core further east, suggesting the weakening of the convergence zone.
- OLR and PrecipitationThe OLR composites for day −3D (Figure 5a) show more intense nuclei west of the Amazon, with values around 190 . It can be observed in this field that the highest values (210–220 ) expand over the continent, which resembles the organization of the SACZ, which is characteristically also accompanied by the precipitation field (Figure 5d). For events in 0D (Figure 5b), the convergence band from the western part of the continent to the adjacent AO is verified. In this composites, the lowest OLR values are found over the continent, and the intense center, previously located in western Amazonian, is now elongated zonally up to the state of Tocantins, in agreement with the precipitation field (Figure 5e), whose daily average is 30 . Figure 5c in +2D, the expressive OLR values recede to the western Amazon region, and the convergence band in the northwest–southeast direction disappears. Precipitation presents point centers with more intense rates in the ITCZ region (Figure 5f) and over the Amazon–Bolivia border.
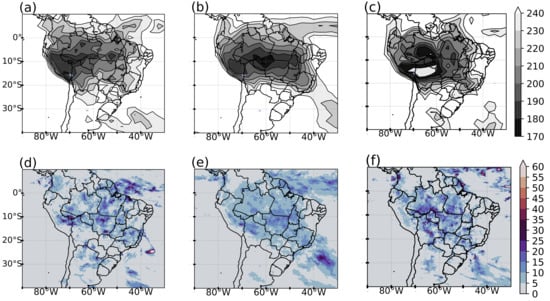 Figure 5. Composites of the OLR () (a–c) and precipitation () (d–f) for the −3D (left), 0D (center), and +2D (right) panels of the SACZ events during the unfavorable phase of the MJO.
3.1.3. Composite of Transition (Unfavorable–Active) Phase of the MJO
- Upper level (250 hPa)Figure 6a (−3D) shows the southernmost center of the BH at 18 S, 65 W, and the TNB leaning over the continent, different from the patterns described above. Positive divergence values are significant ( s), especially in the northern region. At 42 W, a trough is formed in the western flow over the AO. In the composites of SACZ events at 0D (Figure 6b), the BH intensifies and becomes more symmetrical, consequently reinforcing the trough at mid-latitudes. Positive divergence values persist, mainly in the areas of difluence between the two systems (BH and TNB) and in front of the trough axis around 50 W. This provides a long zone of oriented convergence of the north to southeast of Brazil. On +2D (Figure 6c), BH expands to the south, and extensive areas of intense positive values of horizontal divergence spread across the continent and ocean, disorganizing the SACZ.
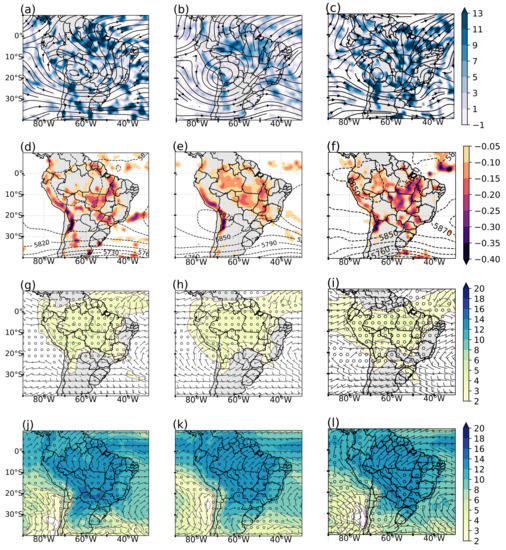 Figure 6. Composites of the streamlines and horizontal divergence of wind () at 250 hPa (a–c), geopotential height and omega () at 500 hPa (d–f), specific humidity () and winds at 500 hPa (g–i) and at 850 hPa (j–l) for the −3D (left), 0D (center), and +2D (right) panels of the SACZ events during the transition phase of the MJO.
 - Medium level (500 hPa)Figure 6d,g for −3D day shows that the subtropical highs are not configured, but a broad trough occurs in the southeast and south regions of Brazil. The specific humidity has significant values at this level, which suggests support of a convergence band. Conversely, negative values of the vertical velocity are distributed over a part of Brazil and continuously over the Andes mountain range from the coast of Colombia to the north of Argentina. The composites for the SACZ days (Figure 6e) show the well-configured subtropical highs, with the SPSH located in the inland of the continent. Between these two systems, the trough reaches the north of the state of São Paulo, and the omega indicates negative values organized over the continent if compared to −3D (Figure 6d). The presence of subtropical highs is evident as a broad band of specific moisture that narrows toward the southeast of the country, possibly due to the stretching of the trough. For +2D, Figure 6f,i show that the subtropical highs are positioned further away from the continent, along with the trough, which reduces in amplitude; the vertical velocity intensifies with an area in agreement with the horizontal divergence region.
- Lower level (850 hPa)The behavior of the wind the day before the SACZ in Figure 6j shows the direction of the wind from north to south over the states of Amazonas and Pará. An LLJ is observed along the east side of the Andes, but with a branch to the east at 18 S. Figure 6k shows a clear change in the direction in the wind in the northwestern part of the Amazon region. At that point, it changes from north to east, directing moisture to the SACZ region. Contrary to this behavior, the return of flow in the northern direction of Argentina is observed only in Figure 6l, contributing to the transport of moisture in that region, which characterizes the weakening of the convergence zone in the typical region. The specific humidity does not show wide variations in the values in the different stages of the SACZ.
- OLR and PrecipitationThe pattern for the MJO transition phase in −3D (Figure 7a) shows a band of cloudiness in the northwest–southeast direction but with a small discontinuity over the AO. Minimum OLR values of 190 were found over north and central-west Brazil, whose fields are aligned with the precipitation distribution (Figure 7d). Figure 8b shows a more spatially homogeneous OLR field, characterizing a more southern SACZ with less intense nuclei than the previous patterns. The intense precipitation values (Figure 7e) agree with the OLR fields with centers over the western Amazon region. Composites of the day after SACZ (Figure 7c) also differ from the patterns of the active and unfavorable phases of the MJO; the two patterns indicate the occurrence of the SACZ in the northwest–southeast direction. In this case, this is not observed: there is only one sudden shift southwards. This can be explained by the arrival and formation of a frontal system that is positioned to the south of Uruguay, whose expressive values are observed in the rain field (Figure 7f), in addition to a discontinuous band over the oceanic SACZ.
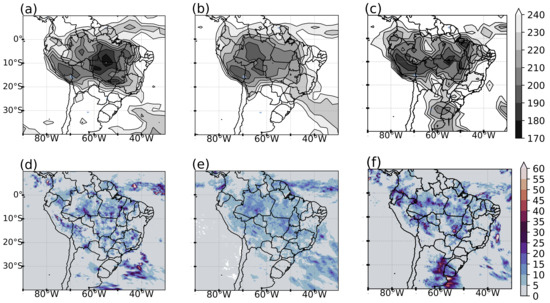 Figure 7. Main characteristics of the OLR () (a–c) and precipitation () (d–f) for the −3D (left), 0D (center), and +2D (right) panels of the SACZ events during the transition phase of the MJO.
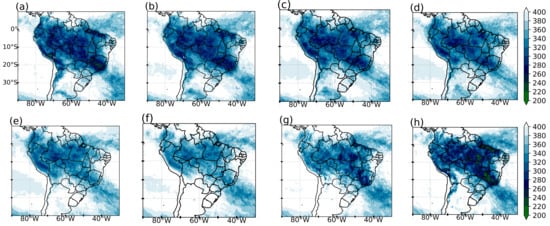 Figure 8. Composites of the diurnal spatial cycle of the OLR to (a) 00 UTC, (b) 03 UTC, (c) 06 UTC, (d) 09 UTC, (e) 12 UTC, (f) 15 UTC, (g) 18UTC, and (h) 21UTC of the SACZ events during the active phase of the MJO.
3.2. Diurnal Cycle of the OLR
From the high temporal resolution data (every 3 h) from the Division of Satellites and Environmental Systems (DSA/CPTEC/INPE), we analyzed the diurnal behavior of the cloudiness band of the SACZ compounds in the different phases of the MJO. The purpose of this assessment was to verify which time leads to intense convective activity and to identify which weather systems produce the highest volumes of precipitation. Furthermore, we aimed to demonstrate the spatial and preferential displacement of these events, which are evident in satellite images [5,26,50].
In general, the characterization of the diurnal OLR cycle for SACZ events occurring in the favorable phase of the MJO (Figure 8a–h) shows the convective band oriented in the northwest–southeast direction, with values ranging from 310 to 220 . The lowest values (<230 ) occur in the southeast region, the coast of the north/northeast region, and the south of the state of Pará and Peru. Regarding temporal evolution, values covering most of the territory at 21 UTC are observed, while the lowest convective activity occurs at 15 UTC. This is in line with the expected features off the austral summer. During the day, due to daytime heating, the surface heats up and begins to transport moisture and heat to the atmosphere through latent and sensible heat fluxes. These thermodynamic forcings, together with their dynamics, can favor the formation of cloud growth, development, and maintenance [52] and thus help create the appropriate conditions to generate convective systems.
In this sense, another feature verified in the diurnal cycle is the expressive values in the form of a homogeneous convective band over the coast of the states of Amapá, Pará, and Maranhão, suggesting a mesoscale system known as Amazon coastal squall lines (SLs) [53,54]. According to Kousky [55], these SLs are continuous convective cells originating from the sea breeze circulation, which can travel over the continent more than 400 km [53]. In Figure 8, the system formation that initiated at 18 UTC ( 15 Local Time (LT); Figure 8g) intensifies at 21 UTC (Figure 8h; 18 LT) and disappears at 06UTC ( 03 LT; Figure 8b), with a total lifetime of 9 h. This life cycle agrees with the results observed by Garsgant et al. [54]: first, convective cells start in the afternoon, then are exacerbated in the early evening, and dissipate later. Furthermore, for this case, the type of SL is identified as a convection coastline (CSL), whose displacement to the interior of the continent does not advance more than 170 km [53]. Moreover, we observed that an ITCZ is found over the continent and with a wide extension over the equatorial AO.
In the case of SACZ events occurring during the unfavorable phases of the MJO (Figure 9a–h), we observed that the diurnal cycle of the OLR identifies the cloudiness of the convergence zone from the Amazon, passing through the southeast and reaching the AO. Intense and notable values (<220 ) occur on the border between the midwest and northeast regions of Brazil, south of the state of Rondônia, Colombia, and the coast of Peru. The evolution of convection starts at 18 UTC, intensifies at 21 UTC, and weakens at 9 UTC, but it is still possible to observe the persistence of a convective center with expressive values south of the state of Rondônia at 6 UTC. This feature was not observed for the diurnal cycle of the OLR during SACZ events in the active phase of the MJO. In addition, the ITCZ convergence band narrows, and the formation of SLs was not observed.
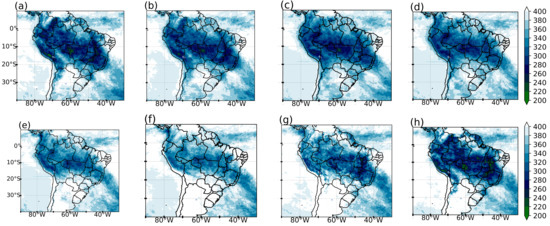
Figure 9.
Composites of the diurnal spatial cycle of the OLR to (a) 00 UTC, (b) 03 UTC, (c) 06 UTC, (d) 09 UTC, (e) 12 UTC, (f) 15 UTC, (g) 18UTC, and (h) 21UTC of the SACZ events during the unfavorable phase of the MJO.
Figure 10a–h, depicting the diurnal cycle of the OLR for the MJO transition phase, also identifies the convective band over the continent, oriented in the northwest–southeast direction. The intensity of the low OLR values appears at 18 UTC over the states of Goiás and Tocantins, peaks at 21 UTC, and reduces to 15 UTC, thus following the behavior observed in the two previous cases. In addition, the formation of the mesoscale system can be observed on the coast of the states of Pará and Maranhão at 18 UTC, intensifying at 21 UTC and dissipating at 3 UTC. The discontinuity of ITCZ activity over the equatorial Atlantic is observed at this phase; this characteristic was not observed for the two previous phases, thus suggesting a weaker convergence zone, as verified in the OLR values.
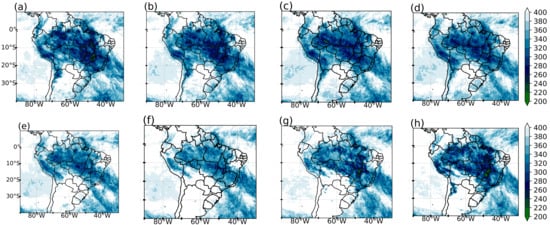
Figure 10.
Composites of the diurnal spatial cycle of the OLR to (a) 00 UTC, (b) 03 UTC, (c) 06 UTC, (d) 09 UTC, (e) 12 UTC, (f) 15 UTC, (g) 18UTC, and (h) 21UTC of the SACZ events during the transition phase of the MJO.
4. Discussion and Conclusions
In general, we observed some particularities in the formation of the SACZ in the three tropospheric levels during the different phases of the MJO. In the different patterns for 0D, SACZ presented the classic behavior described in several studies [10,11,56,57]: well-organized and with the meteorological variables in phases throughout the troposphere. However, some differences were evident in the organization of each phase of the MJO, favoring the permanence of the SACZ. Although we have guaranteed equal amounts of events for each phase, the number of these was small, which makes the discussion of results limited but still contribute knowledge to the general aspects.
At 200 hPa, the BH was in a flattened form during the active phase pattern compared to in the unfavorable and transition phases; however, at these latter MJO phases, the trough embedded in the west flow was more pronounced. At medium levels, the subtropical highs appeared more defined and with a broad trough that extended north of the state of Paraná. This differs from the unfavorable phase, in which the subtropical highs (over both Pacific and Atlantic oceans) were ill-defined with an elongated depression in the south of the state of Paraná. This channel of humidity to the east of the Andes Mountains supported the frontal systems on the surface and, together with the subtropical highs, concentrated all the moisture in this layer. Furthermore, the organized characteristic of moisture extending even into the middle troposphere emphasized the continental and oceanic SACZ, denoting the intense role of moisture convergence at low levels. In this aspect, it was only possible to observe in the unfavorable phase of the MJO at average levels values above 2 over the continent, characterizing the continental SACZ. One might hypothesize that the behavior was influenced by another variability (interannual, interdecadal) since all the events that occurred in this phase were in the La Niña year. For this reason, we suggest further studies to confirm this hypothesis and complement this result with the use of more events and tests with numerical models.
In the lower troposphere, the main difference between the active and unfavorable patterns was found in the wind flow, with the moisture channel being more intense in the latter. Highlights for the MJO transition pattern were only verified in the geopotential height and the wind flow fields at 500 and 850 hPa, respectively. The first level showed a trough that extended to the state of São Paulo along with the interior of the continent, whereas in the second, the winds that favor the humidity channel did not seem as evident as in the other two modes.
In the fields of OLR and precipitation, in the compounds of the active phase of the MJO in 0D, we observed spatial and intensity variability in the SACZ in a well-distributed way in its climatological position, in addition to significant values above 35 in the oceanic part. In the unfavorable phase, the main highlights were significant values below 200 over the continent, with zonal nuclei on the border of the states of Amazonas, Pará, and Mato Grosso. In the active phase, this intense OLR center is presented in the direction of the SACZ, that is, northwest–southeast. These fields agree with precipitation values but with daily values reaching up to 25 . For the pattern of the transition phase, less intense centers westward over the continent and positioned to the west of the Amazon were observed, with values above 210 , whereas for the precipitation field, the rates are similar to those of the other composites.
To show the characteristics of the atmospheric fields that can form the SACZ with the different impacts related to the MJO, we found, as expected, different behaviors in the composites in the previous days (−3D). At 250 hPa, we observed the presence of an upper-level cyclonic vortex only in the active phase pattern; at medium levels, we found an organized presence of subtropical highs. At low levels, the preponderant evidence occurred during the LLJ bifurcation. In the active phase of the MJO, the east branch of the same (westerly wind) occurred at 20 S, in agreement with the findings of Ninomiya [56]. However, during the unfavorable and transition phases, this change coincided further north at 10 S and with a more intense flow to the convergence band region. These perceptible characteristics in the behavior of the LLJ indicate a supply of more moisture to the SACZ and a possible persistence for more than 4 days. Furthermore, the entrance of the frontal systems is also important for creating this persistence and direction of the LLJ to the convergence zone, but the differences are created by the combination of SACZ events and the different phases of the MJO, although the MJO is not the only factor causing this variability.
After the SACZ event (+2D), the composites indicated a disorganization of the horizontal and omega divergence fields, influencing the weakening of the moisture channel in the northwest–southeast direction. In addition, LLJ support directed toward northern Argentina and southern Paraguay, which clearly denotes the absence of flow directed to the convergence zone. This pattern was also verified in the OLR and precipitation fields. An observation verified at all levels and in the MJO phases was the intense values of the meteorological variables over the Andes Mountains, probably associated with the Gibbs effect [58], which is related to the representation of the topography in the spectral model.
The spatial diurnal cycle of the estimated OLR data [42] presented values above those found in the NOAA data [59] but coherent in the resolution, which can be used for studying the temporal evolution of convective processes in the South American continent. The beginning of intense convective activity started at 18 UTC, intensified at 21 UTC, and dissipated at 15 UTC. The formation of SLs occurred during the SACZ events in the active phase and during the MJO transition, with its characteristic orientation (northwest–southeast) parallel to the coast and with a life cycle of 9 h; in the unfavorable phase, this system was not verified. Notably, SLs in the Amazon are complex systems with interactions on different scales from large-scale to cloud-scale [53]. From this, associating the appearance of SLs to the different phases of the MJO, we tried to justify, through the meteorological characteristics selected in the previous section, what differed in the low and high atmospheric levels that would corroborate the formation of SLs in the Amazon. Therefore, we verified that the composites for 0D of the horizontal divergence of the wind was positive (convection at low levels) and parallel to the north coast of Brazil, as well as higher specific moisture values (14 ) over the continent than the ocean. This possibly favored (disfavored) the emergence of SLs in the active (unfavorable) and transition phases of the MJO. Regarding the ITCZ configuration, we identified a wider convective zone during the active phase, denoting an interaction with the SACZ convection, which reinforces the results of De Souza and Ambrizzi [23], but it narrowed in the unfavorable phase and was discontinuous during the transition phase.
Author Contributions
Conceptualization, L.P.V. and D.L.H.; methodology, L.P.V.; software, L.P.V. and J.A.A.M.; validation, L.P.V., J.A.A.M. and D.L.H.; formal analysis, L.P.V.; investigation, L.P.V.; resources, L.P.V.; data curation, L.P.V. and D.L.H.; writing—original draft preparation, L.P.V., D.L.H. and J.A.A.M.; writing—review and editing, L.P.V.; visualization, L.P.V., D.L.H. and J.A.A.M.; supervision, D.L.H.; project administration, L.P.V. All authors have read and agreed to the published version of the manuscript.
Funding
This research was funded in part by the Conselho Nacional de Desenvolvimento Científico e Tecnológico (CNPq), grant number 142113/2018-2; and Coordenação de Aperfeiçoamento de Pessoal de Nível Superior (CAPES), Finance Code 001.
Institutional Review Board Statement
Not applicable.
Informed Consent Statement
Not applicable.
Data Availability Statement
Not applicable.
Acknowledgments
We thank the anonymous reviewers for their suggestions and comments for the improvement of the manuscript. The research was supported by CAPES and CNPq. This work constitutes part of L. Viana’s Ph.D. dissertation at the National Institute for Spacial Research (INPE). The authors express sincere thanks to Rogerio Batista for the OLR DSA dataset.
Conflicts of Interest
The authors declare no conflict of interest.
Abbreviations
The following abbreviations are used in this manuscript:
| AO | Atlantic Ocean |
| BH | Bolivian High |
| CAS | Continental Amazonian SACZ |
| CCS | Continental Coastal SACZ |
| CSL | Coast Squall Line |
| CPTEC | Center for Weather Forecasting and Climate Studies |
| DSA | Satellite and Environmental Systems Division |
| ECMWF | European Center for Medium-Range Weather Forecasts |
| ENSO | El Niño-South Oscillation |
| GPM | Global Precipitation Measurement |
| IMERGE | Integrated MultiSatellite Retrievals for GPM |
| INPE | National Institute for Space Research |
| ITCZ | Intertropical Convergence Zone |
| LLJ | Low Level Jet |
| MCS | Mesoscale Convective System |
| MJO | Madden–Julian Oscillation |
| NOAA | National Oceanic and Atmospheric Administration |
| OCS | Oceanic SACZ |
| OLR | Outgoing Longwave Radiation |
| PSA | Pacific South-America |
| RMM | Real-Time Multivariate Index |
| SA | South America |
| SAMS | South American Monsoon System |
| SACZ | South Atlantic Convergence Zone |
| SASH | South Atlantic South High |
| SL | Squall Line |
| SPSH | South Pacific South High |
| TNB | Trough Northeast of Brazil |
| TRMM | Tropical Rainfall Measuring Mission |
References
- Zhou, J.; Lau, K. Does a monsoon climate exist over South America? J. Clim. 1998, 11, 1020–1040. [Google Scholar] [CrossRef]
- Nogué-Paegle, J.; Mechoso, C.R.; Fu, R.; Cook, K.H.; Liebmann, B. Progress in Pan American CLIVAR research: Understanding the South American Monsoon. Meteorologica. 2002, 27, 1–30. [Google Scholar]
- Gan, M.; Kousky, V.; Ropelewski, C. The South America monsoon circulation and its relationship to rainfall over west-central Brazil. J. Clim. 2004, 17, 47–66. [Google Scholar] [CrossRef] [Green Version]
- Marengo, J.A.; Soares, W.R.; Saulo, C.; Nicolini, M. Climatology of the low-level jet east of the Andes as derived from the NCEP–NCAR reanalyses: Characteristics and temporal variability. J. Clim. 2004, 17, 2261–2280. [Google Scholar] [CrossRef] [Green Version]
- Kousky, V.E. Pentad outgoing longwave radiation climatology for the South American sector. Rev. Bras. Meteor 1988, 3, 217–231. [Google Scholar]
- Horel, J.D.; Hahmann, A.N.; Geisler, J.E. An investigation of the annual cycle of convective activity over the tropical Americas. J. Clim. 1989, 2, 1388–1403. [Google Scholar] [CrossRef] [Green Version]
- Silva Dias, P.L.; Schubert, W.H.; DeMaria, M. Large-scale response of the tropical atmosphere to transient convection. J. Atmos. Sci. 1983, 40, 2689–2707. [Google Scholar] [CrossRef]
- Figueroa, S.N.; Satyamurty, P.; Da Silva Dias, P.L. Simulations of the summer circulation over the South American region with an eta coordinate model. J. Atmos. Sci. 1995, 52, 1573–1584. [Google Scholar] [CrossRef] [Green Version]
- Madden, R.A.; Julian, P.R. Detection of a 40–50 day oscillation in the zonal wind in the tropical Pacific. J. Atmos. Sci. 1971, 28, 702–708. [Google Scholar] [CrossRef]
- Kodama, Y. Large-scale common features of subtropical precipitation zones (the Baiu frontal zone, the SPCZ, and the SACZ) Part I: Characteristics of subtropical frontal zones. J. Meteorol. Soc. Jpn. Ser. II 1992, 70, 813–836. [Google Scholar] [CrossRef] [Green Version]
- Kodama, Y.M. Large-scale common features of sub-tropical convergence zones (the Baiu Frontal Zone, the SPCZ, and the SACZ) Part II: Conditions of the circulations for generating the STCZs. J. Meteorol. Soc. Jpn. Ser. II 1993, 71, 581–610. [Google Scholar] [CrossRef] [Green Version]
- Nogués-Paegle, J.; Mo, K.C. Alternating wet and dry conditions over South America during summer. Mon. Weather Rev. 1997, 125, 279–291. [Google Scholar] [CrossRef]
- Liebmann, B.; Kiladis, G.N.; Marengo, J.; Ambrizzi, T.; Glick, J.D. Submonthly convective variability over South America and the South Atlantic convergence zone. J. Clim. 1999, 12, 1877–1891. [Google Scholar] [CrossRef] [Green Version]
- Carvalho, L.M.; Jones, C.; Liebmann, B. Extreme precipitation events in southeastern South America and large-scale convective patterns in the South Atlantic convergence zone. J. Clim. 2002, 15, 2377–2394. [Google Scholar] [CrossRef] [Green Version]
- Nieto Ferreira, R.; Chao, W.C. Aqua-planet simulations of the formation of the South Atlantic convergence zone. Int. J. Climatol. 2013, 33, 615–628. [Google Scholar] [CrossRef] [Green Version]
- Paegle, J.N.; Byerle, L.A.; Mo, K.C. Intraseasonal modulation of South American summer precipitation. Mon. Weather Rev. 2000, 128, 837–850. [Google Scholar] [CrossRef]
- Carvalho, L.M.; Jones, C.; Liebmann, B. The South Atlantic convergence zone: Intensity, form, persistence, and relationships with intraseasonal to interannual activity and extreme rainfall. J. Clim. 2004, 17, 88–108. [Google Scholar] [CrossRef] [Green Version]
- Zhang, C. Madden–Julian oscillation: Bridging weather and climate. Bull. Am. Meteorol. Soc. 2013, 94, 1849–1870. [Google Scholar] [CrossRef]
- Knutson, T.R.; Weickmann, K.M. 30–60 day atmospheric oscillations: Composite life cycles of convection and circulation anomalies. Mon. Weather Rev. 1987, 115, 1407–1436. [Google Scholar] [CrossRef]
- Madden, R.A.; Julian, P.R. Description of global-scale circulation cells in the tropics with a 40–50 day period. J. Atmos. Sci. 1972, 29, 1109–1123. [Google Scholar] [CrossRef]
- Chen, G. Diversity of the Global Teleconnections Associated with the Madden–Julian Oscillation. J. Clim. 2021, 34, 397–414. [Google Scholar] [CrossRef]
- Kousky, V.E.; Kayano, M.T. Principal modes of outgoing longwave radiation and 250-mb circulation for the South American sector. J. Clim. 1994, 7, 1131–1143. [Google Scholar] [CrossRef] [Green Version]
- De Souza, E.B.; Ambrizzi, T. Modulation of the intraseasonal rainfall over tropical Brazil by the Madden–Julian oscillation. Int. J. Climatol. J. R. Meteorol. Soc. 2006, 26, 1759–1776. [Google Scholar] [CrossRef]
- Cunningham, C.A.C.; Cavalcanti, I.F.d.A. Intraseasonal modes of variability affecting the South Atlantic Convergence Zone. Int. J. Climatol. 2006, 26, 1165–1180. [Google Scholar] [CrossRef]
- Alvarez, M.S.; Vera, C.S.; Kiladis, G.N.; Liebmann, B. Influence of the Madden Julian Oscillation on precipitation and surface air temperature in South America. Clim. Dyn. 2016, 46, 245–262. [Google Scholar] [CrossRef]
- Casarin, D.; Kousky, V. Anomalias de precipitação no sul do Brasil e variações na circulação atmosférica. Rev. Bras. Meteorol. 1986, 1, 83–90. [Google Scholar]
- Vera, C.; Higgins, W.; Amador, J.; Ambrizzi, T.; Garreaud, R.; Gochis, D.; Gutzler, D.; Lettenmaier, D.; Marengo, J.; Mechoso, C.; et al. Toward a unified view of the American monsoon systems. J. Clim. 2006, 19, 4977–5000. [Google Scholar] [CrossRef]
- Grimm, A.M. Madden–Julian Oscillation impacts on South American summer monsoon season: Precipitation anomalies, extreme events, teleconnections, and role in the MJO cycle. Clim. Dyn. 2019, 53, 907–932. [Google Scholar] [CrossRef]
- Mayta, V.C.; Ambrizzi, T.; Espinoza, J.C.; Silva Dias, P.L. The role of the Madden–Julian oscillation on the Amazon Basin intraseasonal rainfall variability. Int. J. Climatol. 2019, 39, 343–360. [Google Scholar] [CrossRef]
- Vitorino, M.I.; da Silva Dias, P.; Ferreira, N. Observational study of the seasonality of the submonthly and intraseasonal signal over the tropics. Meteorol. Atmos. Phys. 2006, 93, 17–35. [Google Scholar] [CrossRef]
- Alves, J.; Barbosa, A.C.; Silva, E.M.; Vasconcelos Junior, F.d.C.; Silva, M.L.d.; Santos, A.; Lira, M.A.; Sombra, S.S. Convective Intraseasonal Oscillations beteween Indian-Pacific and Northeasth Brazil Regions: Some Observational and Models Characteristics. Rev. Bras. Meteorol. 2018, 33, 193–206. [Google Scholar] [CrossRef]
- Ohsawa, T.; Ueda, H.; Hayashi, T.; Watanabe, A.; Matsumoto, J. Diurnal variations of convective activity and rainfall in tropical Asia. J. Meteorol. Soc. Jpn. Ser. II 2001, 79, 333–352. [Google Scholar] [CrossRef] [Green Version]
- Zhou, L.; Wang, Y. Tropical Rainfall Measuring Mission observation and regional model study of precipitation diurnal cycle in the New Guinean region. J. Geophys. Res. Atmos. 2006, 111. [Google Scholar] [CrossRef] [Green Version]
- Mori, S.; Hamada, J.I.; Sakurai, N.; Fudeyasu, H.; Kawashima, M.; Hashiguchi, H.; Syamsudin, F.; Arbain, A.A.; Sulistyowati, R.; Matsumoto, J.; et al. Convective systems developed along the coastline of Sumatera Island, Indonesia, observed with an X-band Doppler radar during the HARIMAU2006 campaign. J. Meteorol. Soc. Jpn. Ser. II 2011, 89, 61–81. [Google Scholar] [CrossRef] [Green Version]
- Fajary, F.R.; Hadi, T.W.; Yoden, S. Contributing factors to spatiotemporal variations of Outgoing Longwave Radiation (OLR) in the tropics. J. Clim. 2019, 32, 4621–4640. [Google Scholar] [CrossRef]
- Quadro, M.F.L.d.; Silva Dias, M.A.; Gonçalves, L.G.; Herdies, D.L.; Berbery, E.H. Análise Climatológica da precipitação e do Transporte de umidade na região da ZCAS através da Nova geração de reanálises. Rev. Bras. Meteorol. 2012, 27, 152–162. [Google Scholar] [CrossRef] [Green Version]
- Hersbach, H.; Bell, B.; Berrisford, P.; Hirahara, S.; Horányi, A.; Muñoz-Sabater, J.; Nicolas, J.; Peubey, C.; Radu, R.; Schepers, D.; et al. The ERA5 global reanalysis. Q. J. R. Meteorol. Soc. 2020, 146, 1999–2049. [Google Scholar] [CrossRef]
- Huffman, G.J.; Bolvin, D.T.; Braithwaite, D.; Hsu, K.; Joyce, R.; Xie, P.; Yoo, S.H. NASA global precipitation measurement (GPM) integrated multi-satellite retrievals for GPM (IMERG). Algorithm Theor. Basis Doc. Version 2015, 4, 30. [Google Scholar]
- Huffman, G.J.; Bolvin, D.T.; Nelkin, E.J. Integrated Multi-satellitE Retrievals for GPM (IMERG) technical documentation. NASA/GSFC Code 2015, 612, 47. [Google Scholar]
- Huffman, G.J.; Bolvin, D.T.; Nelkin, E.J. Day 1 IMERG Final Run Release Notes; NASA/GSFC: Greenbelt, MD, USA, 2015.
- Rozante, J.R.; Moreira, D.S.; de Goncalves, L.G.G.; Vila, D.A. Combining TRMM and surface observations of precipitation: Technique and validation over South America. Weather Forecast. 2010, 25, 885–894. [Google Scholar] [CrossRef] [Green Version]
- Ceballos, J.C.; Lima, W.F.A.; Souza, J.M.d. Outgoing longwave radiation at the top of the atmosphere: Preliminary assessment using GOES-8 Imager data. Rev. Bras. GeofiSica 2003, 21, 53–64. [Google Scholar] [CrossRef]
- Grimm, A.M.; Natori, A.A. Climate change and interannual variability of precipitation in South America. Geophys. Res. Lett. 2006, 33. [Google Scholar] [CrossRef] [Green Version]
- Rosa, E.B.; Pezzi, L.P.; Quadro, M.F.L.D.; Brunsell, N. Automated Detection Algorithm for SACZ, Oceanic SACZ and their Climatological Features. Front. Environ. Sci. 2020, 8, 18. [Google Scholar] [CrossRef]
- Herdies, D.L.; da Silva, A.; Silva Dias, M.A.; Nieto Ferreira, R. Moisture budget of the bimodal pattern of the summer circulation over South America. J. Geophys. Res. Atmos. 2002, 107, LBA-42. [Google Scholar] [CrossRef]
- Wheeler, M.C.; Hendon, H.H. An all-season real-time multivariate MJO index: Development of an index for monitoring and prediction. Mon. Weather Rev. 2004, 132, 1917–1932. [Google Scholar] [CrossRef]
- Alvarez, M.S.; Vera, C.S.; Kiladis, G.N. MJO modulating the activity of the leading mode of intraseasonal variability in South America. Atmosphere 2017, 8, 232. [Google Scholar] [CrossRef] [Green Version]
- Shimizu, M.H.; Ambrizzi, T.; Liebmann, B. Extreme precipitation events and their relationship with ENSO and MJO phases over northern South America. Int. J. Climatol. 2017, 37, 2977–2989. [Google Scholar] [CrossRef]
- Grimm, A.M.; Hakoyama, L.R.; Scheibe, L.A. Active and break phases of the South American summer monsoon: MJO influence and subseasonal prediction. Clim. Dyn. 2021, 56, 3603–3624. [Google Scholar] [CrossRef]
- Kousky, V.E.; Gan, M.A. Upper tropospheric cyclonic vortices in the tropical South Atlantic. Tellus 1981, 33, 538–551. [Google Scholar] [CrossRef] [Green Version]
- Jones, C.; Waliser, D.E.; Gautier, C. The influence of the Madden–Julian oscillation on ocean surface heat fluxes and sea surface temperature. J. Clim. 1998, 11, 1057–1072. [Google Scholar] [CrossRef]
- Mota, M.; NOBRE, C.A. Relação da variabilidade da energia potencial convectiva disponível (CAPE) com a precipitação e a alta da Bolívia durante a campanha Wet-AMC/LBA. Rev. Bras. Meteorol. 2006, 21, 344–355. [Google Scholar]
- Cohen, J.C.; Silva Dias, M.A.; Nobre, C.A. Environmental conditions associated with Amazonian squall lines: A case study. Mon. Weather Rev. 1995, 123, 3163–3174. [Google Scholar] [CrossRef]
- Garstang, M.; Massie Jr, H.L.; Halverson, J.; Greco, S.; Scala, J. Amazon coastal squall lines. Part I: Structure and kinematics. Mon. Weather Rev. 1994, 122, 608–622. [Google Scholar] [CrossRef] [Green Version]
- Kousky, V.E. Diurnal rainfall variation in northeast Brazil. Mon. Weather Rev. 1980, 108, 488–498. [Google Scholar] [CrossRef] [Green Version]
- Ninomiya, K. Similarity and difference between the South Atlantic convergence zone and the Baiu frontal zone simulated by an AGCM. J. Meteorol. Soc. Jpn. Ser. II 2007, 85, 277–299. [Google Scholar] [CrossRef] [Green Version]
- Nielsen, D.M.; Belém, A.L.; Marton, E.; Cataldi, M. Dynamics-based regression models for the South Atlantic Convergence Zone. Clim. Dyn. 2019, 52, 5527–5553. [Google Scholar] [CrossRef] [Green Version]
- Navarra, A.; Stern, W.F.; Miyakoda, K. Reduction of the Gibbs Oscillation in Spectral Model Simulations. J. Clim. 1994, 7, 1169–1183. [Google Scholar] [CrossRef] [Green Version]
- Liebmann, B.; Smith, C.A. Description of a complete (interpolated) outgoing longwave radiation dataset. Bull. Am. Meteorol. Soc. 1996, 77, 1275–1277. [Google Scholar]
Publisher’s Note: MDPI stays neutral with regard to jurisdictional claims in published maps and institutional affiliations. |
© 2021 by the authors. Licensee MDPI, Basel, Switzerland. This article is an open access article distributed under the terms and conditions of the Creative Commons Attribution (CC BY) license (https://creativecommons.org/licenses/by/4.0/).