Article

Climatology of Spread F over Tucumán from Massive Statistical Analysis of Autoscaled Data

Istituto Nazionale di Geofisica e Vulcanologia, Via di Vigna Murata 605, 00143 Rome, Italy
*
Author to whom correspondence should be addressed.
Atmosphere 2021, 12(10), 1351; https://doi.org/10.3390/atmos12101351
Submission received: 6 September 2021 / Revised: 8 October 2021 / Accepted: 12 October 2021 / Published: 15 October 2021
(This article belongs to the Section Upper Atmosphere)

Abstract

:
Automatic ionogram interpretation methods developed for real-time ionospheric monitoring can be applied in retrospective studies to analyze large quantities of data. The Autoscala software, implemented for such a purpose, includes a routine for automatic detection of diffused echoes known as spread F, which appear in ionograms due to the presence of ionospheric irregularities along the radio signal path. The main objective of this routine is to reject bad quality ionograms. This new capability was used in a climatological study including a large number of ionograms recorded at the low-latitude ionospheric station of Tucumán (26.9° S, 294.6° E, magnetic latitude 15.5° S, Argentina). The study took into account different levels of geomagnetic and solar activity from 2012 to 2020. The results demonstrate the capability of Autoscala to capture the main signature characteristics of spread F and the temporal evolution of the ionosphere peak heigh hmF2, capturing the post-sunset plasma surge that precedes development of spread F. Maximum occurrence of spread F is observed in local summer, with a tendency to shift before midnight with increasing solar activity. Other new climatological details that emerged from the study are illustrated and briefly discussed, dealing with connection with geomagnetic activity, and morning hmF2 behavior after extremely marked nighttime spread F occurrence.

1. Introduction

The huge increase in instrument and sensor networks in recent decades poses a new challenge to contemporary science, sometimes referred to in the literature as Big Data [1]. While it is possible to store zettabytes of data, there is a problem of how to analyze it all without software designed for this purpose.
The analysis of ionograms [2] continues to be one of the most accurate and effective ways to monitor and study plasma dynamics in the ionosphere, and it is fundamental in Space Weather research and applications. Ionograms are images depicting echo strength as a function of the signal carrier frequency, commonly varied from 1 to 20 MHz, and ground–ionosphere–ground path travel time, presented as virtual altitude of reflection in km [3]. These are the results of ionospheric radio-soundings performed by the ionosondes, which are ground-based HF radars used to vertically sound the ionosphere exploiting its radio waves reflection property, in order to identify the height of the different ionospheric layers, and their corresponding plasma densities. Since the 1960s, several groups have worked on the development of algorithms capable of automatically scaling ionograms and outputting the standard ionospheric characteristics [4,5,6,7,8,9,10,11,12,13,14].
Equatorial ionospheric monitoring is compromised by the presence of equatorial plasma bubbles (EPBs), which are zones of depleted plasma density. These disturb radio communications and navigation in the form of phase and amplitude scintillations or signal loss, representing an important issue for Space Weather (see, e.g., [15,16,17,18]). In ionogram traces, these ionospheric irregularities appear in a characteristic form, as a spread or diffusion of the F region echoes, hence their generic denomination as equatorial spread F (ESF). They are also visible as plume-like structures in radar observations, and emission depletions in airglow images ([19] and references therein). According to its appearance in the ionograms, different types of spread F are commonly classified as: range spread F (RSF), strong range spread F (SSF), frequency spread F (FSF), and mixed spread F (MSF) [17,20]. This classification, however, is not of interest in this work, since all types of spread F mentioned above constitute an insurmountable problem for the interpretation of the ionogram traces. As a way of example, Figure 1 shows a couple of ionograms largely affected by spread F. As can be seen, spread F occurrence can significantly lower the ionogram readability, making often impossible its interpretation (Figure 1a). This is highlighted by the right-side table, reporting the absence of output by Autoscala software and its profiler [21,22]. The loss of ionogram quality due to spread F can also lead to misleading interpretation by autoscaling programs, with consequent erroneous outputs (Figure 1b, and the corresponding right-side table).
The equatorial ionosphere differs significantly from the mid and high latitude ionosphere because the magnetic field is almost horizontal near the equator. During the day, equatorial plasma drifts upward due to the eastwardly directed electric field. The plasma then moves along the magnetic field lines due to gravity and pressure gradients, descending towards the north and south. This motion of ionospheric plasma near the equator is known as a fountain effect and results in the formation of two ionization maxima at ~ +/−15° from the magnetic equator, giving rise to the equatorial ionospheric anomaly (EIA).
At night, the electric field reverses from its diurnal value, due to currents of tidal origin causing an accumulation of negative charge at dusk and positive charge at dawn. The resulting electric field is directed westwards. However, before this night–day inversion, the eastward-directed diurnal electric field often exhibits a sharp intensification, known as a pre-reversal enhancement (PRE), which pushes the F layer plasma even higher. This strong upward drift, combined with gravity, the reduced density of the neutral atmosphere, and the steep electron density gradient in the bottomside ionosphere, results in a high growth rate in Collisional Rayleigh Taylor (CRT) instability [23,24]. If the post-sunset plasma surge rises sufficiently high (to or above 350 km), the stored energy can be released explosively, forming low-density, extremely turbulent features that surge upwards, causing the irregularities described above [25].
Some studies aimed at creating a basis for monitoring and short-term prediction of spread F have investigated the relationship between the extension of EPBs and the strength of PRE (which depends on season, solar activity cycle, and longitude), assessing the latter in relation to the F region bottomside altitude h’F ([26] and reference therein). With the same objective, other authors have used the temporal rate of change of hmF2 to estimate the F region vertical plasma drift vz ([27] and reference therein). These studies focused on vz because its abrupt variations are associated with the occurrence of plasma spread F, during the nighttime hours. The relationship between the vz peak time and the irregularity observed in the ionograms was quantified. This led to a proposal for a new ionospheric scale based on the analysis of ionospheric plasma drift velocity, with the aim of assisting monitoring and short-term prediction of spread F in the Brazilian sector [28]. Another study investigating the possibility of spread F prediction was presented by Sousasantos et al. [29]. They proposed a mathematical simulation for ionospheric vertical drift, based on Digisonde data and focused on predicting whether ionospheric plasma instability would evolve into EPB structures. The vertical drift was calculated through hmF2, directly following ionogram analysis performed by the ARTIST software. The authors achieved promising results, indicating a potential or alternative method for forecasting EPB events at least 30–40 min in advance. The rationale for these studies was that hmF2 is already provided in real-time by existing programs for automatic ionogram interpretation like Autoscala [21,22] and ARTIST [30].
Another important factor was the recent successful development of automatic systems to identify spread F [31,32,33], and specifically the coding of a routine that improved the Autoscala software. The comparison of data generated automatically with data produced manually by operators demonstrated that this routine is a useful tool for Space Weather applications [34]. It is therefore conceivable to use ionosonde measurements for systematic real-time monitoring of the daily temporal evolution of hmF2, to capture the post-sunset plasma surging that precedes the development of spread F, and also to automatically detect the moment at which spread F appears on an ionogram.
Autoscala is among the computer programs that can be used for real-time applications of this type. However, in this study it is exploited for the analysis of a large number of ionograms, an analysis that could not reasonably be carried out manually. This enabled study of the climatology of the spread F occurrence at the Tucumán (26.9° S, 294.6° E, magnetic latitude 15.5° S, Argentina) ionospheric station, near the southern crest of EIA. It also verified Autoscala’s capacity to capture the diurnal evolution of hmF2 in relation to the occurrence of spread F.

2. Materials and Methods

The data analysis included ionograms recorded at the Tucumán ionospheric station starting from 2012 because the antenna system had been modified in late 2011 and the data can be considered homogeneous from that time onwards. Over the study interval of 2012 to 2020, a total of 328,558 ionograms were recorded by the AIS-INGV ionosonde [35] and post-processed with an updated version of Autoscala capable of identifying cases of spread F, and providing the usual estimate for the vertical electron density profile [34,36]. The period in question included a solar activity maximum in 2014, and a minimum in 2019.
The year was divided into four periods for the data analysis, related to local seasons in the Southern Hemisphere: around the summer solstice (November, December, and January), around the autumn equinox (February, March, and April), around the winter solstice (May, June, and July), and around the spring equinox (August, September, and October).
Three different levels of geomagnetic activity were considered based on the values of the three-hourly ap geomagnetic index: all ap < 7 in the previous 6 h (geomagnetically quiet conditions), at least one 7 ≤ ap < 27 in the previous 6 h (moderately disturbed conditions), and at least one ap ≥ 27 in the previous 6 h (highly disturbed conditions). This classification was found to be appropriate for highlighting the features of the observed phenomenology.

3. Results and Discussion

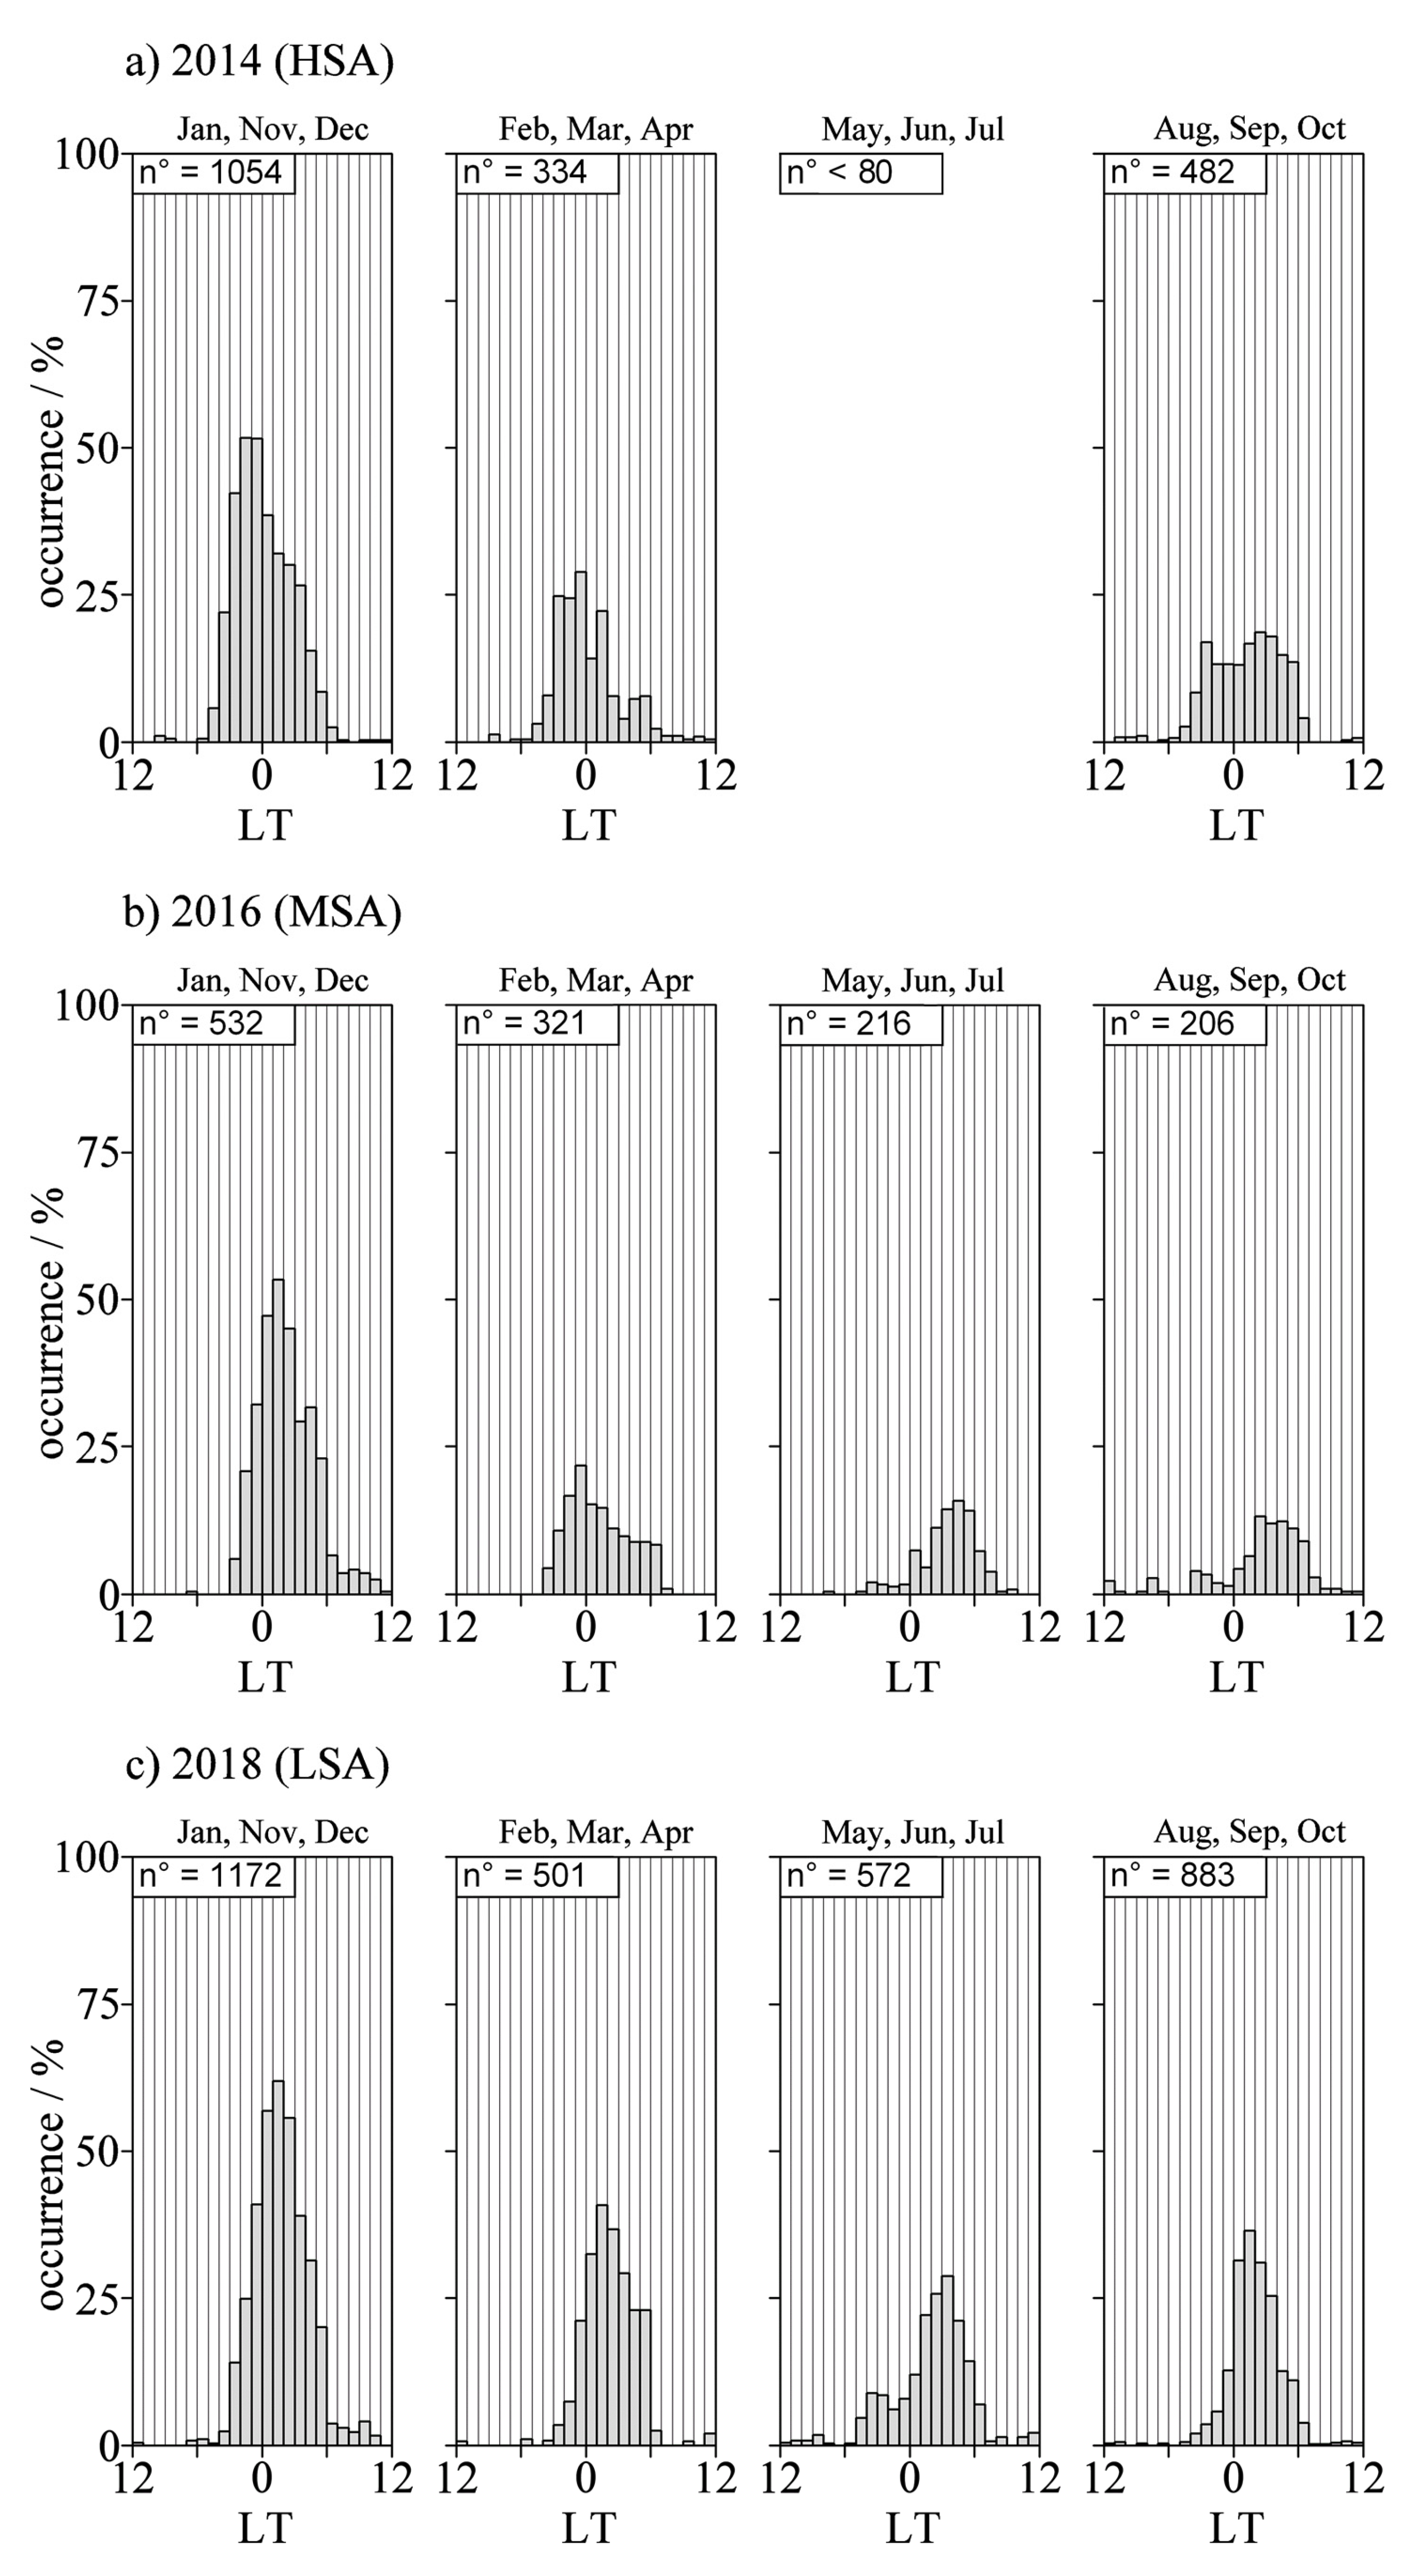
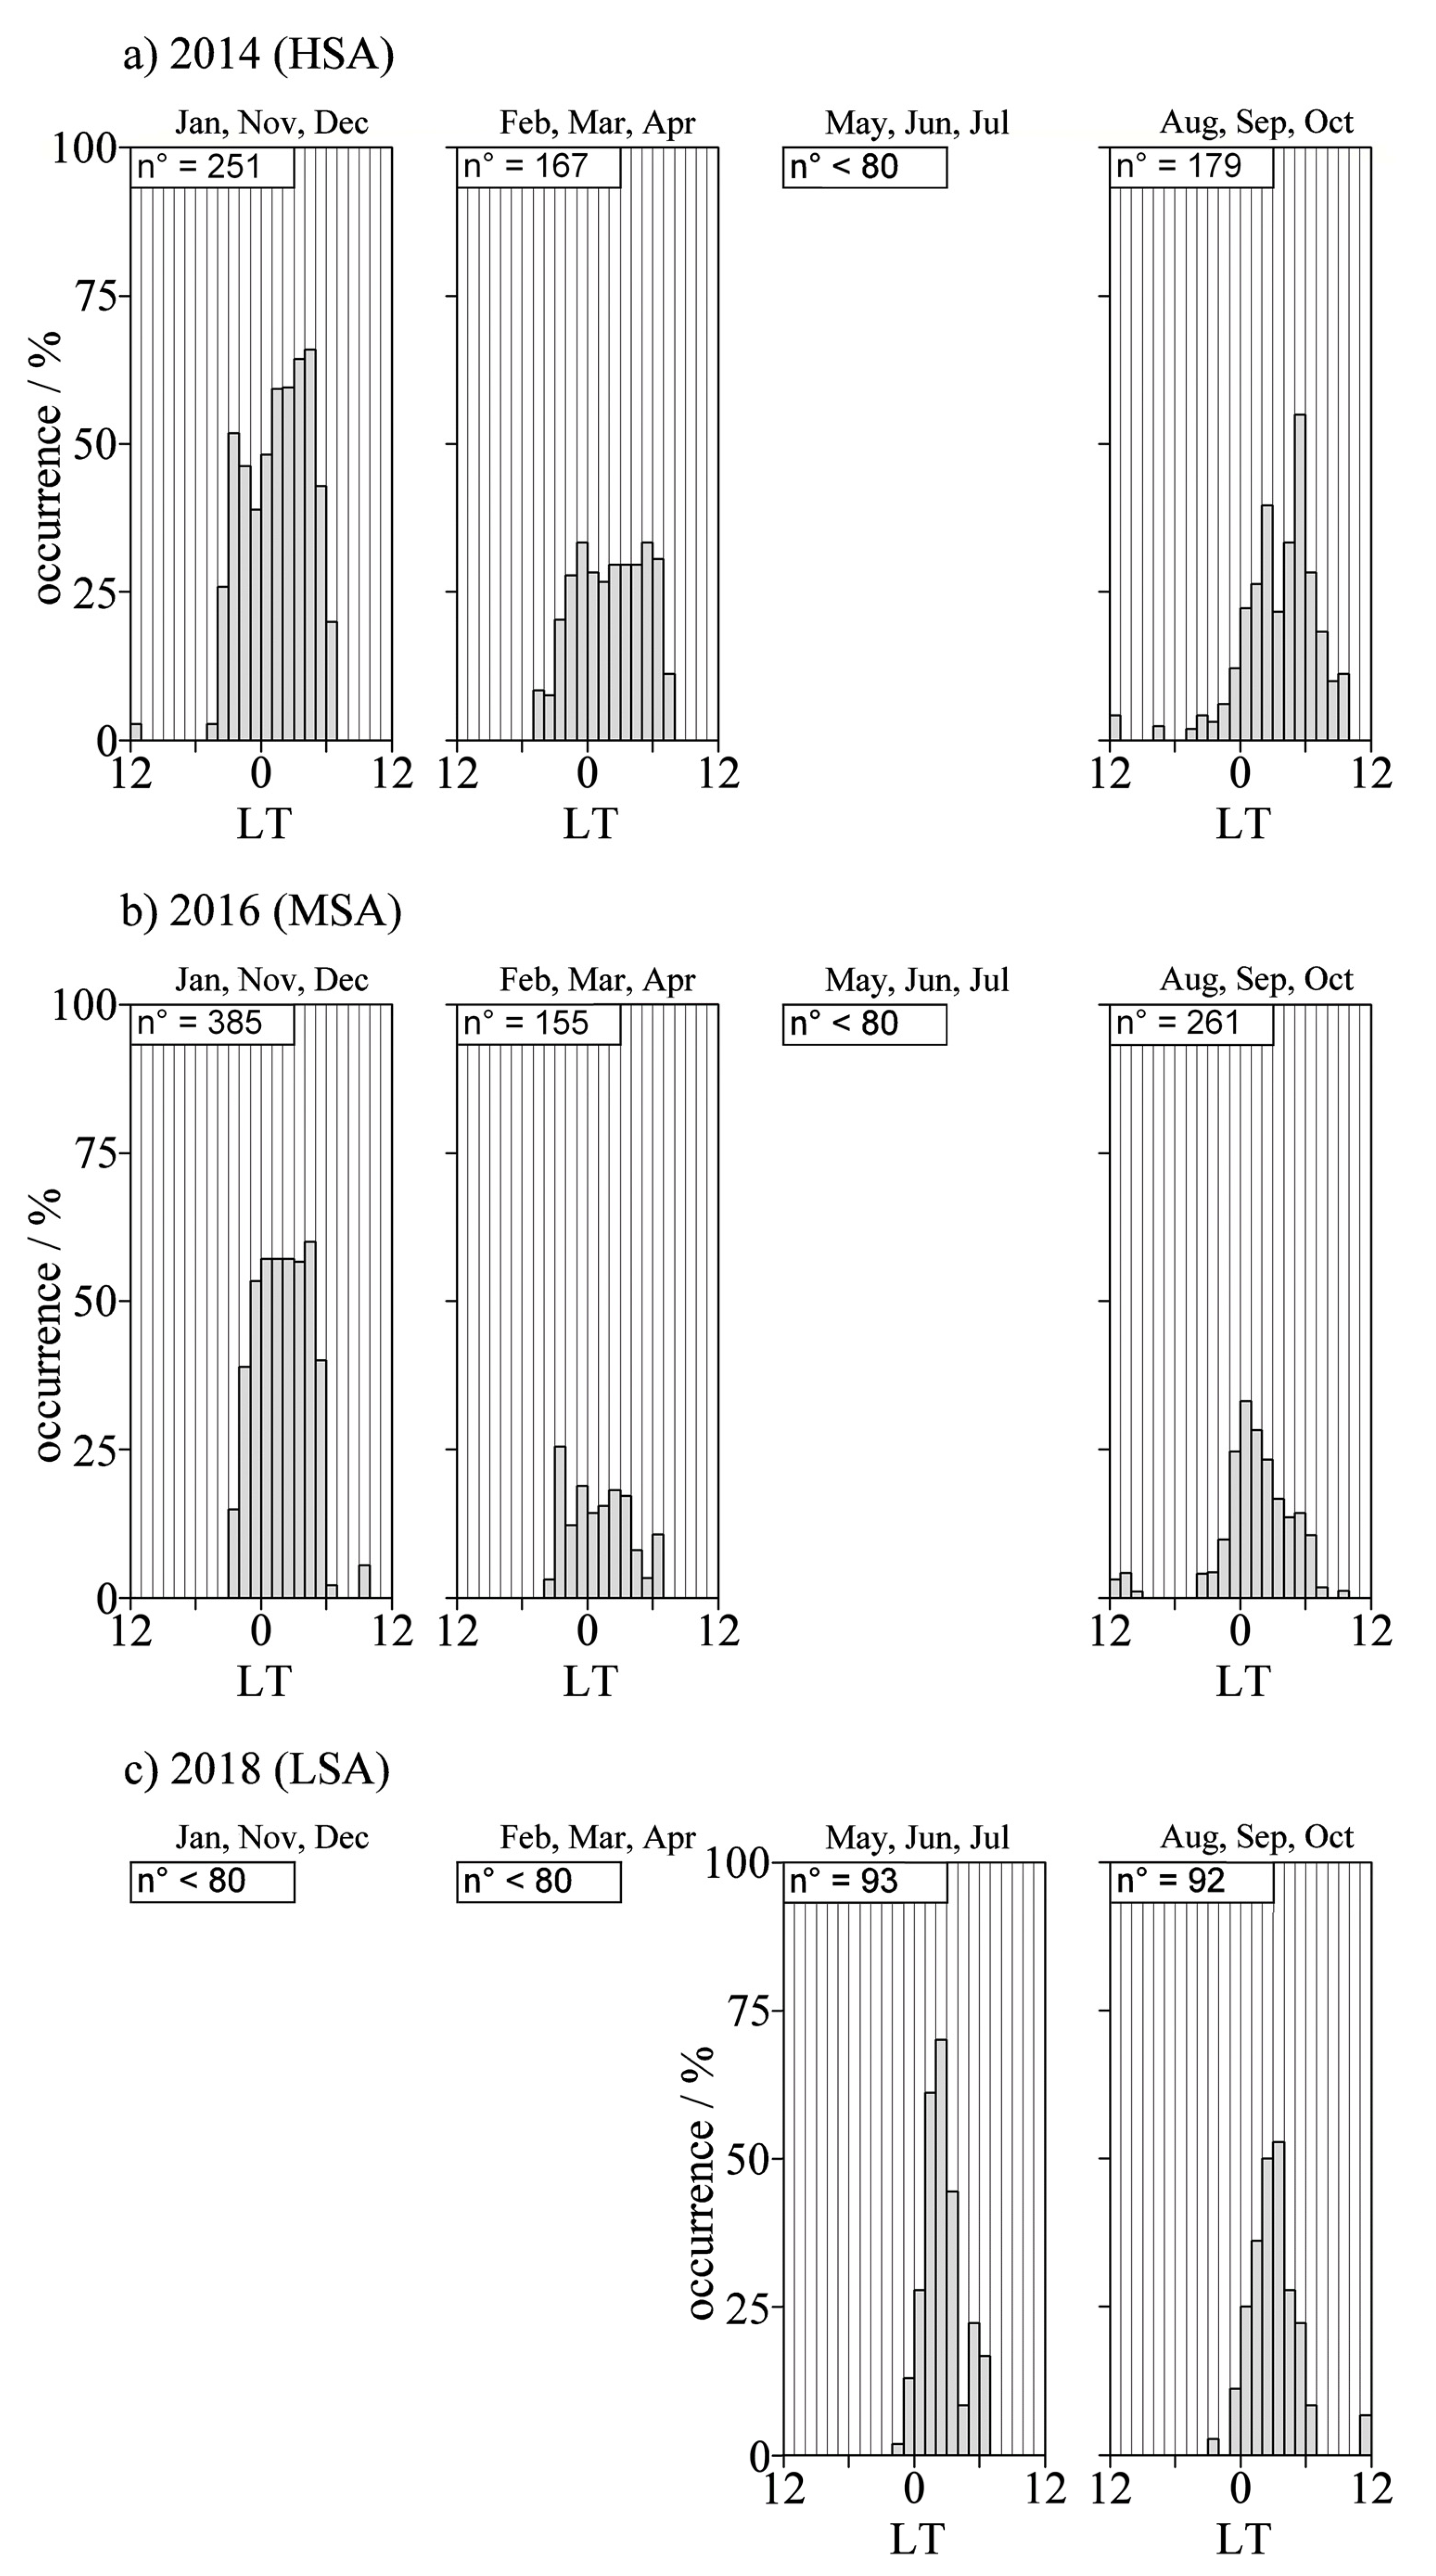
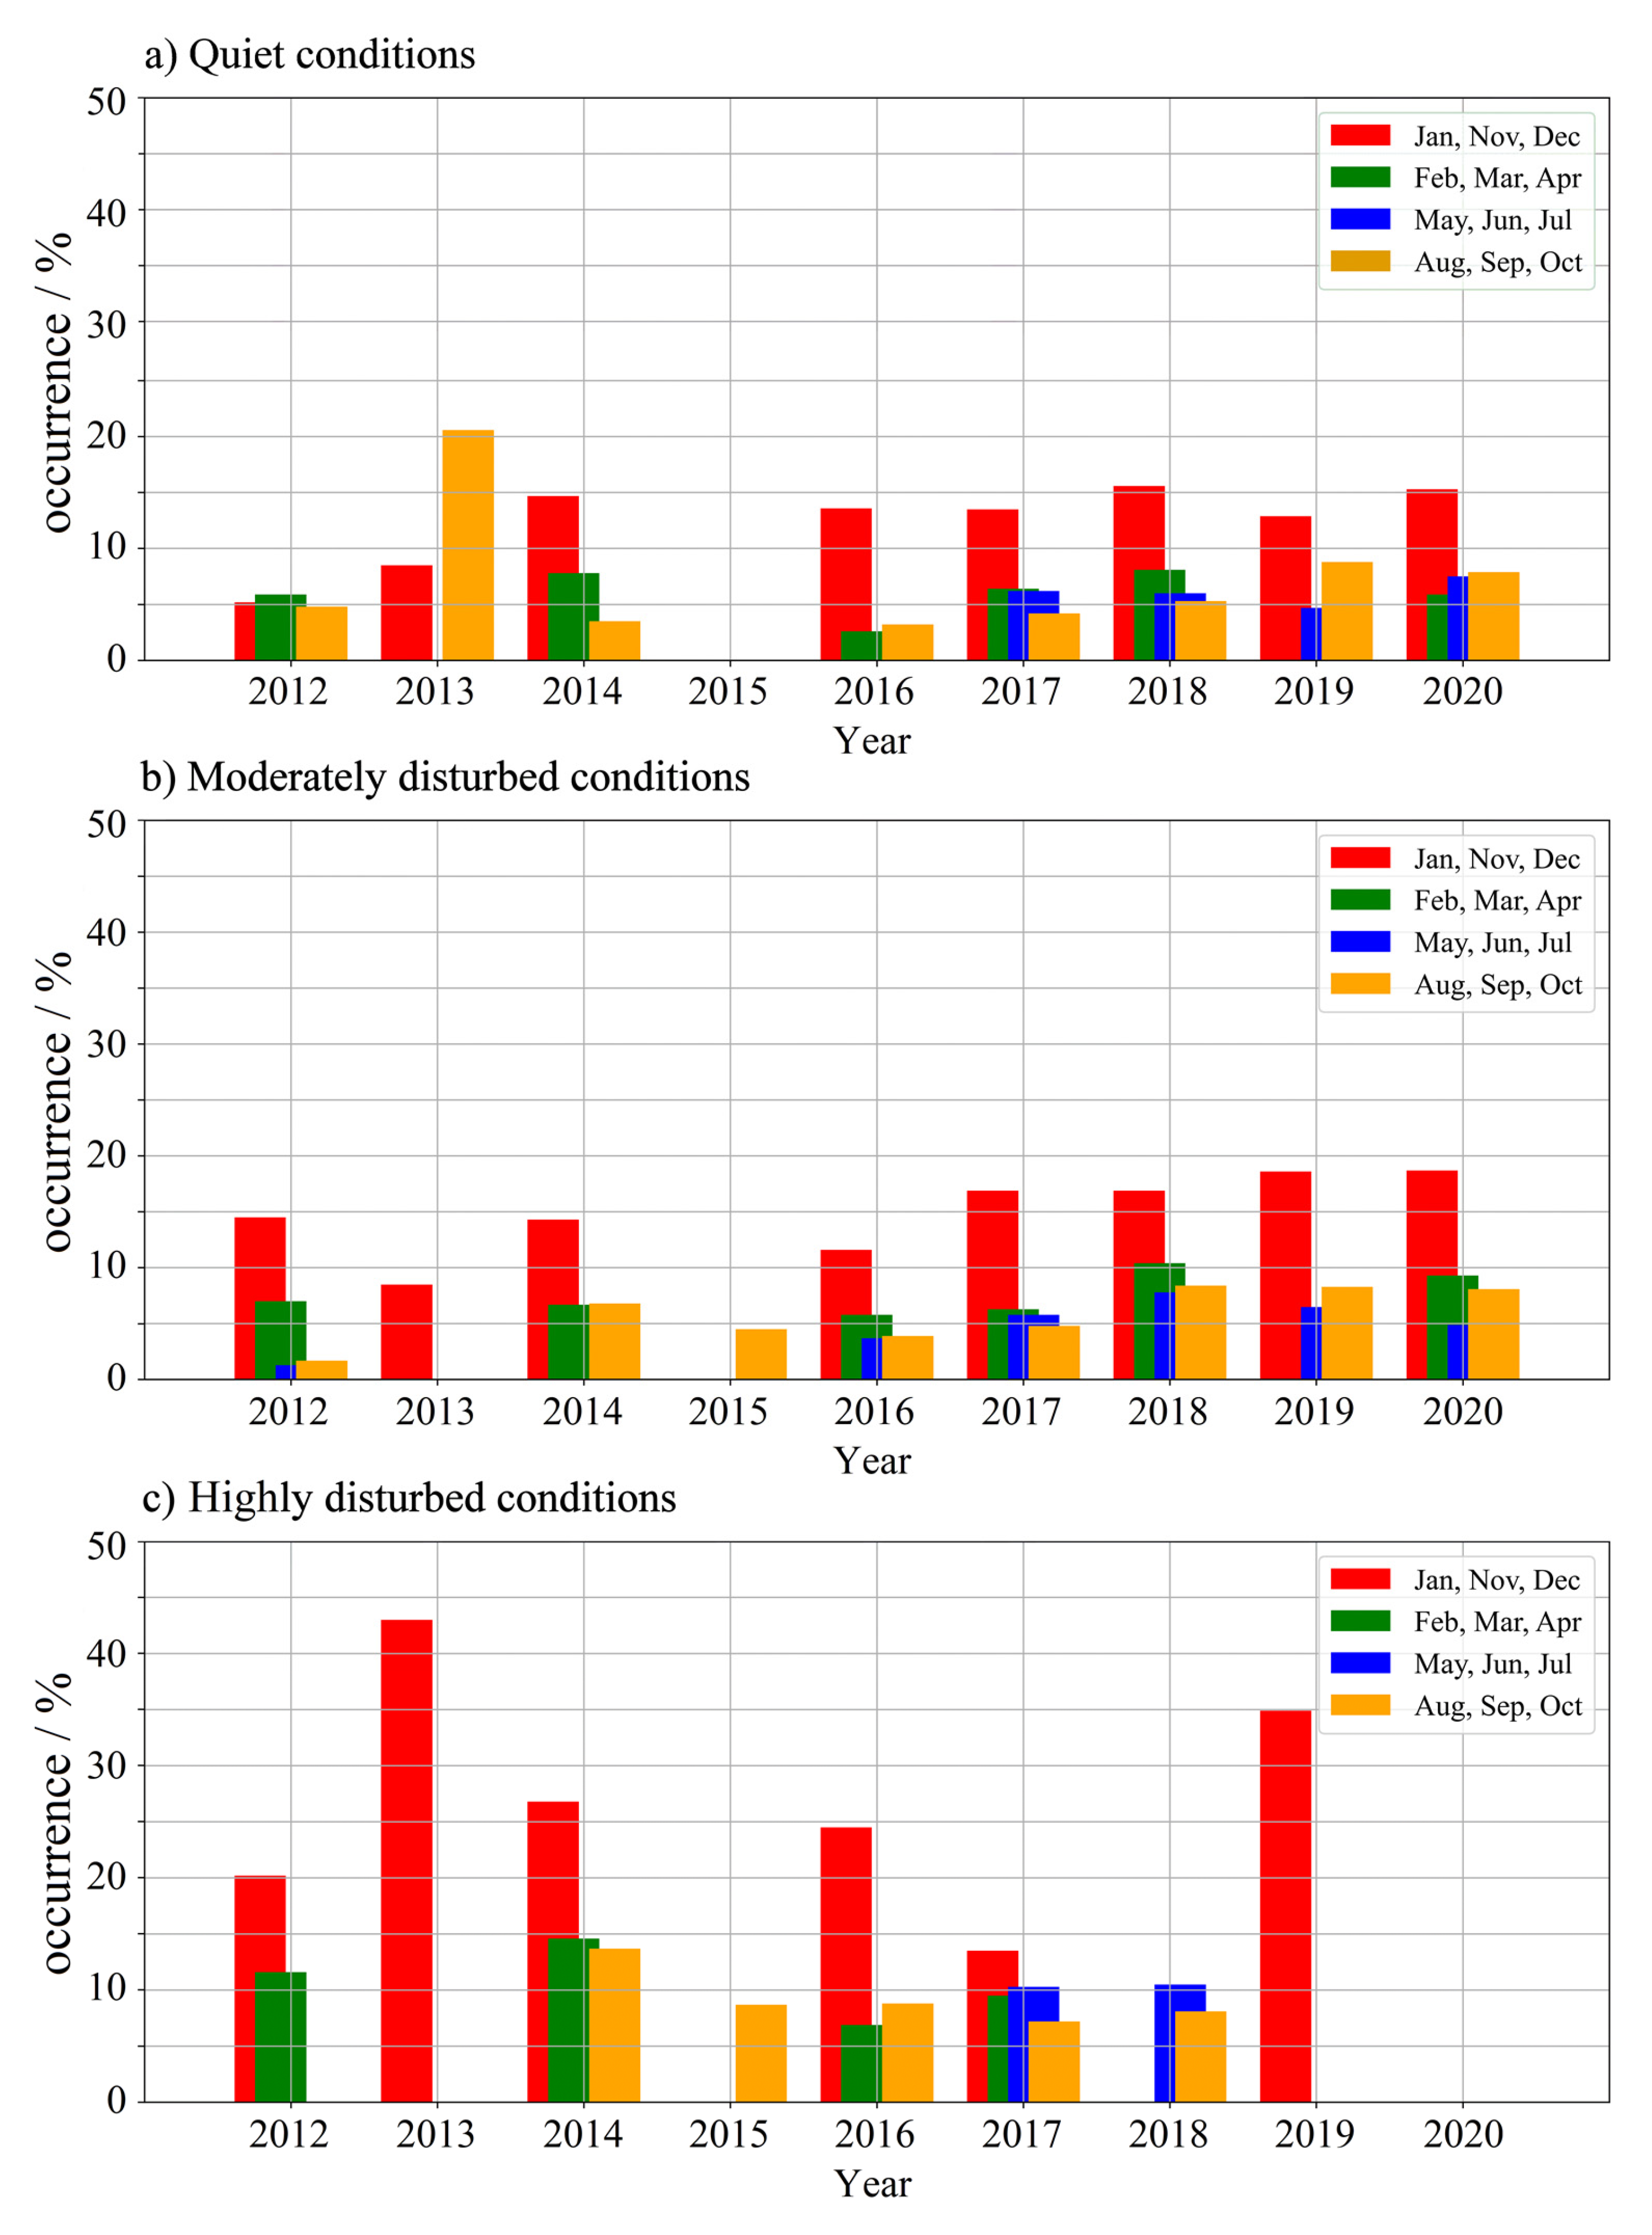
Figure 2 shows the occurrence of spread F as a function of local time (LT) in 2014 (High Solar Activity, HSA), 2016 (Medium Solar Activity, MSA), and 2018 (Low Solar Activity, LSA), considering quiet conditions. Figure 3 shows the occurrence of spread F as a function of LT in 2014, 2016, and 2018, considering moderately disturbed conditions. Figure 4 shows the occurrence of spread F as a function of LT in 2014, 2016, and 2018, considering highly disturbed conditions. Figure 5 shows the occurrence of spread F as a function of the different years, representing different levels of solar activity, during different periods of the year, and for the three defined levels of geomagnetic activity. Figure 2, Figure 3, Figure 4 and Figure 5 only show the histograms derived from more than 80 cases of spread F. The reason for lack of some histograms in such figures lies in the dataset heterogeneity, as some classes defined for histograms construction are empty or poorly filled, making it practically impossible to have a sufficient number of ionograms affected by spread F.
Figure 6 and Figure 7 show the hmF2 trend plots superimposed in 142 cases in which spread F was observed for more than 25% of the time (in red), and 93 cases in which spread F was never observed (in blue). Figure 6 shows the hmF2 values for the different levels of geomagnetic activity defined above. Figure 7 shows the hmF2 values for the different seasons. Figure 8 shows the graph of hmF2 as a function of LT for a case in which spread F was almost absent and not identified by Autoscala in any ionogram, and a case in which spread F was widely observed. All the figures depict 24-h time spans centered on local midnight.
Figure 2, Figure 3 and Figure 4 clearly show that the absolute maximum of spread F occurs in local summer. This agrees with the knowledge that spread F is related to field aligned irregularities, which peak during the time of year when the sunset terminator is closely aligned with the magnetic field lines [37,38]. The occurrence minimum observed in local winter based on the same figures can be explained with the same mechanism. Figure 5 shows no increased occurrence in relation to different solar activity levels. This disagrees with the result obtained by Kepkar et al. [19], who demonstrated that irregularities occur in the region of high plasma density, i.e., the crest of EIA during HSA. This apparently conflicting result is related to what emerges from Figure 2 and Figure 3, which show that maximum occurrence, generally observed after midnight during LSA, tends to anticipate midnight under HSA conditions. Several studies have in fact highlighted that pre-midnight equatorial plasma irregularities are more often detected during solar maximum than the solar minimum (e.g., [19,39]) while some other studies (e.g., [40,41]) indicated that post-midnight plasma irregularities have a higher occurrence rate during low solar activity periods. Thus, if combining pre-midnight and post-midnight plasma irregularities as a whole, the overall occurrence rate will exhibit no clear increase. This phenomenology appears to be related to ionospheric electric fields in quiet conditions. In this respect, it is interesting to note that for ap ≥ 27, the occurrence maximums are much less pronounced and persist after midnight even for HSA. This could be due to the fact that Kp values in the range 4–6 (which are the prevailing conditions in our dataset for ap ≥ 27, i.e., Kp ≥ 4) usually correspond to a mixture of main and recovery phases of the geomagnetic storms, when the electrodynamics are not very clear [41].
Links with geomagnetic activity are unclear. As reported by other authors (see, e.g., [16] and references therein), in some cases irregularities occur and intensify, while in others they appear inhibited. In the South American sector, during the Halloween super storms of 29–30 October 2003, generation of plasma bubbles was reported at the equator, extending to ~2500 km over the equator. In the Indian sector, a study based on the analysis of five storms reported intensification in some cases and inhibition in other cases. Different authors identified a modulation of the growth rate of CRT instability and consequent impact on spread F occurrence, caused by enhanced neutral density during magnetically disturbed periods. In the present study, a connection with geomagnetic activity (i.e., increased incidence of spread F [41]) is only clear for ap ≥ 27, particularly during the local summer season (see Figure 5).
Autoscala was designed from the beginning with the aim of discarding bad quality ionograms in order to avoid generating incorrect data. The implementation of a routine for automatic identification of spread F makes this feature even more effective, enabling correct classification of ionograms [34]. This is why no hmF2 value is provided when spread F is detected. However, Autoscala is capable of identifying the uplift of the F2 layer before EPBs fully develop making an ionogram uninterpretable. Indeed, the post-sunset hmF2 rise prior to spread F occurrence is detected by Autoscala under disturbed conditions (Figure 6b,c), and to a lesser extent also under quiet conditions (Figure 6a).
A comparison of Figure 7a,c shows that hmF2 diurnal variation and occurrence of spread F in local winter are significantly lower than in local summer. Figure 7b,d also reveal that in cases in which spread F is extremely marked during the night, hmF2 maintains a higher value into the subsequent morning hours.
Figure 8a shows the evolution of hmF2 in a case for which Autoscala did not identify any spread F, while Figure 8b shows the same evolution during a night when high occurrence of spread F was detected. These figures highlight how Autoscala is able to detect the typical hourly evolution of hmF2, which appears different on nights when ESF is not automatically detected, compared to nights strongly affected by ESF, because the latter exhibit an uplift of the F2 layer before spread F occurrence is observed. Comparison with the interpretations of a skilled operator confirmed the effective ability of Autoscala to detect the presence of spread F.

4. Conclusions

The basic objective of automatic ionogram scaling software is to achieve a reasonable emulation of how operators manually scale ionograms, primarily for real-time ionosphere monitoring. This paper demonstrates that Autoscala can also be used in a post processing mode to perform a massive statistical analysis of spread F occurrence at a low-latitude station. Indeed, when applied to a large number of ionograms recorded at Tucumán, it successfully detected the most relevant climatological characteristics of spread F, which are maximum occurrence in local summer, and a connection with geomagnetic activity. It was also demonstrated that Autoscala can consistently detect the temporal evolution and uplift of hmF2 before spread F appears. This massive data analysis also revealed some other notable features, as follows.
  • The maximum occurrence of spread F, which for LSA is after midnight, tends to shift before midnight during HSA, except under highly disturbed conditions.
  • The increased occurrence of spread F related to disturbed geomagnetic conditions is only observed when ap ≥ 27, in particular close to the local summer solstice.
  • No direct connection emerged between spread F occurrence and solar activity.
  • When spread F is extremely marked during the night, hmF2 still exhibits higher values the following morning, particularly during the equinoctial periods.
Finally, it should be noted that this method could also be usefully applied to data from other equatorial and low-latitude ionospheric stations to develop the climatology of equatorial spread F on a global scale, in order to deepen the knowledge of low-latitude ionospheric irregularities, and their effects on radio signals. This could positively affect research and applications in many fields, including geodesy, and positioning and navigation systems.

Author Contributions

Conceptualization, C.S.; methodology, C.S.; software, C.S.; validation, C.S.; formal analysis, C.S. and D.S.; investigation, C.S.; resources, C.S.; data curation, C.S. and D.S.; writing—original draft preparation, C.S. and D.S.; writing—review and editing, C.S. and D.S.; visualization, C.S. and D.S.; supervision, C.S.; project administration, C.S. All authors have read and agreed to the published version of the manuscript.

Funding

This research received no external funding.

Data Availability Statement

For this study the following publicly available datasets have been used.
  • electronic Space Weather upper atmosphere (eSWua) of the Istituto Nazionale di Geofisica e Vulcanologia (INGV) [42], accessed on 8 October 2021: ionosonde data.
  • National Environmental Satellite Data and Information Service/National Centers for Environmental Information (NESDIS/NCEI) of the National Oceanic and Atmospheric Administration (NOAA) (https://www.ngdc.noaa.gov/stp/geomag/kp_ap.html, accessed on 8 October 2021), geomagnetic data.

Acknowledgments

The above listed instances are acknowledged for their data services.

Conflicts of Interest

The authors declare no conflict of interest.

References

  1. Lynch, C. Big data: How do your data grow? Nature 2008, 455, 28–29. [Google Scholar] [CrossRef]
  2. Davies, K. Ionospheric Radio; IEE Electromagnetic Waves Series 31; Peter Peregrinus Ltd., on Behalf of the Institution of Electrical Engineers: London, UK, 1990; p. 580. ISBN 0-86341-186-X. [Google Scholar]
  3. Pezzopane, M.; Scotto, C. Massive statistical analysis of autoscaled data: The case of the double reflection signature in mid-latitude vertical ionograms. J. Atmos. Sol.-Terr. Phy. 2013, 97, 43–49. [Google Scholar] [CrossRef] [Green Version]
  4. Reinisch, B.W.; Huang, X. Automatic calculation of electron density profiles from digital ionograms: 3. Processing of bottomside ionograms. Radio Sci. 1983, 18, 477–492. [Google Scholar] [CrossRef]
  5. Fox, M.W.; Blundell, C. Automatic scaling of digital ionograms. Radio Sci. 1989, 24, 747–761. [Google Scholar] [CrossRef]
  6. Igi, S.; Nozaki, K.; Nagayama, M.; Ohtani, A.; Kato, H.; Igarashi, K. Automatic ionogram processing systems in Japan. In Proceedings of the Session G6 at the XXIVth General Assembly of the International Union of Radio Science (URSI), Kyoto, Japan, 25 August–2 September 1993; International Union of Radio Science: Ghent, Belgium, 1993. [Google Scholar]
  7. Tsai, L.C.; Berkey, F.T. Ionogram analysis using fuzzy segmentation and connectedness techniques. Radio Sci. 2000, 35, 1173–1186. [Google Scholar] [CrossRef] [Green Version]
  8. Zabotin, N.A.; Wright, J.W.; Zhbankov, G.A. NeXtYZ: Three-dimensional electron density inversion for dynasonde ionograms. Radio Sci. 2006, 41, RS6S32. [Google Scholar] [CrossRef] [Green Version]
  9. Ding, Z.; Ning, B.; Wan, W.; Liu, L. Automatic scaling of F2-layer parameters from ionograms based on the empirical orthogonal function (EOF) analysis of ionospheric electron density. Earth Planets Space 2007, 59, 51–58. [Google Scholar] [CrossRef] [Green Version]
  10. Su, F.; Zhao, Z.; Li, S.; Yao, M.; Chen, G.; Zhou, Y. Signal identification and trace extraction for the vertical ionogram. IEEE Geosci. Remote Sens. Lett. 2012, 9, 1031–1035. [Google Scholar] [CrossRef]
  11. Pillat, V.G.; Guimaraes, L.N.F.; Fagundes, P.R. A computational tool for ionosonde CADI’s ionogram analysis. Comput. Geosci. 2013, 52, 372–378. [Google Scholar] [CrossRef]
  12. Zheng, H.; Ji, G.; Wang, G.; Zhao, Z.; He, S. Automatic scaling of F layer from ionograms based on image processing and analysis. J. Atmos. Sol.-Terr. Phy. 2013, 105–106, 110–118. [Google Scholar] [CrossRef]
  13. Chen, Z.; Gong, Z.; Zhang, F.; Fang, G. A new ionogram automatic scaling method. Radio Sci. 2018, 53, 1149–1164. [Google Scholar] [CrossRef]
  14. Xiao, Z.; Wang, J.; Li, J.; Zhao, B.; Hu, L.; Libo Liu, L. Deep-learning for ionogram automatic scaling. Adv. Space Res. 2020, 66, 942–950. [Google Scholar] [CrossRef]
  15. Abdu, M.A. Equatorial ionosphere–thermosphere system: Electrodynamics and irregularities. Adv. Space Res. 2005, 35, 771–787. [Google Scholar] [CrossRef]
  16. Balan, N.; Liu, L.; Le, H. A brief review of equatorial ionization anomaly and ionospheric irregularities. Earth Planet. Phys. 2018, 2, 257–275. [Google Scholar] [CrossRef]
  17. Shi, J.K.; Wang, G.J.; Reinisch, B.W.; Shang, S.P.; Wang, X.; Zherebotsov, G.; Potekhin, A. Relationship between strong range spread F and ionospheric scintillations observed in Hainan from 2003 to 2007. J. Geophys. Res. Space Phys. 2011, 116, A08306. [Google Scholar] [CrossRef]
  18. Alfonsi, L.; Spogli, L.; Pezzopane, M.; Romano, V.; Zuccheretti, E.; De Franceschi, G.; Cabrera, M.A.; Ezquer, R.G. Comparative analysis of spread-F signature and GPS scintillation occurrences at Tucumán, Argentina. J. Geophys. Res. Space Phys. 2013, 118, 4483–4502. [Google Scholar] [CrossRef] [Green Version]
  19. Kepkar, A.; Arras, C.; Wickert, J.; Schuh, H.; Alizadeh, M.; Tsai, L.-C. Occurrence climatology of equatorial plasma bubbles derived using FormoSat-3 ∕ COSMIC GPS radio occultation data. Ann. Geophys. 2020, 38, 611–623. [Google Scholar] [CrossRef]
  20. Piggott, W.R.; Rawer, K.U.R.S.I. Handbook of Ionogram: Interpretation and Reduction; US Department of Commerce National Oceanic and Atmospheric Administration-Environmental Data Service: Asheville, NC, USA, 1972.
  21. Scotto, C.; Pezzopane, M. A software for automatic scaling of foF2 and MUF(3000)F2 from ionograms. In Proceedings of the XXVIIth General Assembly of the International Union of Radio Science (URSI), Maastricht, The Netherlands, 17–24 August 2002. [Google Scholar]
  22. Scotto, C. Electron density profile calculation technique for Autoscala ionogram analysis. Adv. Space Res. 2009, 44, 756–766. [Google Scholar] [CrossRef]
  23. Balsley, B.B.; Haerendel, G.; Greenwald, R.A. Equatorial spread F: Recent observations and a new interpretation. J. Geophys. Res. 1972, 77, 5625–5628. [Google Scholar] [CrossRef]
  24. Haerendel, G. Rayleigh-Taylor instability as cause of equatorial spread-F. Trans. Am. Geophys. Union 1972, 53, 1082. [Google Scholar]
  25. Makela, J.J.; Kelley, M.C.; de la Beaujardiére, O. Convective Ionospheric Storms: A Major Space Weather Problem. Space Weather 2006, 4. [Google Scholar] [CrossRef]
  26. Abadi, P.; Otsuka, Y.; Tsugawa, T. Effects of pre-reversal enhancement of E × B drift on the latitudinal extension of plasma bubble in Southeast Asia. Earth Planet. Space 2015, 67, 74. [Google Scholar] [CrossRef] [Green Version]
  27. Adebesin, B.O.; Rabiu, A.B.; Adeniyi, J.O.; Amory-Mazaudier, C. Nighttime morphology of vertical plasma drifts at Ouagadougou during different seasons and phases of sunspot cycles 20–22. J. Geophys. Res. Space Phys. 2015, 120, 10020–10038. [Google Scholar] [CrossRef] [Green Version]
  28. Resende, L.C.A.; Denardini, C.M.; Picanço, G.A.S.; Moro, J.; Barros, D.; Figueiredo, C.A.O.B.; Silva, R.P. On developing a new ionospheric plasma index for Brazilian equatorial F region irregularities. Ann. Geophys. 2019, 37, 807–818. [Google Scholar] [CrossRef] [Green Version]
  29. Sousasantos, J.; Kherani, E.A.; Sobral, J.H.A. An alternative possibility to equatorial plasma bubble forecasting through mathematical modeling and Digisonde data. J. Geophys. Res. Space Phys. 2017, 122, 2079–2088. [Google Scholar] [CrossRef]
  30. Reinisch, B.W.; Huang, X.; Galkin, I.A.; Paznukhov, V.; Kozlov, A. Recent advances in real-time analysis of ionograms and ionospheric drift measurements with digisondes. J. Atmos. Sol.-Terr. Phy. 2005, 67, 1054–1062. [Google Scholar] [CrossRef]
  31. Bhaneja, P.; Earle, G.D.; Bishop, R.L.; Bullett, T.W.; Mabie, J.; Redmon, R. A statistical study of midlatitude spread F at Wallops Island, Virginia. J. Geophys. Res. Space Phys. 2009, 114, A04301. [Google Scholar] [CrossRef] [Green Version]
  32. Pillat, V.G.; Fagundes, P.R.; Guimarães, L.N.F. Automatically identification of Equatorial Spread-F occurrence on ionograms. J. Atmos. Sol. Terr. Phys. 2015, 135, 118–125. [Google Scholar] [CrossRef]
  33. Lan, T.; Hu, H.; Jiang, C.; Yang, G.; Zhao, Z. A comparative study of decision tree, random forest, and convolutional neural network for spread-F identification. Adv. Space Res. 2020, 65, 2052–2061. [Google Scholar] [CrossRef]
  34. Scotto, C.; Ippolito, A.; Sabbagh, D. A method for automatic detection of equatorial spread-F in Ionograms. Adv. Space Res. 2019, 63, 337–342. [Google Scholar] [CrossRef]
  35. Zuccheretti, E.; Tutone, G.; Sciacca, U.; Bianchi, C.; Arokiasamy, B.J. The new AIS-INGV digital ionosonde. Ann. Geophys. 2003, 46, 647–659. [Google Scholar] [CrossRef]
  36. Scotto, C.; Sabbagh, D. Improvements in bottomside electron density definition in the Autoscala program. Adv. Space Res. 2020, 65, 1432–1438. [Google Scholar] [CrossRef]
  37. Tsunoda, R.T. Magnetic-field-aligned characteristics of plasma bubbles in the nighttime equatorial ionosphere. J. Atmos. Terr. Phys. 1980, 42, 743–752. [Google Scholar] [CrossRef]
  38. Tsunoda, R.T. Control of the seasonal and longitudinal occurrence of equatorial scintillations by the longitudinal gradient in integrated E region Pedersen conductivity. J. Geophys. Res. Space Phys. 1985, 90, 447–456. [Google Scholar] [CrossRef]
  39. Carter, B.A.; Zhang, K.; Norman, R.; Kumar, V.V.; Kumar, S. On the occurrence of equatorial F-region irregularities during solar minimum using radio occultation measurements. J. Geophys. Res. Space Phys. 2013, 118, 892–904. [Google Scholar] [CrossRef]
  40. Smith, J.; Heelis, R.A. Equatorial plasma bubbles: Variations of occurrence and spatial scale in local time, longitude, season, and solar activity. J. Geophys. Res. Space Phys. 2017, 122, 5743–5755. [Google Scholar] [CrossRef]
  41. Aa, E.; Zou, S.; Liu, S. Statistical analysis of equatorial plasma irregularities retrieved from Swarm 2013–2019 observations. J. Geophys. Res. Space Phys. 2020, 125, e2019JA027022. [Google Scholar] [CrossRef]
  42. Upper atmosphere physics and radiopropagation Working Group; Marcocci, C.; Pezzopane, M.; Pica, E.; Romano, V.; Sabbagh, D.; Scotto, C.; Zuccheretti, E. Electronic Space Weather Upper Atmosphere Database (eSWua)—HF Data; Version 1.0; Istituto Nazionale di Geofisica e Vulcanologia (INGV): Rome, Italy, 2020. [Google Scholar] [CrossRef]
Figure 1. Example of ionograms largely affected by spread F, recorded at the ionospheric station of Tucumán (26.9° S, 294.6° E) on 11 December 2016 at 5.00 UT (a), and on 8 December 2016 at 10.50 UT (b). As reported in the right-side tables, no outputs are given by Autoscala software for the ionogram in panel (a), while erroneous outputs are given for the ionogram in panel (b), due to the presence of spread F. The red curve represents the reconstructed ionogram trace, while the magenta line is the restored plasma frequency vertical profile.
Atmosphere 12 01351 g001
Figure 2. The occurrence of spread F as a function of LT in 2014 (HSA) (a), 2016 (MSA) (b), and 2018 (LSA) (c), for ap < 7. Only the histograms derived from more than 80 cases of spread F are shown.
Atmosphere 12 01351 g002
Figure 3. The occurrence of spread F as a function of LT in 2014 (HSA) (a), 2016 (MSA) (b), and 2018 (LSA) (c), for 7 ≤ ap < 27. Only the histograms derived from more than 80 cases of spread F are shown.
Atmosphere 12 01351 g003
Figure 4. The occurrence of spread F as a function of LT in 2014 (HSA) (a), 2016 (MSA) (b), and 2018 (LSA) (c), for ap ≥ 27. Only the histograms derived from more than 80 cases of spread F are shown.
Atmosphere 12 01351 g004
Figure 5. The occurrence of spread F as a function of different years, representing different levels of solar activity, during different periods of the year, and under different levels of geomagnetic activity: (a) quiet conditions, (b) moderately disturbed conditions, and (c) highly disturbed conditions. Only the histograms derived from more than 80 cases of spread F are shown.
Atmosphere 12 01351 g005
Figure 6. Overlapping hmF2 trends as a function of LT for the days in which spread F was not observed (blue dots), and days in which it was observed for more than 25% of the time (red dots) under (a) quiet conditions, (b) moderately disturbed conditions, and (c) highly disturbed conditions.
Atmosphere 12 01351 g006
Figure 7. Overlapping hmF2 trends as a function of LT for the days in which spread F was not observed (blue dots), and days in which it was observed for more than 25% of the time (red dots) in (a) November, December, and January, (b) February, March, and April, (c) May, June, and July, and (d) August, September, and October.
Atmosphere 12 01351 g007
Figure 8. Graphs of hmF2 as a function of LT considering: (a) a case in which spread F was not detected by Autoscala (6 January 2014); and (b) a case in which spread F was detected by Autoscala in more than 25% of the ionograms (5 January 2014).
Atmosphere 12 01351 g008
Publisher’s Note: MDPI stays neutral with regard to jurisdictional claims in published maps and institutional affiliations.