Article

Quantitative Precipitation Forecasting Using an Improved Probability-Matching Method and Its Application to a Typhoon Event

1
Hunan Meteorological Observatory, Changsha 410118, China
2
Institute of Tropical and Marine Meteorology/Guangdong Provincial Key Laboratory of Regional Numerical Weather Prediction, CMA, Guangzhou 510641, China
3
Heavy Rain and Drought Flood Disasters in Plateau and Basin Key Laboratory of Sichuan, Chengdu 610072, China
4
Hunan Key Laboratory of Meteorological Disaster Prevention and Reduction, Changsha 410118, China
5
College of Oceanic and Atmospheric Sciences, Ocean University of China, Qingdao 266100, China
*
Author to whom correspondence should be addressed.
Atmosphere 2021, 12(10), 1346; https://doi.org/10.3390/atmos12101346
Submission received: 8 September 2021 / Revised: 10 October 2021 / Accepted: 13 October 2021 / Published: 14 October 2021

Abstract

:
This present study aims to explore how forecasters can quickly make accurate predictions by using various high-resolution model forecasts. Based on three high temporal-spatial resolution (3 km, hourly) numerical weather prediction models (CMA-MESO, CMA-GD, CMA-SH3) from the China Meteorological Administration (CMA), the hourly precipitation characteristics of three model within 24 h from March to September 2020 are discussed and integrated into a single, hourly, deterministic quantitative precipitation forecast (QPF) by making use of an improved weighted moving average probability-matching method (WPM). The results are as follows: (1) In non-rainstorm forecasts, CMA-MESO and CMA-GD have similar forecast abilities. However, in rainstorm forecasts, CMA-MESO has a notable advantage over the other two models. Thus, CMA-MESO is selected as a critical factor when participating in sensitivity experiments. (2) Compared with the traditional equal-weight probability-matching method (PM), the WPM improves the different grade QPF because it can effectively reduce rainfall pattern bias by making use of the weighted moving average (WMA). Additionally, the WPM threat score in rainstorm forecast similarly improved from 0.051 to 0.056, with a 9.8% increase relative to the PM. (3) The sensitivity experiments show that an optimal rainfall intensity score (WPM-best) can further improve the QPF and overcome all single models in both rainstorm and non-rainstorm forecasts, and the WPM-best has a rainstorm threat score skill of 0.062, with an increase of 21.6% compared with the PM. The performance of the WPM-best will be better if the precipitation intensity is stronger and the valid forecast periods is longer. It should be noted that there is no need to select models before using the WPM-best method, because WPM-best can give a very low weight to the less-skillful model in a more objective way. (4) The improved WPM method is also applied to investigate the heavy-rainfall case induced by typhoon Mekkhala (2020), where the improved WPM technique significantly improves rainstorm forecasting ability compared with a single model.

1. Introduction

High-resolution numerical weather prediction (NWP) models have been continuously improved with the rapid development of computers, and the models’ forecasting performance have steadily increased. However, weather forecasters may face some new challenges in operational applications. One crucial issue is that the precipitation products by almost all NWP models have considerable forecast errors and have trouble to accurately forecast the precipitation intensity [1]. Thus, how to eliminate these biases has yet to be addressed in the improvement of NWP skills. Many studies have demonstrated that the development of post-processing techniques can effectively reduce systematic bias [2,3]. For example, the model output statistics (MOS) technique can enhance quantitative precipitation forecast (QPF) skills [4,5], and quantile mapping algorithms are effective in removing historical biases relative to observations [6]. In recent years, Zhu and Luo [7] employed a frequency-matching method (FM) to produce a more realistic rainfall forecast based on frequency distributions of forecast and observations. Wu et al. [8] showed that the optimal threat score-based correction algorithm (OTS) is superior to all lead times, single models, and multi-model means.
Another critical issue to consider is how forecasters can develop a more scientific decision-making process by selecting the most appropriate prediction factors from several products of high-resolution models or ensemble forecasts. Various techniques have therefore been proposed to solve this problem [9,10,11]. For example, Primo et al. [12] showed that logistic regression is preferable to linear methods in more flexibly calibrating probabilistic forecasts. Messner and Mayr [13] demonstrated that the analog methods by which current forecasts can be corrected by utilizing past ensemble forecasts errors were assumed to form an improved forecast. Qi et al. [14] proposed that tropical cyclone track forecasts using the ensemble mean method, which selected prediction members based on errors at short lead times, were better than that using deterministic model predictions. In addition, several studies have demonstrated that combining different forecasts with more than one NWP model can effectively improve QPF [15,16]. For instance, Ebert [17] pointed out that the PM method could improve the rain pattern and the event hit rate. This can be utilized as an alternative to the traditional ensemble mean precipitation to retain the amplitude of the simulated model features [18]. Fang [19] developed a modified PM technique to adjust rainfall pattern with a large-size, low-resolution ensemble, and to adjust the rainfall frequency distribution with a small-size, high-resolution ensemble, to improve the landfall typhoon rainstorm forecast.
Further studies should be carried out to improve these methods, and two steps are included in this paper. Initially, hourly QPF characteristics of three high-resolution models are analyzed, and multi-model calibrated ensembles are further constructed based on the FM and OTS methods. In the second step, an improved WPM method is proposed to integrate multi-model calibrated ensembles into a single, hourly, deterministic QPF. The remainder of this paper is organized as follows: Section 2 describes the data and calibration method used in this study. Section 3 investigates the statistical characteristics of multi-model hourly QPF and compares the calibration results from equal-weight PM with that from WPM. In addition, a case study is presented to demonstrate the results of WPM. A brief summary is provided in Section 4.

2. Data and Methods

2.1. Data

The observation and reanalysis datasets used in this paper are as follows. (1) The hourly observation precipitation data were provided by the China Integrated Meteorological Information Sharing System (CIMISS). In this paper, datasets from 420 high-quality stations were selected based on Hunan Province (24° N—31° N, 108° E—115° E). (2) Reanalysis products (FNL) were provided by National Centers for Environmental Prediction (NCEP). (3) The best track datasets of tropical cyclones over the western North Pacific Ocean were provided by the Shanghai Typhoon Institute (STI) of the China Meteorological Administration (CMA).
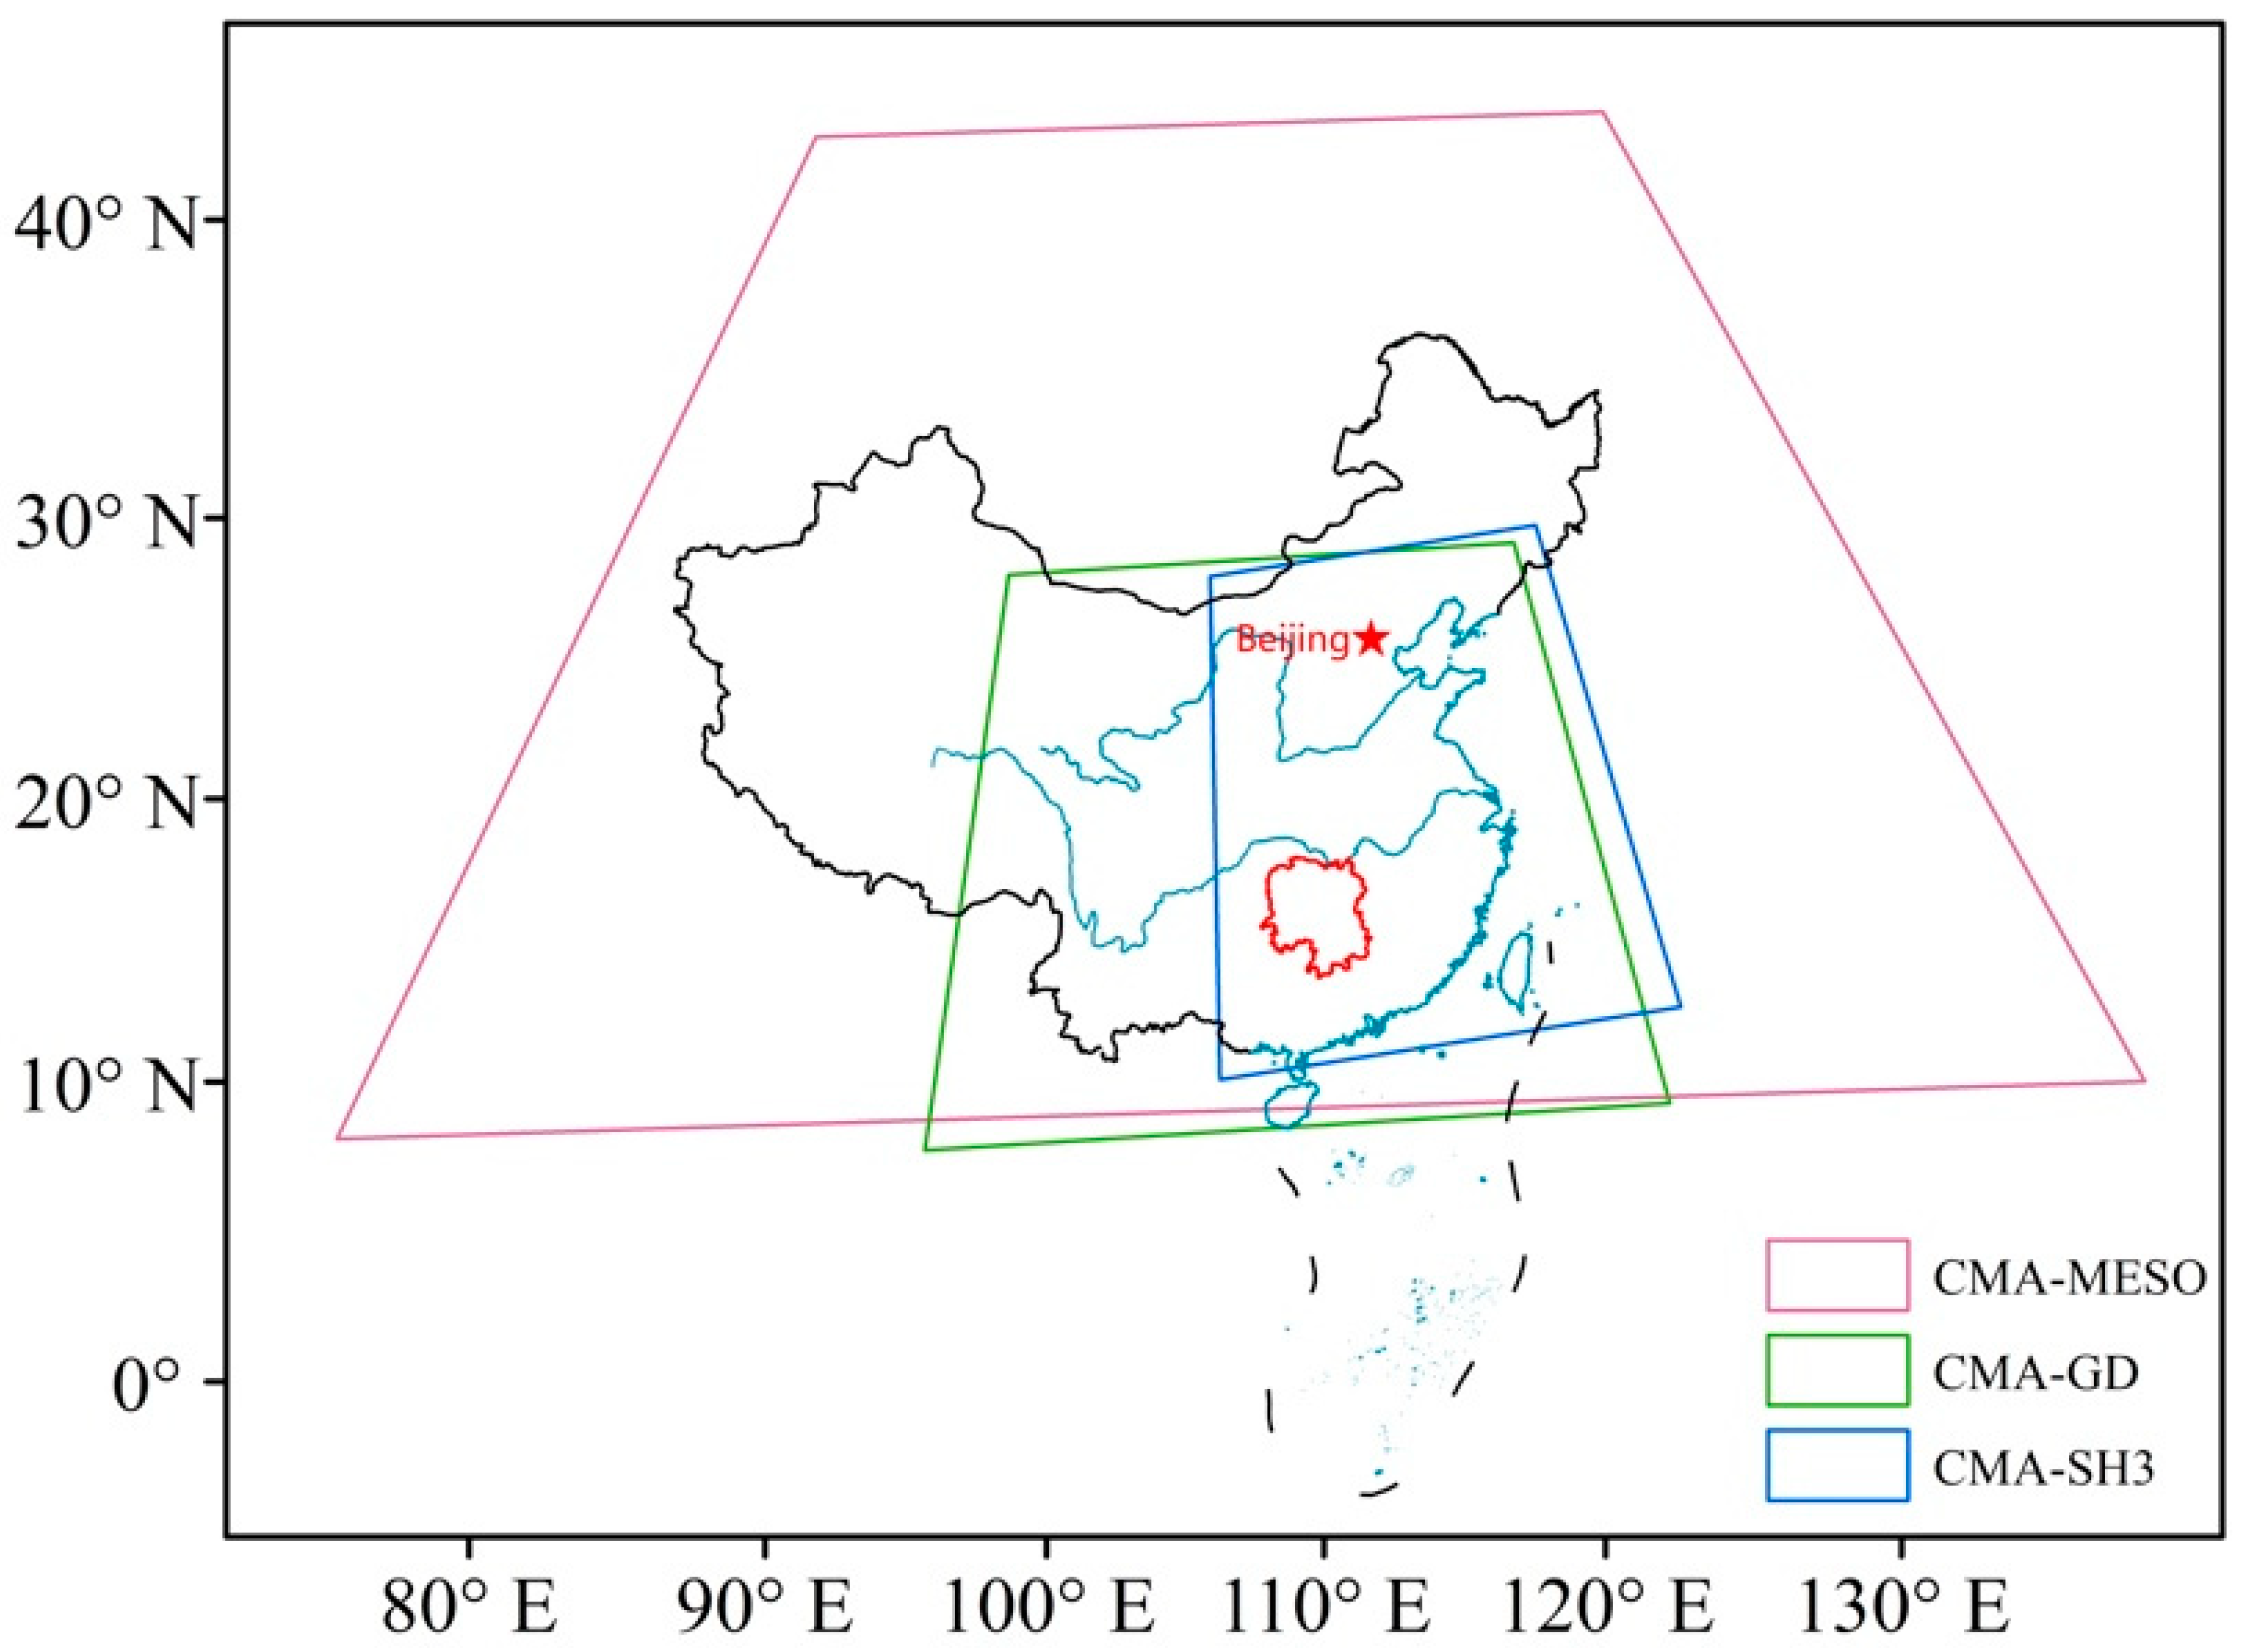
Three high temporal-spatial resolution numerical weather prediction models from CMA were used in this paper, including CMA-MESO, CMA-GD, and CMA-SH3. Table 1 lists specific information about the models. The output products of three models had the same spatial and temporal resolutions of 3 km and 1 h, respectively, and valid forecast periods of 36, 96, and 24 h. This paper selected precipitation products from March to September 2020 as multi-model ensemble members, with uniform initial forecast times of 00:00 and 12:00 UTC and a valid forecast period of 0–24 h. Based on the specific motivation of the China meteorological service business, the hourly QPF was divided into light rain (≥0.1 mm), moderate rain (≥2 mm), heavy rain (≥4 mm), and rainstorm (≥8 mm). Multi-model grid products were the nearest neighbors, interpolated to 420 stations to ensure that the comparison was consistent with observations. Figure 1 shows the domains of the three models and marks the location of Hunan Province.

2.2. Method

2.2.1. Generating Multi-Model Ensemble Members

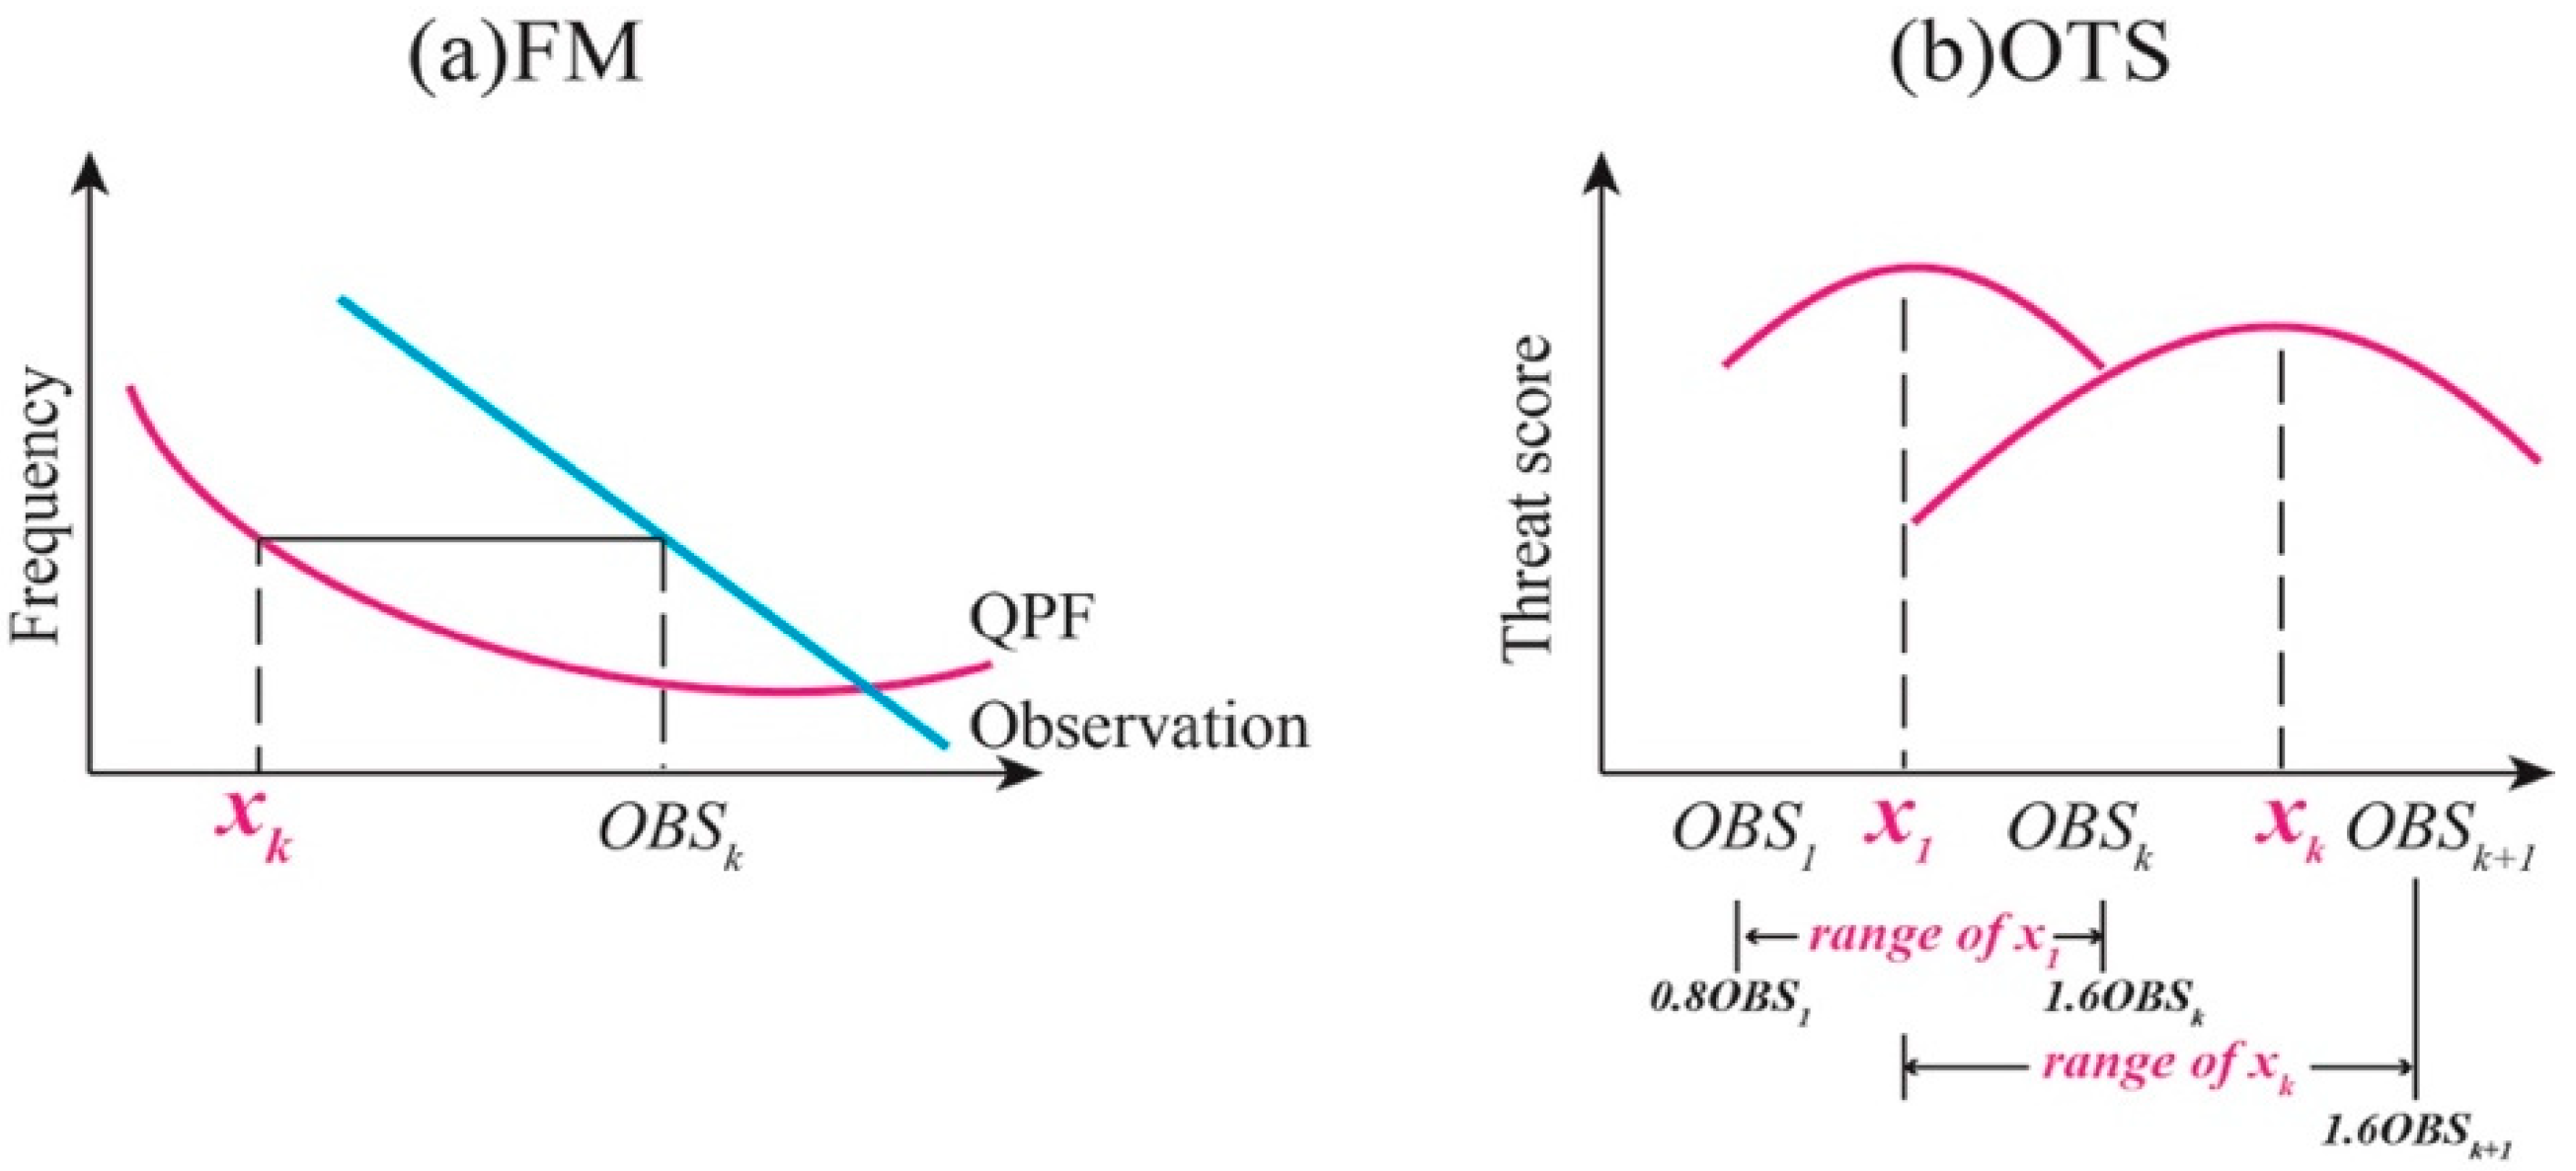
The FM technique [7] aims to eliminate the frequency deviation between QPF and the observations. The new QPF threshold has the same frequency as the observation (Figure 2a). The OTS technique [8] aims to maximize the threat score (TS). The new QPF threshold corresponds to the maximum TS (Figure 2b). Both FM and OTS have the ability to correct the precipitation intensity and are unable to correct the precipitation location bias. The calculation equation of calibrated precipitation is as follows:
y = { 0 ,     x < x 1 O B S k + ( O B S k + 1 O B S k ) x x k x k + 1 x k ,     x k x < x k + 1 x x 5 × O B S 5 ,     x x 5
where x denotes the original model precipitation; y denotes the calibrated precipitation; OBSk is the precipitation grading that selects five grades, namely, 0.1, 2, 4, 8, and 20; and xk is the new precipitation grading. For the FM method, xk is the model threshold with the same frequency as that of the observed OBSk. For OTS, xk is the model precipitation, corresponding to the maximum of TS in each grade. The training window is the last 60 days.
Using FM and OTS, the multi-model QPF intensity was corrected to construct an ensemble prediction system encompassing nine members (Table 2).

2.2.2. WPM Method and Sensitivity Experiments

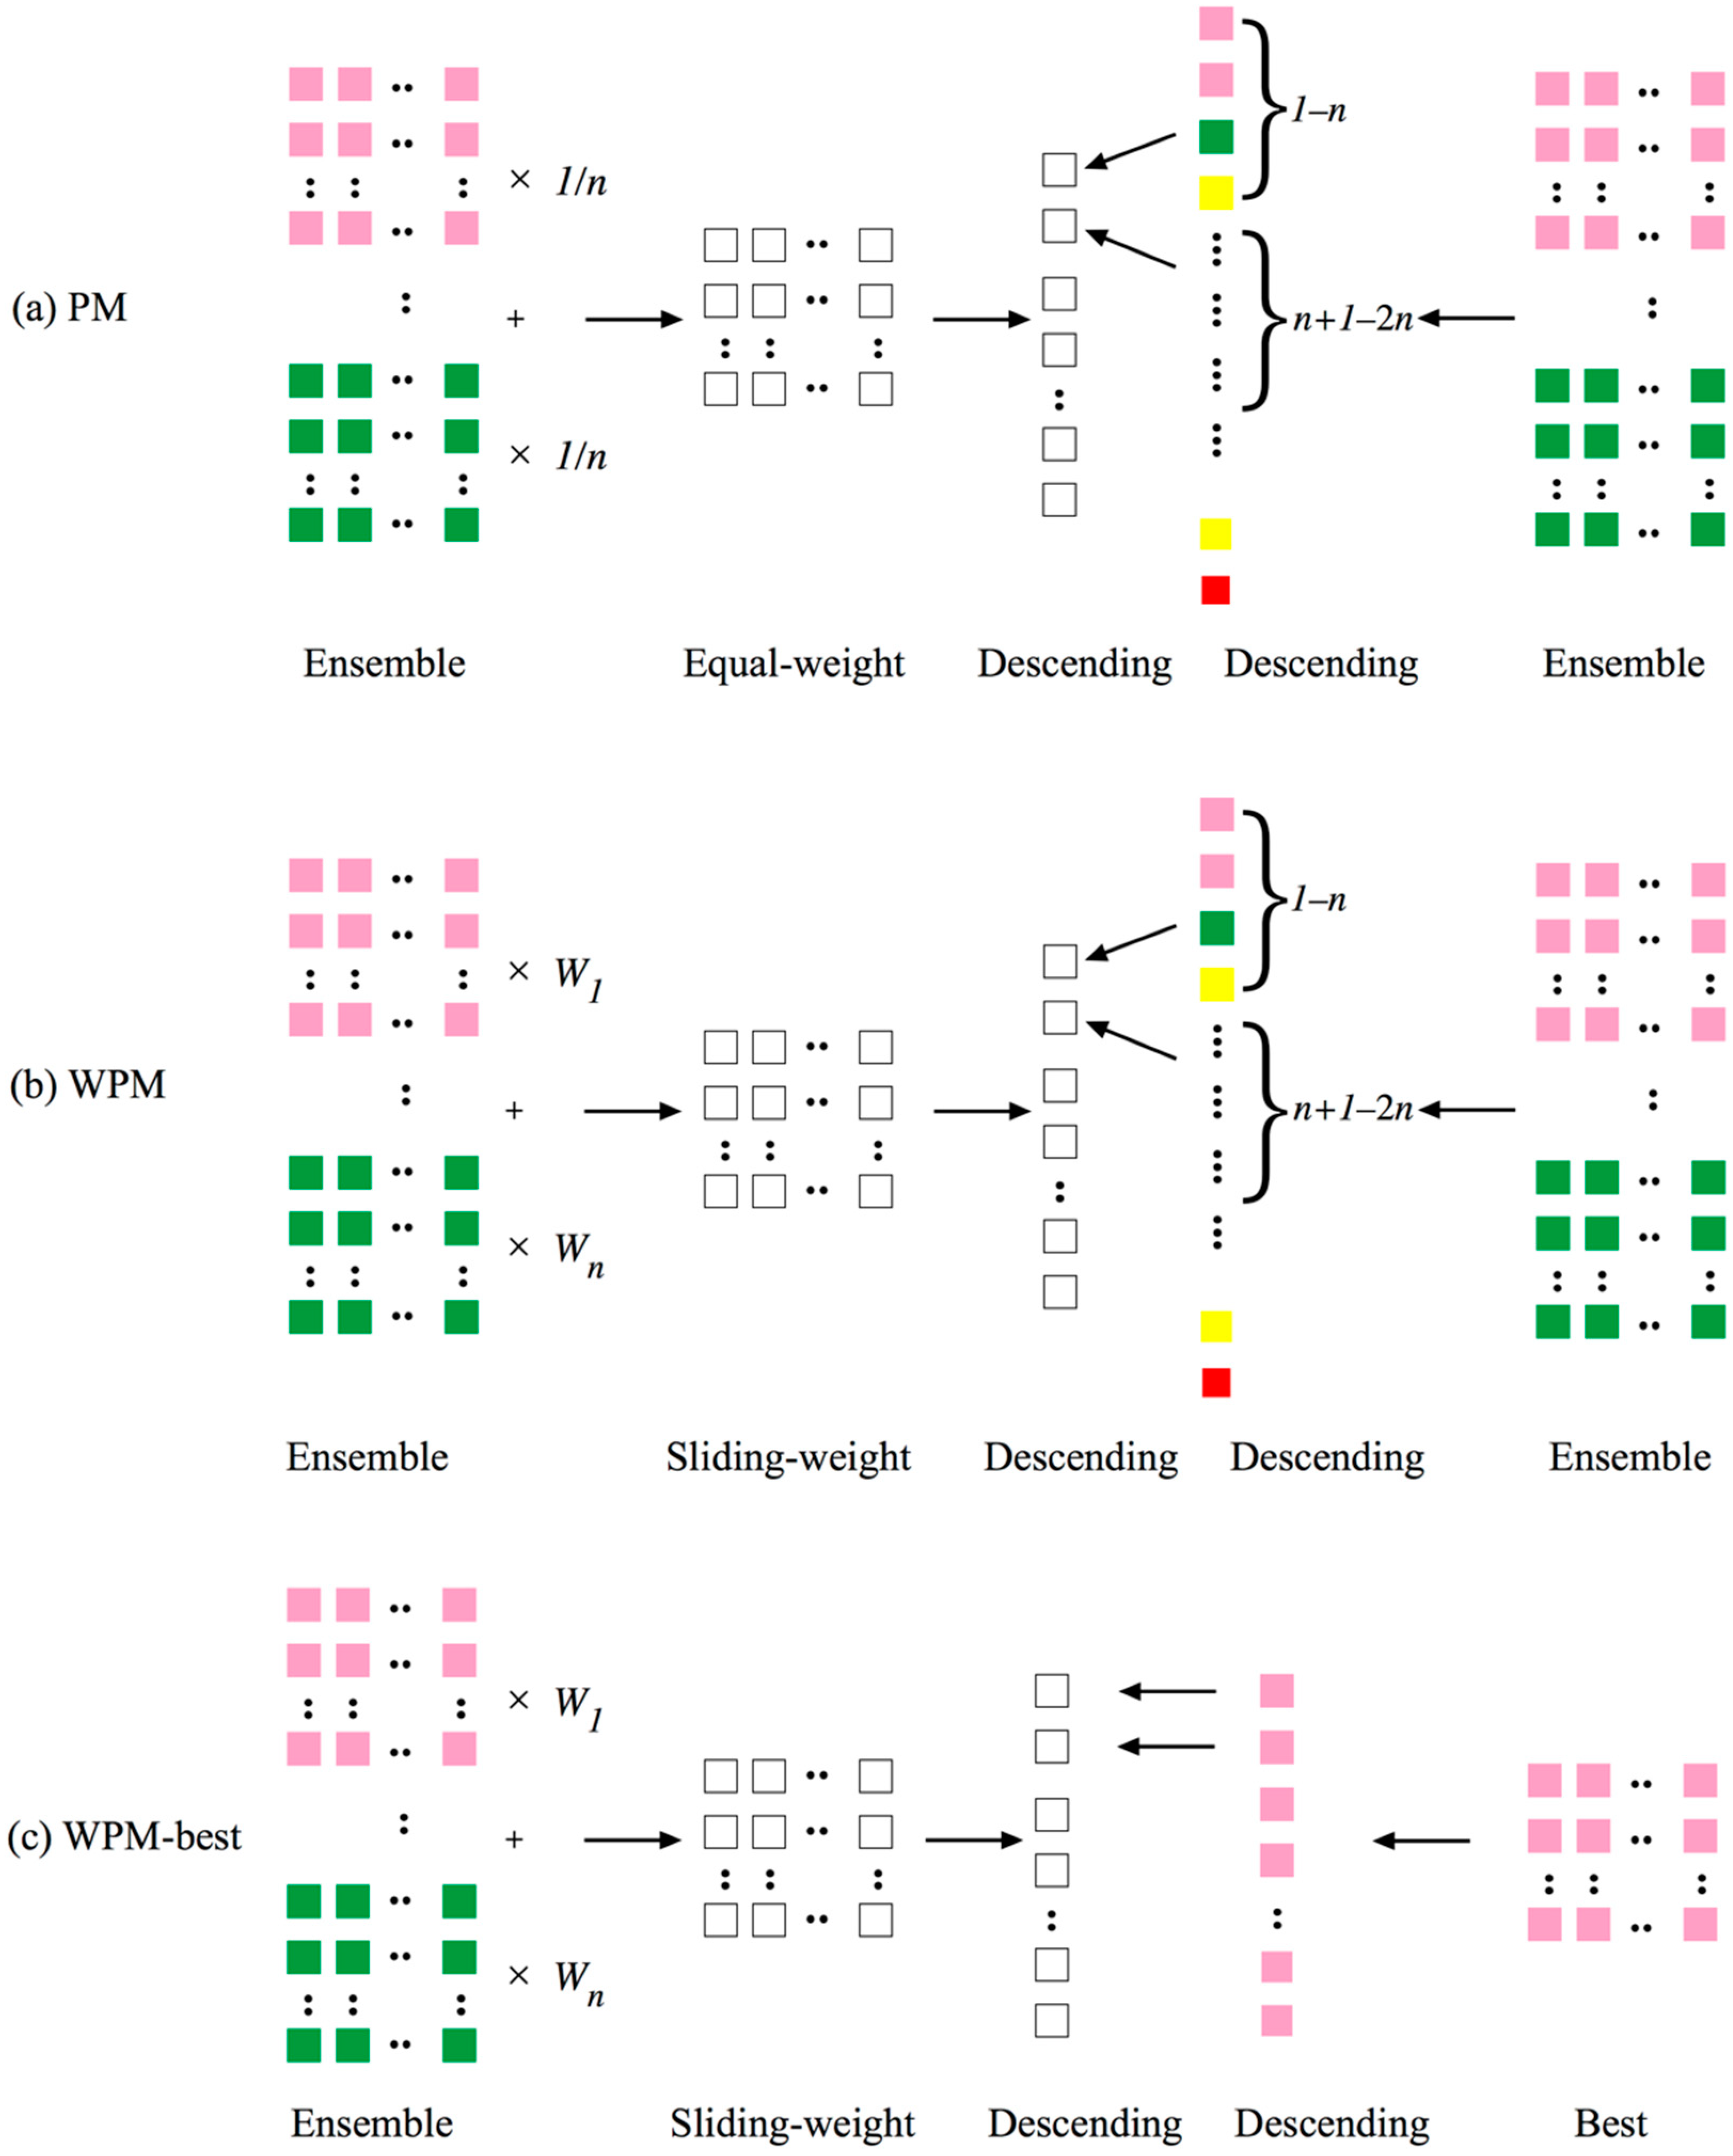
The PM method can overcome the deficiencies of the ensemble mean and can provide a more realistic rainfall forecast than that from the ensemble mean. This method is an equal-weight, multi-model calibration technique, based on the precipitation of an optimal spatial distribution using the ensemble mean. The precipitation has a higher-accuracy frequency distribution due to the ensemble members [17,18,19]. Figure 3a shows the schematic process of PM.
The WPM technique improves the precipitation distribution by replacing the equal weight in the PM method with a weighted moving average (WMA); its calculation method is shown in Figure 3b and Table 3. First, the weights of the ensemble members can be calculated by the real-time Spearman correlation coefficient (R) at each starting time during the training period. For each member, its maximum R is assumed to appear N times. The sum of maximum R during N days, divided by the sum of R-max of the population from where the sample was selected, will then be weighted. After that, the improved pattern can be obtained through a weighted average, multiplied the forecast precipitation of each member by its associated weights, and then the results are added.
However, both PM and WPM have deficiencies; strong precipitation may be weakened by using the median of the ensemble forecast; thus, sensitivity experiments using different values are designed as follows.
Sensitivity experiments: A group of comparative experiments based on the PM method using different distribution fields and values was designed for the ensemble forecast. Figure 3 and Table 4 list the details of the experiments. Specifically, the PM experiment (Figure 3a) uses the ensemble mean as the pattern and the median as the intensity; the WPM experiment (Figure 3b) uses the WMA as the pattern and the median as the intensity; the WPM-best (Figure 3c) uses the WMA as the pattern and the precipitation intensity of the optimal model as the intensity.
Furthermore, the relative advantages of having extra post-processed members and multi-models are demonstrated by applying the WPM-best method to the two optimal models (six members) and a single model (three members).

2.2.3. Verification

Verification indicators used in this paper include the threat score (TS), clear-rainy TS, probability of detection (POD), and false alarm ratio (FAR). The calculating details are provided in Table 5. Here, the clear-rainy threshold is 0.1 mm, which is the smallest detectable amount of rain gauge in China.

3. Results

3.1. Analysis of Multi-Model Hourly QPF

Figure 4a compares the TS performance of the multi-model QPF. Generally, the CMA-MESO and CMA-GD models show almost the same scores, with a maximum difference of 0.007 between them, in non-rainstorm forecasts. However, in rainstorm forecasts, the CMA-MESO model shows a notable advantage with its TS reaching 0.058, followed by the CMA-GD model (0.052). The TS of the CMA-SH3 model across each grade is invariably lower than those of the CMA-MESO and CMA-GD. In addition, notably, as the intensity of precipitation increases, the scores of all models decline, and the relative differences between these models gradually increase.
Specifically, the CMA-MESO model shows a higher POD and lower FAR, whereas the CMA-SH3 has a lower POD and higher FAR, with those of CMA-GD in between (Figure 4b,c). In light rain forecasts, the CMA-GD model has the highest POD (0.643). In other grades of rainfall, the CMA-MESO model invariably has the highest POD. The POD and FAR for the rainstorm forecasts of the CMA-MESO model are 0.152 and 0.915, respectively. As the precipitation intensity increases, the relative differences among different models gradually shrink.

3.2. Analysis of Ensemble Members

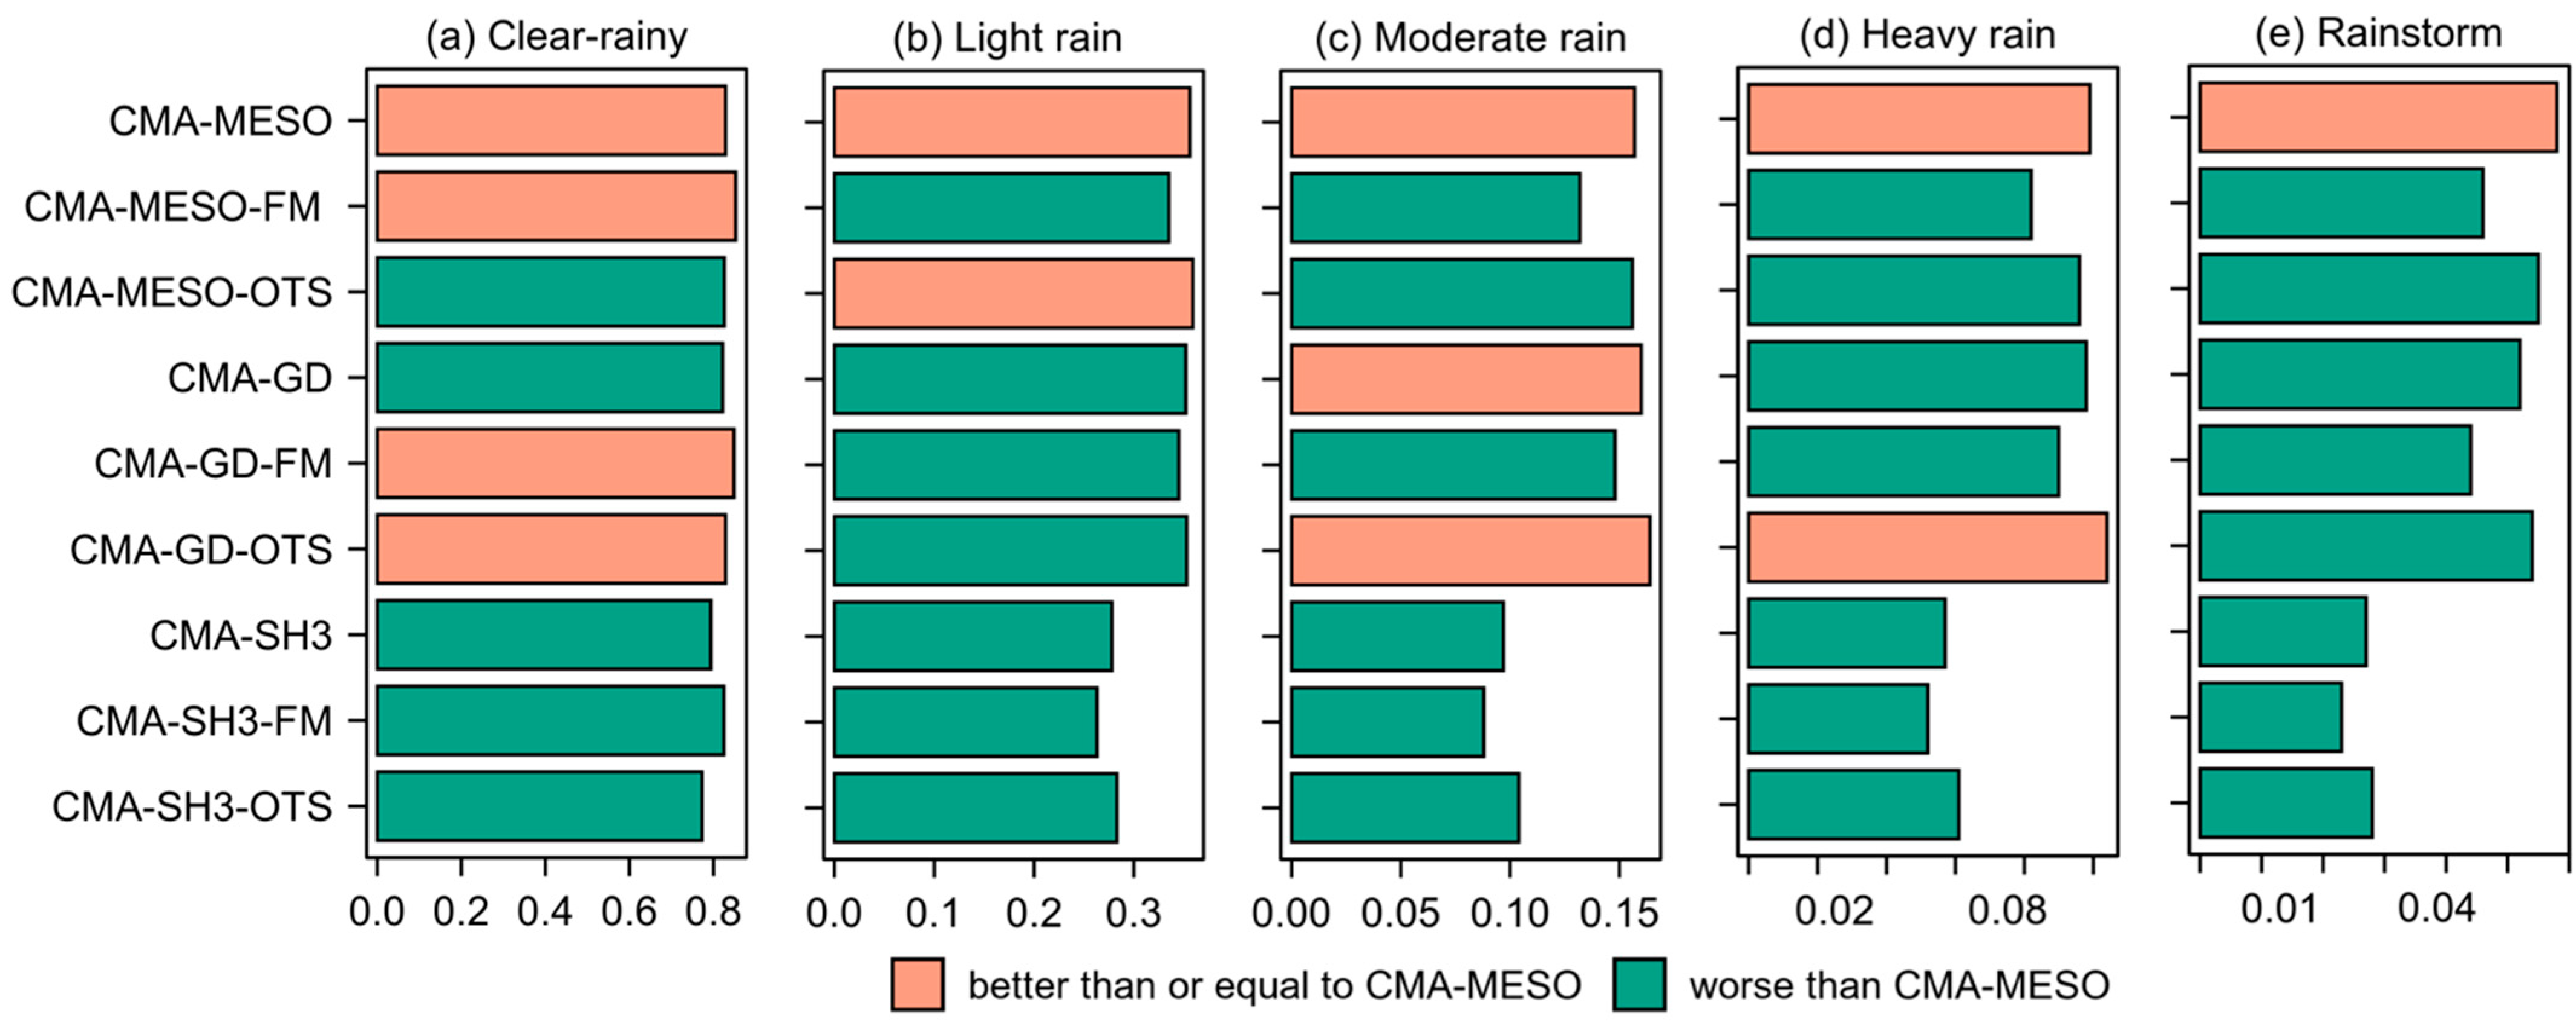
Comparing the nine ensemble members in rainstorm forecasts (Figure 5e) reveals that the CMA-MESO model has the optimal performance among all members. In non-rainstorm forecasts (Figure 5a–d), three CMA-MESO members and three CMA-GD members all have good performances. Specifically, in clear-rainy forecasts, CMA-MESO-FM has the highest TS score of 0.853, followed by CMA-GD-FM (0.849). In light rain forecasts, CMA-MESO (0.356) and CMA-MESO-OTS (0.359) show the optimal performance, with no noticeable difference. The member with the lowest score is CMA-SH3-FM (0.263), which is 26.7% lower than the highest score. In moderate and heavy rain forecasts, CMA-GD-OTS has the highest TS scores of 0.164 and 0.104, followed by CMA-MESO, with scores of 0.157 and 0.099, respectively. Combined with the analysis results in Section 3.1 (Figure 4), CMA-MESO is used as a critical factor in the sensitivity test WPM-best due to its excellent performances for both rainstorm and non-rainstorm forecasts.

3.3. Results of Sensitivity Experiments

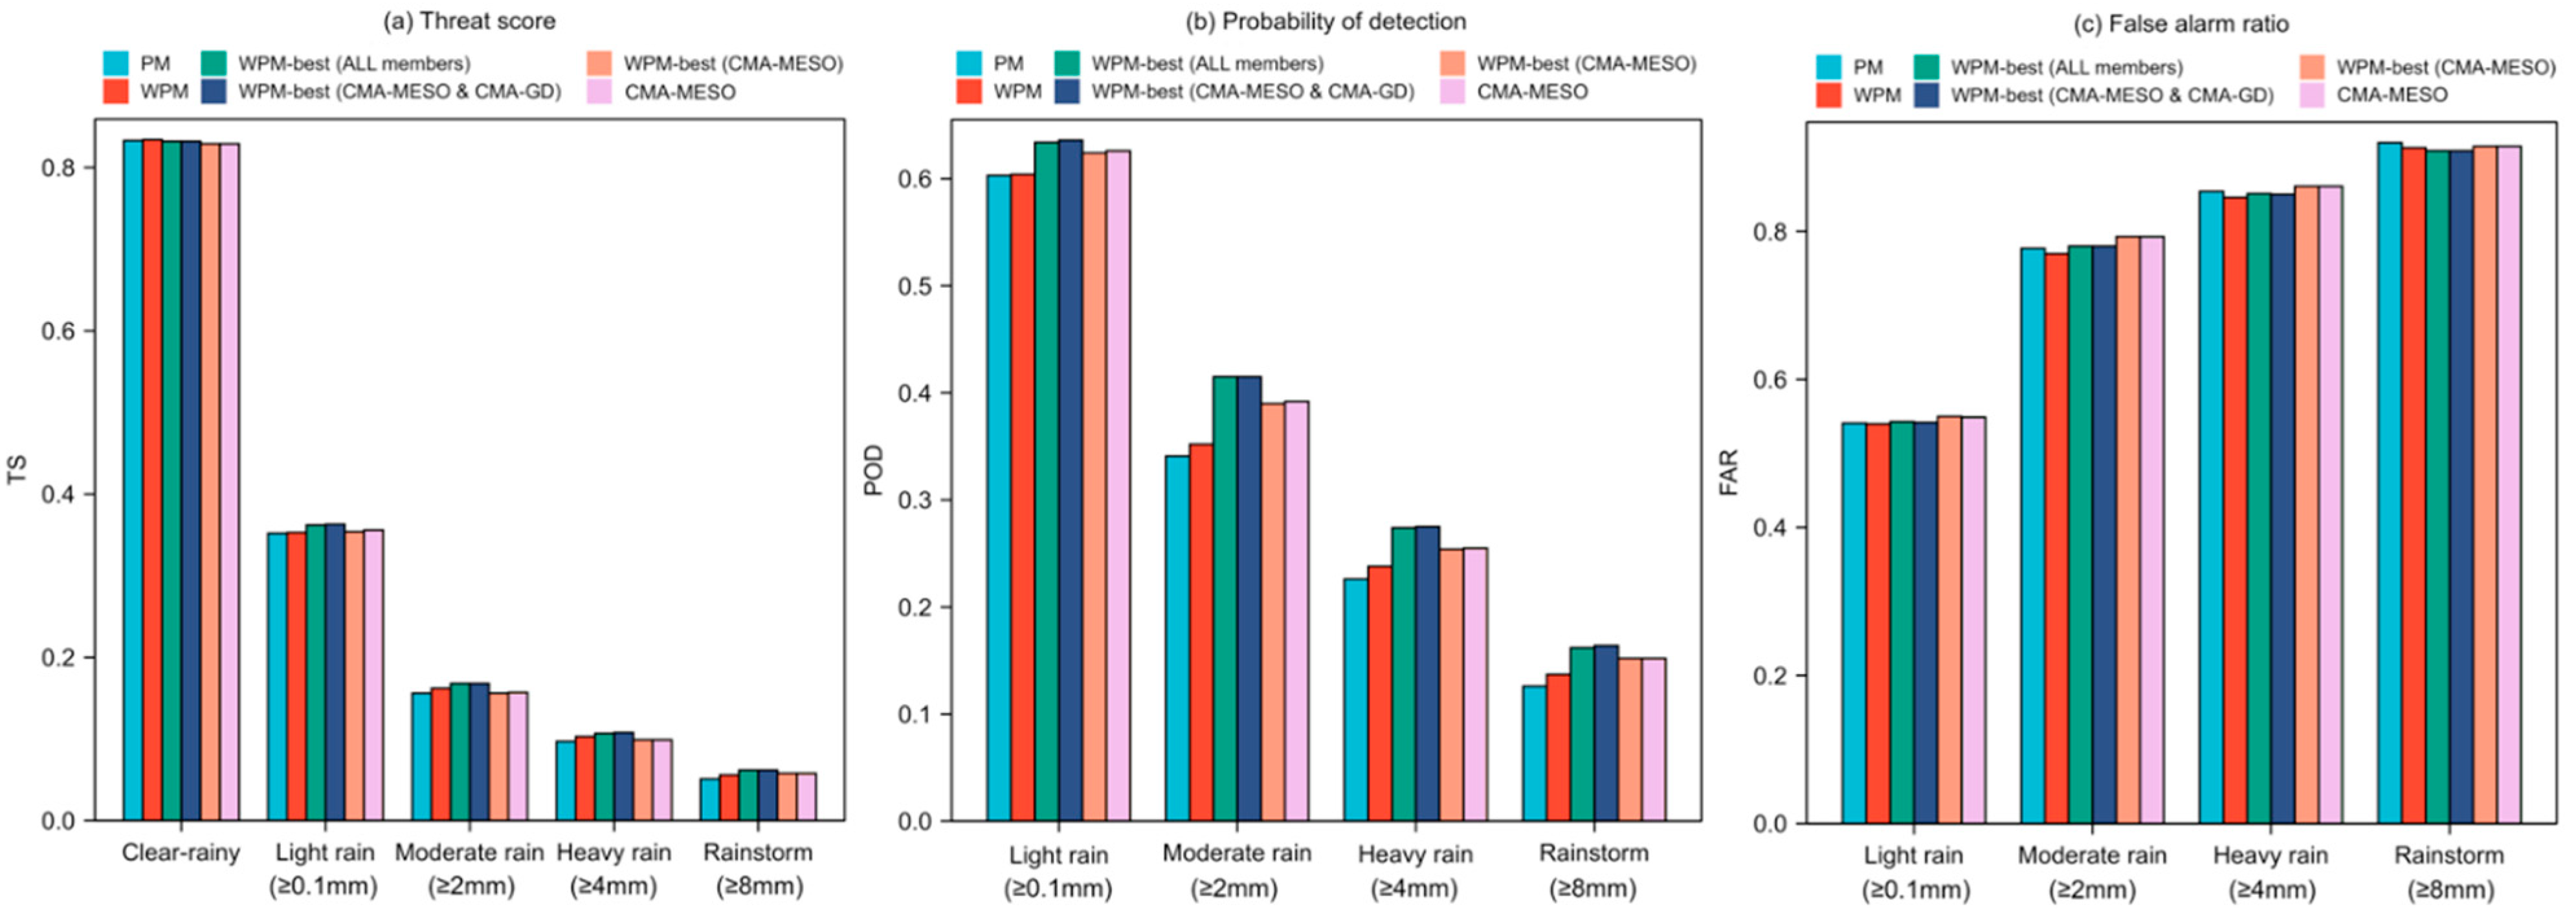
The sensitivity experiments showed that the WPM method with WMA can effectively improve precipitation forecasts across different intensities compared with the use of PM as an equal-weight calibration method (Figure 6a). Specifically, the TS increases from 0.051 to 0.056 for the rainstorm forecast using this method, representing a 9.8% growth. Based on WPM, the WPM-best with all members further improved precipitation forecasts, with the TS in rainstorm forecasts further increasing to 0.062. Compared with the PM, the WPM-best method improved TS by 2.8%, 7.7%, 10.3%, and 21.6%, from light rain to rainstorm forecasts, respectively. Compared with CMA-MESO, the WPM-best method improved TS by 1.7%, 7.0%, 8.1%, and 6.9%, respectively, from light rain to rainstorm forecasts. Thus, as the precipitation intensity increases, this method showed increasingly noticeable advantages. Notably, PM and WPM both increased the clear-rainy forecast but degrade the light rain and rainstorm forecast compared with CMA-MESO.
Specifically, the WPM-best method with all members considerably increased the POD of precipitation forecasts at different intensities, whereas the FAR was decreased (Figure 6b,c). Compared with the PM, the WPM-best increased the POD from light rain to rainstorm forecasts by 5.1%, 21.7%, 21.2%, and 28.6%, respectively, without causing a significant change in the FAR (0.4%, 0.4%, −0.4%, and −1.2%). Compared with CMA-MESO, the POD of the WPM-best from light rain to rainstorm forecasts increased by 1.3%, 5.9%, 7.5%, and 6.6% and the FAR decreased by 1.1%, 1.6%, 1.2%, and 0.7%, respectively. Compared with the WPM, the WPM-best furtherly increased the TS by increasing the POD.
Furthermore, the WPM-best experiment using the two optimal models (three CMA-MESO members and three CMA-GD members) showed the almost same performance with WPM-best (all members). This means that the weighting of the models can be done by the machine because the less-skillful model automatically receives very low performance weights. Therefore, it is not necessary to remove any less-skillful model before using WPM. The experiment using only one model (three CMA-MESO members) failed to improve the forecast compared to CMA-MESO, because both FM and OTS can only improve intensity, and not distribution. In conclusion, there is no need to select models before using the WPM-best method. WPM-best can effectively decrease the multi-model distribution bias, but it has no effect on a single model with extra post-processed FM and OTS members.
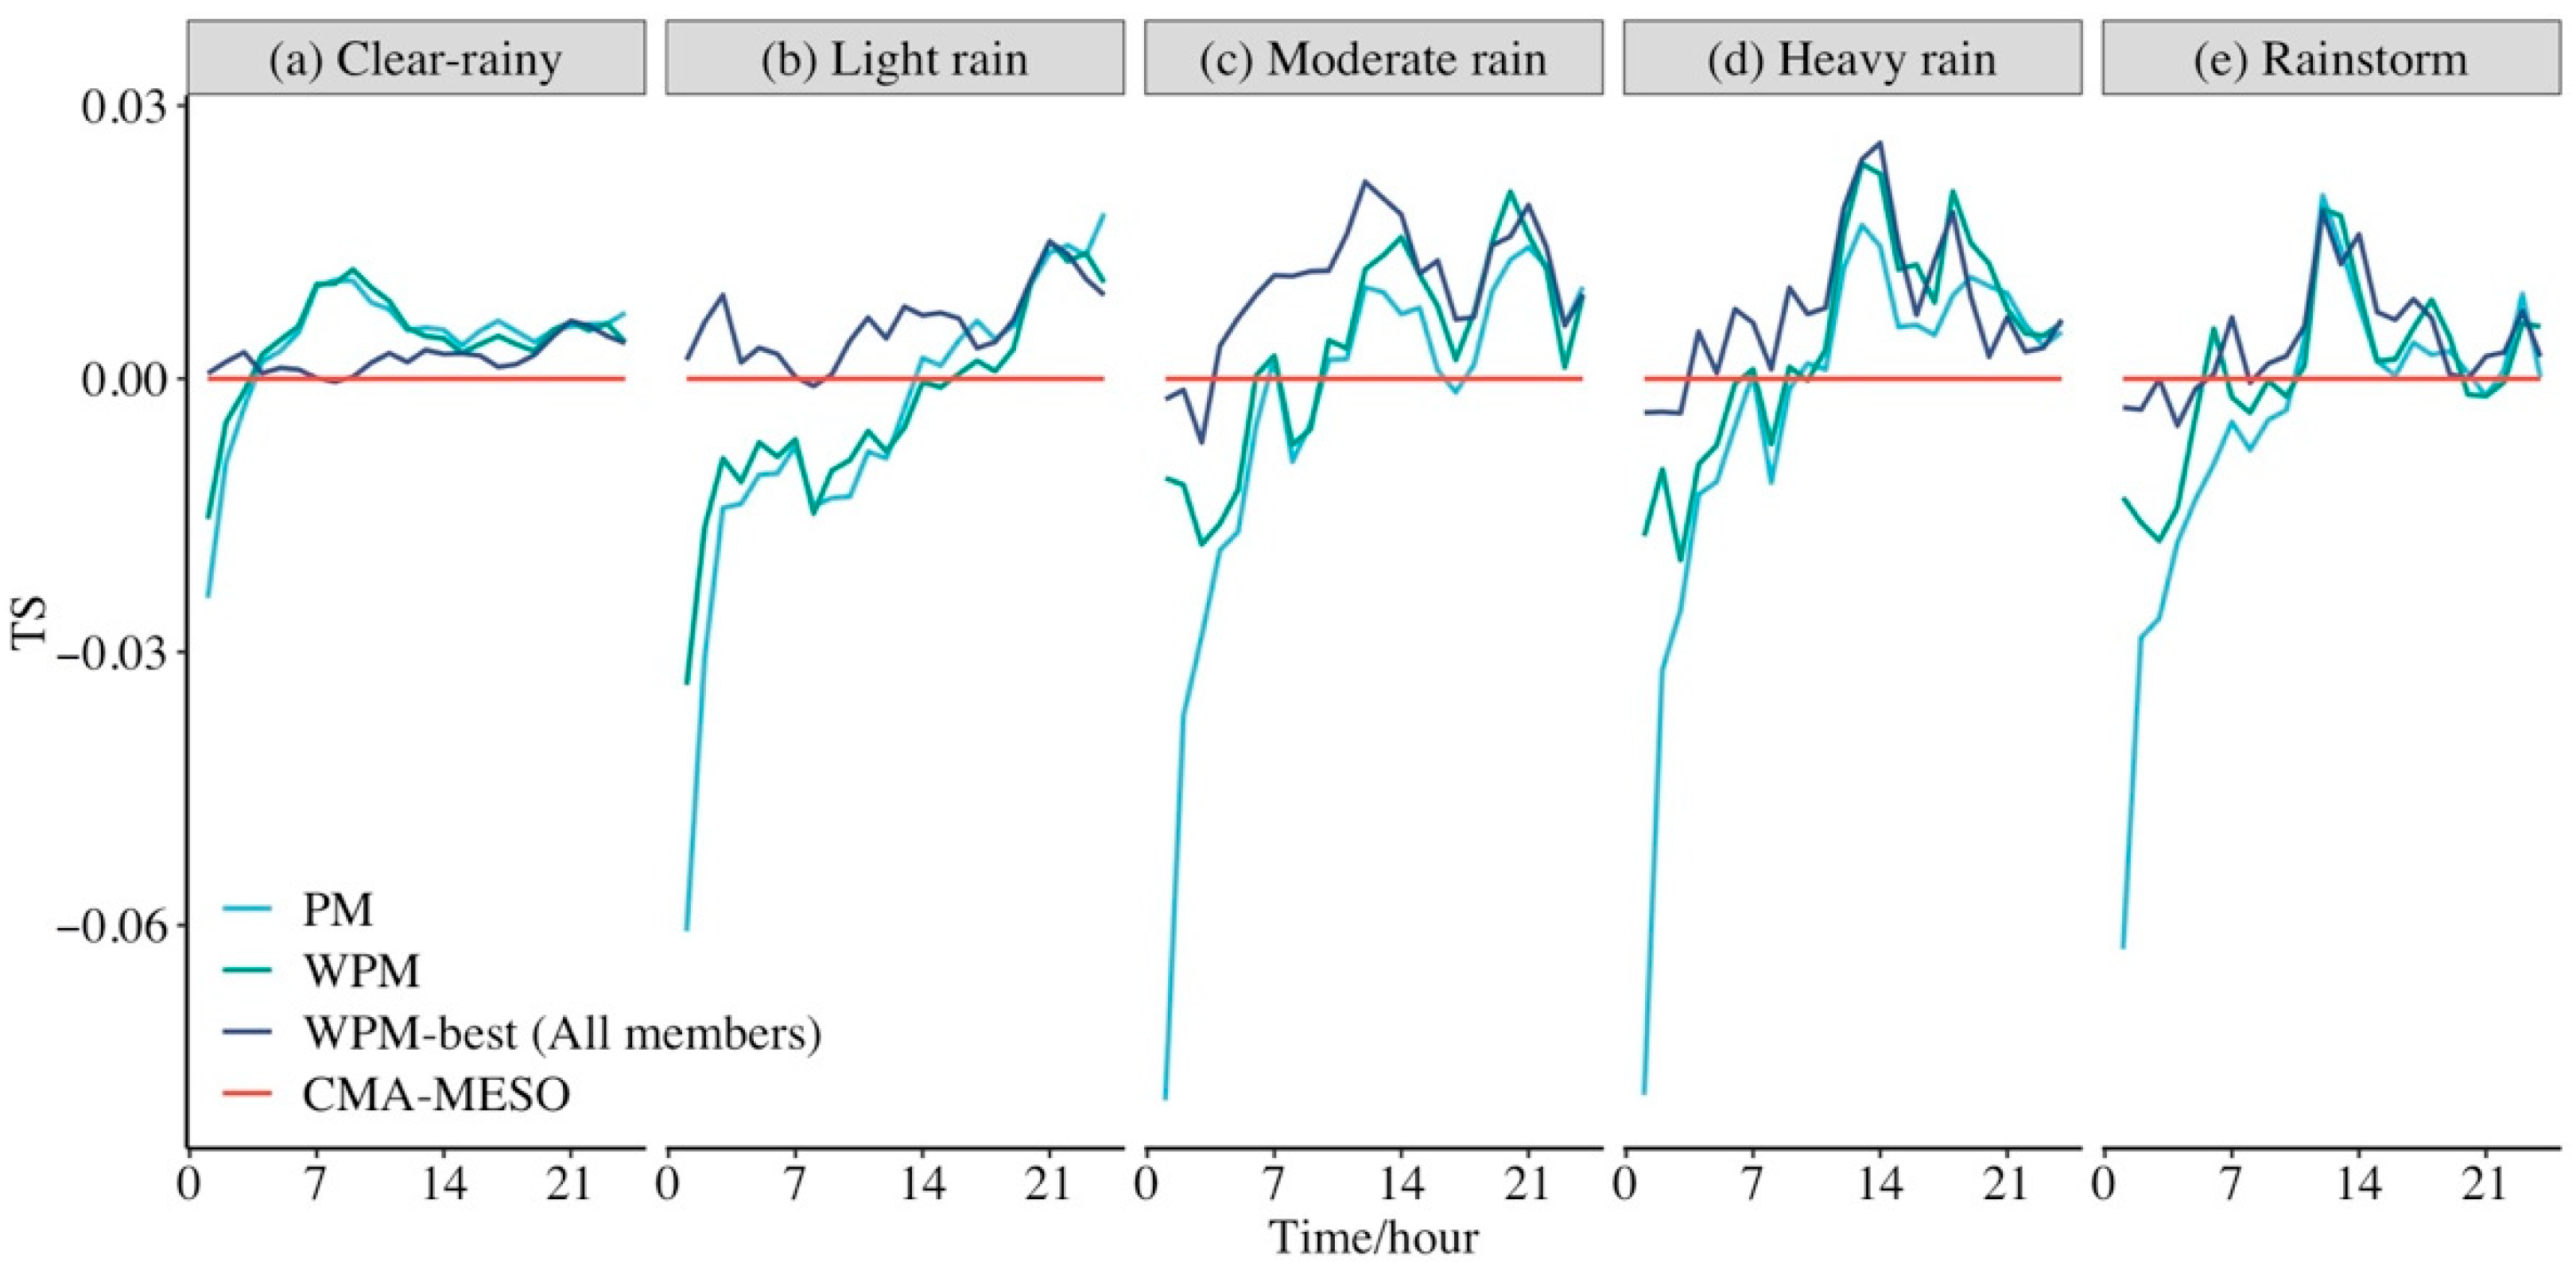
From the perspective of the 0–24 h valid forecast periods in non-rainstorm forecasts (Figure 7a–d), the WPM-best (all members) improved the valid periods by 90.3% compared with CMA-MESO. In rainstorm forecasts (Figure 7e), the WPM-best improved the valid periods by 70.8%. Additionally, the method exhibited a better correction effect in longer valid forecast periods.

3.4. Case Study of Typhoon Mekkhala (2020)

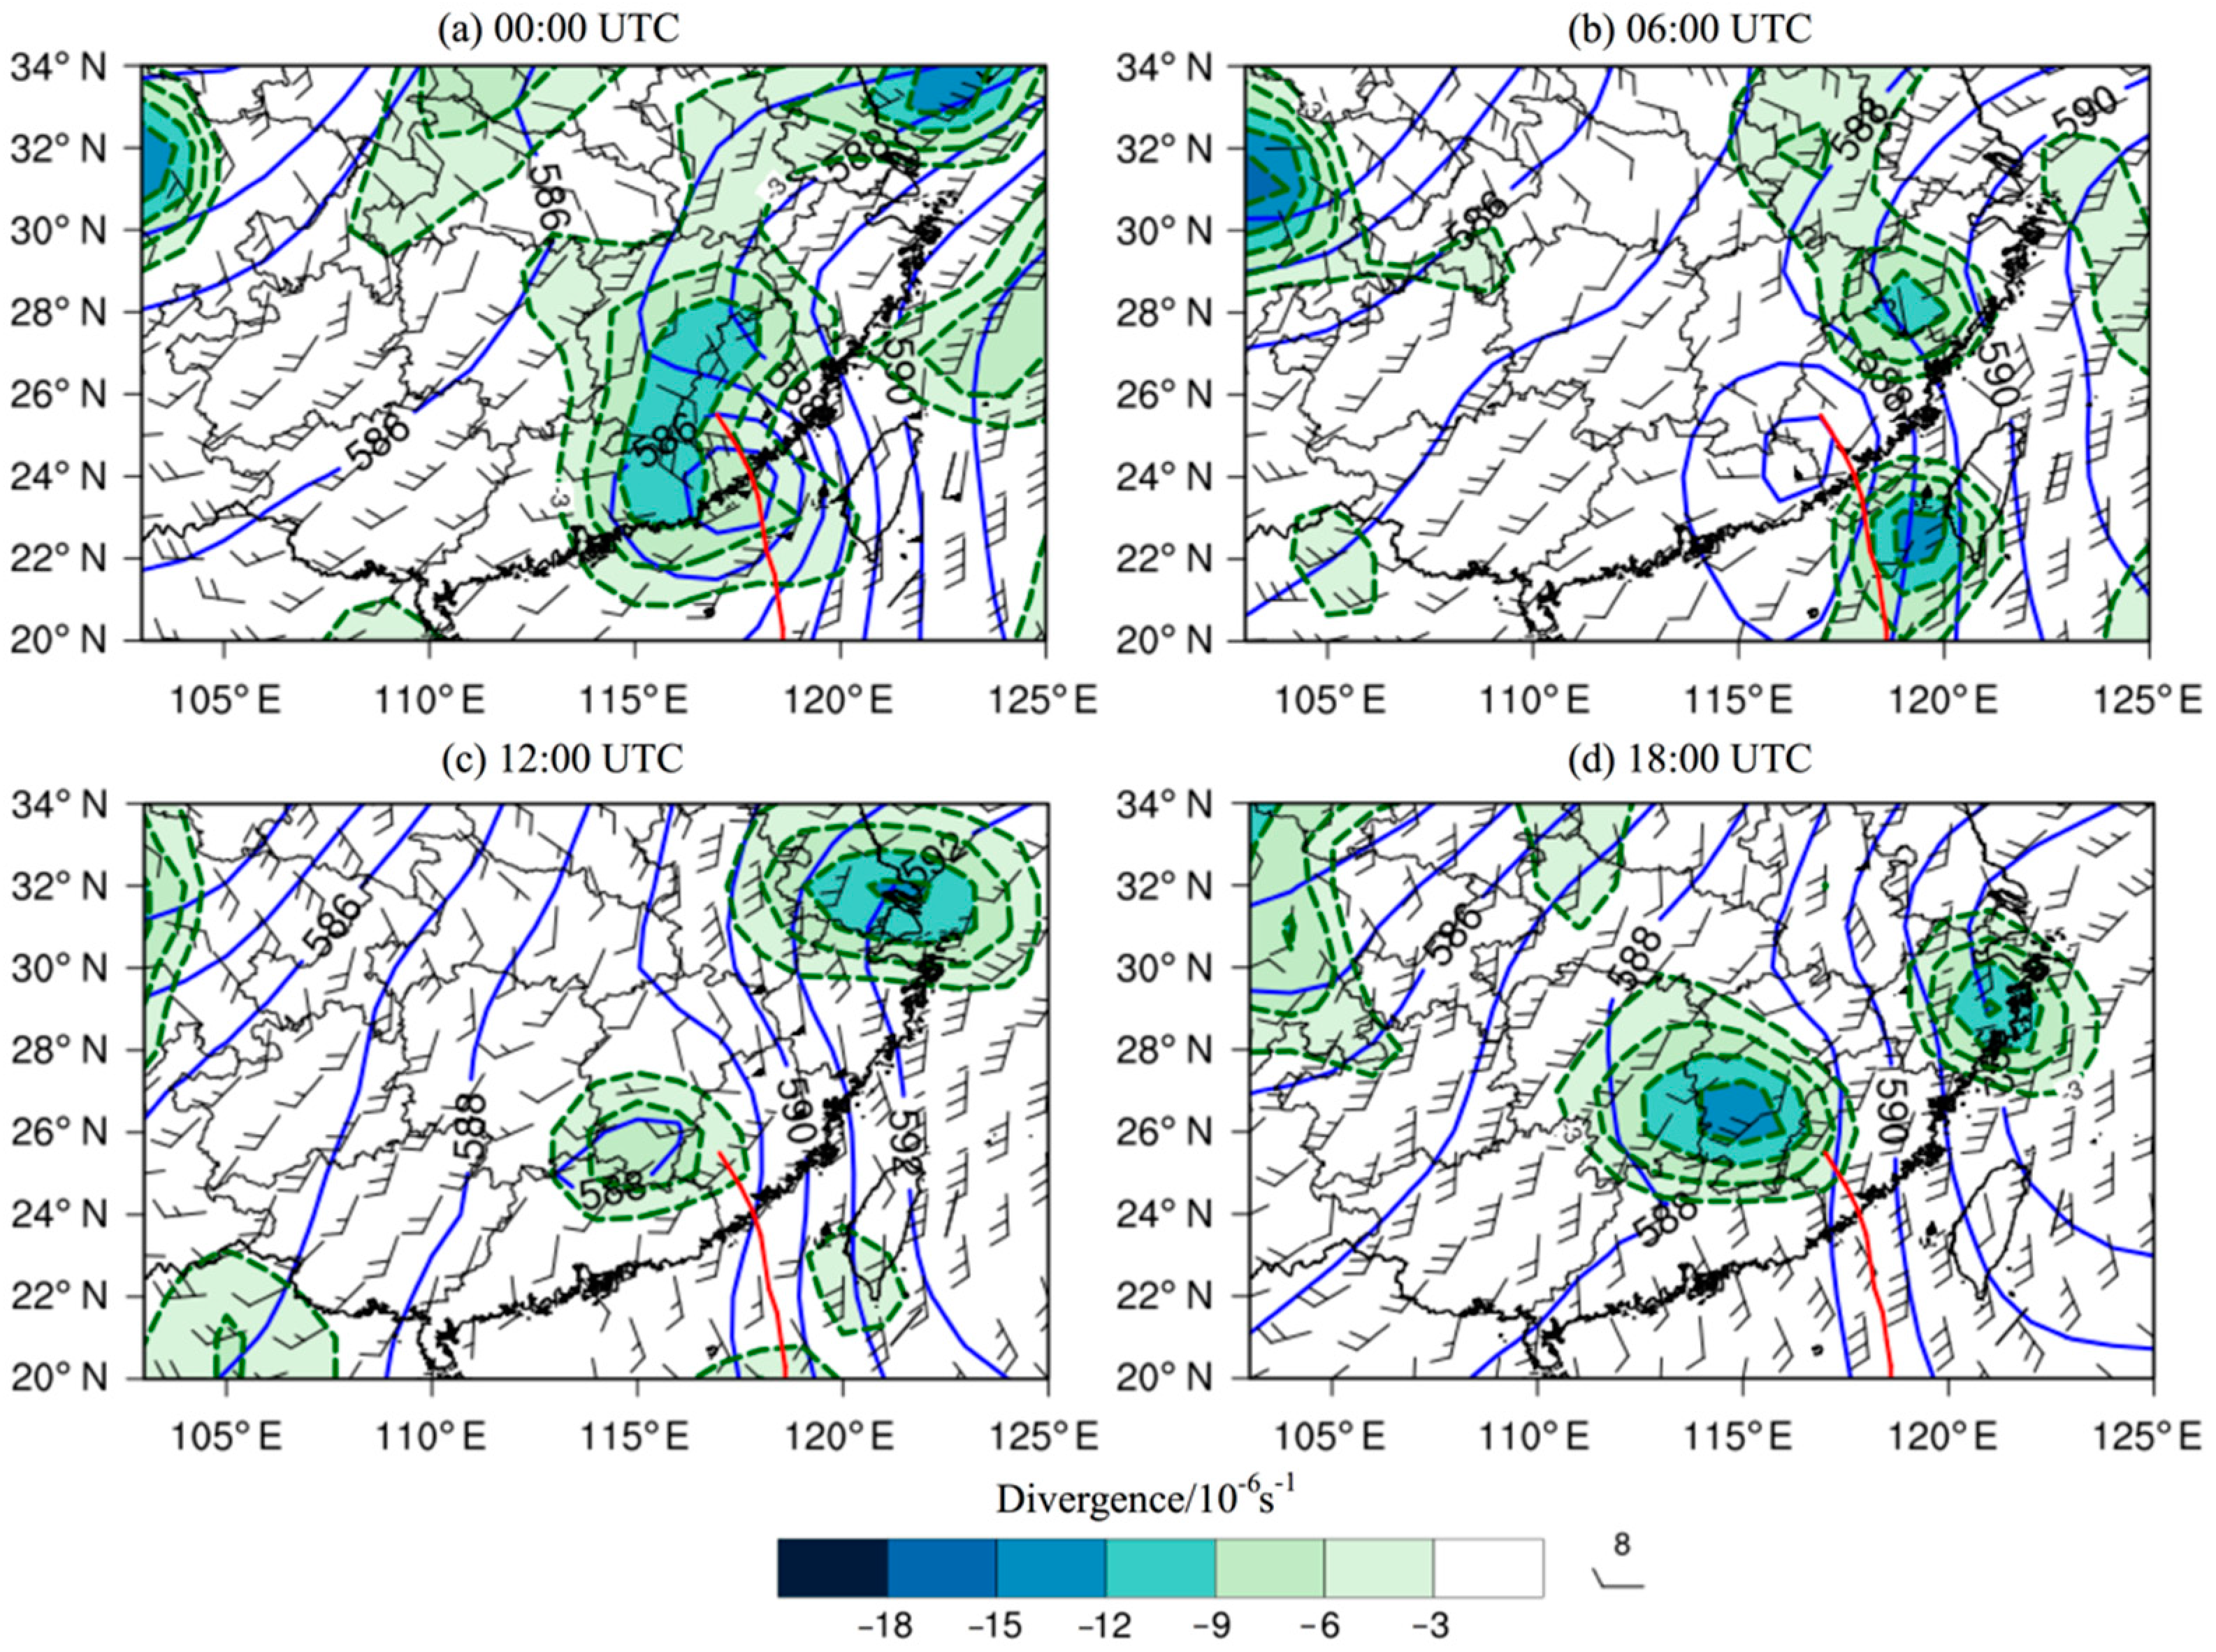
To evaluate the effectiveness of the WPM-best on multi-model typhoon rainfall, the WPM-best (all members) method was applied in the case study, to the typhoon “Mekkhala” (2020) rainstorm occurring on 11 August 11 2020 (Figure 8). Under the impact of the typhoon, the rainstorm was recorded by 118 stations (≥8 mm/h) in Hunan Province. From the weather chart, at the early stage, when severe precipitation occurred (00:00 on 11 August), typhoon “Mekkhala” (2020) landed on Fujian Province with the minimum atmospheric pressure of 975 hPa and a maximum wind speed of grade 13 (38 m/s). At the same time, a large area of cyclonic convergence appeared in southeast Hunan, with a divergence reaching −9 × 10⁻⁶ s−1 on the 700 hPa weather chart and the maximum intensity of precipitation of 61.4 mm/h. From 06:00 to 12:00 (Figure 8b,c), with typhoon “Mekkhala” (2020) moving toward the inland, the convective precipitation in Hunan intensified with a maximum precipitation of 72.6 mm/h. At 18:00 (Figure 8d), with the typhoon weakening and vanishing, the southerly wind intensified, and the rainstorm was about to end.
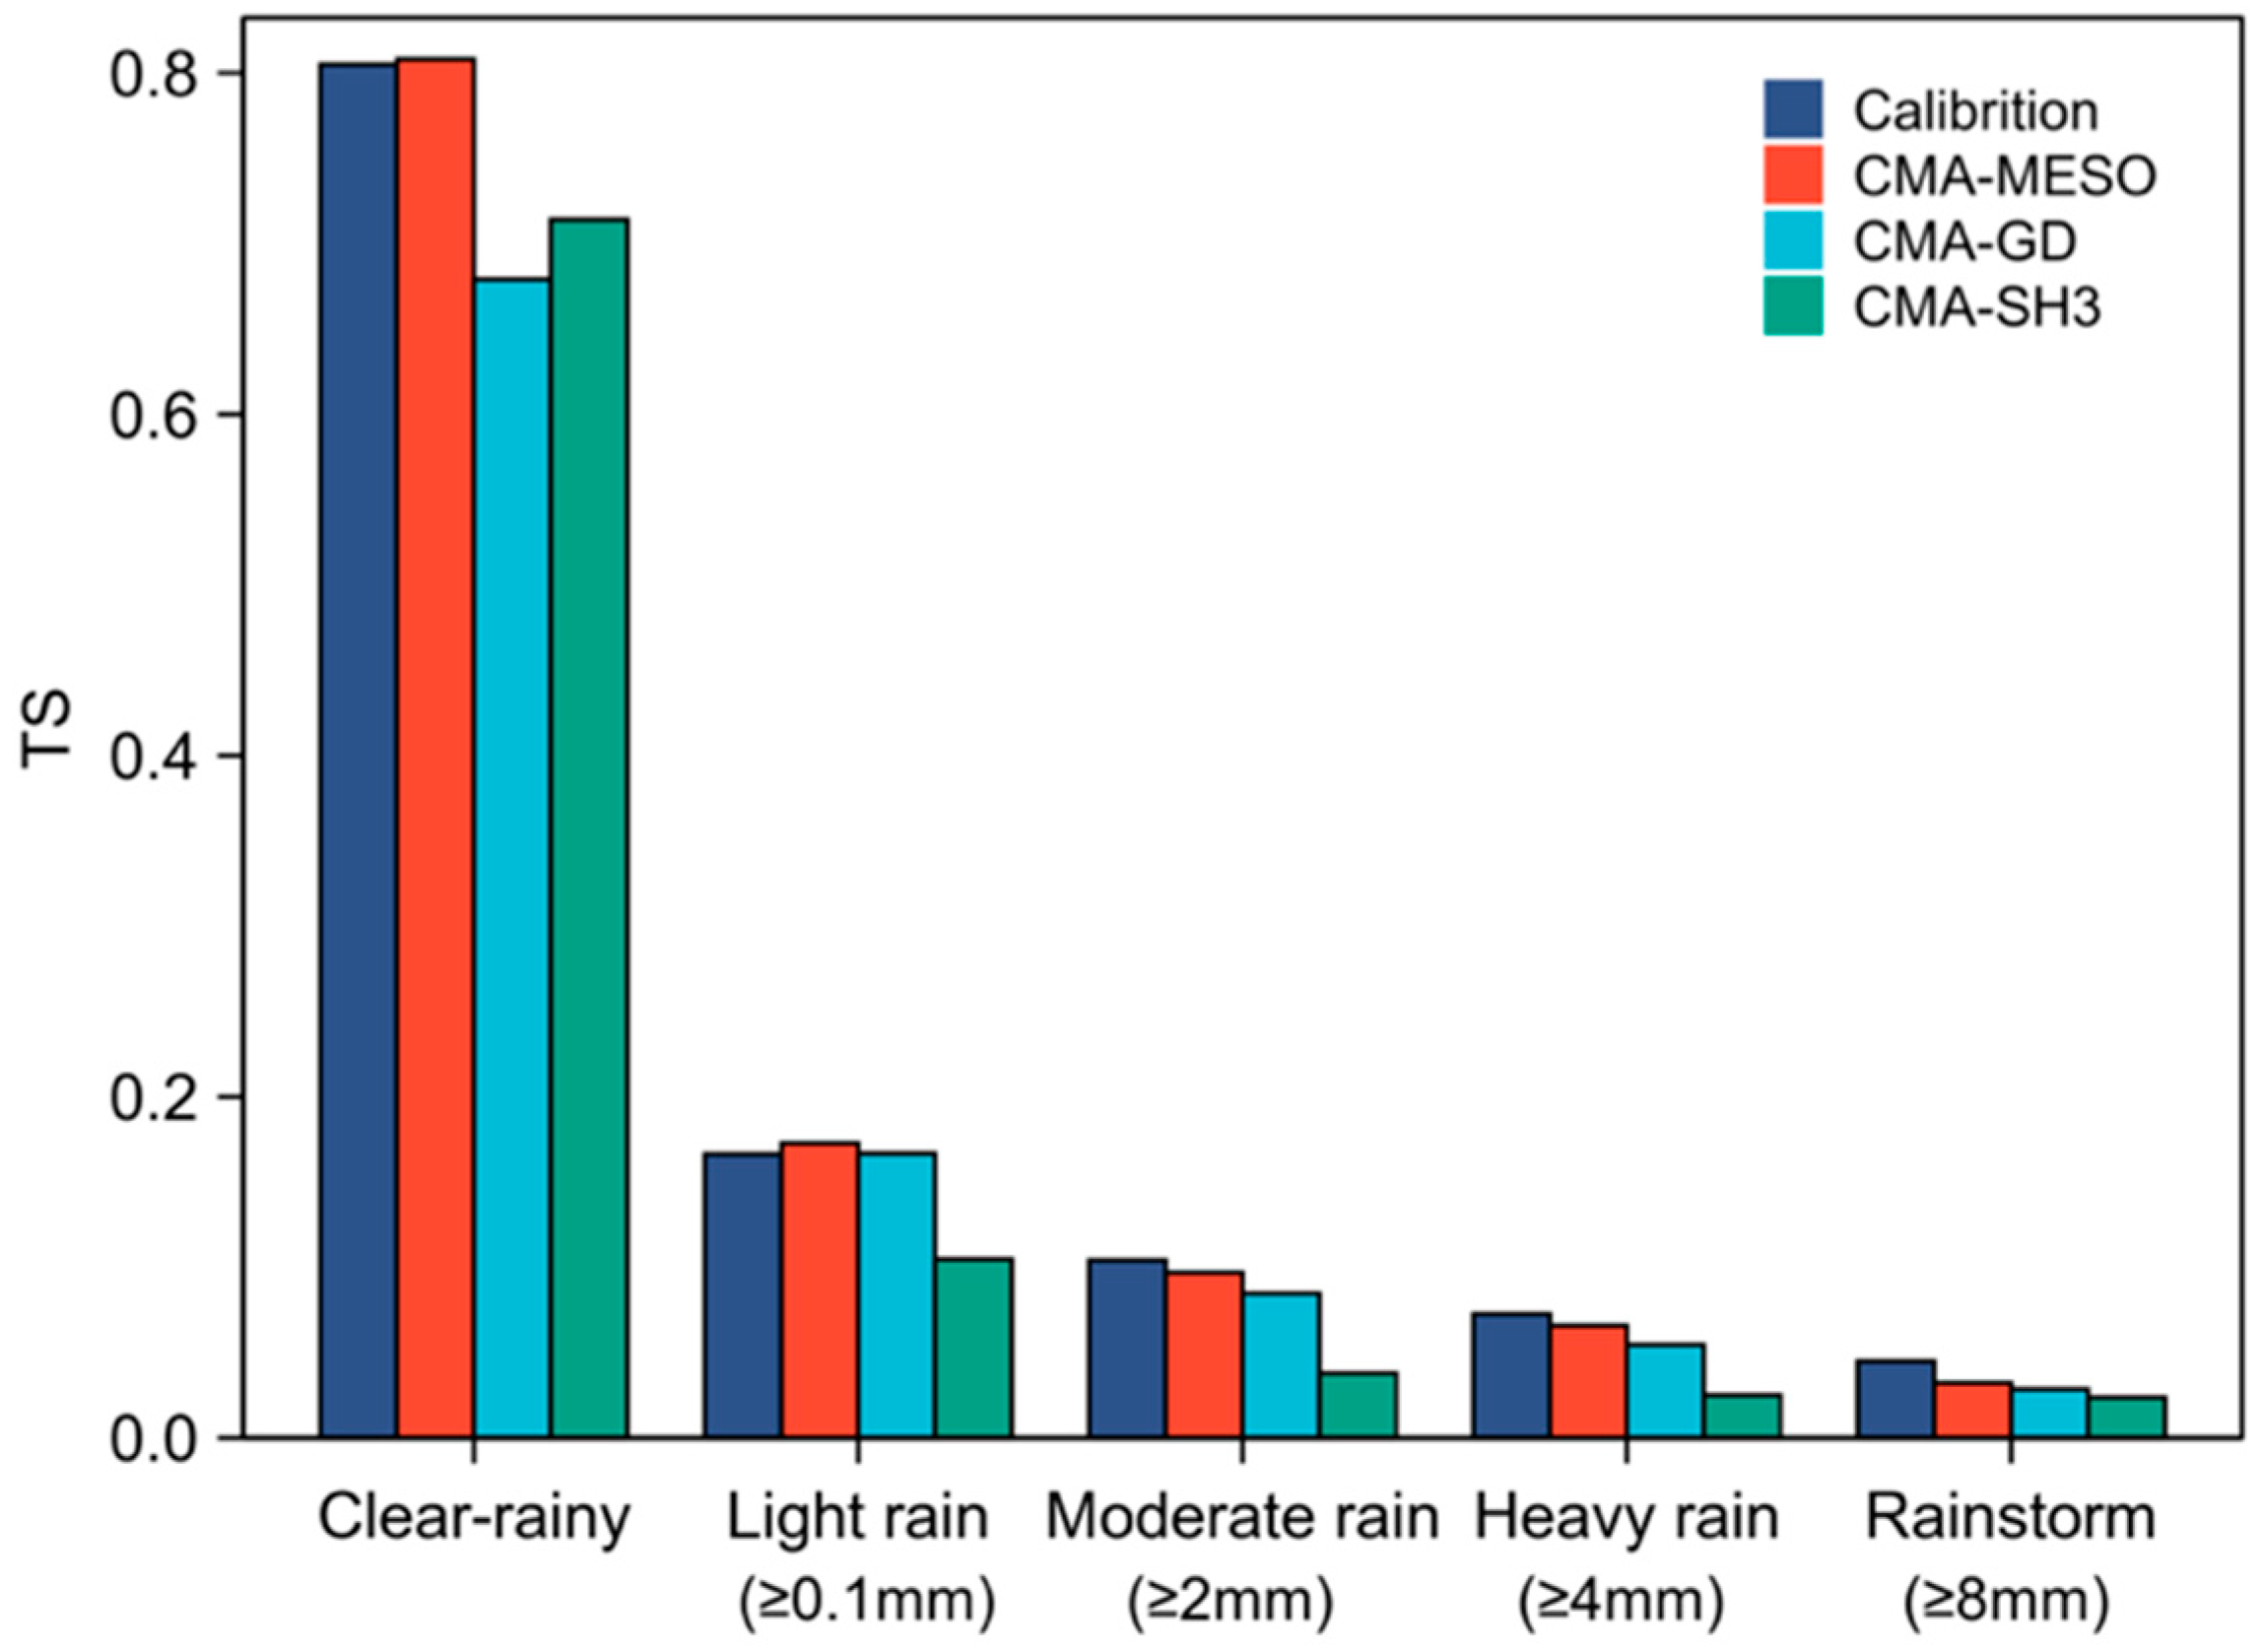
The comparative results of the multi-model precipitation and WPM-best calibration forecasts (Figure 9) reveal that, compared with CMA-MESO, the WPM-best shows improved forecasts for moderate rain, heavy rain, and rainstorm by 7.6%, 10.4%, and 39.2%, respectively. However, it has a lower performance than CMA-MESO, by 0.3% and 3.8%, in clear-rainy and light rain forecasts, respectively. This is consistent with the statistical results shown in Section 3.3, demonstrating that WPM-best performance will be improved if the precipitation intensity becomes stronger.

4. Conclusions

Based on the hourly QPF of three high-resolution NWP models spanning from March to September 2020, FM and OTS calibration methods were used to construct a multi-model ensemble correction forecast and a group of comparative experiments were designed based on the multi-model ensemble method. Specifically, the WMA and model optimization methods were used to improve the precipitation pattern and intensity of the PM method. Finally, the improved correction method was applied in a typhoon rainstorm case. The following results were obtained:
(1)
In non-rainstorm forecasts, CMA-MESO and CMA-GD have similar forecast capabilities. In rainstorm forecasts, CMA-MESO has a notable advantage over CMA-GD and CMA-SH3, with the TS increasing to 0.052 (CMA-GD) from 0.058 (CMA-MESO), representing an 11.5% growth. Additionally, among the nine ensemble members, CMA-MESO showed the highest accuracy for the rainstorm forecast, with a reliable performance in the non-rainstorm forecast. Thus, this was selected as a key factor for the sensitivity experiment.
(2)
Compared with traditional equal-weight PM, the WPM improves the different grades of QPF, obtaining an optimal rainfall pattern using WMA, with a rainstorm threat score skill of 0.051 to 0.056, an increase of 9.8%. On this basis, the WPM-best method, which uses an optimal rainfall intensity than WPM, furtherly improves precipitation forecasts. The higher the precipitation grade, the more significant the improvement. The TS in the rainstorm forecast further increases to 0.062.
(3)
The sensitivity experiments show that there is no need to select models before using the WPM-best method, because WPM-best can give a very low weight to the less-skillful model in a more objective way. However, this method has no effect on a single model with extra post-processed FM and OTS members, because both FM and OTS can only improve intensity, not distribution. The performance of WPM-best improves with longer valid forecast periods.
(4)
The results of the case analysis of typhoon “Mekkhala” (2020) show that CMA-MESO has the highest forecast TS among the three high-resolution models, and the WPM-best method furtherly improves the rainstorm forecast by 39.2% compared with CMA-MESO.
In this study, the “optimal” model used for WPM-best was selected as CMA-MESO for all forecast times. The model performance varies as different times and geographical locations. Therefore, choosing the optimum model for each forecast time could be a constructive way to further improve the QPF. We are expecting to validate the method of dynamically selecting the optimal model in future studies.

Author Contributions

Conceptualization, J.-Q.L. and Z.-L.L.; methodology, J.-Q.L..; software, J.-Q.L., and Q.-Q.W.; validation, Q.-Q.W.; formal analysis, J.-Q.L.; data curation, J.-Q.L.; writing—original draft preparation, J.-Q.L.; writing—review and editing, Z.-L.L. All authors have read and agreed to the published version of the manuscript.

Funding

This research was funded by the Open Project Fund of Guangdong Provincial Key Laboratory of Regional Numerical Weather Prediction, CMA (No. J202009), Heavy Rain and Drought-Flood Disasters in Plateau and Basin Key Laboratory of Sichuan Province (No. SZKT202005), and Key field R & D project of Hunan Science and Technology Department (2019SK2161).

Institutional Review Board Statement

Not applicable.

Informed Consent Statement

Not applicable.

Data Availability Statement

The station data and FNL data used in this work are available from the China Meteorological Data Service Center (https://data.cma.cn, accessed on 1 October 2021) and National Centers for Environmental Prediction (https://rda.ucar.edu/datasets/ds083.2/index.html, accessed on 1 October 2021). The best track datasets for tropical cyclones over the western North Pacific are available from Shanghai Typhoon Institute (https://tcdata.typhoon.org.cn, accessed on 1 October 2021).

Acknowledgments

The authors are very grateful to the editor and anonymous reviewers for their help and recommendations.

Conflicts of Interest

The authors declare no conflict of interest.

References

  1. Novak, D.R.; Bailey, C.; Brill, K.F.; Burke, P.; Hogsett, W.A.; Rausch, R.; Schichtel, M. Precipitation and temperature forecast performance at the weather prediction center. Weather Forecast. 2014, 29, 489–504. [Google Scholar] [CrossRef] [Green Version]
  2. Hamill, T.; Scheuerer, M.; Bates, G. Analog probabilistic precipitation forecasts using GEFS reforecasts and climatology-calibrated precipitation analyses. Mon. Weather Rev. 2015, 143, 3300–3309. [Google Scholar] [CrossRef] [Green Version]
  3. Dai, K.; Zhu, Y.J.; Bi, B.G. The review of statistical post-process technologies for quantitative precipitation forecast of ensemble prediction system. Acta Meteorol. Sin. 2018, 76, 493–510. [Google Scholar]
  4. Ruth, D.P.; Glahn, B.; Dagastaro, V.; Gilbert, K. The performance of MOS in the digital age. Weather Forecast. 2008, 24, 504–519. [Google Scholar] [CrossRef]
  5. Charba, J.P.; Samplatsky, F.G. High-resolution GFS-based MOS quantitative precipitation forecasts on a 4-km grid. Mon. Weather Rev. 2011, 139, 39–68. [Google Scholar] [CrossRef]
  6. Cannon, A.J.; Sobie, S.R.; Murdock, T.Q. Bias correction of GCM precipitation by quantile mapping: How well do methods preserve changes in quantiles and extremes? J. Clim. 2015, 28, 6938–6959. [Google Scholar] [CrossRef]
  7. Zhu, Y.J.; Luo, Y. Precipitation calibration based on the frequency-matching Method. Weather Forecast. 2015, 30, 1109–1124. [Google Scholar] [CrossRef]
  8. Wu, Q.S.; Han, M.; Liu, M.; Chen, F.J. A comparison of optimal-score-based correction algorithms of model precipitation prediction. J. Appl. Meteorol. Sci. 2017, 28, 306–317. [Google Scholar]
  9. Delle Monache, L.; Nipen, T.; Liu, Y.; Roux, G.; Stull, R. Kalman filter and analog schemes to postprocess Numerical Weather Predictions. Mon. Weather Rev. 2011, 139, 3554–3570. [Google Scholar] [CrossRef] [Green Version]
  10. Du, J.; Zhou, B. A dynamical performance-ranking method for predicting individual ensemble member performance and its application to ensemble averaging. Mon. Weather Rev. 2011, 139, 3284–3303. [Google Scholar] [CrossRef]
  11. Du, Y.G.; Qi, L.B.; Cao, X.G. Selective ensemble-mean technique for tropical cyclone track forecast by using time-lagged ensemble and multi-center ensemble in the western North Pacific. Q. J. R. Meteorol. Soc. 2016, 142, 2452–2462. [Google Scholar] [CrossRef]
  12. Primo, C.; Ferro, C.A.T.; Jolliffe, I.T.; Stephenson, D.B. Calibration of probabilistic forecasts of binary events. Mon. Weather Rev. 2009, 137, 1142–1149. [Google Scholar] [CrossRef]
  13. Messner, J.W.; Mayr, G.J. Probabilistic Forecasts Using Analogs in the Idealized Lorenz96 Setting. Mon. Weather Rev. 2010, 139, 1960–1971. [Google Scholar] [CrossRef]
  14. Qi, L.B.; Yu, H.; Chen, P.Y. Selective ensemble-mean technique for tropical cyclone track forecast by using ensemble prediction systems. Q. J. R. Meteorol. Soc. 2014, 140, 805–813. [Google Scholar] [CrossRef]
  15. Park, Y.Y.; Buizza, R.; Leutbecher, M. TIGGE: Preliminary Results on Comparing and Combining Ensembles. Q. J. R. Meteorol. Soc. 2008, 134, 2029–2050. [Google Scholar] [CrossRef]
  16. Bentzien, S.; Friederichs, P. Generating and calibrating probabilistic quantitative precipitation forecasts from the high-resolution NWP model Cos-MO-DE. Weather Forecast. 2012, 27, 998–1002. [Google Scholar] [CrossRef]
  17. Ebert, E.E. Ability of a poor man’s ensemble to predict the probability and distribution of precipitation. Mon. Weather Rev. 2001, 129, 2461–2480. [Google Scholar] [CrossRef]
  18. Clark, A.J.; Weiss, S.J.; Kain, J.S.; Jirak, I.L.; Coniglio, M.; Melick, C.J.; Siewer, C.; Sobash, R.A.; Marsh, R.T.; Dean, A.R.; et al. An Overview of the 2010 Hazardous Weather Testbed Experimental Forecast Program Spring Experiment. Bull. Am. Meteorol. Soc. 2012, 93, 55–74. [Google Scholar] [CrossRef]
  19. Fang, X.; Kuo, Y.H. Improving ensemble-based quantitative precipitation forecasts for topography-enhanced typhoon heavy rainfall over Taiwan with a modified probability-matching technique. Mon. Weather Rev. 2013, 141, 3908–3932. [Google Scholar] [CrossRef] [Green Version]
Figure 1. Domains of three different models and the location of Hunan Province (red line) in the Lambert map projection.
Atmosphere 12 01346 g001
Figure 2. Illustration of (a) frequency-matching method (horizontal lines indicate observation and forecast with the same frequency) and (b) optimal threat score method (red line indicates threat score in different grades).
Atmosphere 12 01346 g002
Figure 3. Schematic of the sensitivity experiments and sliding weight denotes WMA.
Atmosphere 12 01346 g003
Figure 4. Assessment of multi-model hourly QPF. The calculation equations are shown in Table 5.
Atmosphere 12 01346 g004
Figure 5. Threat score of ensemble members. The details of each member are shown in Table 2.
Atmosphere 12 01346 g005
Figure 6. Performance of multi-model hourly QPF before and after different calibrated methods. The details of the calibration method are shown in Figure 3.
Atmosphere 12 01346 g006
Figure 7. Difference of hourly TS between calibrations and CMA-MESO in valid time of 0–24 h.
Atmosphere 12 01346 g007
Figure 8. Synoptic situation of geopotential height (blue, contour interval is 1, unit: dagpm) at 500 hPa, wind (unit: m/s) and divergence (color area, unit: 10−6 m−1) at 700 hPa every 6 h from 00:00 to 18:00 UTC on 11 August 2020. The red line stands for best track of typhoon Mekkhala (2020).
Atmosphere 12 01346 g008
Figure 9. TS of multi-model forecast (CMA-MESO, CMA-GD, and CMA-SH3) and calibrated forecast (dark blue) initiated at 00:00 UTC on 11 August 2020.
Atmosphere 12 01346 g009
Table 1. Three high temporal-spatial resolution numerical weather prediction models.
NameOutput ResolutionDurationOperation/UTCOrganization
CMA-MESO3 km, 1 h36 h00/03/06/09/12/15/18/21China Meteorological Administration
CMA-GD3 km, 1 h96 h00/12Guangdong Meteorological Service
CMA-SH33 km, 1 h24 h Per hourShanghai Meteorological Service
Table 2. List of multi-model ensemble members for hourly QPF.
Ensemble MembersDescriptionTraining Window
CMA-MESOClassic CMA-MESO QPFNone
CMA-MESO-FMQPF magnitude adjusted based on FM Past 60 days
CMA-MESO-OTSQPF magnitude adjusted based on optimal TS Past 60 days
CMA-GDClassic CMA-GD QPFNone
CMA-GD-FMQPF magnitude adjusted based on FMPast 60 days
CMA-GD-OTSQPF magnitude adjusted based on optimal TSPast 60 days
CMA-SH3Classic CMA-SH3 QPFNone
CMA-SH3-FMQPF magnitude adjusted based on FMPast 60 days
CMA-SH3-OTSQPF magnitude adjusted based on optimal TSPast 60 days
Table 3. Indicators used in WPM. The sorted observations and ensemble member precipitation are denoted as O and F, respectively. The i and j denote the ith day and jth ensemble member, respectively. M and N represent the number of ensemble members and the number of valid samples, respectively.
IndicatorExpression
Spearman correlation
coefficient (Ri)
i = 1 N ( F i F ¯ ) ( O i O ¯ ) i = 1 N ( F i F ¯ ) 2 i = 1 N ( O i O ¯ ) 2
Weight (Wj) i = 1 N R i j = 1 M i = 1 N R i
New pattern (D) j = 1 M F j W j
Table 4. Design of the sensitivity experiments.
ExperimentsPatternIntensityTraining Window
PM Ensemble meanEnsemble membersNone
WPMWMA Ensemble membersPast 60 days
WPM-bestWMA The optimal memberPast 60 days
Table 5. Assessment indicators used in multi-model and sensitivity experiments. NA, NB, NC, and ND represent the number of hits, misses, false alarms, and correct negatives, respectively.
IndicatorExpression
Threat score (TS) N A N A + N B + N C
Clear-rainy TS N A + N D N A + N B + N C
Probability of detection (POD) N A N A + N B
False alarm ratio (FAR) N C N A + N C
Publisher’s Note: MDPI stays neutral with regard to jurisdictional claims in published maps and institutional affiliations.