Article

Effects of Long-Term Nitrogen Fertilization and Ground Water Level Changes on Soil CO2 Fluxes from Oil Palm Plantation on Tropical Peatland

1
Graduate School of Agriculture, Hokkaido University, Hokkaido 060-8589, Japan
2
Sarawak Tropical Peat Research Institute, Kuching 94300, Malaysia
3
Agricultural Research Department, Hokkaido Research Organization, Hokkaido 060-0819, Japan
4
Advanced Agriecological Research Sdn Bhd, Kota Damansara, Petaling Jaya 47810, Malaysia
*
Author to whom correspondence should be addressed.
Atmosphere 2021, 12(10), 1340; https://doi.org/10.3390/atmos12101340
Submission received: 15 September 2021 / Revised: 5 October 2021 / Accepted: 9 October 2021 / Published: 13 October 2021
(This article belongs to the Special Issue Agricultural Greenhouse Gas Emissions)

Abstract

:
A long-term study on the effect of nitrogen (N) fertilization on soil carbon dioxide (CO2) fluxes in tropical peatland was conducted to (1) quantify the annual CO2 emissions from an oil palm plantation under different N application rates and (2) evaluate the temporal effects of groundwater level (GWL) and water-filled pore space (WFPS) on soil organic carbon (SOC) and CO2 fluxes. Monthly measurement of soil CO2 fluxes using a closed chamber method was carried out from January 2010 until December 2013 and from January 2016 to December 2017 in an oil palm plantation on tropical peat in Sarawak, Malaysia. Besides the control (T1, without N fertilization), there were three N treatments: low N (T2, 31.1 kg N ha−1 year−1), moderate N (T3, 62.2 kg N ha−1 year−1), and high N (T4, 124.3 kg N ha−1 year−1). The annual CO2 emissions ranged from 7.7 ± 1.2 (mean ± SE) to 16.6 ± 1.0 t C ha−1 year−1, 9.8 ± 0.5 to 14.8 ± 1.4 t C ha−1 year−1, 10.5 ± 1.8 to 16.8 ± 0.6 t C ha−1 year−1, and 10.4 ± 1.8 to 17.1 ± 3.9 t C ha−1 year−1 for T1, T2, T3, and T4, respectively. Application of N fertilizer had no significant effect on annual cumulative CO2 emissions in each year (p = 0.448), which was probably due to the formation of large quantities of inorganic N when GWL was temporarily lowered from January 2010 to June 2010 (−80.9 to −103.4 cm below the peat surface), and partly due to low soil organic matter (SOM) quality. A negative relationship between GWL and CO2 fluxes (p < 0.05) and a positive relationship between GWL and WFPS (p < 0.001) were found only when the oil palm was young (2010 and 2011) (p < 0.05), indicating that lowering of GWL increased CO2 fluxes and decreased WFPS when the oil palm was young. This was possibly due to the fact that parameters such as root activity might be more predominant than GWL in governing soil respiration in older oil palm plantations when GWL was maintained near or within the rooting zone (0–50 cm). This study highlights the importance of roots and WFPS over GWL in governing soil respiration in older oil palm plantations. A proper understanding of the interaction between the direct or indirect effect of root activity on CO2 fluxes and balancing its roles in nutrient and water management strategies is critical for sustainable use of tropical peatland.

1. Introduction

Tropical peat swamp forests play an important role in the global carbon (C) cycle and have contributed to climate change. The incomplete decomposition of dead tree material, especially roots, has led to the slow but progressive accumulation of partially decomposed organic material (peat) over millennia and has afforded this ecosystem a very high C density [1]. Much tropical peat swamp forest has been developed, mostly for agricultural activities including oil palm plantations, especially in Indonesia and Malaysia, the main global producers and exporters of palm oil, accounting for 87% of the global production [2]. Deforestation, burning, and drainage for land conversion have significantly increased the decomposition rate of soil organic matter (SOM) in peatland [3,4,5], which has, in turn, caused elevated greenhouse gas (GHG) emissions, especially carbon dioxide (CO2). This has attracted global attention, especially from those concerned about climate change.
Emission of CO2 through soil respiration is an important component of the C balance in peat swamp forest. Soil respiration comprises two main components: (i) autotrophic respiration, from roots and their associated mycorrhizal fungi, as well as respiration from other microbes in the rhizosphere which are directly dependent on labile C leaked from roots, and (ii) heterotrophic respiration, due to the decomposition of SOM [6]. In peatland ecosystems, oxidative peat decomposition dominates heterotrophic respiration, especially when the peatland is drained [7,8], with the contribution of oxidative peat decomposition to total soil respiration, ranging from 60% to 86% in oil palm plantations on tropical peat [9,10,11]. SOM content can be used for the assessment of stocks and changes of soil organic carbon (SOC) in peatland soils [12]. The quantity of C stored in terrestrial soils largely depends on the magnitude of SOC mineralization. Hydrological conditions have significant effects on SOC mineralization in tropical peatlands. Most studies reported that lowering the groundwater level (GWL) accelerated peat decomposition and increased CO2 emissions [13,14,15]. However, a smaller response of CO2 fluxes to GWL could be caused by the disconnection of capillary forces, which occurs when the distance between the water table and the ground surface is too far [13]. Rather than GWL, water-filled pore space (WFPS) was reported to be more dominant in affecting soil CO2 emissions in peat because drainage and compaction could increase peat bulk density and decrease its total porosity, resulting in greater WFPS [3]. A decline in SOM quality and nutrients associated with conversion may decrease substrate-driven rates of CO2 production from peat decomposition over time [16,17]. Substrate quality of SOM, which is usually classified into labile and recalcitrant soil C, can become an important factor regulating peat decomposition [18]. The C:N ratio accounts for the degree of SOM decomposition as the C:N ratio regulates the decomposition rate and humus formation during SOM decomposition. The low C:N ratio may be attributed to either an increase in the nitrous oxide (N2O) emissions with an increase in nitrogen, or low carbon stock leading to a decrease in CO2 and methane emissions [19]. Apart from higher CO2 emissions, an increased peat mineralization rate also affords a possibly greater potential for N2O production due to better NO3 availability under aerobic drained conditions. Thus, peat decomposition caused by oil palm development on tropical peatland was probably the main reason for the large source of N2O emission, as evidenced by the positive correlation between CO2 and N2O fluxes [20,21].
Nitrogen (N) fertilization as an essential component of agricultural management was reported to influence soil C status by affecting crop biomass and microbial decomposition [22]. However, studies on the effects of N fertilizer on soil CO2 fluxes from mineral soils revealed conflicting results. For instance, increased N fertilization increased the nutrient status, plant biomass, and belowground C input via root exudates and turnover, which in turn elevated CO2 emissions due to higher microbial activity and biomass [23], whereas another study reported that the addition of N significantly depressed microbial communities due to the accumulation of toxic NH4+, which suppressed soil CO2 emissions [24]. Recent studies have evaluated the effect of N fertilizer on CO2 emissions in tropical peatlands and have found that N fertilizer had no significant effect on CO2 emissions [25,26]. However, a study by Jauhiainen et al. [27] reported that N fertilization significantly increased CO2 flux from agricultural land but significantly decreased it from degraded land, and therefore, its effect depends on specific sites and management practices. A review paper established that CO2 emissions were significantly higher in tropical peatland than in northern boreal and temperate peatlands, and increased significantly with N fertilization [28]. However, the response of soil respiration to N fertilization may also depend on the concentration of labile C in the soil [29,30]. Studies showed that microbial decomposition in peat was more enhanced by adding labile C and N than by adding only N [16,31].
To date, there have been few long-term studies where changes in environmental conditions and peat characteristics over time could show different soil respiration responses to GWL and addition of N. While the effects of N fertilizers on cultivated tropical peatland are still poorly known, an understanding of this subject is essential to develop approaches to ensure the sustainable management of tropical peatland for agriculture. Therefore, a long-term study was conducted in an oil palm plantation on a tropical peat soil to (1) quantify the annual CO2 emissions in response to N fertilization at different rates and (2) evaluate the effects over time of GWL and WFPS on SOC and CO2 fluxes.

2. Materials and Methods

2.1. Study Site and Experimental Design

The study site was an oil palm plantation located on a 9 m deep tropical peat in Sarawak, Malaysia. The regional climate is humid, tropical, and the site has average annual precipitation and air temperature of 2701 mm and 32.6 °C, respectively. Typically, in Sarawak, the wet season occurs from November to March, while the dry season occurs from May to September. The soil was classified as Typic Haplofibrist based on the USDA soil classification system [32]. The landscape was generally flat in the study area. The plantation land was opened in 2007 and planted in 2008, with oil palms at a density of 148 palms ha−1 in a triangular design (8.5 m between palms). Chaddy et al. [33] describe the site in greater depth.
A randomized complete block design was used (set up in 2009), with a control and three treatments of different N rates. There were three blocks (replications). Each block (1564 m2) included 36 oil palms, of which 4 in the middle of each replication plot were selected as gas sampling points. Blocks were separated by two to three rows of palms or field drains. The control (T1) had no N fertilization, while N treatments were: low (T2, 31.1 kg N ha−1 year−1), moderate (T3, 62.2 kg N ha−1 year−1), and high (T4, 124.3 kg N ha−1 year−1). Powdered ammonium sulphate was applied as the N fertilizer at a baseline rate of 62.2 kg N ha−1 year−1 (T3) following the guidance of Hasnol et al. [34]. Fertilizer was applied four times a year, in March, June, September, and November, at 2.0 m from the palm trunk. Chaddy et al. [33] have previously described the experimental design and treatment plots in their paper studying the effect of N fertilization on N2O emission.

2.2. Measurement of Soil CO2 Flux and Environmental Variables

Monthly soil CO2 fluxes were measured using a closed chamber method [3,35], starting in January 2010 until December 2013 and resuming from January 2016 to December 2017. Stainless-steel, white-painted chambers, 25 cm tall and 18.5–21.0 cm in diameter, were used. Four chambers were installed in each block at a point 2 m away from each selected palm (i.e., at the fertilization point). Chamber bases were installed approximately 3 cm into the soil surface. The chamber height was measured at three points inside the chamber, which was then left for 30 minutes to attain stability from any disturbance during installation. Gas fluxes in the field were measured between 9 a.m. and 11 a.m. The sampling of each treatment was performed simultaneously based on replication. Gas samples in the chamber headspace were taken at 0 and 4 min for CO2 after closing the chambers. A linear increase of CO2 concentration in the chamber within 6 minutes after the chamber was deployed was reported by Nakano et al. [35]. Gas samples were stored in Tedlar bags and CO2 concentrations were analyzed within 5 h after sampling using an infrared CO2 analyzer (ZFP-9, Fuji Electric Systems, Tokyo, Japan). The CO2 flux (F; mg C m−2 h−1) was calculated using the following equation:
F = p × (V/Sb) × (Δct) × (273/(273 + T)) × α,
where p is the CO2 density (1.977 kg m−3), Δct is the rate of change in gas concentration over time in the chamber headspace while the chamber was closed (10−6 × m3 m−3 h−1), V is the volume of the chamber (m3), Sb is the area of the chamber base (m2), T is the average air temperature (°C) during the sampling period (0 and 4 min), and α is the ratio of the molecular weight of C to CO2 (0.273). The annual cumulative soil CO2 emissions were calculated from the monthly mean values as follows:
Annual   cumulative   CO 2   emission =   i = 1 n 1 F i × D i
where Fi is the mean gas flux (t C ha−1 day−1) between two sampling times (i.e., for time interval), Di is the number of days in the sampling interval, and n is the sampling frequency.
Air temperature, GWL, and rainfall were also measured at each chamber concurrently with CO2 flux measurements. GWL was measured in a perforated PVC pipe forced into the ground and rainfall was collected and measured using a rain gauge.

2.3. Peat Sampling

Undisturbed peat core samples (0–5 cm) were collected at each gas sampling point using a core ring (100 cm3), followed by soil sampling at 0–25 cm using a peat auger (Eijelkemp, the Netherlands). The actual volume (solid and liquid phases) of the undisturbed core sample was measured in the laboratory using a digital actual volumenometer (DIK-1150, Daiki Rika, Saitama, Japan) for calculating the water-filled pore space (WFPS) and total porosity. Then, the samples were oven-dried at 105 °C for 48 h and reweighed to determine their bulk density (Bd) and moisture content. The WFPS and total porosity (Pt) were calculated using the following equations:
WFPS (%) = W/(W + A) × 100
Pt (%) = (W + A)/S) × 100
where W is the volume of water (cm3), A is the volume of air (cm3), and S is the volume of the core ring (cm3). Then, peat soil at 0–25 cm (higher root density zone) was sampled using a peat auger. The C and N contents were analyzed using a CN analyzer (LECO TruMac 4060, LECO Corporation, Saint Joseph, MI, USA). Loss on ignition (LOI) was measured using a thermogravimetric analyzer (Leco TGA701, LECO Corporation, Saint Joseph, MI, USA). The organic C content of the soil (SOC) is normally assumed to be 1/1.724 of the SOM content, 58% C in SOM [36]. Thus, SOC was calculated using the following equation:
SOC = LOI/1.724

2.4. Statistical Analysis

The differences in the annual cumulative CO2 emissions between the treatments and the years were analyzed with a two-way ANOVA (p < 0.05). Tukey’s HSD test was used to compare the mean difference (p < 0.05) of a given variable across the treatments. The relationships among CO2 flux, GWL, WFPS, SOC, and C:N ratio were further examined using linear regression analyses. All statistical analyses were conducted using SPSS Statistics Software version 21 (IBM, New York, NY, USA).

3. Results

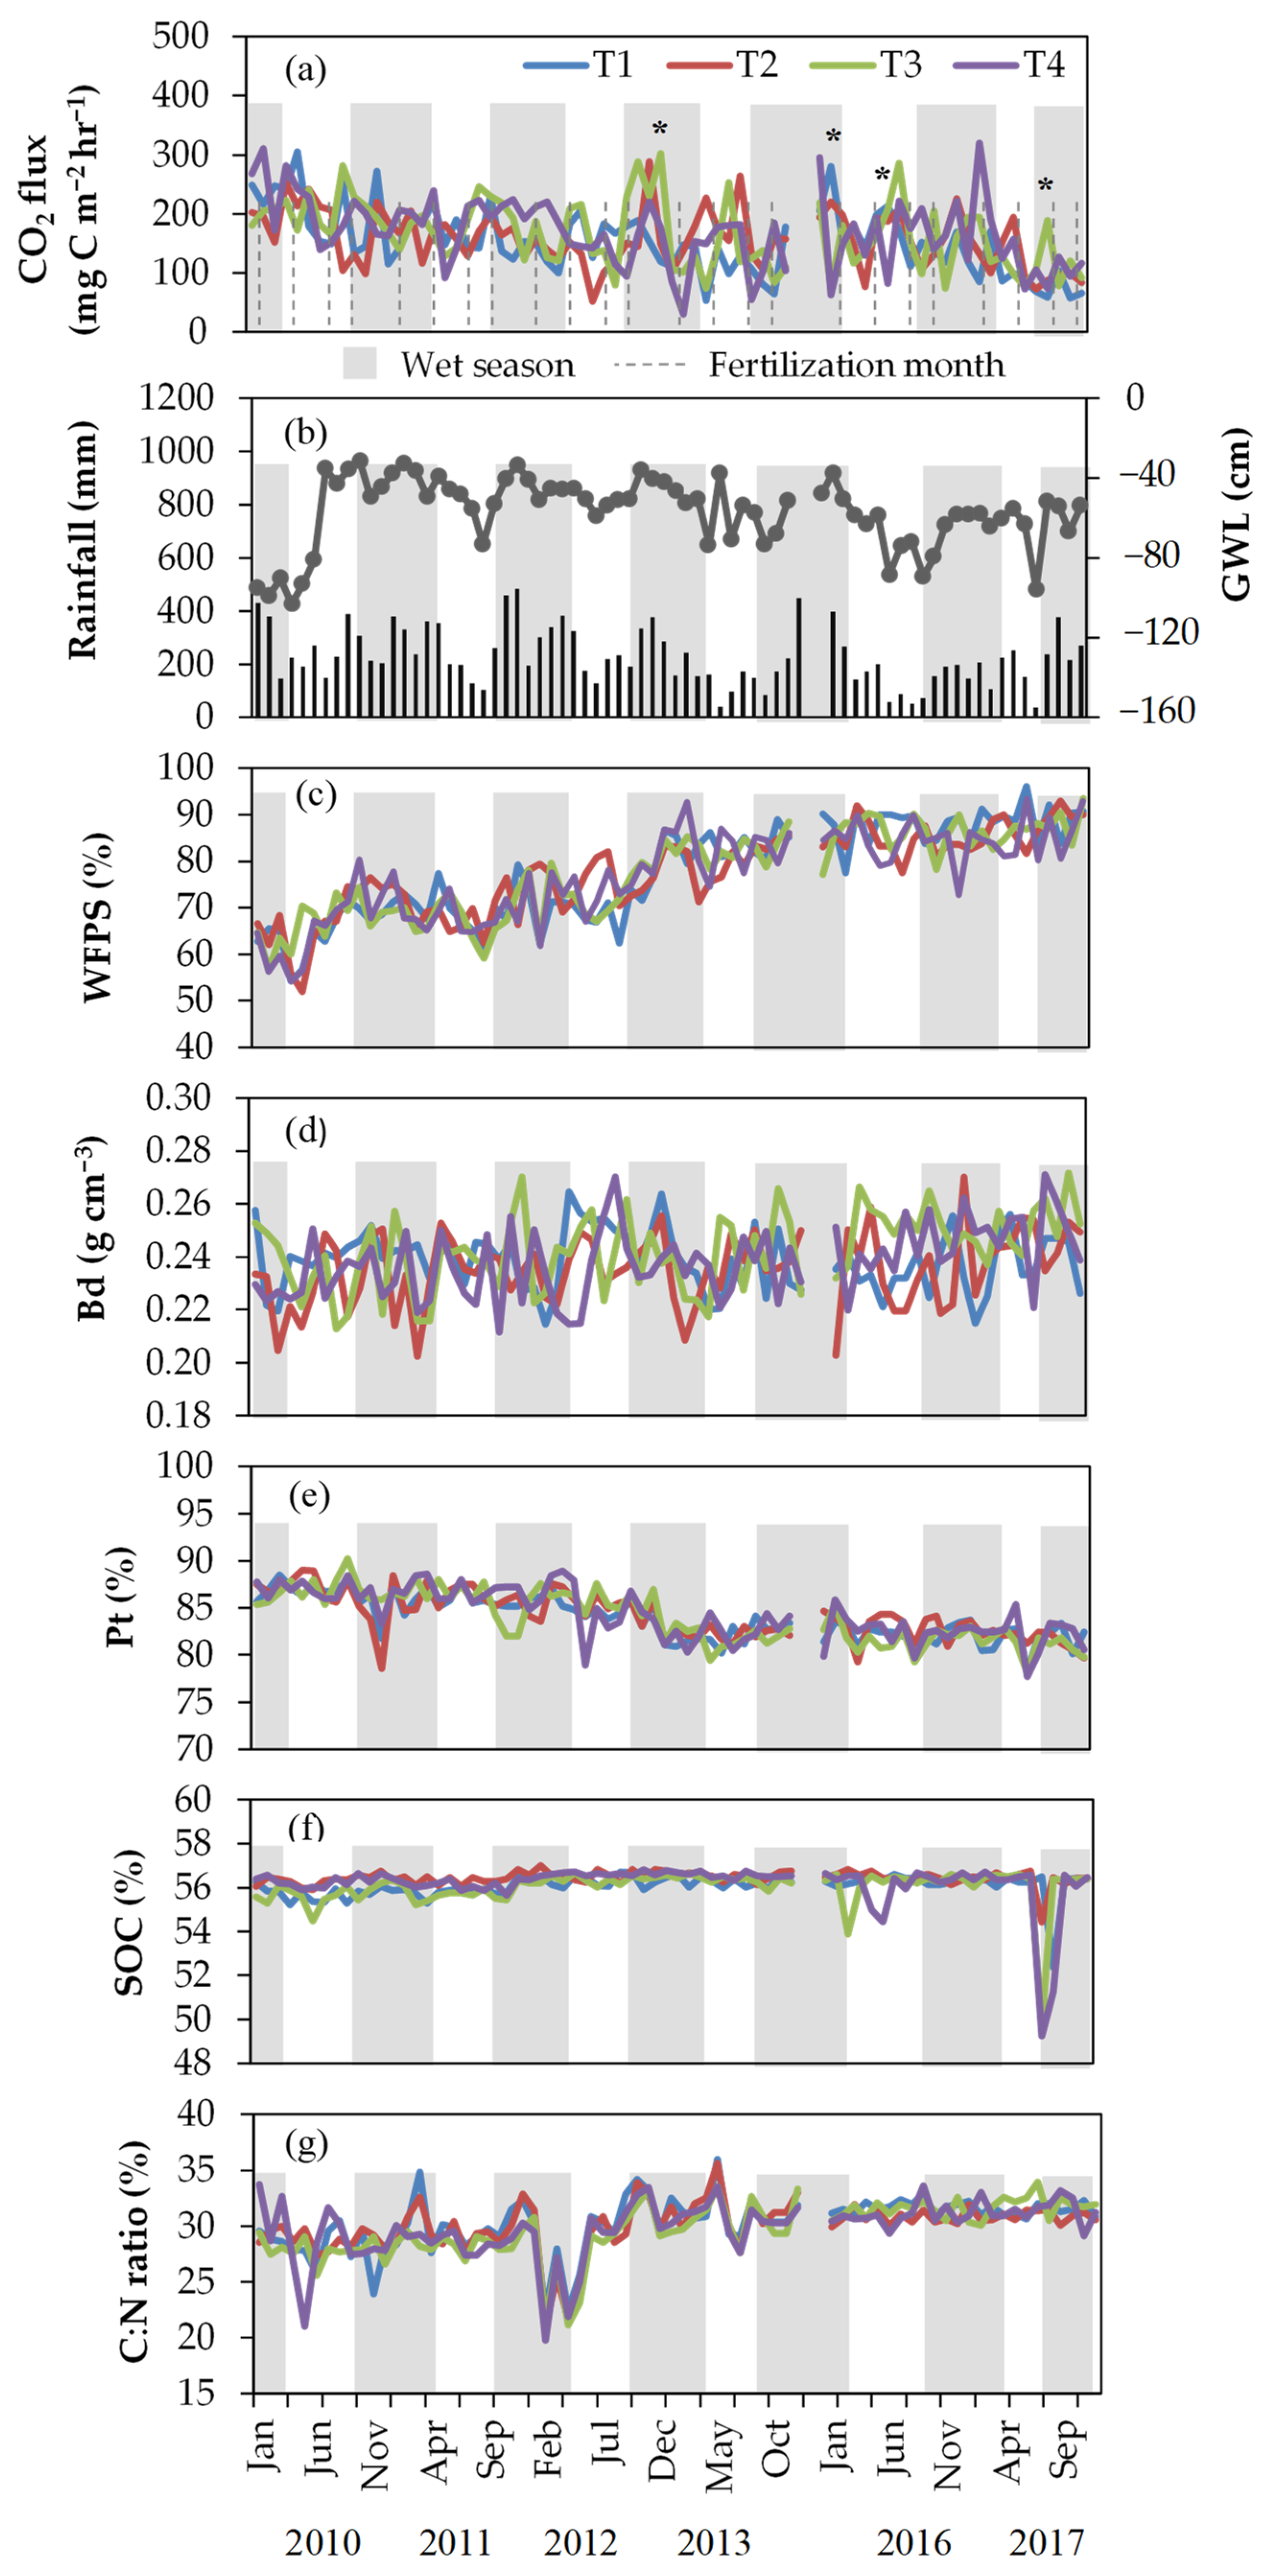
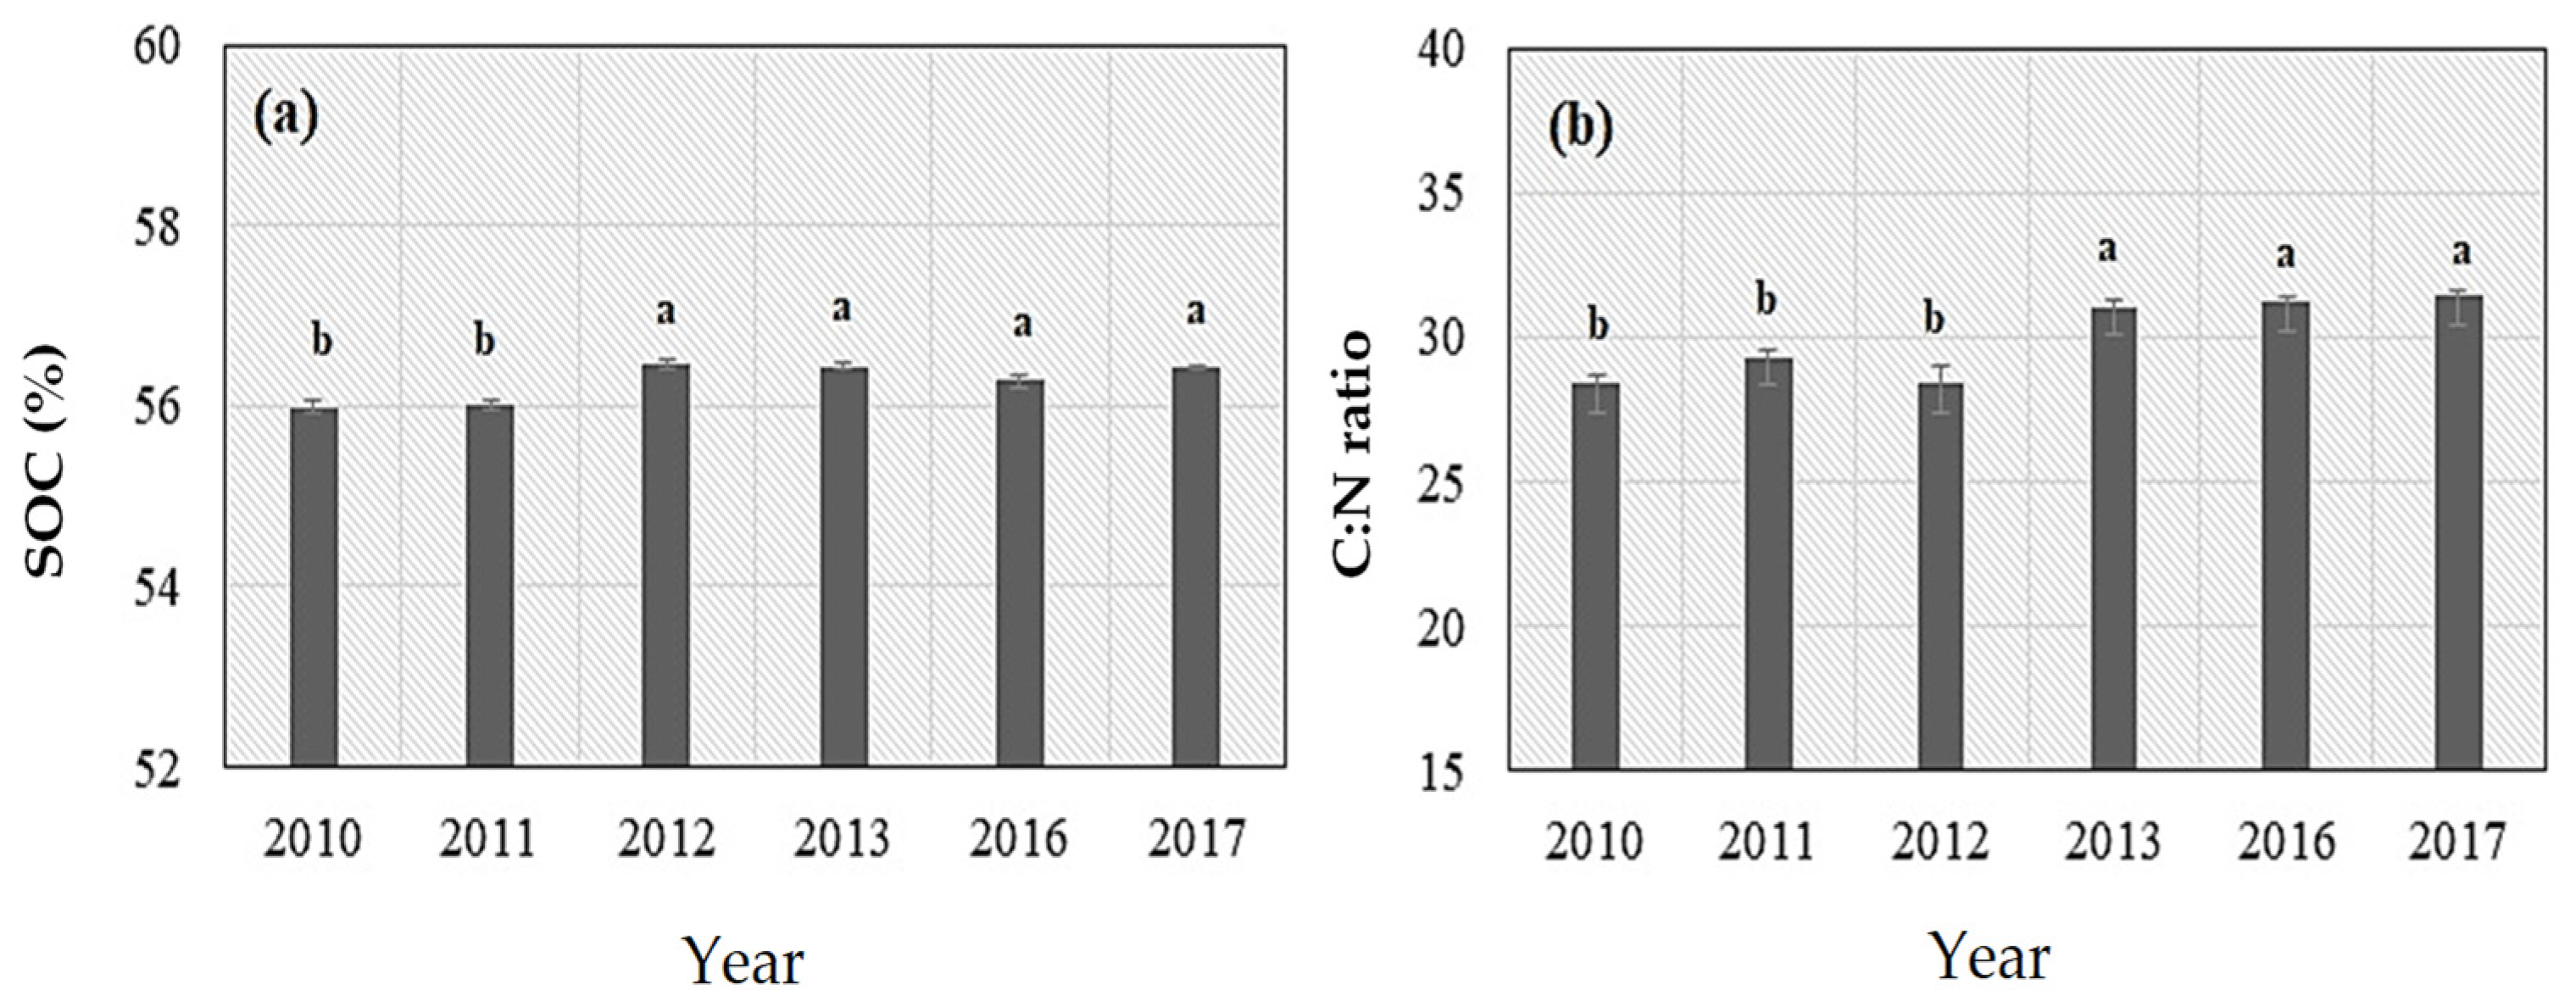
3.1. Soil CO2 Fluxes, Environmental Variables, and Soil Properties

Soil CO2 fluxes varied from 53.0 to 304.5 mg C m−2 h−1 for T1, 51 to 288.5 mg C m−2 h−1 for T2, 74 to 302.0 mg C m−2 h−1 for T3, and 29 to 320.2 mg C m−2 h−1 for T4 (Figure 1a). Monthly variations in soil CO2 fluxes were not significantly affected (p > 0.05) by the N fertilization treatments over the study period, except for January 2013, February 2016, July 2016, and September 2017. Soil CO2 flux from T3 was significantly higher than from T1 in January 2013 (p < 0.05) and September 2017 (p < 0.05). However, soil CO2 fluxes from both T3 and T4 were significantly lower than from T1 (p < 0.01) in February 2016, while soil CO2 flux from T4 only was significantly lower than from T1 (p < 0.05) in July 2016. Higher soil CO2 fluxes ranging from 172 to 309.8 mg C m−2 hr−1 occurred when GWL dropped from −80.9 to −103.4 cm below the peat surface from January to June 2010. A drop in WFPS was also recorded during the same period (Figure 1b,c). As shown in Table 1, annual cumulative CO2 emissions ranged from 7.7 ± 1.2 (mean ± SE) to 16.6 ± 1.0 t C ha−1 year−1 for T1, 9.8 ± 0.5 to 14.8 ± 1.4 t C ha−1 year−1 for T2, 10.5 ± 1.8 to 16.8 ± 0.6 t C ha−1 year−1 for T3, and 10.4 ± 1.8 to 17.1 ± 3.9 t C ha−1 year−1 for T4. The application of N fertilizer had no significant effect on annual cumulative CO2 emissions in each year (p = 0.448).
Bd varied from 0.20 to 0.27 g cm−3 while Pt ranged from 77.7% to 89.0% during the study period (Figure 1d,e). There were no significant differences among treatments for Bd and Pt (p < 0.05). Decreased Pt concurred with the increase in WFPS and the decrease in soil CO2 fluxes in all treatments with time (Figure 1a,c,e). Annual cumulative CO2 emissions under all treatments generally decreased with time (Table 1). Values for SOC ranged from 55.9% to 57.0% (Figure 1f), while C:N ratio ranged from 19.7 to 35.9 under the control and all treatments (Figure 1g). There were no significant differences found among treatments for SOC and C:N ratio (p < 0.05). SOC in 2012–2017 were significantly higher than 2010 and 2011 (p < 0.001), with an average increase of 0.7% (Figure 2a). C:N ratio was significantly higher in 2013–2017 compared with the period 2010–2012 (p < 0.001) (Figure 2b).

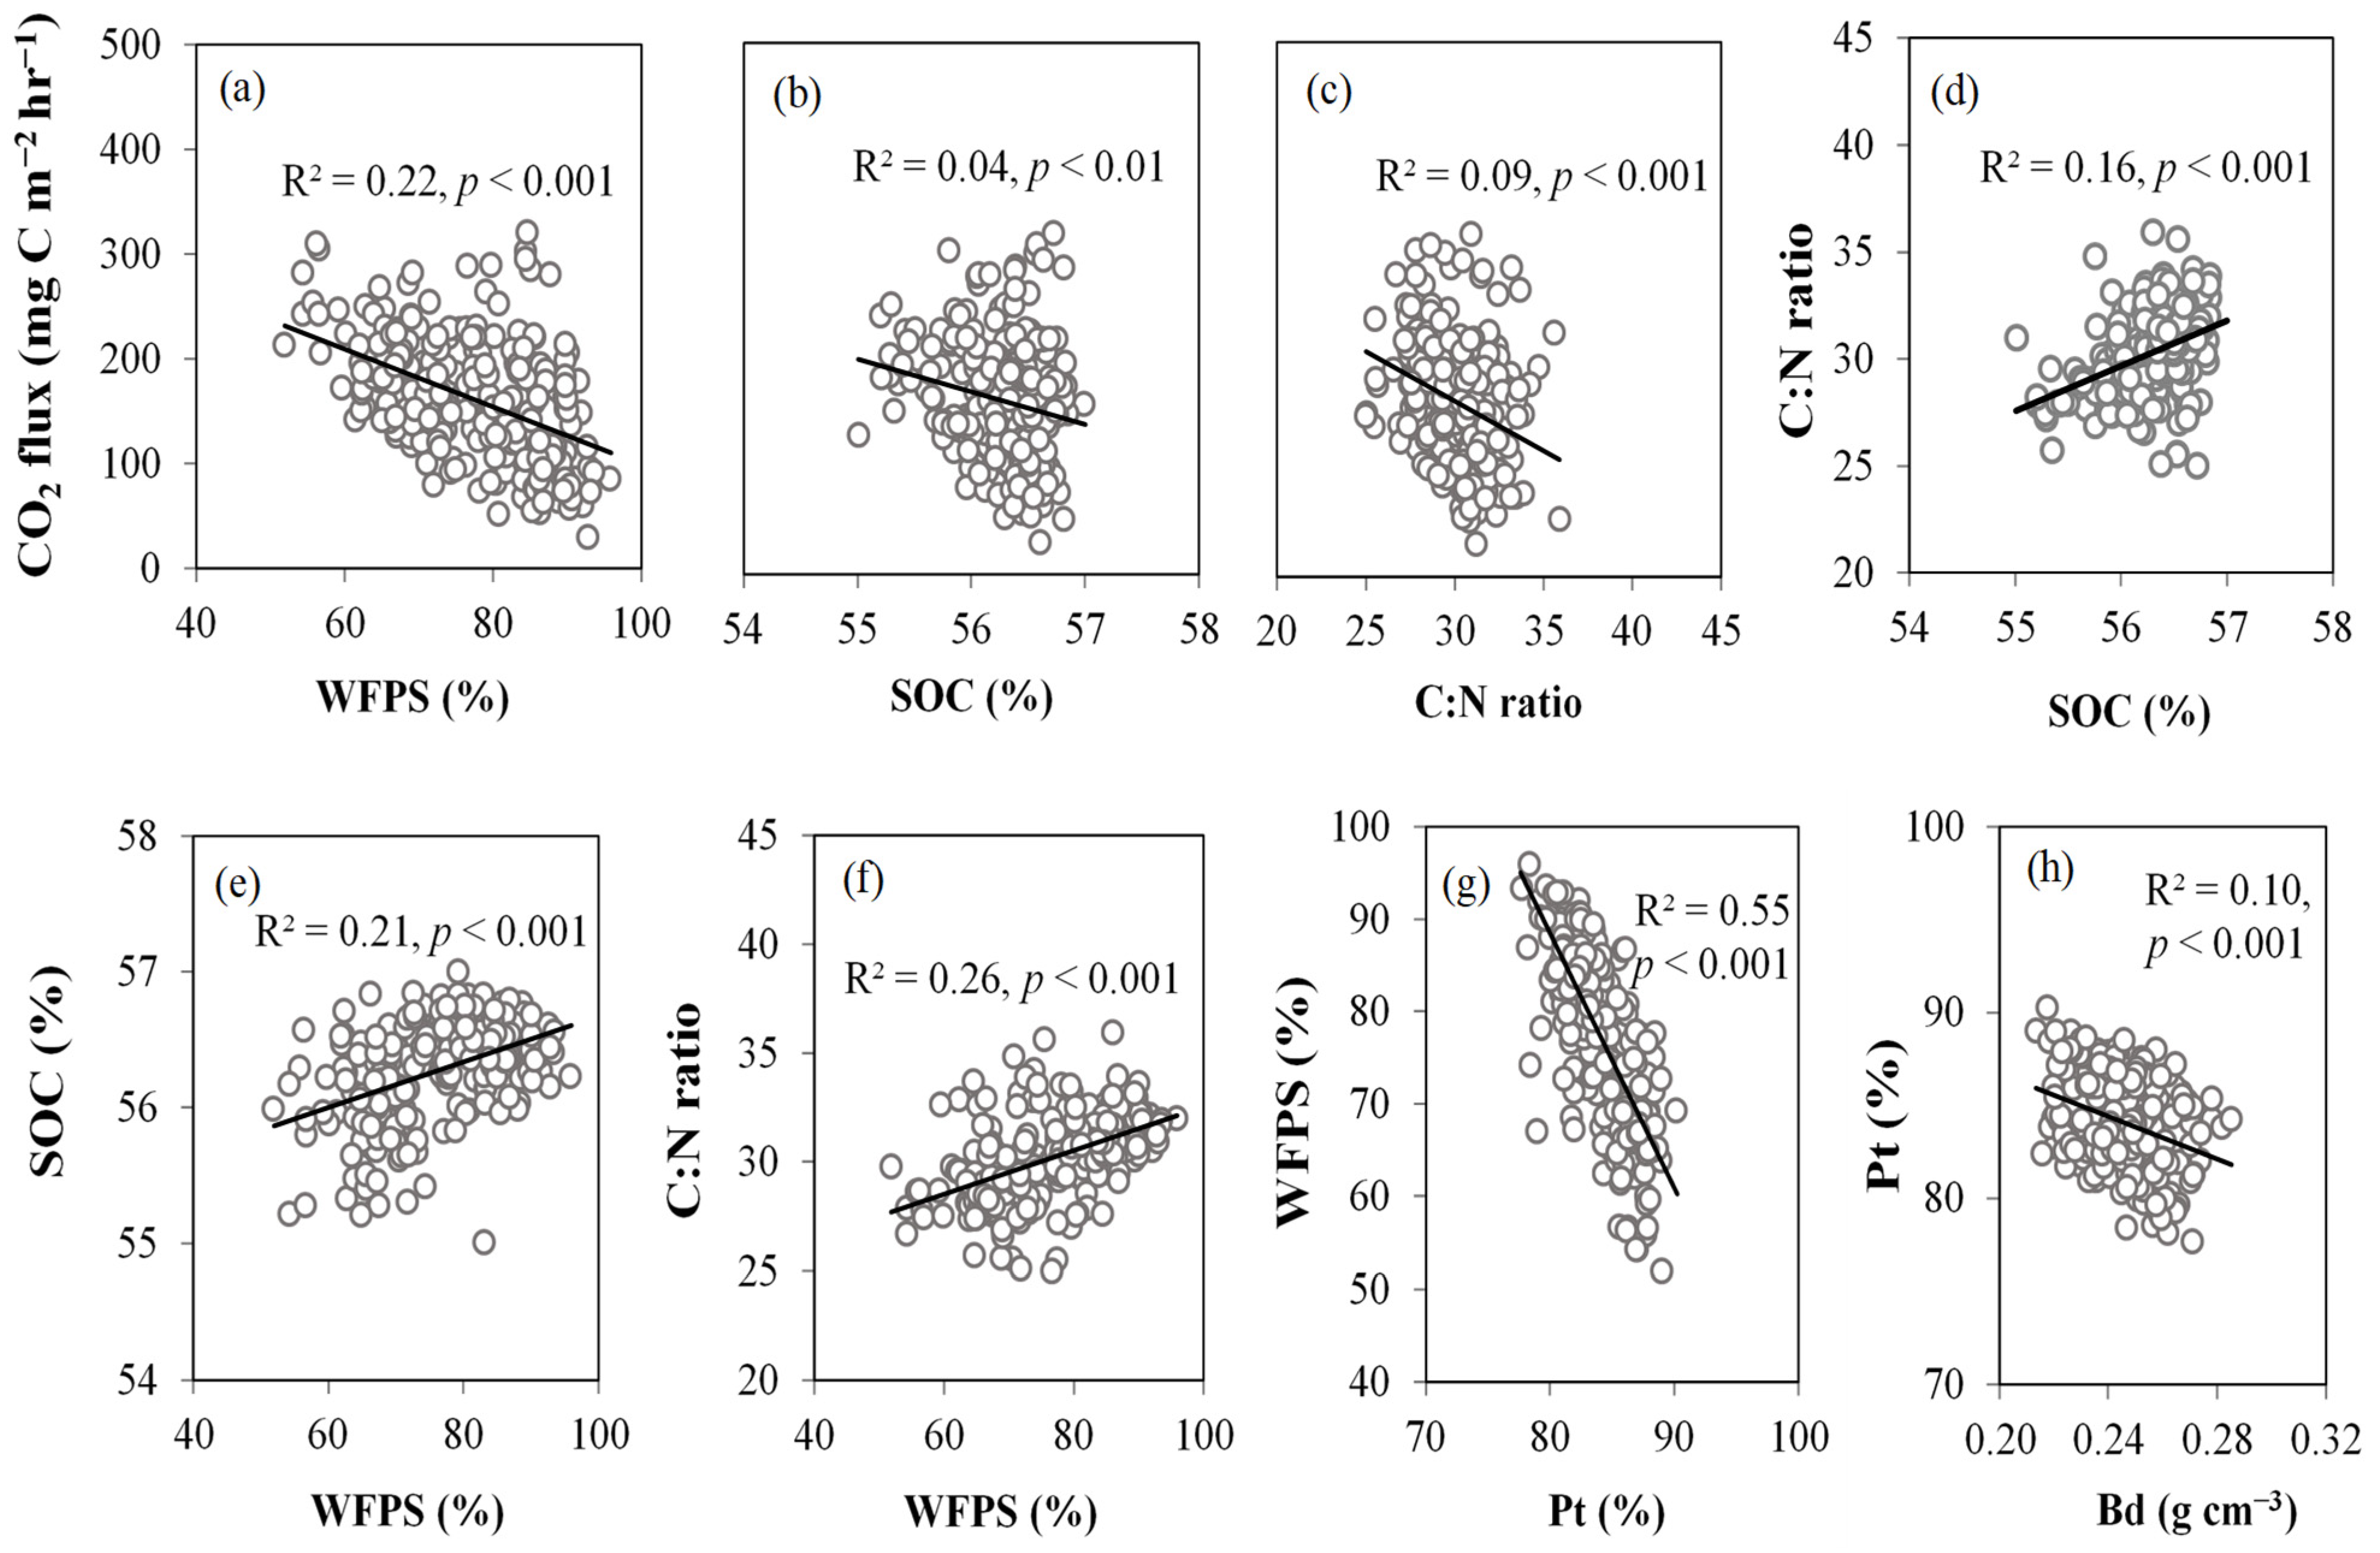
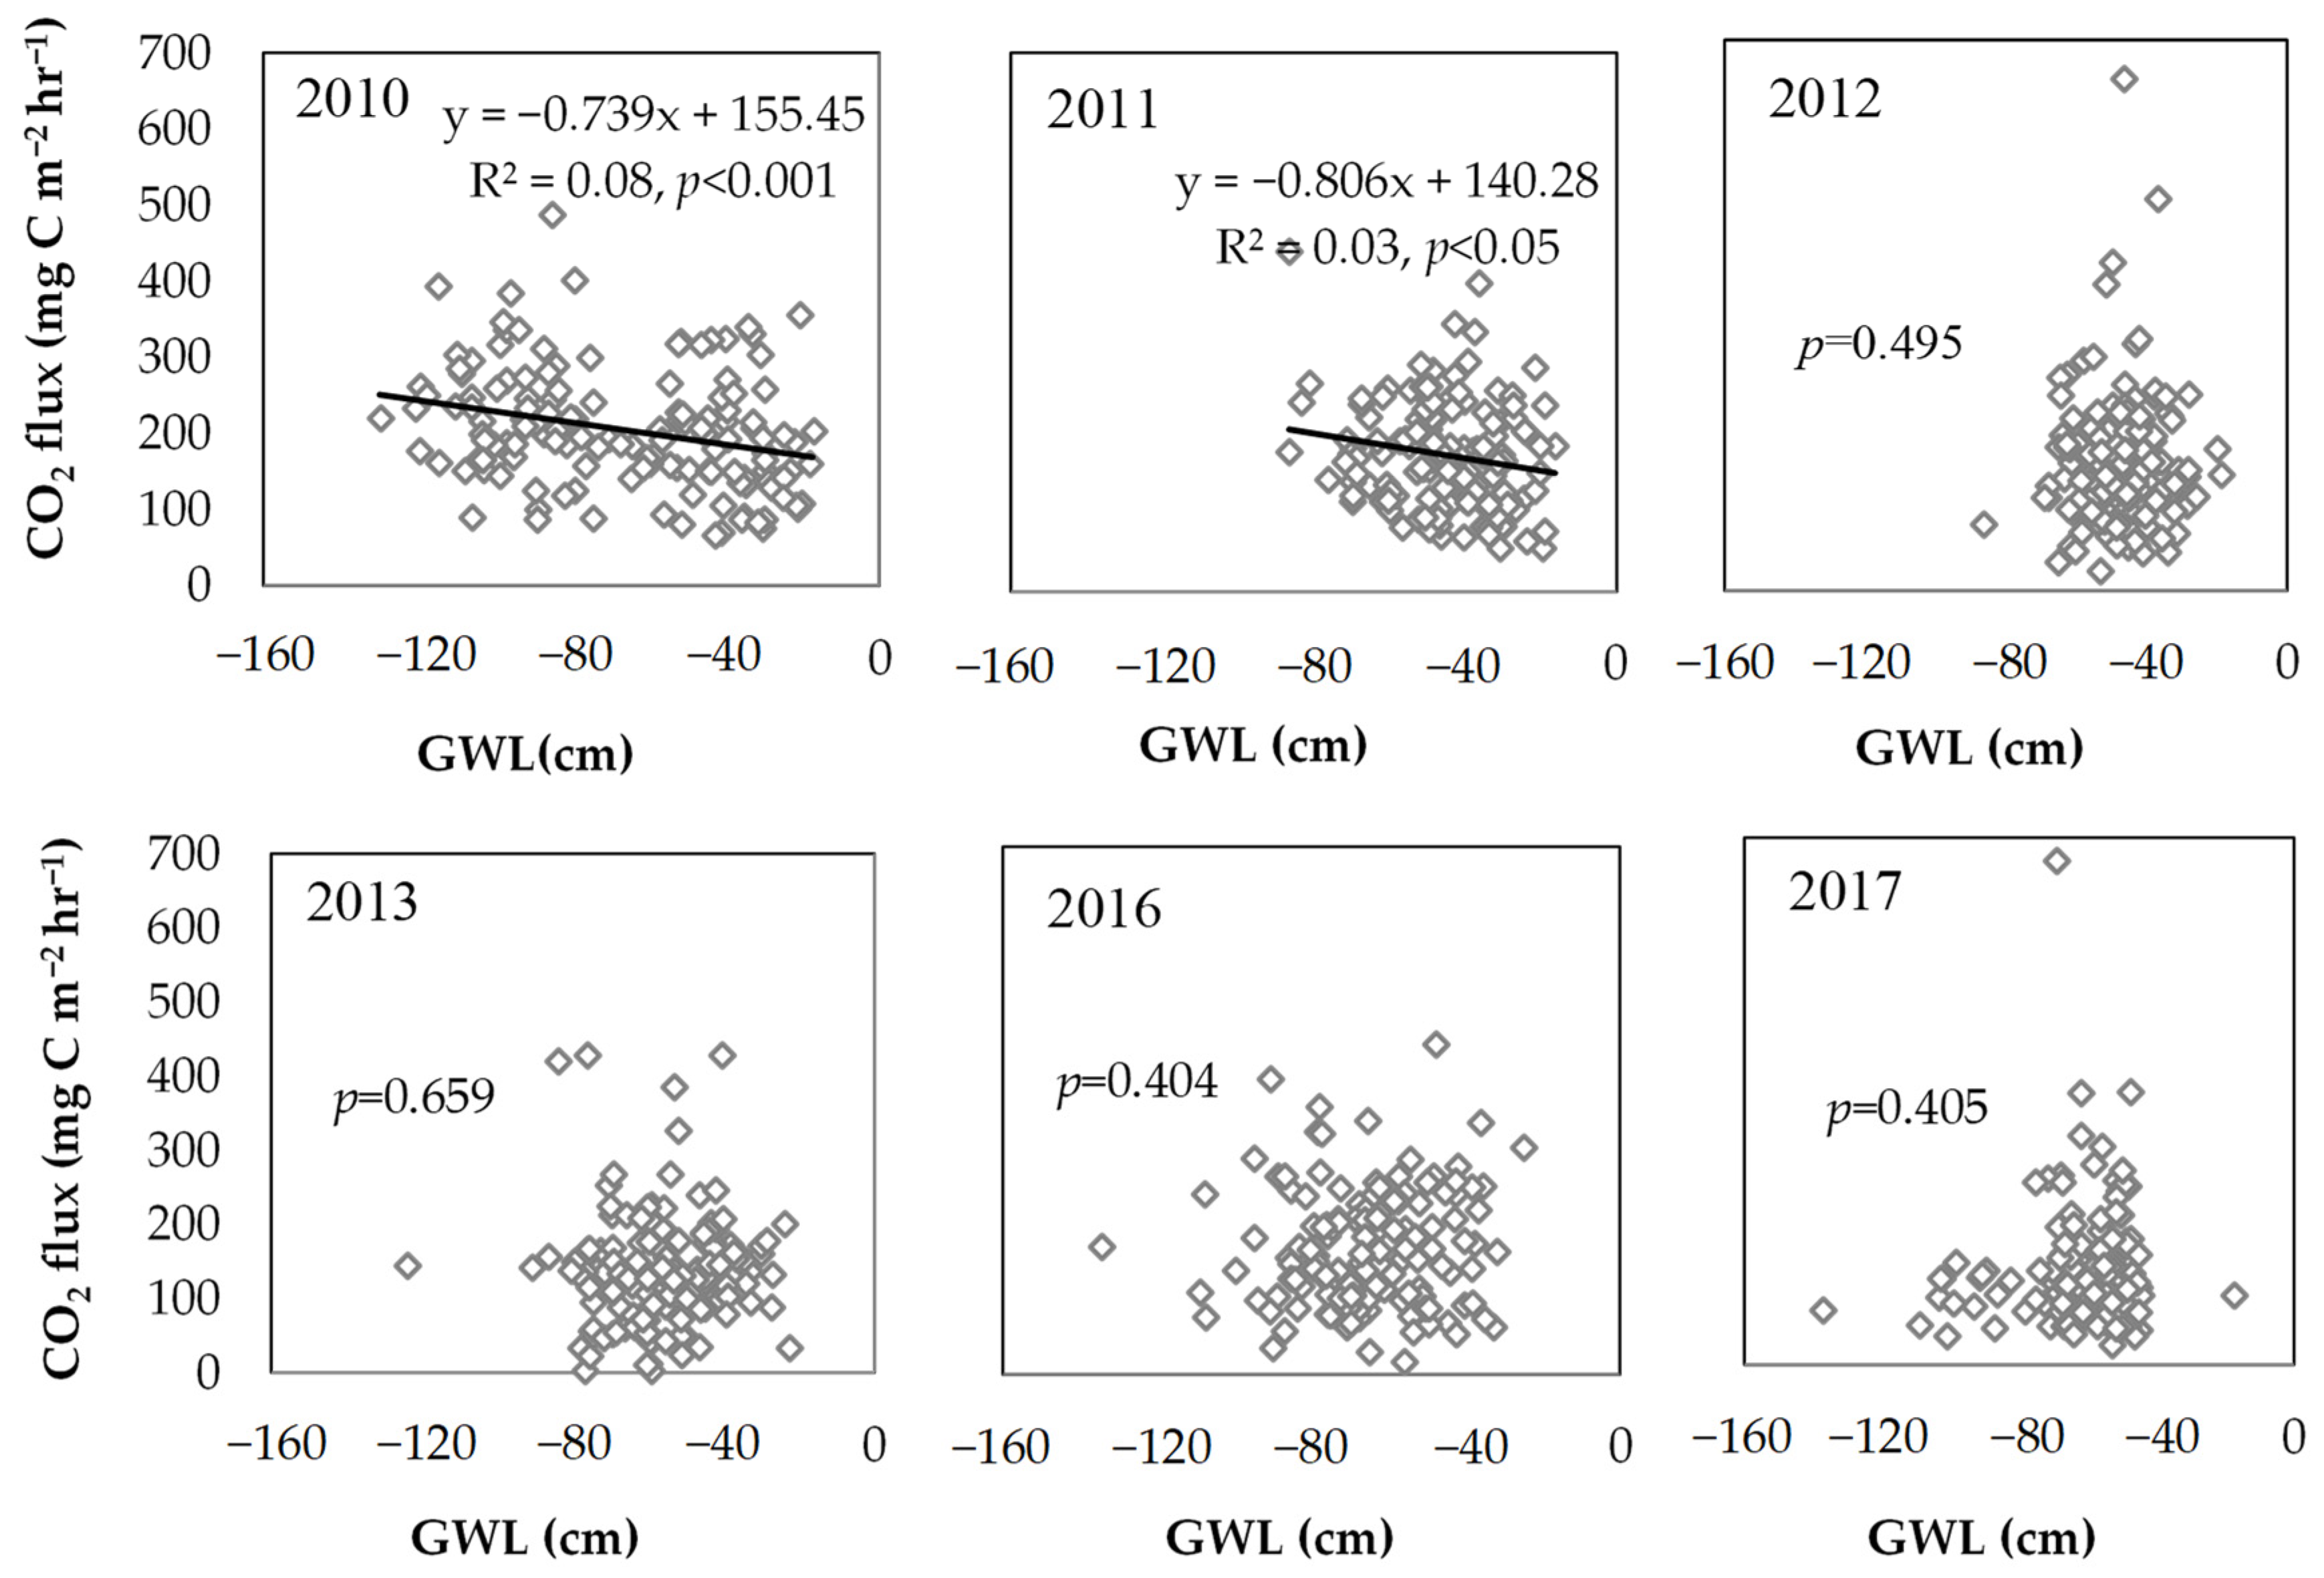
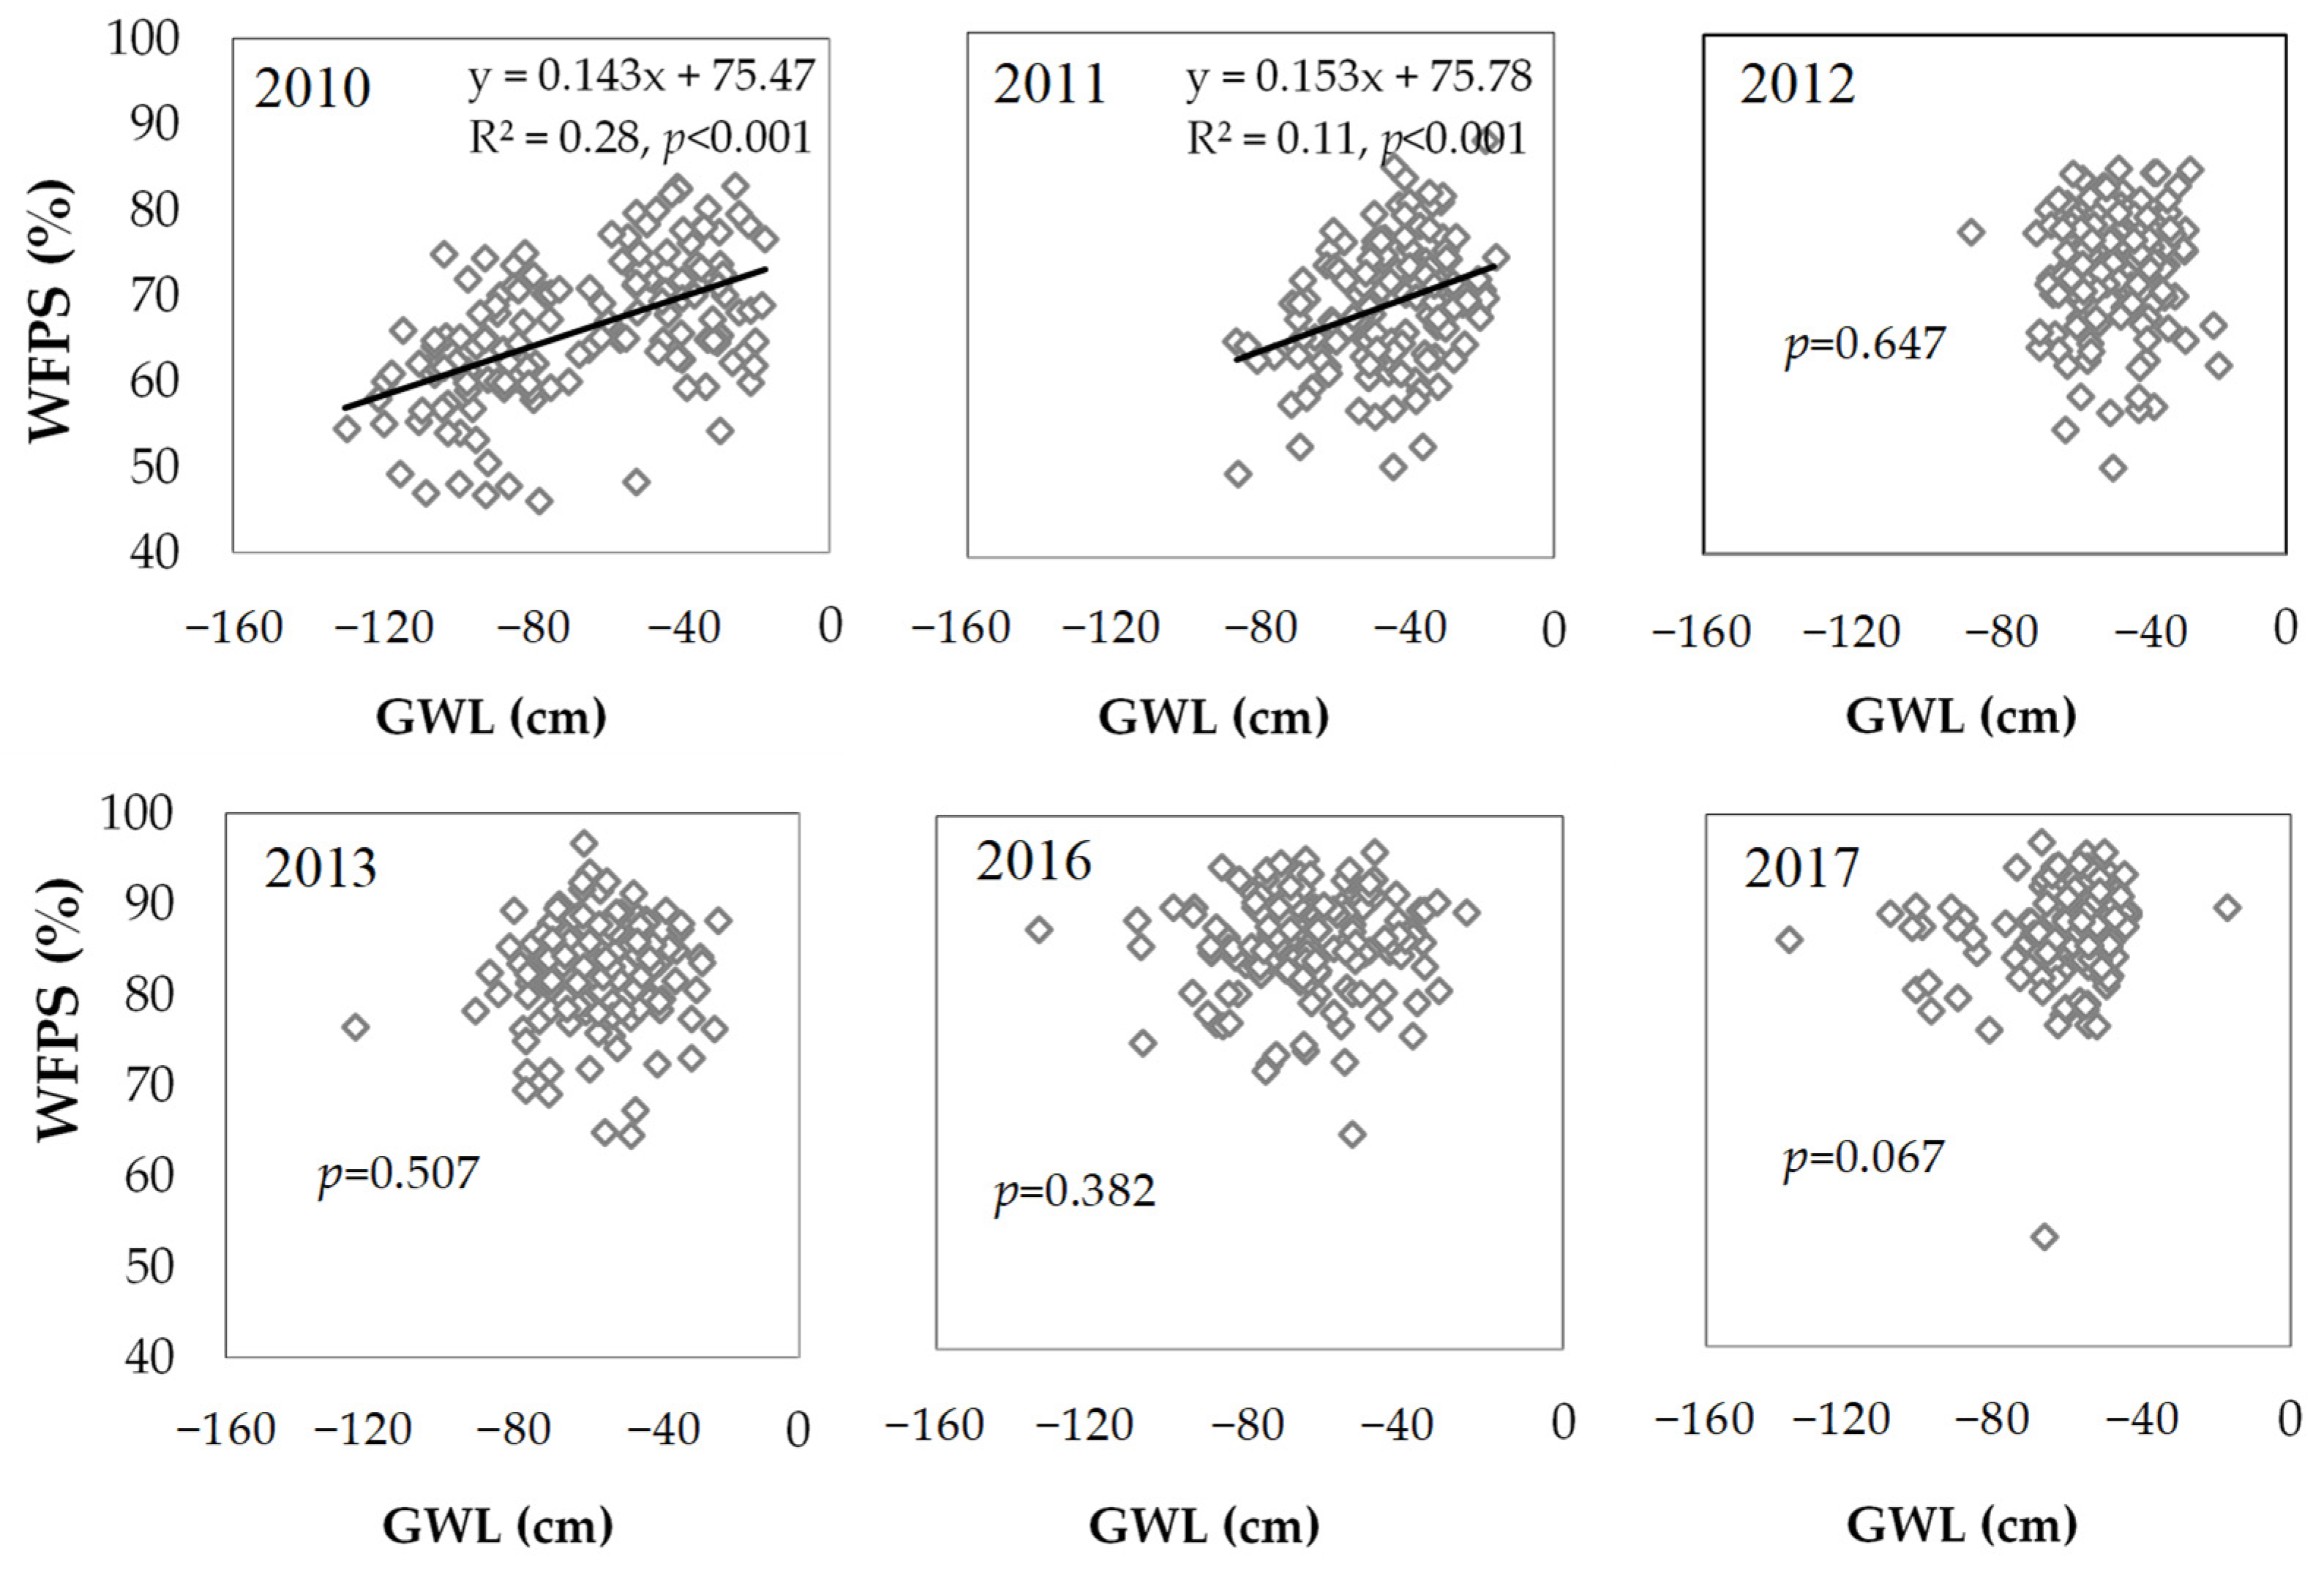
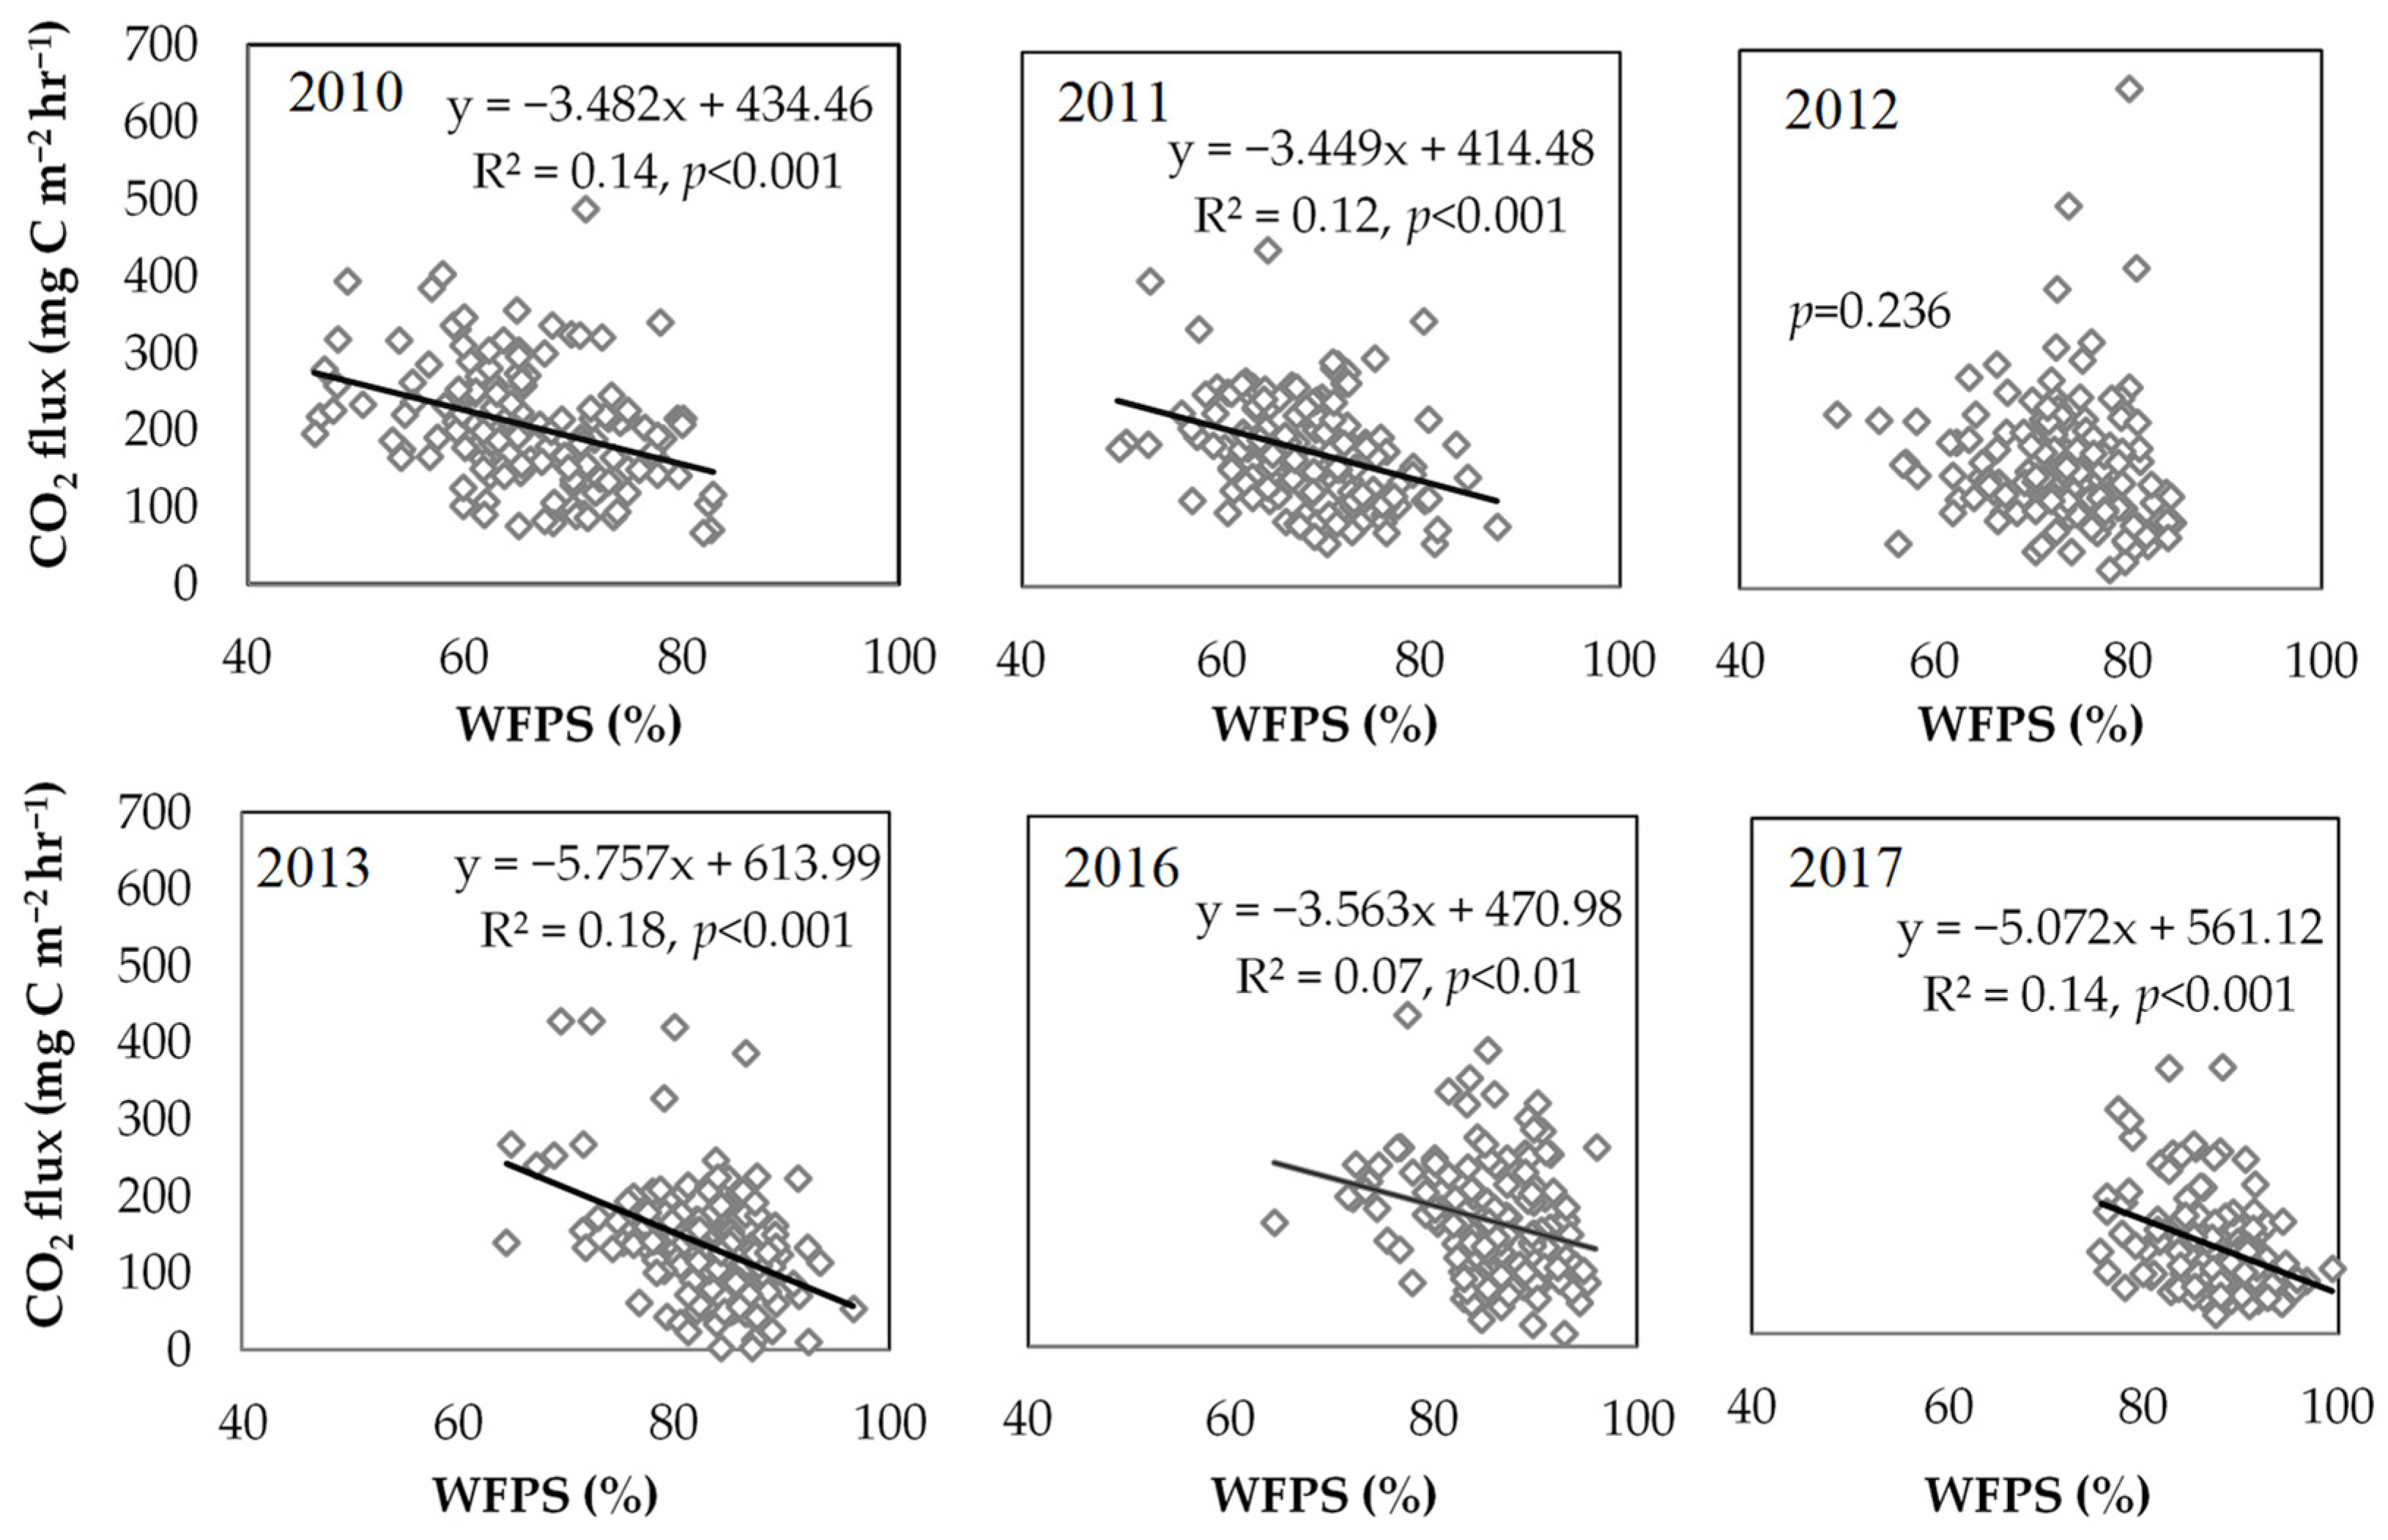
3.2. Factors Influencing CO2 Fluxes

A negative linear regression relationship between GWL and soil CO2 flux was found only in 2010 (p < 0.001) and 2011 (p < 0.05), when the oil palms were still young (Figure 3), demonstrating that lowering of GWL increased soil CO2 fluxes and vice versa. This concurred with the positive linear relationship between GWL and WFPS only in 2010 and 2011 (p < 0.001) (Figure 4), indicating that GWL had no significant effect on either WFPS or soil CO2 fluxes as the palms grew older. However, a negative linear relationship was obtained between WFPS and soil CO2 fluxes in oil palm every year except 2012 (Figure 5). Instead of GWL, WFPS was a more dominant factor affecting soil CO2 fluxes in oil palm plantations in tropical peatland, regardless of palm age. Fluxes of CO2 not only decreased linearly with the increase in WFPS (p < 0.001) (Figure 6a) but also with increases in SOC and C:N ratio, as shown by the negative linear relationship between SOC and soil CO2 fluxes (p < 0.01) (Figure 6b) and between C:N ratio and soil CO2 fluxes (p < 0.001) (Figure 6c). The C:N ratio was found to be strongly influenced by SOC, as shown by the significant positive relationship between SOC and C:N ratio (p < 0.001) (Figure 6d). In contrast to soil CO2 fluxes, SOC and C:N ratio had a positive linear relationship (p < 0.001) with WFPS (Figure 6e,f). WFPS was influenced by Pt, as indicated by the negative linear relationship between WFPS and Pt (p < 0.001) (Figure 6g). Pt was found to be influenced by Bd, as indicated by their negative linear relationship (p < 0.001) (Figure 6h).

4. Discussion

4.1. Effects of N Fertilization on Soil CO2 Emissions

Studies on the effect of N fertilization on soil CO2 emissions in tropical peatland had been conducted in sago palm cultivation [25], a 4-year-old oil palm plantation [26], agricultural and degraded land [27], and a 7-year-old oil palm plantation [10]. Our study found no significant effects of N fertilization on CO2 emissions (p = 0.448) (Table 1), similar to Watanabe et al. [25] and Sakata et al. [26]. The CO2 fluxes from this study (29 to 320.2 mg C m−2 h−1) were similar to or higher than those values from Watanabe et al. [25] and Sakata et al. [26] (23–223 mg C m−2 h−1). However, the effects of N fertilization on CO2 emissions depend on management practices. For instance, Jauhiainen et al. [27] found that soil CO2 increased in agricultural land but decreased in degraded land on tropical peatland. Controlled burning, GWL maintained close to the surface, and recurrent modest fertilization of agricultural land have impacted peat microbial communities to respond better to changes in environmental resources and conditions (e.g., fertilization) than situations in degraded land which experienced detrimental impacts, e.g., wild fires, extreme dryness, and flooding. High production of inorganic N was likely to occur during the short-term drop in GWL from January to June 2010, with a consequent large N pool in the study site. Therefore, the large N pool upon peatland conversion, which was probably above the threshold and exceeded the critical value (>400 ppm) for SOM decomposition, would probably cause a lack of N fertilizer effects on CO2 emissions in this study. This is further supported by the insignificant effects of N fertilization on oil palm yield at the same site [33]. Another point to consider is the low SOM quality [16]. The importance of labile SOC for peat decomposition was highlighted in an incubation study of tropical peat soil by Jauhiainen et al. [31], showing enhancement of heterotrophic CO2 production when combined addition of labile C and N was provided as compared to the addition of N only. According to a review by Kumar et al. [37], organic C can be classified into three main categories: (a) labile organic carbon (LOC), consisting of low molecular weight compounds that support heterotrophic bacterial growth, (b) semi-labile organic carbon (SLOC), consisting of high and low molecular weight compounds resistant to rapid microbial degradation (e.g., carbohydrates, partially hetero-polysaccharides), and (c) refractory organic carbon (ROC), dominated by the presence of LMW compounds resistant to microbial remineralization. It is a photo-chemically active material that is transformed to a biologically labile material. The highest degradation rates are LOC followed by SLOC and ROC. LOC was a more sensitive indicator for CO2 emissions [38].
Annual cumulative CO2 emissions decreased with the age of palm (Table 1). During early conversion, drainage decreased GWL and exposed the peat to aerobic conditions, which increased the rate of peat decomposition and the loss of labile C. This explains the higher CO2 emissions and lower C:N ratio during the early stages of oil palm growth in this study (Figure 1g). In contrast to Melling et al. [39], soil CO2 fluxes increased with the age of palm due to higher root biomass with palm age, suggesting that root respiration and microbial activity are associated with root turnover and root exudates as a major component of soil respiration in tropical peatland under oil palm. Root biomass, which increases with palm age, probably provides labile C through more fresh roots’ litter and exudates. However, according to Nelson et al. [40] and Wang et al. [41], root density does not accurately reflect root respiration and exudation activities since old coarse roots are usually less active than young fine roots. Moreover, fertilizer application at a distance of 1–2 m from the tree trunk would lead to reduced enzyme activities and decreased organic acid content, causing inadequate labile C for microbial activities [42]. The decrease in CO2 emissions with the increase in SOC and C:N ratio with the age of palm might be associated to recalcitrant C. Peat soils exposed to aerobic conditions over a long period are subjected to higher decomposition rates, and eventually, the organic materials will reduce to organic matter that is recalcitrant to further breakdown, even in slower decomposition [43,44], and this may explain the significant increase in SOC and C:N ratio in the years 2012 and 2013 (p < 0.001), respectively (Figure 2). Cooper et al. [44] reported that conversion from forest to mature oil palm resulted in a labile C pool reduction from ca. 70% to <20%, with an accompanying increase in the intermediate C pool (more stabilized soil carbon pool) (from ca. 20% to 70%) in surface peat.

4.2. Effects of WFPS and GWL on Soil CO2 Emissions

Peat drainage and compaction from machinery prior to oil palm cultivation together with initial higher decomposition rates improved the peat soil Bd, increasing micropores’ volume, capillary water, and water-retention capacity over time, causing peat to have a high water-retention capacity. In this study, WFPS was influenced by Pt more than GWL (Figure 6g). On the other hand, root growth, which increases with palm age, would likely compress the peat soils with resultant increased Bd and decreased total soil porosity. In this study, WFPS higher than 60% created anaerobic conditions which depressed aerobic microbial activity [45,46], decreased SOM mineralization, and increased C:N ratio (Figure 6e,f). This leads to a decrease in soil CO2 fluxes with time.
Lowering of the water table in oil palm plantations exposes peat to oxygen and leads to accelerated peat decomposition, which increases soil CO2 flux [5,47], as reflected by the negative relationship between GWL and soil CO2 fluxes only in 2010 and 2011 (p < 0.05) when the oil palm was still young (Figure 3). The WFPS was affected by GWL only in 2010 and 2011 (p < 0.001) (Figure 4). Soil respiration was linked to GWL in an area of lower root density where water uptake is the lowest [40,48], which explained the significant effects of GWL on soil CO2 fluxes in younger stages (p < 0.05) (Figure 3). In older stages, parameters such as root activity might be more predominant than GWL in governing WFPS and soil respiration in oil palm plantations when GWL was maintained near or within the rooting zone (0–50 cm). Expansion of the root zone laterally in older palms may make the active area of root water uptake from deeper layers, retaining high soil moisture content on the top layer. The root mat of oil palm, which is composed of a net of fibrous roots, is able to capture and control water availability in the soil surface environment around the growing space under the oil palm tree [49]. The effects of roots on WFPS are likely to be larger when the palms grow older due to the larger root biomass, causing a lack of correlation between GWL and WFPS as the age of the palms increased (p > 0.05) (Figure 4). Moreover, as the oil palm grows, its canopy will enlarge, resulting in decreased soil temperature and evaporation rate from the peat surface with consequent higher soil moisture. The correlation between GWL and soil moisture is weaker in peatlands with low GWL and controlled permanent drainage as compared to peatlands with high GWL and without controlled drainage [8]. Previous studies have shown that annual cumulative CO2 emissions for oil palm plantations with GWL between −91 and −36 cm range from 10.3 to 28.4 t C ha−1 year−1 [3,9,17,50]. Our values were lower and fell within the range of 7.7 ± 1.2 to 17.1 ± 3.9 t C ha−1 year−1.
In the peatland ecosystem, oxidative peat decomposition dominates heterotrophic respiration when it is drained [7,8]. The contribution of oxidative peat decomposition to total soil respiration ranged between 60% and 86% in oil palm plantations on tropical peat [9,10,11]. In addition, a review by Prananto et al. [51] reported that for shallower GWL (<0.5 m from ground surface), 66% of the total soil CO2 emissions was due to heterotrophic respiration, while for a deeper groundwater level (≥0.5 m), 84% of it was comprised of heterotrophic respiration. A study by Matysek et al. [52] showed the high contribution of autotrophic respiration to CO2 fluxes: 24% and 72% adjacent to the trunk (0.5 m distance) in 14- and 8-year-old plantations, respectively. However, autotrophic respiration declined exponentially to 25% 2 m away from the trunk, with no significant difference between the 14- and 8-year-old plantations. Thus, for this study, it is assumed that root respiration would probably not be dominant in contributing to soil respiration, considering the position of CO2 measurements in this study, which was 2 m from the palm.

5. Conclusions

Application of N fertilizers had no significant effect on CO2 emissions due to a large N pool upon peatland conversion and low SOM quality. Peat soils exposed to aerobic conditions over a long period probably had higher recalcitrant C than labile C, and this would reduce the decomposition rate, and hence, lead to lower soil CO2 fluxes. Retention of soil moisture content on the top layer was possibly due to the deep root water uptake caused by lateral expansion of the root zone in older palms, which highlights the importance of roots over WFPS and GWL in governing soil respiration in older oil palm plantations, especially when GWL is at the proximity of its rooting zone (0–50 cm). Representations by short-term studies on soil CO2 fluxes are probably unreliable in characterizing carbon emissions from oil palm plantations on tropical peatland due to significant temporal variation. Therefore, thorough examination and understanding of the interaction between root activity on CO2 fluxes and its roles in nutrient and water management strategies is crucial for sustainable use of tropical peatland.

Author Contributions

Conceptualization, A.C. and L.M.; methodology, A.C. and L.M.; formal analysis, A.C.; investigation, A.C.; resources, L.M.; data curation, A.C.; writing—original draft preparation, A.C.; writing—review and editing, A.C., K.I., K.J.G., Y.T. and R.H.; visualization, R.H.; supervision, R.H.; project administration, A.C.; funding acquisition, A.C. and L.M. All authors have read and agreed to the published version of the manuscript.

Funding

This research was funded by the Federal Government of Malaysia and the Sarawak State Government.

Acknowledgments

The authors gratefully acknowledge the assistance of Sarawak TROPI staff members in field trial management and data collection and analysis. The authors also wish to convey their great appreciation to Donny Sudid (Soil Branch, Department of Agriculture, Sarawak) for his experience and valuable assistance during this study.

Conflicts of Interest

The authors declare no conflict of interest. The funders had no role in the design of the study; in the collection, analyses, or interpretation of data; in the writing of the manuscript, or in the decision to publish the results.

References

  1. Page, S.E.; Morrison, R.; Malins, C.; Hooijer, A.; Rieley, J.O.; Jauhiainen, J. Review of Peat Surface Greenhouse Gas Emissions from Oil Palm Plantations in Southeast Asia; White Paper Number 15; International Council on Clean Transportation: Washington, DC, USA, 2011; pp. 1–78. Available online: https://theicct.org/sites/default/files/publications/ICCT_Peat-Emissions_Sept2011.pdf (accessed on 1 July 2021).
  2. Uning, R.; Latif, M.T.; Othman, M.; Juneng, L.; Mohd Hanif, N.; Nadzir, M.S.M.; Abdul Maulud, K.N.; Jaafar, W.S.W.M.; Said, N.F.S.; Ahamad, F.; et al. A Review of Southeast Asian Oil Palm and Its CO2 Fluxes. Sustainability 2020, 12, 5077. [Google Scholar] [CrossRef]
  3. Melling, L.; Hatano, R.; Goh, K.J. Soil CO2 flux from three ecosystems in tropical peatland of Sarawak, Malaysia. Tellus B Chem. Phys. Meteorol. 2005, 57, 1–11. [Google Scholar] [CrossRef]
  4. Hooijer, A.; Page, S.; Navratil, P.; Vernimmen, R.; van der Vat, M.; Tansey, K.; Konecny, K.; Siegert, F.; Ballhorn, U.; Mawdsley, N. Carbon Emissions from Drained and Degraded Peatland in Indonesia and Emission Factors for Measurement, Reporting and Verification (MRV) of Peatland Greenhouse Gas Emissions—A Summary of KFCP Research Results for Practitioners; IAFCP: Jakarta, Indonesia, 2014.
  5. Hirano, T.; Kusin, K.; Limin, S.; Osaki, M. Carbon dioxide emissions through oxidative peat decomposition on a burnt tropical peatland. Glob. Chang. Biol. 2014, 20, 555–565. [Google Scholar] [CrossRef] [PubMed]
  6. Millard, P.; Midwood, A.J.; Hunt, J.E.; Whitehead, D.; Boutton, T.W. Partitioning soil surface CO2 efflux into autotrophic and heterotrophic components, using natural gradients in soil δ13C in an undisturbed savannah soil. Soil Biol. Biochem. 2008, 40, 1575–1582. [Google Scholar] [CrossRef]
  7. Toma, Y.; Takakai, F.; Darung, U.; Kuramochi, K.; Limin, S.H.; Dohong, S.; Hatano, R. Nitrous oxide emission derived from soil organic matter decomposition from tropical agricultural peat soil in central Kalimantan, Indonesia. Soil Sci. Plant Nutr. 2011, 57, 436–451. [Google Scholar] [CrossRef] [Green Version]
  8. Jauhiainen, J.; Hooijer, A.; Page, S.E. Carbon dioxide emissions from an Acacia plantation on peatland in Sumatra, Indonesia. Biogeosciences 2012, 8, 8269–8302. [Google Scholar] [CrossRef] [Green Version]
  9. Dariah, A.; Marwanto, S.; Agus, F. Root-and peat-based CO2 emissions from oil palm plantations. Mitig. Adapt. Strateg. Glob. Chang. 2014, 19, 831–843. [Google Scholar] [CrossRef]
  10. Comeau, L.P.; Hergoualc’h, K.; Hartill, J.; Smith, J.; Verchot, L.V.; Peak, D.; Salim, A.M. How do the heterotrophic and the total soil respiration of an oil palm plantation on peat respond to nitrogen fertilizer application? Geoderma 2016, 268, 41–51. [Google Scholar] [CrossRef]
  11. Ishikura, K.; Darung, U.; Inoue, T.; Hatano, R. Variation in soil properties regulate greenhouse gas fluxes and global warming potential in three land use types on tropical peat. Atmosphere 2018, 9, 465. [Google Scholar] [CrossRef] [Green Version]
  12. Klingenfuß, C.; Roßkopf, N.; Walter, J.; Heller, C.; Zeitz, J. Soil organic matter to soil organic carbon ratios of peatland soil substrates. Geoderma 2014, 235, 410–417. [Google Scholar] [CrossRef]
  13. Ishikura, K.; Yamada, H.; Toma, Y.; Takakai, F.; Morishita, T.; Darung, U.; Limin, A.; Limin, S.H.; Hatano, R. Effect of groundwater level fluctuation on soil respiration rate of tropical peatland in Central Kalimantan, Indonesia. Soil Sci. Plant Nutr. 2017, 63, 1–13. [Google Scholar] [CrossRef] [Green Version]
  14. Itoh, M.; Okimoto, Y.; Hirano, T.; Kusin, K. Factors affecting oxidative peat decomposition due to land use in tropical peat swamp forests in Indonesia. Sci. Total Environ. 2017, 609, 906–915. [Google Scholar] [CrossRef] [Green Version]
  15. Könönen, M.; Jauhiainen, J.; Laiho, R.; Spetz, P.; Kusin, K.; Limin, S.; Vasander, H. Land use increases the recalcitrance of tropical peat. Wetl. Ecol. Manag. 2016, 24, 717–731. [Google Scholar] [CrossRef]
  16. Swails, E.; Jaye, D.; Verchot, L.; Hergoualc’h, K.; Schirrmann, M.; Borchard, N.; Wahyuni, N.; Lawrence, D. Will CO2 emissions from drained tropical peatlands decline over time? Links between soil organic matter quality, nutrients, and C mineralization rates. Ecosystems 2017, 21, 868–885. [Google Scholar] [CrossRef]
  17. Marwanto, S.; Sabiham, S.; Funakawa, S. Importance of CO2 production in subsoil layers of drained tropical peatland under mature oil palm plantation. Soil Tillage Res. 2019, 186, 206–213. [Google Scholar] [CrossRef]
  18. Könönen, M.; Jauhiainen, J.; Straková, P.; Heinonsalo, J.; Laiho, R.; Kusin, K.; Limin, S.; Vasander, H. Deforested and drained tropical peatland sites show poorer peat substrate quality and lower microbial biomass and activity than unmanaged swamp forest. Soil Biol. Biochem. 2018, 123, 229–241. [Google Scholar] [CrossRef]
  19. Kumar, A.; Kumar, M.; Pandey, R.; Zhi Guo, Y.; Cabral-Pinto, M. Forest soil nutrient stocks along altitudinal range of Uttarakhand Himalayas: An aid to Nature Based Climate Solutions. CATENA 2021, 207, 105667. [Google Scholar] [CrossRef]
  20. Kimura, S.D.; Melling, L.; Goh, K.J. Influence of soil aggregate size on greenhouse gas emission and uptake rate from tropical peat soil in forest and different oil palm development years. Geoderma 2012, 185, 1–5. [Google Scholar] [CrossRef]
  21. Mu, Z.; Huang, A.; Ni, J.; Xie, D. Linking annual N2O emission in organic soils to mineral nitrogen input as estimated by heterotrophic respiration and soil C/N ratio. PLoS ONE 2014, 9, e96572. [Google Scholar] [CrossRef] [PubMed] [Green Version]
  22. Green, C.J.; Blackmer, A.M.; Horton, R. Nitrogen effects on conservation of carbon during corn residue decomposition in soil. Soil Sci. Soc. Am. J. 1995, 59, 453–459. [Google Scholar] [CrossRef]
  23. Lee, K.H.; Jose, S. Soil respiration and microbial biomass in a pecan—Cotton alley cropping system in southern USA. Agrofor. Syst. 2003, 58, 45–54. [Google Scholar] [CrossRef]
  24. Bowden, R.D.; Davidson, E.; Savage, K.; Arabia, C.; Steudler, P. Chronic nitrogen additions reduce total soil respiration and microbial respiration in temperate forest soils at the Harvard Forest. For. Ecol. Manag. 2004, 196, 43–56. [Google Scholar] [CrossRef]
  25. Watanabe, A.; Purwanto, B.H.; Ando, H.; Kakuda, K.I.; Jong, F.S. Methane and CO2 fluxes from an Indonesian peatland used for sago palm (Metroxylon sagu Rottb.) cultivation: Effects of fertilizer and groundwater level management. Agric. Ecosyst. Environ. 2009, 134, 14–18. [Google Scholar] [CrossRef]
  26. Sakata, R.; Shimada, S.; Arai, H.; Yoshioka, N.; Yoshioka, R.; Aoki, H.; Kimoto, N.; Sakamoto, A.; Melling, L.; Inubushi, K. Effect of soil types and nitrogen fertilizer on nitrous oxide and carbon dioxide emissions in oil palm plantations. Soil Sci. Plant Nutr. 2014, 61, 48–60. [Google Scholar] [CrossRef]
  27. Jauhiainen, J.; Kerojoki, O.; Silvennoinen, H.; Limin, S.; Vasander, H. Heterotrophic respiration in drained tropical peat is greatly affected by temperature—A passive ecosystem cooling experiment. Environ. Res. Lett. 2014, 9, 105013. [Google Scholar] [CrossRef] [Green Version]
  28. Hatano, R. Impact of land use change on greenhouse gases emissions in peatland: A review. Int. Agrophys. 2019, 33, 167–173. [Google Scholar] [CrossRef]
  29. Ni, K.; Ding, W.X.; Cai, Z.C.; Wang, Y.F.; Zhang, X.L.; Zhou, B.K. Soil carbon dioxide emission from intensively cultivated black soil in Northeast China: Nitrogen fertilization effect. J. Soils Sediments 2012, 12, 1007–1018. [Google Scholar] [CrossRef]
  30. Tu, L.H.; Hu, T.X.; Zhang, J.; Li, X.W.; Hu, H.L.; Liu, L.; Xiao, Y.L. Nitrogen addition stimulates different components of soil respiration in a subtropical bamboo ecosystem. Soil Biol. Biochem. 2013, 58, 255–264. [Google Scholar] [CrossRef]
  31. Jauhiainen, J.; Silvennoinen, H.; Könönen, M.; Limin, S.; Vasander, H. Management driven changes in carbon mineralization dynamics of tropical peat. Biogeochemistry 2016, 129, 115–132. [Google Scholar] [CrossRef]
  32. Soil Survey Staff. Keys to Soil Taxonomy, 12th ed.; USDA-Natural Resources Conservation Service: Washington, DC, USA, 2014.
  33. Chaddy, A.; Melling, L.; Ishikura, K.; Hatano, R. Soil N2O emissions under different N rates in an oil palm plantation on tropical peatland. Agriculture 2019, 9, 213. [Google Scholar] [CrossRef] [Green Version]
  34. Hasnol, O.; Farawahida, M.D.; Mohd, H.; Samsudin, A. Re-evaluation of nutrients requirements for oil palm planting on peat soil. Planter 2014, 90, 161–177. [Google Scholar]
  35. Nakano, T.; Sawamoto, T.; Morishita, T.; Inoue, G.; Hatano, R. A comparison of regression methods for estimating soil-atmosphere diffusion gas fluxes by a closed-chamber technique. Soil Biol. Biochem. 2004, 36, 107–113. [Google Scholar] [CrossRef]
  36. Agus, F.; Hairiah, K.; Mulyani, A. Pengukuran Cadangan Karbon Tanah Gambut; Petunjuk Praktis; World Agroforestry Centre-ICRAF, SEA Regional Office dan Balai Besar Penelitian dan Pengembangan Sumberdaya Lahan Pertanian (BBSDLP): Bogor, Indonesia, 2011; 58p. Available online: https://balittanah.litbang.pertanian.go.id/ind/dokumentasi/buku/2011%20Agus%20et%20al%20Pengukuran%20karbon%20tanah%20gambut.pdf (accessed on 1 July 2021).
  37. Kumar, A.; Sharma, M.P. Review of methodology for estimation of labile organic carbon in reservoirs and lakes for GHG emission. J. Mater. Environ. Sci. 2014, 5, 653–660. [Google Scholar]
  38. Kumar, A.; Sharma, M.P. Estimation of greenhouse gas emissions from Koteshwar hydropower reservoir, India. Environ. Monit. Assess. 2017, 189, 240. [Google Scholar] [CrossRef]
  39. Melling, L.; Chaddy, A.; Goh, K.J.; Hatano, R. Soil CO2 fluxes from different ages of oil palm in tropical peatland of Sarawak, Malaysia as influenced by environmental and soil properties. Acta Hortic. ISHS 2013, 982, 25–35. [Google Scholar] [CrossRef]
  40. Nelson, P.N.; Banabas, M.; Scotter, D.R.; Webb, M.J. Using soil water depletion to measure spatial distribution of root activity in oil palm (Elaeis guineensis Jacq.) plantations. Plant Soil. 2006, 286, 109–121. [Google Scholar] [CrossRef]
  41. Wang, X.; Zhu, B.; Wang, Y.; Zheng, X. Field measures of the contribution of root respiration to soil respiration in an alder and cypress mixed plantation by two methods: Trenching method and root biomass regression method. Eur. J. For. Res. 2008, 127, 285–291. [Google Scholar] [CrossRef]
  42. Harianti, M.; Sutandi, A.; Saraswati, R.; Maswar, M.; Sabiham, S. Enzyme Activities in Relation to Total K, Ca, Mg, Fe, Cu, and Zn in Oil Palm Rhizosphere of Tropical Peatland in Riau, Indonesia. Biotropia 2018, 25, 202–213. [Google Scholar] [CrossRef]
  43. Zhang, H.; Zhou, Z. Recalcitrant carbon controls the magnitude of soil organic matter mineralization in temperate forests of northern China. For. Ecosyst. 2018, 5, 17. [Google Scholar] [CrossRef]
  44. Cooper, H.V.; Vane, C.H.; Evers, S.; Aplin, P.; Girkin, N.T.; Sjögersten, S. From peat swamp forest to oil palm plantations: The stability of tropical peatland carbon. Geoderma 2019, 342, 109–117. [Google Scholar] [CrossRef]
  45. Linn, D.M.; Doran, J.W. Effect of water-filled pore space on carbon dioxide and nitrous oxide production in tilled and nontilled soils. Soil Sci. Soc. Am. J. 1984, 48, 1267–1272. [Google Scholar] [CrossRef] [Green Version]
  46. van Lent, J.; Hergoualc’h, K.; Verchot, L.; Oenema, O.; van Groenigen, J.W. Greenhouse gas emissions along a peat swamp forest degradation gradient in the Peruvian Amazon: Soil moisture and palm roots effects. Mitig. Adapt. Strateg. Glob. Chang. 2019, 24, 625–643. [Google Scholar] [CrossRef] [Green Version]
  47. Couwenberg, J.; Dommain, R.; Joosten, H. Greenhouse gas fluxes from tropical peatlands in South-east Asia. Glob. Chang. Biol. 2010, 16, 1715–1732. [Google Scholar] [CrossRef]
  48. Hergoualc’h, K.; Hendry, D.T.; Murdiyarso, D.; Verchot, L.V. Total and heterotrophic soil respiration in a swamp forest and oil palm plantations on peat in Central Kalimantan, Indonesia. Biogeochemistry 2017, 135, 203–220. [Google Scholar] [CrossRef] [Green Version]
  49. Intara, Y.I.; Nusantara, A.D.; Supanjani, S.; Caniago, Z.; Ekawita, R. Oil palm roots architecture in response to soil humidity. Int. J. Oil Palm 2018, 1, 79–89. Available online: https://ijop.id/index.php/ijop/article/view/11/10 (accessed on 17 August 2021).
  50. Husnain, H.; Wigena, I.P.; Dariah, A.; Marwanto, S.; Setyanto, P.; Agus, F. CO2 emissions from tropical drained peat in Sumatra, Indonesia. Mitig. Adapt. Strateg. Glob. Chang. 2014, 19, 845–862. [Google Scholar] [CrossRef]
  51. Prananto, J.A.; Minasny, B.; Comeau, L.P.; Rudiyanto, R.; Grace, P. Drainage increases CO2 and N2O emissions from tropical peat soils. Glob. Chang. Biol. 2020, 26, 4583–4600. [Google Scholar] [CrossRef]
  52. Matysek, M.; Evers, S.; Samuel, M.K.; Sjogersten, S. High heterotrophic CO2 emissions from a Malaysian oil palm plantations during dry-season. Wetlands Ecol. Manag. 2018, 26, 415–424. [Google Scholar] [CrossRef] [Green Version]
Figure 1. Monthly (a) soil CO2 fluxes, (b) rainfall and GWL, (c) WFPS, (d) bulk density (Bd), (e) soil porosity (Pt), (f) soil organic carbon (SOC), and (g) C:N ratio under control and each treatment (2010–2017). * Significant at the 0.05 level of probability.
Atmosphere 12 01340 g001
Figure 2. Yearly mean of (a) SOC and (b) C:N ratio from 2010 to 2017. The letters (a, b) indicate a significant difference between years using Tukey’s Test HSD at p < 0.05.
Atmosphere 12 01340 g002
Figure 3. Relationship between GWL and CO2 fluxes over time (2010–2017).
Atmosphere 12 01340 g003
Figure 4. Relationship between GWL and WFPS over time (2010–2017).
Atmosphere 12 01340 g004
Figure 5. Relationship between WFPS and CO2 fluxes over time (2010–2017).
Atmosphere 12 01340 g005
Figure 6. Linear relationship between (a) water-filled pore space (WFPS) and CO2 flux, (b) soil organic carbon (SOC) and CO2 flux, (c) C:N ratio and CO2 flux, (d) SOC and C:N ratio, (e) WFPS and SOC, (f) WFPS and C:N ratio, (g) soil porosity (Pt) and WFPS, and (h) bulk density (Bd) and Pt.
Atmosphere 12 01340 g006
Table 1. Annual cumulative CO2 emissions (t C ha−1 year−1) (mean ± SE) under each treatment (n = 3).
YearT1T2T3T4Mean
201016.6 ± 1.0 a A14.8 ± 1.4 a A16.8 ± 0.6 a A17.1 ± 3.9 a A11.5 ± 0.5
201113.5 ± 1.6 a B13.4 ± 0.5 a AB14.7 ± 2.4 a AB15.3 ± 3.5 a A10.5 ± 0.5
201212.9 ± 0.6 a B10.9 ± 1.5 a AB13.9 ± 3.7 a AB13.2 ± 2.5 a A9.7 ± 0.4
20138.9 ± 0.6 a C13.0 ± 2.4 a AB10.7 ± 1.0 a B10.4 ± 1.8 a A8.4 ± 0.3
201614.0 ± 1.2 a AB13.2 ± 2.6 a AB13.0 ± 1.5 a AB13.0 ± 0.2 a A10.4 ± 0.1
20177.7 ± 1.2 a C9.8 ± 0.5 a B10.5 ± 1.8 a B11.4 ± 3.7 a A9.1 ± 0.4
Mean12.3 ± 1.0 a 12.5 ± 1.5 a13.2 ± 1.8 a13.4 ± 2.6 a
ANOVA
SourcedfMean SquareFp-value
N rates35.4991.2910.288
Year566.17915.5400.000
Year * N rates154.3651.0250.448
Error484.259
T1: without N fertilization, T2: low N (T2, 31.1 kg N ha−1 year−1), T3: moderate N (T3, 62.2 kg N ha−1 year−1), and T4: high N (T4, 124.3 kg N ha−1 year−1). The letters (a, b, c) in the row indicate a significant difference between treatments, while the letters (A, B, C) in the column indicate a significant difference between years using Tukey’s Test HSD at p < 0.05.
Publisher’s Note: MDPI stays neutral with regard to jurisdictional claims in published maps and institutional affiliations.

