Article

Indoor Air Quality in Healthcare and Care Facilities: Chemical Pollutants and Microbiological Contaminants

1
Département d’Hygiène, des Risques Environnementaux et Associés aux Soins, Faculté de Médecine, Université de Lorraine, F-54000 Lorraine, France
2
APEMAC EA4360, Université de Lorraine, F-54000 Nancy, France
3
EHESP School of Public Health, Inserm, Irset (Institut de Recherche en Santé, Environnement et Travail)—UMR_S 1085, Université de Rennes, F-35000 Rennes, France
4
EHESP, Inserm, Irset (Institut de Recherche en Santé, Environnement et Travail)—UMR_S 1085, Université de Rennes, F-35000 Rennes, France
5
Laboratoire de Parasitologie-Mycologie, CHU-Rennes, F-35000 Rennes, France
6
Département Territorial d’Hygiène et de Prévention du Risque Infectieux, CHRU-Nancy, F-54000 Nancy, France
*
Author to whom correspondence should be addressed.
Atmosphere 2021, 12(10), 1337; https://doi.org/10.3390/atmos12101337
Submission received: 15 September 2021 / Revised: 3 October 2021 / Accepted: 9 October 2021 / Published: 13 October 2021
(This article belongs to the Special Issue Chemical Speciation Monitoring and Measurement)

Abstract

:
The indoor air quality of healthcare and care facilities is poorly studied. The aim of this study was to qualitatively and quantitatively describe the chemical pollution and the microbiological contaminations of the indoor environment of these facilities. Methods: A wide range of chemical compounds (39 volatile and 13 semi-volatile organic compounds, carbon dioxide, fine particulate matter) and microorganisms (fungi and bacteria) were studied. Sampling campaigns were conducted in two French cities in summer 2018 and winter 2019 in six private healthcare facilities (general practitioner’s offices, dental offices, pharmacies) and four care facilities (nursing homes). Results: The highest median concentrations of chemical compounds (μg/m3) were measured for alcohols (ethanol: 378.9 and isopropanol: 23.6), ketones (acetone: 18.8), aldehydes (formaldehyde: 11.4 and acetaldehyde: 6.5) and terpenes (limonene: 4.3). The median concentration of PM2.5 was 9.0 µg/m3. The main bacteria of these indoor environments were Staphylococcus, Micrococcus and Bacillus genera, with median bacterial concentrations in the indoor air of 14 cfu/m3. The two major fungal genera were Cladosporium and Penicillium, with median fungal concentrations of 7 cfu/m3. Conclusions: Indoor air in healthcare and care facilities contains a complex mixture of many pollutants found in higher concentrations compared to the indoor air in French hospitals in a previous study.

1. Introduction

The indoor air quality of care facilities (nursing homes, elderly care centers, etc.) and private healthcare facilities (general practitioner’s offices, dental offices, pharmacies, etc.) is poorly studied. The most studied indoor environments are schools, housing buildings such as homes and hotels, and offices; only a few studies have been carried out in healthcare facilities such as hospitals, elderly care facilities and dental clinics [1]. Regarding dental clinics, studies investigating chemical pollutants have mainly been carried out in teaching hospitals [2,3,4]. These hospital dental clinics receive a large number of patients in large dental treatment rooms often fitted with mechanical ventilation systems, and, for these reasons, they are not comparable with private dental offices. Concerning elderly care facilities, a few studies have measured ambient parameters (temperature, relative humidity, carbon dioxide (CO2)), particulate matter (PM), and sometimes the total volatile organic compounds (TVOCs) with the formaldehyde concentration [5,6,7]. These studies did not provide a quantification of a large range of chemical pollutants and microbiological contamination. To the best of authors’ knowledge, only one indoor air quality study has been performed in pharmacies [8], and none in general practitioner’s offices.
Knowledge of indoor air quality in establishments for both public and worker uses is important, especially where the public is potentially vulnerable. This is the case for healthcare institutions. The patients arriving for consultation are often ill and potentially immunocompromised, and elderly people are generally in poorer health. Moreover, senior citizens spent more than 80% of their time indoors at home [9]. The workers are also widely exposed to indoor air in work environments because they spend more than 30% of their time working indoors [10]. The quantification of chemical pollutants in the indoor air of these facilities provides the data necessary to conduct—as a second step—a quantitative health risk assessment of the chronic inhalation of the identified chemical compounds.
Indoor air contains a mixture of chemical and microbial compounds that can affect the health of exposed people [11,12]. Individuals are exposed to volatile organic compounds (VOCs) and semi-volatile organic compounds (SVOCs) through inhalation, skin contact and ingestion depending on their gaseous or particulate form [13]. It is now well established that organic compounds may lead to various health troubles [14,15]. The chemical pollutants may come from various products such as cleaning solutions, detergents and disinfectants, which are largely used in healthcare facilities to reduce the risk of infection [16]. They may also be emitted from building materials and the outdoor environment [17,18]. The level of PM in the air can be affected by humans walking indoors [19] as well as by outdoor air [18]. PM, including fine particles less than 2.5 µm in diameter (PM2.5), is a risk factor for mortality and morbidity [20]. Exposure to bacteria and fungi is mainly via the inhalation, digestive or skin routes. It can contribute to a wide variety of health problems such as infection, allergy or intoxication. Among them, vulnerable patients are particularly at risk of fungal infection or allergy that still represent a high disease burden [21]. Due to the nature of their activities, healthcare facilities are at higher risk of microbiological contamination, in line with the infectious nature of the patients and interventions [22]. Medical environments receiving ill patients can be contaminated by skin contact, the liberation of skin scale [23] or bioaerosols generated by patients (talking, breathing, sneezing or coughing), which contaminate the indoor air and the surfaces by sedimentation [22]. Consequently, healthcare workers and patients are exposed to numerous infectious agents from these medical environments and are potentially multidrug-resistant [24]. This may promote the cross-transmission of microorganisms or even infections through healthcare and care facilities, and eventually, propagation to the community.
In a previous study [25], we described the chemical pollutants and microbiological contaminants in the indoor air of two French hospitals. The indoor air pollution of the French hospitals was low, probably due to the central air conditioning systems. These systems remove aerosol pollutants and decrease indoor aerosols with a high air-exchange rate. With a similar approach, the aims of this study were to qualitatively and quantitatively describe and to analyze the seasonal variations in the chemical pollution and the microbiological contamination of the indoor environment of healthcare and care facilities during summer and winter in two French urban areas.

2. Materials and Methods

2.1. Study Sites and Sampling Period

The study was carried out in two French urban areas (Nancy and Rennes) in June 2018 for the summer campaign and February 2019 for the winter campaign. In each urban area, the investigation was conducted in five facilities: three private healthcare facilities (general practitioner’s office, dental office and pharmacy) and two care facilities (nursing homes). For each facility, samples were collected during a typical week of activity. These sampling locations were selected based on the diversity of their care activities, the nature of chemical compounds used and their representativeness. Participation was voluntary and without any compensation.

2.2. Building Characteristics

All healthcare and care facilities were in urban and suburban areas. Most buildings were not recent constructions (built before the year 2000) (90%), except one nursing home, which dated back to 2014. The mean volumes of sampled rooms in general practitioner’s offices, dental offices and pharmacies were 45 ± 20, 37 ± 12 and 320 ± 137 m3, respectively. In nursing homes, the mean volumes of bedrooms and common rooms were 60 ± 7 and 510 ± 199 m3, respectively. All nursing homes had mechanical ventilation (4/4), and 50% of dental offices (1/2) were fitted. General practitioner’s offices and pharmacies used only window openings. Most sampled rooms had exterior walls with windows (90%, 9/10) and air conditioners (60%, 6/10). Characteristics of the buildings and sampled rooms are described in Table S1.

2.3. Sampling Strategies

In each facility, air samples were collected from two rooms—bedroom and common room (refectory or lounge) in nursing homes, consulting room and waiting room in general practitioner’s offices, treatment room and waiting room or sterilization room in dental offices, and storage room and commercial space in pharmacies—in order to estimate spatial variability in chemical pollution and microbiological contamination in indoor air.
Sampling campaigns were conducted twice over a period of four and a half consecutive days (Monday morning to Friday midday) in order to include every single activity and to estimate temporal variability. Four rooms (two facilities) were sampled per week, and the campaign (for each urban area and each season) was conducted for three consecutive weeks.
The sampling location in each room was chosen to be the most representative of average pollution, when possible, in the center of the room, and at least one meter away from any obstacles (such as furniture or medical devices). Areas directly exposed to ventilation, near to doors and windows or in the immediate vicinity of furniture and walls were avoided. The location was also chosen in order to avoid sampling and measurement equipment exposure to direct sunlight. The equipment was set on a tripod at the height of respiratory tracts, approximately 150 cm above ground level, according to NF EN ISO 16000-1.

2.4. Ambient Parameters and PM Measurement

Ambient parameters were measured continuously during both sampling campaigns in all facilities. Temperature, relative humidity, atmospheric pressure and CO2 were measured with Class’Air® (PYRESCOM, Canohès, France) in each room at intervals of 10 min during four and a half days by the campaign. Based on the CO2 measurements, an indoor air stuffiness index ranging from 0 to 5—called ICONE—was calculated with Microsoft® Excel (Microsoft Corporation, Redmond, WA, USA) according to Equation (1) [26].
ICONE = 8.3 log (1 + f1 + 3f2)
where f1 is the proportion of CO2 concentration values between 1000 and 1700 ppm, and f2 is the proportion of CO2 concentration values > 1700 ppm.
Equation (1): ICONE stuffiness index [26].
The flow rates of mechanical ventilation were measured once by the campaign with Q-Trak® 7565 (TSI Inc., Shoreview, MN, USA).
The number of fine particles (PM2.5) was measured in each room at intervals of 1 min over two-and-a-quarter days (allowing measurements in two rooms per campaign) using an optic particles count: pDR1500® (Thermo Fisher Scientific Inc., Waltham, MA, USA) (Table 1).

2.5. VOCs and SVOCs Sampling and Analyses

During both campaigns, 39 VOCs and 13 SVOCs were sampled (Table 2). Due to similarity with healthcare and care facilities, the same organic compounds were selected from previous studies in hospitals [16,25]. Hydrogen peroxide analysis was added in this study because of its use as a disinfectant in healthcare and care facilities.
Passive sampling was used to collect the 7 aldehydes using 2,4-DNPH cartridges (Radiello™) (SUPELCO® by Sigma-Aldrich, St. Louis, MO, USA). Active sampling was used to collect the 31 other VOCs using Carbopack™/Carboxen® tube (SUPELCO® by Sigma-Aldrich, St. Louis, MO, USA), the 13 SVOCs using polyurethane foam (PUF) and quartz filter (University Research Glassware, Chapel Hill, NC, USA), and the hydrogen peroxide using a closed-face cartridge. Aldehydes, other VOCs and SVOCs were simultaneously analyzed in air samples by chemical desorption and high-performance liquid chromatography with diode array detection (HPLC/DAD), thermal desorption (TD) and gas chromatography/mass spectrometry (GC/MS), and pressurized liquid extraction (PLE) and gas chromatography/tandem mass spectrometry (GC/MS/MS), respectively. Hydrogen peroxide was analyzed in air samples by chemical desorption and a photometer (Table 1). Details of the chemical analysis, including quality assurance and quality control, were presented in our previous work [25]. Concerning these methods, the laboratory was accredited by Cofrac in accordance with the recognized international standard ISO/IEC 17025:2005.

2.6. Microbiological Sampling and Analyses

During both campaigns, air samples of 1 m3 each were collected twice per room by a cyclonic liquid air sampler: Coriolis® µ filled with specific collection liquid (Bertin Technologies, Montigny-le-Bretonneux, France) (Table 1). Two flat surfaces were sampled per room using swabs and sampled templates of 100 cm².
Bacteria and fungi were enumerated by classical techniques of cultures and identification with plate count agar (PCA) and Sabouraud chloramphenicol agar (SAB), respectively. Two milliliters of air sampler liquid were directly seeded (200 μL per plate on five plates of culture medium for bacteria and fungi). Colony growing was checked daily, and enumeration was performed after 1 and 5 days of incubation at 30 ± 2 °C for bacteria and after 3, 5 and 7 days at 25 ± 2 °C for fungi.
Bacteria were isolated using tryptic soy agar (TSA). Then, identification was performed using matrix-assisted laser desorption/ionization time-of-flight mass spectrometry (MALDI-TOF MS): MALDI Biotyper® (Bruker, Billerica, MA, USA) and the Bruker Biotyper 3.0 database for samples of one urban area. They were identified using Gram straining and biochemical analytical profile index (API) test (bioMérieux, Marcy-l’Etoile, France) for samples of the other urban area. Antibiograms were performed in accordance with the guidelines of the European Society of Clinical Microbiology and Infectious Diseases to test the antibiotic susceptibility of bacterial pathogens.
Fungi were identified by mycologists according to their macroscopic and microscopic morphology colored with lactophenol and, for samples of one urban area, using MALDI-TOF MS.

2.7. Duplicates and Field Blanks

In order to assess whether the samples may have been contaminated during the sampling and analyze steps, field blank samples were collected for the chemical compounds (aldehydes (n = 1), hydrogen peroxide (n = 1), other VOCs (n = 1) and SVOCs (n = 1)) and for the microbiological parameters (liquid air sampler (n = 1) and swabbing liquid (n = 1) during both campaigns in each urban area. The field blank samples were treated identically to the samples (except that no air was drawn through the sampler) and were analyzed in the same manner as the samples. No chemical compound was detected above limit of quantification (LoQ) in the field blank samples. Few bacteria and fungi species were detected in the field blank samples of one urban area. These species were excluded from the samples performed on the same day in the same room.
Duplicate samples were also collected during both campaigns in each urban area for chemical compounds (aldehydes (n = 1), hydrogen peroxide (n = 1), other VOCs (n = 1) and SVOCs (n = 1)). The difference between concentrations of the same substance in the two duplicates never exceeded 88% for aldehydes (hexaldehyde), 67% for other VOCs (ethanol) and 14% for SVOCs (tonalide). The concentrations for the chemical compounds were validated and reported without correction because the mean differences of duplicates were very slight: 1 ± 1 µg/m3 (range: 0–71) for VOCs and 9 ± 3 ng/m3 (range: 0–100) for SVOCs.

2.8. Statistical Analysis

Data were described as numbers and percentages for categorical variables and as means ± standard errors (SE) or median associated with range (minimum–maximum) for continuous variables. The results were statistically processed with Mann–Whitney U tests or Student’s t-tests according to non-normal or normal distributions of variables (analyzed by Shapiro–Wilk test) using RStudio® (RStudio Inc., Boston, MA, USA) version 1.1.456. The statistical significance was set at p < 0.05. Regarding each organic compound, tests were performed only for most quantified compounds (50% > LoQ). To perform the tests, the maximal value hLoQ (high limit of quantification) replaced a concentration >hLoQ; the minimal value LoQ/2 replaced a concentration <LoQ, i.e., when the compound was detected but not quantified.

3. Results

3.1. Ambient Parameters

For all facilities, the median temperature/relative humidity were 24.7 °C/48.0% (range: 20.6–28.9 °C/32.0–74.2%) during the summer and 20.9 °C/36.0% (range: 13.3–26.6 °C/22.0–59.0%) during the winter. The median CO2 concentrations were 517 ppm (range: 332–2455) during the summer and 600 ppm (range: 356–3633) during the winter. These three ambient parameters varied significantly according to the season (p < 0.0001). The air change rates of mechanical ventilation ranged from 0.3 to 0.8 Vol/h (Table S1).
According to the ICONE index score based on CO2 concentrations, the mean indoor air stuffiness in healthcare and care facilities did not exceed 2, the medium air stuffiness level (Table 3). The CO2 concentration and the indoor air stuffiness (ICONE) were higher during main occupational hours (p < 0.0001), i.e., during the day in healthcare facilities and in the common rooms of nursing homes, and during the night in the bedrooms of nursing homes.

3.2. Particulate Matter

The median PM2.5 concentration across all measures (n = 100 585) was 9.0 µg/m3 (range: 0.4–668.5). The median PM2.5 concentration varied significantly according to the season: 10.7 µg/m3 (range: 0.4–430.0) during summer and 7.1 µg/m3 (range: 0.6–668.5) during winter (p < 0.0001). The details for each type of room according to the season are presented in Figure 1.

3.3. Organic Compounds: VOCs and SVOCs

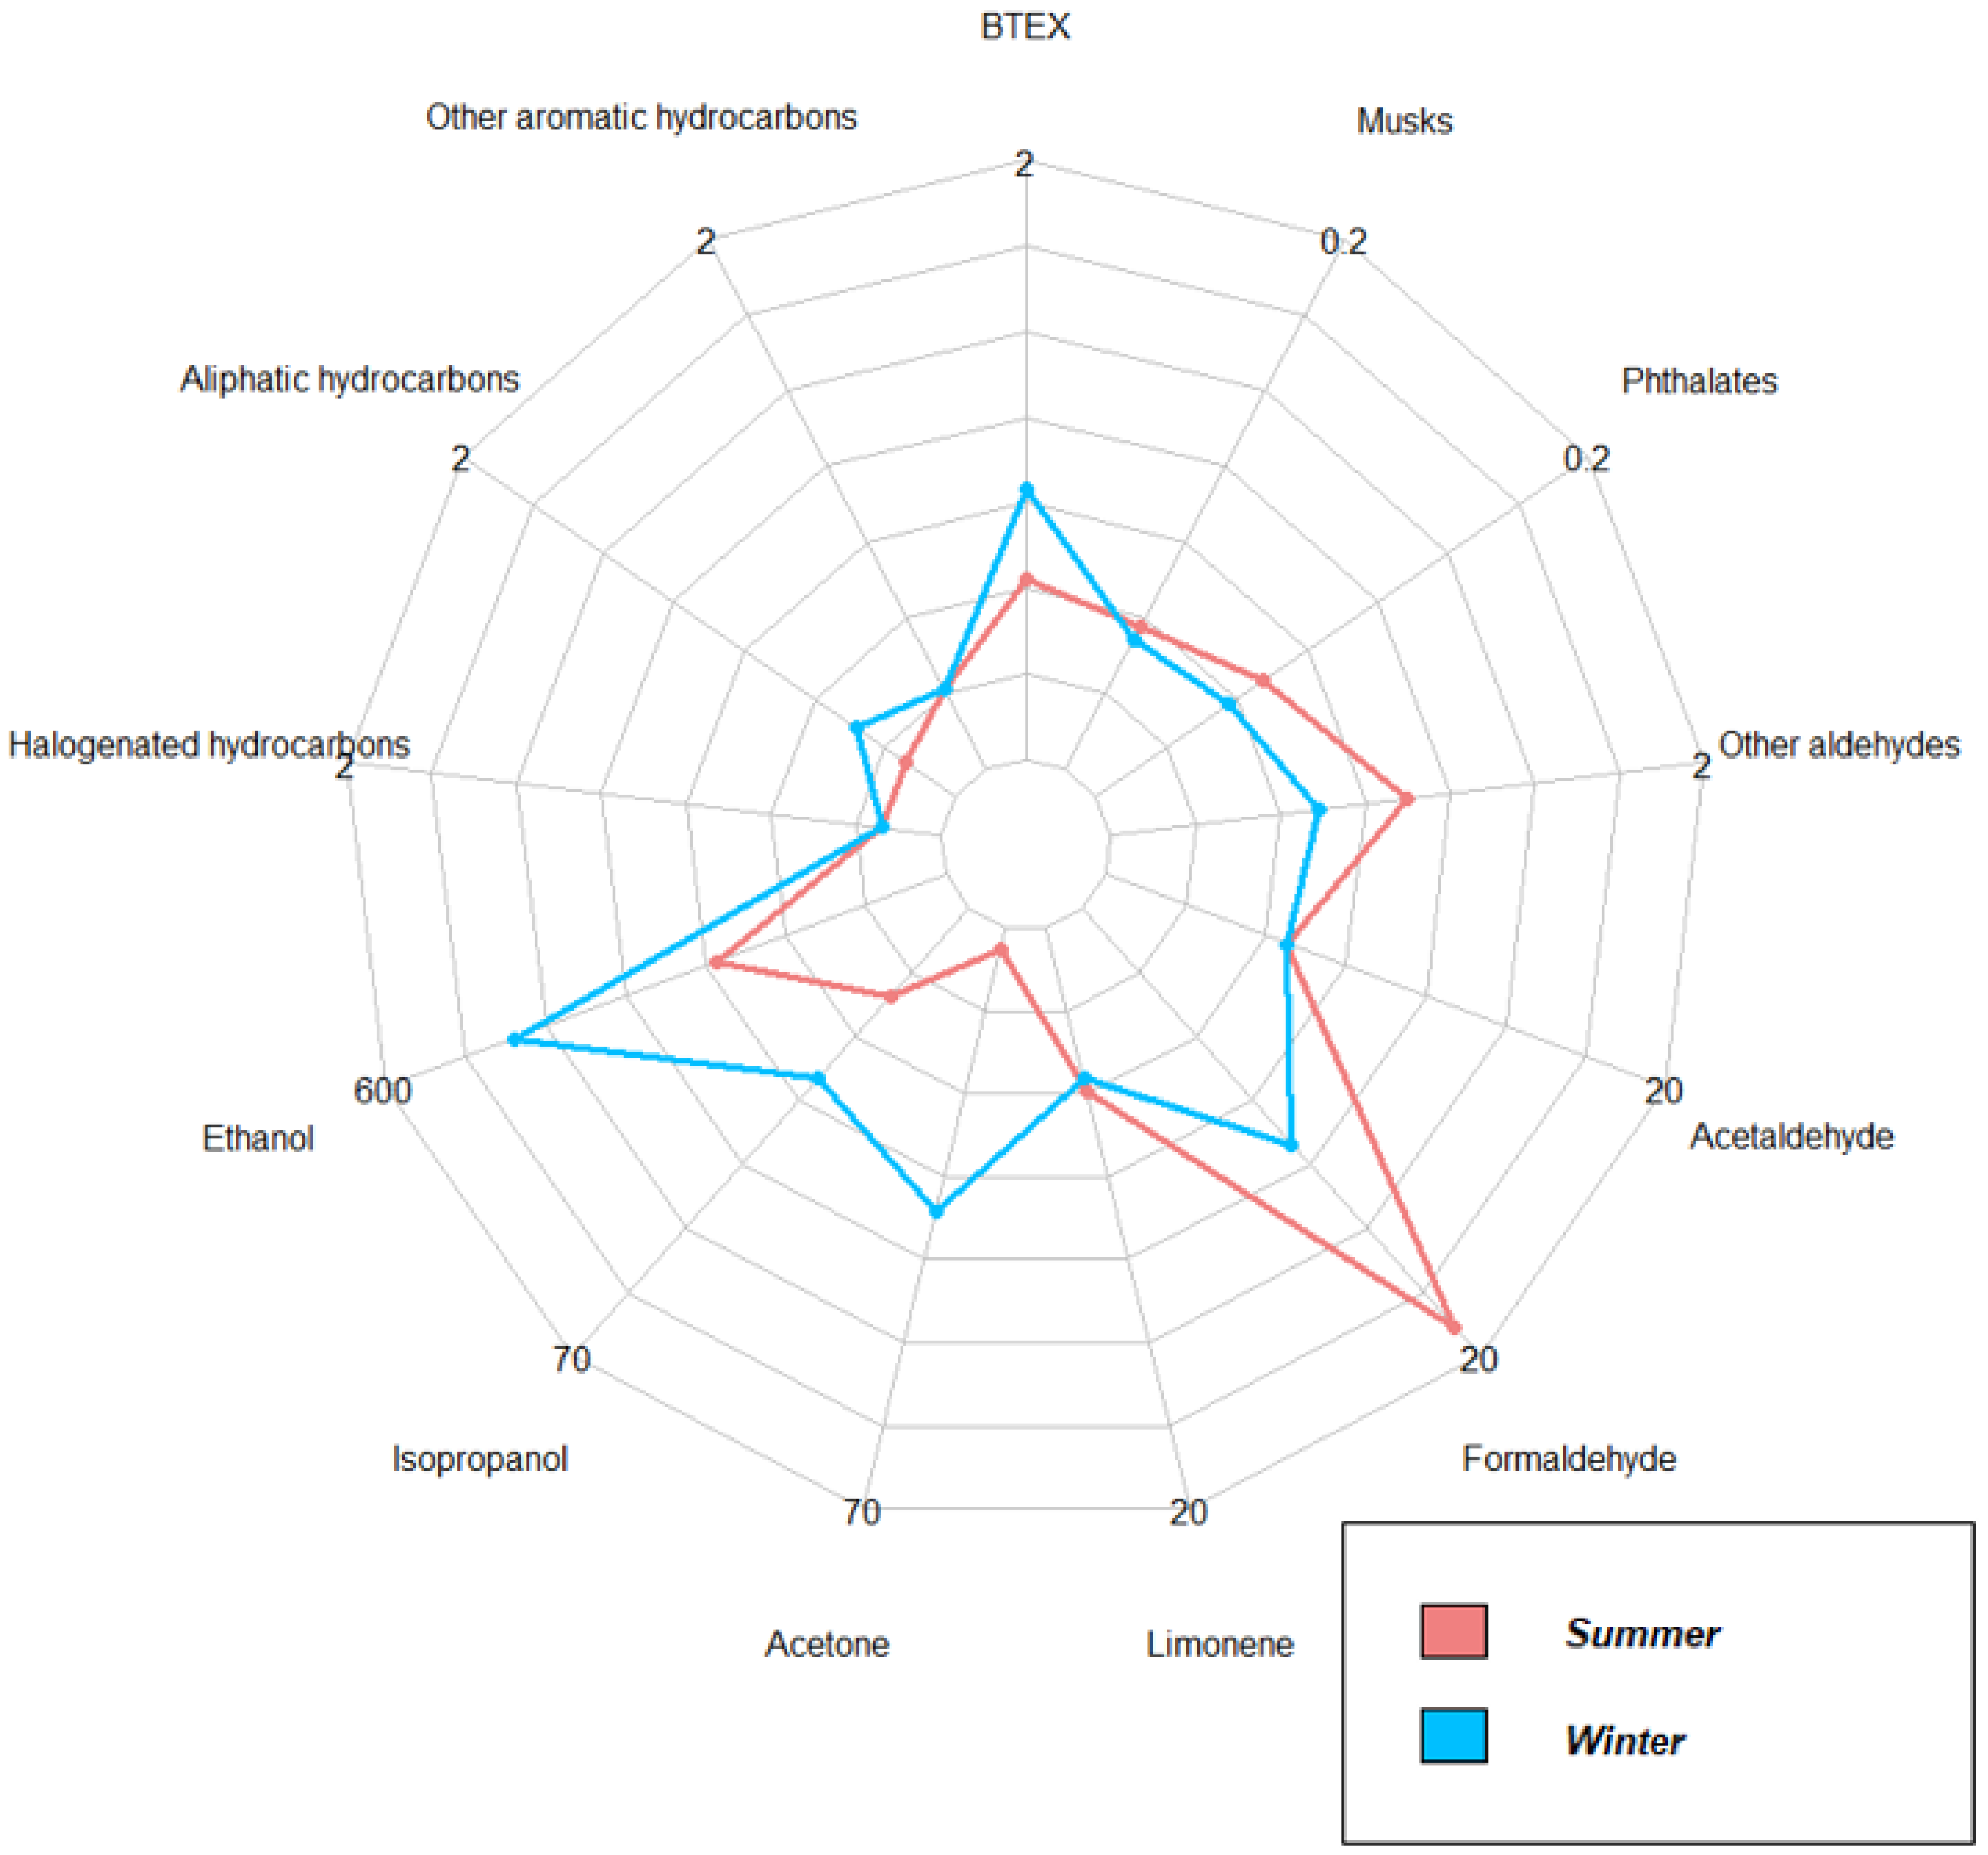
Regarding VOCs, only 53.8% (20/39) of the target compounds were quantified (concentration > LoQ) in more than 50% of the sampled rooms during both seasons (>20/40 samples). Four aldehydes (formaldehyde, acetaldehyde, butyraldehyde and hexaldehyde) were quantified in all sampled rooms. Ethanol, propionaldehyde, toluene and limonene were quantified in ≥90% of the sampled rooms. The most-quantified VOCs with the highest median concentration were for alcohols (ethanol: 378.9 µg/m3 (range: <5.4–1085.0; several samples exceeded hLoQ) and isopropanol: 23.6 µg/m3 (range: <1.3–81.7; several samples exceeded hLoQ)), ketones (acetone: 18.8 µg/m3 (range: <0.8–118.4; several samples exceeded hLoQ)), aldehydes (formaldehyde: 11.4 µg/m3 (range: 3.4–52.9) and acetaldehyde: 6.5 µg/m3 (range: 2.1–24.0)), peroxides (hydrogen peroxide: 8.5 µg/m3 (range: <1.4–24.9)) and terpenes (limonene: 4.3 µg/m3 (range: <0.2–66.7; several samples exceeded hLoQ)). The highest concentrations were measured during the winter for ethanol, acetone, toluene, m-p-xylene, phenol and n-decane (p < 0.05) and during the summer for formaldehyde and butyraldehyde (p < 0.04) (Figure 2). Ethanol, isopropanol and acetone were quantified in the highest concentrations in dental facilities, and toluene and hexaldehyde in the highest concentrations in pharmacies (Figure 3). The details of VOC concentrations for each type of room according to the season are presented in Table S2.
Regarding SVOCs, only 46.2% (6/13) of the target compounds were quantified (concentration > LoQ) in more than 50% of the sampled rooms during both campaigns (>20/40 samples). Five SVOCs were ubiquitous and had the highest median concentrations: three phthalates (diisobutylphtalate: 270 ng/m3 (range: 95–1200), diethylphtalate: 240 ng/m3 (range: 51–3800) and dibutylphtalate: 77 ng/m3 (range: 25–660)) and two musks (galaxolide: 130 ng/m3 (range: 25–1000) and tonalide: 24 ng/m3 (range: 6–430)). The only significant variation according to the season was the highest concentrations for diisobutylphtalate during the summer (p < 0.05). Diisobutylphtalate and galaxolide were measured in the highest concentrations in dental and general practitioner’s offices, respectively (Figure 3). The details of SVOCs concentrations for each type of room according to the season are presented in Table S3.

3.4. Microorganisms: Bacteria and Fungi

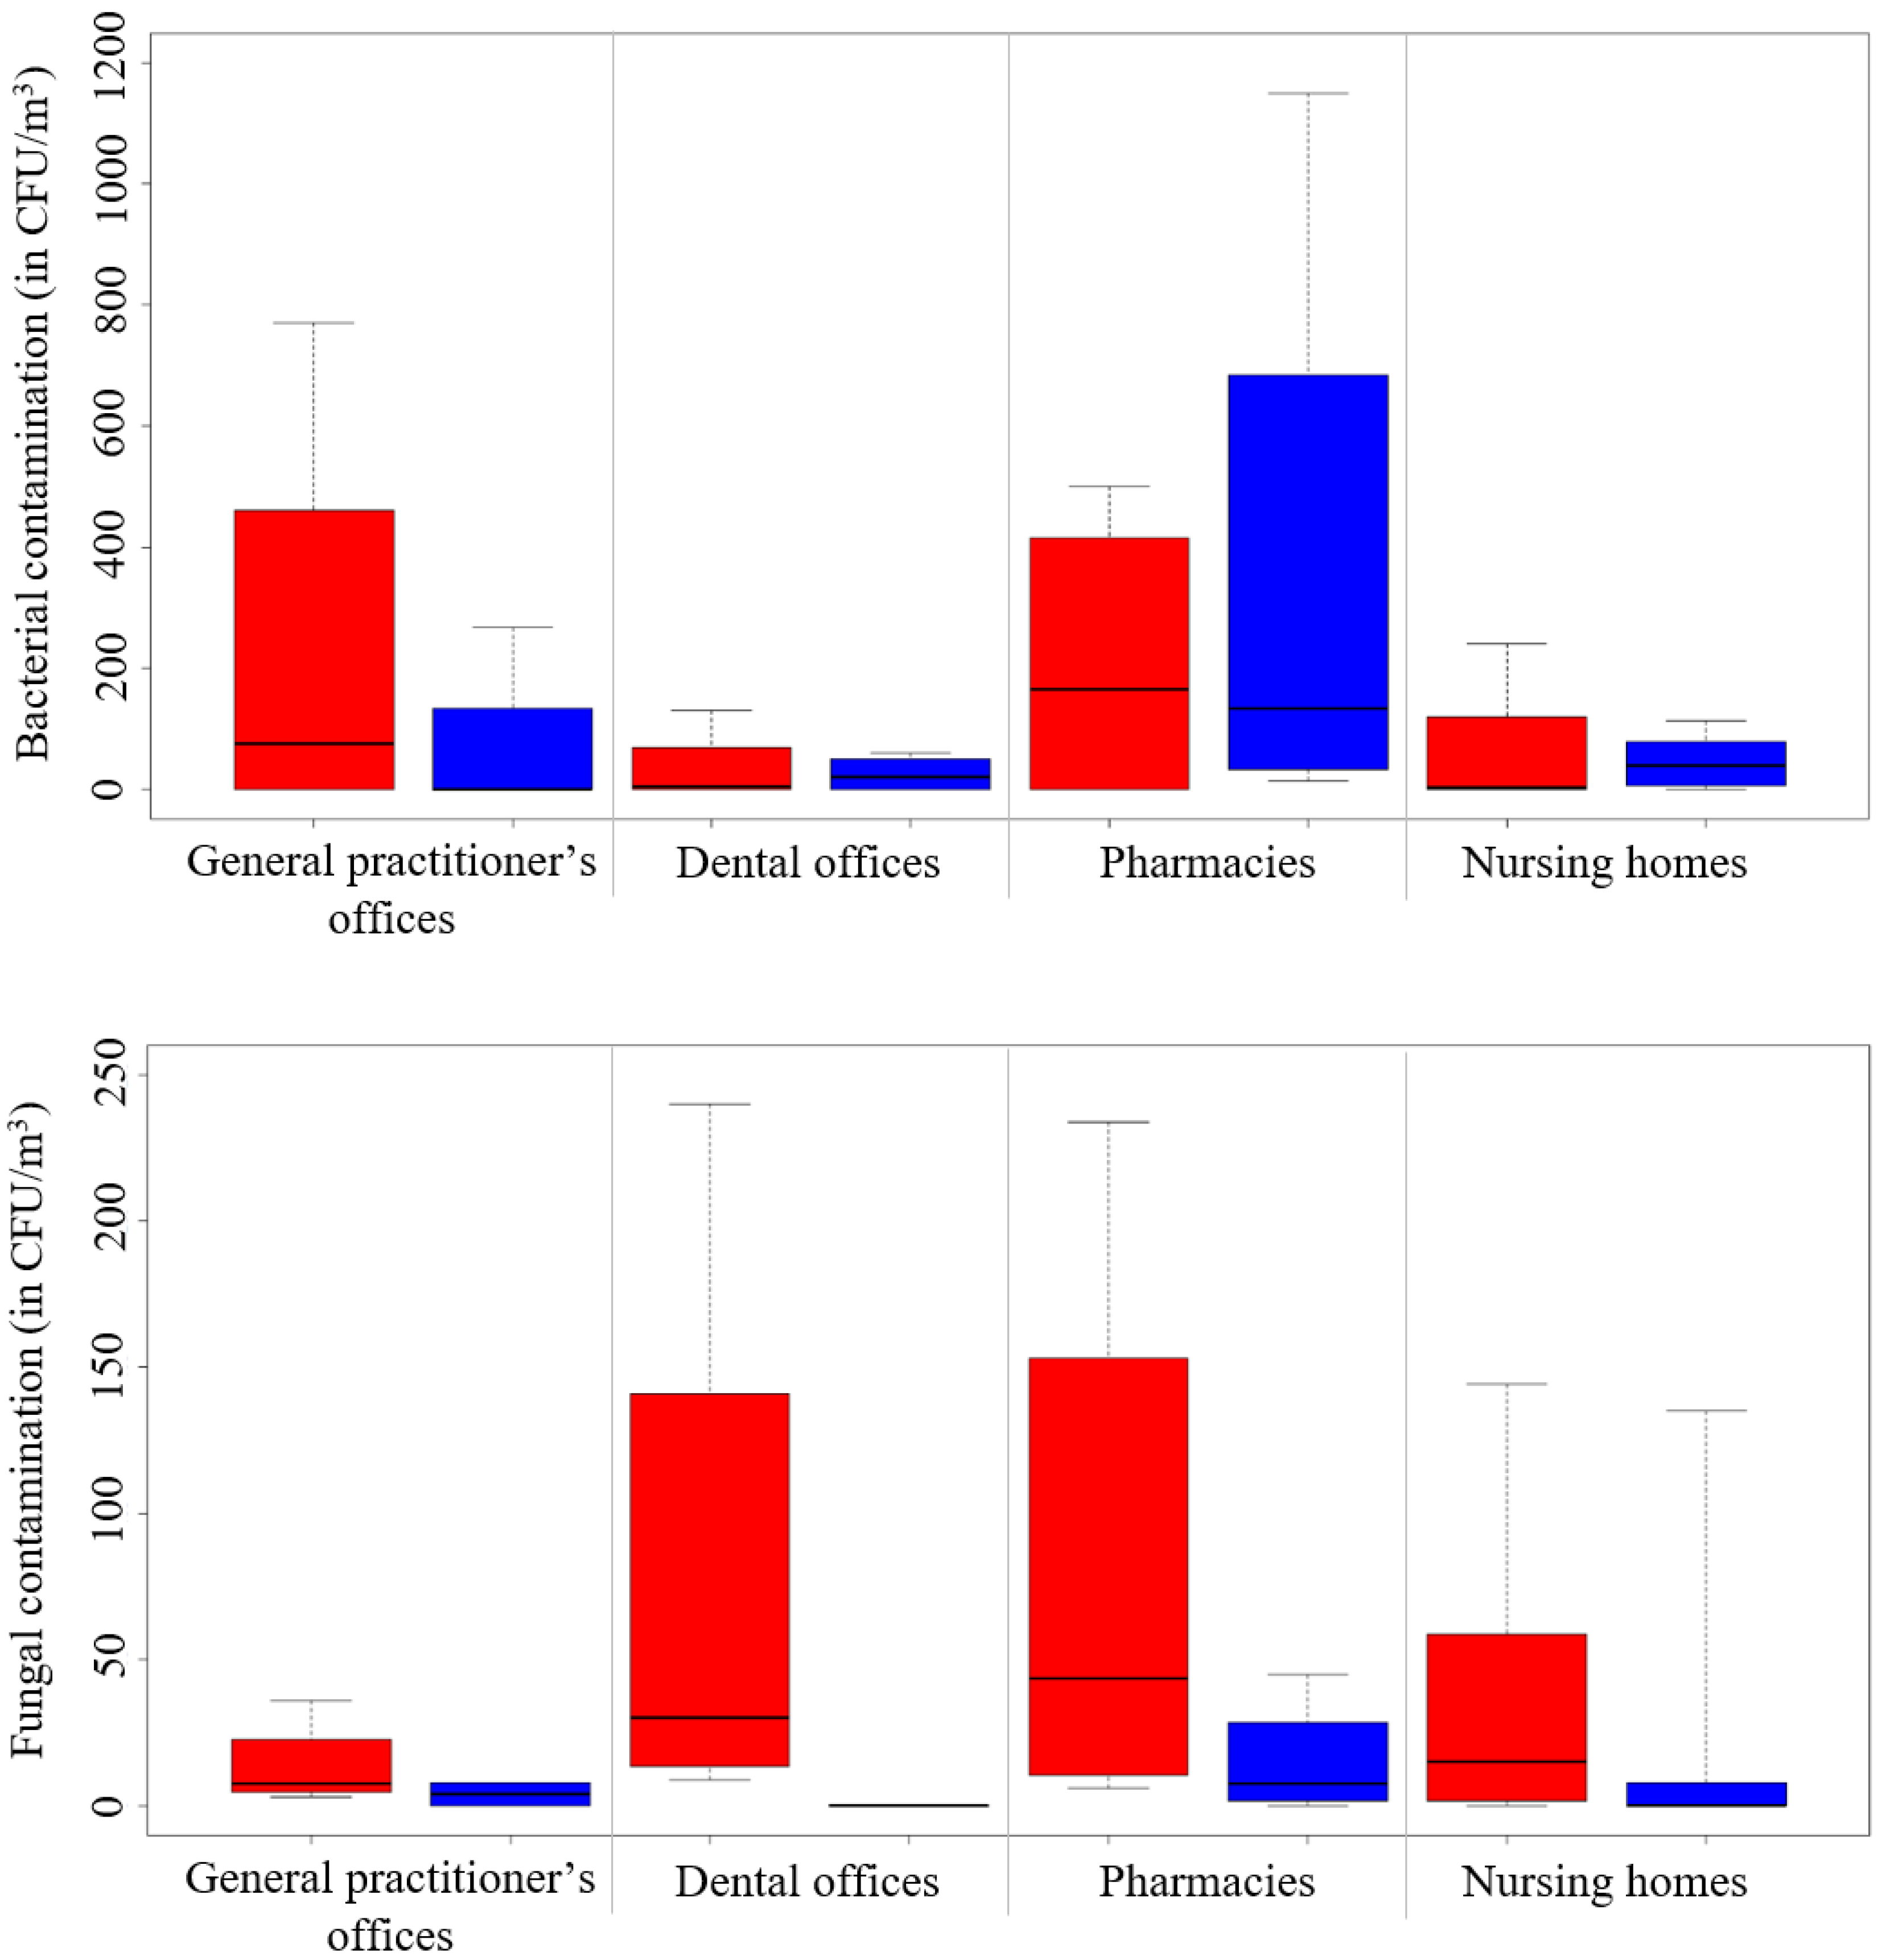
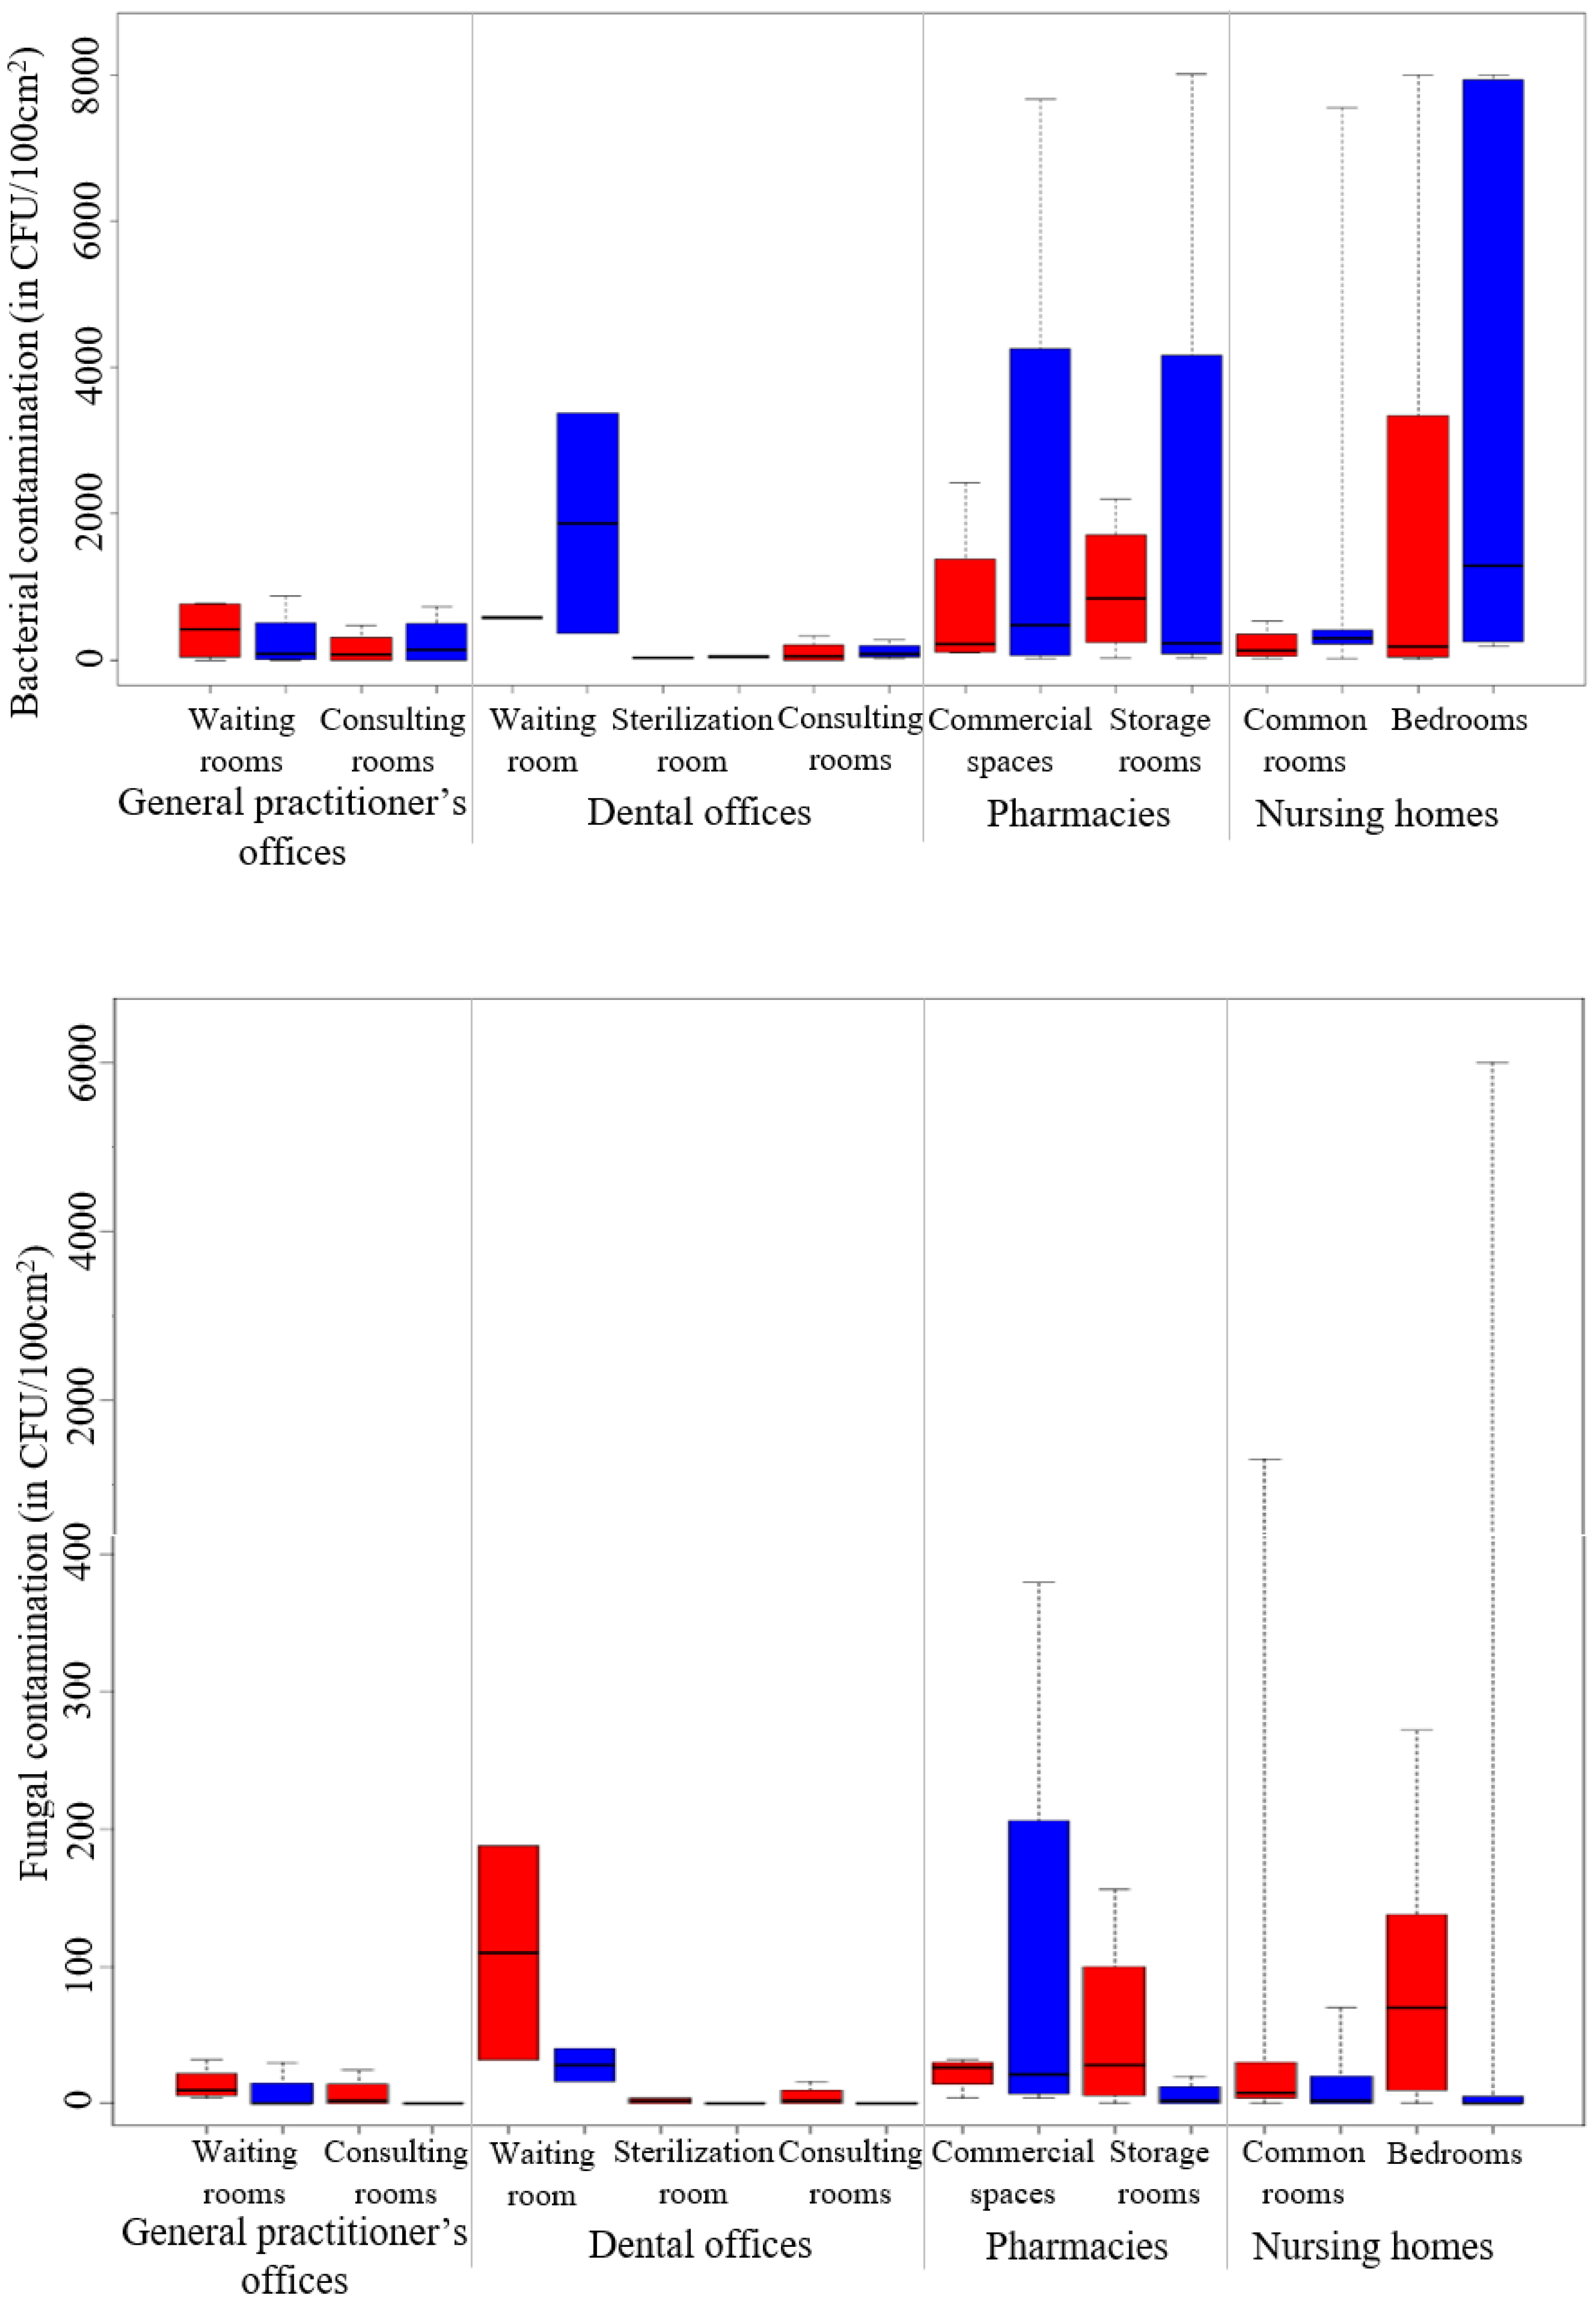
Bacterial and fungal cultures from 40 cyclonic air samples revealed median concentrations of 14 CFU/m3 (range: 0–1150) and 7 CFU/m3 (range: 0–240), respectively (Figure 4). Bacterial and fungal cultures from 80 surface swab samples showed a median concentration of 243 CFU/100 cm2 (range: 0–8007; several samples exceeded hLoQ) and 4 CFU/100cm2 (range: 0–6000; several samples exceeded hLoQ), respectively (Figure 5). Only fungal concentration varied significantly in both air and surfaces according to the season, with the highest quantity of fungi during summer (p < 0.002).
Some 70 bacterial species from some 40 genera (Table S4) and nearly 30 filamentous and yeast fungal species from some 20 genera were identified (Table S5). The three main bacterial genera were: Staphylococcus spp. (32.1% of identified bacteria) including S. hominis, S. epidermidis, S. saprophyticus and S. chromogenes, Micrococcus spp. (19.3% of identified bacteria) and Bacillus spp. (10.5% of identified bacteria), including B. cereus and B. licheniformis, mainly followed by Erwinia spp., Pseudomonas spp., Kocuria spp., Pantoea spp. and Stenotrophomonas maltophilia (5.5%, 4.7%, 4.7%, 4.6% and 2.9% of identified bacteria, respectively). The two main fungal genera were: Cladosporium spp. (41.1% of identified fungi) and Penicillium spp. (20.0% of identified fungi), mainly followed by Rhodoturola, Aspergillus spp., Basidiomycota, yeast, Alternaria spp. and Eurotium spp. (10.7%, 9.6%, 6.7%, 2.8%, 2.7% and 2.3% of identified fungi, respectively). Unfortunately, 9.7% of bacteria genera and 3.3% of fungal genera were not identified. General practitioner’s offices.
Concerning antibiotic resistance, the bacterial pathogens which were tested mainly included several strains of Staphylococcus (S. xylosus, S. sciuri, S. aureus), S. maltophilia, Acinetobacter ursingii, Escherichia vulneris and Citrobacter freundii. S. aureus species resistant to penicillin, erythromycin, norfloxacin and fusidic acid were found on a surface in the common room of a nursing home. Multidrug-resistant S. aureus species (resistant to penicillin, erythromycin, rifampicin, gentamicin, norfloxacin and fusidic acid) were found in the air of a common room in another nursing home. Enterobacteria (Escherichia vulneris) producing extended-spectrum beta-lactamases (ESBL) and carbapenemases, and S. maltophilia species resistant to trimethoprim and levofloxacin were found on surfaces in the bedroom of a nursing home. S. maltophilia species resistant to trimethoprim were found in several samples: in the air of a dental waiting room, on a surface of a general practitioner’s waiting room, and twice in the air in the common room of a nursing home. No azole-resistant Aspergillus fumigatus or Candida spp. were found.

4. Discussion

This study compiled a vast and original amount of data concerning the microbiological, chemical and particulate contamination in healthcare and care facilities. The indoor air quality was affected by several factors: human presence, human activities (including specific healthcare and cleaning activities), indoor and outdoor environment, ventilating capacities, season… [1,2,3].

4.1. Ambient Parameters

CO2 is emitted from people in the room, and its concentration was influenced by the number of people presented, the volume of the room and the air exchange rate. In any facility combined, the median CO2 concentration during summer/winter (517/600 ppm) seems slightly lower than French dwellings (620/641 ppm) [27] and higher than French hospitals (436/530 ppm) [25]. These differences are probably due, in part, to the lower air exchange rate in the dwellings (0.3 volumes per hour) [27] and higher rate in the hospitals (1 to 11 volumes per hour) [25] in comparison with this study (0.3 to 0.8 volumes per hour). Indoor air stuffiness was higher in the sterilization rooms of dental offices and consulting rooms for both dental and general practitioner’s offices. Compared to other rooms, these rooms are mainly ventilated by windows opening, which is not frequently performed. Other rooms benefit from natural and mechanical ventilation, which promotes the elimination of CO2 and other pollutants.

4.2. Particulate Matter (PM2.5)

The median PM2.5 concentration (9.0 µg/m3) seems in the lower part of office buildings (9–26 µg/m3) [28,29], lower than dwellings (16 µg/m3) [27,30] and higher than hospitals (1.6 µg/m3) [25]. Similarly to CO2, PM2.5 may vary in link to ventilation capacities and human activities. PM2.5 concentrations increase, respectively, when people are present in a room and with human activity, including the resuspension of deposited particles due to human movements [19]. Indoor PM2.5 concentrations are also affected by the infiltration of outdoor PM2.5 [31]; they come from outside traffic [17,18]. Many of our facilities were in residential neighborhoods close to PM2.5 sources such as a car park or major road. In this study, PM2.5 concentrations were higher in summer than winter. This result is not consistent with other studies, which showed higher concentrations of PM2.5 during winter than during summer [28,30], probably due to other indoor environmental conditions, such as building characteristics, occupant window-opening activities, indoor source emissions and ventilation systems [18,31]. The World Health Organization (WHO) has recently revised its air quality guidelines, with a reduction in recommended levels of exposure to PM2.5 from 10 to 5 μg/m3. In this study, the median PM2.5 concentration was below the previous level of long-term exposure recommendation but higher than the new recommended level. The median PM2.5 concentration could be more than six times higher for specific room such as sterilization room in dental offices during summer. The highest values were greater than 24 h exposure recommendation from the WHO (15 μg/m3) [32]. Regarding the WHO recommendations, efforts to protect populations who work in these facilities are required to reduce the health risks posed by this pollution (PM2.5 increases morbidity and mortality from cardiovascular and respiratory disease).

4.3. Volatile Organic Compounds (VOCs)

Alcohols (ethanol, isopropanol), ketones (acetone) and aldehydes were the three VOCs with the highest concentrations in this study. In French hospitals, ethanol, isopropanol and acetone were also the main organic compounds quantified [16]. The median concentrations of ethanol and isopropanol in French hospitals were similar (245.7 to 495.0 and 13.6 to 20.3 µg/m3, respectively) [16,25] in this study (378.9 and 23.6 µg/m3, respectively). Therefore, due to analytical limits, alcohols’ maximum concentrations may be higher. Seasonal variability may be due to windows opening in summer. Healthcare and cleaning activities are probably the main sources of these pollutants. Alcohols are included in hydro-alcoholic solutions, and many disinfectants largely used in these healthcare and care facilities. Limonene, which is used as a perfume in disinfectants or deodorants [17], was quantified in almost all the rooms studied, corroborating this theory. In pharmacies, limonene could come from perfumes sold.
The seven aldehydes searched were quantified for all rooms. Formaldehyde and acetaldehyde presented the highest median concentrations (11.4 and 6.5 µg/m3, respectively), similar to office buildings (14.0 and 6.1 μg/m3) [28], lower than in bedrooms of French dwellings (17.5 to 28.6 and 11.5 to 12.6 μg/m3) [27,30], but higher than in hospitals (3.2 to 5.1 and 3.6 to 4.1 μg/m3) [16,25]. A European study carried out in nursing homes had measured the concentration of formaldehyde (mean: 7.2 μg/m3) to be similar to that of this study [7]. The highest values were found in private healthcare facilities (dental and general practitioner’s offices and pharmacies). Aldehydes take their origin in decorating and building materials such as particle boards, vinyl floors and solvent-based paints [17]. Building materials and decorations generate long-term emissions of formaldehyde; their emission rates decrease each year [33], but may remain high for up to 13 years [34]. These materials may not have been the main source of aldehydes in this study because almost all the facilities were built over 20 years ago. Other sources of aldehydes are photocopiers [35] and cleaning products [36], which are frequently used in healthcare facilities to print prescriptions and to clean the surfaces, respectively. Aldehyde concentrations were higher in summer than in winter (p < 0.04), in relation to the increase in the temperature and the relative humidity during summer [33,37], despite the higher ventilation by windows opening.
Other aromatic hydrocarbons (such as benzene, toluene, ethylbenzene, p-xylene, m-xylene, o-xylene, 1,2,4trimethylbenzene, styrene)—quantified in low concentrations in our samples—may come from outside traffic and petroleum-based indoor coatings [17]. Phenol was quantified in the highest concentration in consulting and sterilization rooms of dental offices, and this pollutant may be used as a disinfectant for dental suction units.
Regarding the halogenated hydrocarbons, trichloromethane was quantified in the rooms of the dental offices, and tetrachloroethylene was quantified in the sterilization and consulting rooms of a dental office and in rooms of a pharmacy. A dry cleaner is installed near the positive pharmacy, which could explain the presence of these pollutants. In the dental offices, trichloromethane and tetrachloroethylene may be used as solvents for dental root canal sealers. The concentrations were lower than in French dwellings [30] and similar to office buildings [28].
In comparison with other French indoor environments, the air pollution of private healthcare and care facilities quantified in this study seems similar to office buildings, lower than in dwellings [27,30] but higher than in hospitals [16,25]. For most VOCs, the concentrations were higher in winter compared with the summer, probably due to lower ventilation, in accordance with the literature [1].
All the VOC concentrations were lower than accepted toxicological reference values (TRVs) of acetone (TRV of ATSDR: 30 μg/m3) during winter in dental offices, in the consulting rooms of general practitioner’s offices, in commercial spaces of pharmacies and in the bedrooms of nursing homes.

4.4. Semi-Volatile Organic Compounds (SVOCs)

Diisobutylphtalate, diethylphtalate and dibutylphtalate were the three most quantified phthalates in this study, with median concentrations of 270, 240 and 77 ng/m3, respectively. Similar concentrations were found in the living rooms of French dwellings, concerning phthalates with median concentrations of 354, 182 and 86 ng/m3 regarding these three pollutants, respectively [27]. However, lower concentrations of phthalates were found in French hospitals [25]. Phthalates originate from PVC flooring, vinyl materials on walls and other building materials [38]; they are released in indoor air under the influence of such factors as temperature [39]. This is in line with the highest concentrations found during summer in comparison to winter in this study, even though only a significant difference was found for diisobutylphtalate (p < 0.05).
Concerning musk, galaxolide and tonalide, they were present in lower median concentrations in French hospitals (50 and 10 ng/m3, respectively) [25] and living rooms of French dwellings (94 and 15 ng/m3, respectively) [27] in comparison to this study (130 and 24 ng/m3, respectively). No significant seasonal variation was highlighted, in accordance with Baurès et al. in hospitals [25].
The five pyrethroid compounds were never quantified during this study. This is in accordance with their absence in a medical environment such as hospitals [25] because pyrethroids are insecticides that are not regularly used in healthcare and care facilities.

4.5. Microorganisms: Bacteria and Fungi

Very few studies have quantified microorganisms in the indoor air of healthcare and care facilities. In this study, very low median concentrations of bacteria and fungi in indoor air were found (14 and 7 CFU/m3, respectively). Other studies had found higher mean concentrations of bacteria in indoor air in dental offices (>100 CFU/m3) [40,41], elderly care centers (>300 CFU/m3) [42], office buildings (>650 CFU/m3) [43] and schools (391 CFU/m3 in high schools to 2205 CFU/m3 in primary schools) [44]. This difference could be explained by the fact that more people are present in schools and office buildings compared to private healthcare facilities. It is well known that the number of people and their activities strongly influence the bacterial concentration in the indoor air [44,45]. Moreover, previous studies in dental offices sampled only the air of the consulting rooms which are largely contaminated by bioaerosols due to the widespread use of high-speed dental turbines, hand pieces, and mechanical scalers [41]; however, this study sampled the air in waiting and sterilization rooms. Finally, the use of a cyclonic liquid air sampler (Coriolis® µ) in this study could also partly explain this difference; other studies have used impactors to sample the air [46,47].
The diversity of bacterial and fungal species identified in this study is in line with microorganisms identified in hospitals and other healthcare facilities such as dental offices [22]. Outdoor air is the main source of microorganisms—before the human skin—in the indoor environment [48]. Indoor fungal communities are largely driven by outdoor air [49]. In this study, Cladosporium spp. and Penicillium spp. were the main identified fungi. They were the most frequently identified fungal genera in indoor and outdoor air [50], especially in dwellings [27], hospitals [25], office buildings [51], elderly care centers [42] and dental offices [41]. Moreover, a relationship exists between humans and bacterial communities in the built environment [52]. Humans, from their skin, their clothing and their respiratory systems, are a major source of bacteria [49], and the skin is a key identified source of bacteria in the indoor environment [48]. In this study, we identified many human commensal bacteria of the skin, such as S. hominis, S. epidermidis and Micrococcus spp., in the air and on the surfaces. Staphylococcus spp. and Micrococcus spp. are also among the main bacteria genera quantified in hospitals [25], dental offices [41,53], office buildings [43,51] and schools [44]. Bacterial contamination is also influenced by healthcare activity; for example, in the consulting rooms of dental offices, oral bacteria were identified such as Actinomyces oris, which is one of the predominant microorganisms colonizing the oral cavity and plays a role in dental plaque formation.
A few antibiotic-resistant bacteria were detected: mainly in the rooms of nursing homes, but also in the air of a dental waiting room and on a surface of a general practitioner’s waiting room. Therefore, antibiotic-resistant bacteria spread not only in hospitals, but also in healthcare and care facilities. Antibiotic resistance is a growing concern, and contamination of antibiotic-resistant bacteria on surfaces of healthcare facilities may cause healthcare-associated infections [24]. Therefore, knowledge and compliance with recommended infection-prevention procedures, including suitable cleaning measures of surfaces and reusable medical equipment, reduce the prevalence of antibiotic-resistant bacteria. Cleaning is a crucial issue that requires attention, and prevents the spread of antibiotic-resistant bacteria in healthcare facilities [54].

4.6. Strengths and Limitations of the Study

This study was the first to investigate indoor air quality in healthcare and care facilities with a wide range of organic compounds (39 VOCs and 13 SVOCs) and fine particulate matter measures associated with quantitative and qualitative analyses of bacteria and fungi during both summer and winter seasons. In addition, measures were performed during several days of typical weeks of activity to consider the diversity of activities in the healthcare and care facilities.
This study presented some limitations. Regarding organic compounds analyses, several VOCs (mainly ethanol and isopropanol, but also n-propanol, acetone and limonene) presented concentrations exceeding the hLoQ of the GC/MS analyses. Therefore, the maximal exposure to these pollutants could not be precisely evaluated in all facilities. Regarding microbiological identification, comparability of results in the two urban areas studied could be criticized because microorganisms were identified with two different techniques (MALDI-TOF MS in one urban area and API test in the other); however, these two techniques may provide similar results for a wide quantity of microorganisms [55]. Moreover, 9.7% of bacteria genera and 3.3% of fungal genera were not identified due to the limits of identification methods. Thus, the microbiological diversity of healthcare and care facilities was not totally explored, especially since the culture-based method used was limited to the research of culturable microorganisms [48]. During this study, culture-independent PCR molecular methods were performed for analyzing the microbial communities present in environmental samples more precisely. Unfortunately, no microorganism (bacteria, fungi and virus) was detected by this molecular technique due to analytical problems with the limits of detection of genome units (GU) being too high (220,000 UG/100 cm2 for surface samples and 3300 UG/m3 for air samples). Therefore, the methods and results of microbial PCR analyses were not presented in this article. New approaches using next-generation sequencing will probably help in the future to characterize the microbial exposome more precisely [56].
Finally, this study investigated a limited number of buildings. Future investigations are required to confirm the results and characterize indoor air pollution and contamination of private healthcare facilities and nursing homes more precisely.

5. Conclusions

Indoor air in private healthcare and care facilities contains a complex mixture of chemical, particulate and microbiological compounds. The most frequently quantified compounds were alcohols (ethanol and isopropanol) originating mainly from healthcare activities. This study showed higher pollution compared to our previous study in indoor hospital environments.

Supplementary Materials

The following are available online at https://www.mdpi.com/article/10.3390/atmos12101337/s1, Table S1: Characteristics of the healthcare and care facilities, Table S2: Median concentrations (μg/m3) of volatile organic compounds (VOCs) in sampled rooms of healthcare and care facilities during summer (S) and winter (W), Table S3: Median concentrations (ng/m3) of semi-volatile organic compounds (SVOCs) in sampled rooms of healthcare and care facilities during summer (S) and winter (W), Table S4: Bacteria isolated from air and surfaces in sampled rooms of healthcare and care facilities during summer (S) and winter (W), Table S5: Fungi isolated from air and surfaces in sampled rooms of healthcare and care facilities during summer (S) and winter (W).

Author Contributions

Conceptualization, A.F.; Data curation, A.B. and M.G.; Formal analysis, A.B.; Funding acquisition, A.F.; Investigation, A.B., H.G. and M.G.; Methodology, E.B., O.B., P.L.C., J.-P.G. and A.F.; Project administration, A.F.; Supervision, P.L.C., J.-P.G. and A.F.; Visualization, A.B.; Writing—original draft, A.B., E.B. and A.F.; Writing—review and editing, A.B., E.B., H.G., O.B., M.G., P.L.C., J.-P.G. and A.F. All authors have read and agreed to the published version of the manuscript.

Funding

This research was funded by the French Agency for Food, Environmental and Occupational Health & Safety (ANSES), grant number PNREST-2017-1-216.

Institutional Review Board Statement

Not applicable.

Informed Consent Statement

Not applicable.

Data Availability Statement

The datasets supporting the conclusions of this article are included within the article and its additional file.

Acknowledgments

The authors thank Émilie Surget and Julien Gastine (LERES—EHESP) for their assistance with this work.

Conflicts of Interest

The authors declare no conflict of interest.

References

  1. Paciência, I.; Madureira, J.; Rufo, J.; Moreira, A.; Fernandes, E. A systematic review of evidence and implications of spatial and seasonal variations of volatile organic compounds (VOC) in indoor human environments. J. Toxicol. Environ. Health B Crit. Rev. 2016, 19, 47–64. [Google Scholar] [CrossRef] [PubMed]
  2. Huang, Q.; Marzouk, T.; Cirligeanu, R.; Malmstrom, H.; Eliav, E.; Ren, Y.F. Ventilation assessment by carbon dioxide levels in dental treatment rooms. J. Dent. Res. 2021, 100, 810–816. [Google Scholar] [CrossRef]
  3. Tzoutzas, I.; Maltezou, H.C.; Barmparesos, N.; Tasios, P.; Efthymiou, C.; Assimakopoulos, M.N.; Tseroni, M.; Vorou, R.; Tzermpos, F.; Antoniadou, M.; et al. Indoor Air Quality evaluation using mechanical ventilation and portable air purifiers in an academic dentistry clinic during the COVID-19 pandemic in Greece. Int. J. Environ. Res. Public Health 2021, 18, 8886. [Google Scholar] [CrossRef] [PubMed]
  4. Helmis, C.G.; Tzoutzas, J.; Flocas, H.A.; Halios, C.H.; Assimakopoulos, V.D.; Stathopoulou, O.I.; Panis, V.; Apostolatou, M. Emissions of total volatile organic compounds and indoor environment assessment in dental clinics in Athens, Greece. Int. Dent. J. 2008, 58, 269–278. [Google Scholar] [CrossRef] [PubMed]
  5. Hwang, S.H.; Roh, J.; Park, W.M. Evaluation of PM10, CO2, airborne bacteria, TVOCs, and formaldehyde in facilities for susceptible populations in South Korea. Environ. Pollut. 2018, 242, 700–708. [Google Scholar] [CrossRef] [PubMed]
  6. Almeida-Silva, M.; Almeida, S.M.; Pegas, P.N.; Nunes, T.; Alves, C.A.; Wolterbeek, H.T. Exposure and dose assessment to particle components among an elderly population. Atmos. Environ. 2015, 102, 156–166. [Google Scholar] [CrossRef]
  7. Bentayeb, M.; Norback, D.; Bednarek, M.; Bernard, A.; Cai, G.; Cerrai, S.; Eleftheriou, K.K.; Gratziou, C.; Holst, G.J.; Lavaud, F.; et al. Indoor air quality, ventilation and respiratory health in elderly residents living in nursing homes in Europe. Eur. Respir J. 2015, 45, 1228–1238. [Google Scholar] [CrossRef] [PubMed] [Green Version]
  8. Kim, H.H.; Lee, G.W.; Yang, J.Y.; Jeon, J.M.; Lee, W.S.; Lim, J.Y.; Lee, H.S.; Gwak, Y.K.; Shin, D.C.; Lim, Y.W. Indoor exposure and health risk of polycyclic aromatic hydrocarbons (PAHs) via public facilities PM2.5, Korea (II). Asian J. Atmos. Env. 2014, 8, 35–47. [Google Scholar] [CrossRef] [Green Version]
  9. Matz, C.J.; Stieb, D.M.; Davis, K.; Egyed, M.; Rose, A.; Chou, B.; Brion, O. Effects of age, season, gender and urban-rural status on time-activity: CanadianHuman Activity Pattern Survey 2 (CHAPS 2). Int. J. Environ. Res. Public Health 2014, 11, 2108–2124. [Google Scholar] [CrossRef] [Green Version]
  10. Schweizer, C.; Edwards, R.D.; Bayer-Oglesby, L.; Gauderman, W.J.; Ilacqua, V.; Jantunen, M.J.; Lai, H.K.; Nieuwenhuijsen, M.; Künzli, N. Indoor time-microenvironment-activity patterns in seven regions of Europe. J. Expo. Sci. Environ. Epidemiol. 2007, 17, 170–181. [Google Scholar] [CrossRef] [Green Version]
  11. Le Cann, P.; Bonvallot, N.; Glorennec, P.; Deguen, S.; Goeury, C.; Le Bot, B. Indoor environment and children’s health: Recent developments in chemical, biological, physical and social aspects. Int. J. Hyg. Environ. Health 2011, 215, 1–18. [Google Scholar] [CrossRef]
  12. Sérafin, G.; Blondeau, P.; Mandin, C. Indoor air pollutant health prioritization in office buildings. Indoor Air 2021, 31, 646–659. [Google Scholar] [CrossRef]
  13. Pelletier, M.; Bonvallot, N.; Ramalho, O.; Mandin, C.; Wei, W.; Raffy, G.; Mercier, F.; Blanchard, O.; Le Bot, B.; Glorennec, P. Indoor residential exposure to semivolatile organic compounds in France. Environ. Int. 2017, 109, 81–88. [Google Scholar] [CrossRef]
  14. Fournier, K.; Glorennec, P.; Bonvallot, N. An exposure-based framework for grouping pollutants for a cumulative risk assessment approach: Case study of indoor semi-volatile organic compounds. Environ. Res. 2014, 130, 20–28. [Google Scholar] [CrossRef] [Green Version]
  15. Tsai, W.T. An overview of health hazards of volatile organic compounds regulated as indoor air pollutants. Rev. Environ. Health 2019, 34, 81–89. [Google Scholar] [CrossRef]
  16. Bessonneau, V.; Mosqueron, L.; Berrubé, A.; Mukensturm, G.; Buffet-Bataillon, S.; Gangneux, J.P.; Thomas, O. VOC contamination in hospital, from stationary sampling of a large panel of compounds, in view of healthcare workers and patients exposure assessment. PLoS ONE 2013, 8, e55535. [Google Scholar] [CrossRef] [PubMed]
  17. Zabiegala, B. Organic compounds in indoor environments. Pol. J. Environ. Stud. 2006, 15, 383–393. [Google Scholar]
  18. Zhang, M.; Zhang, S.; Feng, G.; Su, H.; Zhu, F.; Ren, M.; Cai, Z. Indoor airborne particle sources and outdoor haze days effect in urban office areas in Guangzhou. Environ. Res. 2017, 154, 60–65. [Google Scholar] [CrossRef]
  19. Benabed, A.; Limam, K. Resuspension of Indoor Particles Due to Human Foot Motion. Energy Procedia 2017, 139, 242–247. [Google Scholar] [CrossRef]
  20. Kim, K.-H.; Kabir, E.; Kabir, S. A review on the human health impact of airborne particulate matter. Environ. Int. 2015, 74, 136–143. [Google Scholar] [CrossRef]
  21. Gangneux, J.P.; Bougnoux, M.E.; Hennequin, C.; Godet, C.; Chandenier, J.; Denning, D.W.; Dupont, B.; LIFE Program, the Société Française de Mycologie Médicale SFMM-Study Group. An estimation of burden of serious fungal infections in France. J. Mycol. Med. 2016, 26, 385–390. [Google Scholar] [CrossRef] [PubMed]
  22. Zemouri, C.; de Soet, H.; Crielaard, W.; Laheij, A. A scoping review on bio-aerosols in healthcare and the dental environment. PLoS ONE 2017, 12, e0178007. [Google Scholar] [CrossRef] [PubMed]
  23. Beggs, C.; Knibbs, L.D.; Johnson, G.R.; Morawska, L. Environmental contamination and hospital-acquired infection: Factors that are easily overlooked. Indoor Air 2015, 25, 462–474. [Google Scholar] [CrossRef] [Green Version]
  24. Kurita, H.; Kurashina, K.; Honda, T. Nosocomial transmission of methicillin-resistant Staphylococcus aureus via the surfaces of the dental operatory. Br. Dent. J. 2006, 201, 297–300. [Google Scholar] [CrossRef] [Green Version]
  25. Baurès, E.; Blanchard, O.; Mercier, F.; Surget, E.; le Cann, P.; Rivier, A.; Gangneux, J.P.; Florentin, A. Indoor air quality in two French hospitals: Measurement of chemical and microbiological contaminants. Sci. Total Environ. 2018, 642, 168–179. [Google Scholar] [CrossRef]
  26. Ribéron, J.; Ramalho, O.; Derbez, M.; Berthineau, B.; Wyart, G.; Kirchner, S.; Mandin, M. Air stuffiness index: From schools to dwellings. Pollut. Atmosphérique 2016, 228, 1–12. [Google Scholar]
  27. Dallongeville, A.; Costet, N.; Zmirou-Navier, D.; Le Bot, B.; Chevrier, C.; Deguen, S.; Annesi-Maesano, I.; Blanchard, O. Volatile and semi-volatile organic compounds of respiratory health relevance in French dwellings. Indoor Air 2016, 26, 426–438. [Google Scholar] [CrossRef]
  28. Mandin, C.; Trantallidi, M.; Cattaneo, A.; Canha, N.; Mihucz, V.G.; Szigeti, T.; Mabilia, R.; Perreca, E.; Spinazzè, A.; Fossati, S.; et al. Assessment of indoor air quality in office buildings across Europe-The OFFICAIR study. Sci. Total Environ. 2017, 579, 169–178. [Google Scholar] [CrossRef] [Green Version]
  29. Mosqueron, L.; Momas, I.; Le Moullec, Y. Personal exposure of Paris office workers to nitrogen dioxide and fine particles. Occup. Environ. Med. 2002, 59, 550–555. [Google Scholar] [CrossRef] [PubMed] [Green Version]
  30. Langer, S.; Ramalho, O.; Derbez, M.; Ribéron, J.; Kirchner, S.; Mandin, C. Indoor environmental quality in French dwellings and building characteristics. Atmos. Environ. 2016, 128, 82–91. [Google Scholar] [CrossRef]
  31. Shao, Z.; Yin, X.; Bi, J.; Ma, Z.; Wang, J. Spatiotemporal variations of indoor PM2.5 concentrations in Nanjing, China. Int. J. Environ. Res. Public Health 2019, 16, 144. [Google Scholar] [CrossRef] [Green Version]
  32. World Health Organization (WHO). WHO Global Air Quality Guidelines: Particulate Matter (PM2.5 and PM10), Ozone, Nitrogen Dioxide, Sulfur Dioxide and Carbon Monoxide; World Health Organization: Geneva, Swiss, 2021. [Google Scholar]
  33. Liang, W.; Yang, S.; Yang, X. Long-term formaldehyde emissions from medium-density fiberboard in a full-scale experimental room: Emission characteristics and the effects of temperature and humidity. Environ. Sci. Technol. 2015, 49, 10349–10356. [Google Scholar] [CrossRef]
  34. Guo, H.; Kwok, N.H.; Cheng, H.R.; Lee, S.C.; Hung, W.T.; Li, Y.S. Formaldehyde and volatile organic compounds in Hong Kong homes: Concentrations and impact factors. Indoor Air 2009, 19, 206–217. [Google Scholar] [CrossRef]
  35. Spinazzè, A.; Campagnolo, D.; Cattaneo, A.; Urso, P.; Sakellaris, I.A.; Saraga, D.E.; Mandin, C.; Canha, N.; Mabilia, R.; Perreca, E.; et al. Indoor gaseous air pollutants determinants in office buildings-The OFFICAIR project. Indoor Air 2020, 30, 76–87. [Google Scholar] [CrossRef]
  36. Campagnolo, D.; Saraga, D.E.; Cattaneo, A.; Spinazzè, A.; Mandin, C.; Mabilia, R.; Perreca, E.; Sakellaris, I.; Canha, N.; Mihucz, V.G.; et al. VOCs and aldehydes source identification in European office buildings-The OFFICAIR study. Build. Environ. 2017, 115, 18–24. [Google Scholar] [CrossRef]
  37. Xiong, J.; Zhang, P.; Huang, S.; Zhang, Y. Comprehensive influence of environmental factors on the emission rate of formaldehyde and VOCs in building materials: Correlation development and exposure assessment. Environ. Res. 2016, 151, 734–741. [Google Scholar] [CrossRef]
  38. Bornehag, C.G.; Lundgren, B.; Weschler, C.J.; Sigsgaard, T.; Hagerhed-Engman, L.; Sundell, J. Phthalates in indoor dust and their association with building characteristics. Environ. Health Perspect. 2005, 113, 1399–1404. [Google Scholar] [CrossRef] [PubMed] [Green Version]
  39. Clausen, P.A.; Liu, Z.; Kofoed-Sørensen, V.; Little, J.; Wolkoff, P. Influence of temperature on the emission of di-(2-ethylhexyl)phthalate (DEHP) from PVC flooring in the emission cell FLEC. Environ. Sci. Technol. 2012, 46, 909–915. [Google Scholar] [CrossRef] [PubMed]
  40. Castiglia, P.; Liguori, G.; Montagna, M.T.; Napoli, C.; Pasquarella, C.; Bergomi, M.; Fabiani, L.; Monarca, S.; Petti, S.; SItI Working Group Hygiene in Dentistry. Italian multicenter study on infection hazards during dental practice: Control of environmental microbial contamination in public dental surgeries. BMC Public Health 2008, 8, 187. [Google Scholar] [CrossRef] [PubMed] [Green Version]
  41. Kobza, J.; Pastuszka, J.S.; Bragoszewska, E. Do exposures to aerosols pose a risk to dental professionals? Occup. Med. 2018, 68, 454–458. [Google Scholar] [CrossRef] [Green Version]
  42. Mendes, A.; Pereira, C.; Mendes, D.; Aguiar, L.; Neves, P.; Silva, S.; Batterman, S.; Teixeira, J.P. Indoor air quality and thermal comfort-results of a pilot study in elderly care centers in Portugal. J. Toxicol. Environ. Health Part A 2013, 76, 333–344. [Google Scholar] [CrossRef] [PubMed] [Green Version]
  43. Brągoszewska, E.; Biedroń, I. Indoor Air Quality and Potential Health Risk Impacts of Exposure to Antibiotic Resistant Bacteria in an Office Rooms in Southern Poland. Int. J. Environ. Res. Public Health 2018, 15, 2604. [Google Scholar] [CrossRef] [Green Version]
  44. Bragoszewska, E.; Mainka, A.; Pastuszka, J.S.; Lizonczyk, K.; Desta, Y.G. Assessment of bacterial aerosol in a preschool, primary school and high school in Poland. Atmosphere 2018, 9, 87. [Google Scholar] [CrossRef] [Green Version]
  45. Fu Shaw, L.; Chen, I.H.; Chen, C.S.; Wu, H.H.; Lai, L.S.; Chen, Y.Y.; Wang, F.D. Factors influencing microbial colonies in the air of operating rooms. BMC Infect Dis. 2018, 18, 4. [Google Scholar] [CrossRef] [Green Version]
  46. Chang, C.W.; Ting, Y.T.; Horng, Y.J. Collection efficiency of liquid-based samplers for fungi in indoor air. Indoor Air 2019, 29, 380–389. [Google Scholar] [CrossRef]
  47. Chang, C.W.; Wang, L.J. Impact of culture media and sampling methods on Staphylococcus aureus aerosols. Indoor Air 2015, 25, 488–498. [Google Scholar] [CrossRef] [PubMed]
  48. Adams, R.I.; Bateman, A.C.; Bik, H.M.; Meadow, J.F. Microbiota of the indoor environment: A meta-analysis. Microbiome 2015, 3, 49. [Google Scholar] [CrossRef] [PubMed] [Green Version]
  49. Stephens, B. What have we learned about the microbiomes of indoor environments? mSystems 2016, 1, e00083-16. [Google Scholar] [CrossRef] [PubMed] [Green Version]
  50. Sautour, M.; Sixt, N.; Dalle, F.; L’Ollivier, C.; Fourquenet, V.; Calinon, C.; Paul, K.; Valvin, S.; Maurel, A.; Aho, S.; et al. Profiles and seasonal distribution of airborne fungi in indoor and outdoor environments at a French hospital. Sci. Total Environ. 2009, 407, 3766–3771. [Google Scholar] [CrossRef]
  51. Gołofit-Szymczak, M.; Górny, R.L. Microbiological air quality in office buildings equipped with dventilation systems. Indoor Air 2018, 28, 792–805. [Google Scholar] [CrossRef]
  52. Fujiyoshi, S.; Tanaka, D.; Maruyama, F. Transmission of airborne bacteria across built environments and its measurement standards: A review. Front. Microbiol. 2017, 8, 2336. [Google Scholar] [CrossRef] [PubMed] [Green Version]
  53. Al Maghlouth, A.; Al Yousef, Y.; Al-Bagieh, N.H. Qualitative and quantitative analysis of microbial aerosols in selected areas within the College of Dentistry, King Saud University. Quintessence Int. 2007, 38, e222–e228. [Google Scholar] [PubMed]
  54. Hefzy, E.M.; Wegdan, A.A.; Abdel Wahed, W.Y. Hospital outpatient clinics as a potential hazard for healthcare associated infections. J. Infect. Public Health 2016, 9, 88–97. [Google Scholar] [CrossRef] [PubMed] [Green Version]
  55. Grevskott, D.H.; Svanevik, C.S.; Wester, A.L.; Lunestad, B.T. The species accuracy of the Most Probable Number (MPN) European Union reference method for enumeration of Escherichia coli in marine bivalves. J. Microbiol. Methods 2016, 131, 73–77. [Google Scholar] [CrossRef] [PubMed]
  56. Gangneux, J.P.; Sassi, M.; Lemire, P.; Le Cann, P. Metagenomic Characterization of Indoor Dust Bacterial and Fungal Microbiota in Homes of Asthma and Non-asthma Patients Using Next Generation Se-quencing. Front. Microbiol. 2020, 11, 1671. [Google Scholar] [CrossRef]
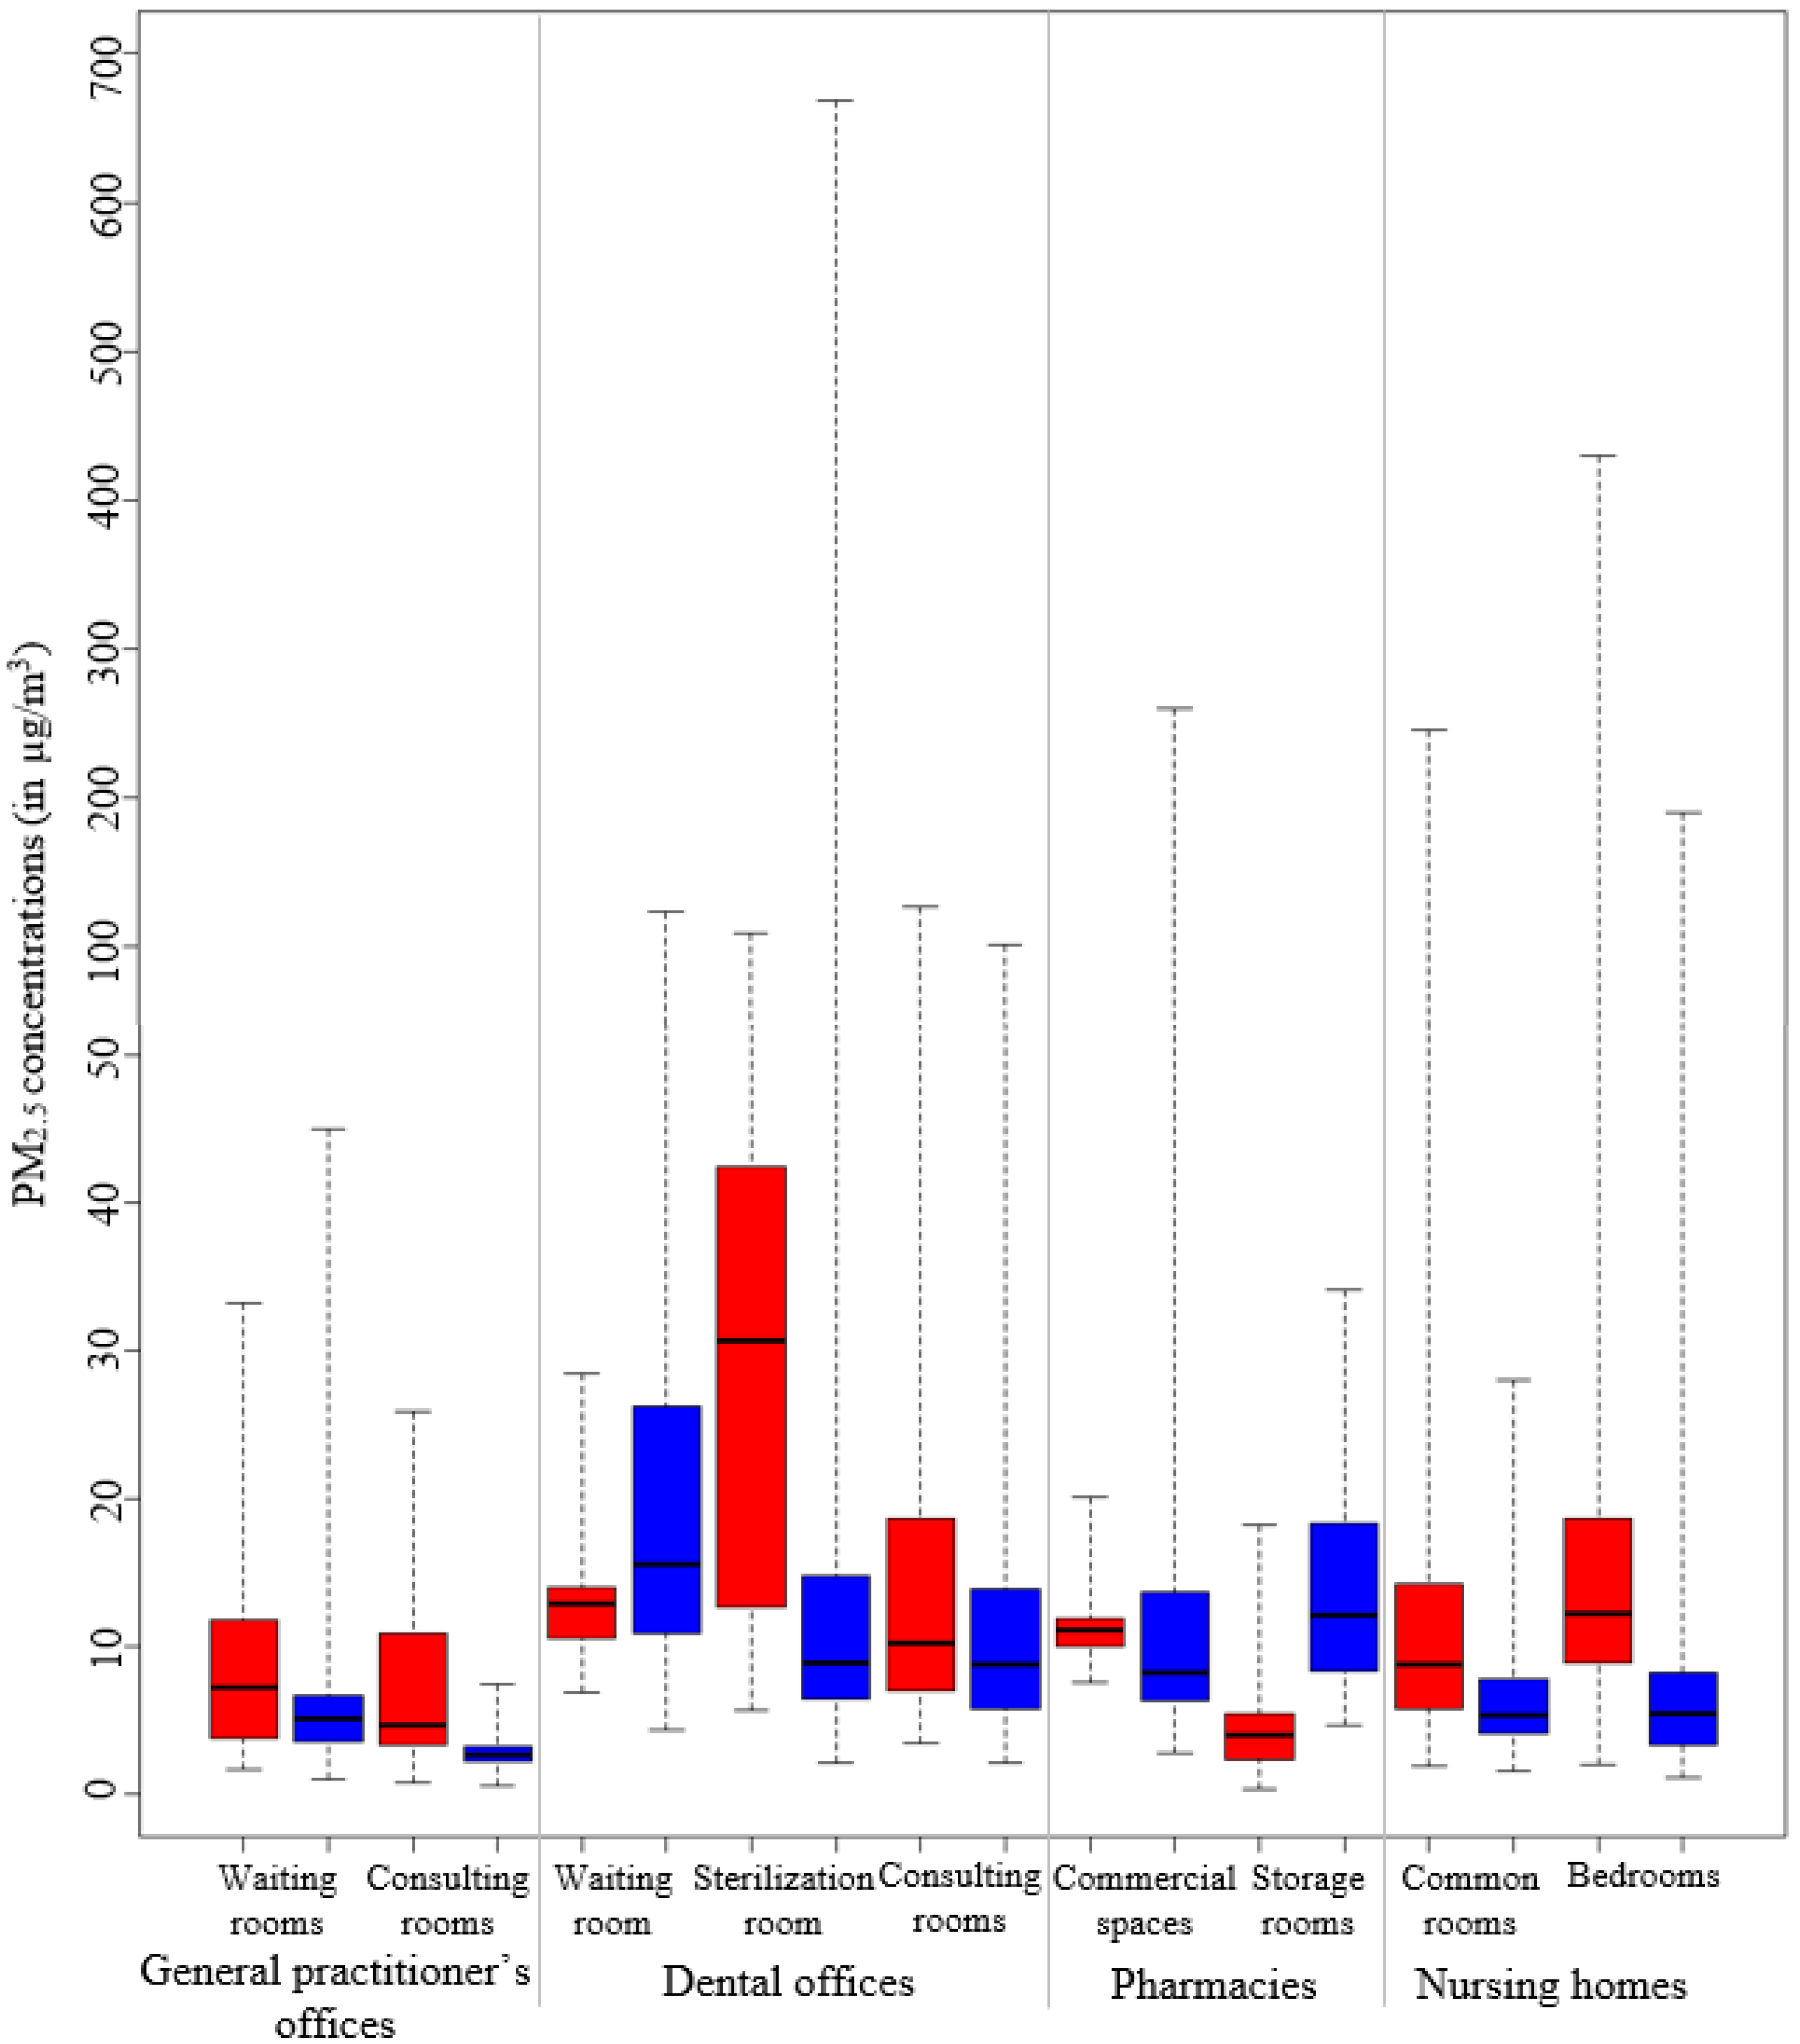
Figure 1. Fine particulate matter (PM2.5) concentrations (µg/m3) in each sampled room of healthcare and care facilities during summer (red) and winter (blue).
Atmosphere 12 01337 g001
Figure 2. Median semi-volatile and volatile organic compound (SVOC and VOC) concentrations (μg/m3) for all measurements according to sampling seasons. Notes: BTEX, benzene, toluene, ethylbenzene and xylene; other aromatic hydrocarbons include styrene, 1,2,4-trimethylbenzene, naphthalene and phenol; other aldehydes include propionaldehyde, butyraldehyde, isovaleraldehyde, valeraldehyde, hexaldehyde.
Atmosphere 12 01337 g002
Figure 3. Median semi-volatile and volatile organic compound (SVOC and VOC) concentrations (μg/m3) for all measurements according to sampling facilities. Notes: BTEX, benzene, toluene, ethylbenzene and xylene; other aromatic hydrocarbons include styrene, 1,2,4-trimethylbenzene, naphthalene and phenol; other aldehydes include propionaldehyde, butyraldehyde, isovaleraldehyde, valeraldehyde, hexaldehyde.
Atmosphere 12 01337 g003
Figure 4. Bacterial and fungal contamination in indoor air (CFU/m3) in healthcare and care facilities during summer (red) and winter (blue). Notes: air samples were collected twice per season in each waiting room of general practitioner’s offices, waiting or sterilization room of dental offices, the commercial space of pharmacies and common room of nursing homes.
Atmosphere 12 01337 g004
Figure 5. Bacterial and fungal contaminations on surfaces (CFU/100 cm2) in each sampled room of healthcare and care facilities during summer (red) and winter (blue).
Atmosphere 12 01337 g005
Table 1. Sampling and analysis methods and design.
CompoundsSamplingSampling Time and Flow RateAnalysis Methods
Carbon dioxide (CO2)Passive
Class’Air®
4.5 daysNon-dispersive infrared technology: Class’Air®
Particles (PM2.5)Active
pDR1500®
2.25 days 1.5 L/minOptic particles count: pDR1500®
AldehydesPassive
2,4-DNPH cartridge Radielo™
4.5 daysHPLC/DAD
Other VOCsActive
Carbopack™/Carboxen® tube
3 h 50 mL/minThermal desorption and GC/MS
SVOCsActive
Polyurethane foam and quartz filter
4.5 days 2 L/minPressurized liquid extraction and GC/MS/MS
Hydrogen peroxideActive
Closed-face cartridge
6–8 h 1 L/minChemical desorption
and photometer
Microbiological
(bacteria and fungi)
Coriolis® air sampler
Swabs for surfaces
10 min–100 L/min
Spot sample (100 cm2)
Cultures
MALDI-TOF MS or API test
Notes: HPLC/DAD, high-performance liquid chromatography with diode array detection; GC/MS, gas chromatography/mass spectrometry; GC/MS/MS, gas chromatography/tandem mass spectrometry.
Table 2. List of organic compounds sampled.
Family of Compounds (Number)Organic Compound
Volatile organic compounds (VOCs) (39)
Aromatic hydrocarbons (9)benzene, ethylbenzene, styrene, toluene, o-xylene, mp-xylenes, 1,2,4-trimethylbenzene, naphthalene, phenol
Aliphatic hydrocarbons (3)n-decane, n-undecane, n-heptane
Halogenated hydrocarbons (8)1,1,1-trichloroethane, 1,4-dichlorobenzene, trichloroethylene, tetrachloroethylene, bromodichloromethane, dibromochloromethane, tribromomethane, trichloromethane
Alcohols (5)2-ethyl-1-hexanol, phenoxyethanol, ethanol, isopropanol, n-propanol
Ketones (2)acetone, 2-butanone
Terpenes (1)limonene
Ethers (3)ether, 2-ethoxyethanol, 2-butoxyethanol
Peroxides (1)hydrogen peroxide
Aldehydes (7)formaldehyde, acetaldehyde, propionaldehyde, butyraldheyde, isovaleraldehyde, valeraldehyde, hexaldehyde
Semi-volatile organic compounds (SVOCs) (13)
Phthalates (6)di(2-ethylhexyl)phthalate (DEHP), diethylphthalate (DEP), dibutylphthalate (DBP), diisobutyltphthalate (DiBP), benzylbutylphthalate (BBP), diisononylphthalate (DiNP)
Musk (2)tonalide, galaxolide
Pyrethroids (5)cyfluthrine, cypermethrine, deltamethrine, permethrine, tetramethrine
Table 3. Mean indoor air stuffiness according to the ICONE index score.
FacilitiesRoomsDay (8 am to 8 pm)Night (8 pm to 8 am)
SummerWinterSummerWinter
General practitioner’s offices (n = 2)Waiting rooms0100
Consulting rooms2211
Dental offices (n = 2)Waiting room0000
Sterilization room2210
Consulting rooms2211
Pharmacies (n = 2)Commercial spaces0000
Storage rooms1000
Nursing homes (n = 4)Common rooms0000
Bedrooms0010
Notes: ICONE index score ranges from 0 to 5 (0 = no air stuffiness; 1 = low air stuffiness; 2 = medium air stuffiness; 3 = high air stuffiness; 4 = very high air stuffiness; 5 = extreme air stuffiness).
Publisher’s Note: MDPI stays neutral with regard to jurisdictional claims in published maps and institutional affiliations.