Generating Flood Hazard Maps Based on an Innovative Spatial Interpolation Methodology for Precipitation


Abstract
1. Introduction
2. Materials and Methods
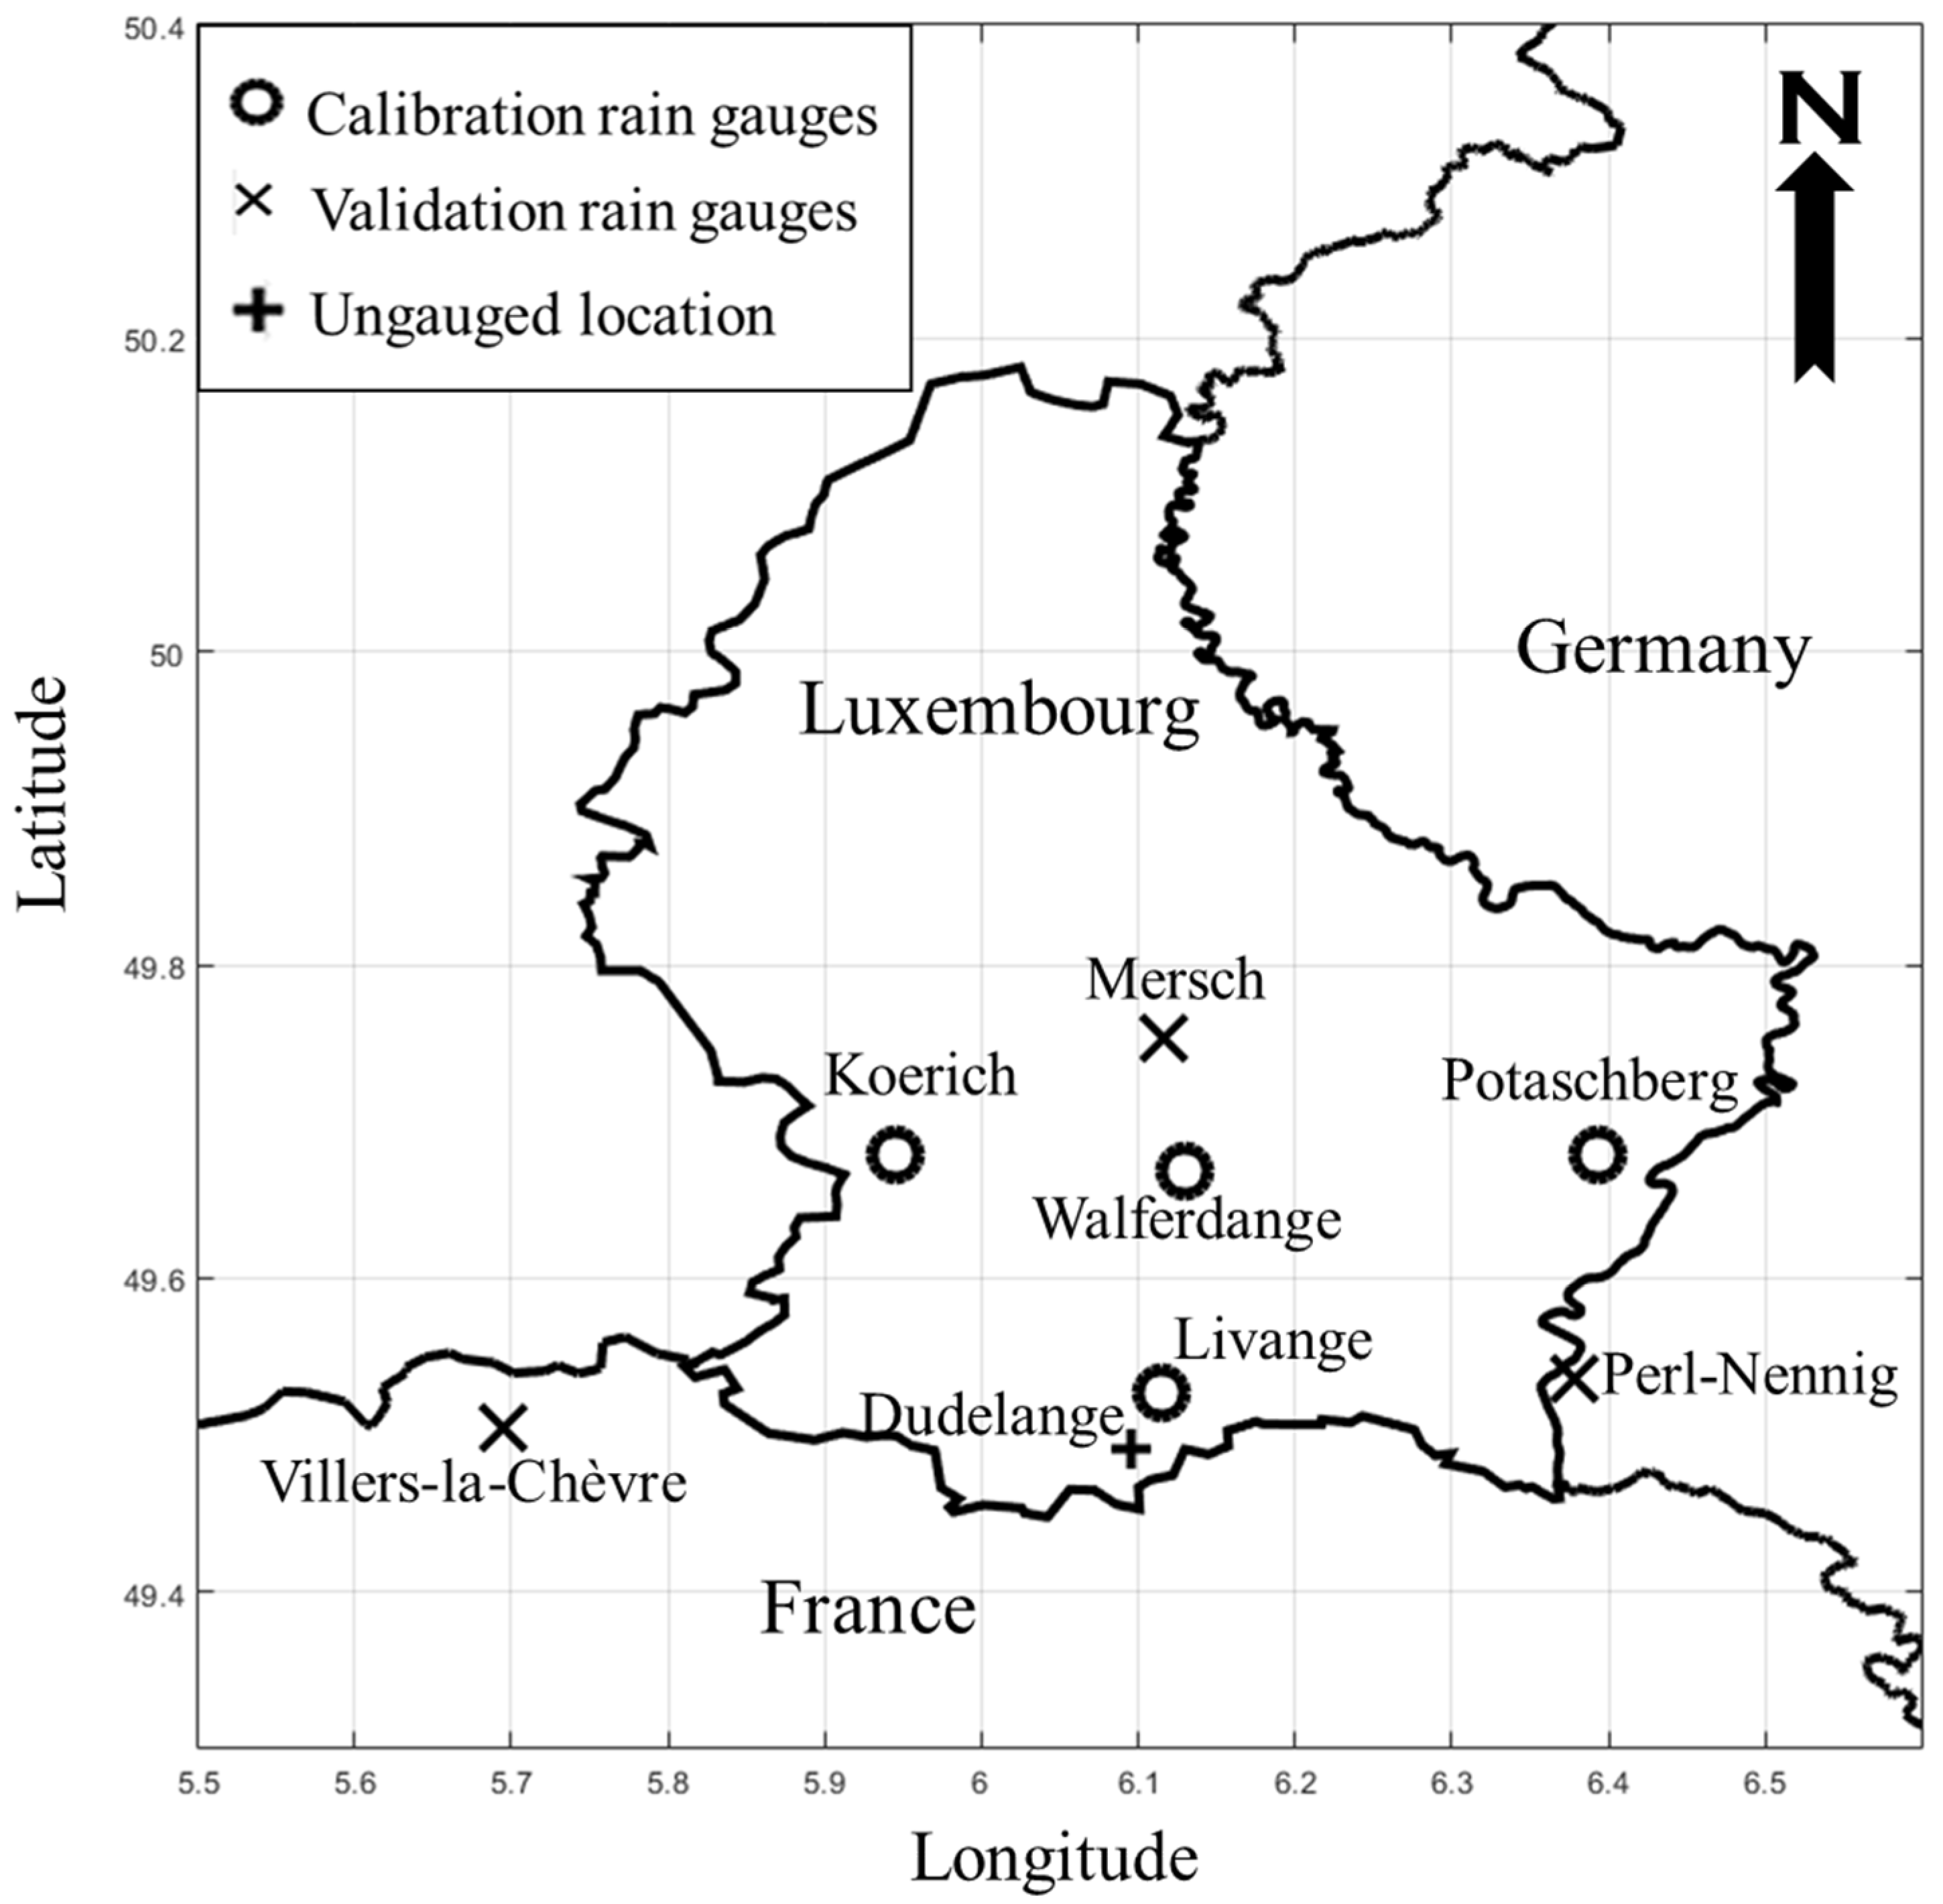
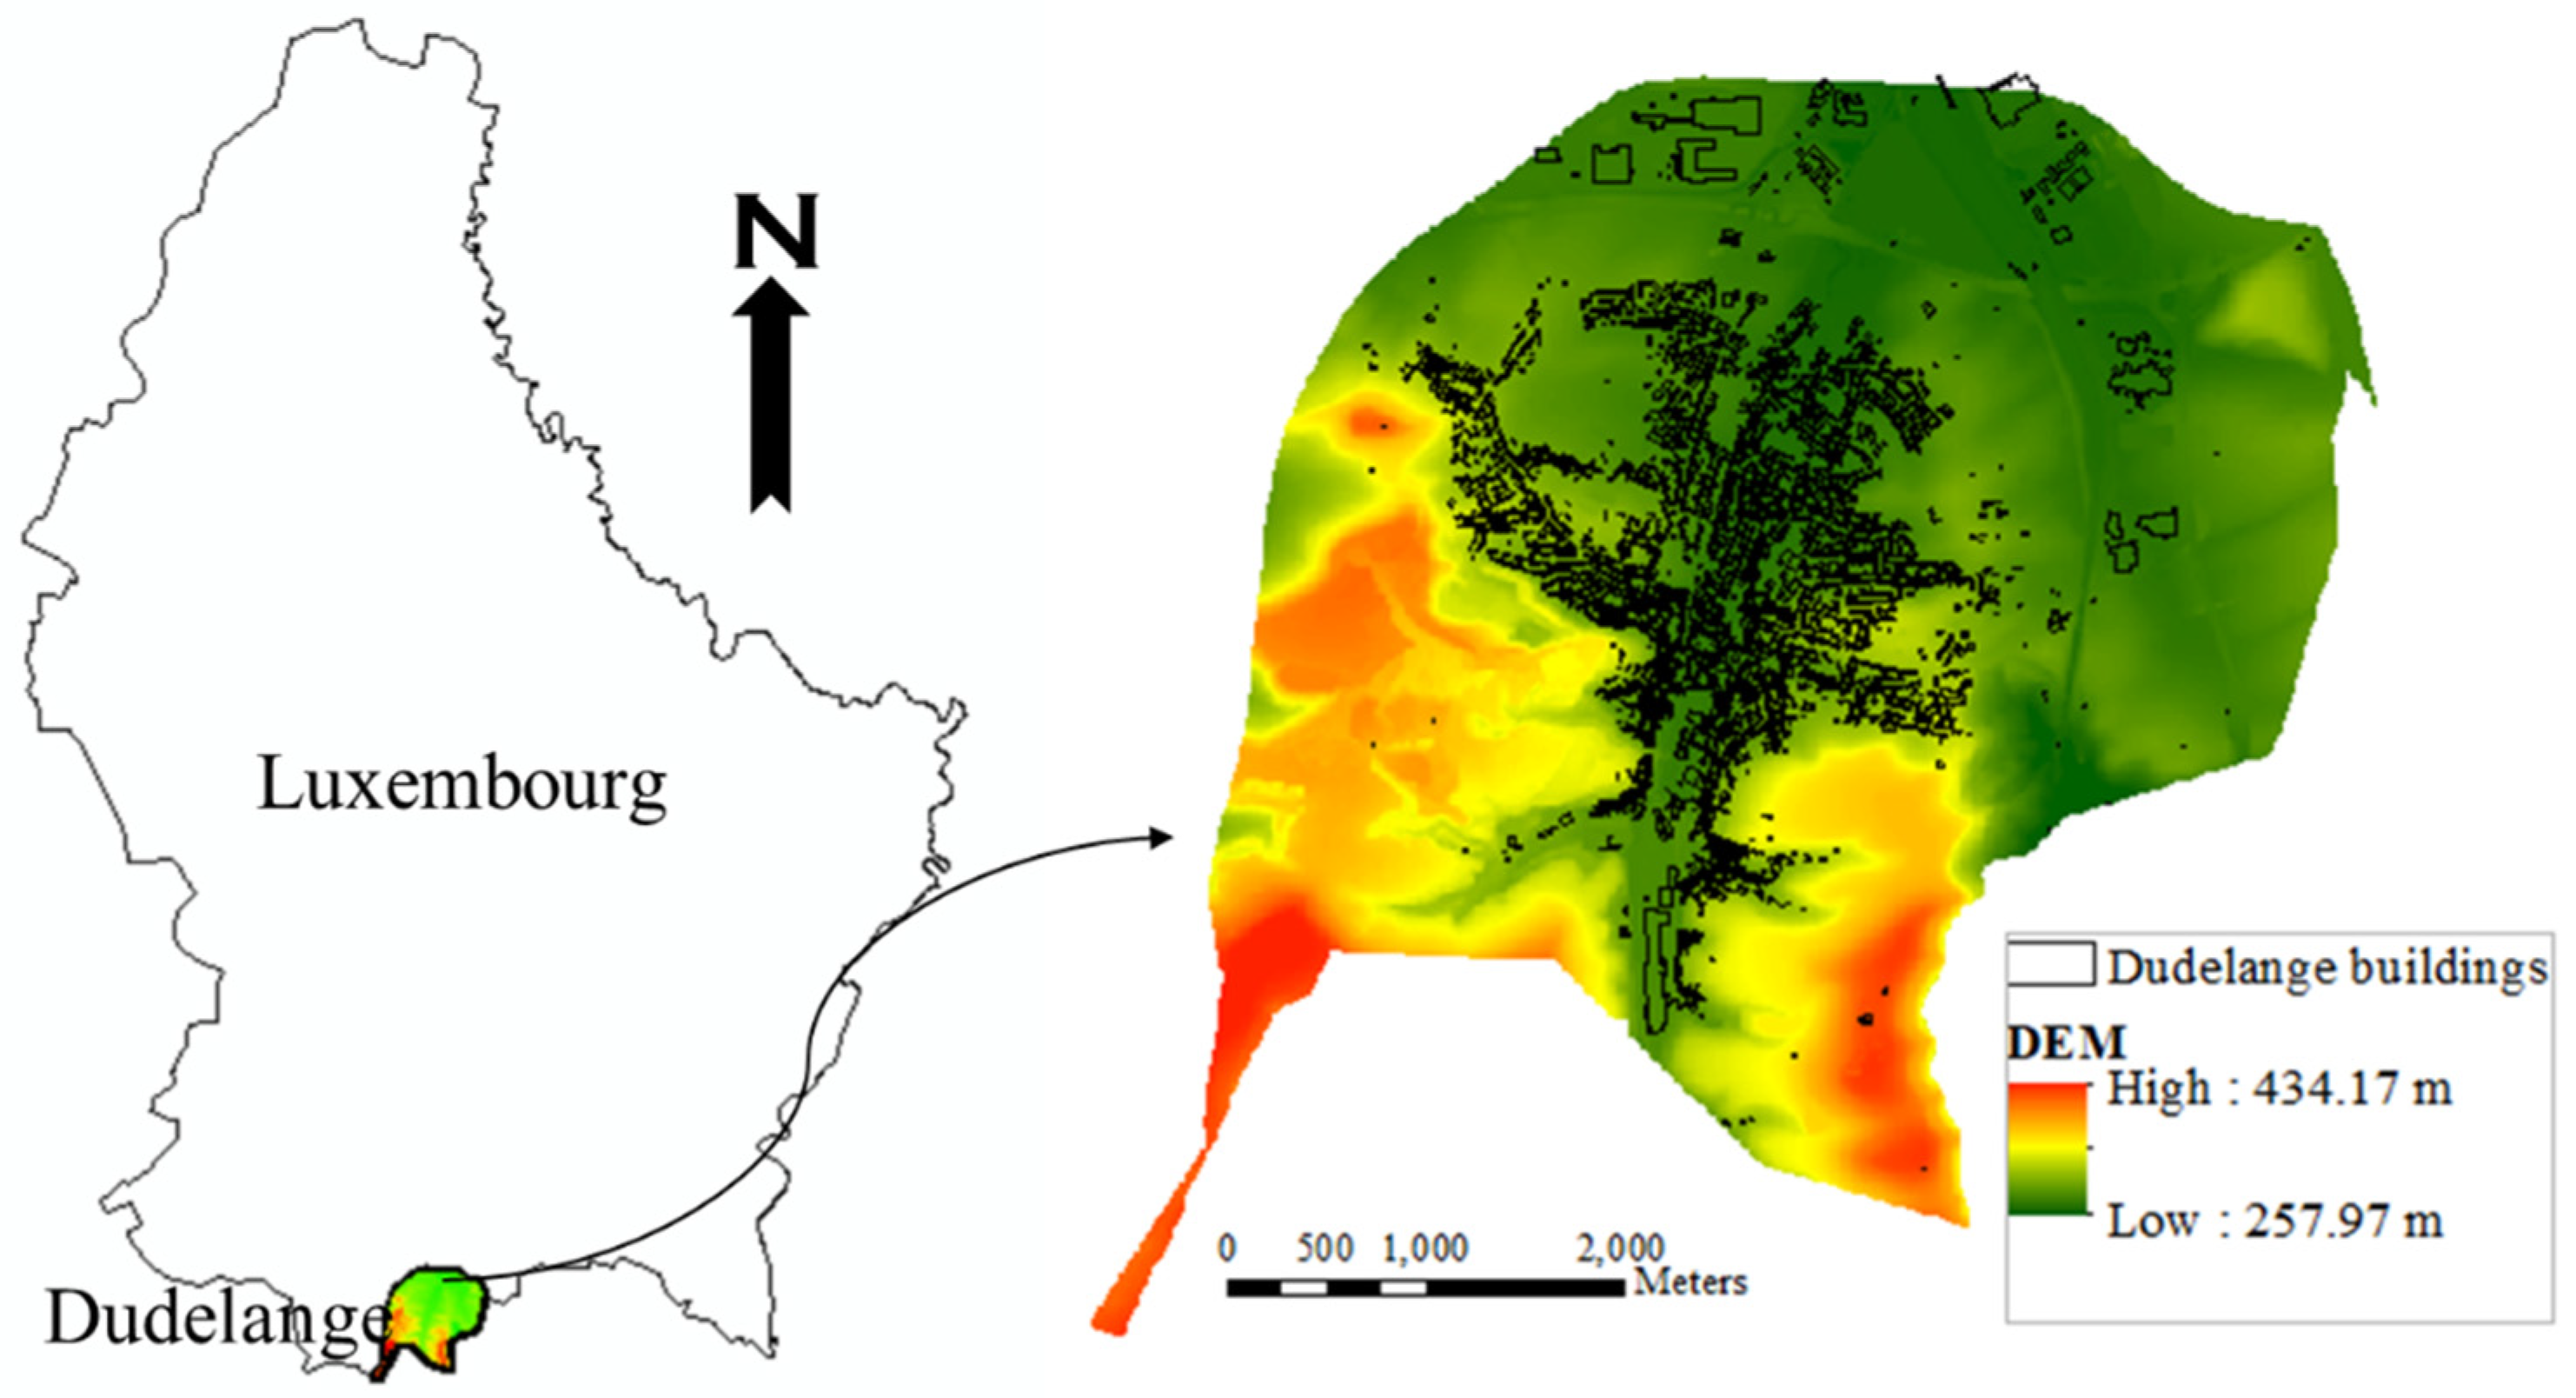
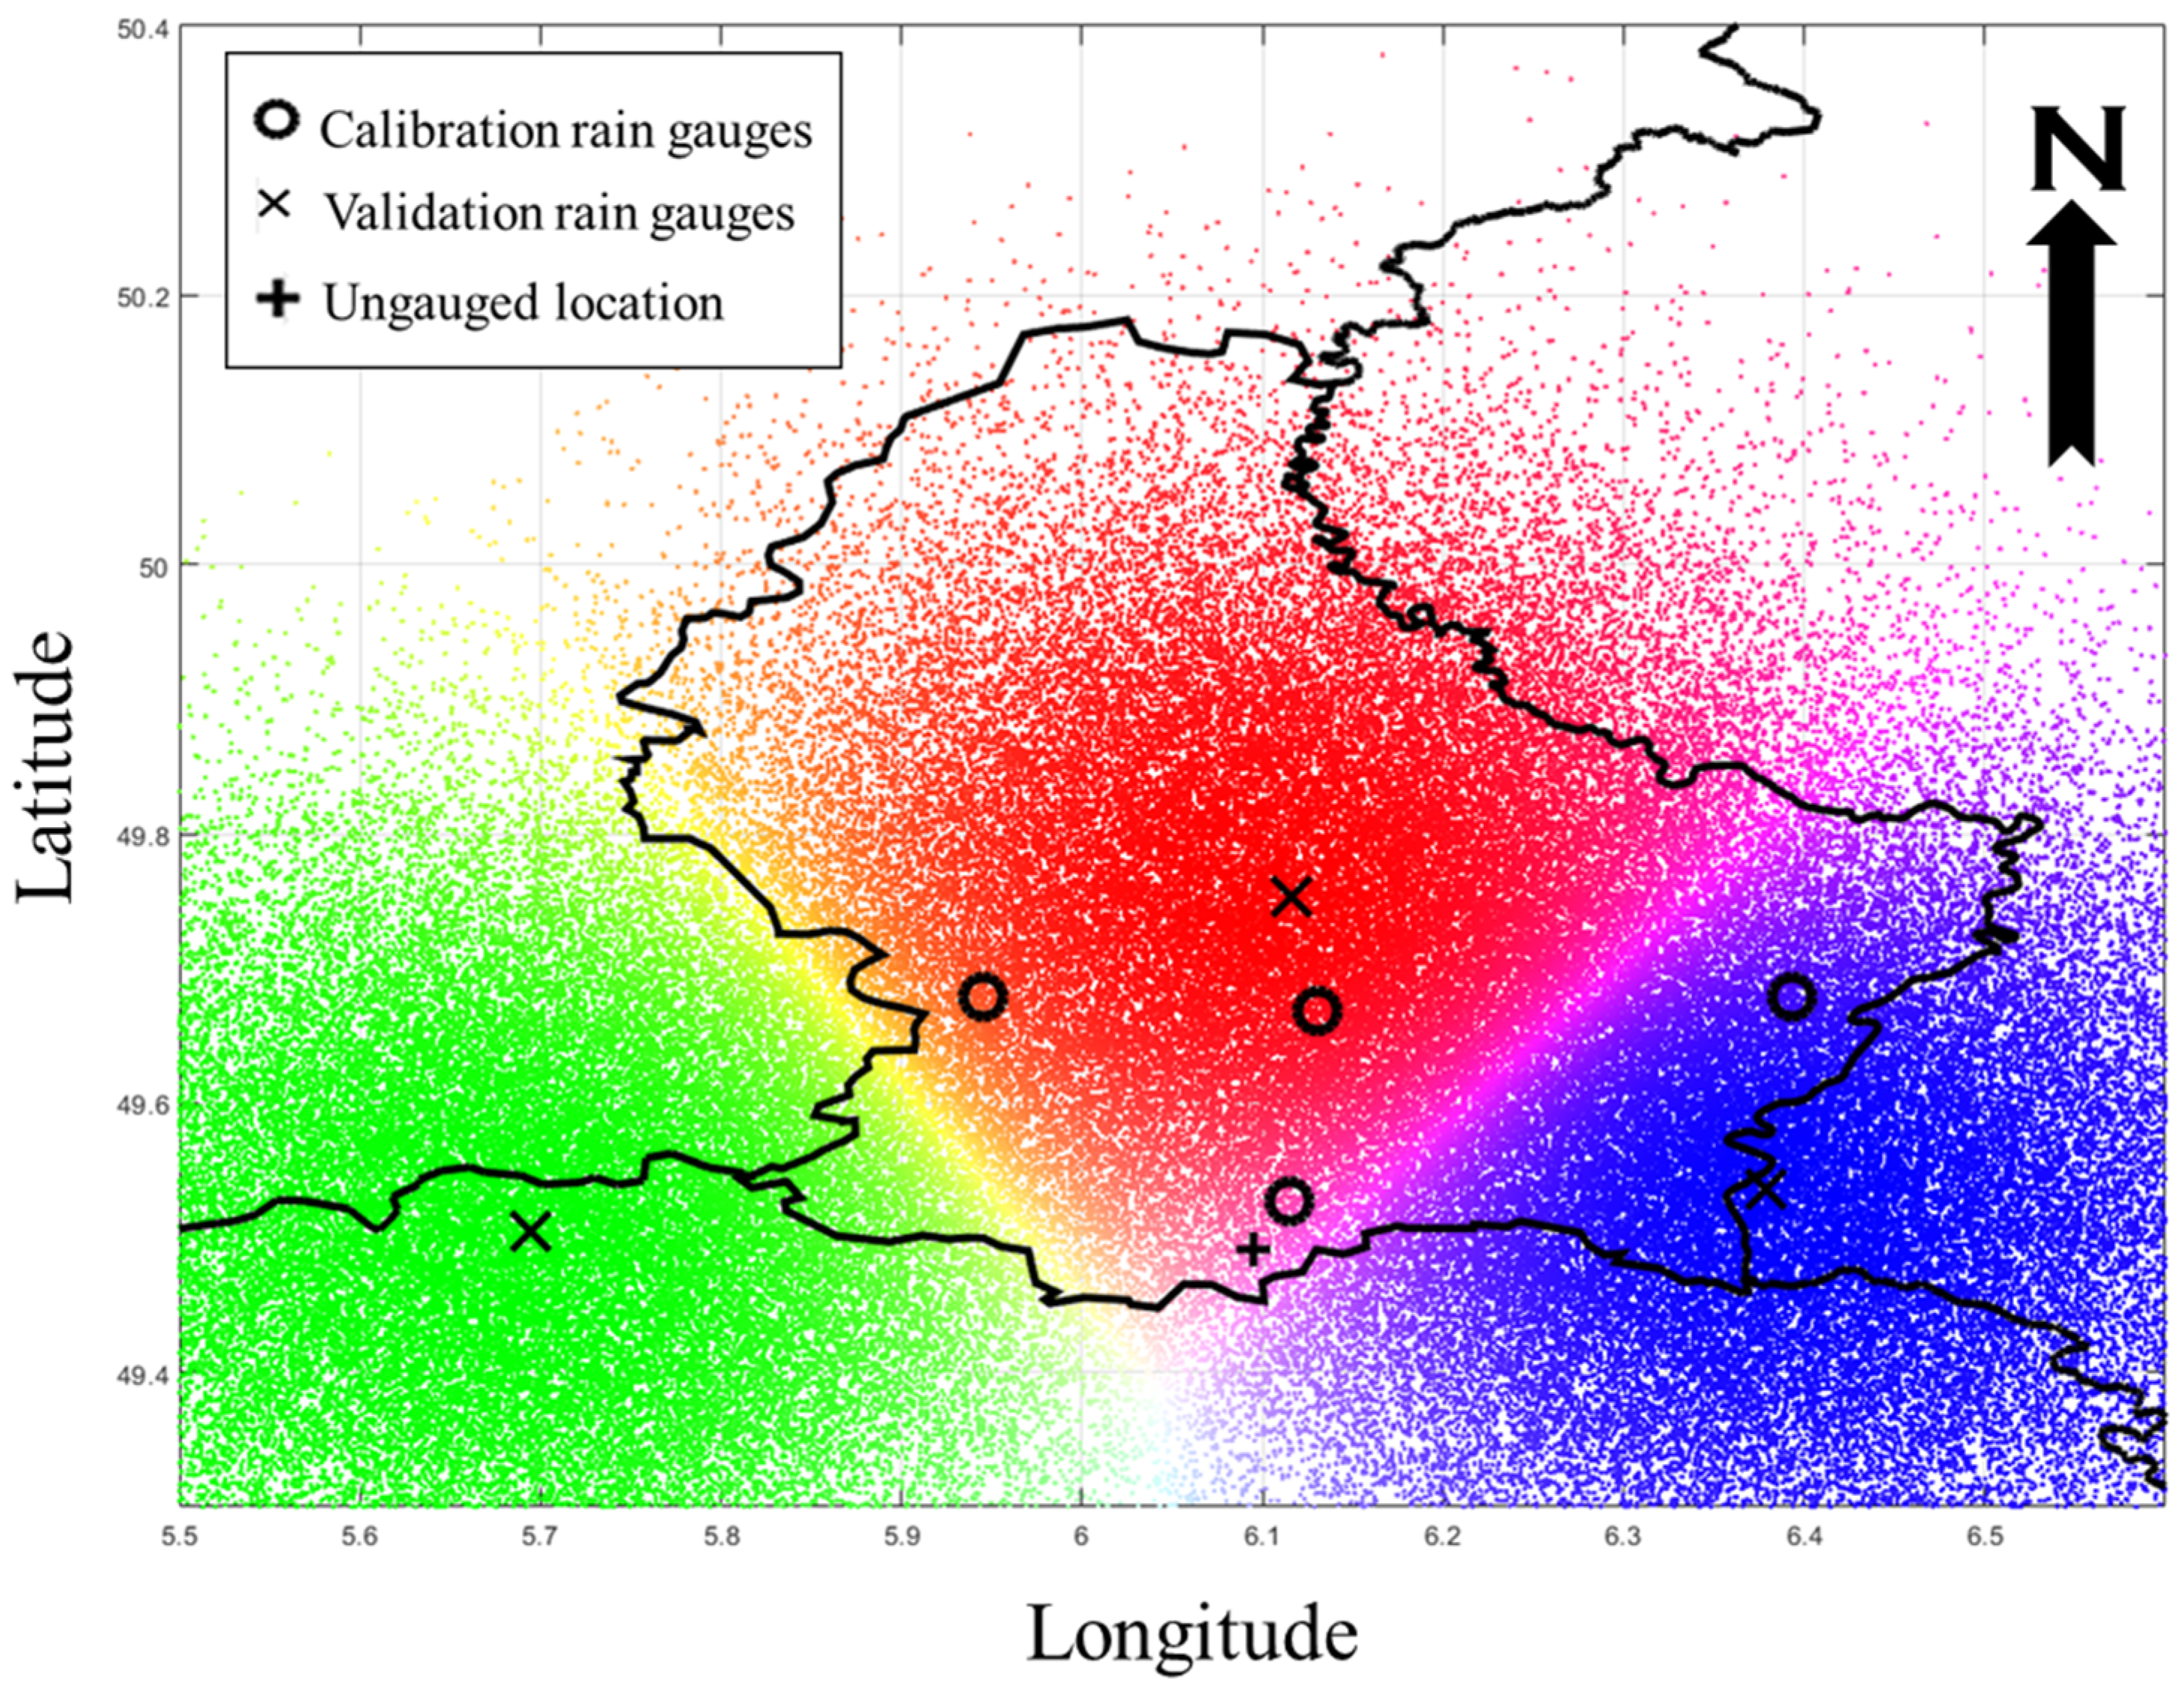
2.1. Study Area and Data
2.2. Estimation of Rainfall Data Using the i-FCM Clustering Method
2.3. Return Period (Tr) Estimation for Maximum Daily Rainfall
2.4. Flood Hazard Maps Using LISFLOOD FP Model
3. Results and Discussion
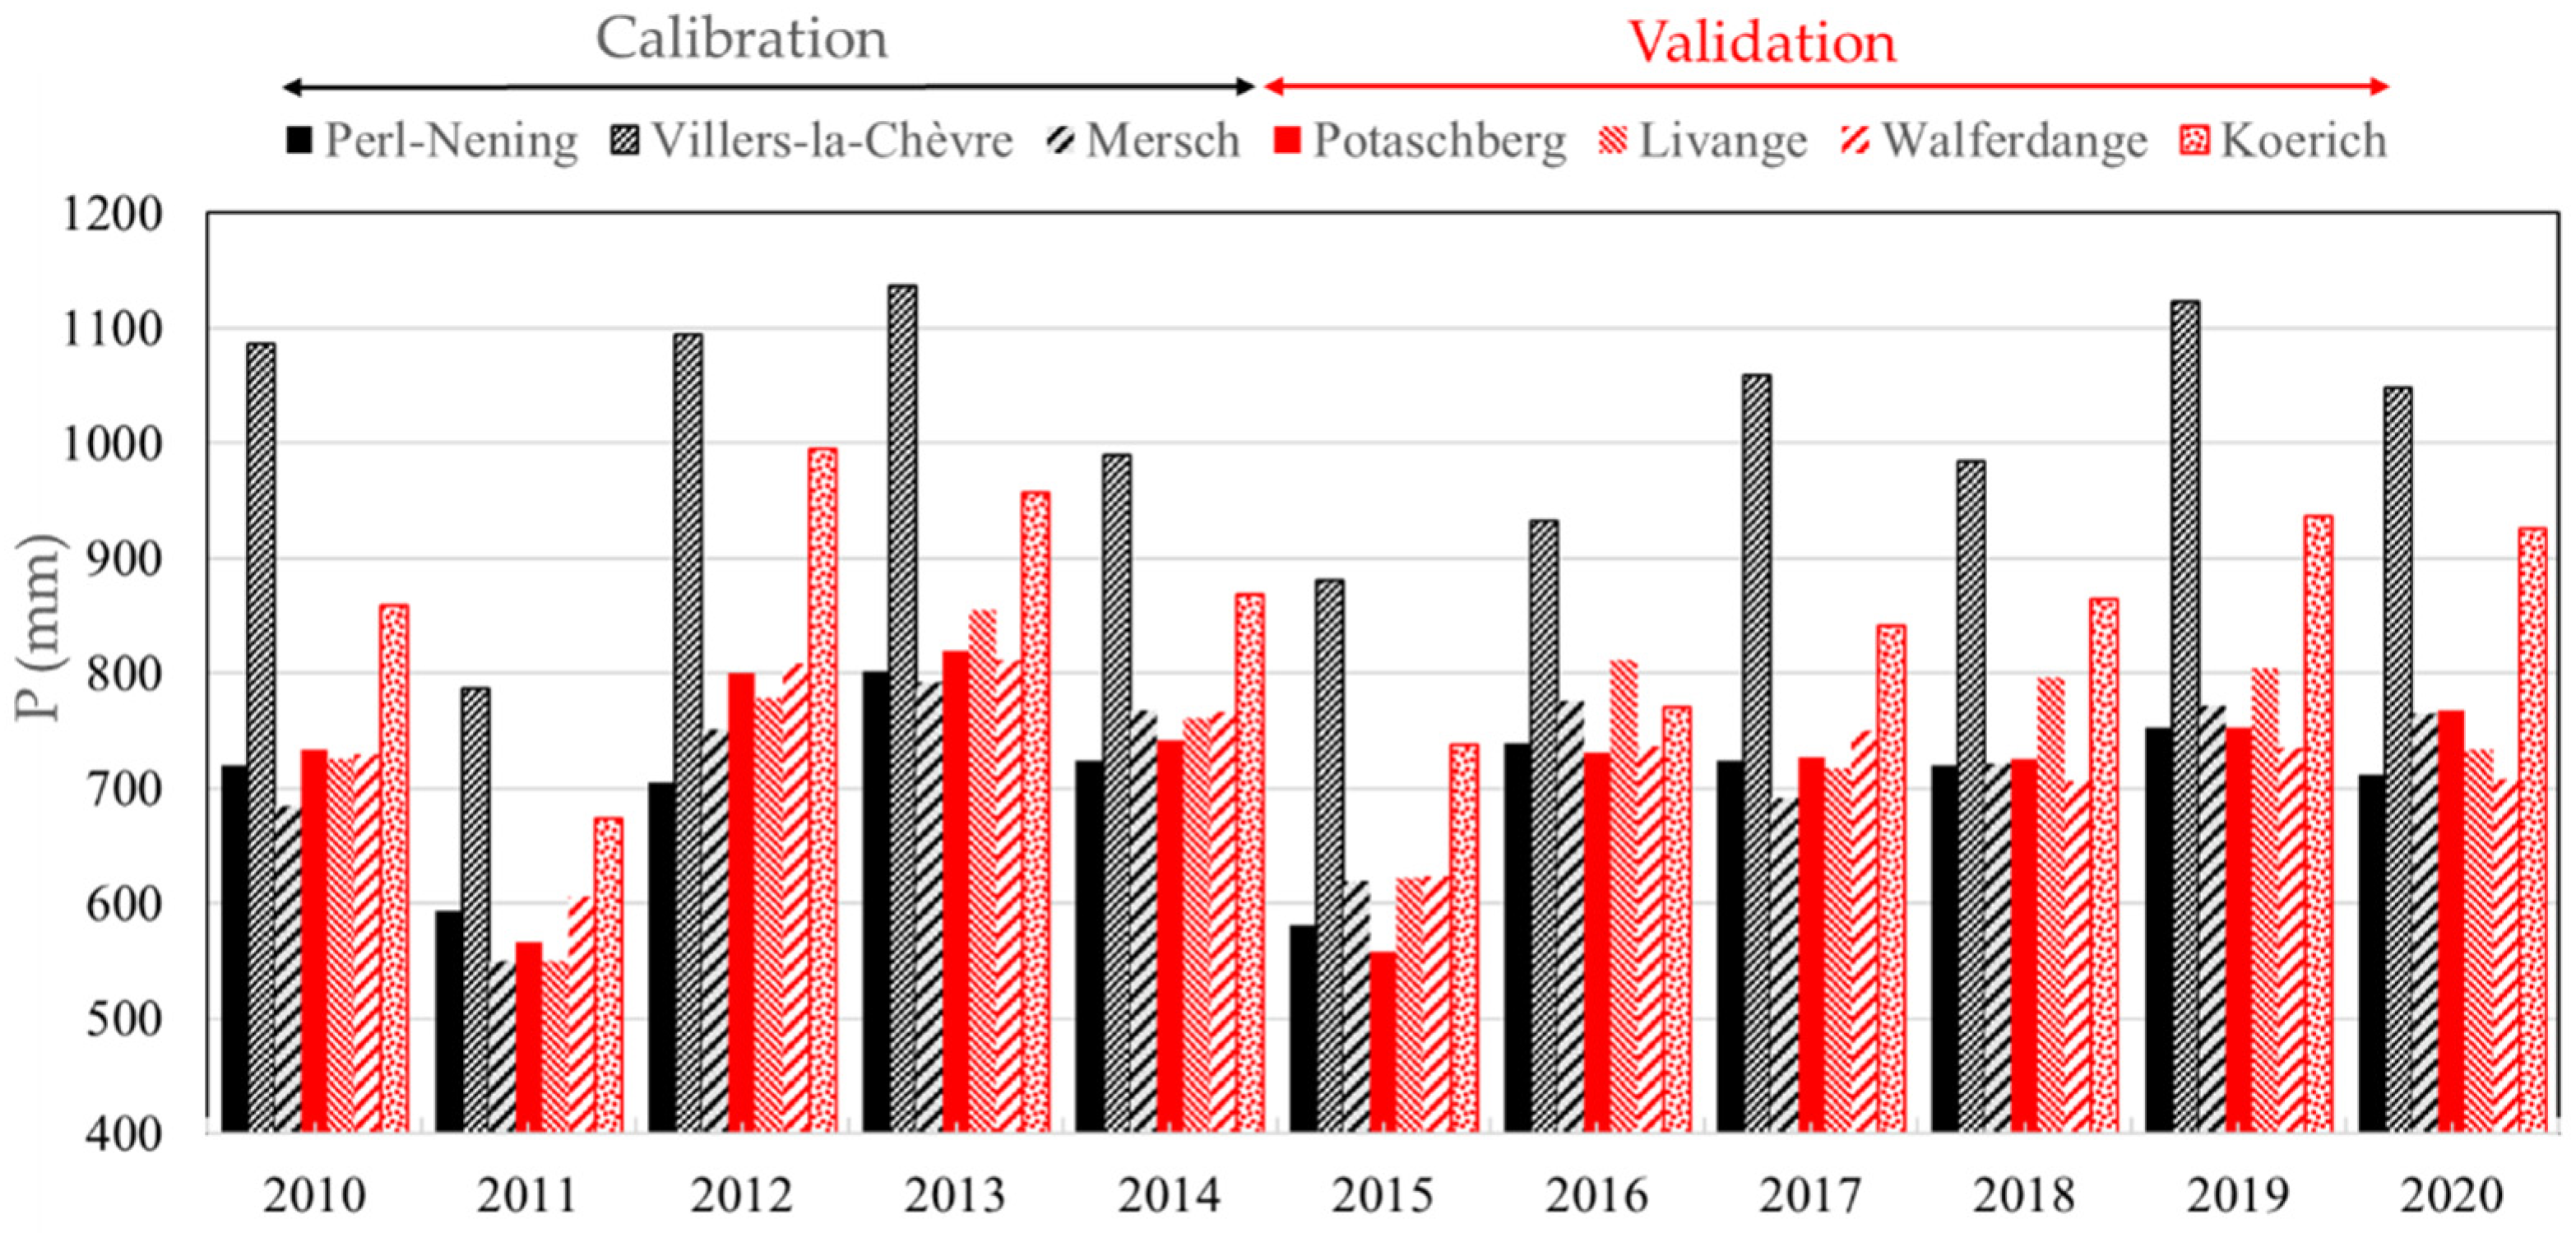
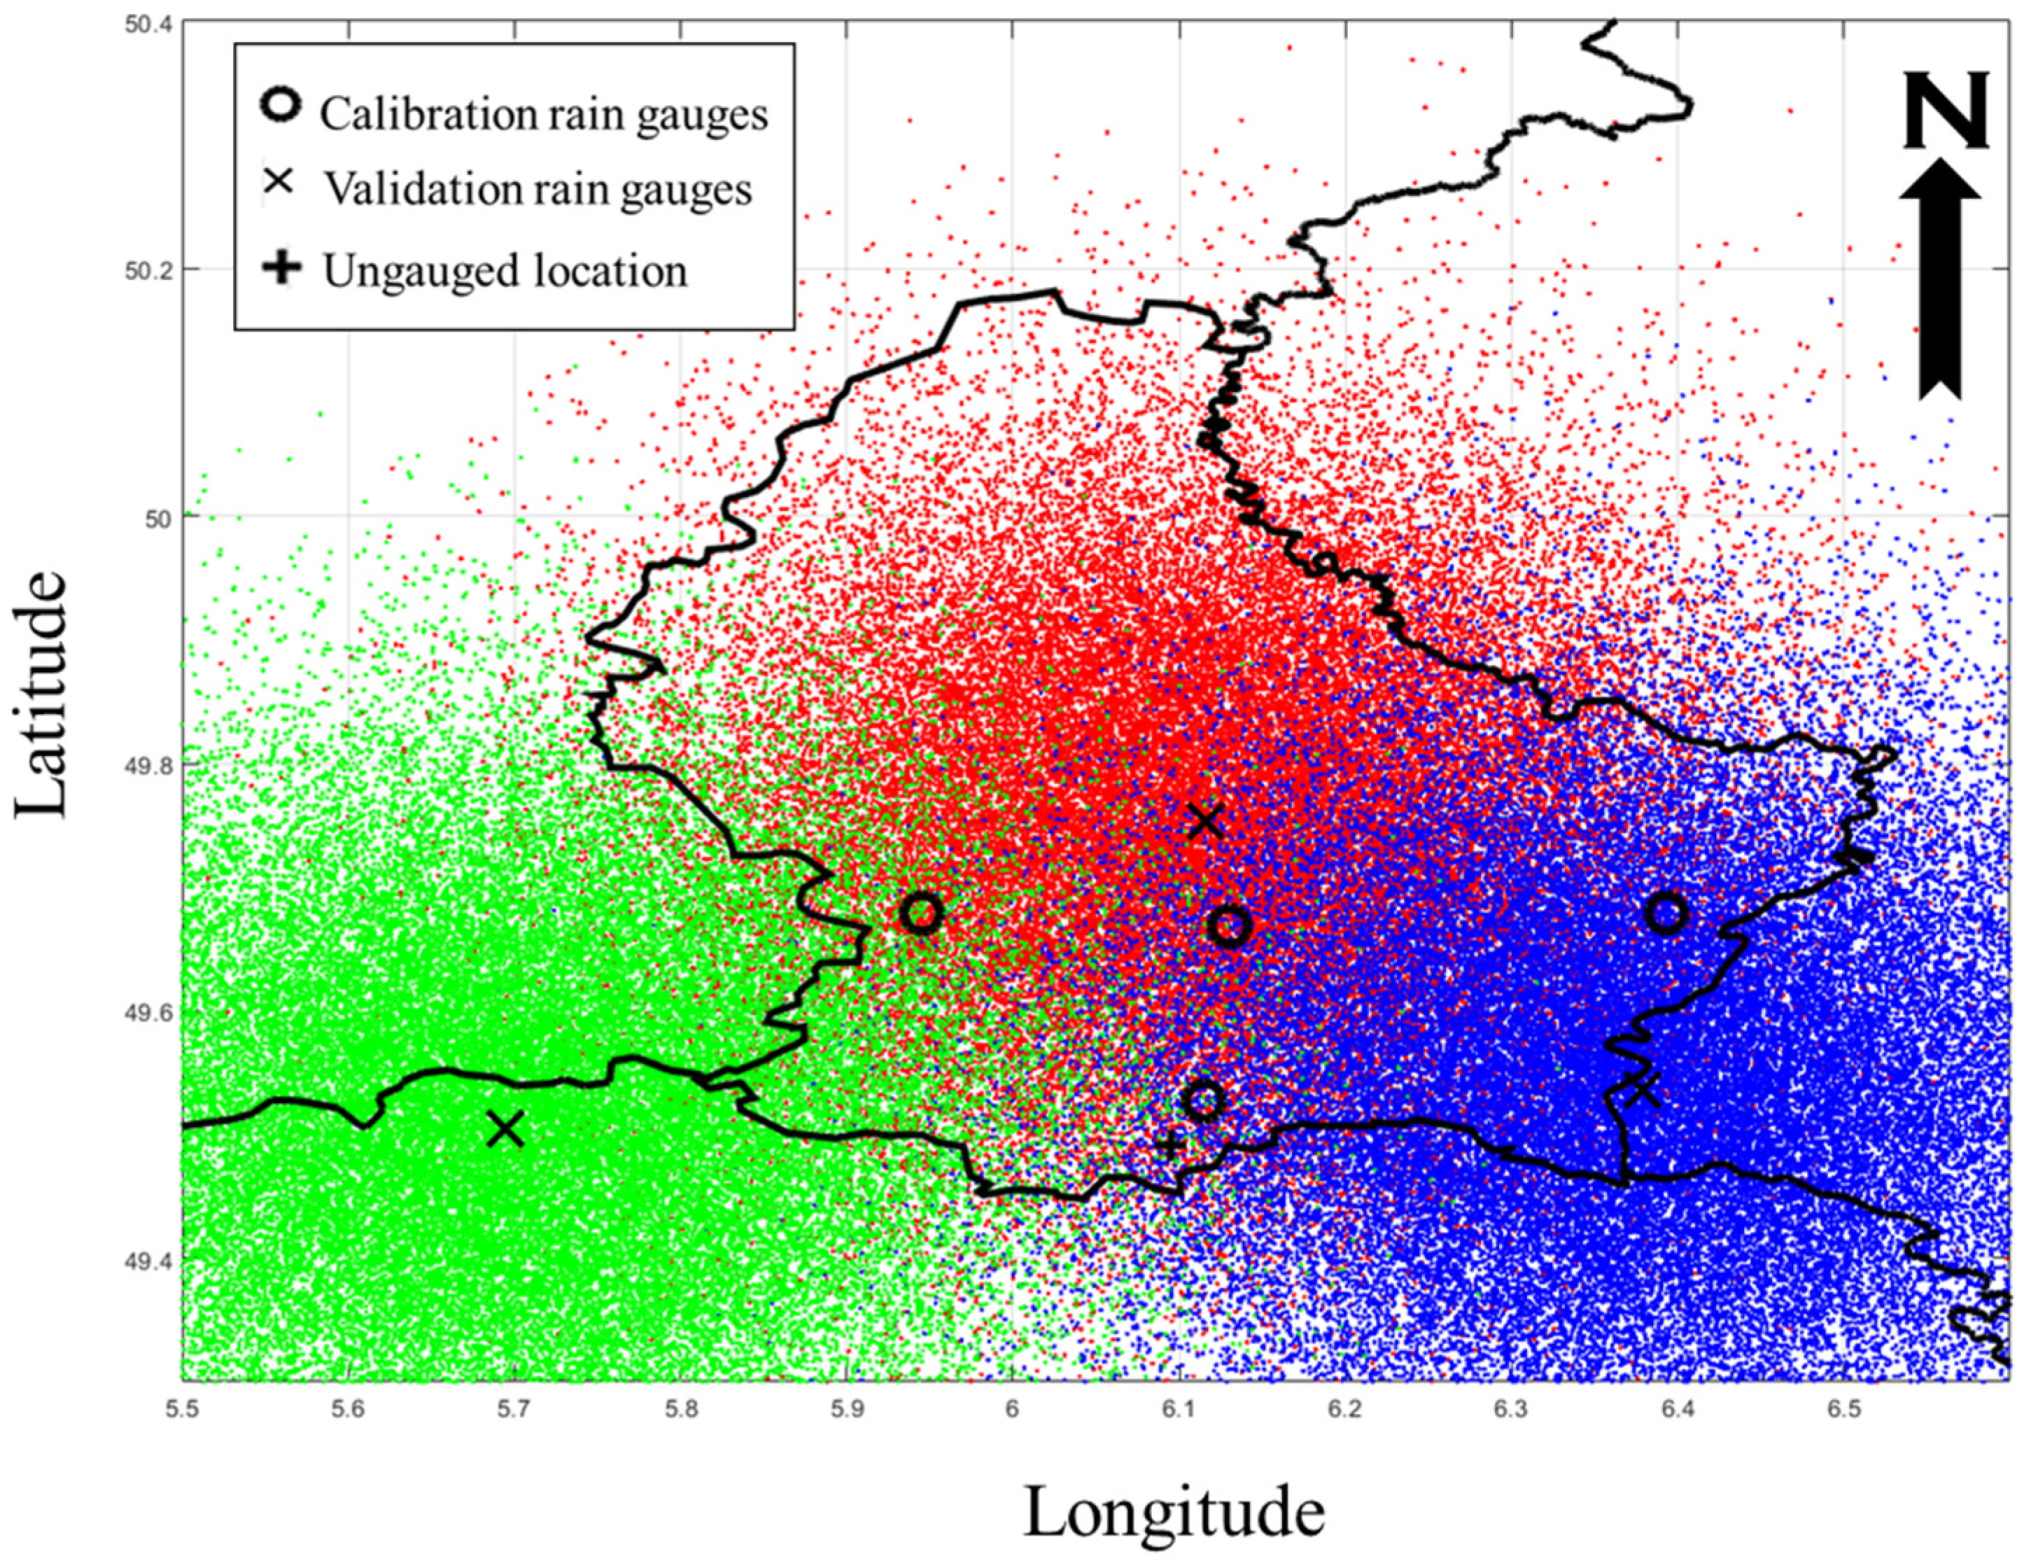
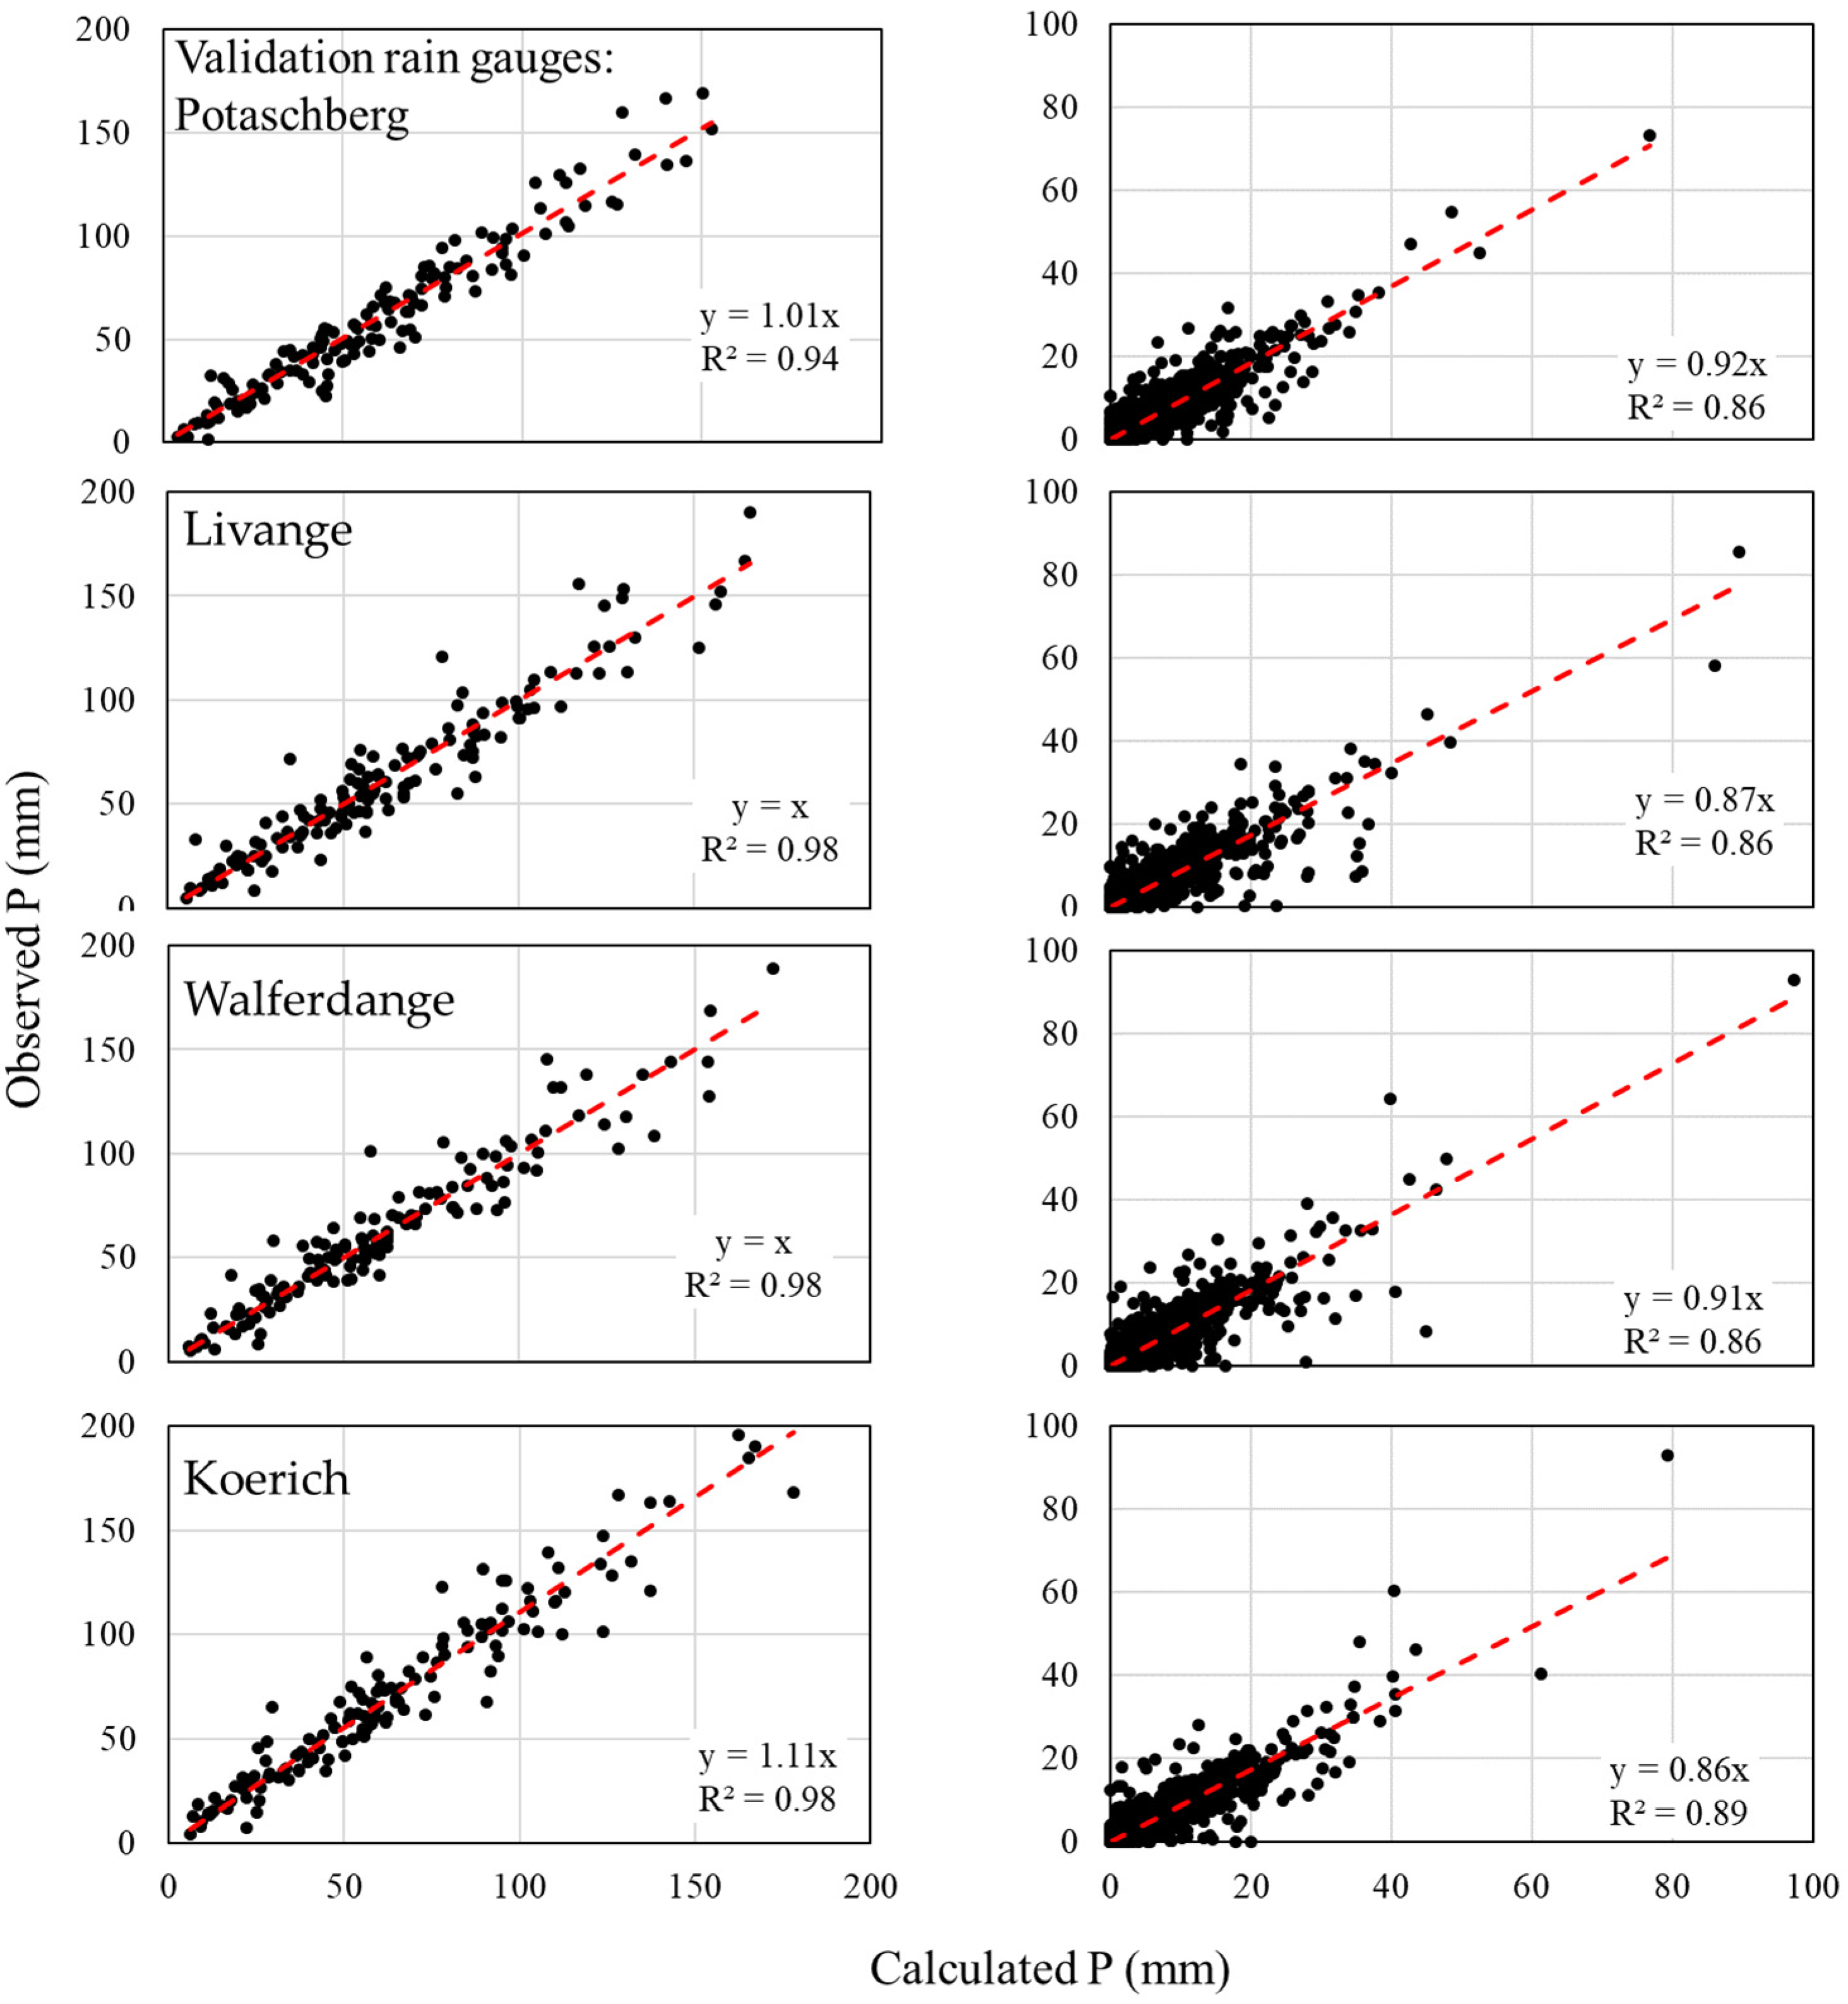
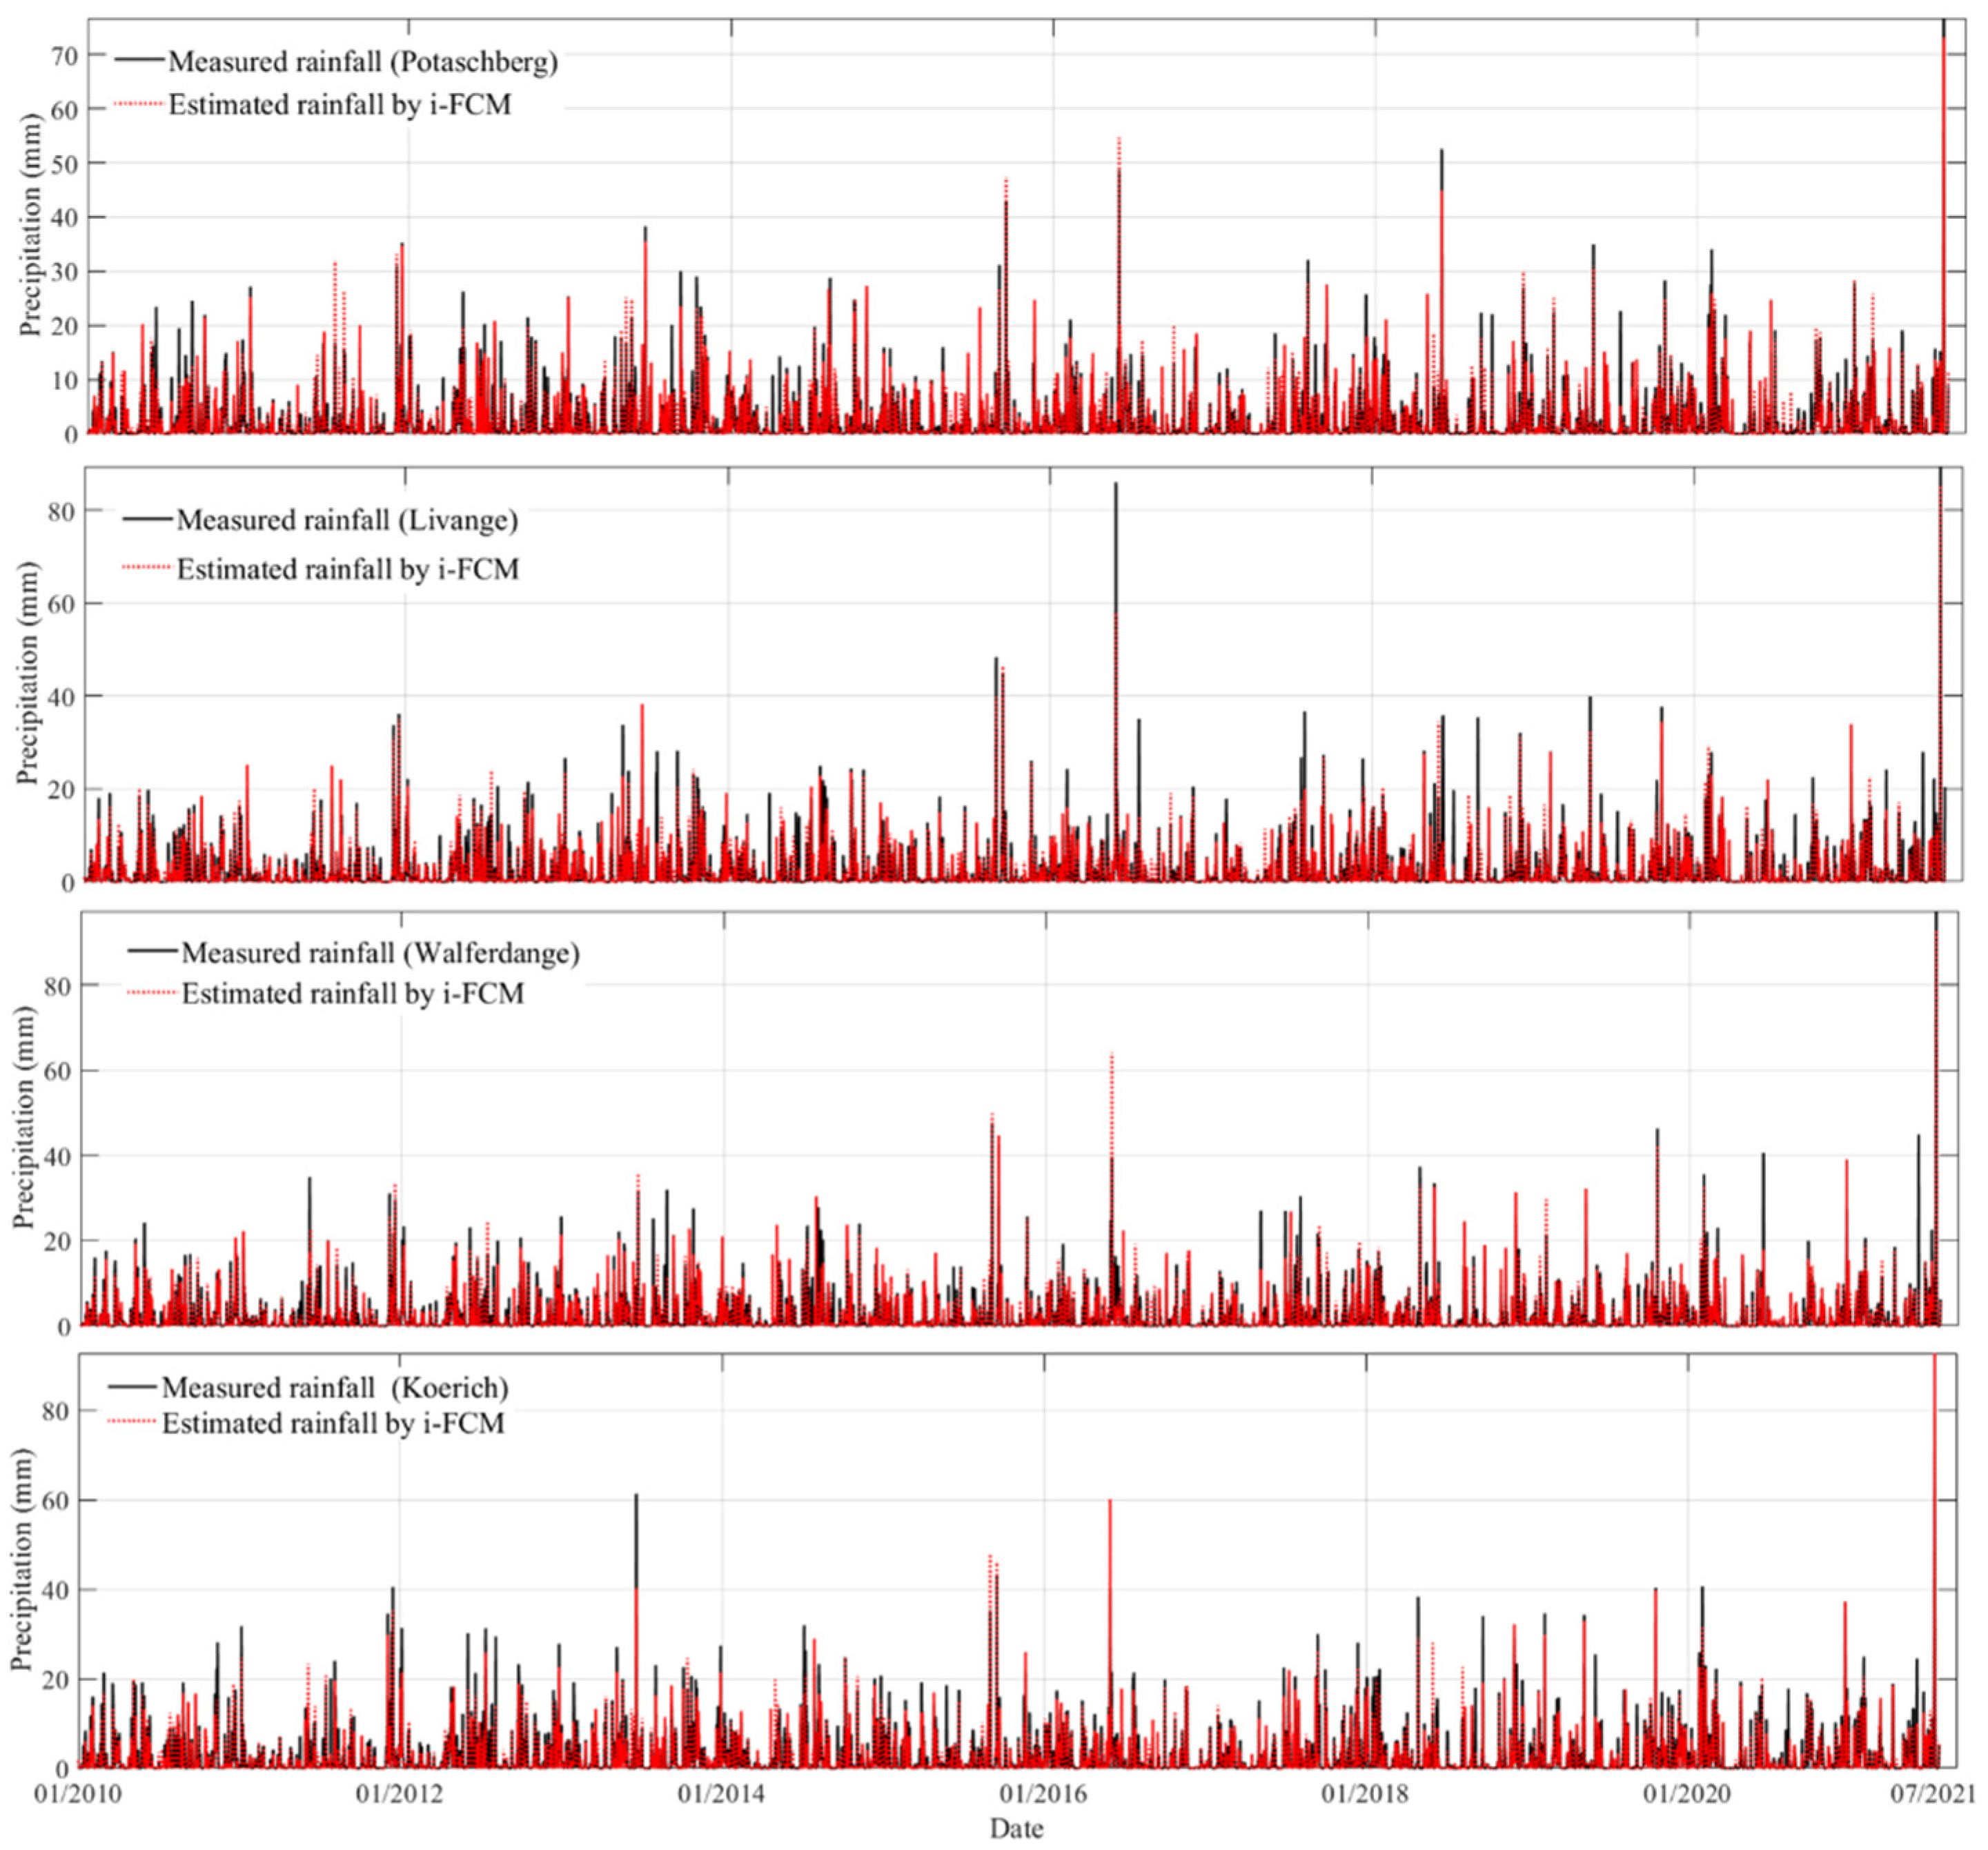
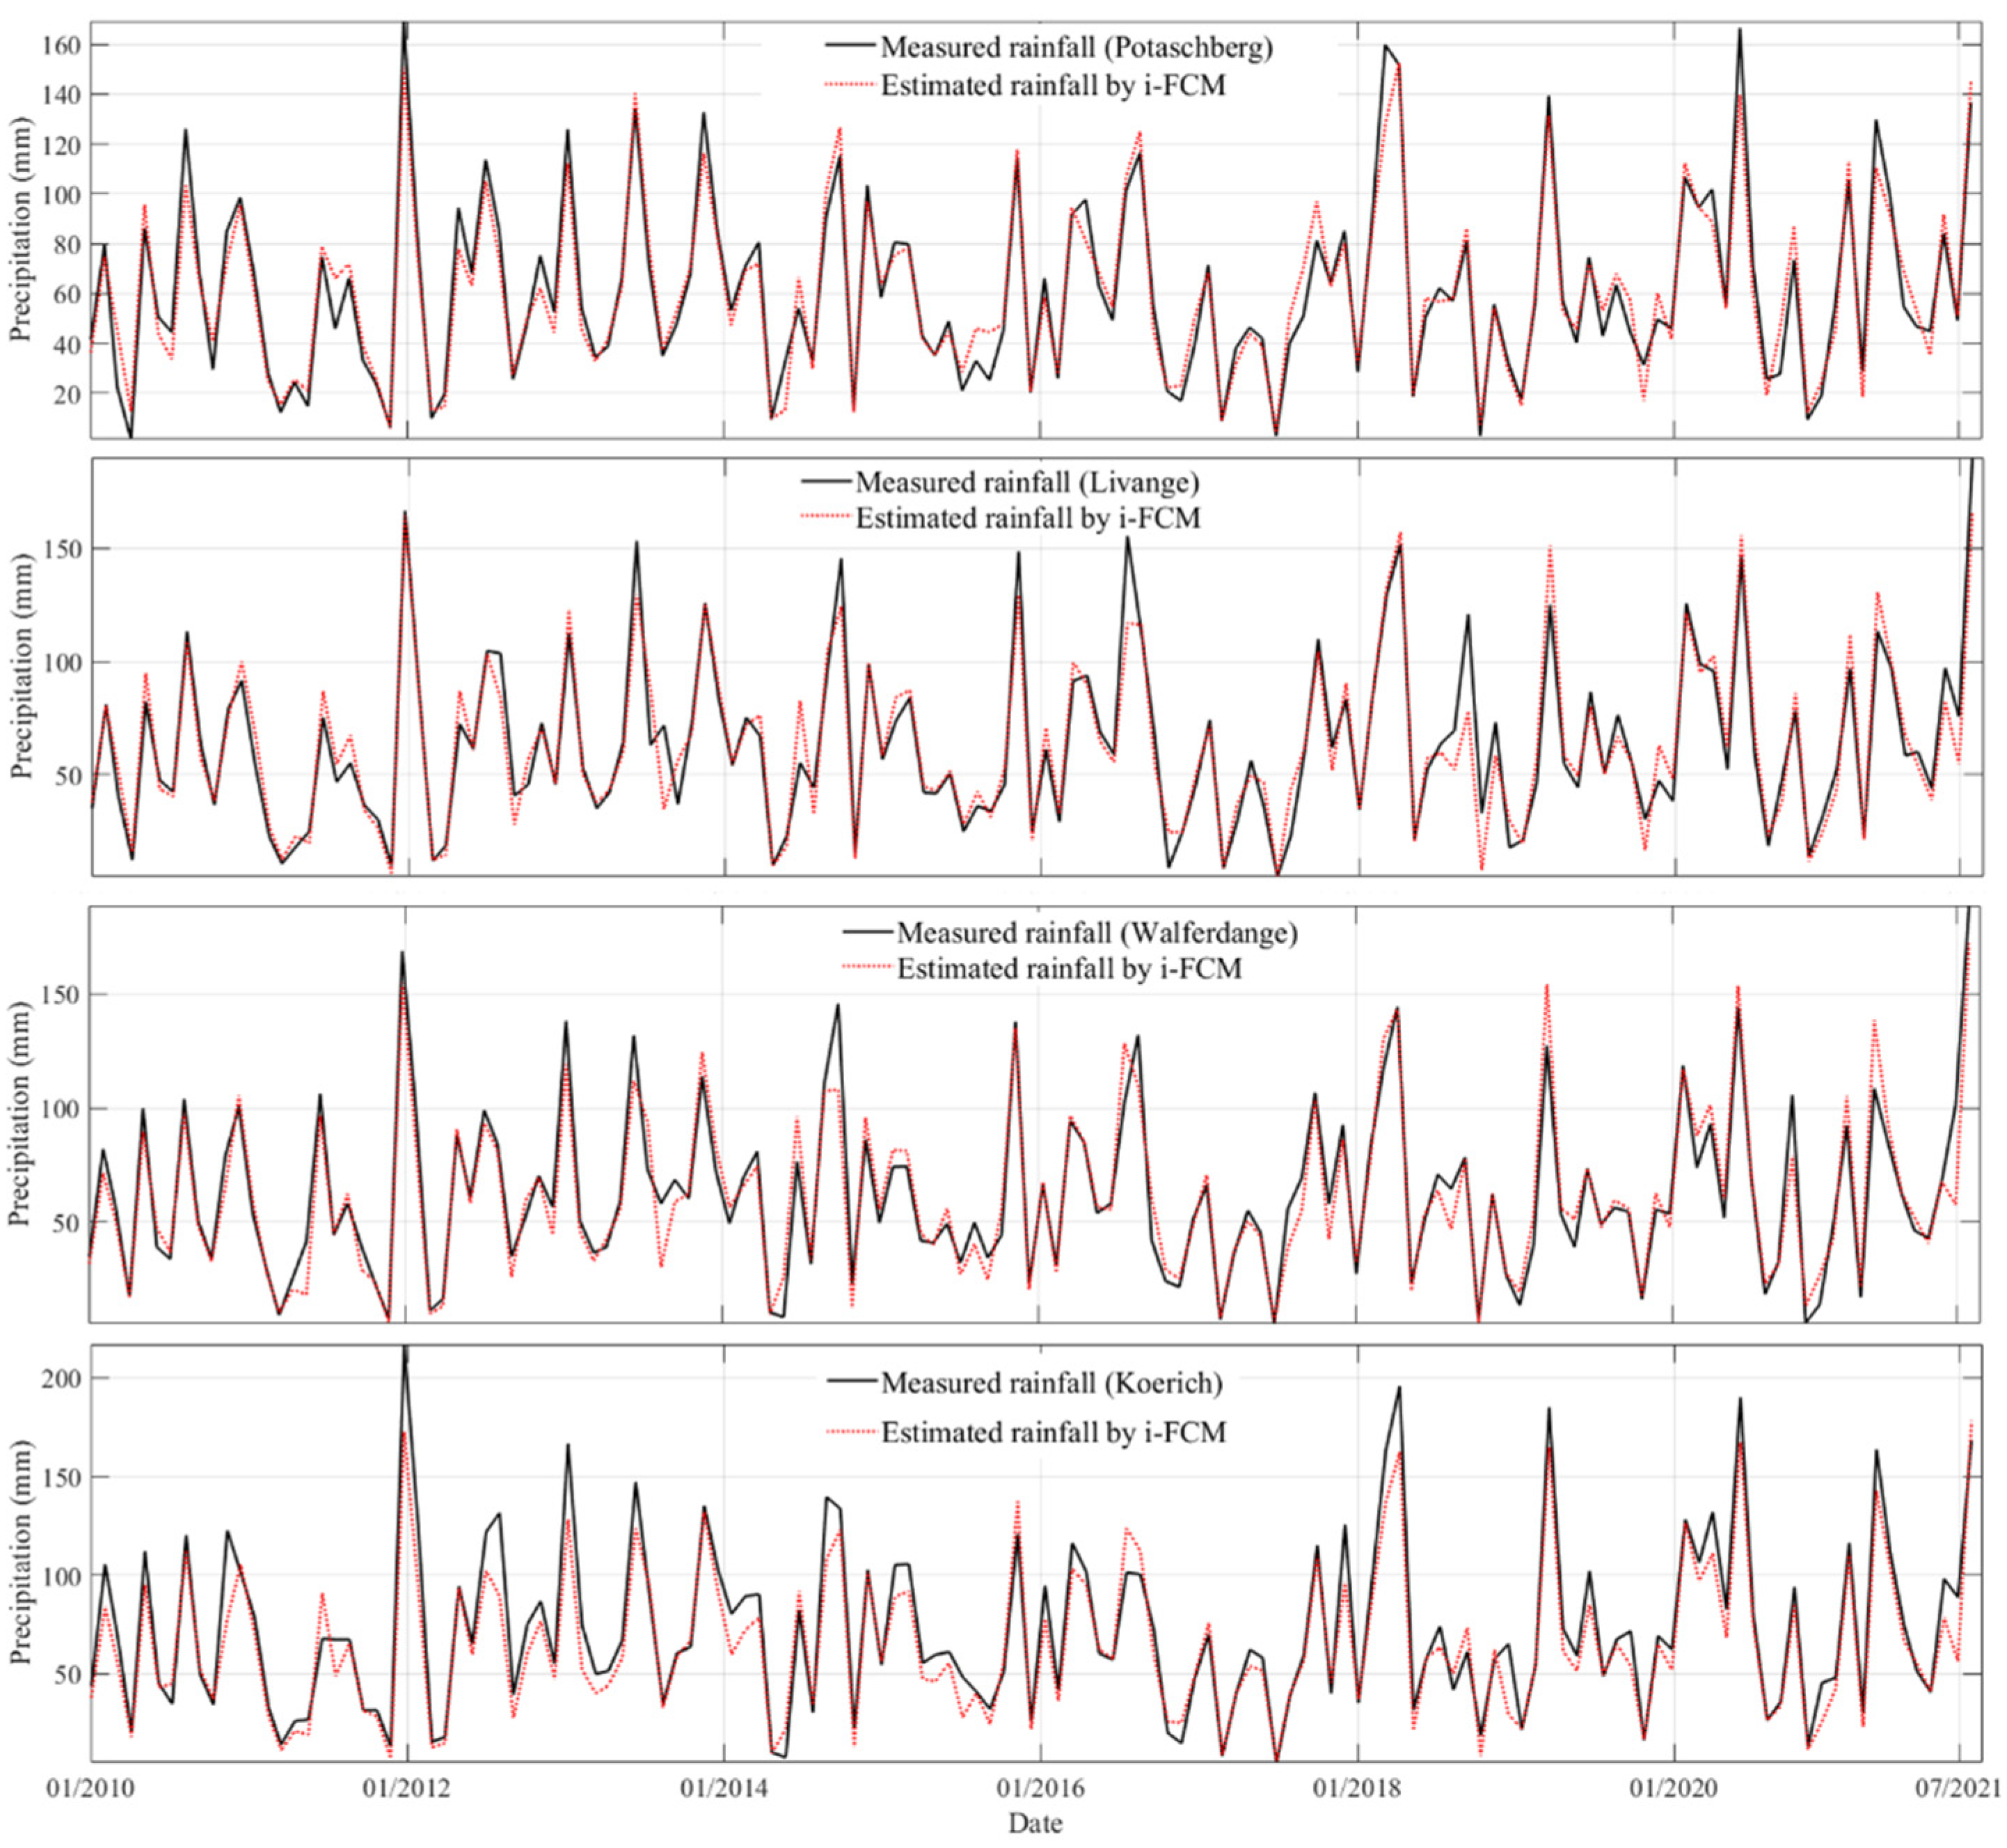
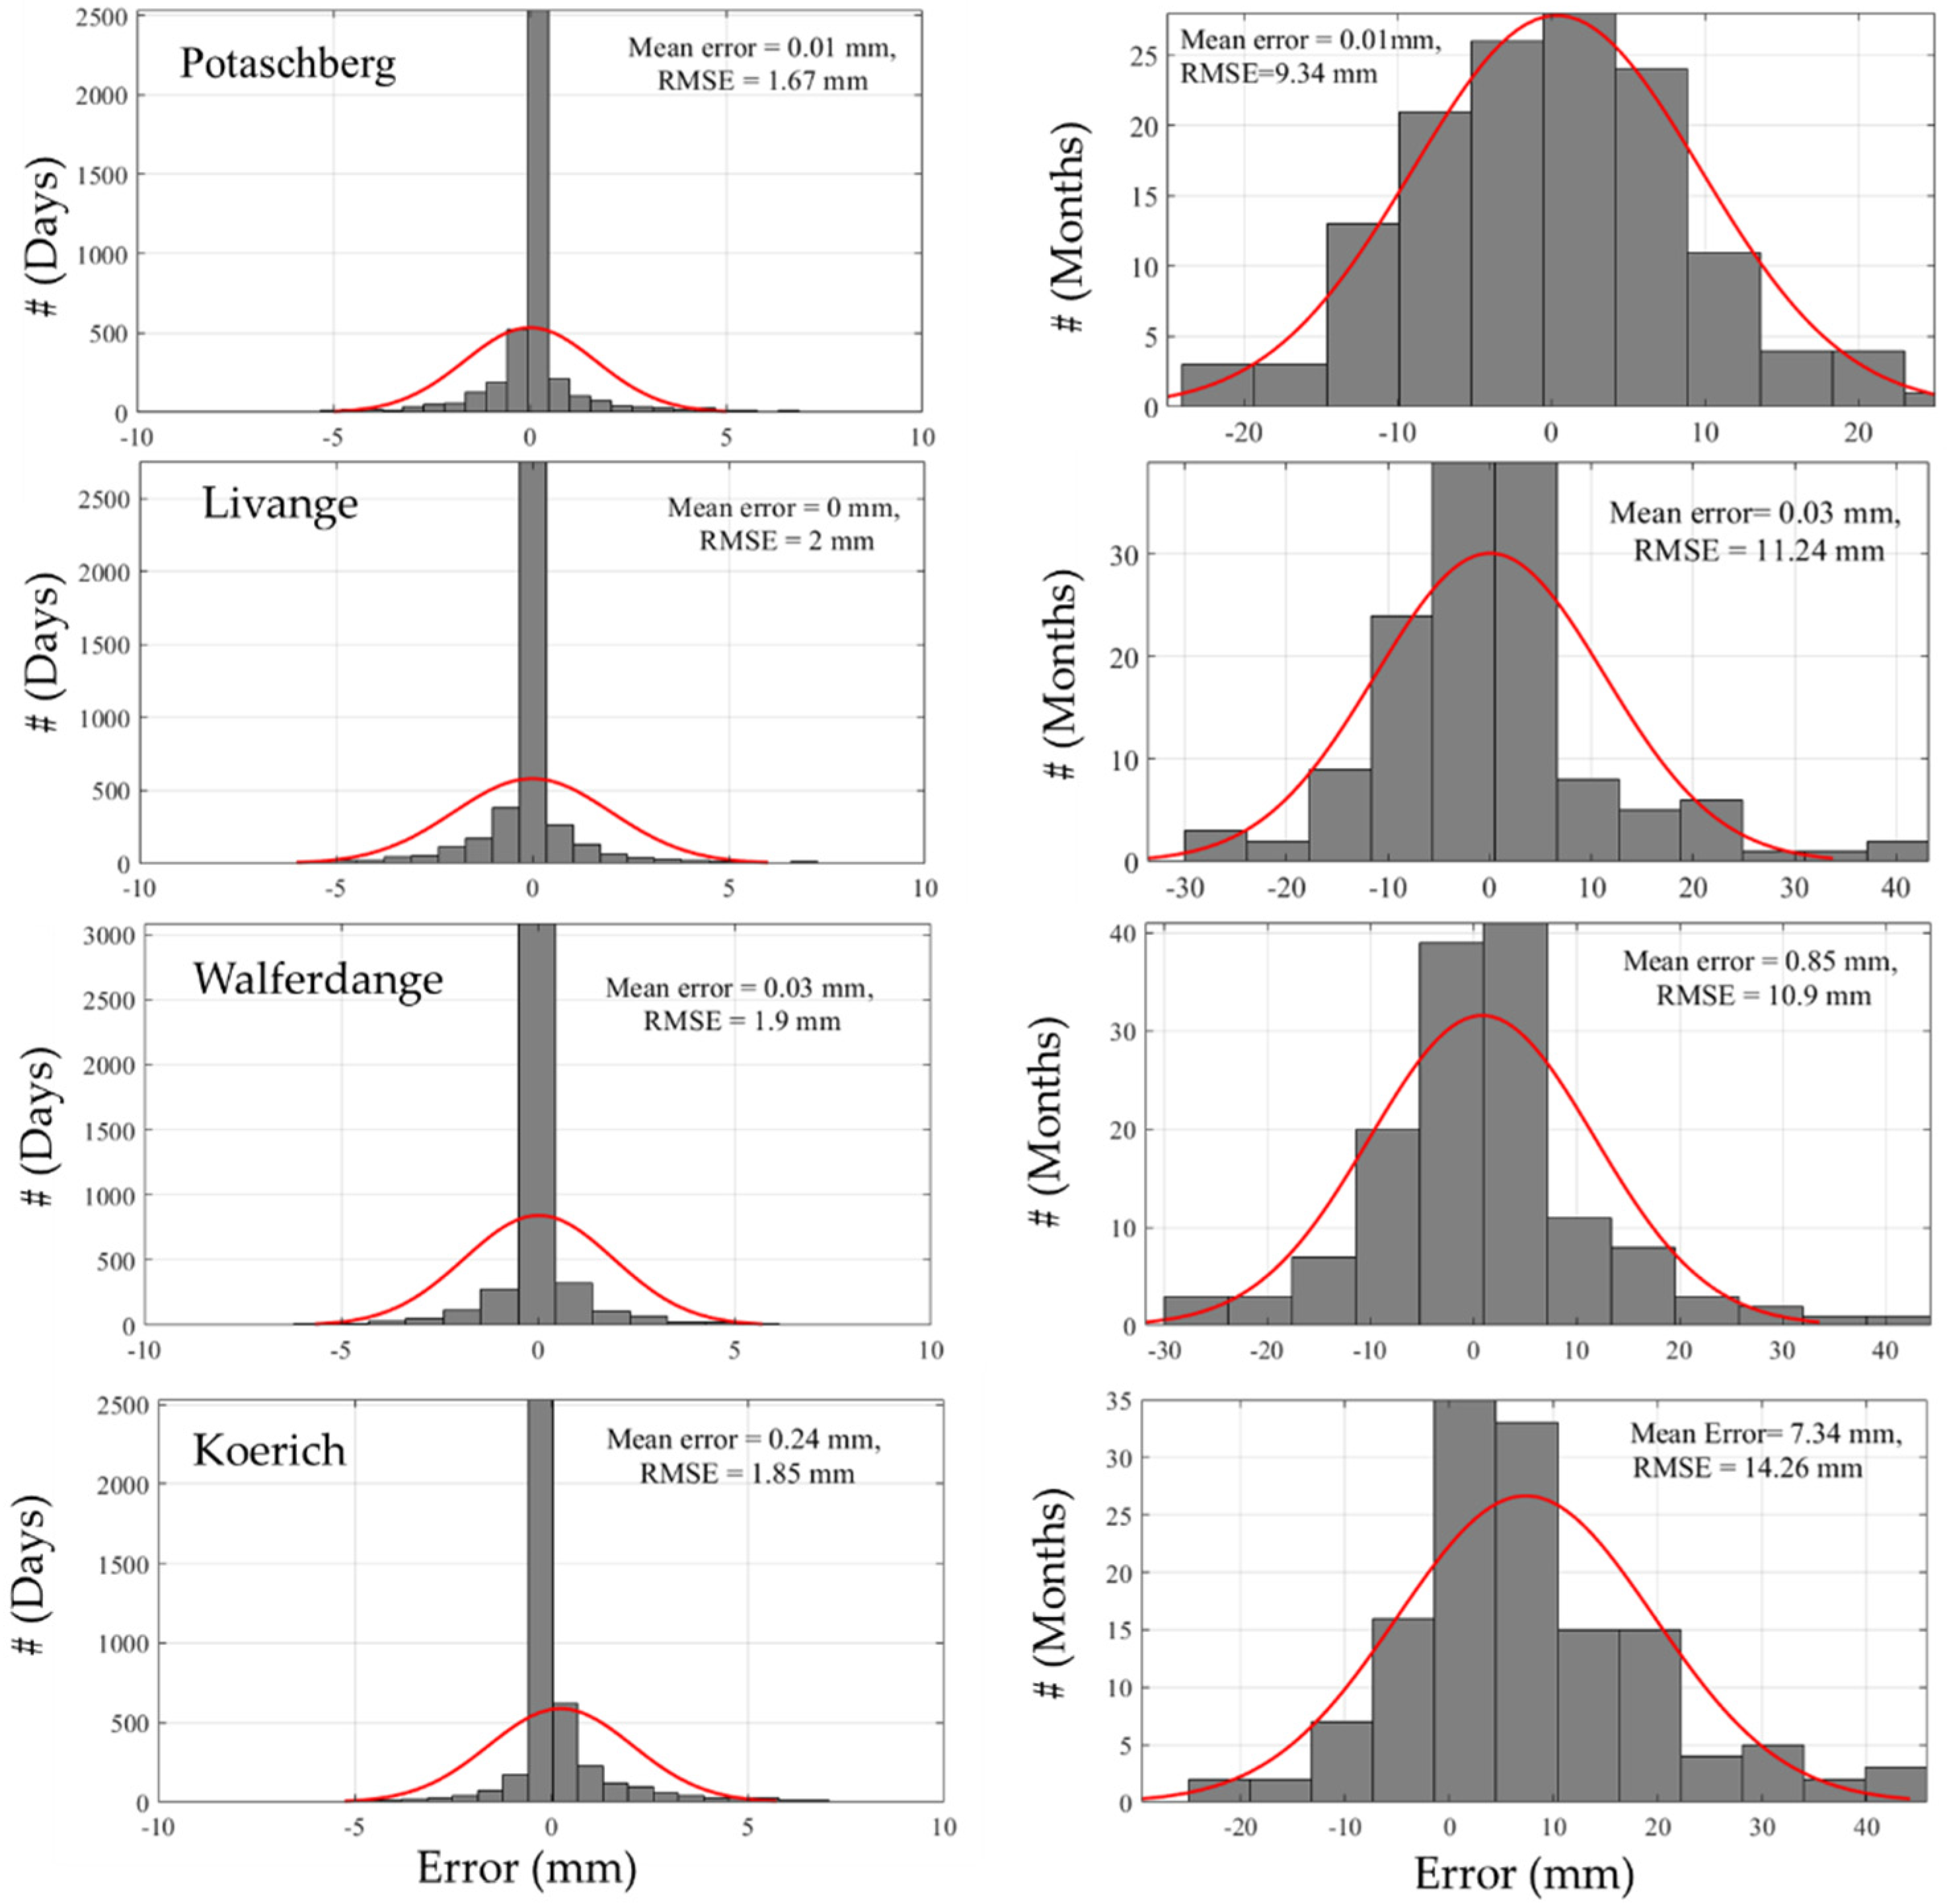
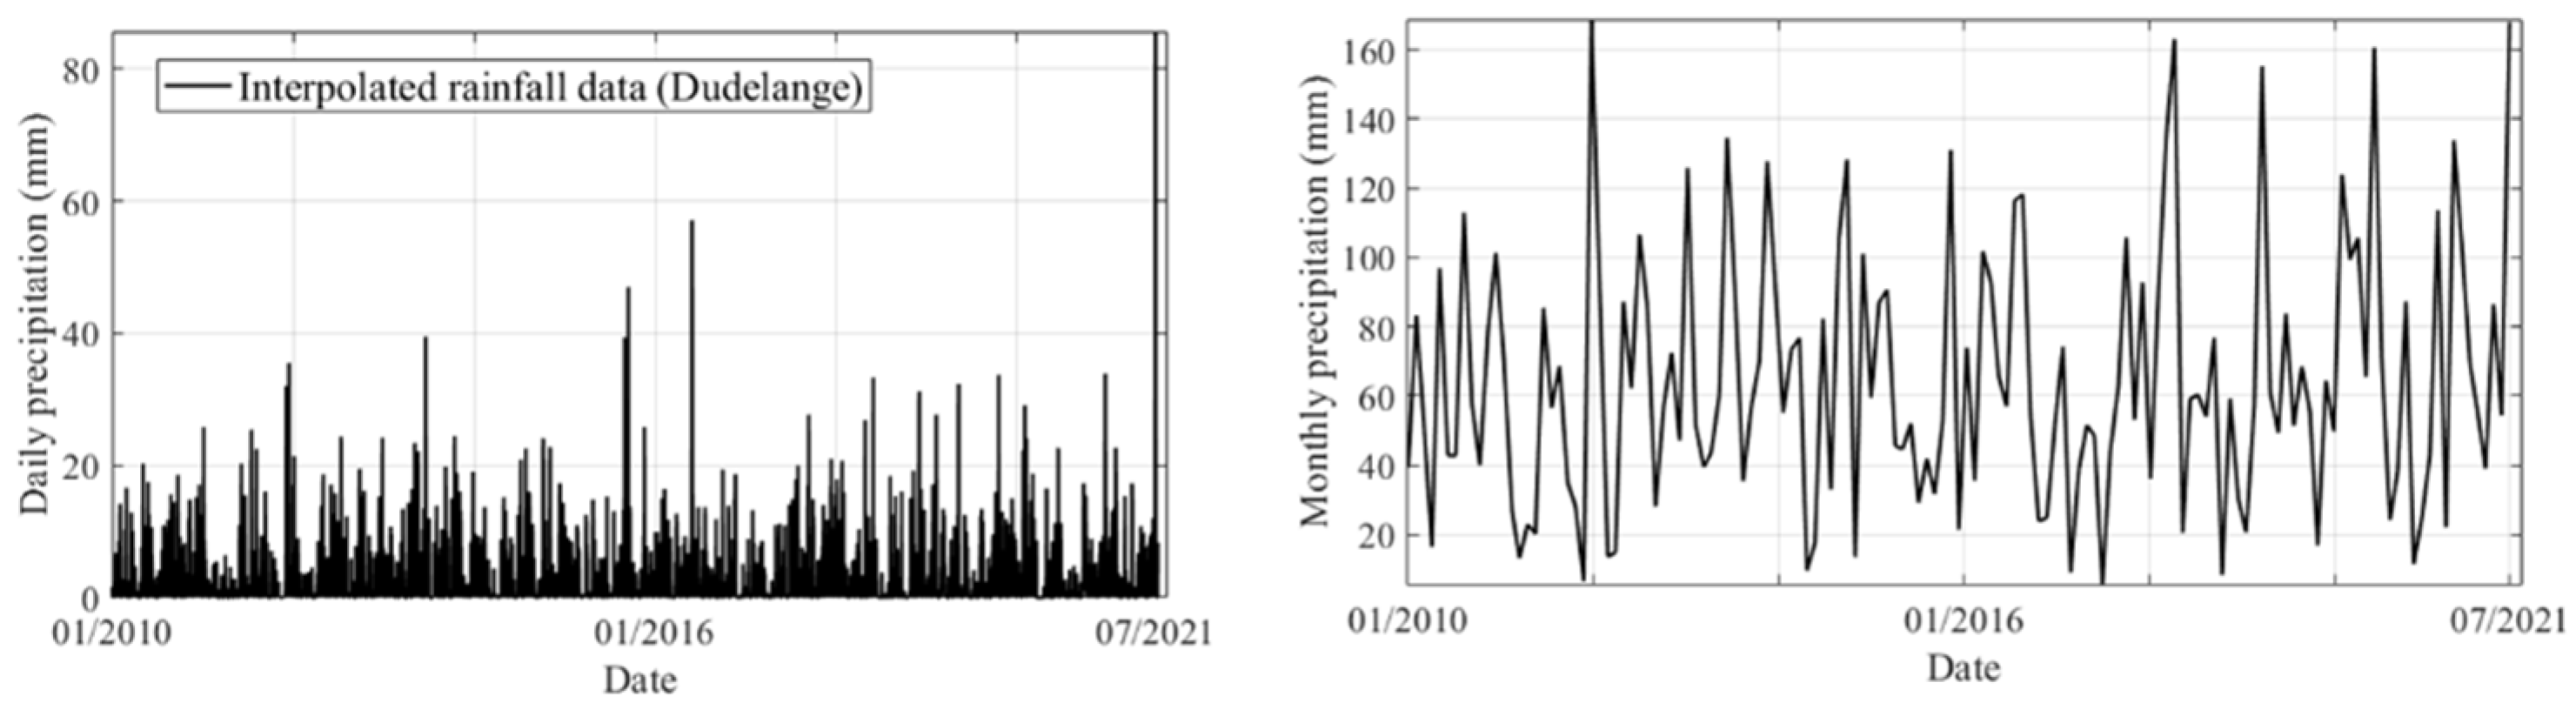
3.1. i-FCM Spatial Interpolation for Precipitation
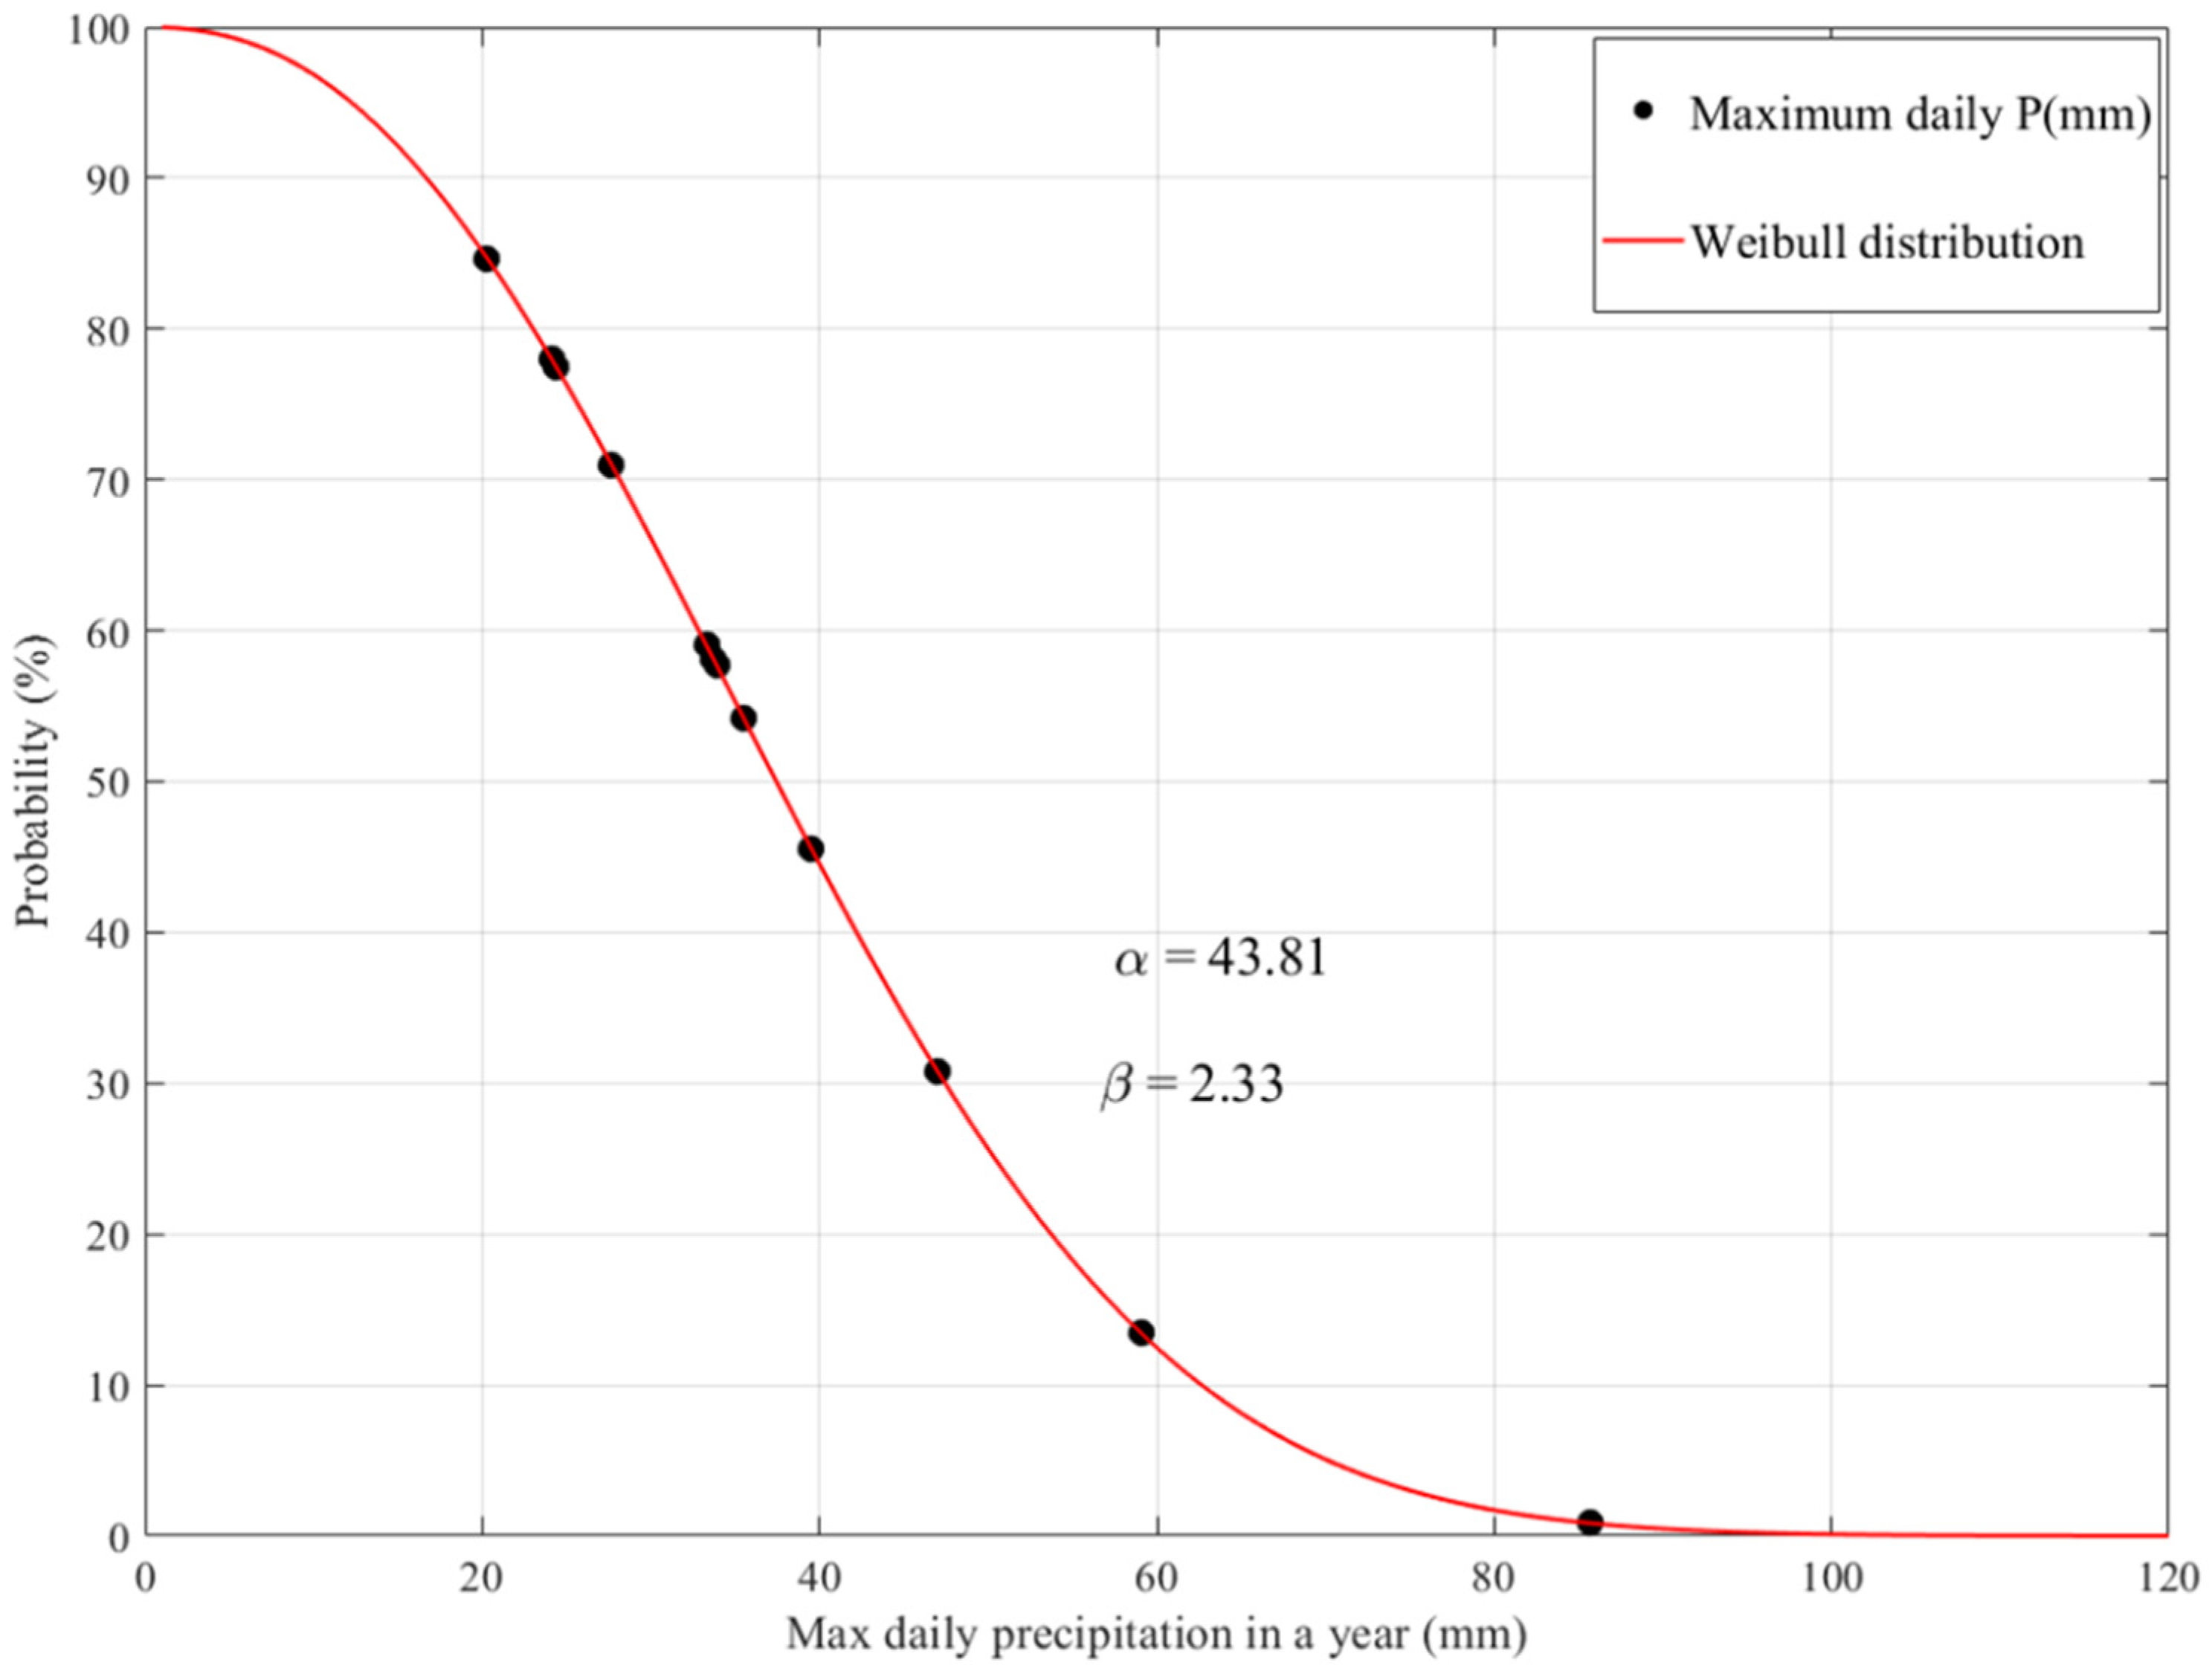
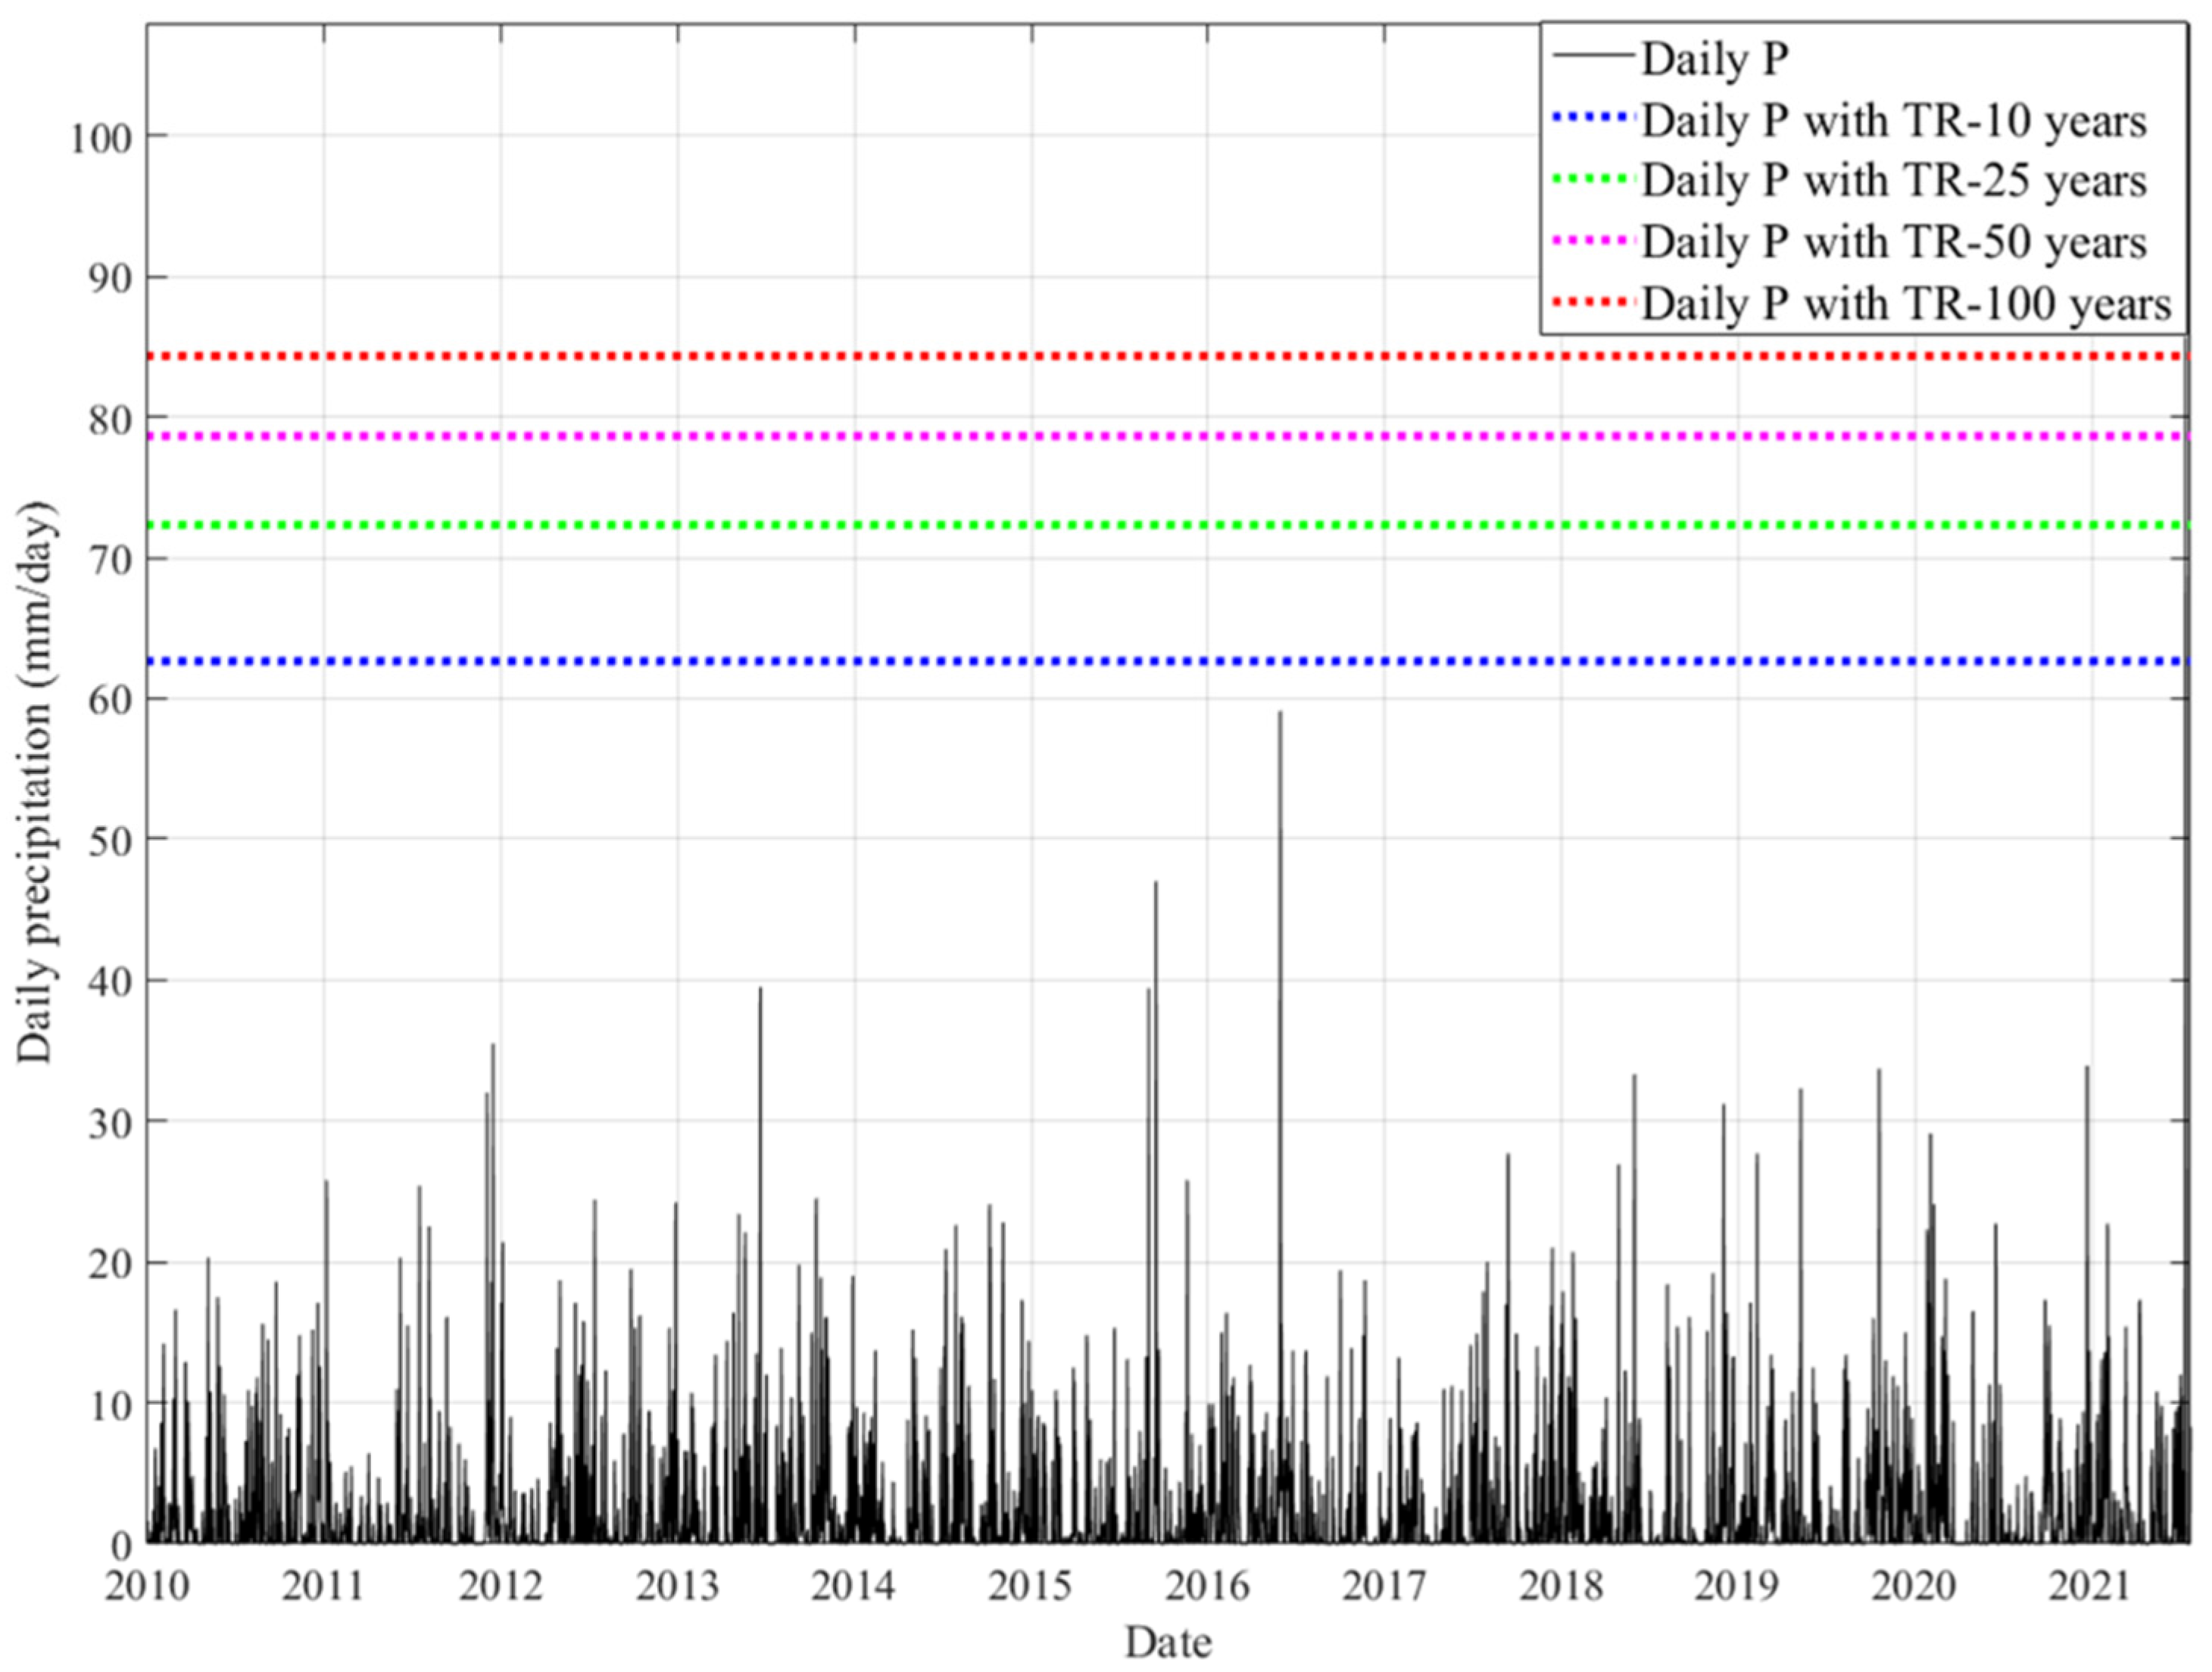
3.2. Estimation of Maximum Daily Rainfall Return Periods Using Two-Parameter Weibull Distribution
3.3. Generating Flood Hazards Maps Using LISFLOOD FP Model
4. Conclusions
Author Contributions
Funding
Data Availability Statement
Conflicts of Interest
References
- IPCC. Summary for policymakers. In Climate Change 2007: The Physical Science Basis. Contribution of Working Group I to the Fourth Assessment Report of the Intergovernmental Panel on Climate Change; Solomon, S., Qin, D., Manning, M., Chen, Z., Marquis, M., Averyt, K.B., Tignor, M., Miller, H.L., Eds.; Cambridge University Press: Cambridge, UK, 2007. [Google Scholar]
- Zare, M.; Koch, M. An Analysis of MLR and NLP for Use in River Flood Routing and Comparison with the Muskingum Method. In Proceedings of the 11th International Conference on Hydroscience & Engineering (ICHE), Hamburg, Germany, 29 September–2 October 2014; pp. 505–513. [Google Scholar]
- Courty, L.G.; Rico-Ramirez, M.Á.; Pedrozo-Acuña, A. The Significance of the Spatial Variability of Rainfall on the Numerical Simulation of Urban Floods. Water 2008, 10, 207. [Google Scholar] [CrossRef] [Scilit]
- Crochet, P.; Jóhannesson, T.; Jónsson, T.; Sigurðsson, O.; Björnsson, H.; Pálsson, F.; Barstad, I. Estimating the Spatial Distribution of Precipitation in Iceland Using a Linear Model of Orographic Precipitation. J. Hydrometeorol. 2007, 8, 1285–1306. [Google Scholar] [CrossRef] [Scilit]
- Hu, Q.; Li, Z.; Wang, L.; Huang, Y.; Wang, Y.; Li, L. Rainfall Spatial Estimations: A Review from Spatial Interpolation to Multi-Source Data Merging. Water 2019, 11, 579. [Google Scholar] [CrossRef] [Scilit]
- Drogue, G.; Ben Khediri, W. Catchment model regionalization approach based on spatial proximity: Does a neighbor catchment-based rainfall input strengthen the method? J. Hydrol. Reg. Stud. 2016, 8, 26–42. [Google Scholar] [CrossRef] [Scilit]
- Zadeh, L.A.; Aliev, R.A. Fuzzy Logic Theory and Applications, Part I and Part II; World Scientific Publishing Co.: Singapore, 2018. [Google Scholar]
- Çakıt, E.; Karwowski, W. Fuzzy Inference Modeling with the Help of Fuzzy Clustering for Predicting the Occurrence of Adverse Events in an Active Theater of War. Appl. Artif. Intell. 2015, 29, 945–961. [Google Scholar] [CrossRef] [Scilit]
- Bezdek, J.C.; Ehrlich, R.; Full, W. FCM: The fuzzy c-means clustering algorithm. Comput. Geosci. 1984, 10, 191–203. [Google Scholar] [CrossRef] [Scilit]
- Jafari, M.M.; Ojaghlou, H.; Zare, M.; Schumann, G.J. Application of a Novel Hybrid Wavelet-ANFIS/Fuzzy C-Means Clustering Model to Predict Groundwater Fluctuations. Atmosphere 2021, 12, 9. [Google Scholar] [CrossRef] [Scilit]
- Ayvaz, M.T.; Karahan, H.; Aral, M.M. Aquifer parameter and zone structure estimation using kernel-based fuzzy c-means clustering and genetic algorithm. J. Hydrol. 2007, 343, 240–253. [Google Scholar] [CrossRef] [Scilit]
- Zare, M.; Koch, M. Groundwater level fluctuations simulation and prediction by ANFIS- and hybrid Wavelet-ANFIS/Fuzzy C-Means (FCM) clustering models: Application to the Miandarband plain. J. Hydro-Environ. Res. 2018, 18, 63–76. [Google Scholar] [CrossRef] [Scilit]
- Pal, N.R.; Bezdek, J.C. On cluster validity for the fuzzy c-means model. IEEE Trans. Fuzzy Syst. 1995, 3, 370–379. [Google Scholar] [CrossRef] [Scilit]
- Hirsch, R.M. Probability plotting position formulas for flood records with historical information. J. Hydrol. 1987, 96, 185–199. [Google Scholar] [CrossRef] [Scilit]
- Chow, V.T.; Maidment, D.R.; Mays, L.W. Applied Hydrology; McGraw-Hill: New York, NY, USA, 1988. [Google Scholar]
- Cunnane, C. Unbiased plotting positions—A review. J. Hydrol. 1978, 37, 205–222. [Google Scholar] [CrossRef] [Scilit]
- Zare, M.; Koch, M. Hybrid signal processing/machine learning and PSO optimization model for conjunctive management of surface–groundwater resources. Neural Comput. Appl. 2021, 33, 13. [Google Scholar] [CrossRef] [Scilit]
- Pook, L.P. Approximation of Two Parameter Weibull Distribution by Rayleigh Distributions for Fatigue Testing; National Engineering Laboratory Report 694; East Kilbride: Glasgow, UK, 1984. [Google Scholar]
- Neal, J.; Schumann, G.; Bates, P. A subgrid channel model for simulating river hydraulics and floodplain inundation over large and data sparse areas. Water Resour. Res. 2012, 48, W11506. [Google Scholar] [CrossRef] [Scilit]
- Hawker, L.; Neal, J.; Tellman, B.; Liang, J.; Schumann, G.; Doyle, C.; Sullivan, J.A.; Savage, J.; Tshimanga, R. Comparing earth observation and inundation models to map flood hazards. Environ. Res. Lett. 2020, 15, 12. [Google Scholar] [CrossRef] [Scilit]
- Bates, P.; Trigg, M.; Neal, J.; Dabrowa, A. LISFLOOD-FP User Manual, Code Release 5.9.6; University of Bristol: Bristol, UK, 2013. [Google Scholar]
- Ramsbottom, D.; Floyd, P.; Penning-Rowsell, E. Flood Risks to People Phase 1, R&D Technical Report FD2317; DEFRA: London, UK, 2003.
- Beck, J.V.; Arnold, K.J. Parameter Estimation in Engineering and Science; John Wiley & Sons: Hoboken, NJ, USA, 1977; p. 522. [Google Scholar]


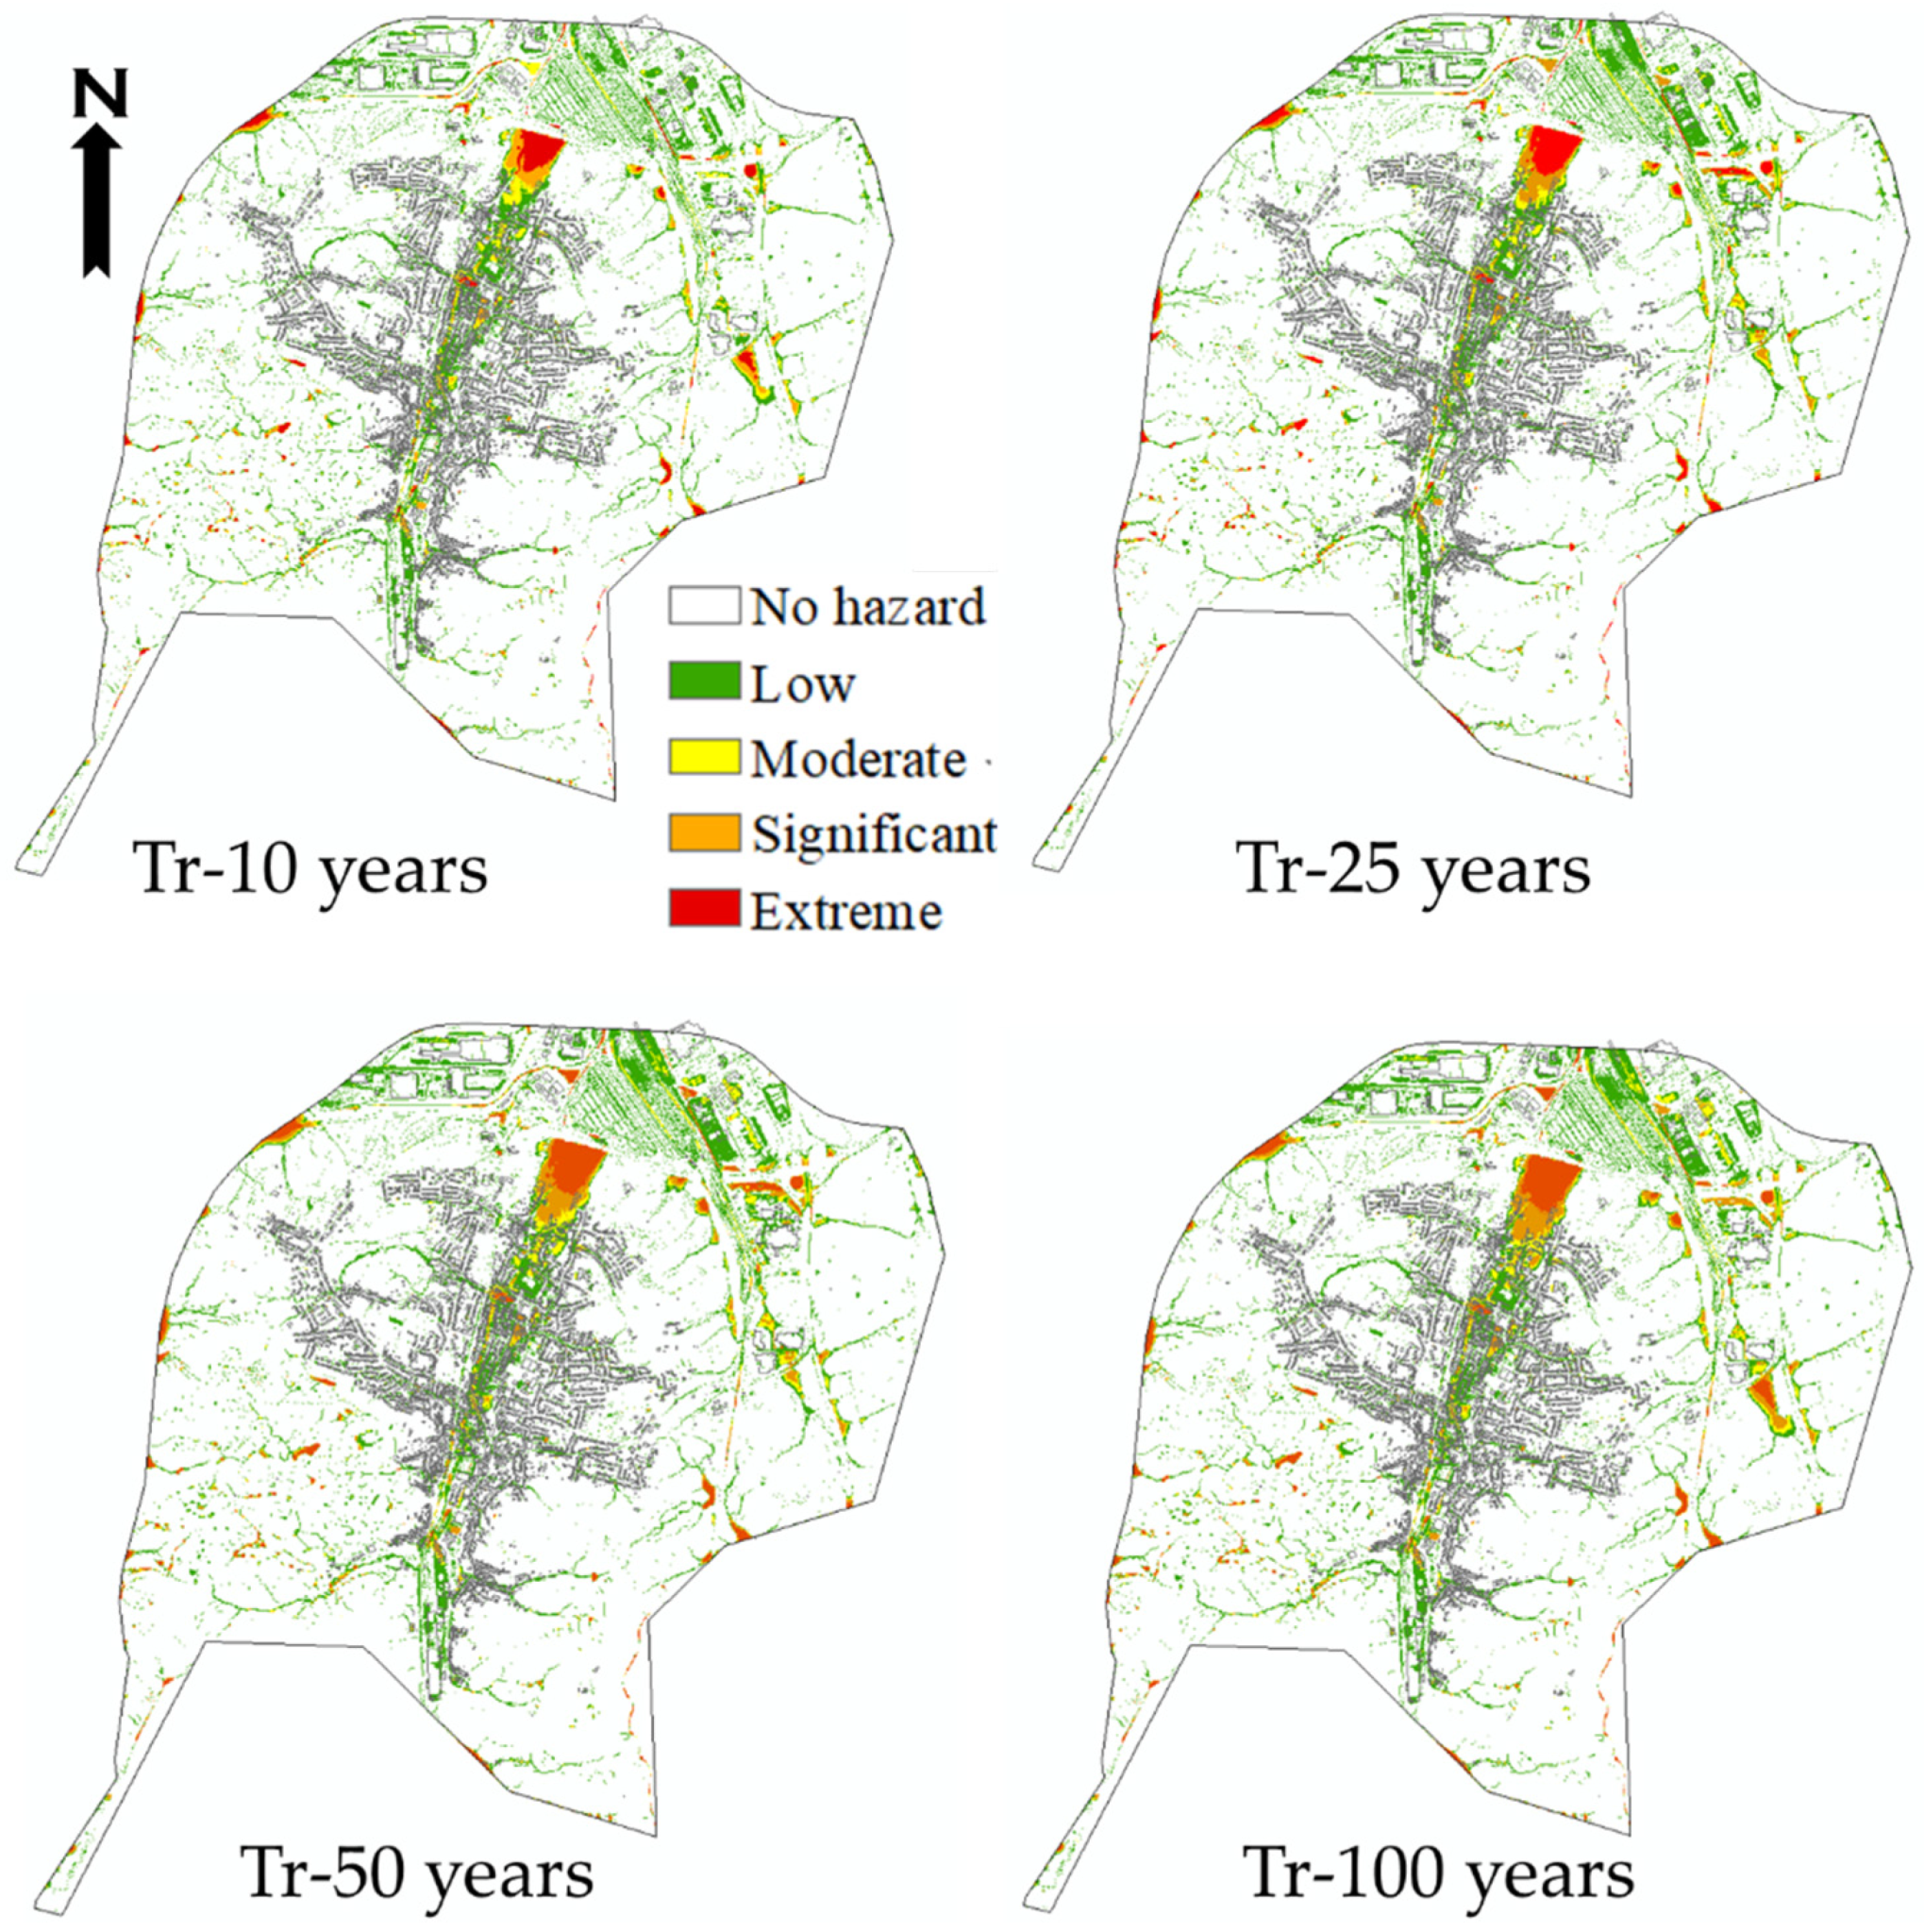

| Flood Hazard Rating | Degree of Flood Hazard | Description |
|---|---|---|
| 0 | No hazard | - |
| <0.75 | Low | Caution; Very low danger |
| 0.75–1.25 | Moderate | Danger for some |
| 1.25–2.5 | Significant | Danger for most |
| >2.5 | Extreme | Danger for all |
| Hazard Rating | Tr-10 | Tr-25 | Tr-50 | Tr-100 |
|---|---|---|---|---|
| 0.75–1.25 | 30.20 | 32.91 | 35.54 | 33.16 |
| 1.25–2.5 | 23.99 | 29.80 | 29.27 | 34.17 |
| >2.5 | 19.44 | 24.42 | 27.90 | 30.36 |
| Sum (ha) | 73.63 | 87.13 | 92.71 | 97.69 |
Publisher’s Note: MDPI stays neutral with regard to jurisdictional claims in published maps and institutional affiliations. |
© 2021 by the authors. Licensee MDPI, Basel, Switzerland. This article is an open access article distributed under the terms and conditions of the Creative Commons Attribution (CC BY) license (https://creativecommons.org/licenses/by/4.0/).
Share and Cite
Zare, M.; Schumann, G.J.-P.; Teferle, F.N.; Mansorian, R. Generating Flood Hazard Maps Based on an Innovative Spatial Interpolation Methodology for Precipitation. Atmosphere 2021, 12, 1336. https://doi.org/10.3390/atmos12101336
Zare M, Schumann GJ-P, Teferle FN, Mansorian R. Generating Flood Hazard Maps Based on an Innovative Spatial Interpolation Methodology for Precipitation. Atmosphere. 2021; 12(10):1336. https://doi.org/10.3390/atmos12101336
Chicago/Turabian StyleZare, Mohammad, Guy J.-P. Schumann, Felix Norman Teferle, and Ruja Mansorian. 2021. "Generating Flood Hazard Maps Based on an Innovative Spatial Interpolation Methodology for Precipitation" Atmosphere 12, no. 10: 1336. https://doi.org/10.3390/atmos12101336
APA StyleZare, M., Schumann, G. J.-P., Teferle, F. N., & Mansorian, R. (2021). Generating Flood Hazard Maps Based on an Innovative Spatial Interpolation Methodology for Precipitation. Atmosphere, 12(10), 1336. https://doi.org/10.3390/atmos12101336