Article

Spatiotemporal Change of Air-Quality Patterns in Hubei Province—A Pre- to Post-COVID-19 Analysis Using Path Analysis and Regression

1
Department of Computer Science, Huanggang Normal University, Huangzhou 438000, China
2
Geography Section, School of Humanities, Universiti Sains Malaysia, Penang 11800, Malaysia
3
Department of Computer Engineering, BUITEMS, Quetta 87300, Pakistan
4
Faculty of Information & Communication Technology, BUITEMS, Quetta 87300, Pakistan
5
School of Geography, Nanjing Normal University, Nanjing 210023, China
6
Key Laboratory of Tropical Biological Resources of Ministry of Education, School of Life and Pharmaceutical Sciences, Hainan University, Haikou 570228, China
7
College of Electrical Engineering, Sichuan University, Chengdu 610000, China
*
Author to whom correspondence should be addressed.
Atmosphere 2021, 12(10), 1338; https://doi.org/10.3390/atmos12101338
Submission received: 3 September 2021 / Revised: 3 October 2021 / Accepted: 7 October 2021 / Published: 13 October 2021
(This article belongs to the Section Air Quality)

Abstract

:
Mitigation measures and control strategies relating to the novel coronavirus disease 2019 (COVID-19) have been widely applied in many countries to reduce the transmission of this pandemic disease. China was the first country to implement a strong lockdown policy to control COVID-19 when countries worldwide were struggling to manage COVID-19 cases. However, lockdown causes numerous changes to air-quality patterns due to the low amount of traffic and the decreased human mobility it results in. To study the impact of the strict control measures of the new COVID-19 epidemic on the air quality of Hubei in early 2020, the air-quality monitoring data of Hubei’s four cities, namely Huangshi, Yichang, Jingzhou, and Wuhan, from 2019 to 2021, specifically 1 January to 30 August, was examined to analyze the characteristics of the temporal and spatial distribution. All air-quality pollutants decreased during the active-COVID-19 period, with a maximum decrease of 26% observed in PM 10 , followed by 23% of PM 2.5 , and a minimum decrease of 5% observed in O 3 . Changes in air pollutants from 2017 to 2021 were also compared, and a decrease in all pollutants through to 2020 was found. The air-quality index (AQI) recorded an increase of 2% post-COVID-19, which shows that air quality will worsen in future, but it decreased by 22% during the active-COVID-19 period. A path analysis model was developed to further understand the relationship between the AQI and air-quality patterns. This path analysis shows a strong correlation between the AQI and PM 10 and PM 2.5 , however its correlation with other air pollutants is weak. Regression analysis shows a similar pattern of there being a strong relationship between AQI and PM 10 ( r 2 = 0.97) and PM 2.5 ( r 2 = 0.93). Although the COVID-19 pandemic had numerous negative effects on human health and the global economy, it is likely that the reduction in air pollution and the significant improvement in ambient air quality due to lockdowns provided substantial short-term health benefits. The government must implement policies to control the environmental issues which are causing poor air quality in post-COVID-19.

1. Introduction

In January 2020, the novel coronavirus (COVID-19) pneumonia epidemic was first identified in Wuhan [1]. The Chinese Government and various government departments placed great importance on addressing it and quickly initiated prevention and control measures to prevent the spread of the virus. Epidemic control measures restricted human activities [2] and improved air quality overall, but the air quality in some cities or regions did not improve [3], and after the epidemic control measures were lifted and air quality returned to previous levels [4]. Thus, epidemic prevention and control provided contemporary society with a good opportunity to observe the relationship between human activities and air quality, to review past atmospheric environmental protection measures, and to better plan future atmospheric environmental protections.
Lockdown during COVID-19 brought different changes in air quality worldwide and different researchers highlighted those changes in their studies. Altuwayjiri et al. highlights the changes in chemical properties and oxidative potential PM2.5 during the lockdown period in Italy. Both PM2.5 and NO2 showed a reduction during lockdown period due to a decrease in primary emission from road traffic [5]. Elshorbany et al. used remote-sensing data to find reductions in the air pollutants during COVID-19 in USA and identified potential factors in the change of tropospheric ozone (O3) [6]. Menut et al. studied the change of the air-quality pattern in Western Europe and used the WRF-CHIMERE modelling strategy to highlight the major change in NO2 concentration while there were minor changes in PM2.5 concentrations during COVID-19 [7]. Clemente et al. shared the change in PM1 and PM10, and observed temporal variations in PM1 and PM10 concentrations were strongly affected by the frequency of Saharan dust events with a 35% decrease [8].
Zangari et al. have observed decreases in PM 2.5 (36%) and NO 2 (51%) concentrations shortly after the shutdown took place due to COVID-19 [9]. On 24 March 2020, India enforced stringent lockdown measures to manage COVID-19, and this resulted in a 17% decrease in ambient AQI and an increase in the ozone ( O 3 ) concentration [10]. This also reflects a positive correlation with an increase in COVID-19 cases due to poor air quality and indicates a correlation between COVID-19-vulnerable regions and air pollution selected spots, which suggests that air pollution may exacerbate the clinical manifestations of the disease. Bar et al. detected a reduced PM 2.5 across 50 countries post-COVID-19, with the highest decreases recorded in America and Europe [11]. Stratoulias et al. studied the air-quality impact post-COVID-19 in a medium-sized urban area in Thailand and found a 33.7% decrease in NO 2 concentration just three weeks after lockdown. Similar results were observed for other pollutants, namely PM 2.5 , particulate matter with aerodynamic diameters ≤10 μm ( PM 10 ), and O 3 , which decreased by 21.8%, 22.9%, and 12.5%, respectively [12].
The COVID-19 pandemic has had a positive environmental impact due to improved air quality. Therefore, the period of epidemic prevention and control is a good point in time for the further exploration of the main factors affecting urban air quality changes. [13]. In this study, we examine the AQI and the levels of six ambient air pollutants, namely NO 2 , O 3 , sulphur dioxide ( SO 2 ), carbon monoxide (CO), PM 10 , and PM 2.5 , before, during and after the 2020 COVID-19 lockdown in the four cities of Hubei province in China, namely Huangshi, Yichang, Jingzhou, and Wuhan. The period between January 2020 and August 2020 was selected because a strict lockdown was in place in all four of the cities. Additionally, the AQI and pollutant concentrations during the same period in the prior two years, namely 2017 to 2018, are assessed. The relationship between the AQI and each air pollutant ( PM 2.5 , PM 10 , SO 2 , NO 2 , CO, and O 3 ) in each city is investigated using a spatiotemporal change analysis. This exercise sought to improve understanding of changing air-quality patterns in each city pre-COVID-19, during active COVID-19, and post-COVID-19. Furthermore, correlation analyses between the six air pollutants and the AQI during the three periods are performed to ascertain the sources of air pollutants during and after lockdown. Regression models are developed to analyze the trends of air-quality patterns and their changes over time. This study is the first to assess the relationships between the concentrations of the six named pollutants and the AQI before, during and after Hubei’s COVID-19 lockdown.

2. Materials and Methods

2.1. Study Area Monitoring Stations

Hubei Province is located in the south of Central China, the middle reaches of the Yangtze River, and the north of Dongting Lake, hence the name Hubei, or “E” for short, and the provincial capital is Wuhan. Hubei lies between 29°05′ and 33°20′ north latitude and 108°21′ and 116°07′ east longitude. It is connected to Anhui to the east, Jiangxi and Hunan to the south, Chongqing to the west, Shaanxi to the northwest, and Henan to the north. Hubei is surrounded by mountains in the east, west, and north, and it has the Jiangshan Plain, which is known as the “land of fish and rice”, in the middle [14]. The geographical location of Hubei is excellent. Any other province in the country can be reached by crossing two provinces at the most. It is the only province in China where this can be done. For this study, the four cities of Huangshi, Yichang, Jingzhou, and Wuhan within the Hubei Province were selected because of the availability of more monitoring stations and the high number of COVID-19 cases recorded in these cities. Together, these four cities contain 29 air-quality monitoring stations. Huangshi has six, Jingzhou has five, Wuhan has eleven, and Yichang has seven. Figure 1 shows Hubei Province with the selected cities and dots marking the locations of these stations. Most of the monitoring stations are in urban areas because the main pollution exists in these developed areas with more traffic.

2.2. Air Pollutant Data

This paper primarily employs the daily average datasets of the air pollutants from the various stations. The mass concentration data used for the AQI and the ambient atmospheric pollutants ( PM 2.5 , PM 10 , SO 2 , NO 2 , CO, and O 3 ) were obtained from the weather post report on tianqihoubao.com. Each monitoring station’s ambient PM 2.5 , PM 10 , NO 2 , CO, SO 2 , and O 3 concentrations were recorded hourly and then, from these values, the provincial daily average and each city’s stations’ average were computed.
In order to meets the requirements of air quality under the new circumstances, in 2021 (Table 1 shows the standard values of AQI), China issued the new national ambient air-quality standard (GB 3095-2012) [15], which clarified the calculation method of AQI:
First calculate the individual Air quality index of certain pollutant ( I A Q I p ):
I A Q I p = I A Q I H I I A Q I L o B P H I B P L o ( C p B P L o ) + I A Q I L o
In the equation above, C p represent the mass concentration of pollutant p; B P H I is the higher threshold of pollutant concentration near C p corresponding to the specific IAQI (Individual Air Quality Index) regulated by government policy; B P L o is the lower threshold of pollutant concentration near C p regulated by the government; I A Q I H I is the corresponding IAQI to B P H I ; while I A Q I L o is the corresponding IAQI to B P L o .
Then take the largest number from all I A Q I p to calculate the AQI:
AQI = max { I A Q I 1 , I A Q I 2 , I A Q I 3 , , , , I A Q I n }

2.3. Regression and Path Analysis Model

Multiple linear regression reflects the direct effect between the independent variable and the dependent variable, but the relationship between the variables is often intricate. Some are unidirectional influence relationships, and some are mutual influence relationships. It is often difficult for analysts to use only one regression model. In this study, a regression analysis is conducted and the multiple regression advanced model, i.e., the path analysis model, is used to elaborate on the relationship between the pollutants. The path analysis model was pioneered by the geneticist Wright [16] for use in color genetic research on two pigs in theme parks and environments in 1983, and it was later widely used in sociology, biology, and geography, as well as other fields. The path analysis model is a multiple regression model. Typically, path models consist of independent and dependent variables that are depicted graphically as boxes or rectangles. The roles of the different parts of the simulation model boxes show direct and indirect effects to describe the relationship between variables more comprehensively. In the regression model, all variables in the path model are random variables, and all variables can be correlated, which is more in line with the reality of social economics. If it comprises a one-way arrow, it is only a regression model. However, if a dynamic arrow materializes on the box and a circular path appears, it is an acyclic model. The path analysis model is a relationship model that discloses complex relationships, such as non-existent realistic relationships, gradual loops, and self-feedback. The arrow to the other component represents a direct path.

2.4. Statistical Analysis

This study mainly focuses on analyzing the impact of COVID-19 on air pollution. Therefore, the levels of the six air pollutants were examined during the following three consecutive periods: pre-COVID-19 (from 1 January to 30 August 2019), during active COVID-19 (from 1 January to 30 August 2020) and post-COVID-19 (from 1 January to 30 August 2021). The year 2019 was selected as the pre-COVID-19 period to compare all four seasons rather than only winter, since air pollutant patterns change with the seasons [17]. For further assessment, the results from 2017 (AQ-2017) and 2018 (AQ-2018) were compared to better evaluate the impact of the changes on air pollutant patterns. Statistical analysis of the data was performed using SPSS software (version 25; IBM Company). For comparison of means we used the least significant difference (LSD) statistical method. If the value at a particular level of statistical probability (e.g., p ≤ 0.05 means with 95% accuracy) when exceeded by the difference between two means for a particular characteristic, then the two means are said to be distinct for that characteristic at that or lesser levels of probability. LSD calculates the minimum significant value between two means as if tested on these two means (instead of grouping them all). This allows you to directly compare two means in two separate groups. Any difference greater than LSD is considered a significant result. When the F ratio recommends rejecting the null hypothesis H0, that is, when the difference between population means is large, use the least significant difference (LSD) test in the context of analysis of variance.
Least significant difference (LSD) (5%) = S.E. xt value by using error degrees of freedom, where S.E. = 2 M S E r .

3. Results and Discussion

This study is being conducted to highlight the changes in the patterns of the AQI and air pollutants post-COVID-19.

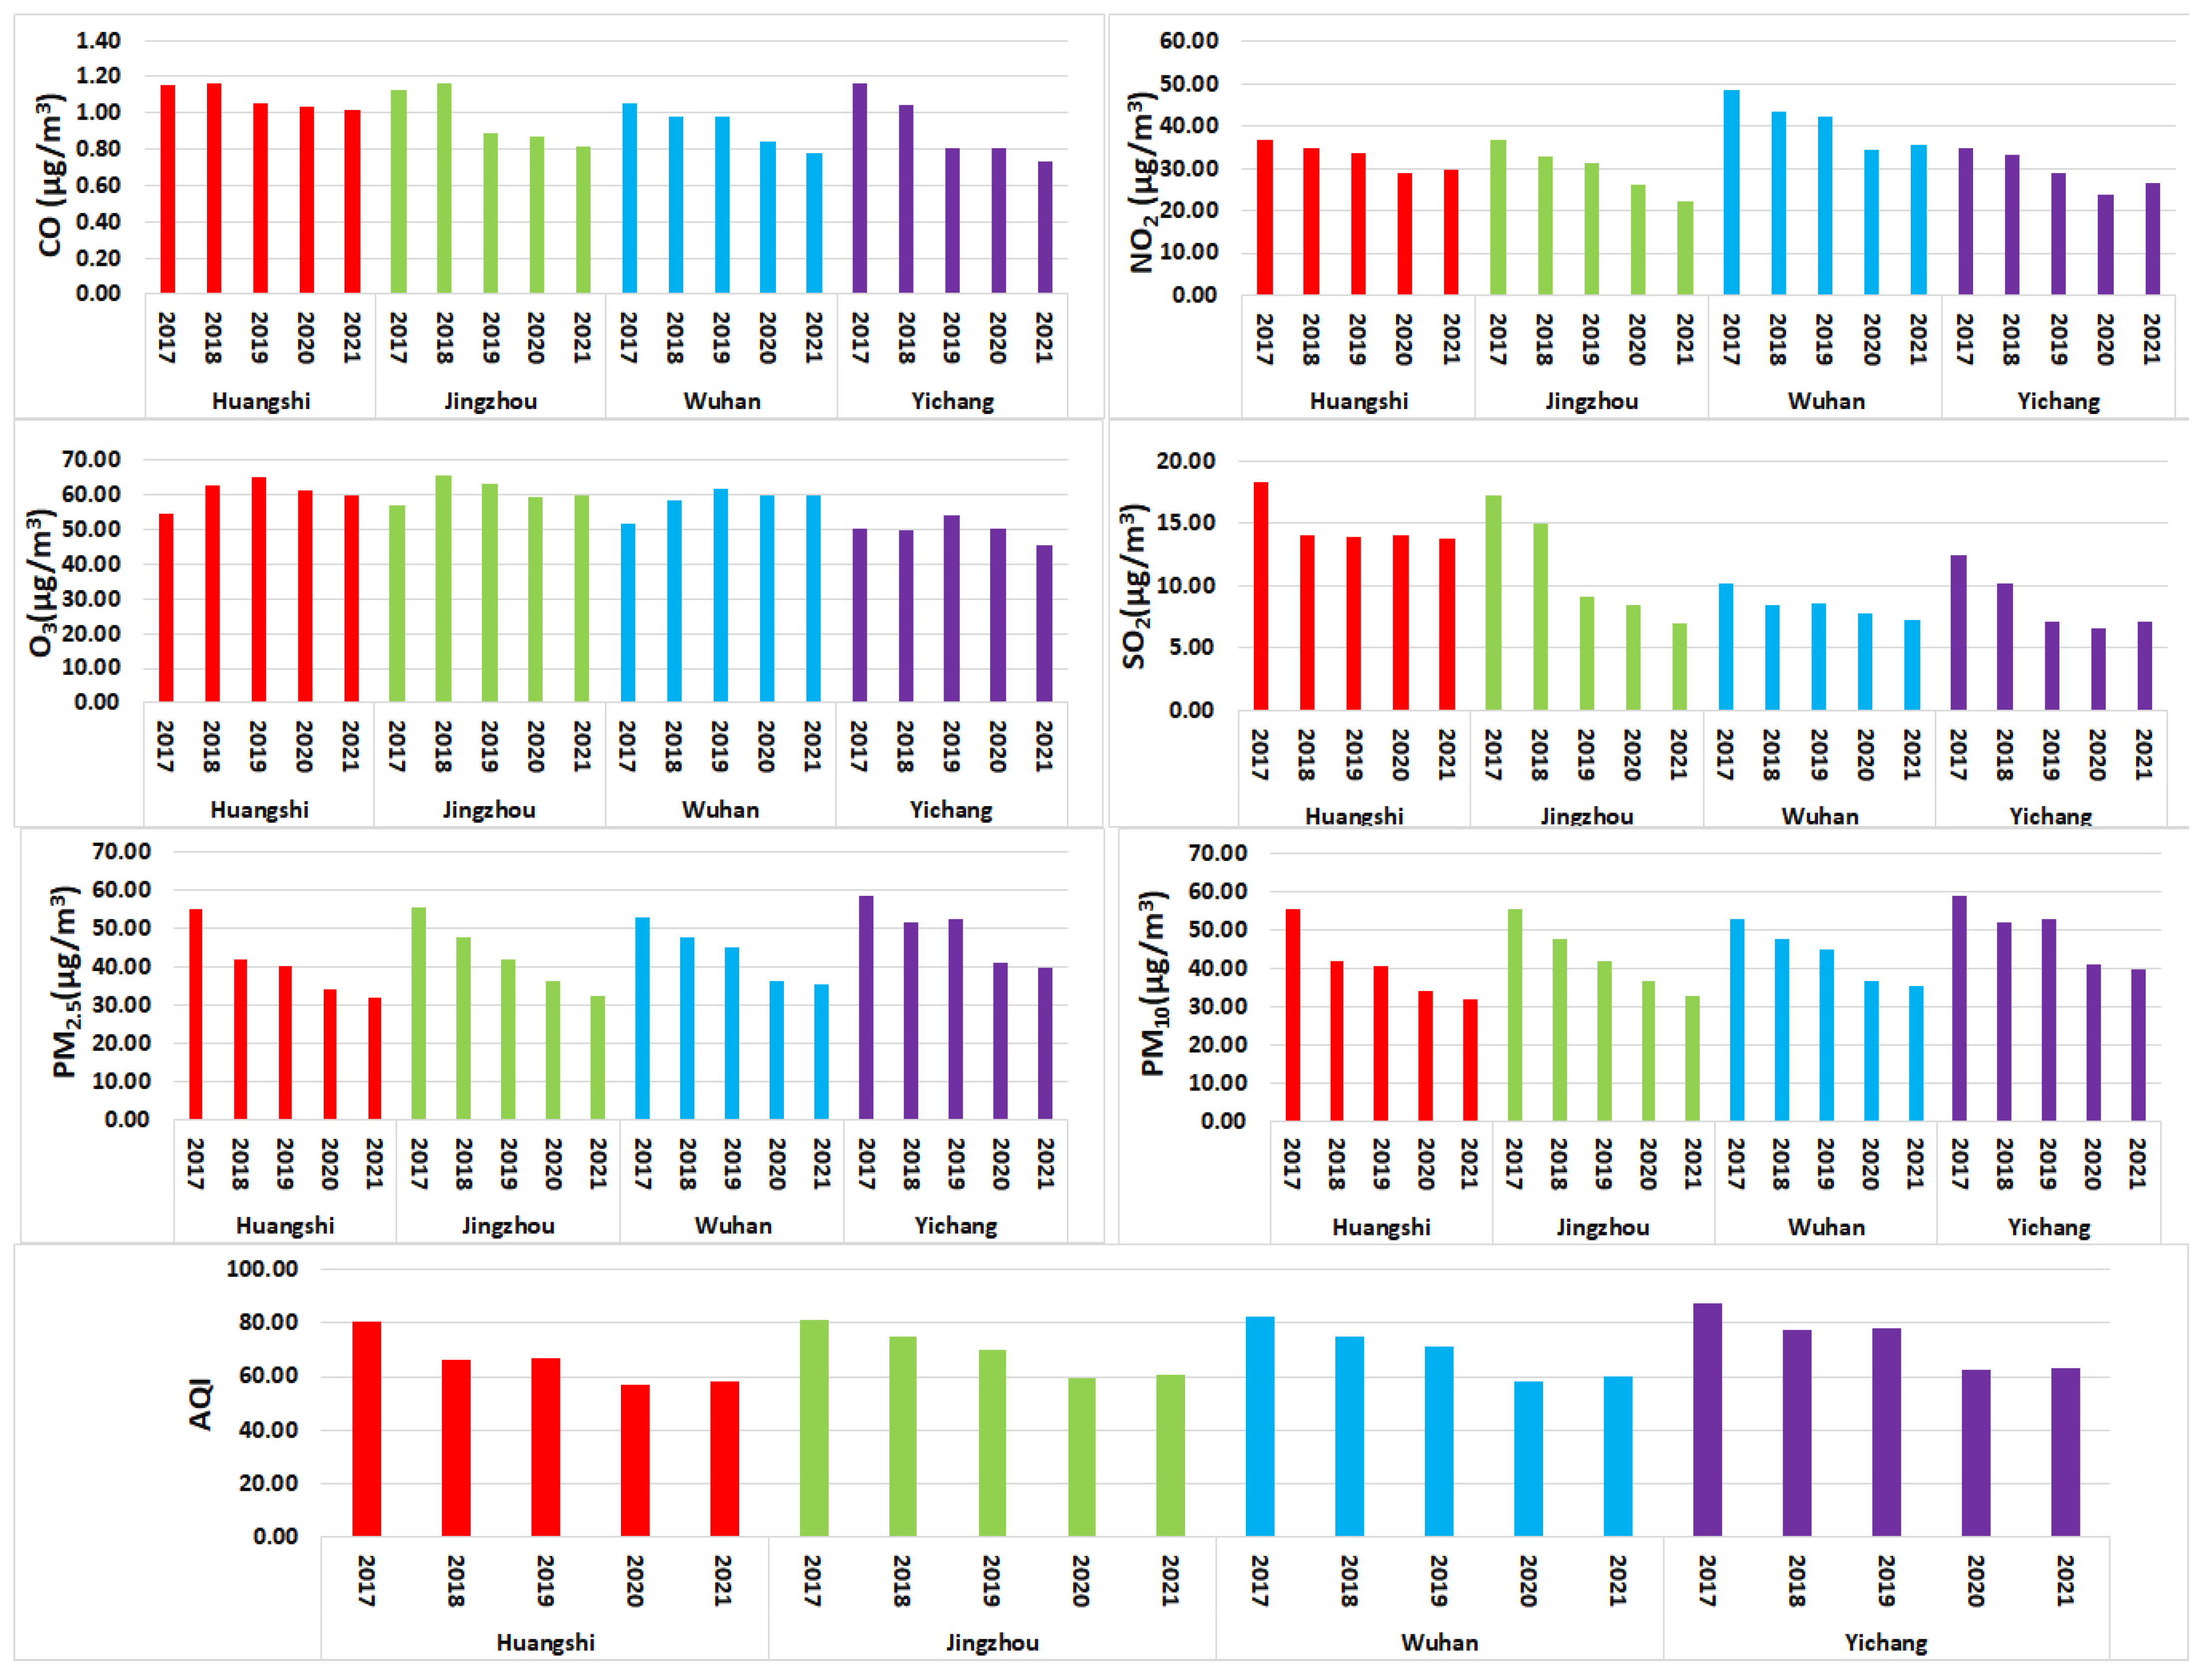
3.1. City-Wide Change in Air-Quality Patterns from 2017 to 2021

The change in air-quality patterns in the four cities within Hubei Province over the last five years is shown in Figure 2. The AQI level of all four cities is reduced yearly due to continuous air quality monitoring by the government with policy implications for the environment friendly transport system, and it can be observed that until 2020 (before active COVID-19) the AQI was decreasing; however, in the post-COVID-19 period, it began to increase due to an increase in economic development and traffic. A similar pattern was observed for some of the air-quality pollutants, namely NO2 and PM 10 . The concentration of O 3 was increasing in the pre-COVID-19 period, but it reduced after the active-COVID-19 period and continued to decrease in the post-COVID-19 period. The concentration of PM 2.5 decreased yearly from 2017 until 2021, but its decrease in 2021 is less notable compared to the active-COVID-19 period.
Table 2 shows the statistical results of analysis performed on data of all cities.
The LSD test helps to identify the population whose means are significantly different. After applying LSD on Table 2, values of AQI by year shows that there are three groups (A, B, C) among group means that are significantly different from one another. For CO, there are five groups (A, B, C, D, E) and all five groups’ means are significantly different from one another. The LSD test of NO2 by year shows that there are 3 groups (A, B, C) among group means that are significantly different from one another while for O3 LSD comparisons show two groups (A and B) which are significantly different from one another. The PM2.5 and PM10 LSD test shows three groups (A, B, C) whose group means are significantly different from one another. The LSD test of SO2 by year shows there are there are 4 groups (A, B, C, D) among group means that are significantly different from one another.
Change in concentration of pollutants in Wuhan and other cities has involved different local environmental policies and control measures due to COVID-19. In late January 2020, due to the COVID-19 epidemic, the Wuhan region implemented strict regulations. Traffic restrictions reduced vehicle emissions in urban areas to the utmost extent. Existing observations have shown that the atmospheric composition in eastern China changed significantly in February 2020 compared to January 2020.
Yichang city experienced several rare continuous serious pollution processes before COVID-19, which caused widespread concern for government. The control of air pollution has always been an important part of protecting people’s lives and health in Yichang City. During the pre-COVID period, the Yichang City Government and the Environmental Protection Bureau implemented compulsory measures to reduce air pollution. These measures included artificial rain enhancement and haze reduction; strengthening the management of motor vehicles and rectifying yellow-label vehicles; stopping part of construction site operations; stopping and limiting production of key polluting enterprises; reducing pollution from coal-burning facilities; and reducing organic waste. However, significant change in air pollutant can be observed during active-COVID when the strict lockdown was implemented.
In recent years, air pollution has been caused by the rapid increase in the number of motor vehicles in Jingzhou city. Jingzhou’s transportation has been continuously developed in last few years, but road construction has been relatively lagging. Many different causes are the reason for the pre-COVID and post-COVID increase of pollutants such as insufficient infrastructure in all counties in Jingzhou, narrow roads in the old towns, low green coverage, bare ground and ground dust caused by citizens’ production and life, plus temperature inversion, dense fog, and severe weather such as haze will directly and indirectly affect the air quality of relevant areas.
Huangshi City is in the south of the Yangtze River area, with four distinct seasons. Spring and winter are dry and less rainy. There is more floating dust in the air due to its weather conditions. Therefore, dust in the city and construction site soil and sand dust seriously affect the air quality of this city. The large fog formed is not conducive to the diffusion of air pollutants, causing PM2.5 and PM10 to exceed the standard. O3 is a secondary pollutant and is closely related to NOx. Its generation is mainly controlled by meteorological conditions. The summer weather is hot, and it is affected by meteorological effects such as solar radiation and high temperature that are beneficial to photochemical reactions. Nitrogen oxides and hydrocarbons in the air are exposed to strong sunlight. Under irradiation, after a series of complex atmospheric photochemical reactions, more O3 is produced and enriched, which causes O3 to become the main pollutant in summer. This is the reason that from 2017 to 2019 pollutants were high in Huangshi city which decreased during active-COVID period.

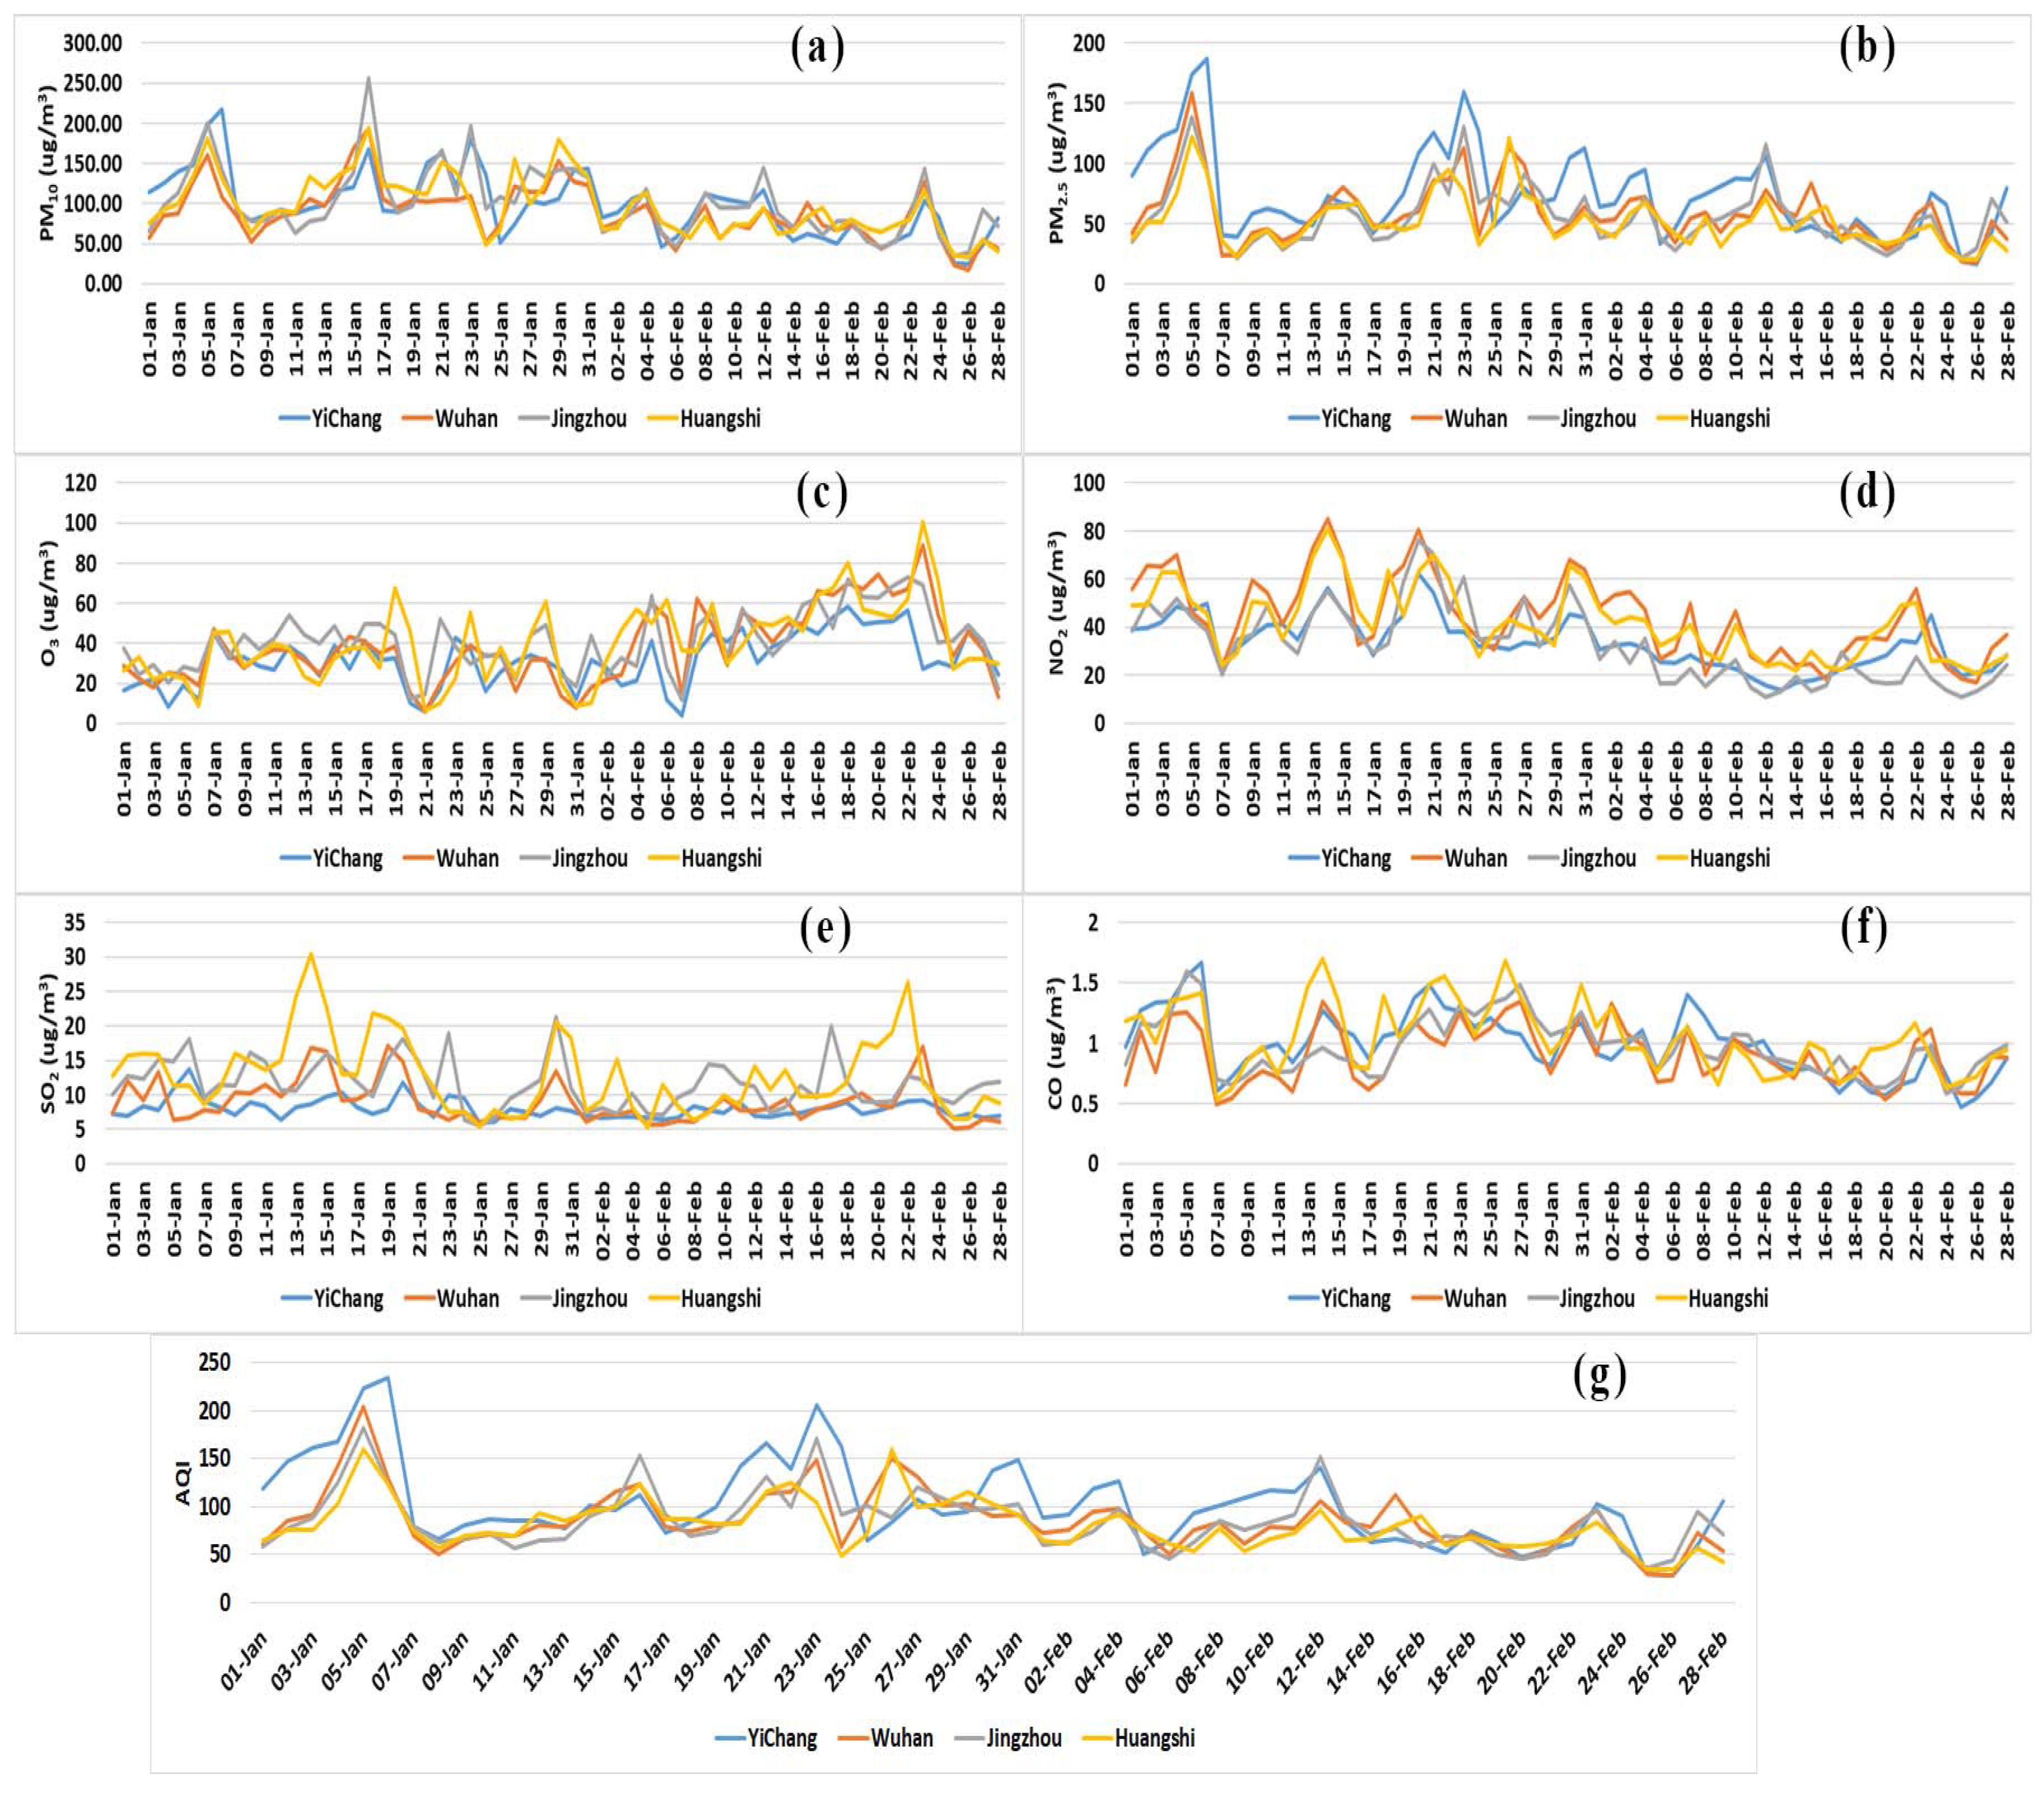
3.2. Daily Change in Air Pollutants during Active-COVID-19

Figure 3 shows the daily change in air-quality patterns for two months i.e., from January to February (to show variations due to lockdown) since the emergence of the COVID-19 virus.
It can be observed that the AQI gradually decreases after the implementation of a lockdown in Wuhan and nearby cities on 23 January 2020 [18]. Soon after the lockdown begins, the pollutants and the AQI had a sudden decrease, and after a few days of lockdown continuously decrease due to low human activity and less economic development [19]. The only pollutant which was increasing during lockdown was only O3. After the lockdown was lifted on 8 April 2020, the AQI level started increasing once again, while the level of O 3 , which was decreasing, shifted towards increasing after the lockdown ended. However, with the rapid increase in the number of motor vehicles, the NO 2 concentration in Wuhan increased. Traffic control was implemented in Wuhan on 23 January 2020. There was little change in the concentration of NO 2 in Wuhan after 23 January 2020 compared to the same period pre-COVID-19, however the NO 2 concentration dropped from 47 µg/m3 to 29 µg/m3 between 20 January and 24 January. Although motor vehicle travel was banned in Wuhan’s central urban area on 26 January 2020, the level of NO 2 in Wuhan was the lowest at the end of January at an average concentration of 8 µg/m3. This is mainly since the motor vehicle ban was during a period of sustained humidity. Contrary to O 3 , due to a weaker convection and diffusion effect when the temperature is low, PM 2.5 concentrations are highest in winter, and they gradually decrease as the temperature rises. The change in the trend of PM 2.5 concentration is consistent with that of NO 2 . In Wuhan, the concentration of PM 2.5 decreased by 23.6% overall in 2020, in Jingzhou it decreased by 15.3%, in Huangshi it decreased by 18.2%, and in Yichange it decreased by 28.6%. Similarly, PM 10 levels also decreased on a daily basis after the execution of the lockdown. The actual contribution of the prohibition to the reduction of particulate matter in Wuhan is limited, especially as the daytime maximum temperature rises above 20 °C in mid-March, which leads to the degree of conversion of NO 2 into particulate matter weakening, and the PM 2.5 concentration is similar to that of the same period the previous year. This shows that although the strict traffic control during the epidemic minimized motor vehicle emissions, sources of major pollution emissions, such as industrial production, still existed.
Man-made SO 2 emissions mainly come from industrial coal, which is an important source of particulate matter [20]. After China began implementing a desulfurization policy in 2006, the concentration of SO 2 in Wuhan has continued to decline and is currently at a relatively low level [21]. From 22 January to 28 January 2020 (Spring Festival), the level of SO 2 in the Wuhan area remained at 5 µg/m3, but it rose to 11 µg/m3 on 31 January 2020, unlike the sharp drop in NO 2 concentration in 2020. During the lockdown period, the concentration of SO 2 dropped from 9 µg/m3 in the same pre-COVID-19 period the previous year to 8 µg/m3, indicating that the SO 2 concentration during the pandemic has reduced compared to SO 2 levels before the pandemic. Emissions related to industrial activities did not significantly reduce.

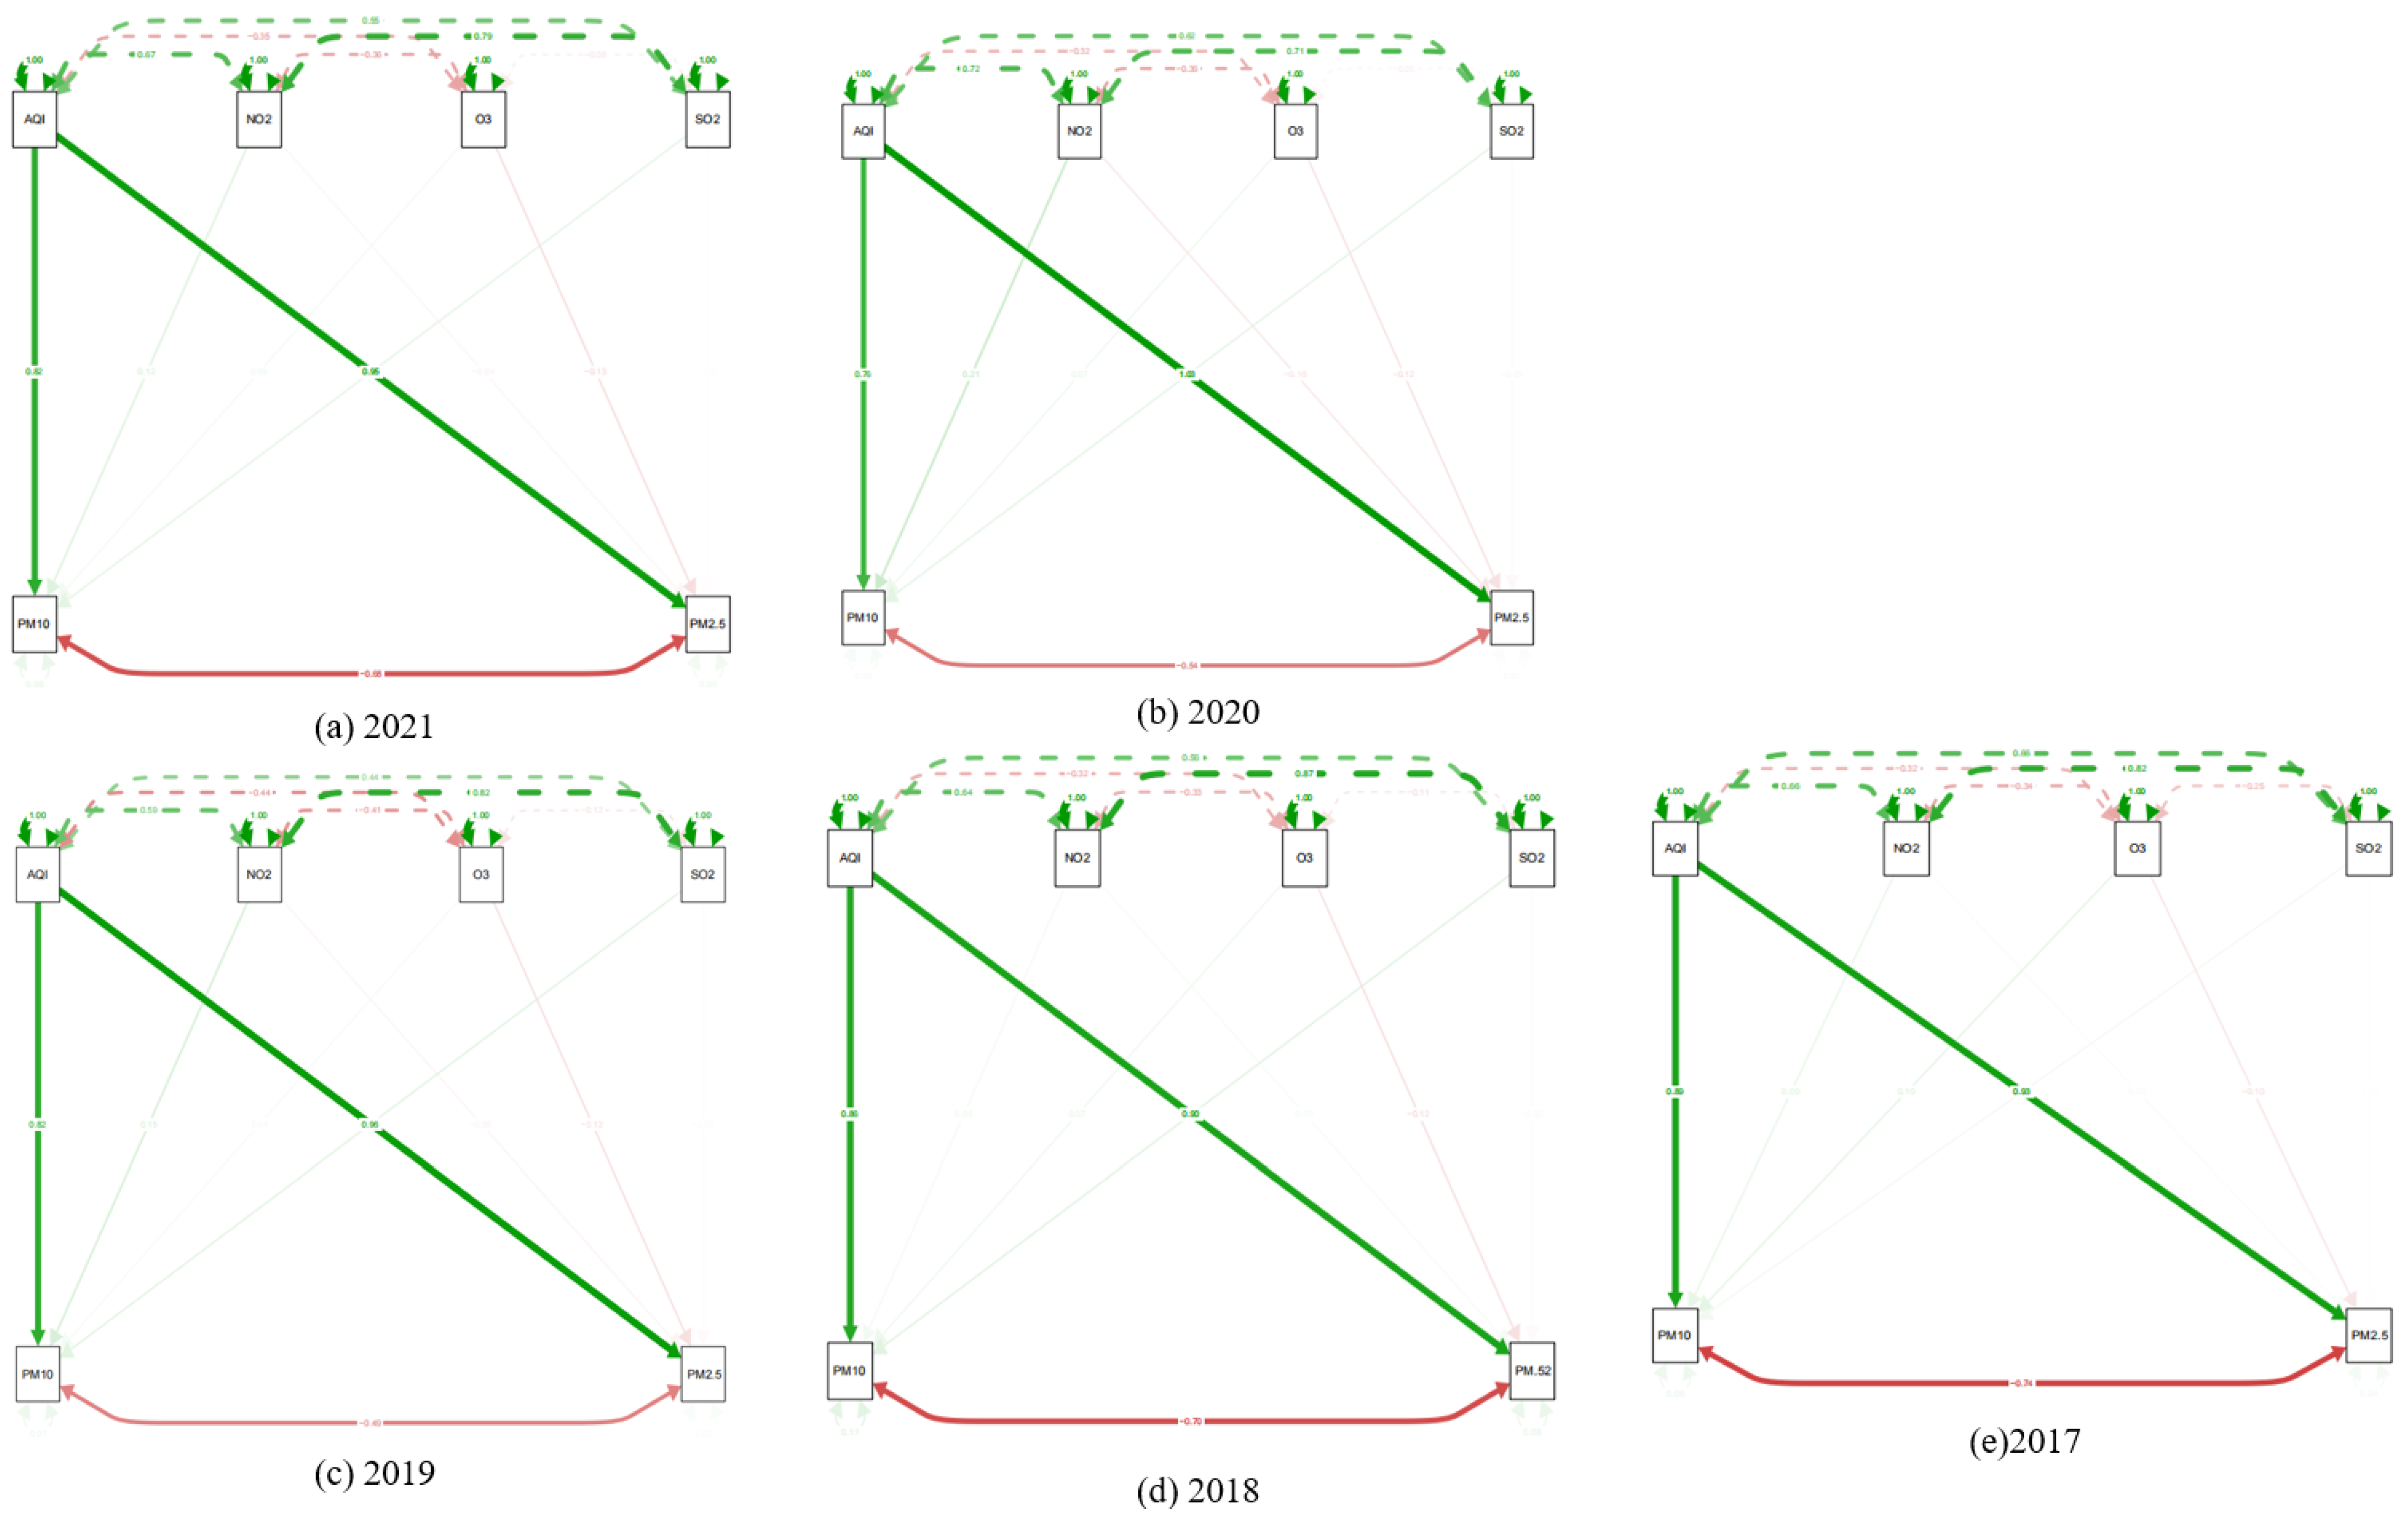
3.3. Path Analysis Implementation

Path analyses were used to find relationship of primary and major pollutants therefore we calculated the relationship of PM10 and PM2.5 (dependent variables) with other pollutants (independent variables). The path analysis model was used to predict the direct and indirect relationship between the air pollutants and the AQI (Figure 4 and Table 3). β is the correlation coefficient range from 0 to 1. The higher the value of beta, the stronger the association between the variables.
It can be observed that PM 2.5 ’s β coefficient with the AQI is 0.94, whereas it is low with SO 2 and NO 2 and lowest with O 3 in the post-COVID-19 period. Similar patterns were observed for the active-COVID-19 period, where the β coefficient with the AQI is 0.866 for PM 2.5 but is lower for the other variables. The pre-COVID-19 PM 2.5 β coefficient is still higher compared to the other pollutants. The post-COVID-19 PM 10 is strongly correlated with the AQI, with a β coefficient of 0.801, but negatively correlated with the other pollutants. Pre-COVID-19 and during active COVID-19, the same pattern of it having a strong relationship with the AQI but negative relationships with the other pollutants can be observed. The air-quality index is calculated based on averages of all pollutant concentrations measured in a full day. While the majority of AQIs evaluate only a subset of ozone O3, particulate matter (PM), NO2, SO2, CO, and volatile organic compounds (VOCs), overall AQI covers them all. Therefore, results from path analysis shows a strong relationship between PM10 and PM2.5 with AQI which means that AQI has a major impact on these pollutants.

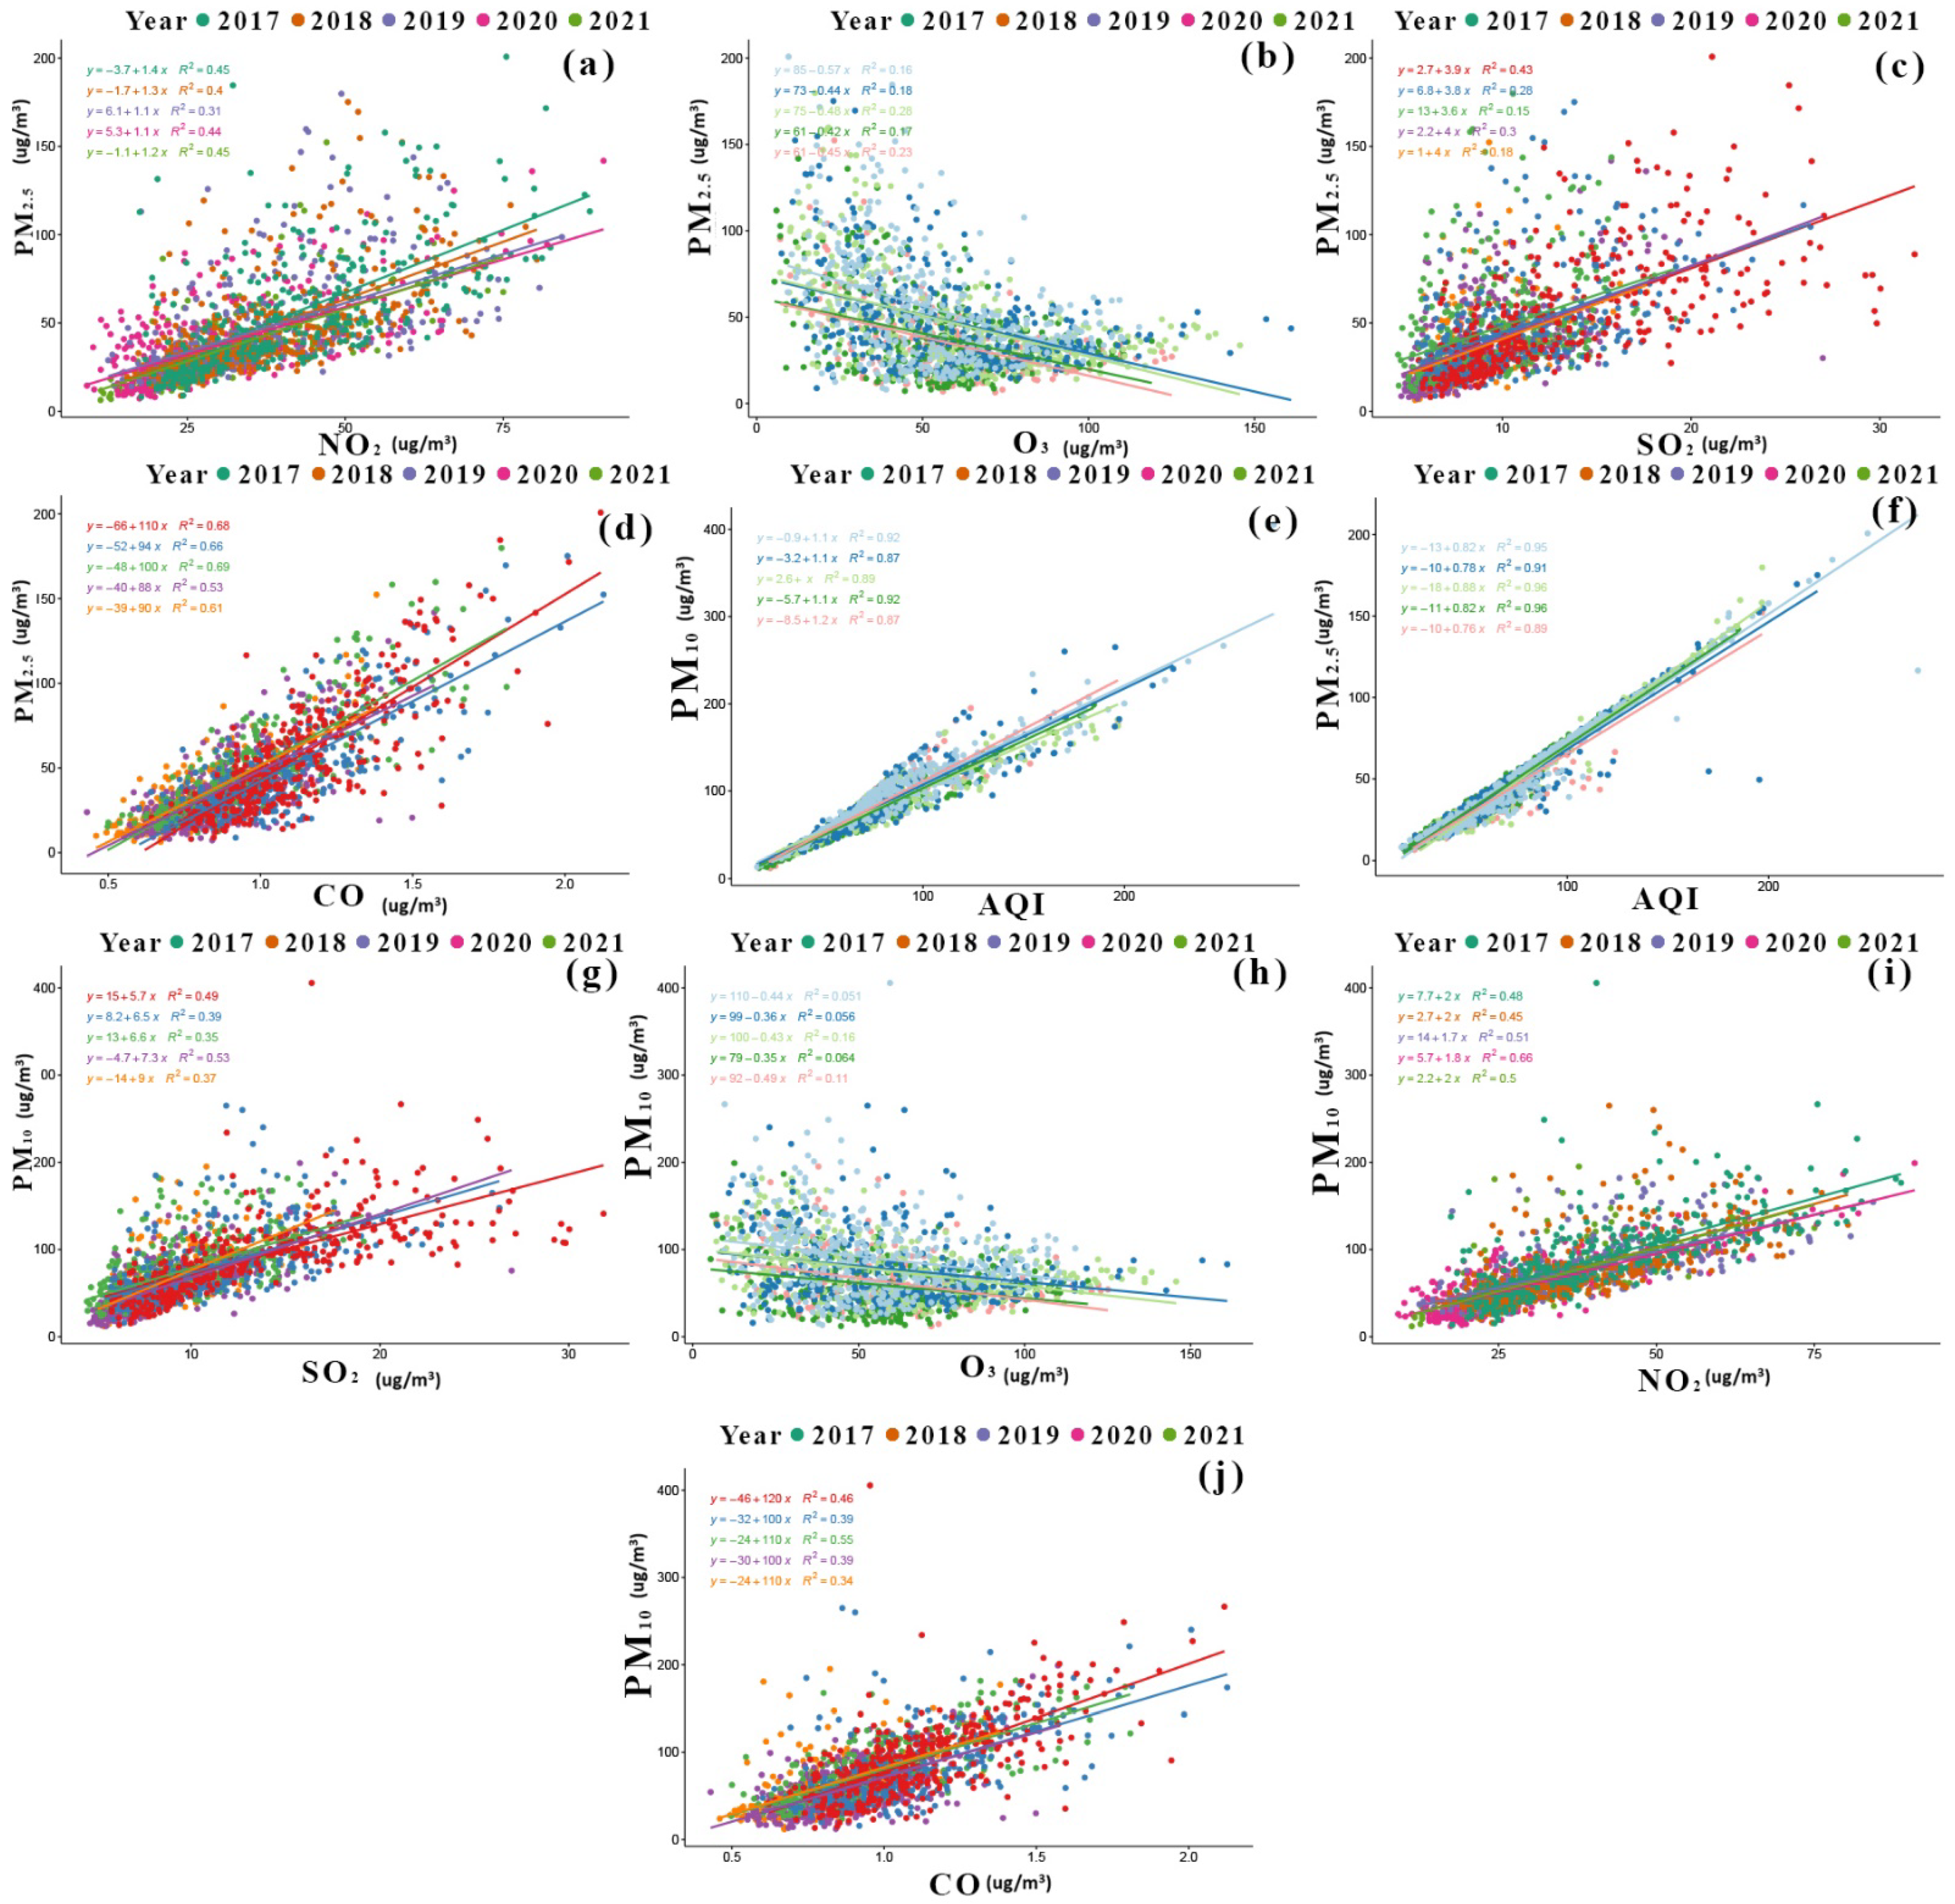
3.4. Regression Analysis Implementation

The regression between PM 2.5 and NO 2 has not changed over the past five years ( r 2 > 0.31 to r 2 < 0.45), however during the active-COVID-19 period ( r 2 = 0.44), the regression is higher than pre-COVID-19 ( r 2 = 0.31). The regression between PM 2.5 and O 3 has weakened a lot over the past five years ( r 2 > 0.16 to r 2 < 0.28); however, during the active-COVID-19 period ( r 2 = 0.17), it decreased more compared to pre-COVID-19 ( r 2 = 0.28) and post-COVID-19 ( r 2 = 0.23). The regression of PM 2.5 and SO 2 during the active-COVID-19 period ( r 2 = 0.30) is higher than pre-COVID-19 ( r 2 = 0.15) and post-COVID-19 ( r 2 = 0.15). PM 2.5 and CO have an average medium regression ( r 2 > 0.51 to r 2 < 0.69) value throughout every year, but the lowest value recorded is during the active-COVID-19 period ( r 2 = 0.53). The regression between PM 2.5 and AQI is strong every year ( r 2 > 0.89 to r 2 < 0.96), however the lowest value recorded is in the post-COVID-19 period ( r 2 = 0.89) (Figure 5).
Similarly, the regression between PM 10 and AQI is strong every year ( r 2 > 0.87 to r 2 < 0.92), however the lowest value recorded is post-COVID-19 ( r 2 = 0.87). PM 10 and SO 2 have an average medium regression over all five years ( r 2 > 0.35 to r 2 < 0.53), with the highest value being recorded in the active-COVID-19 period ( r 2 = 0.53) and lowest value being recorded pre-COVID-19 ( r 2 = 0.35). PM 10 and O 3 also have a weak regression over all five years ( r 2 > 0.051 to r 2 < 0.11), with the highest value being recorded post-COVID-19 ( r 2 = 0.11) and the lowest value being recorded in the year 2017 ( r 2 = 0.051). It can also be observed that the regression value during the active-COVID-19 period ( r 2 = 0.064) is lower compared to pre-COVID-19 ( r 2 = 0.16) and post-COVID-19 ( r 2 = 0.11). The regression between PM 10 and NO 2 is medium every year ( r 2 > 0.44 to r 2 < 0.66), however the highest value recorded is during the active-COVID-19 period ( r 2 = 0.66). PM 10 and CO also have a medium regression every year ( r 2 > 0.55 to r 2 < 0.34), but post-COVID-19 ( r 2 = 0.34) saw the lowest value of regression and pre-COVID-19 ( r 2 = 0.55) saw the highest value of regression. This regression model helps predict the relationship of PM 10 and PM 2.5 with other pollutants in order to gain an understanding of the changing behavior of air quality.
Since the COVID-19 pandemic, many scholars at home and abroad have discussed the characteristics of the changes in air quality under epidemic prevention and control, but relatively few studies have used statistical methods for their analysis [22,23]. In this study, a path analysis and a regression analysis were the main methods used to measure the relationships between the AQI value, the number of days of primary pollutant pollution, the pollutant concentration, and NO 2 / SO 2 , among other values, from January 2019 to August 2021 and the same period in 2017 and 2018. The aim was to compare and analyze the changes in air quality in Wuhan and nearby cities during the period of epidemic prevention and control, to discuss the impact of epidemic prevention measures on air quality, to provide a reference and idea of how air pollutant patterns are changing yearly, and to suggest ways to improve air quality and adjust prevention and control measures.
From the analysis of the results, it can be said that the air quality in Hubei improved significantly during the epidemic prevention and control period compared to the previous three years. This is clearly in line with the epidemic prevention and control measures implemented in Hubei during the pandemic, namely traffic restrictions, closed community management, and enterprise production and operation control [24]. These greatly restricted peoples’ production and living activities, and this is closely related to the reduction in pollutants. The successive implementation of the above measures has reduced urban pollution sources and the emission of pollutants that affect ambient air quality [25,26]. However, due to closed management and the fact that the population is relatively dense, the demand for heating increased exponentially. Therefore, after traffic restrictions were adopted in Hubei, the concentration of particulate matter increased slightly. Due to the needs of social life, the order and scope of the implementation of the above measures have gradually slowed down in Hubei, production and living activities have gradually resumed. Compared to the same period in previous years, the difference in daily average AQI has gradually decreased. This research also provides clarification regarding the management of ambient air quality. The results show that a temporary social blockade cannot improve the pollution of all pollutants. Due to the increase in fireworks emissions and coal combustion, the number of pollution days of O 3 and PM 2.5 increased during certain periods. Therefore, the focus of Hubei Province’s future environmental protections should still be on the reduction of emissions through technological innovations in industry, transportation, and living activities. The removal of pollution sources may not be a good strategy for energy conservation and emissions reduction.
Through a year-on-year comparison of the concentration of basic pollutants during and before the pandemic, this study also explored the sources and influencing factors of air pollution during the COVID-19 pandemic. During the epidemic prevention and control period in Hubei, the concentrations of pollutants such as PM 2.5 , PM 10 , NO 2 , SO 2 , and CO all declined, which is consistent with changes in the ambient air quality in other countries and regions [27,28,29,30]. In particular, the concentration of SO 2 pollution improved significantly during the epidemic prevention and control period. This is because in recent years, Hubei Province had actively adopted environmental protection measures such as improving stoves in cities and towns, eliminating small and medium-sized boilers, and switching to anthracite.
Declining industrial control is, therefore, an important measure for the reduction of SO 2 emissions. After the gradual relaxation of the epidemic preventions and controls, the concentrations of PM 2.5 and CO in Hubei showed a downward trend. This is because a rise in temperature, which was occurring at the time, is conducive to the complete combustion of fuel, which results in a decrease in PM 2.5 and CO emissions, so fuel is improved, and heating is increased. This method may be a better measure than restricting traffic and reducing exhaust emissions in terms of reducing PM 2.5 and CO emissions. In addition, heating tools, such as heaters and boilers, are also important sources of PM 2.5 and CO. Their utilization rate decreases with climate warming. When the temperature rises, the concentration of these pollutants will drop further.

4. Conclusions

This study shows that the daily average AQI value and the concentration of various pollutants in Hubei during the epidemic prevention and control period improved to varying degrees compared to the same period in 2018 and 2019. For all the air quality pollutants studied, a decrease in concentration was recorded during the active-COVID-19 period, with a maximum decrease observed in PM 10 at 26% followed by PM 2.5 at 23% and the lowest decrease observed in O 3 at 5%. The changes in air pollutant levels from 2017 to 2021 were further compared and a decrease in all pollutants through to 2020 was found. However, in 2021, air pollution began to increase. The analysis of the primary pollutants during the epidemic prevention and control period showed that only the number of days of PM 10 pollution decreased, with PM 2.5 and O 3 pollution increasing after the traffic blockade was established because of increased emissions from coal and fireworks. The above results indicate that the lockdown during the COVID-19 pandemic may have had both positive and negative effects on ambient air quality.
This study has some shortcomings, which are as follows:
  • This study verifies that the lockdown during the COVID-19 pandemic may have had both positive and negative effects on ambient air quality. However, due to limitations in the availability of data from all the air-monitoring stations, some stations’ data has been excluded, and thus, this outcome cannot be applied to all the stations.
  • Further monitoring of stations can be improved if their locations are far from each other so that the overall air pollutants’ real concentration can be calculated across all parts of the city.

Author Contributions

Conceptualization, M.A., Z.L., S.B. and R.A.W.; methodology, U.A.B., M.M.N. and S.A.; data curation, S.B., R.A.W., U.A.B., M.M.N., and S.A.; writing—review and editing, M.A., Z.L., S.B., R.A.W., U.A.B., M.M.N., and S.A.; funding acquisition, M.A. and Z.L. All authors have read and agreed to the published version of the manuscript.

Funding

The work is supported by the Natural Science Foundation of Hubei Province of China in 2021 (project name: Research on Brain Tumor Diagnosis Based on Capsule Neural Network), New Generation Information Technology Innovation Project Ministry of Education (project number: 20202020ITA05022), and Hundreds of Schools Unite with Hundreds of Counties-University Serving Rural Revitalization Science and Technology Support Action Plan (Grant No.: BXLBX0847).

Institutional Review Board Statement

Not applicable.

Informed Consent Statement

Not applicable.

Data Availability Statement

Not applicable.

Acknowledgments

Thanks for reviewers and editors for providing suggestion in improving the manuscript.

Conflicts of Interest

The authors declare no conflict of interest.

References

  1. Gautam, S.; Hens, L. COVID-19: Impact by and on the environment, health and economy. Environ. Dev. Sustain. 2020, 22, 4953–4954. [Google Scholar] [CrossRef]
  2. Li, L.; Li, Q.; Huang, L.; Wang, Q.; Zhu, A.; Xu, J.; Liu, Z.; Li, H.; Shi, L.; Li, R.; et al. Air quality changes during the COVID-19 lockdown over the Yangtze River Delta Region: An insight into the impact of human activity pattern changes on air pollution variation. Sci. Total Environ. 2020, 732, 139282. [Google Scholar] [CrossRef] [PubMed]
  3. Zalakeviciute, R.; Vasquez, R.; Bayas, D.; Buenano, A.; Mejia, D.; Zegarra, R.; Diaz, V.; Lamb, B. Drastic Improvements in Air Quality in Ecuador during the COVID-19 Outbreak. Aerosol Air Qual. Res. 2020, 20, 1783–1792. [Google Scholar] [CrossRef]
  4. Lian, X.; Huang, J.; Huang, R.-J.; Liu, C.; Wang, L.; Zhang, T. Impact of city lockdown on the air quality of COVID-19-hit of Wuhan city. Sci. Total Environ. 2020, 742, 140556. [Google Scholar] [CrossRef]
  5. Altuwayjiri, A.; Soleimanian, E.; Moroni, S.; Palomba, P.; Borgini, A.; De Marco, C.; Ruprecht, A.A.; Sioutas, C. The impact of stay-home policies during Coronavirus-19 pandemic on the chemical and toxicological characteristics of ambient PM2.5 in the metropolitan area of Milan, Italy. Sci. Total Environ. 2021, 758, 143582. [Google Scholar] [CrossRef] [PubMed]
  6. Elshorbany, Y.F.; Kapper, H.C.; Ziemke, J.R.; Parr, S.A. The Status of Air Quality in the United States during the COVID-19 Pandemic: A Remote Sensing Perspective. Remote Sens. 2021, 13, 369. [Google Scholar] [CrossRef]
  7. Menut, L.; Bessagnet, B.; Siour, G.; Mailler, S.; Pennel, R.; Cholakian, A. Impact of lockdown measures to combat Covid-19 on air quality over western Europe. Sci. Total Environ. 2020, 741, 140426. [Google Scholar] [CrossRef] [PubMed]
  8. Clemente, Á.; Yubero, E.; Nicolás, J.F.; Caballero, S.; Crespo, J.; Galindo, N. Changes in the concentration and composition of urban aerosols during the COVID-19 lockdown. Environ. Res. 2021, 203, 111788. [Google Scholar] [CrossRef]
  9. Zangari, S.; Hill, D.; Charette, A.T.; Mirowsky, J.E. Air quality changes in New York City during the COVID-19 pandemic. Sci. Total Environ. 2020, 742, 140496. [Google Scholar] [CrossRef]
  10. Agarwal, A.; Kaushik, A.; Kumar, S.; Mishra, R.K. Comparative study on air quality status in Indian and Chinese cities before and during the COVID-19 lockdown period. Air Qual. Atmos. Health 2020, 13, 1167–1178. [Google Scholar] [CrossRef]
  11. Bar, S.; Parida, B.R.; Mandal, S.P.; Pandey, A.C.; Kumar, N.; Mishra, B. Impacts of partial to complete COVID-19 lockdown on NO2 and PM2.5 levels in major urban cities of Europe and USA. Cities 2021, 117, 103308. [Google Scholar] [CrossRef]
  12. Stratoulias, D.; Nuthammachot, N. Air quality development during the COVID-19 pandemic over a medium-sized urban area in Thailand. Sci. Total Environ. 2020, 746, 141320. [Google Scholar] [CrossRef] [PubMed]
  13. Adam, M.G.; Tran, P.T.; Balasubramanian, R. Air quality changes in cities during the COVID-19 lockdown: A critical re-view. Atmos. Res. 2021, 264, 105823. [Google Scholar] [CrossRef]
  14. Wilder, B.; Charpignon, M.; Killian, J.A.; Ou, H.-C.; Mate, A.; Jabbari, S.; Perrault, A.; Desai, A.N.; Tambe, M.; Majumder, M.S. Modeling between-population variation in COVID-19 dynamics in Hubei, Lombardy, and New York City. Proc. Natl. Acad. Sci. USA 2020, 117, 25904–25910. [Google Scholar] [CrossRef]
  15. Ministry of Environmental Protection. Ambient Air Quality Standards (GB 3095-2012). 2012. Available online: http://www.zzemc.cn/em_aw/Content/GB3095-2012.pdf (accessed on 29 February 2012).
  16. Wright, S. On “Path analysis in genetic epidemiology: A critique”. Am. J. Hum. Genet. 1983, 35, 757–768. [Google Scholar]
  17. Mohan, M.; Kandya, A. An Analysis of the Annual and Seasonal Trends of Air Quality Index of Delhi. Environ. Monit. Assess. 2007, 131, 267–277. [Google Scholar] [CrossRef] [PubMed]
  18. Lau, H.; Khosrawipour, V.; Kocbach, P.; Mikolajczyk, A.; Schubert, J.; Bania, J.; Khosrawipour, T. The positive impact of lockdown in Wuhan on containing the COVID-19 outbreak in China. J. Travel Med. 2020, 27, taaa037. [Google Scholar] [CrossRef] [Green Version]
  19. Li, M.; Yin, H.; Jin, Z.; Zhang, H.; Leng, B.; Luo, Y.; Zhao, Y. Impact of Wuhan lockdown on the indications of cesarean delivery and newborn weights during the epidemic period of COVID-19. PLoS ONE 2020, 15, e0237420. [Google Scholar] [CrossRef]
  20. Goodsite, M.E.; Hertel, O.; Johnson, M.S.; Jørgensen, N.R. Urban Air Quality: Sources and Concentrations. In Air Pollution Sources, Statistics and Health Effects; Springer: New York, NY, USA, 2021. [Google Scholar] [CrossRef]
  21. Guo, H.; Yang, C.; Liu, X.; Li, Y.; Meng, Q. Simulation evaluation of urban low-carbon competitiveness of cities within Wuhan city circle in China. Sustain. Cities Soc. 2018, 42, 688–701. [Google Scholar] [CrossRef]
  22. Elsaid, A.M.; Ahmed, M.S. Indoor Air Quality Strategies for Air-Conditioning and Ventilation Systems with the Spread of the Global Coronavirus (COVID-19) Epidemic: Improvements and Recommendations. Environ. Res. 2021, 199, 111314. [Google Scholar] [CrossRef] [PubMed]
  23. Yang, Q.; Wang, B.; Wang, Y.; Yuan, Q.; Jin, C.; Wang, J.; Li, S.; Li, M.; Li, T.; Liu, S.; et al. Global air quality change during COVID-19: A synthetic analysis of satellite, reanalysis and ground station data. Environ. Res. Lett. 2021, 16, 074052. [Google Scholar] [CrossRef]
  24. Lin, R.; Lin, S.; Yan, N.; Huang, J. Do prevention and control measures work? Evidence from the outbreak of COVID-19 in China. Cities 2021, 118, 103347. [Google Scholar] [CrossRef] [PubMed]
  25. Jephcote, C.; Hansell, A.L.; Adams, K.; Gulliver, J. Changes in air quality during COVID-19 ‘lockdown’ in the United Kingdom. Environ. Pollut. 2021, 272, 116011. [Google Scholar] [CrossRef] [PubMed]
  26. Ali, S.M.; Malik, F.; Anjum, M.S.; Siddiqui, G.F.; Anwar, M.N.; Lam, S.S.; Nizami, A.-S.; Khokhar, M.F. Exploring the linkage between PM2.5 levels and COVID-19 spread and its implications for socio-economic circles. Environ. Res. 2021, 193, 110421. [Google Scholar] [CrossRef] [PubMed]
  27. Ghahremanloo, M.; Lops, Y.; Choi, Y.; Mousavinezhad, S. Impact of the COVID-19 outbreak on air pollution levels in East Asia. Sci. Total Environ. 2021, 754, 142226. [Google Scholar] [CrossRef]
  28. Bao, R.; Zhang, A. Does lockdown reduce air pollution? Evidence from 44 cities in northern China. Sci. Total Environ. 2020, 731, 139052. [Google Scholar] [CrossRef]
  29. Brimblecombe, P. Visibility Driven Perception and Regulation of Air Pollution in Hong Kong, 1968–2020. Environments 2021, 8, 51. [Google Scholar] [CrossRef]
  30. Hang, Y.; Wang, Q.; Wang, Y.; Su, B.; Zhou, D. Industrial SO2 emissions treatment in China: A temporal-spatial whole process decomposition analysis. J. Environ. Manag. 2019, 243, 419–434. [Google Scholar] [CrossRef]
Figure 1. The study area of Hubei with the locations of the monitoring stations in the four cities.
Atmosphere 12 01338 g001
Figure 2. City-wide daily changes in air-quality patterns.
Atmosphere 12 01338 g002
Figure 3. Daily change in air-quality patterns (a) PM10 (b) PM2.5 (c) O3 (d) NO2 (e) SO2 (f) CO (g) AQI.
Atmosphere 12 01338 g003
Figure 4. Path analysis graphical representation (a) Year 2021 (b) Year 2020 (c) Year 2019 (d) Year 2018 (e) Year 2017.
Atmosphere 12 01338 g004
Figure 5. Yearly regression changes in air-quality patterns in Hubei (all four cities) (a) PM2.5 with NO2 (b) PM2.5 with O3 (c) PM2.5 with SO2 (d) PM2.5 with CO (e) PM10 with AQI (f) PM2.5 with AQI (g) PM10 with SO2 (h) PM10 with O3 (i) PM10 with NO2 (j) PM10 with CO.
Atmosphere 12 01338 g005
Table 1. Air Quality Index range and corresponding impact.
Air Quality Index RangeAir Quality LevelAir Quality CategoryRepresentative ColorImpacts on Human Health and Recommended Actions
0–50Level ISuperiorGreenThe air quality is satisfactory. There is basically no air pollution, and no impact on human activities
51–100Level IIGoodYellowThe air quality is acceptable. There are certain air pollutants that may cause health issues to a small number of people who should reduce outdoor activities.
101–150Level IIIMild
Pollution
OrangeSymptoms in susceptible people would intensify, and healthy people would show irritation symptoms. Elderly people and children should avoid long duration of high-intensity outdoor exercises.
151–200Level IVModerate
Pollution
RedSymptoms in susceptible people would further intensify, and the breathing of healthy people would be affected. Elderly people and children should avoid outdoor sports.
201–300Level VHeavy
Pollution
PurpleOrdinary people would show symptoms. Elderly people and children should avoid outdoor sports. The general population should reduce outdoor activities.
>300Level VISevere
Pollution
MaroonObvious and strong symptoms would appear, and all groups of people should avoid outdoor activities.
Table 2. Statistical explanation of data.
YearMethodStatistical Analysis of Air Pollutants
AQICONO2O3PM10PM2.5SO2
2021Max259.632.7099.29153.04368.88208.4280.96
Min15.960.202.961.504.172.001.21
Mean60.37 C0.82 E30.92 C56.83 AB63.75 C35.42 C8.61 D
Std.29.710.2815.7626.5337.4523.764.87
Median55.410.7927.7554.9255.0430.337.46
2020Max238.757.66143.38155.79255.21189.13160.86
Min12.380.131.921.885.292.171.00
Mean59.23 C0.87 D29.84 C57.87 A58.90 C37.25 C8.76 D
Std.30.460.3017.5325.9733.8625.406.47
Median53.540.8425.5457.5751.9030.717.17
2019Max346.332.78121.73181.00340.08296.3359.21
Min15.540.133.743.228.953.001.04
Mean72.02 B0.94 C36.04 B60.67 A74.33 B45.79 B9.37 C
Std.35.970.3318.5533.9038.0032.095.71
Median63.460.9031.9657.5466.2236.968.00
2018Max353.834.43135.61212.96465.08248.0468.54
Min11.250.153.791.576.003.421.06
Mean73.74 B1.06 B37.85 B58.28 A78.02 B47.69 B10.82 B
Std.38.920.3618.5230.5046.4531.576.62
Median63.421.0033.4255.0465.6439.089.42
2017Max478.175.29137.42217.17743.25351.04132.00
Min12.330.162.002.086.312.881.04
Mean83.06 A1.11 A41.47 A52.81 B91.16 A55.11 A13.40 A
Std.44.870.3520.4828.3953.1637.199.53
Median74.581.0636.7148.6782.7046.4511.08
Letters indicate which means are significantly different at the 95% level of confidence.
Table 3. Path analysis regression output.
202120202019
β CoefficientStd. ErrorMultiple R2β CoefficientStd. ErrorMultiple R2β CoefficientStd. ErrorMultiple R2
P M 2.5
AQI0.9490.0130.9170.8660.0170.9650.8680.0190.933
S O 2 0.3170.040.4660.0370.3630.069
O 3 0.0690.0130.0970.0150.0420.018
N O 2 1.0920.1521.0890.151.2380.288
P M 10
AQI0.8010.0070.9490.8610.0090.980.8660.0090.977
S O 2 −0.0730.023−0.1620.021−0.0960.034
O 3 −0.130.007−0.1220.009−0.110.009
N O 2 −0.60.087−0.2030.084−0.1670.143
Publisher’s Note: MDPI stays neutral with regard to jurisdictional claims in published maps and institutional affiliations.

