1. Introduction
The Western Cape (WC) is a province in the west of South Africa, situated in the subtropical pressure belt. Parts of the WC (i.e., parts of the western and southwestern regions) are characterized by the Mediterranean type of climate. This region receives rainfall mainly during the austral winter (JJA) through the activity of cold fronts that sweep across the area. The Southern Annular Mode (SAM) is a hemispherical mode of variability that is associated a with high (low) SLP in the mid-latitudes during its positive (negative) phase and opposing SLP anomalies over higher latitudes of the Southern Hemisphere [
1,
2,
3]. The authors of [
3,
4] found that the SAM is related to regional circulation types (CTs) that can influence the local climate of the WC. Thus, through the control of enhanced/suppressed westerly wind in the mid-latitudes, the SAM can impact atmospheric transport and stability in parts of the WC. While a previous study [
3] investigated how the SAM is linked to seasonal rainfall variability over the WC, this study examines whether there exists a link between the synoptic conditions that can be modulated by the SAM and the black carbon (BC) aerosol optical depth (AOD) in the WC. The WC has an air quality management plan with the goal of becoming the lowest carbon province in South Africa and a green economic hub on the African continent [
5]. Hence, the findings in this study will be useful to both policymakers and modelers of pollutant transport in the WC.
BC particles are generated from the incomplete combustion of fossil and biomass fuels. BC is a carbonaceous aerosol consisting of particulate matter and hence it is an air pollutant. This is a global environmental issue for two basic reasons: first, inhaling it can cause health issues [
6], and second, it can absorb light in the form of heat, and thus it is a forcing agent that can induce climate change [
7]. According to [
5], the WC accommodates 11.3% of South Africa’s population, and the growing population results in an increase in air pollutant emissions from vehicles, industry, wood burning, waste burning, vegetation fires, etc. The authors further note that in regions with poor atmospheric dispersion (e.g., Khayelitsha, located in the southwestern region of the WC), the austral winter presents a challenging situation with regard to maintaining the national ambient air quality standards. From the atmospheric point of view, high BC loading can be attributed to relatively stable and dry conditions during the austral winter, whereas rainy and windy weather favors the dispersion and dilution of air pollutants [
8].
Scales of atmospheric motion include macroscale, synoptic large-scale, mesoscale, and microscale phenomena. The macroscale involves changes in the planetary atmospheric composition that occur at timescales of weeks to months. The SAM is a hemispherical mode that can explain at least the weekly variance in atmospheric flow and can be characterized as a macroscale phenomenon with little forecasting capability for daily pollutant dispersion. However, its influence can be downscaled to the synoptic scale by examining how it modulates regional atmospheric circulation patterns [
3,
4]. Synoptic-scale phenomena are applicable for studying daily pollution transport and dilution. Thus, for a given period and region, they can be used to explain weather conditions and to issue forecasts several times a day. The CTs that result from the classification of synoptic patterns of atmospheric circulation can be downscaled further to analyze variations in atmospheric processes at a station (e.g., in [
9]). Thus, even though mesoscale and microscale processes can provide more detailed information on pollutant transport (e.g., at a point scale and at temporal resolutions of minutes to hours), the analysis of regional CTs can still be of benefit for the understanding of synoptic patterns of atmospheric circulation associated with pollutant transport in a given region.
In the regional context of South Africa, several studies have investigated pollutant transport and dilution. The authors of [
10] investigated the impact of climatic factors on temporal changes in atmospheric pollutant loading over Mpumalanga and KwaZulu-Natal provinces. They found that during the austral winter (JJA) and the austral spring (SON), BC and sulfur dioxide are the two major pollutants, due to sugarcane burning. The authors of [
11] analyzed the transport of PM10 (i.e., particulate matter with a diameter < 10 µm) from remote sources into Cape Town during high pollution episodes. They found that the transport of PM10 is triggered by a trough along the west coast and high pressure over the continent. The authors of [
12] studied the emission of sulfur and its transport over Cape Town. They found that extreme pollution events in Cape Town can be caused by stagnant flow conditions over the city. The authors of [
13,
14] studied the characterization and measurement of particulate matter and gaseous pollutants in South Africa. The authors of [
15] investigated the anthropogenic contribution to atmospheric black carbon concentrations in southern Africa using a regional model.
Given that atmospheric conditions linked to horizontal and vertical transport as well as rainfall formation represent critical meteorological factors that impact pollutant loading over parts of the WC, this study contributes to existing studies by examining how synoptic conditions related to the SAM impact the BC AOD over the WC. Thus, two basic hypotheses underlie this study: (1) the SAM modulates leading CTs over the study region [
3,
4] and (2) this represents a major driver of air quality in the WC province.
2. Data and Methodology
A previous study [
3], henceforth referred to as Ib, used ERA5 [
16] to classify the CTs in Africa south of the equator. The CT classification was performed using the fuzzy obliquely rotated T-mode (i.e., the variable is a time series and observations are grid points) principal component analysis (PCA) method [
17,
18]. The classification method results in a simplified time series. For each retained mode, the classification technique finds vector positions that maximize the number of hyperplane counts and simultaneously cluster the days with a similar spatial pattern. Thus, by introducing a threshold within the range of ±0.2–0.35 to separate the noise (i.e., loadings within the zero interval) from the signals [
19], each retained component forms two classes (opposing states of the same atmospheric mode), below and above the threshold.
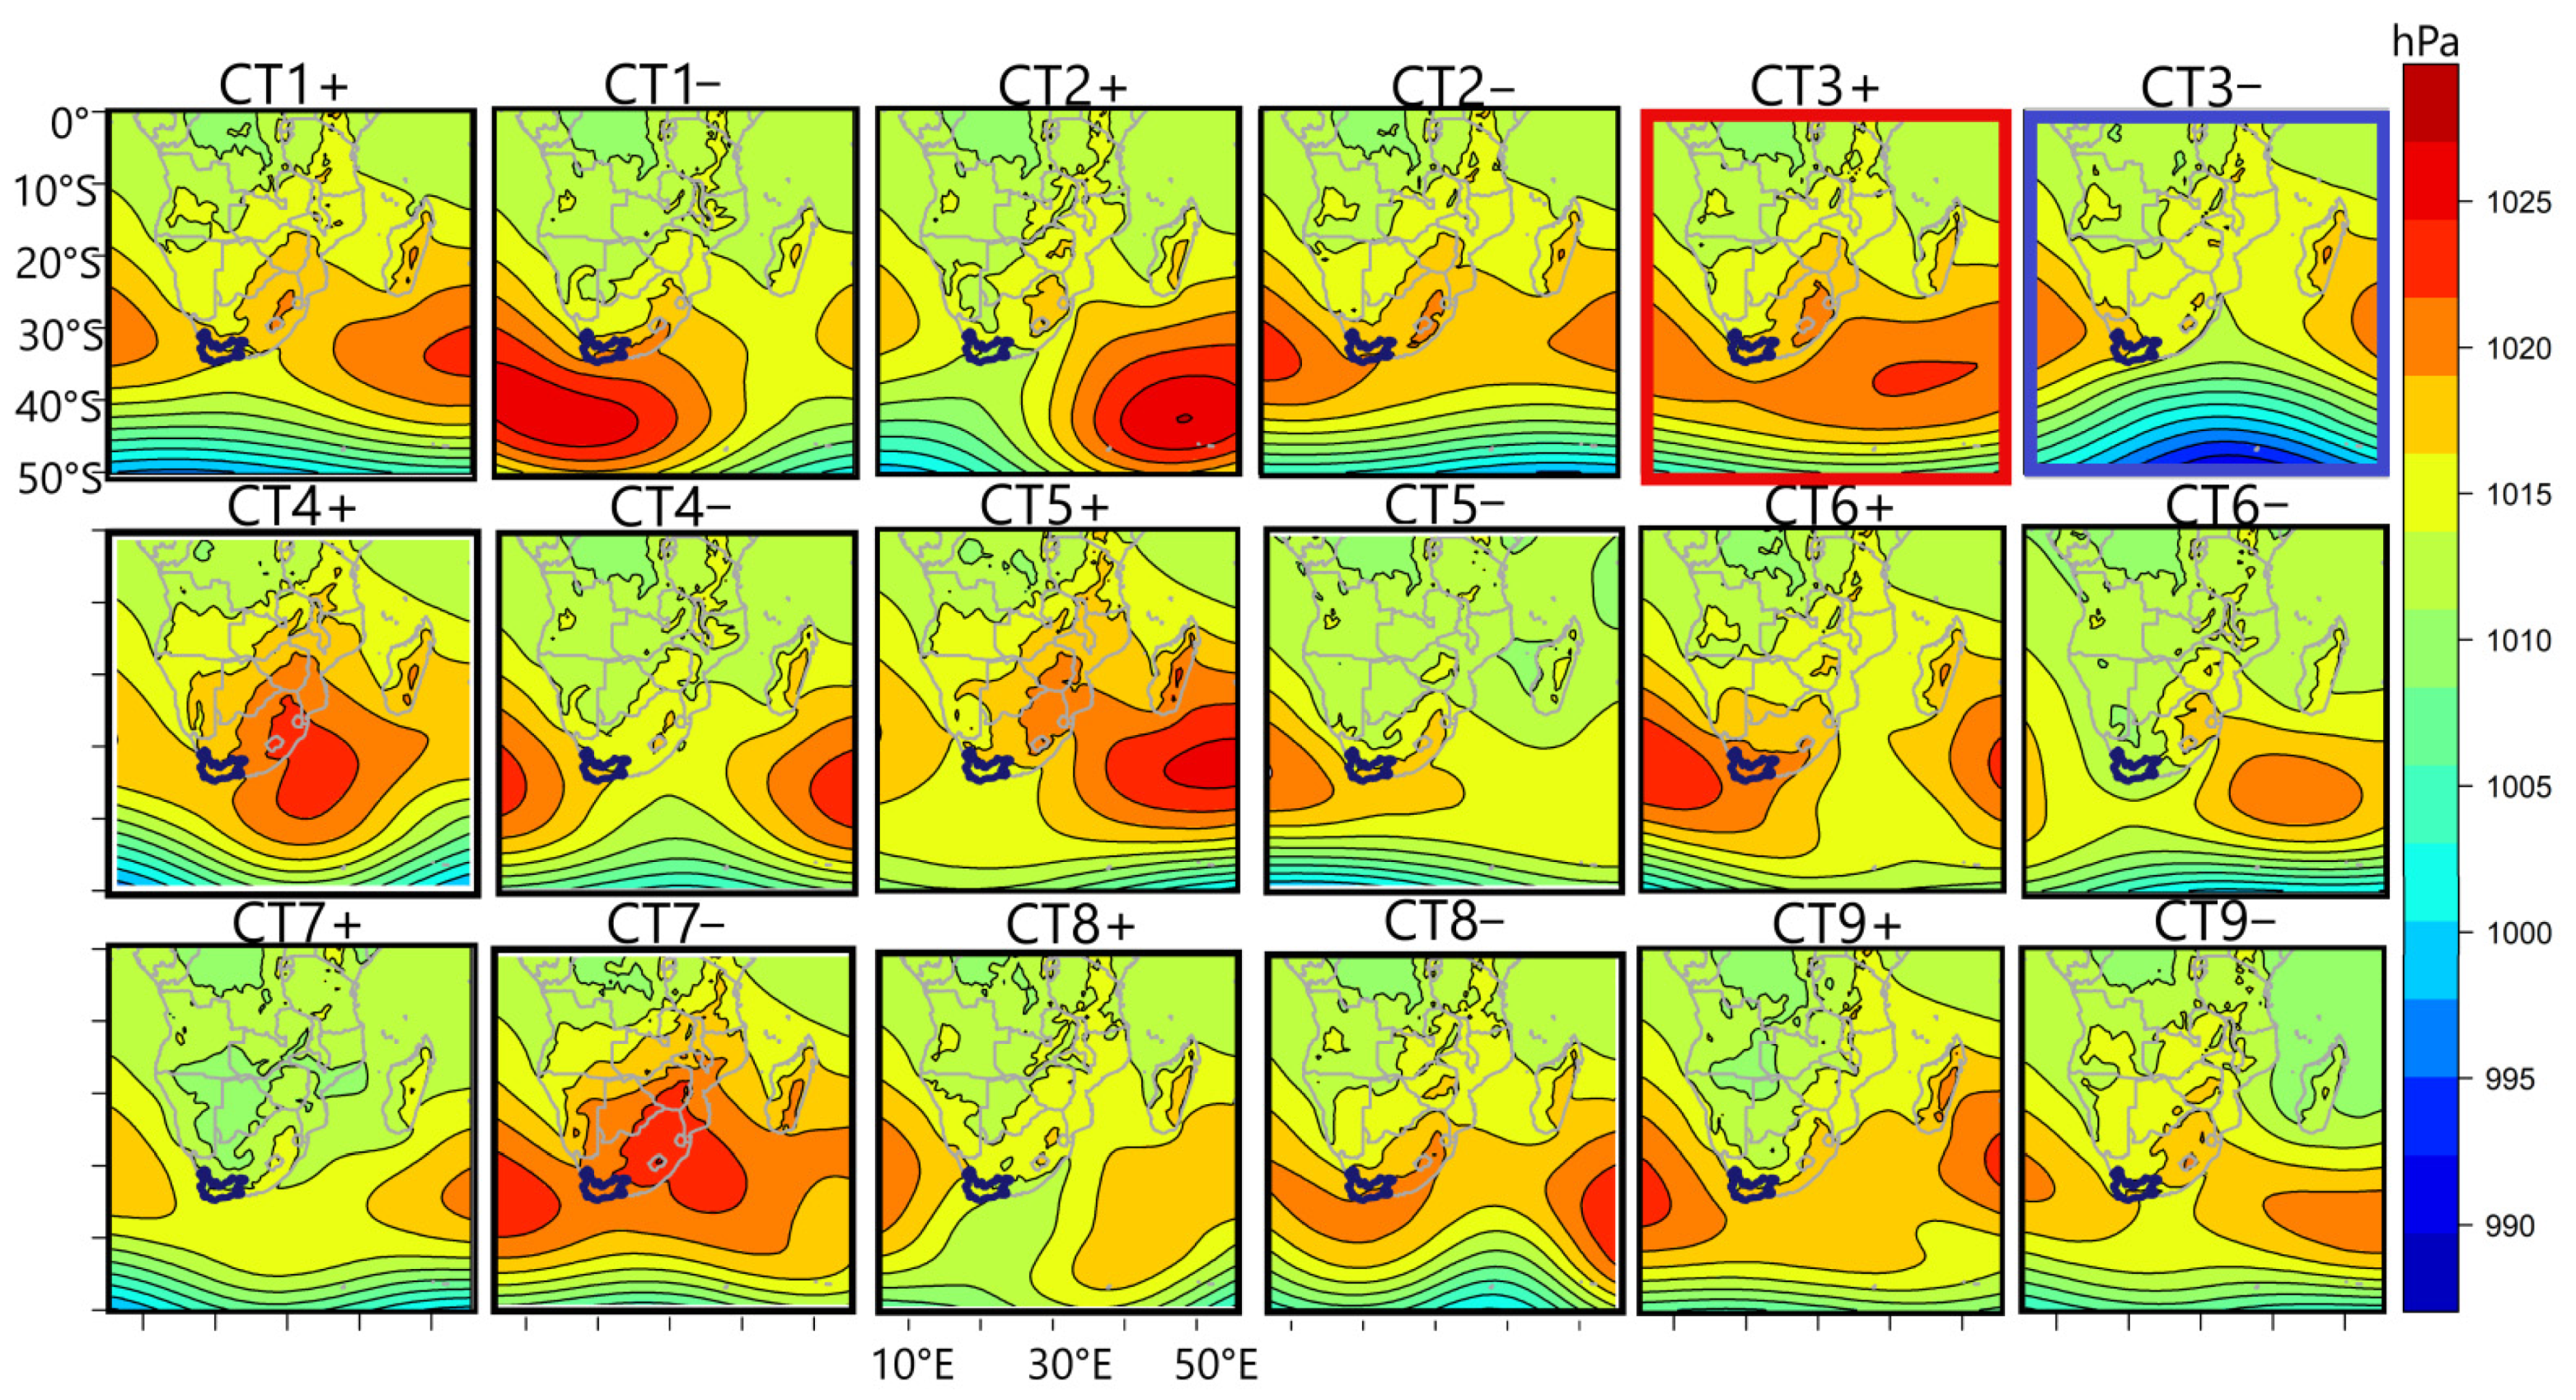
The CTs from Ib were further classified based on having a high probability of being associated with dry or wet events in the WC. The classified modes of variability linked to wet or dry events in the WC were related to the SAM phases, and changes in the frequencies of occurrence of the selected CTs modulated by the SAM were assessed under future climate change conditions using the SSP585 and RCP8.5 scenarios. The present study is an extension of Ib, dedicated to the role of the SAM-related CTs in aerosol loading and air quality in southwesternmost Africa. CT3+ (CT3−) (see
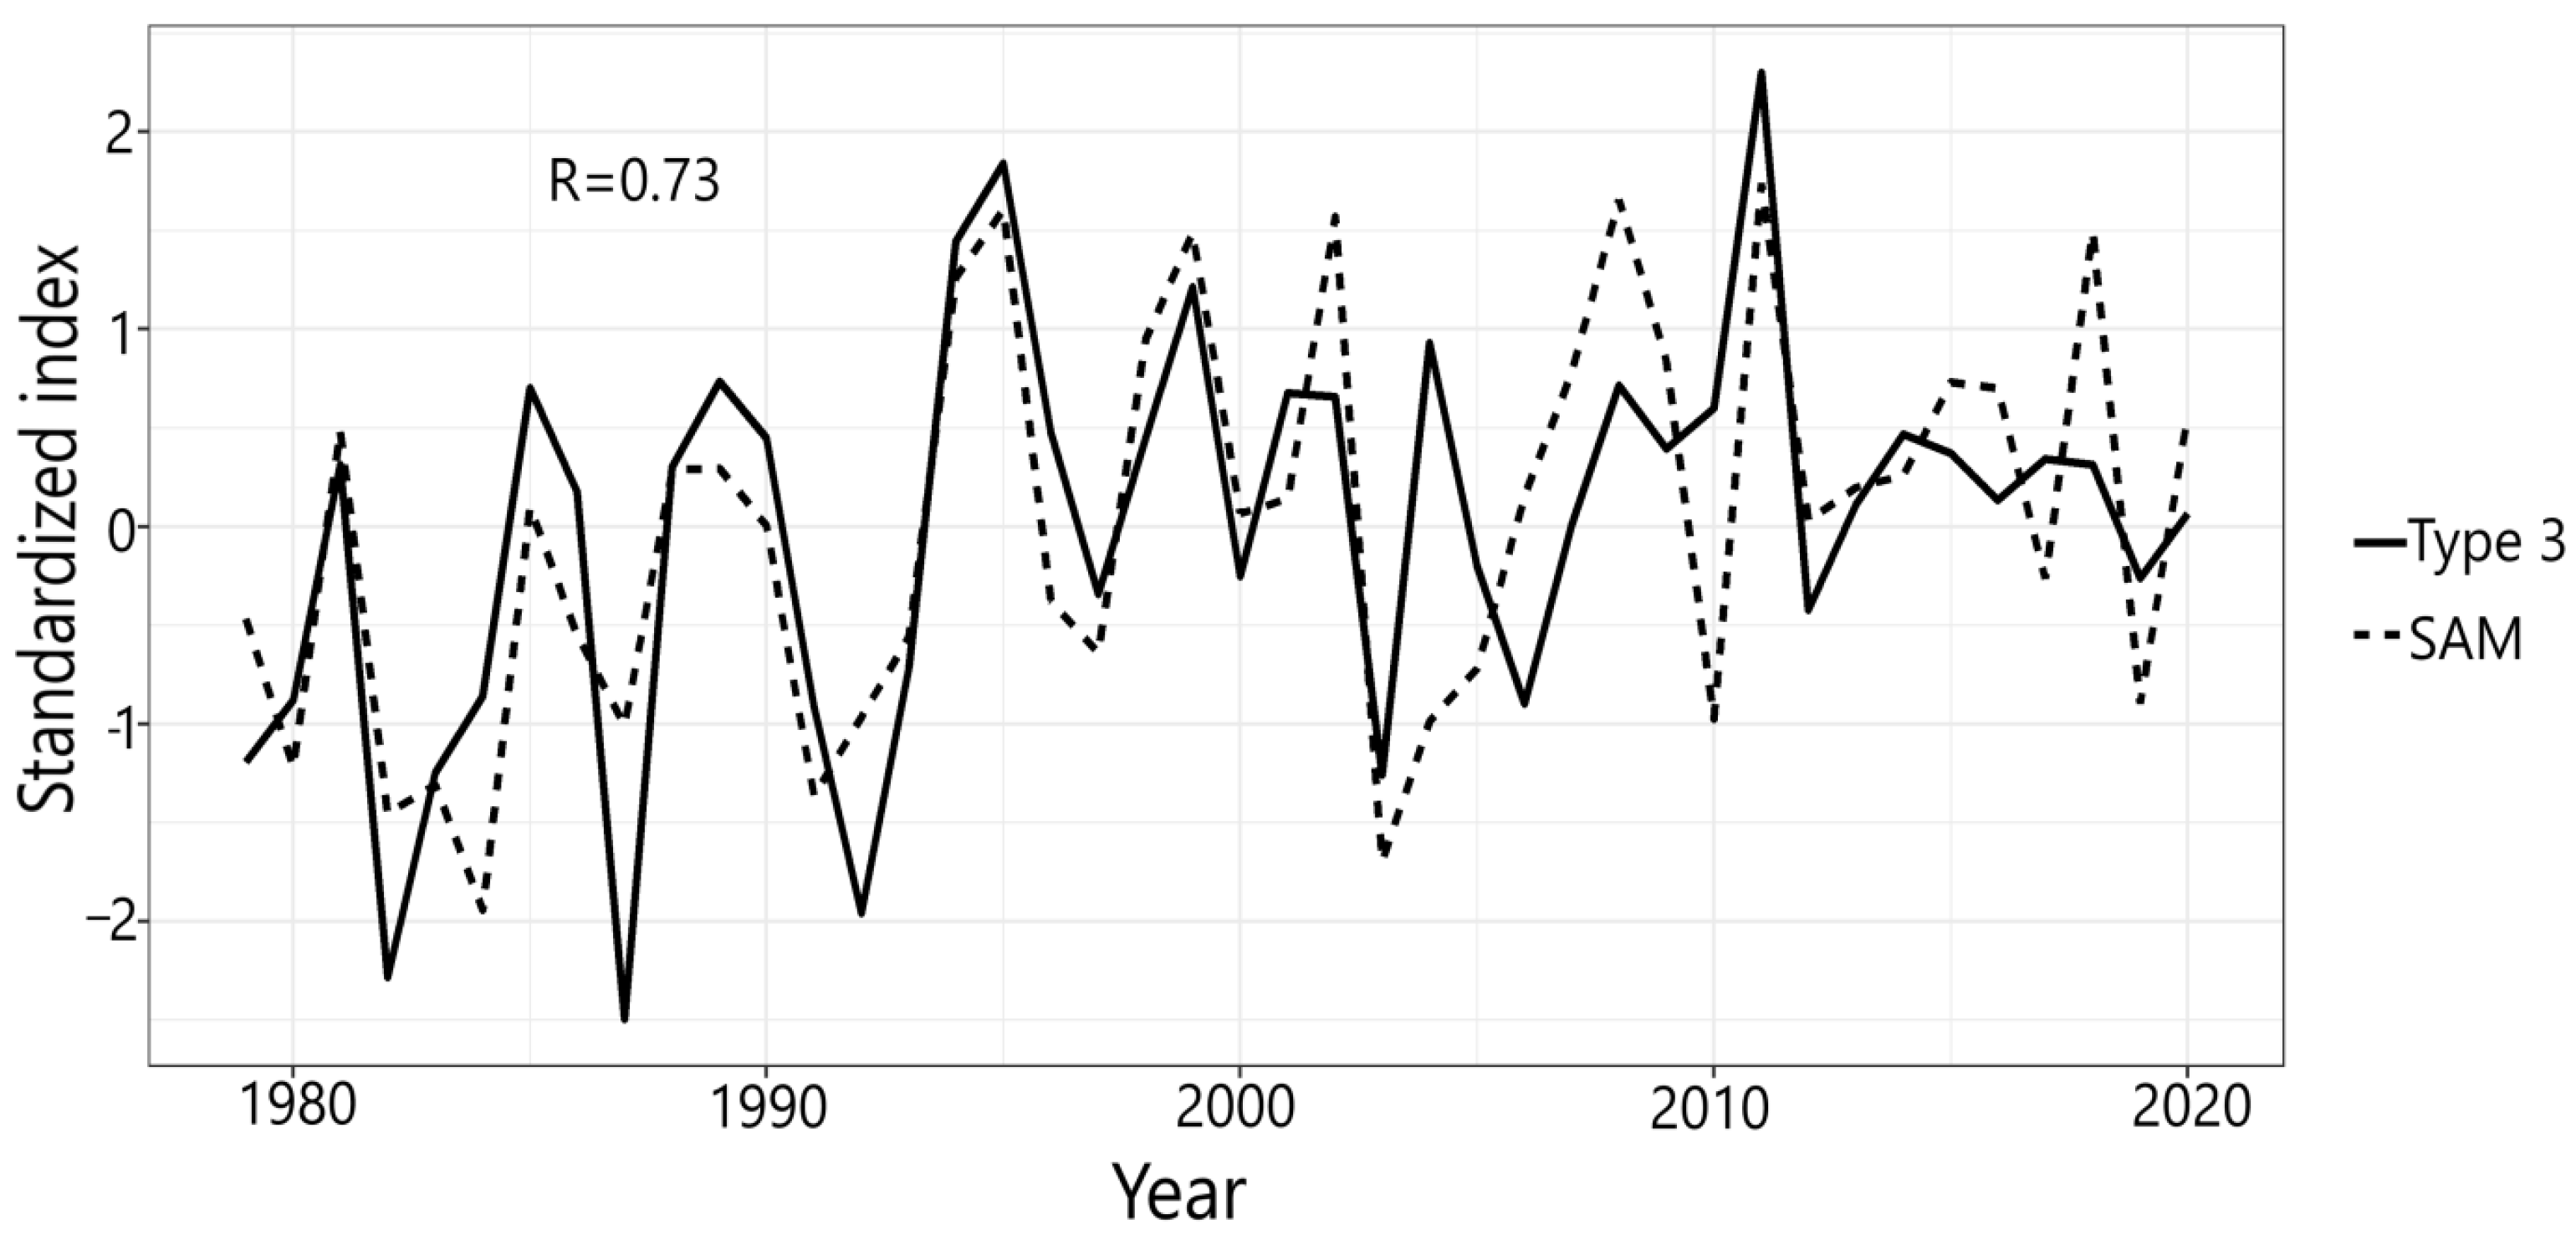
Figure A1) was found in Ib to be related to the positive (negative) phase of the SAM, and these are the CTs that are further analyzed in this study. Further seasonal decomposition of the relationship between the SAM and the type 3 CTs (i.e., CT3+/CT3−) showed a significant relationship in all seasons at a 0.05 error level. However, the relationship was strongest during the austral summer.
Figure A2 shows that during the austral summer, the SAM variations are well in phase with fluctuations in type 3 CTs (R = 0.73). The analysis in this work aims to uncover how the SAM, through the control of the CTs linked to it, can impact the BC AOD over southwesternmost Africa.
The ERA5 reanalysis product provided by the European Centre for Medium-Range Weather Forecasts (ECMWF) was used for the CT classification in Ib. For consistency, the BC AOD data used in this study were obtained from the ECMWF Atmospheric Composition Reanalysis 4 (EAC4). The EAC4 is the fourth-generation ECMWF global reanalysis of atmospheric composition. Through the principle of data assimilation, the ECA4 is based on the combination of model data with observations from all around the world, providing a globally complete and consistent data set. The atmospheric model used is based on the laws of physics and chemistry. Satellite instruments are used to measure radiation levels at the top of the atmosphere. Thus, the BC AOD of an atmospheric column can be calculated, providing information on the amount of BC aerosol in the atmospheric column. The major limitation of this procedure is that the satellite instrument can only detect aerosols in cloud-free conditions. This implies that the vertical distribution of the aerosols cannot be accurately quantified. During the data assimilation process, this shortcoming is addressed through the combination of satellite data and short-range forecasts. The data sets were available at a 3-hourly temporal resolution from 2003 to 2020 at the time of writing this article. Therefore, the BC AOD data were obtained for the aforementioned time frame. Daily averages were computed. The horizontal resolution was 0.75°. Horizontal and vertical wind velocity data sets at 850 hPa (i.e., the height above the interior plateau that covers most of South Africa) were also obtained from ERA5 for the 1979–2020 period used in the previous CT classification taken from Ib.
In seasons when CT3+ and CT3− occurred, composites of the BC AOD were calculated. The statistical relationships between the BC AOD and the frequencies of occurrence and amplitudes of CT3+ and CT3− were investigated using correlation analysis at a 95% confidence level. Since the sample size for the BC AOD data was limited (i.e., 18 years) Kendall’s Tau-b correlation coefficient was applied and tested for statistical significance. Ib reported a significant relationship between the SAM and the frequencies of occurrence and amplitudes of CT3+ and CT3−. Thus, the correlation in this work can be interpreted as a rough estimate of how the SAM impacts the BC AOD in the WC through governing the frequencies of occurrence and amplitudes of CT3+ and CT3−.
3. Results
Consistently with the studies in [
5,
10], it was found that when spatially averaged over the WC, the austral winter (JJA) and the austral spring (SON) had the highest BC AOD, while it was lowest during the austral summer (DJF) and autumn (MAM). During JJA (DJF), more stable (unstable) atmospheric conditions prevail in South Africa as the subtropical high-pressure system moves northward (southward) towards (away from) the southern African landmasses. The authors of [
20] noted that during JJA, large-scale biomass burning contributes to high air pollutant concentrations in southern Africa. Other pollutant sources during JJA include domestic cooking and heating [
21].
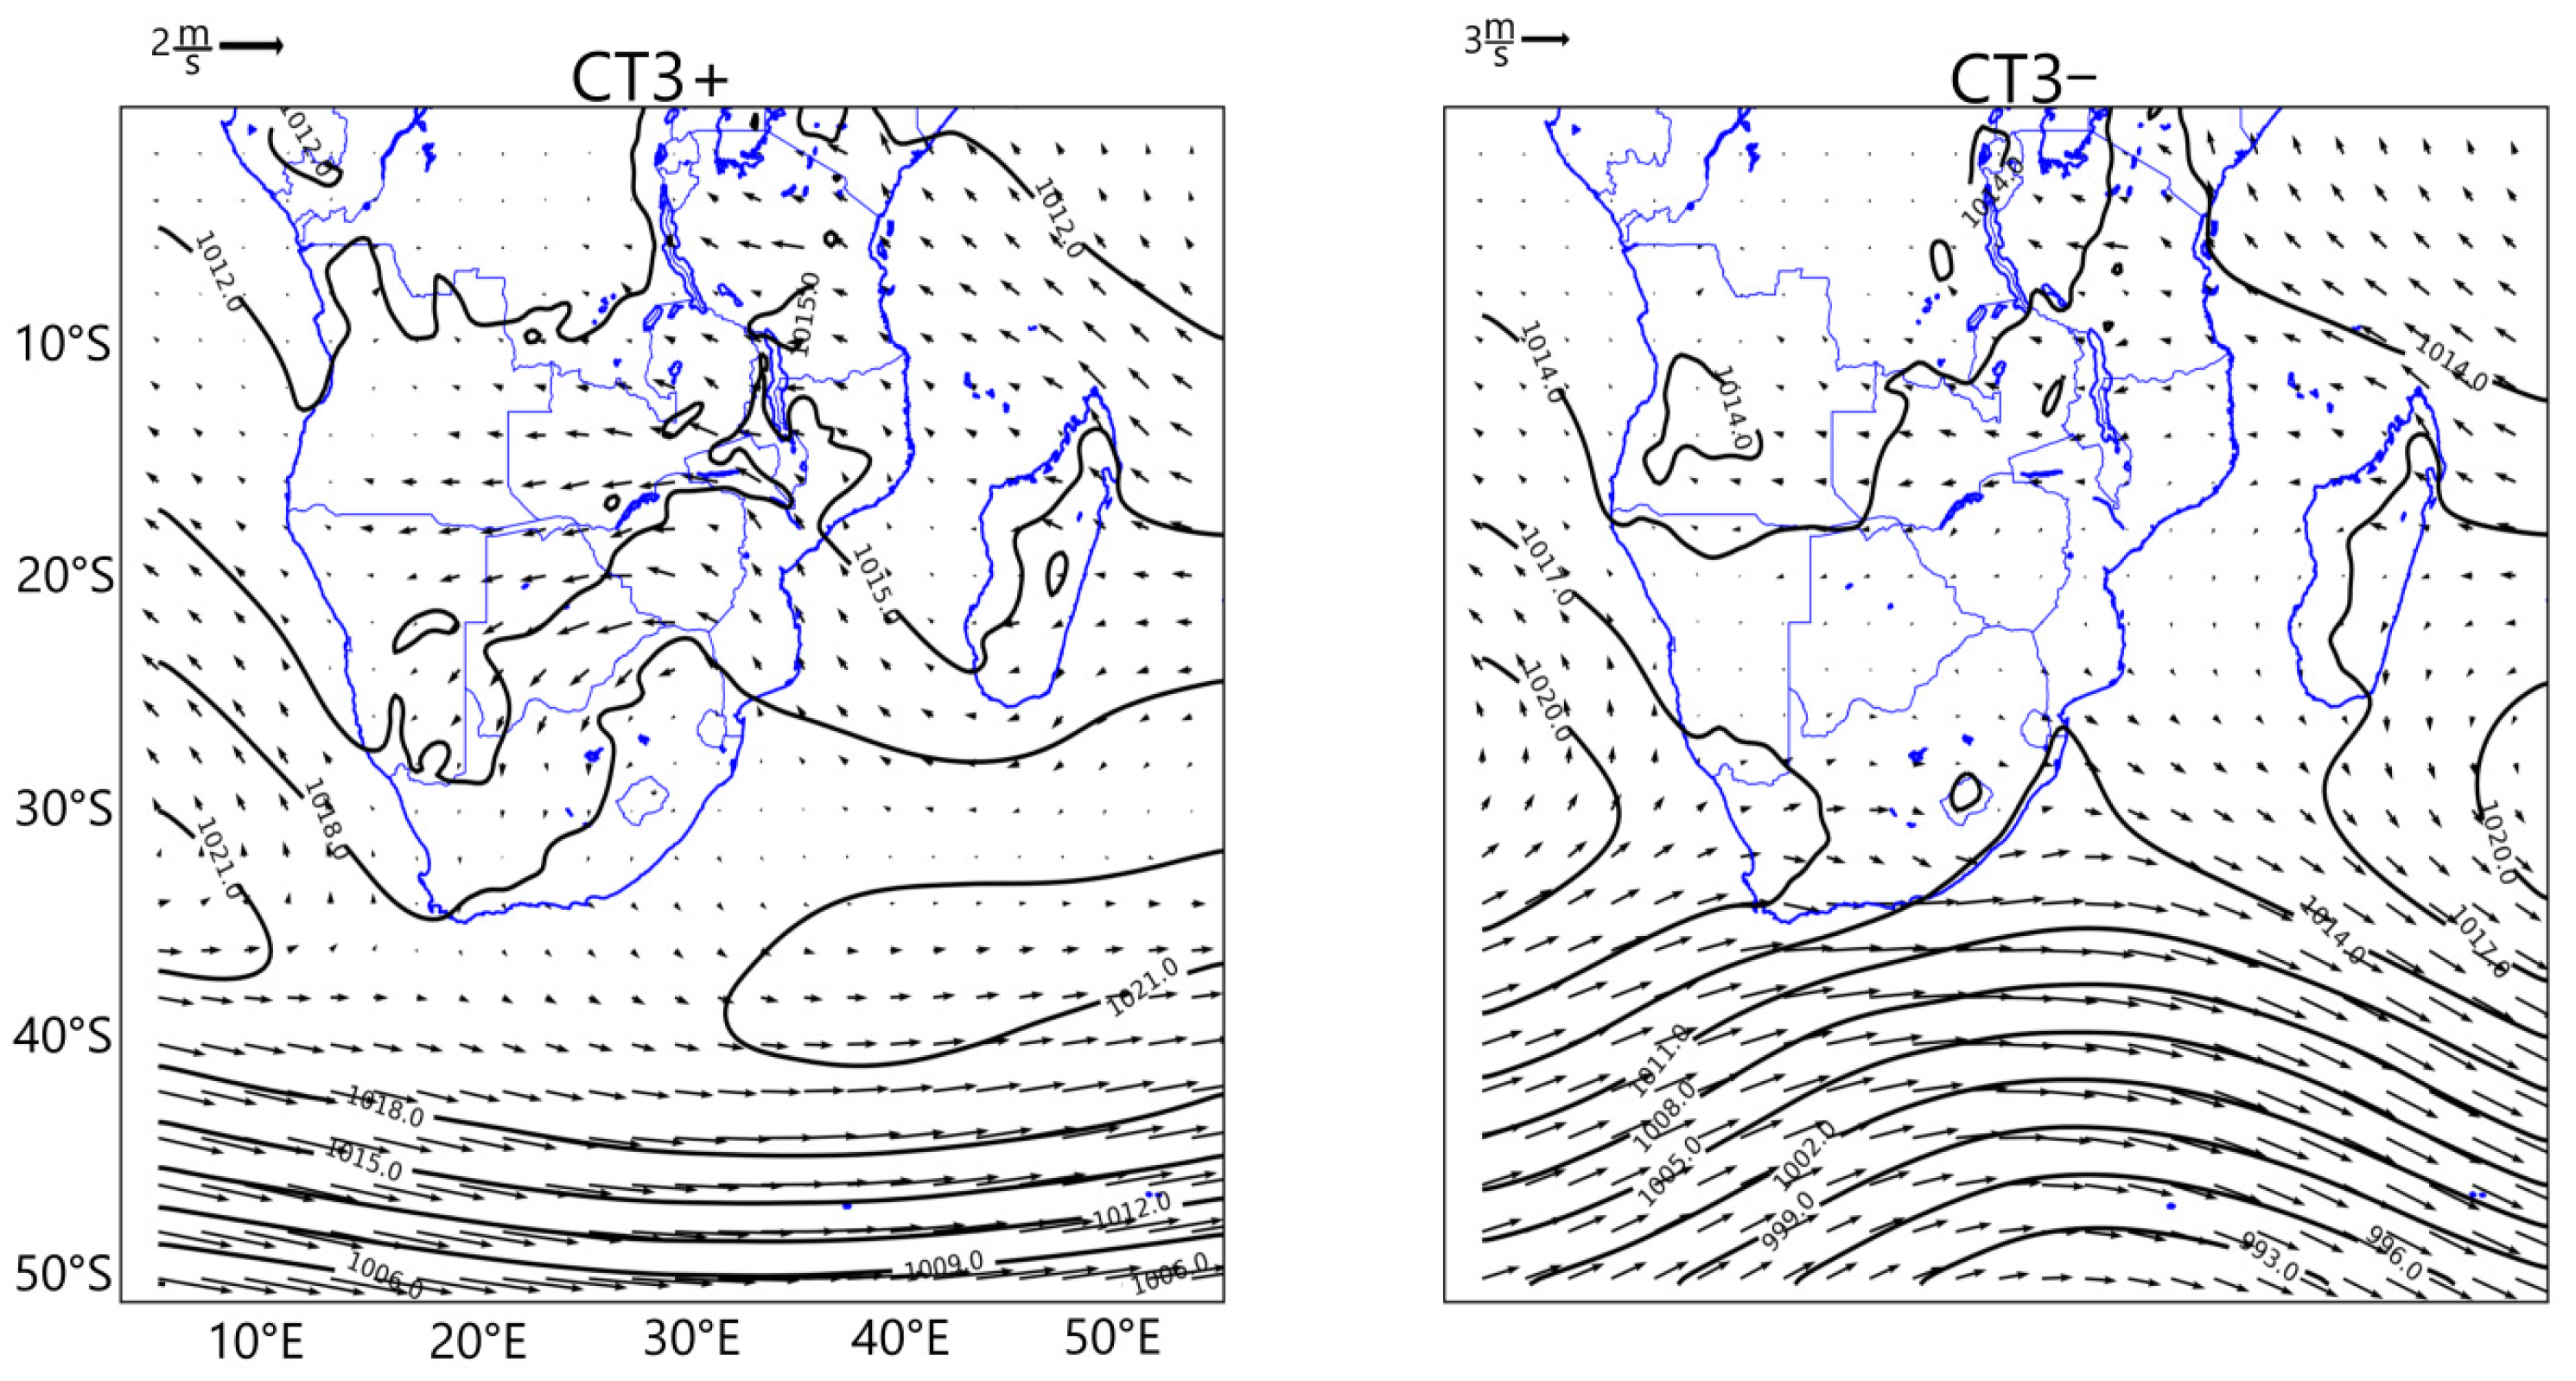
Figure 1 shows the two CTs related to the SAM, as reported in Ib. CT3+ is related to the positive SAM phase and CT3− to the negative SAM phase. During times when CT3+ (CT3−) occurs, the storm track of mid-latitude cyclones is located more towards the south (north) and light (strong) westerly winds are evident over the WC. The mean horizontal wind speed in the WC for CT3+ (CT3−) is 2.3 m/s (4.5 m/s). In addition, for CT3+, the South Atlantic Ocean high-pressure system is more prevalent, causing weak offshore winds, whereas CT3– is associated with strong onshore winds that lead to AOD dispersion along the coasts.
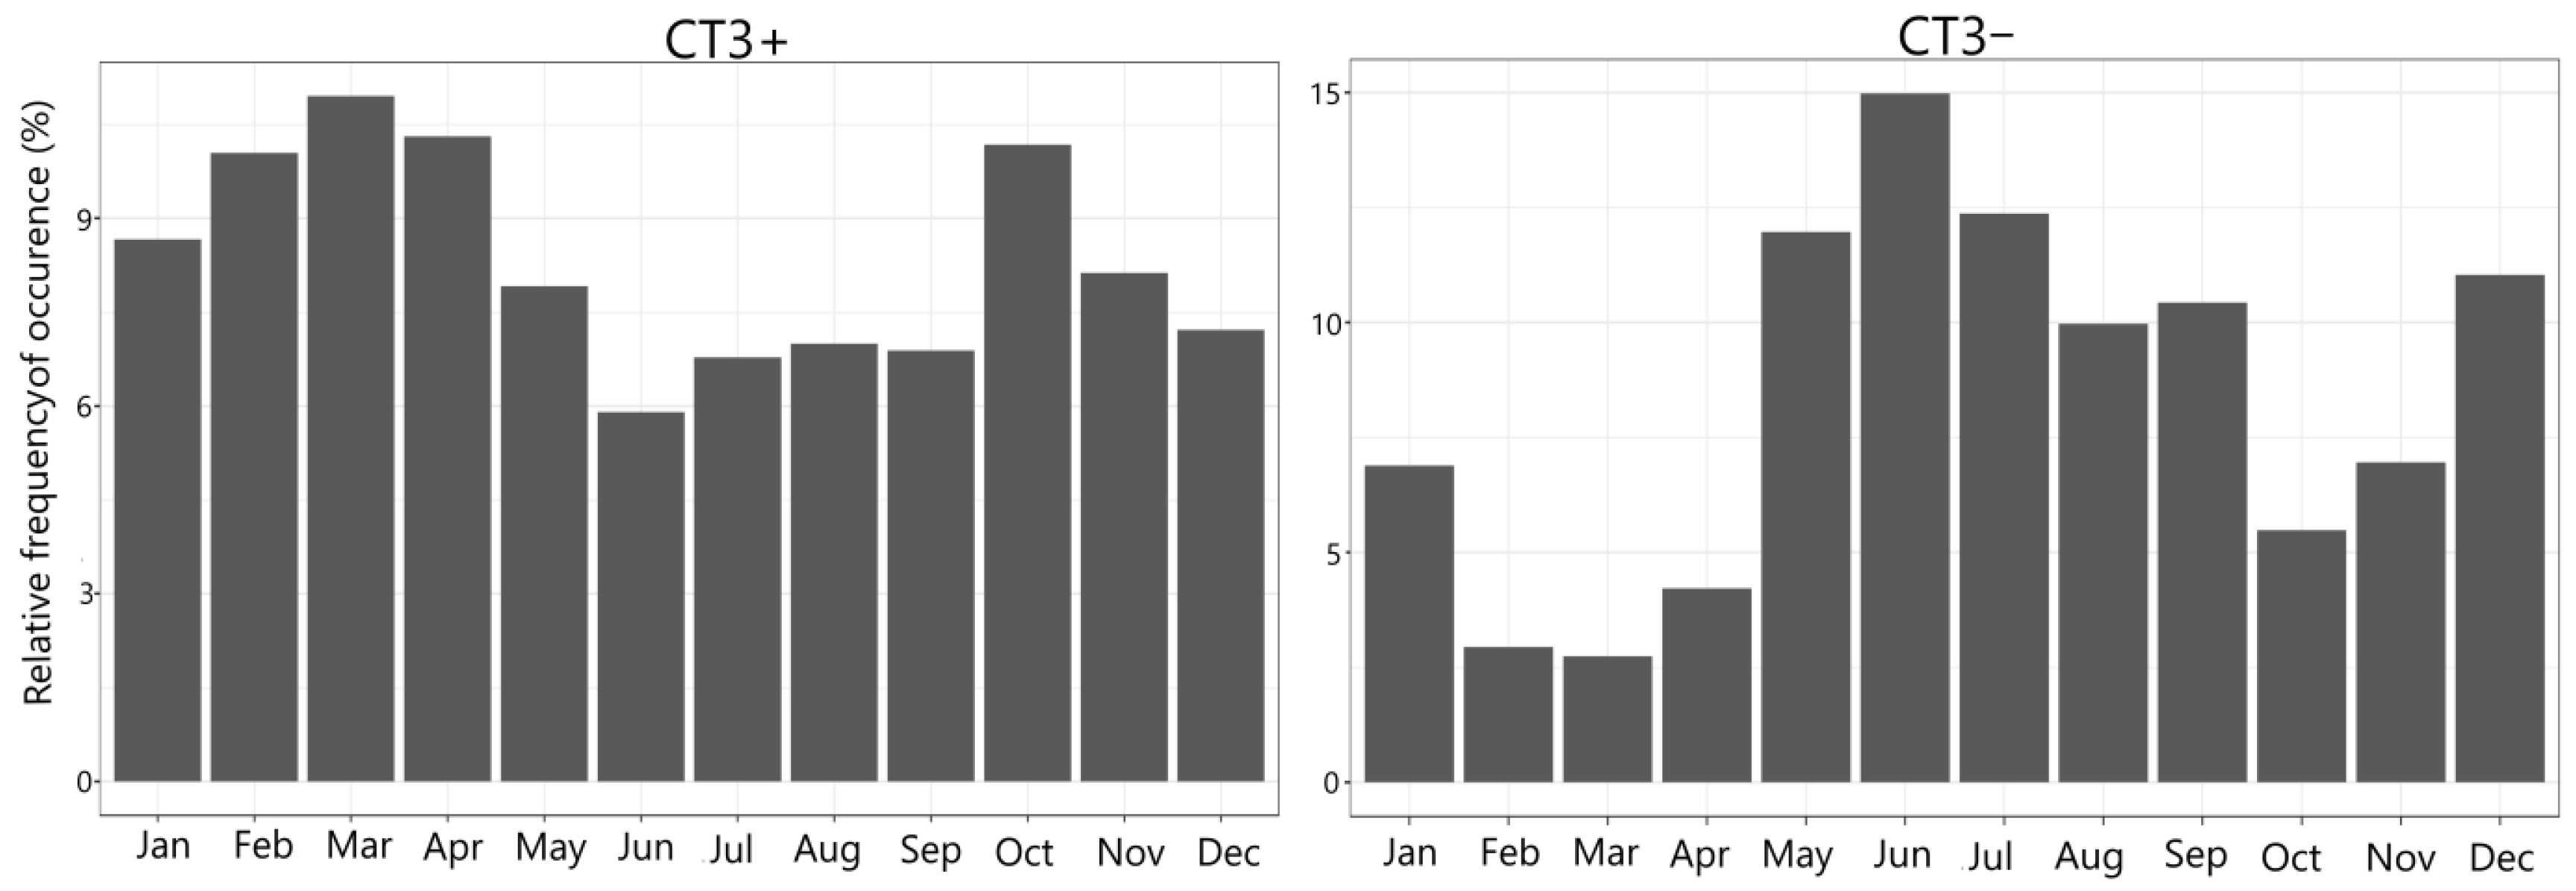
Although the CTs are continuous and can occur at any time of the year,
Figure 2 shows the annual cycle for CT3+ and CT3−. The dominant periods of each of the CTs are when they are likely to persist for a longer time so that their atmospheric signals can be represented in the local climate.
CT3+ is the more dominant pattern during all seasons except for May to September, when CT3− is relatively more dominant. On average, during the late austral autumn to early austral spring, the subtropical anticyclone is located more towards the north. Blocking of the mid-latitude cyclones south of South Africa is diminished, allowing the polar fronts to track further north. These create the atmospheric conditions suitable for the synoptic state of CT3− (
Figure 1). On average, during the late austral spring to early autumn seasons, the reverse conditions occur. The mid-latitude cyclone is further blocked by the subtropical anticyclone that shifts more towards the south during this period, creating the necessary atmospheric conditions suitable for the synoptic state of CT3+.
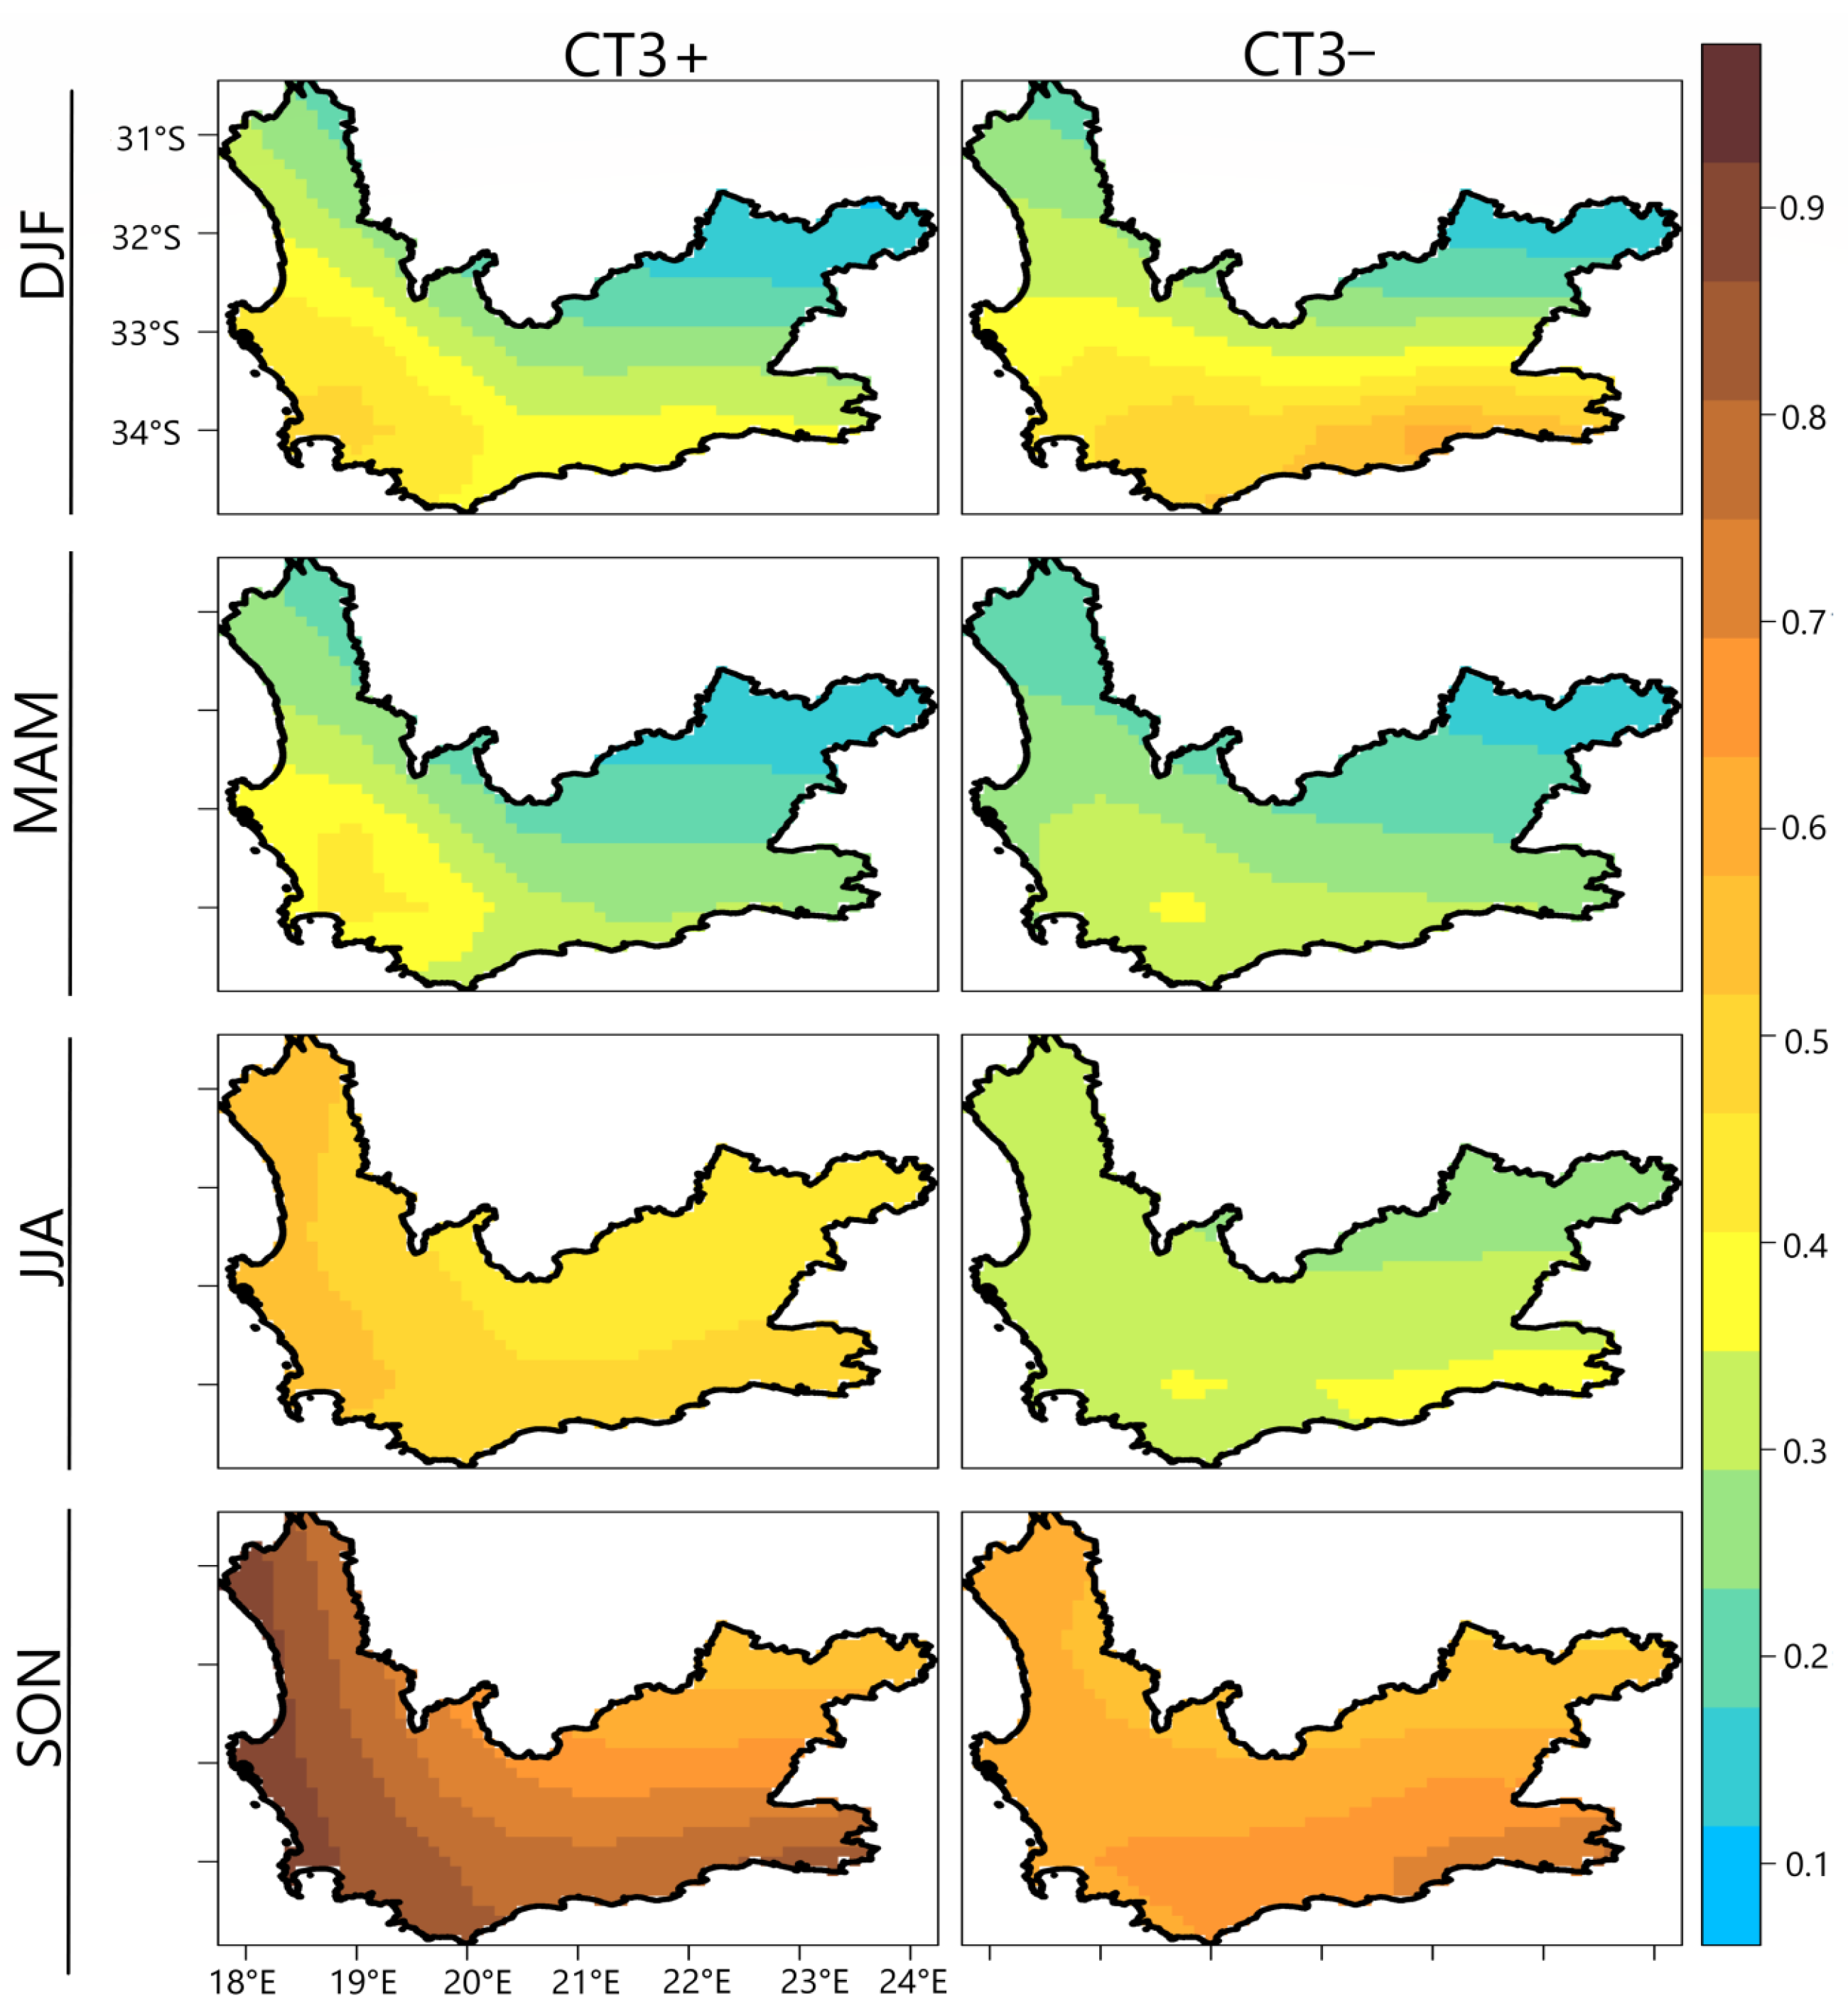
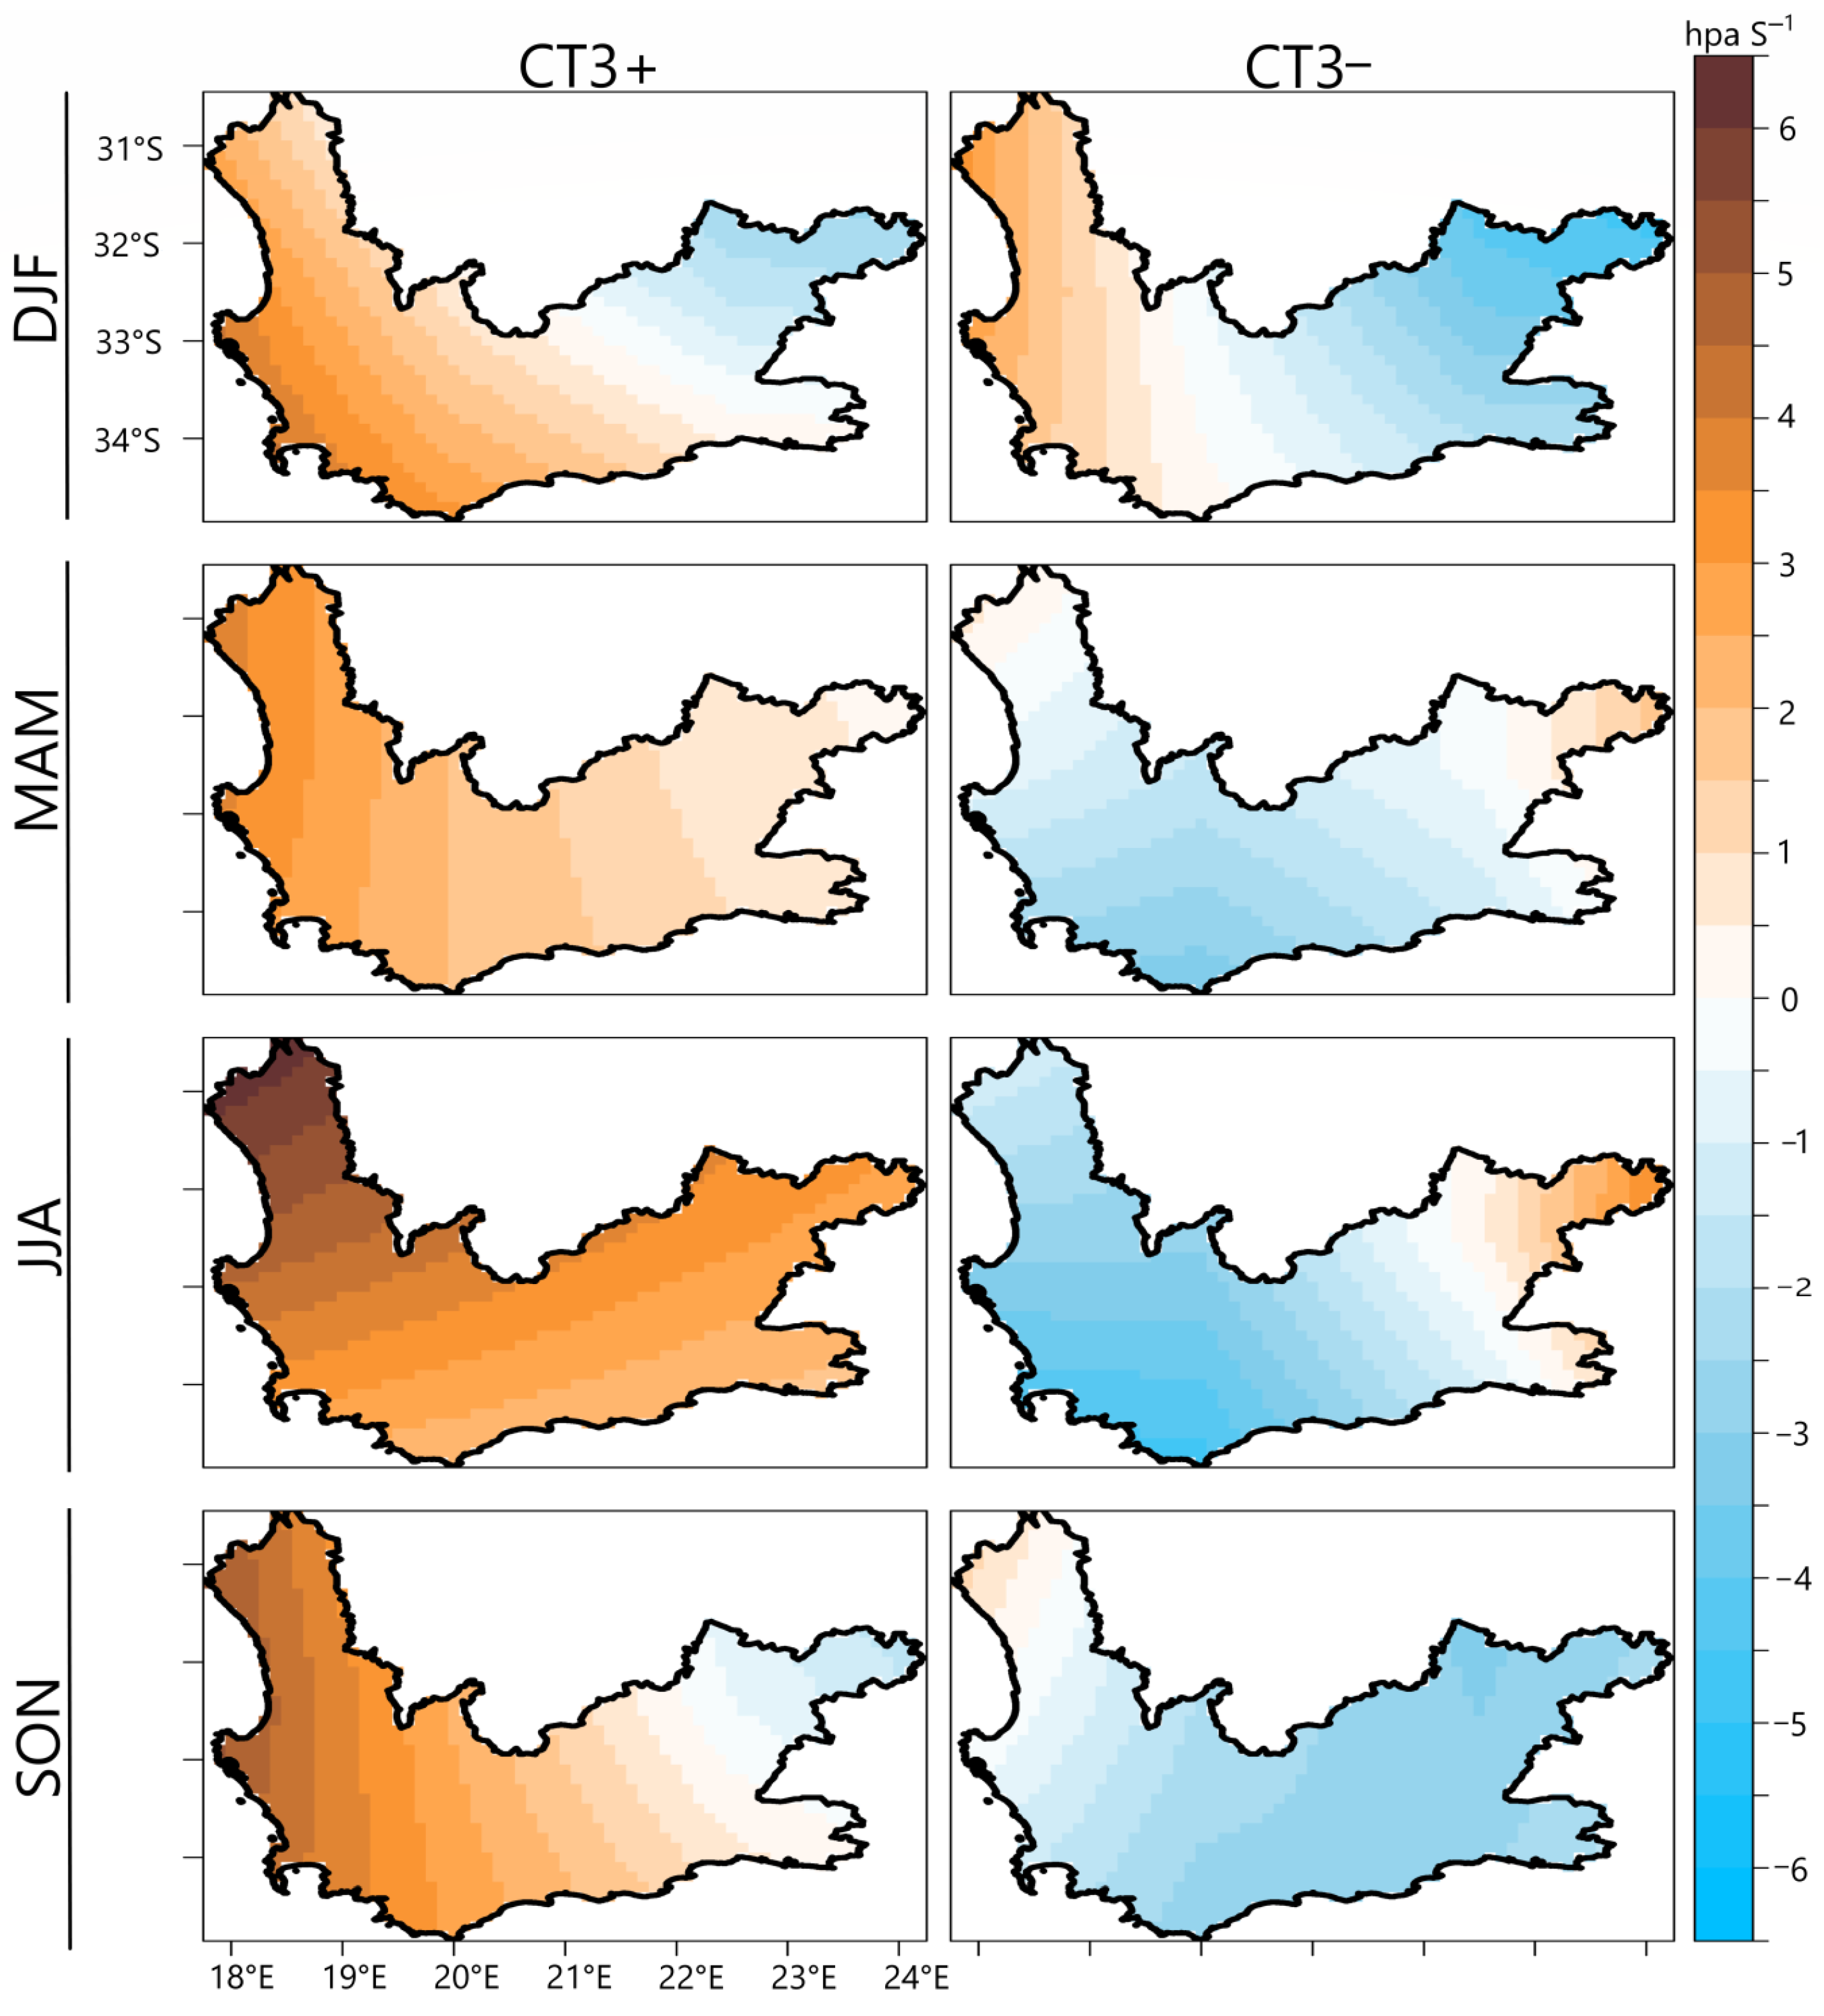
Figure 3 shows the seasonal spatial average of the BC AOD in the WC, during the active periods of CT3+ and CT3−, and
Figure 4 shows the seasonal 850 hPa vertical wind velocity composites for CT3+ and CT3−. Under CT3+ conditions, the southwestern and western parts of the study region are characterized by a higher BC AOD. Due to the proximity of the western regions of the WC to the cold Benguela current, the atmospheric stability is enhanced, favoring a higher AOD.
In all seasons except for DJF, the BC AOD is significantly higher for CT3+ compared to CT3− (
Figure 3). In addition, a positive vertical velocity (i.e., a downward motion/stable atmosphere) is more evident for CT3+ in the western and southwestern parts of the WC province (
Figure 4). For CT3− in JJA and MAM, a negative vertical velocity (i.e., an upward motion/unstable atmosphere) prevails over the WC, especially in the southwestern part, where a Mediterranean type of climate is assigned. The unstable conditions over the southwestern region that are strongest during JJA result from cold fronts that penetrate the region, leading to vertical mixing, rainfall, and a decrease in the BC AOD. Moreover, Ib reported that CT3− is associated with above-average rainfall over the western and southwestern parts of the WC. Hence, (i) the strong westerly winds, (ii) the unstable atmosphere, and (iii) the above-average rainfall (that can wash out atmospheric pollutants) represent the atmospheric processes through which CT3− tends to disperse and dilute BC (
Figure 3). The reverse conditions hold for CT3+. The results are in agreement with [
11] that states extreme pollution events in Cape Town can be caused by stagnant flow conditions over the city.
During DJF, neither a lower BC AOD nor an unstable atmosphere occurs in the southwestern region under CT3− (
Figure 3, top panels). A possible explanation is that the summer climate in South Africa does not favor the synoptic state of CT3− but buffers it. Thus, even when CT3− occurs, it is less likely that its signal will be manifest in the local climate of the WC.
Figure 3 and
Figure 4 show that MAM and JJA are the seasons when BC dispersion and dilution under CT3− are likely to be active over parts of the WC. The BC AOD is highest during SON, though relatively lower under CT3− because, according to
Figure 2, CT3+ is more dominant from October to November, favoring a higher BC AOD over the entire study domain.
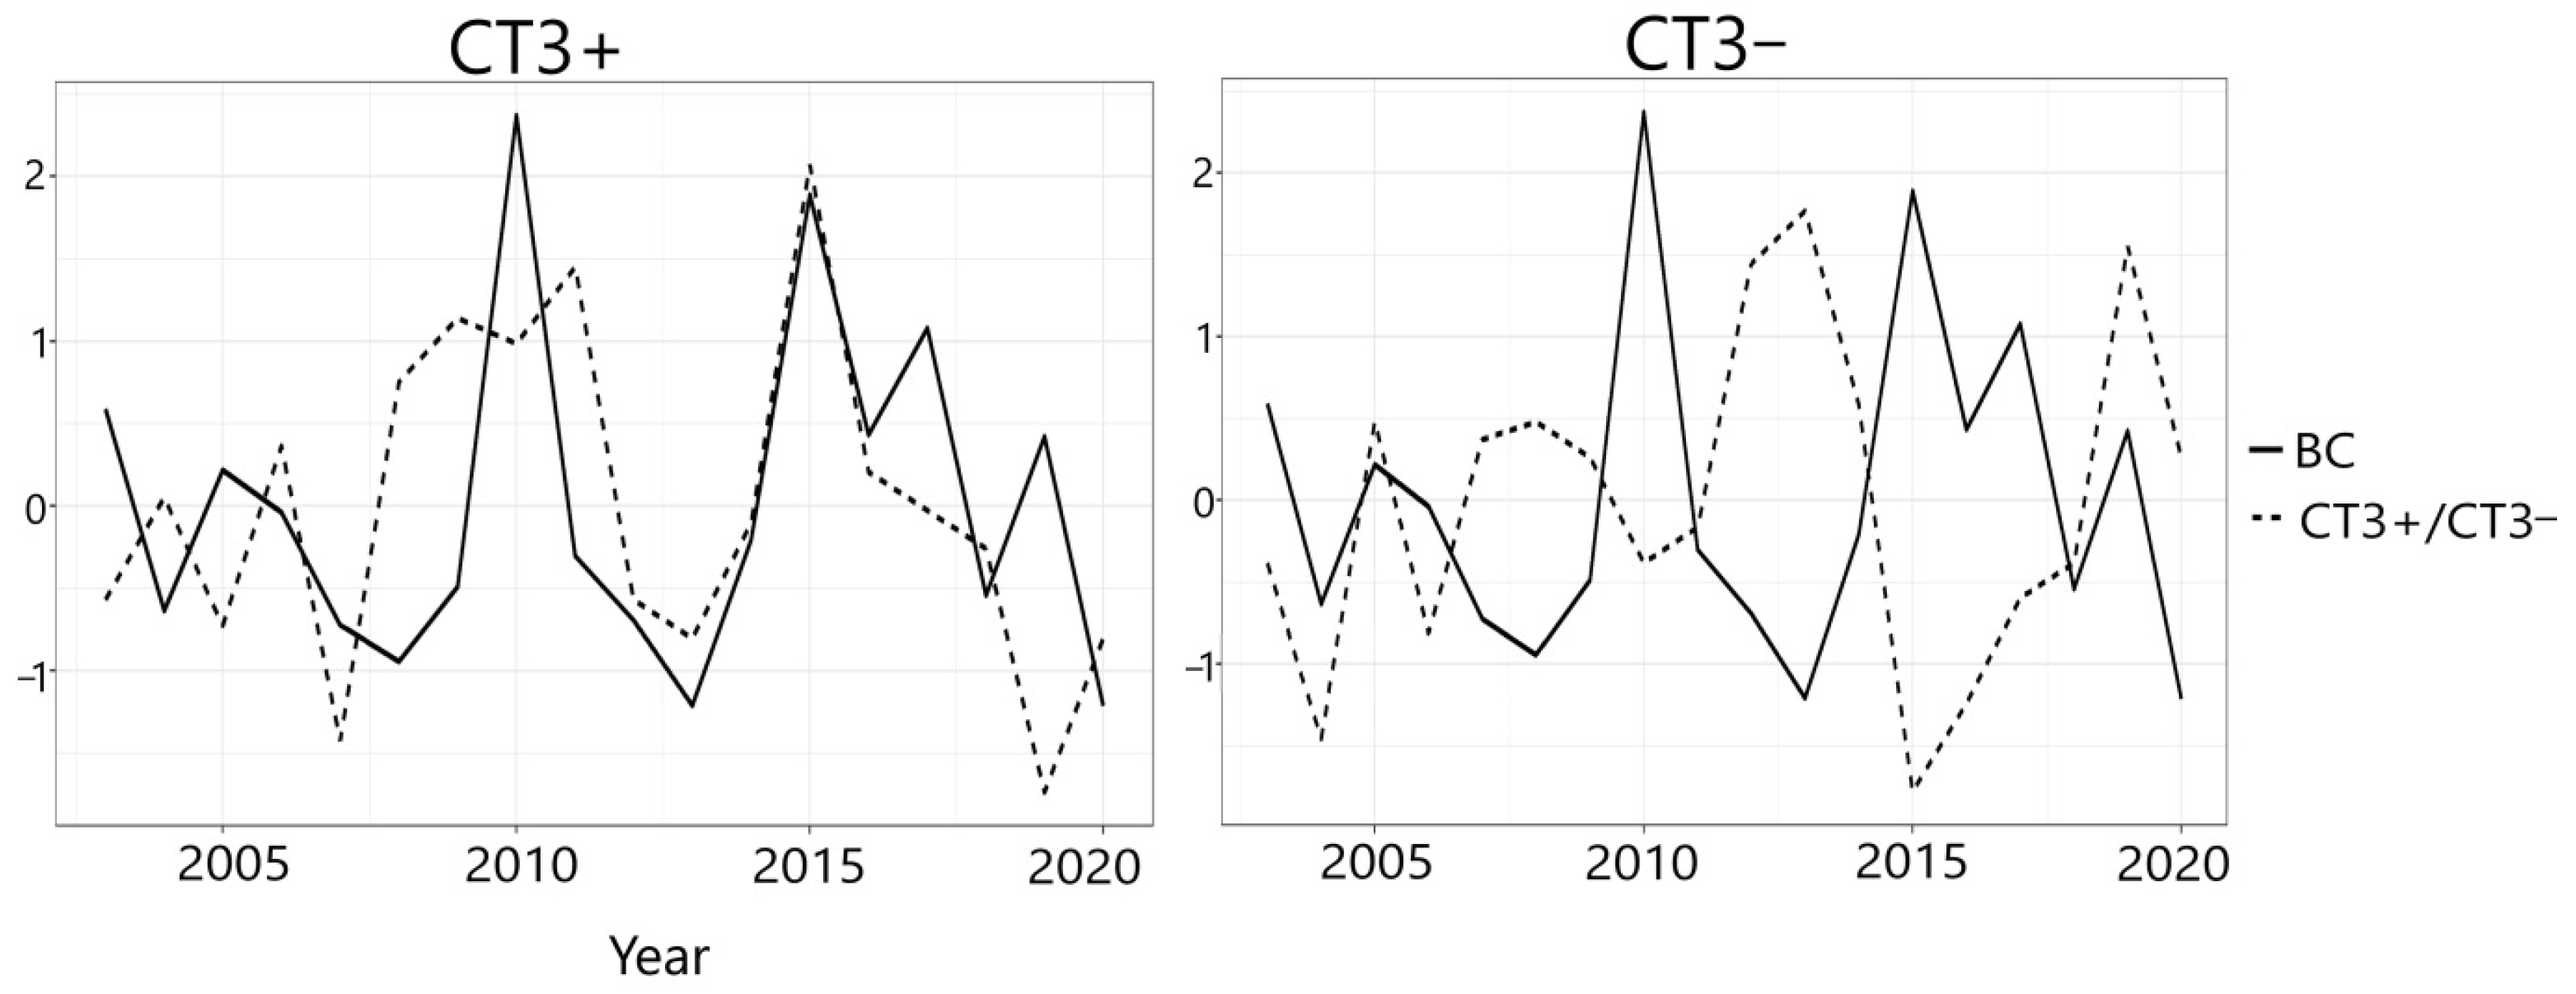
Figure 5 shows the time series of the BC AOD averaged over the WC and the frequencies of occurrence of CT3+ and CT3−. According to the findings described above, a statistically significant positive correlation (R = 0.25) and a negative correlation (R = −0.31) are found between the annual mean BC AOD and the annual occurrences of CT3+ and CT3−, respectively. This implies that years with an above-average frequency of CT3− (CT3+) can be associated with below-average (above-average) values of the BC AOD over the WC. Since CT3+ and CT3− are opposing states of the same atmospheric mode, they are characterized by different patterns and have opposing relationships with the BC AOD.
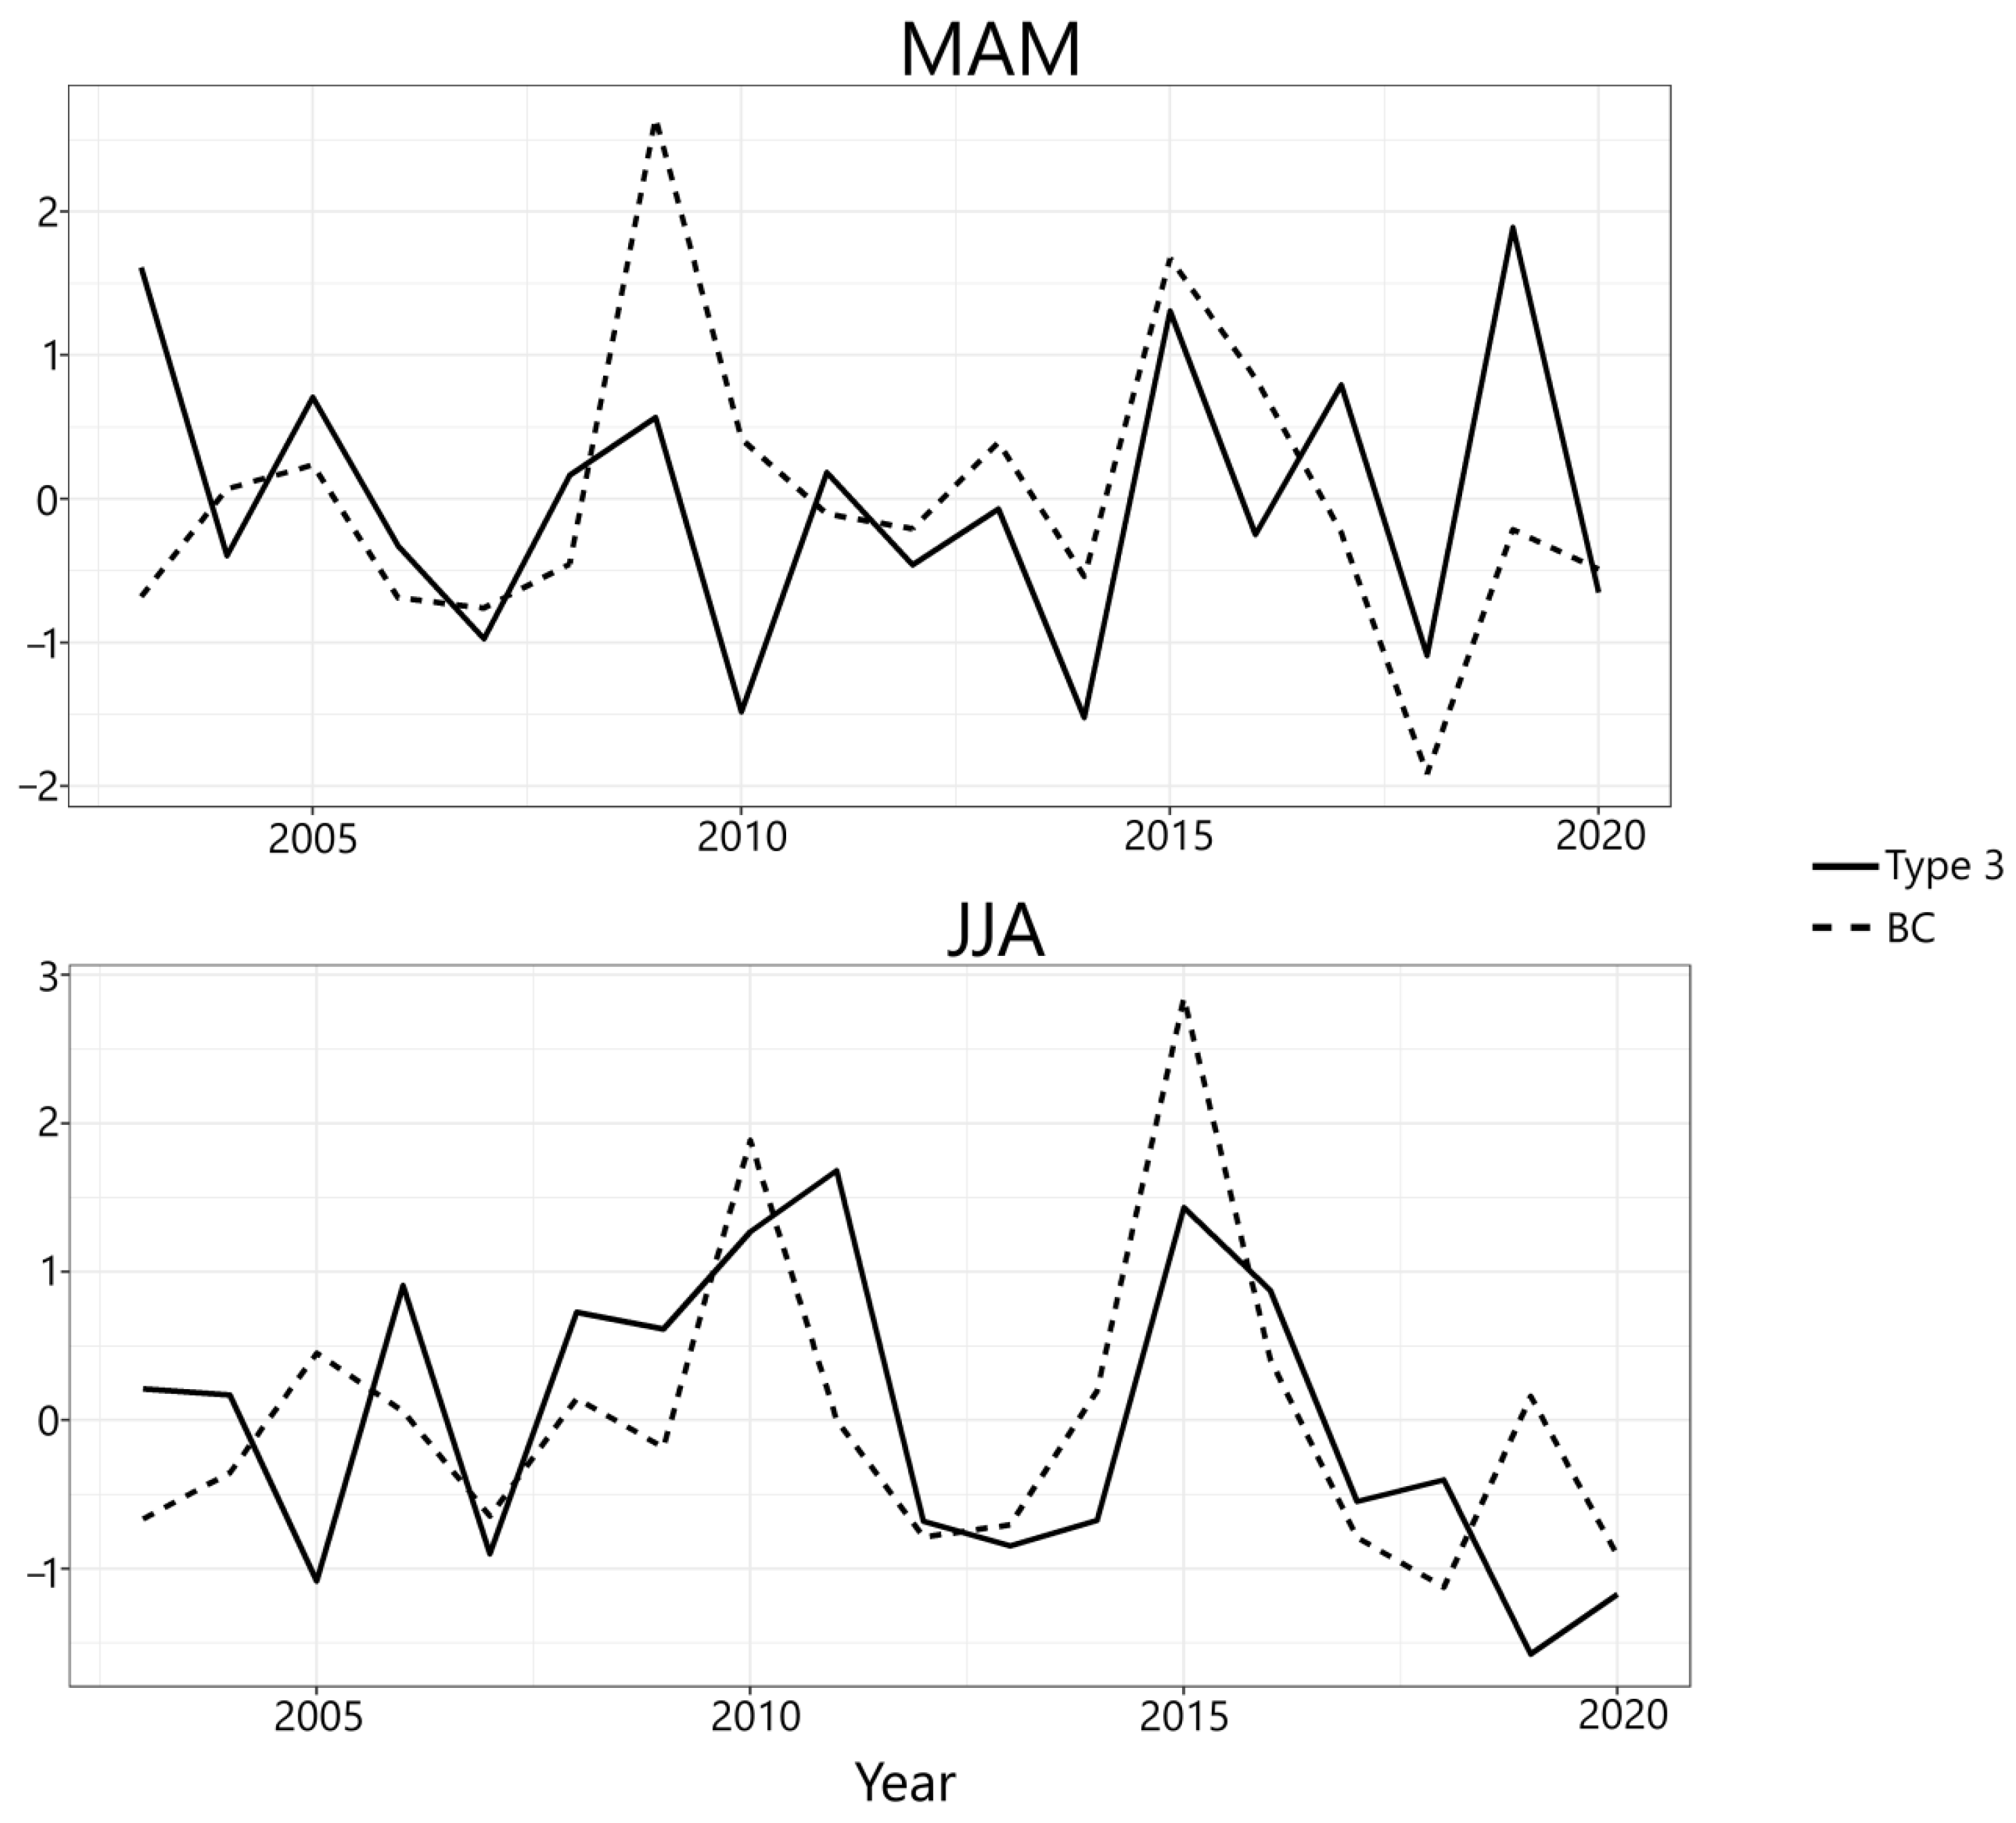
During MAM and JJA, a significant correlation was also found between the amplitude of the type 3 (summarizing CT3+ and CT3−) conditions and the seasonal mean MAM and JJA BC AOD averaged over the WC. Note that in this case, the CT time series refers to the loadings from the respective eigenvectors of type 3 CTs, whereas the CT time series in
Figure 5 denotes the counting statistics for CT3+ and CT3− events, respectively, as opposing states of the same atmospheric mode. The time series of the BC AOD and the loadings of type 3 CTs are shown in
Figure 6. The correlation coefficient is 0.24 during MAM and 0.31 during JJA. The relationship is strongest during JJA. No significant correlation was found for the other seasons. The results imply that when CT3+ (CT3−) occurs during MAM or JJA, above-average (below-average) BC AOD values can be expected over the WC.
4. Discussion
Ib reported that the frequency of CT3+ (CT3) is expected to increase (decrease) under global warming, in line with the projected SAM shift towards the positive phase [
22,
23]. Thus, an implication of the results of this study pertains to the need for limiting local aerosol emission, especially in the western and southwestern parts of the WC province. A shift towards the positive polarity of the SAM implies more stable atmospheric conditions and weak horizontal and vertical mixing that may lead to higher pollutant concentrations from low-level emission sources [
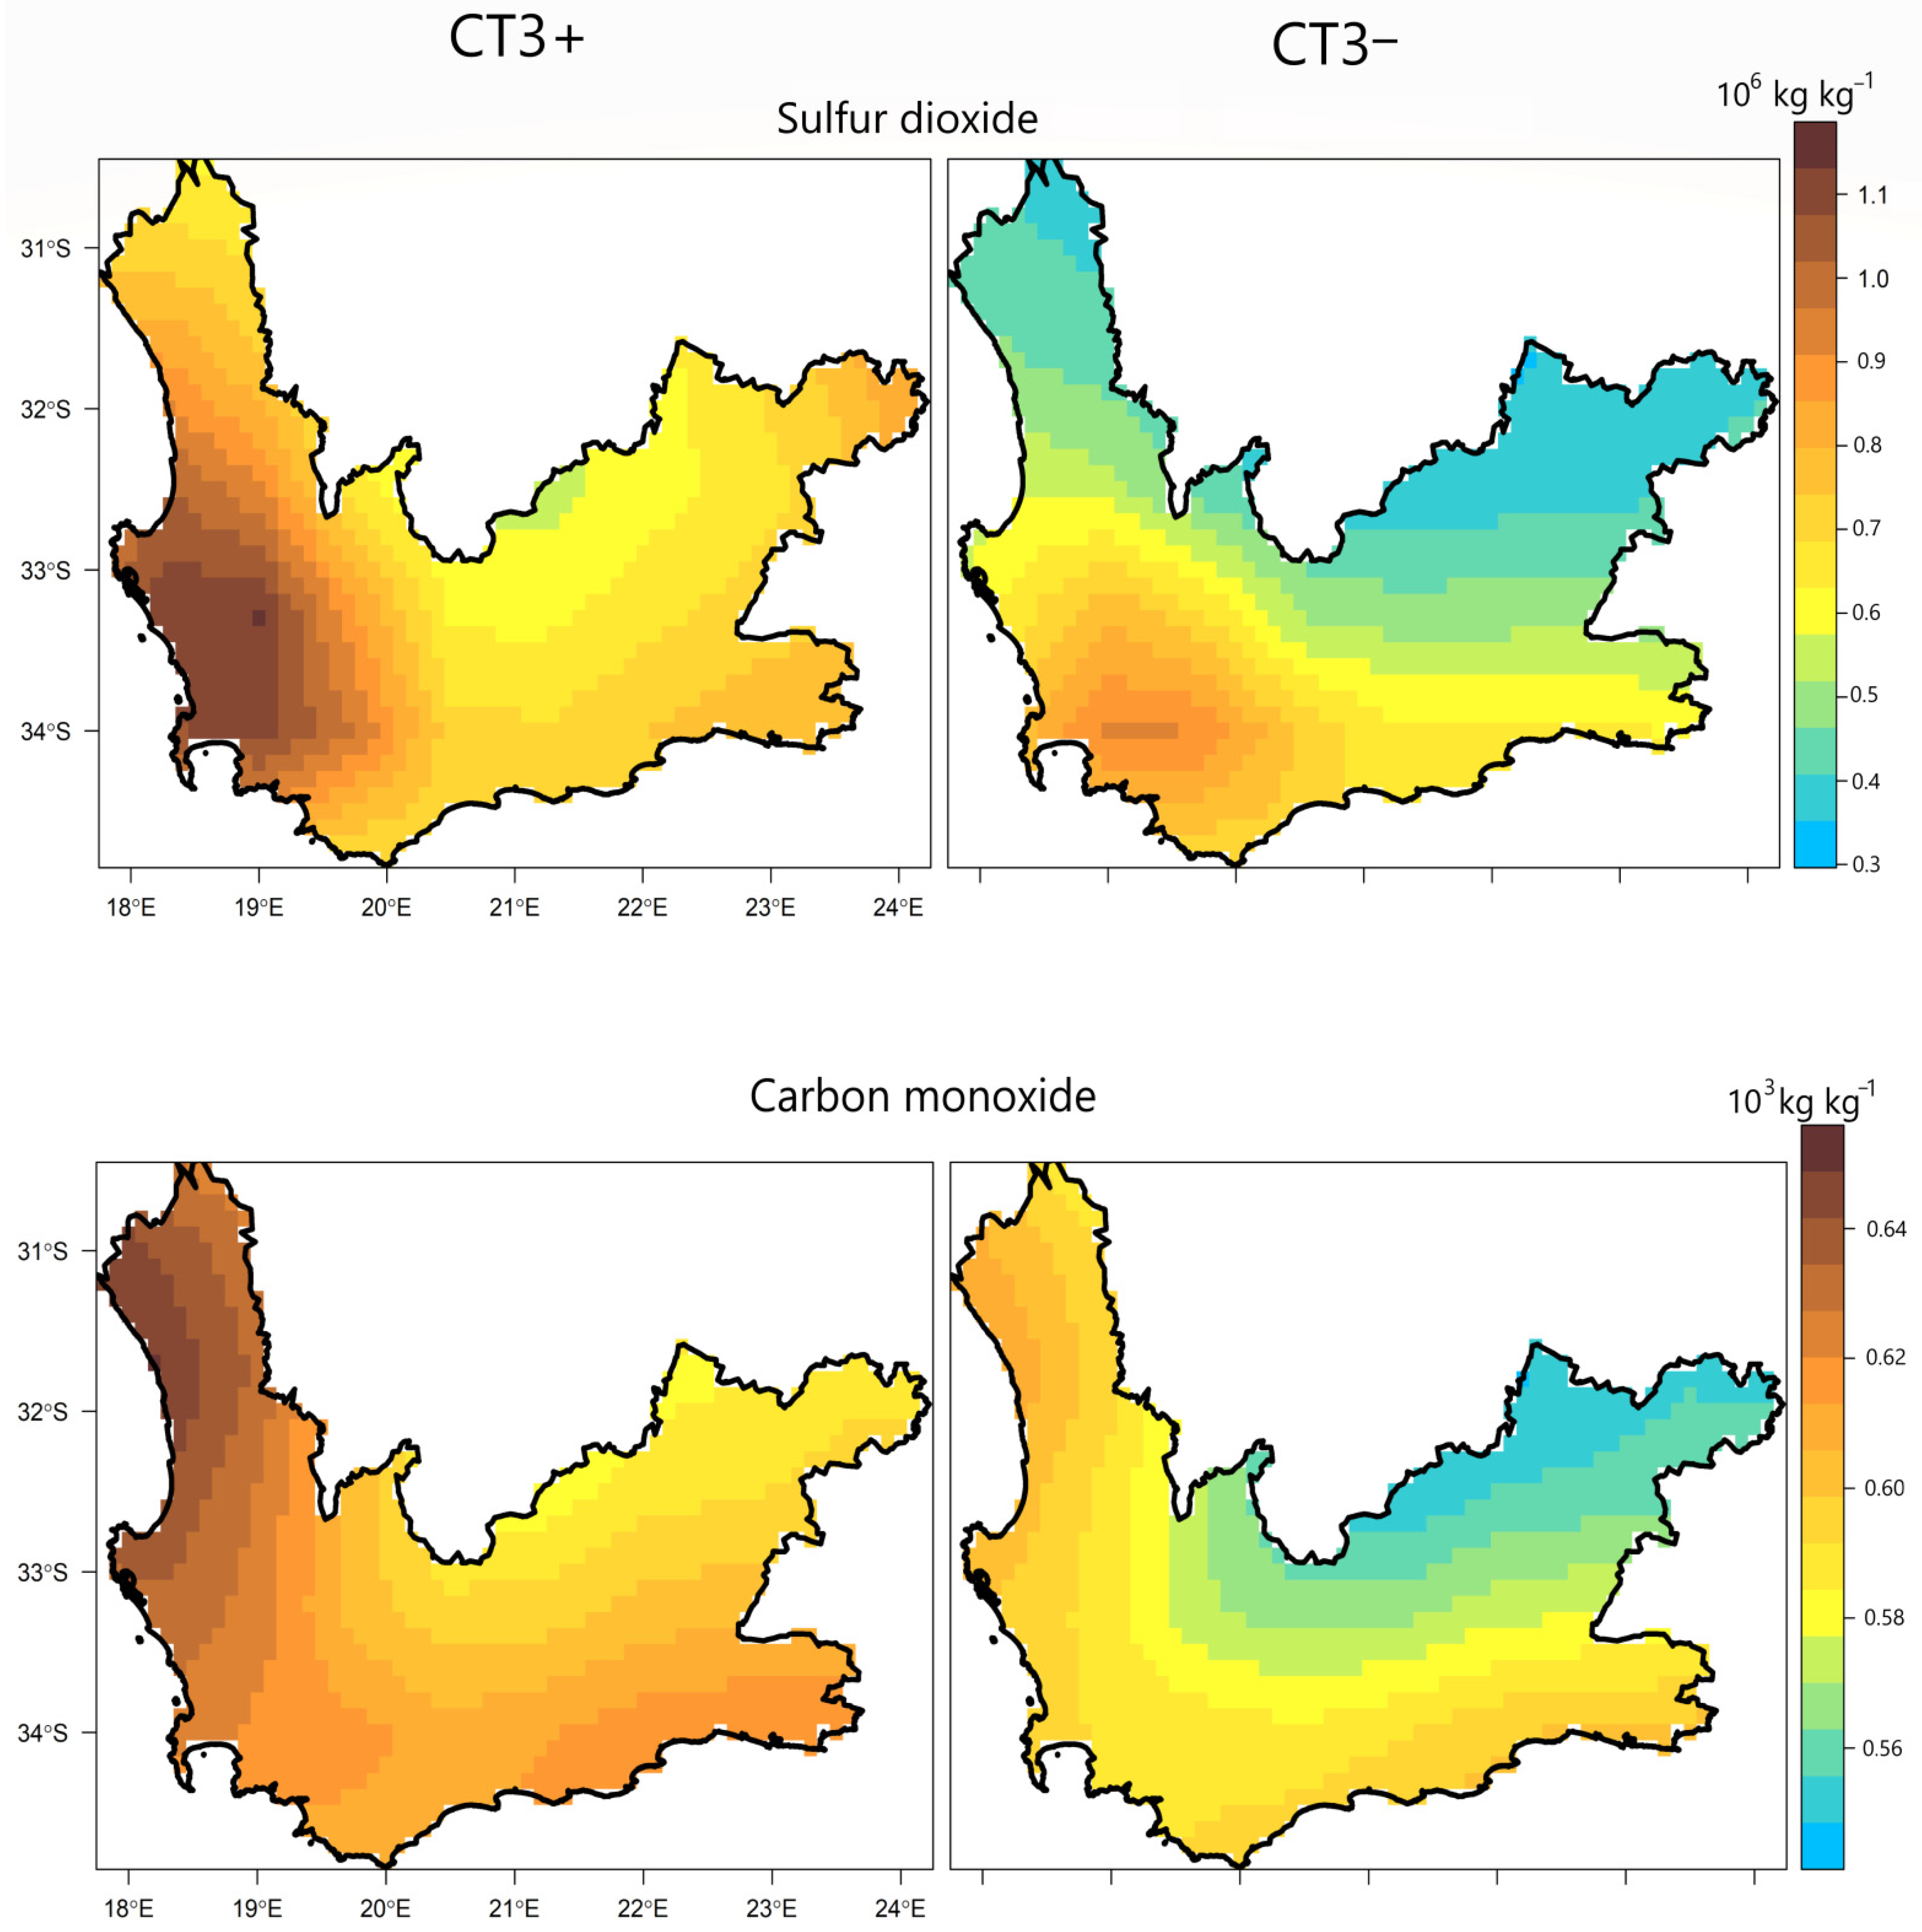
8]. In contrast, the higher wind speeds and unstable conditions that can be triggered by a negative SAM anomaly are necessary to dilute the BC in the WC region. The results in this work are not limited only to BC but include other gaseous pollutants, such as sulfur dioxide and carbon monoxide (
Figure A3).
In summary, the SAM, through its control of CT3+/CT3−, can impact wind direction, wind speed, atmospheric turbulence, and stability over some parts of the WC region. These meteorological parameters have a significant influence on the dispersion and dilution of atmospheric pollutants. However, not all air pollutant problems are linked to large-scale meteorological conditions. The pollutant sources can play a leading role even when meteorological factors favor the dispersion and dilution of pollutants. In addition, there are other small-scale atmospheric circulation features, such as land and sea breezes [
24], behavior of plumes emitted from the source, and topographically induced wind systems, that affect atmospheric pollutant transport [
25].
The results in this study show an added value of CT analysis. For example, seasonal timescale decomposition alone would have indicated that only JJA and SON can be periods of high BC AOD in large parts of the WC. The CT analysis identified some of the causes of this seasonality and hence contributes to a better process understanding, including CTs with wet/unstable and dry/stable conditions resulting from the northward and southward migration of the storm tracks of mid-latitude cyclones (cf.
Figure 3). Thus, JJA and SON are often characterized by the prevalence of atmospheric instability, strong winds, and above-average rainfall, resulting in low BC AOD values over large parts of the WC. The detected link to the SAM is of great value when considering timely measures against higher pollutant concentrations in the course of global warming.


