
A 479-Year Early Summer Temperature Reconstruction Based on Tree-Ring in the Southeastern Tibetan Plateau, China


Abstract
:1. Introduction
2. Materials and Methods
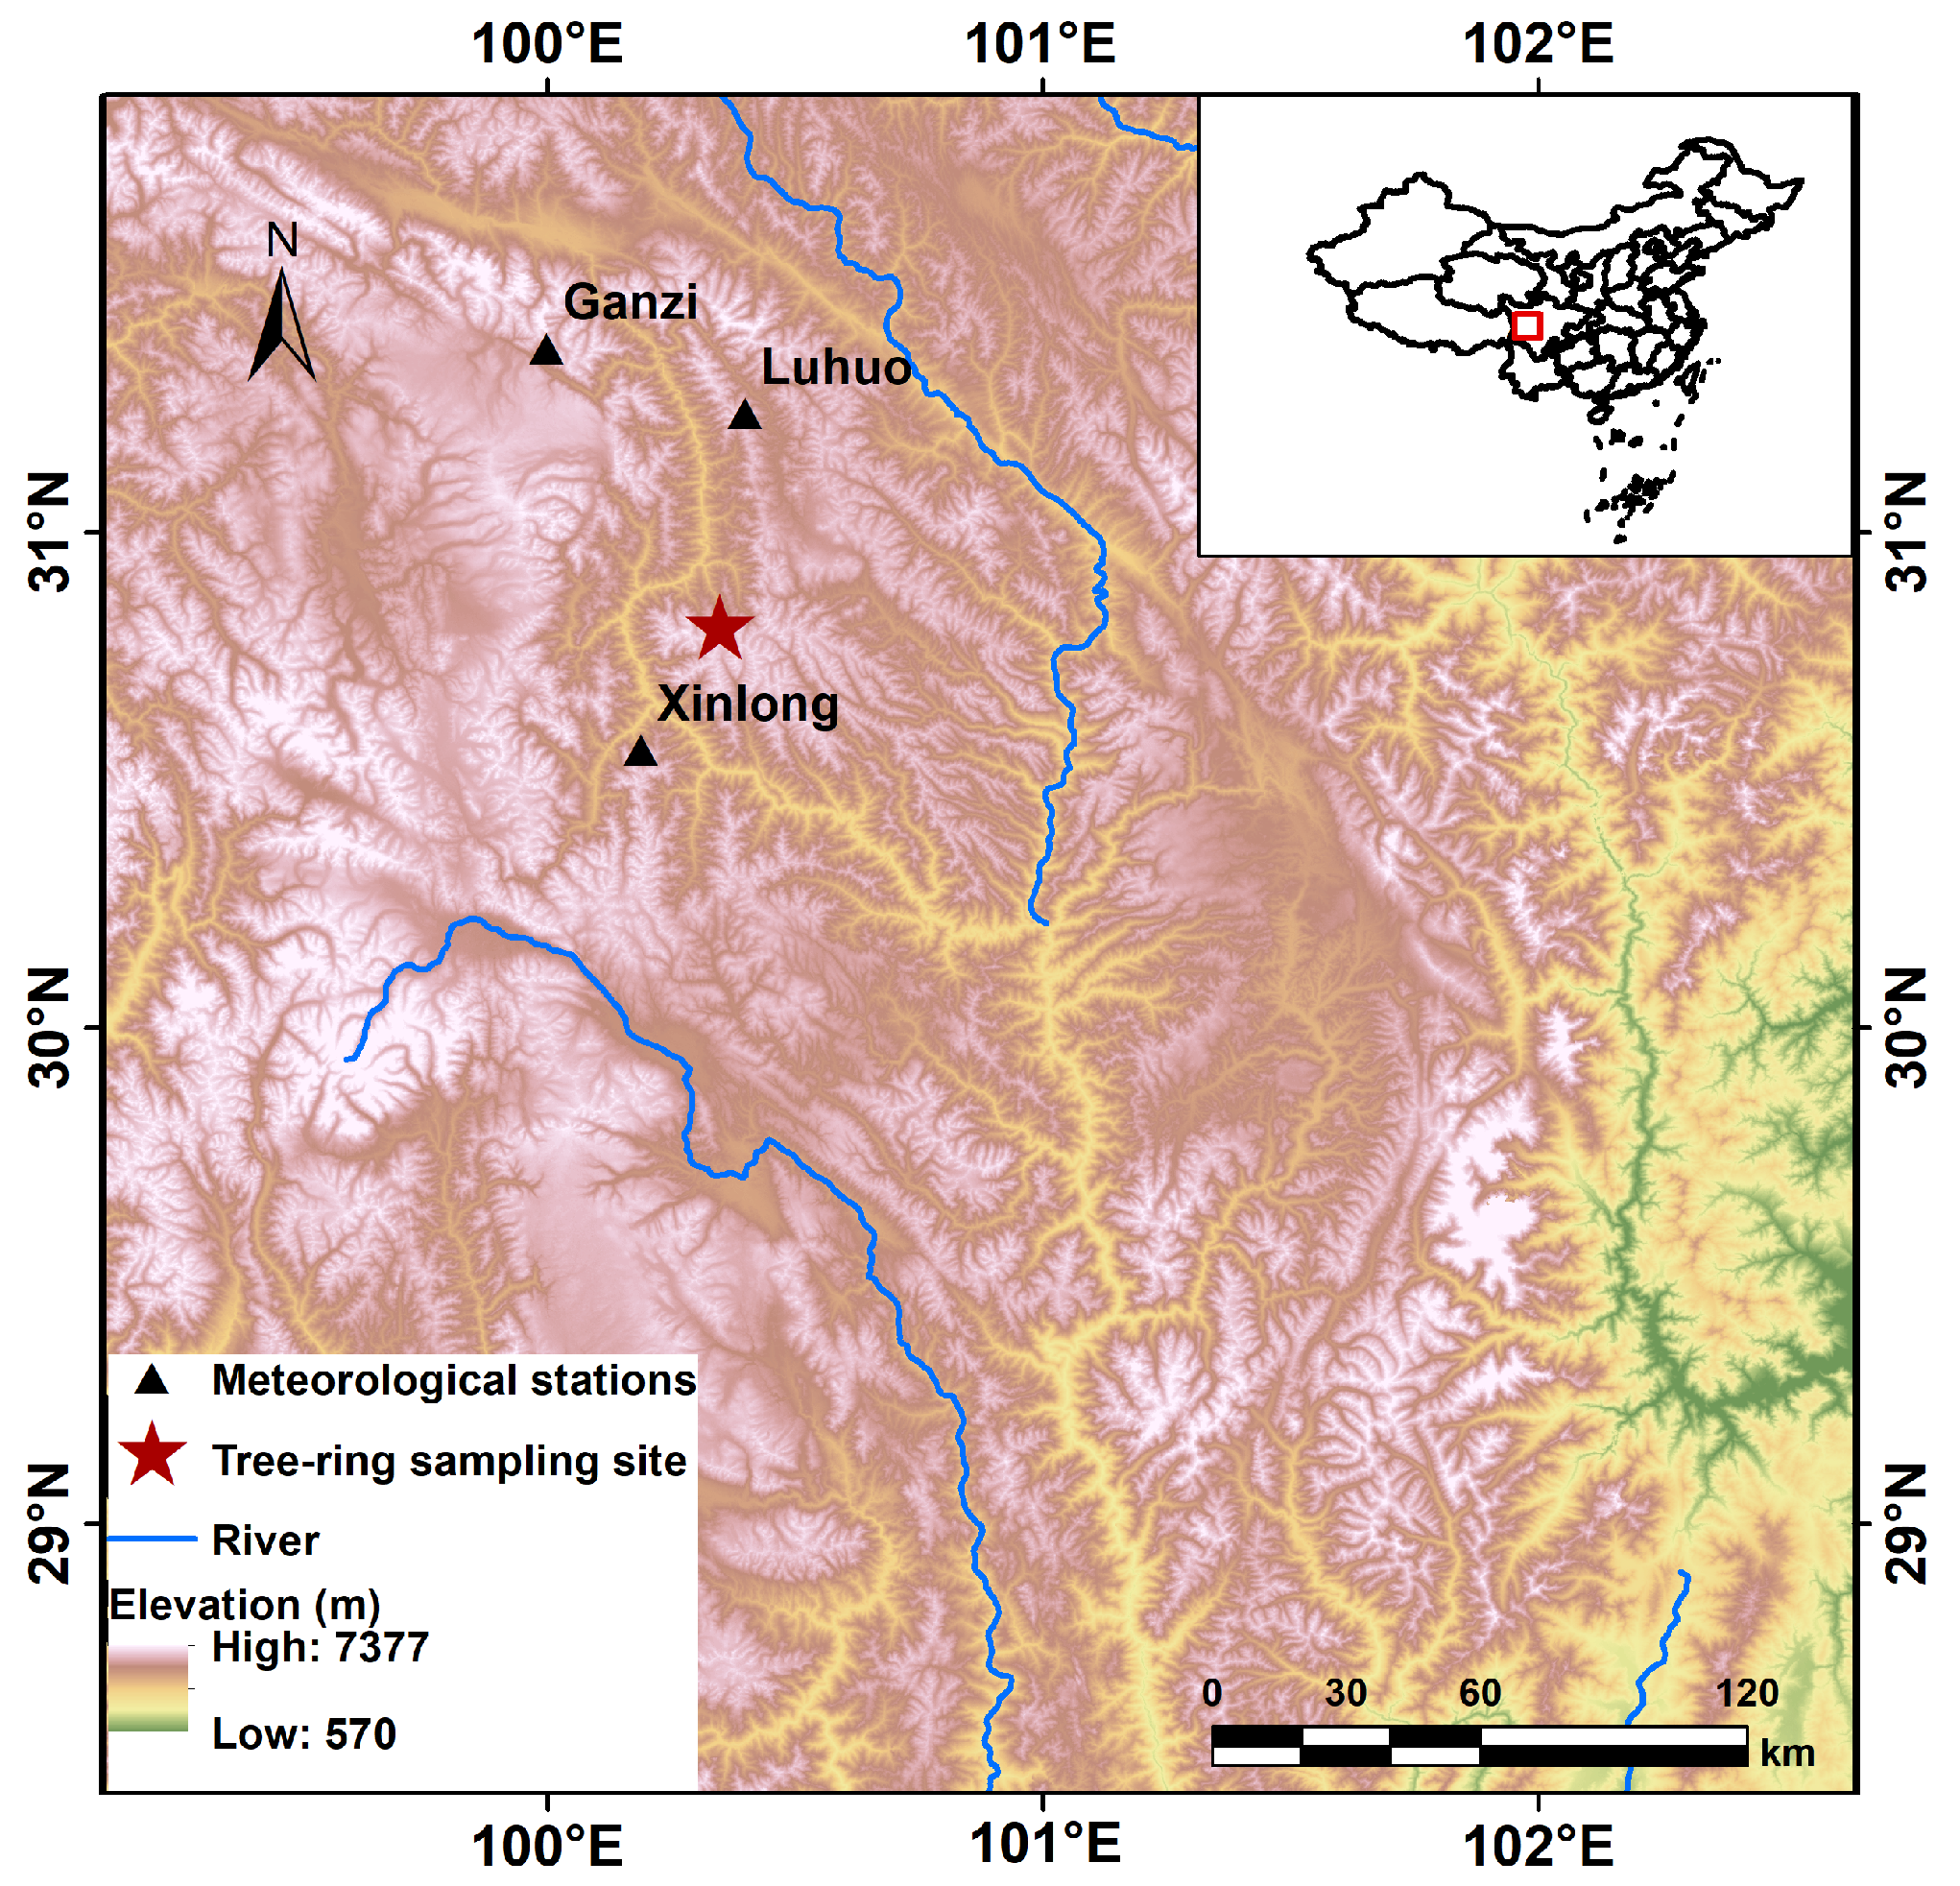
2.1. Study Area
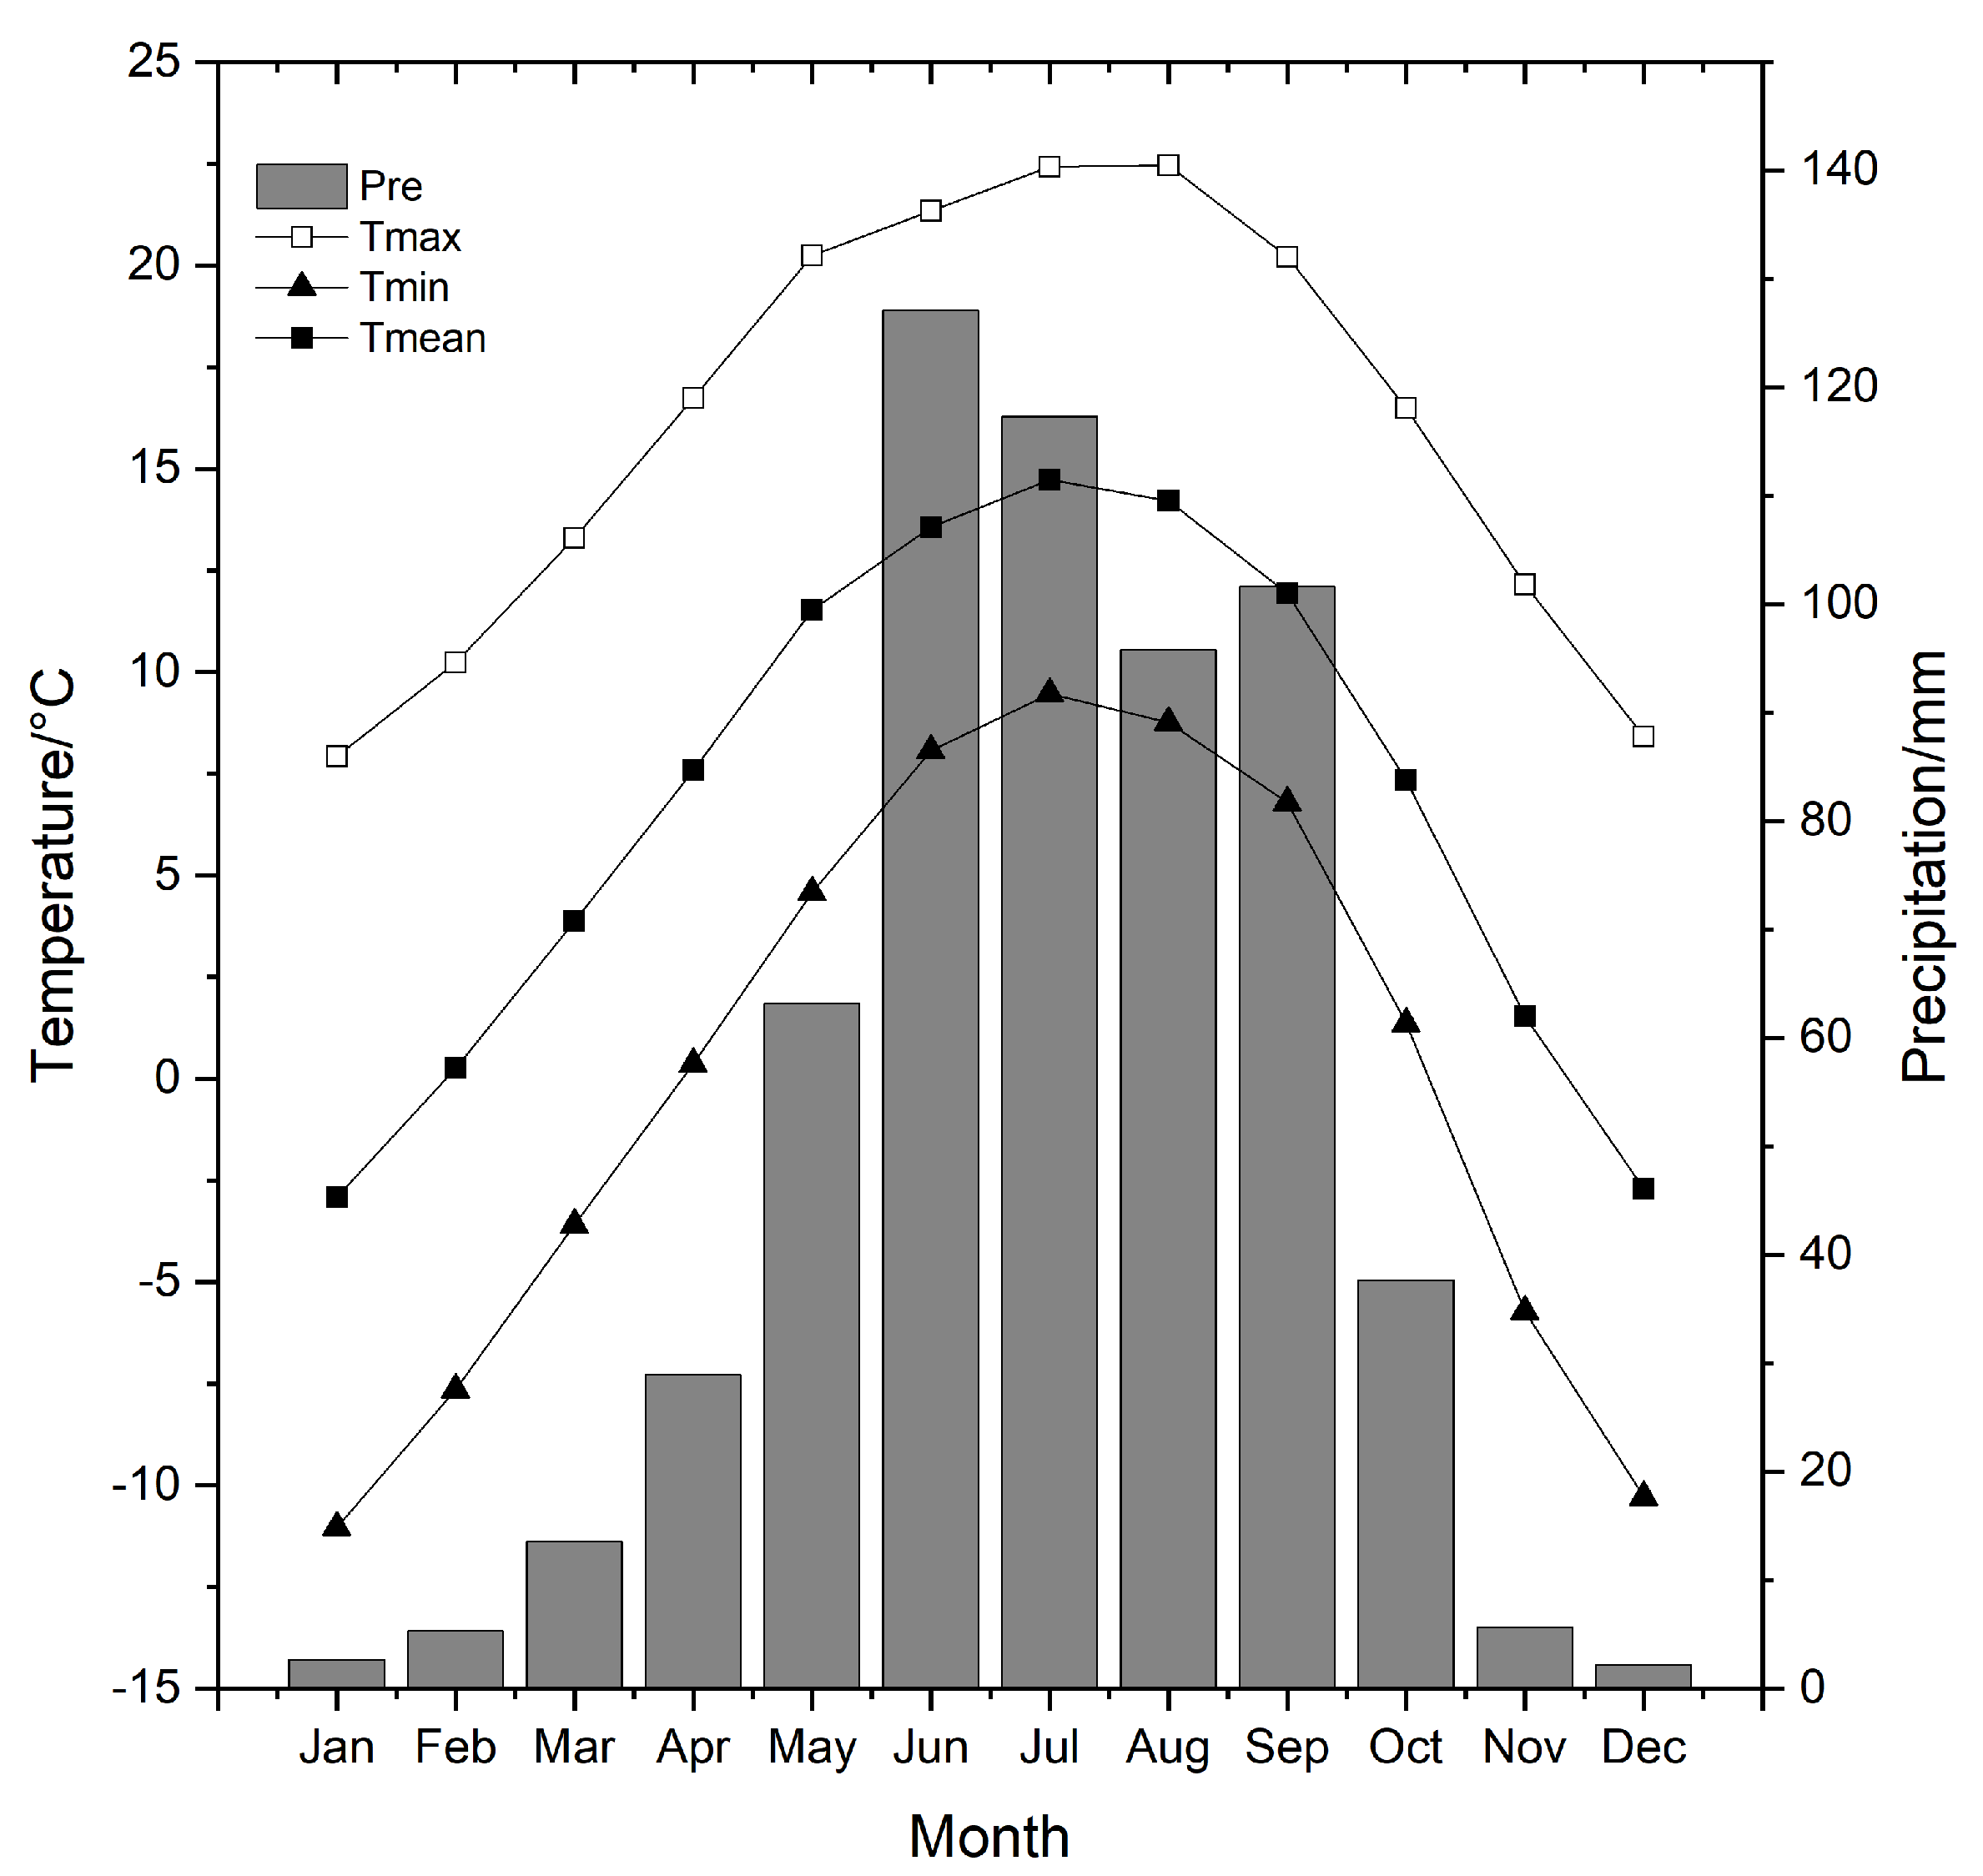
2.2. Climate Data
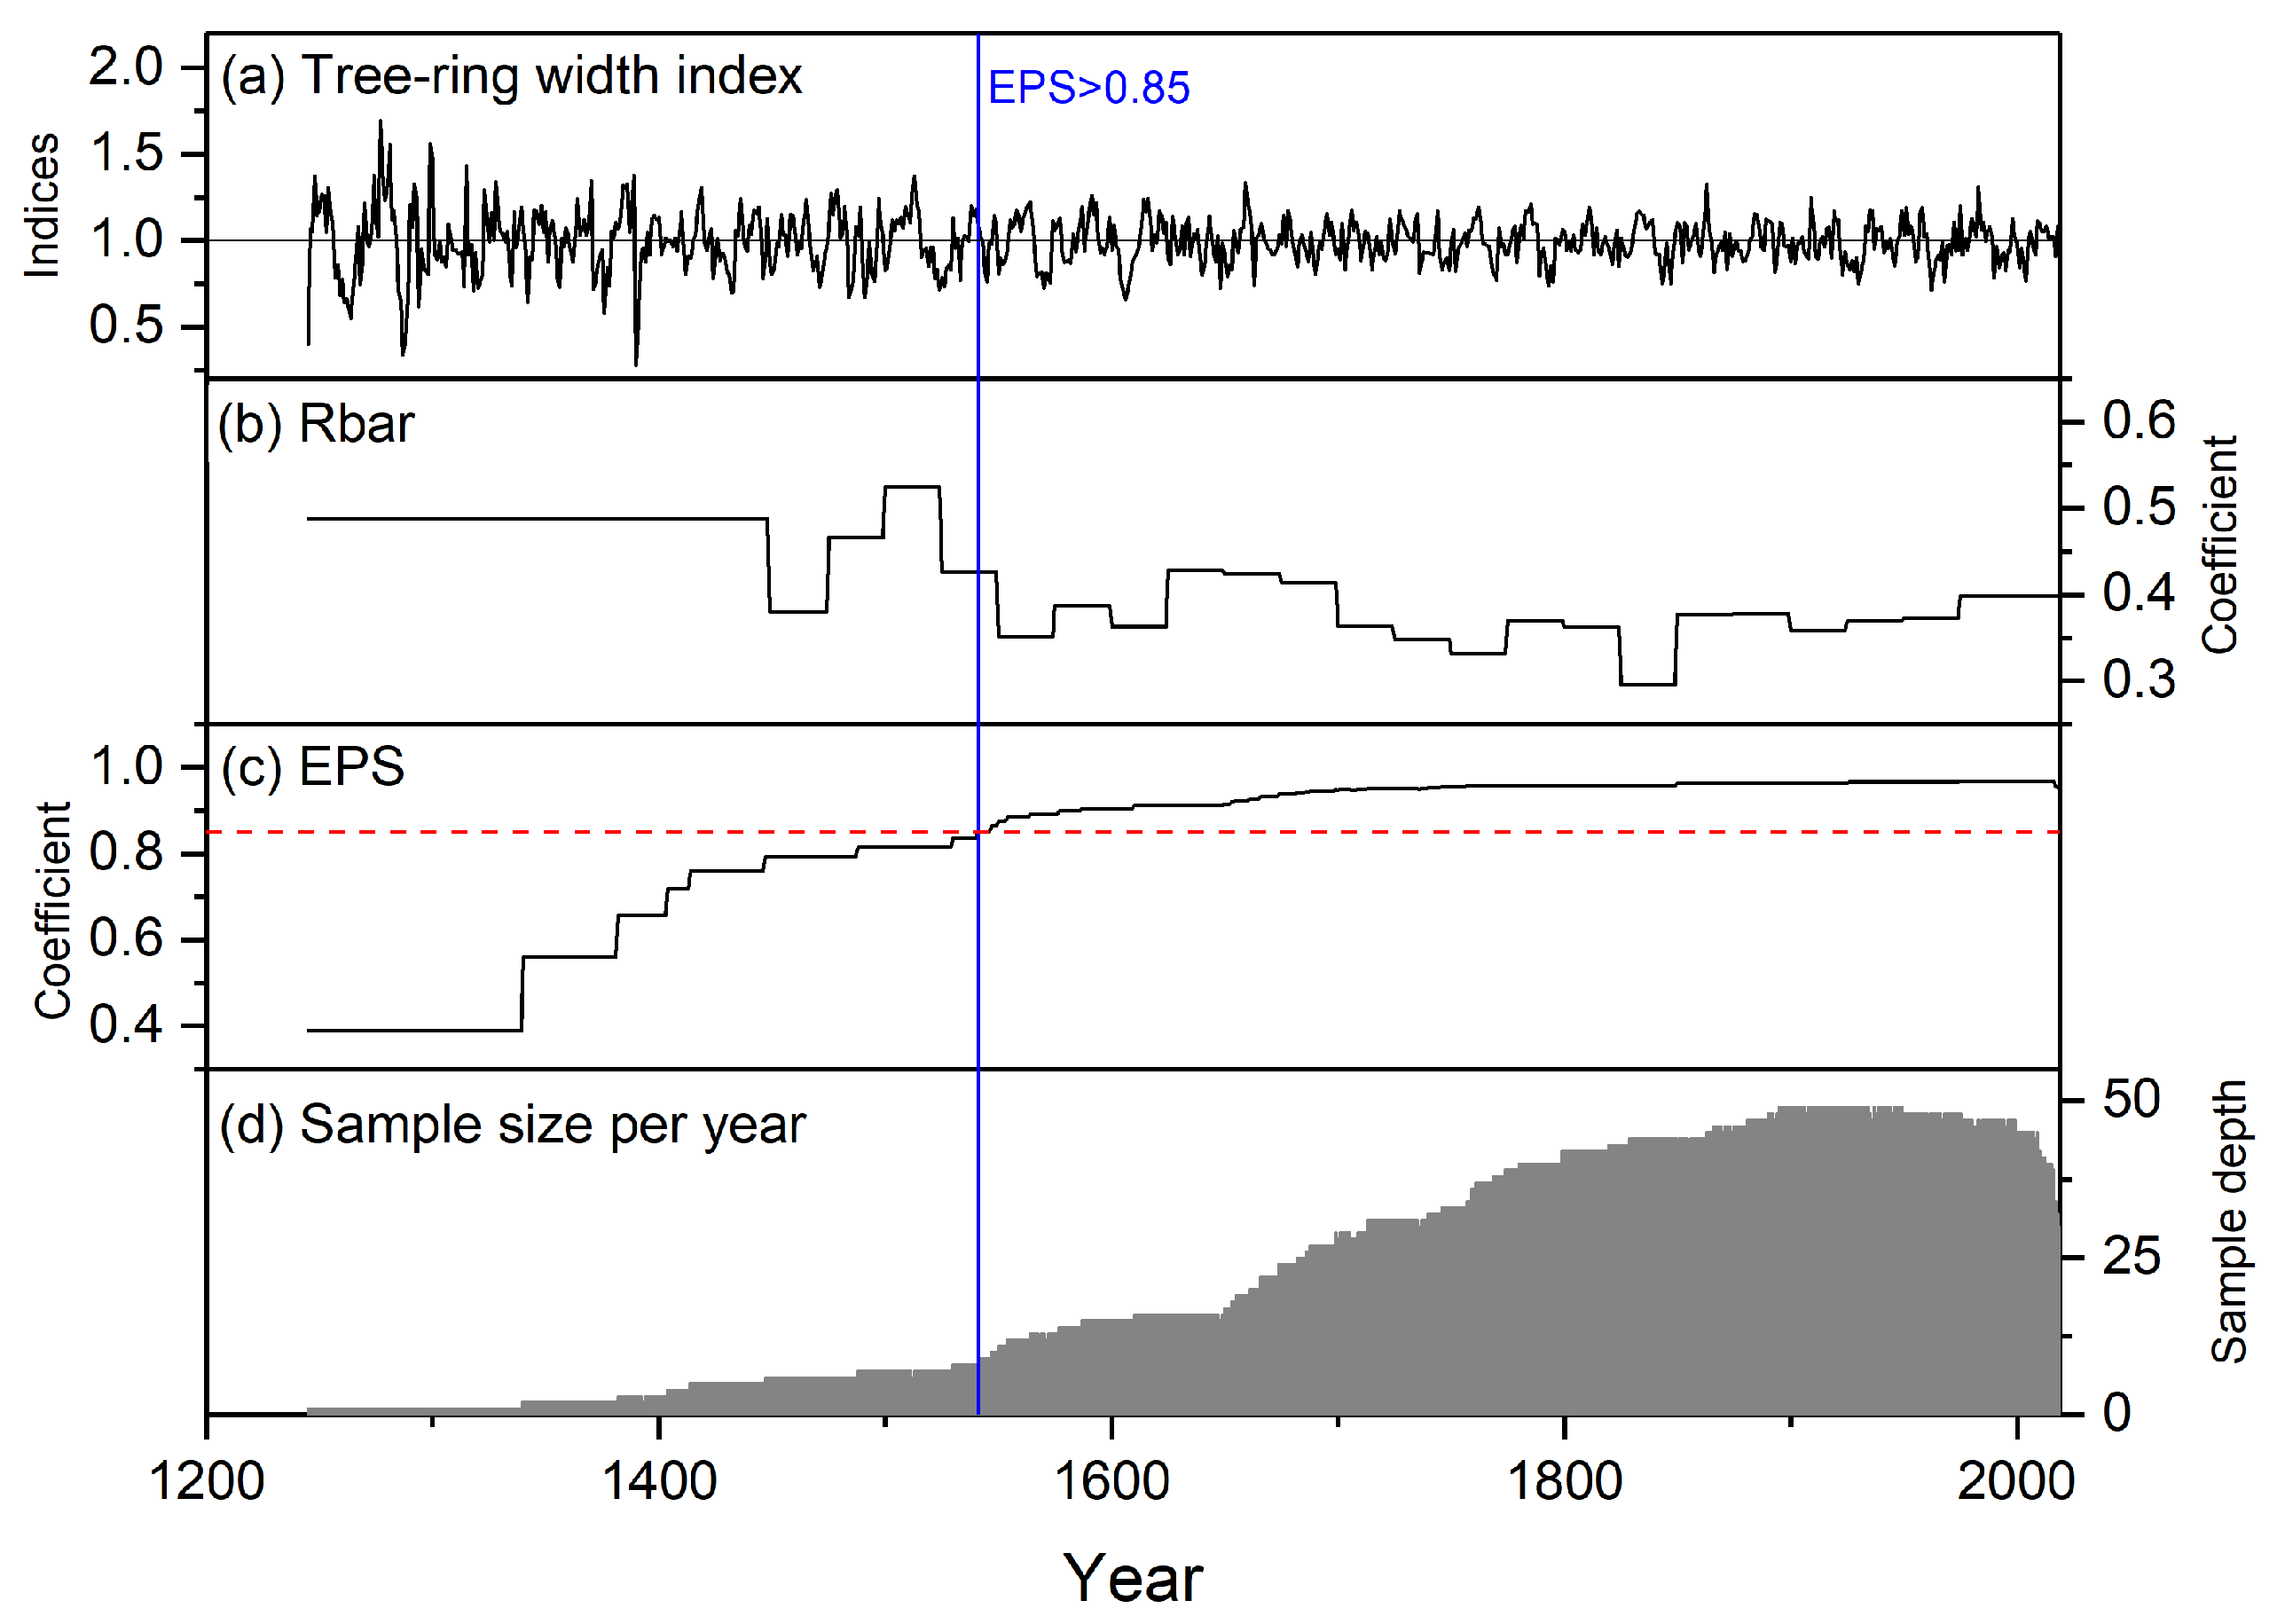
2.3. Tree-Ring Data and Chronology Development
2.4. Climate Reconstruction and Statistical Methods
3. Results
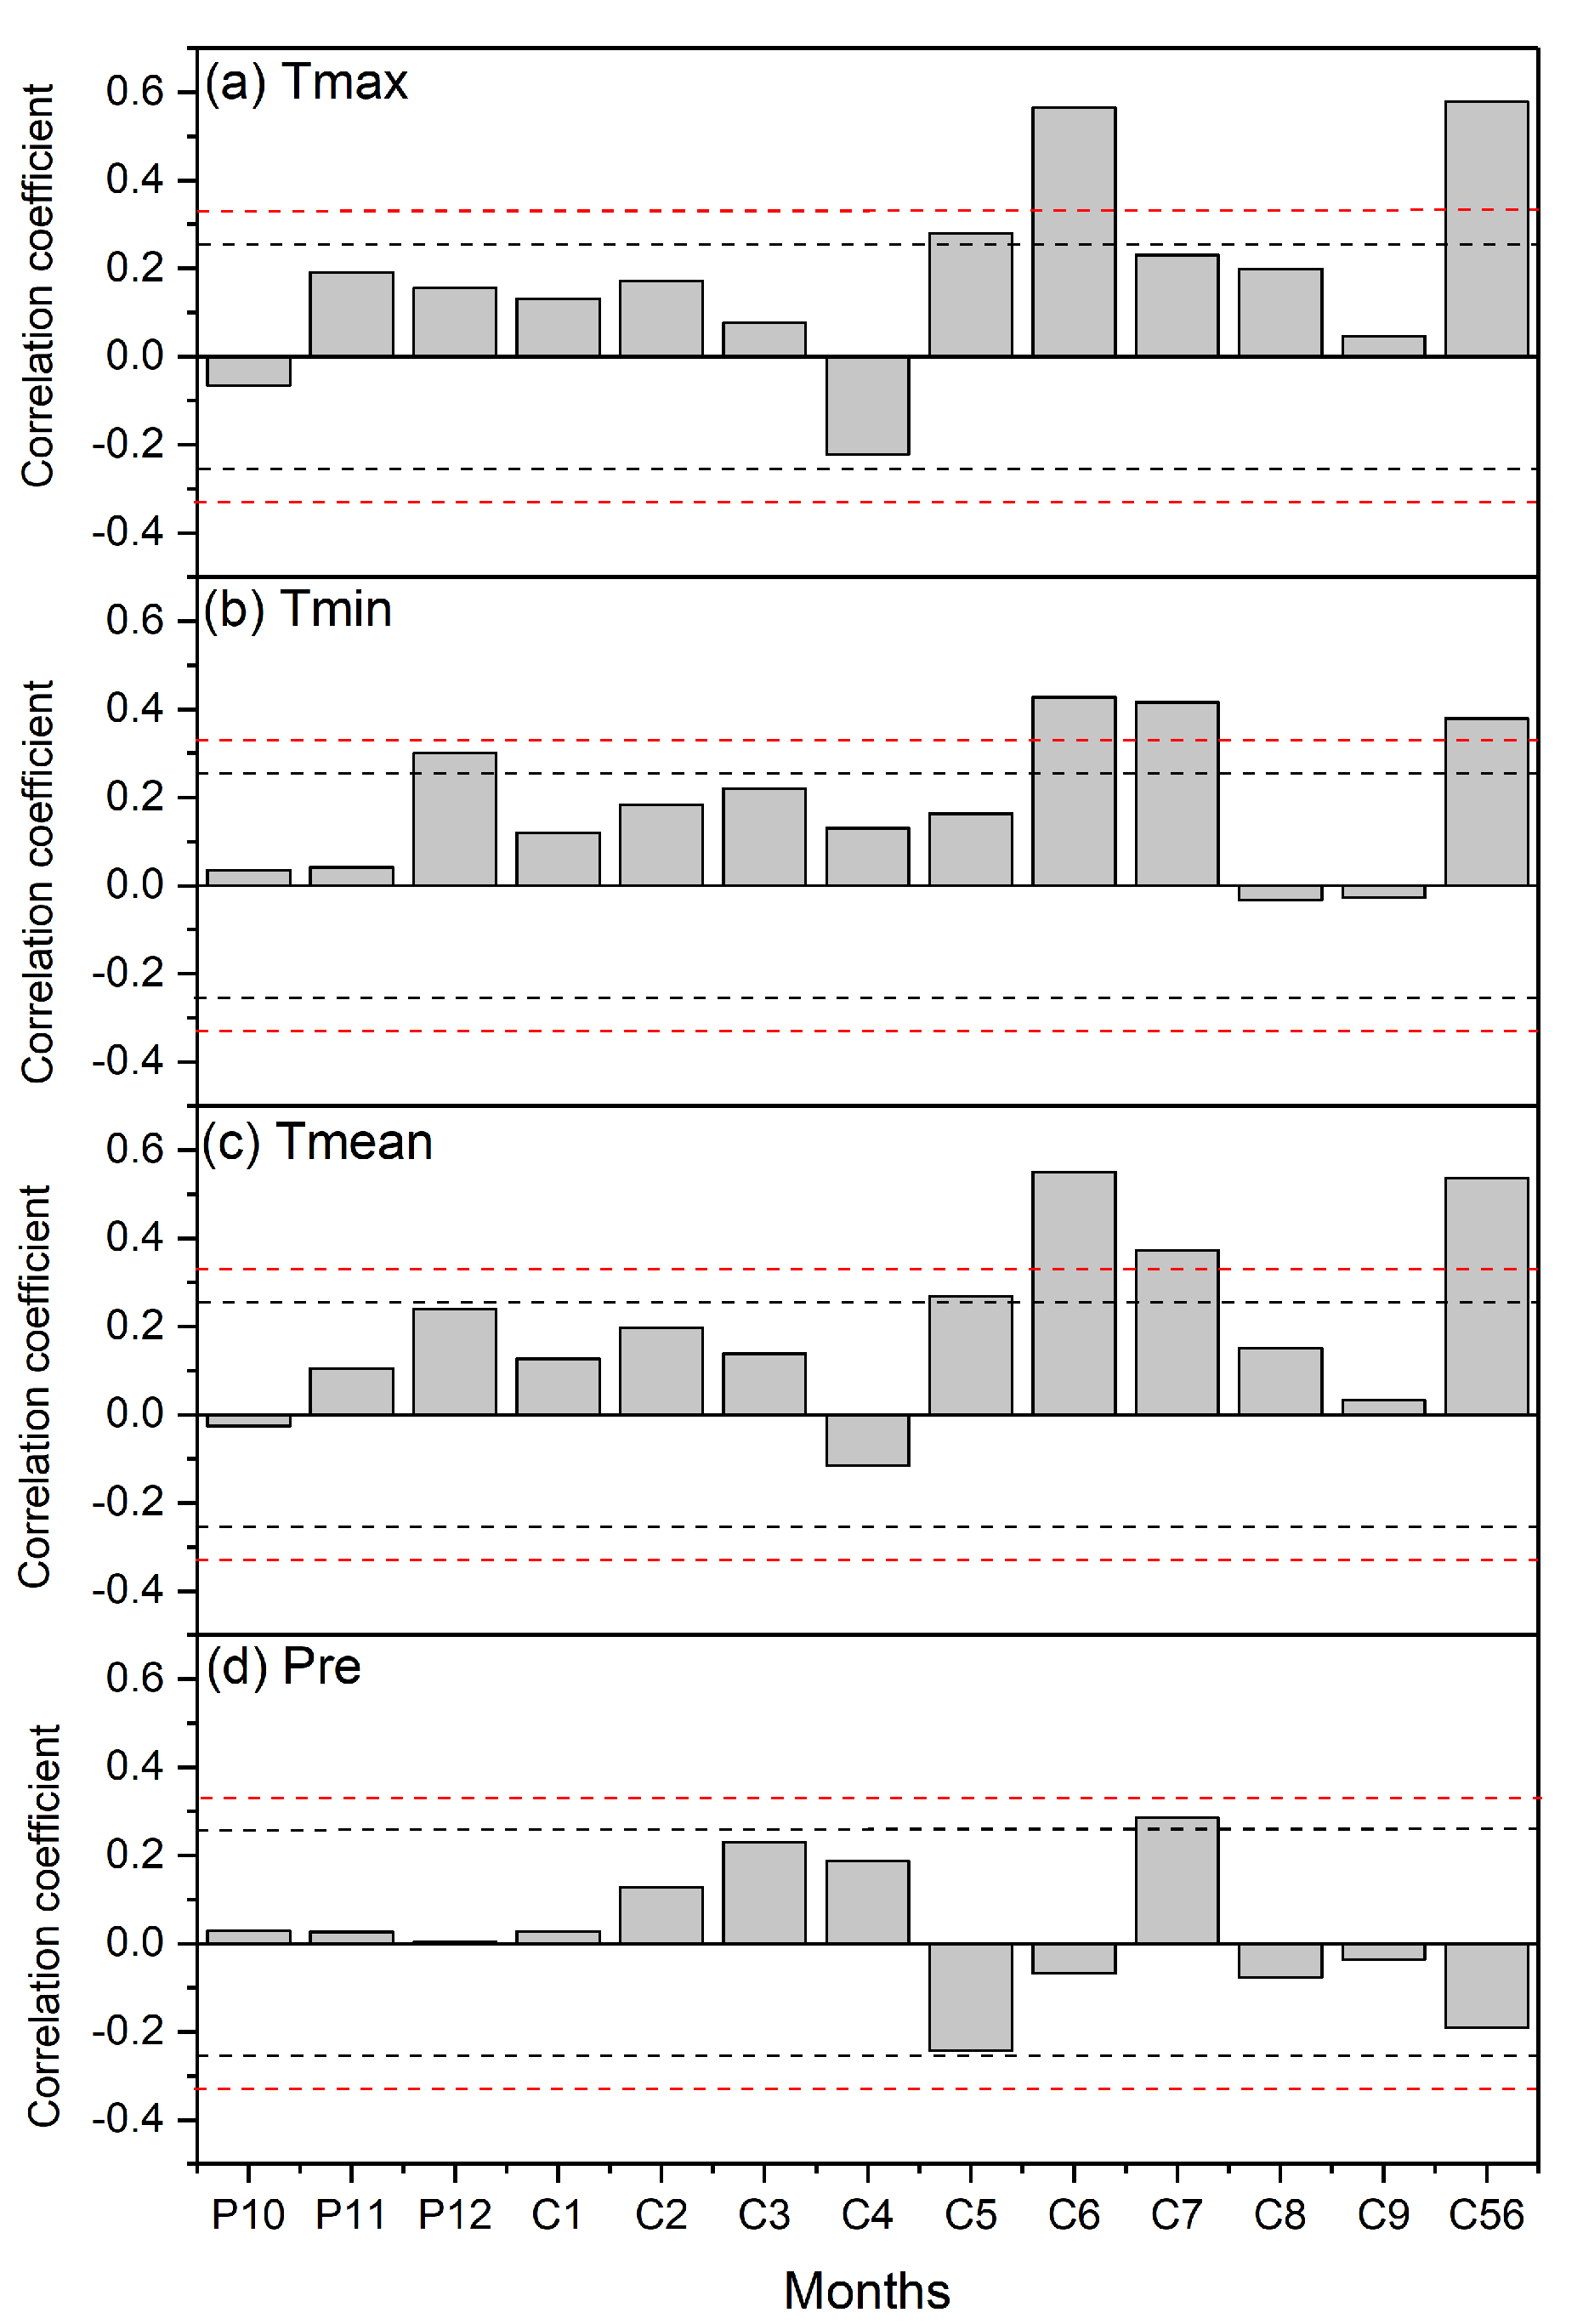
3.1. Climate–Tree Growth Response Analysis
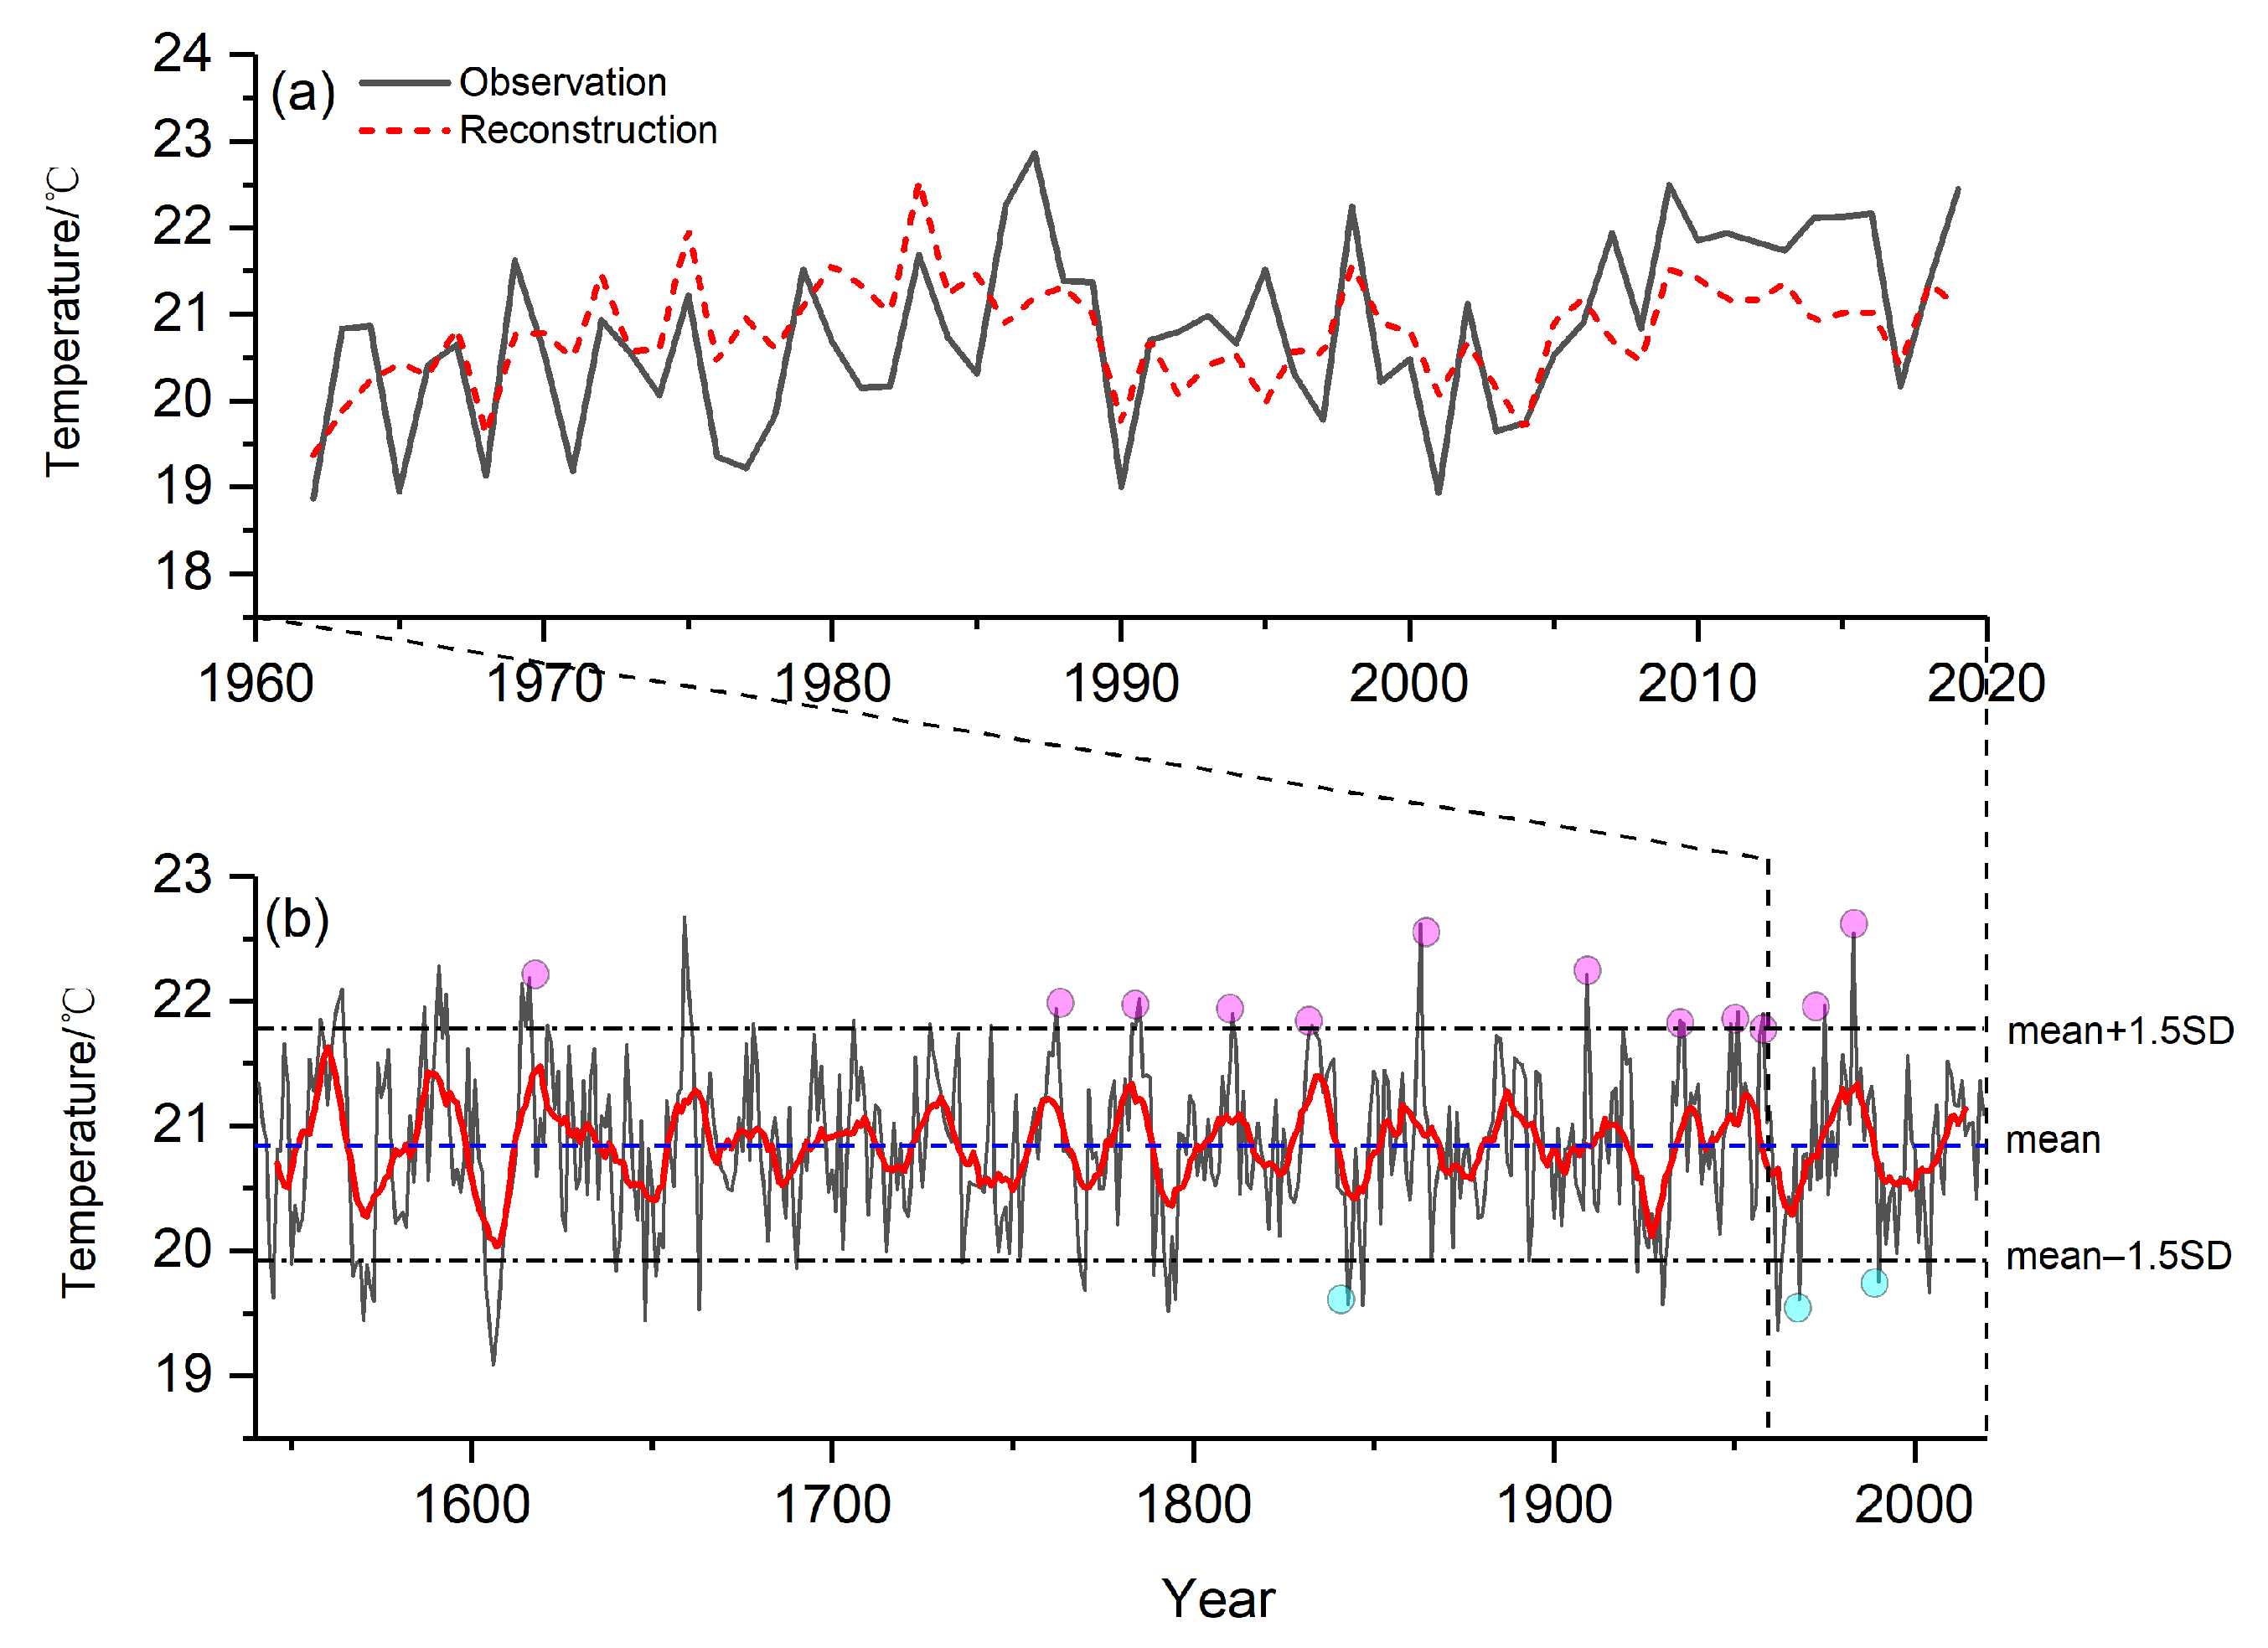
3.2. Calibration and Verification of the Reconstruction Model
3.3. Variations of Mean Maximum May–June Temperature
4. Discussion
4.1. Climate–Radial Tree Growth Relationships
4.2. Validation for Our Summer Temperature Reconstruction
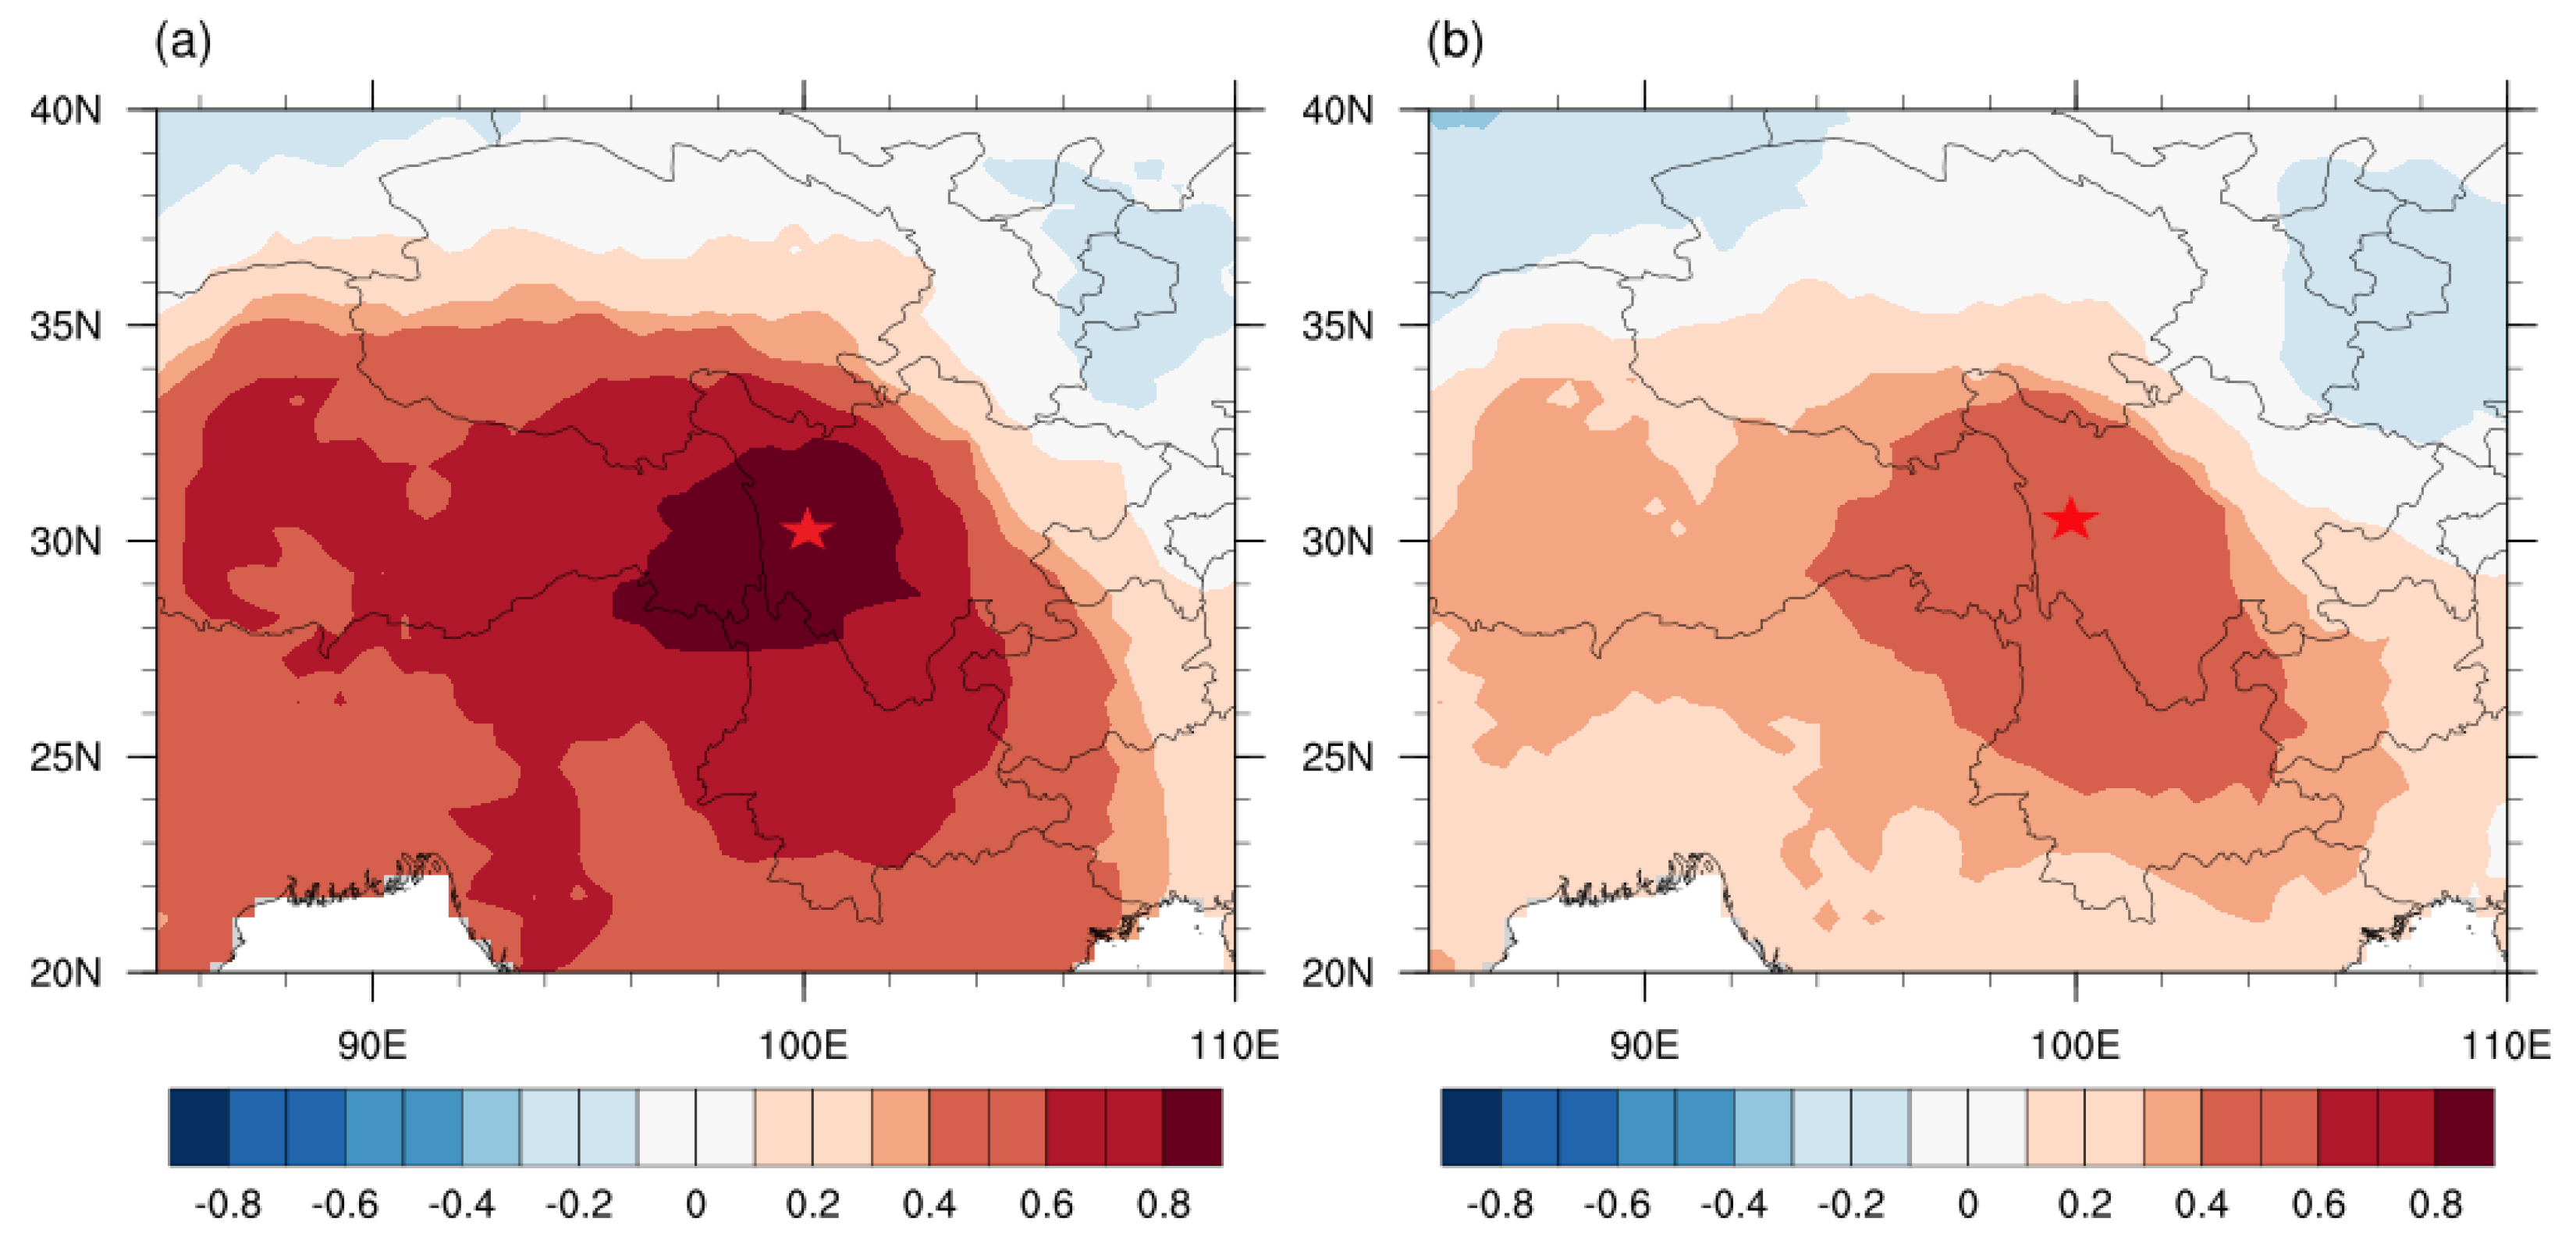
4.2.1. Spatial Correlation Analysis
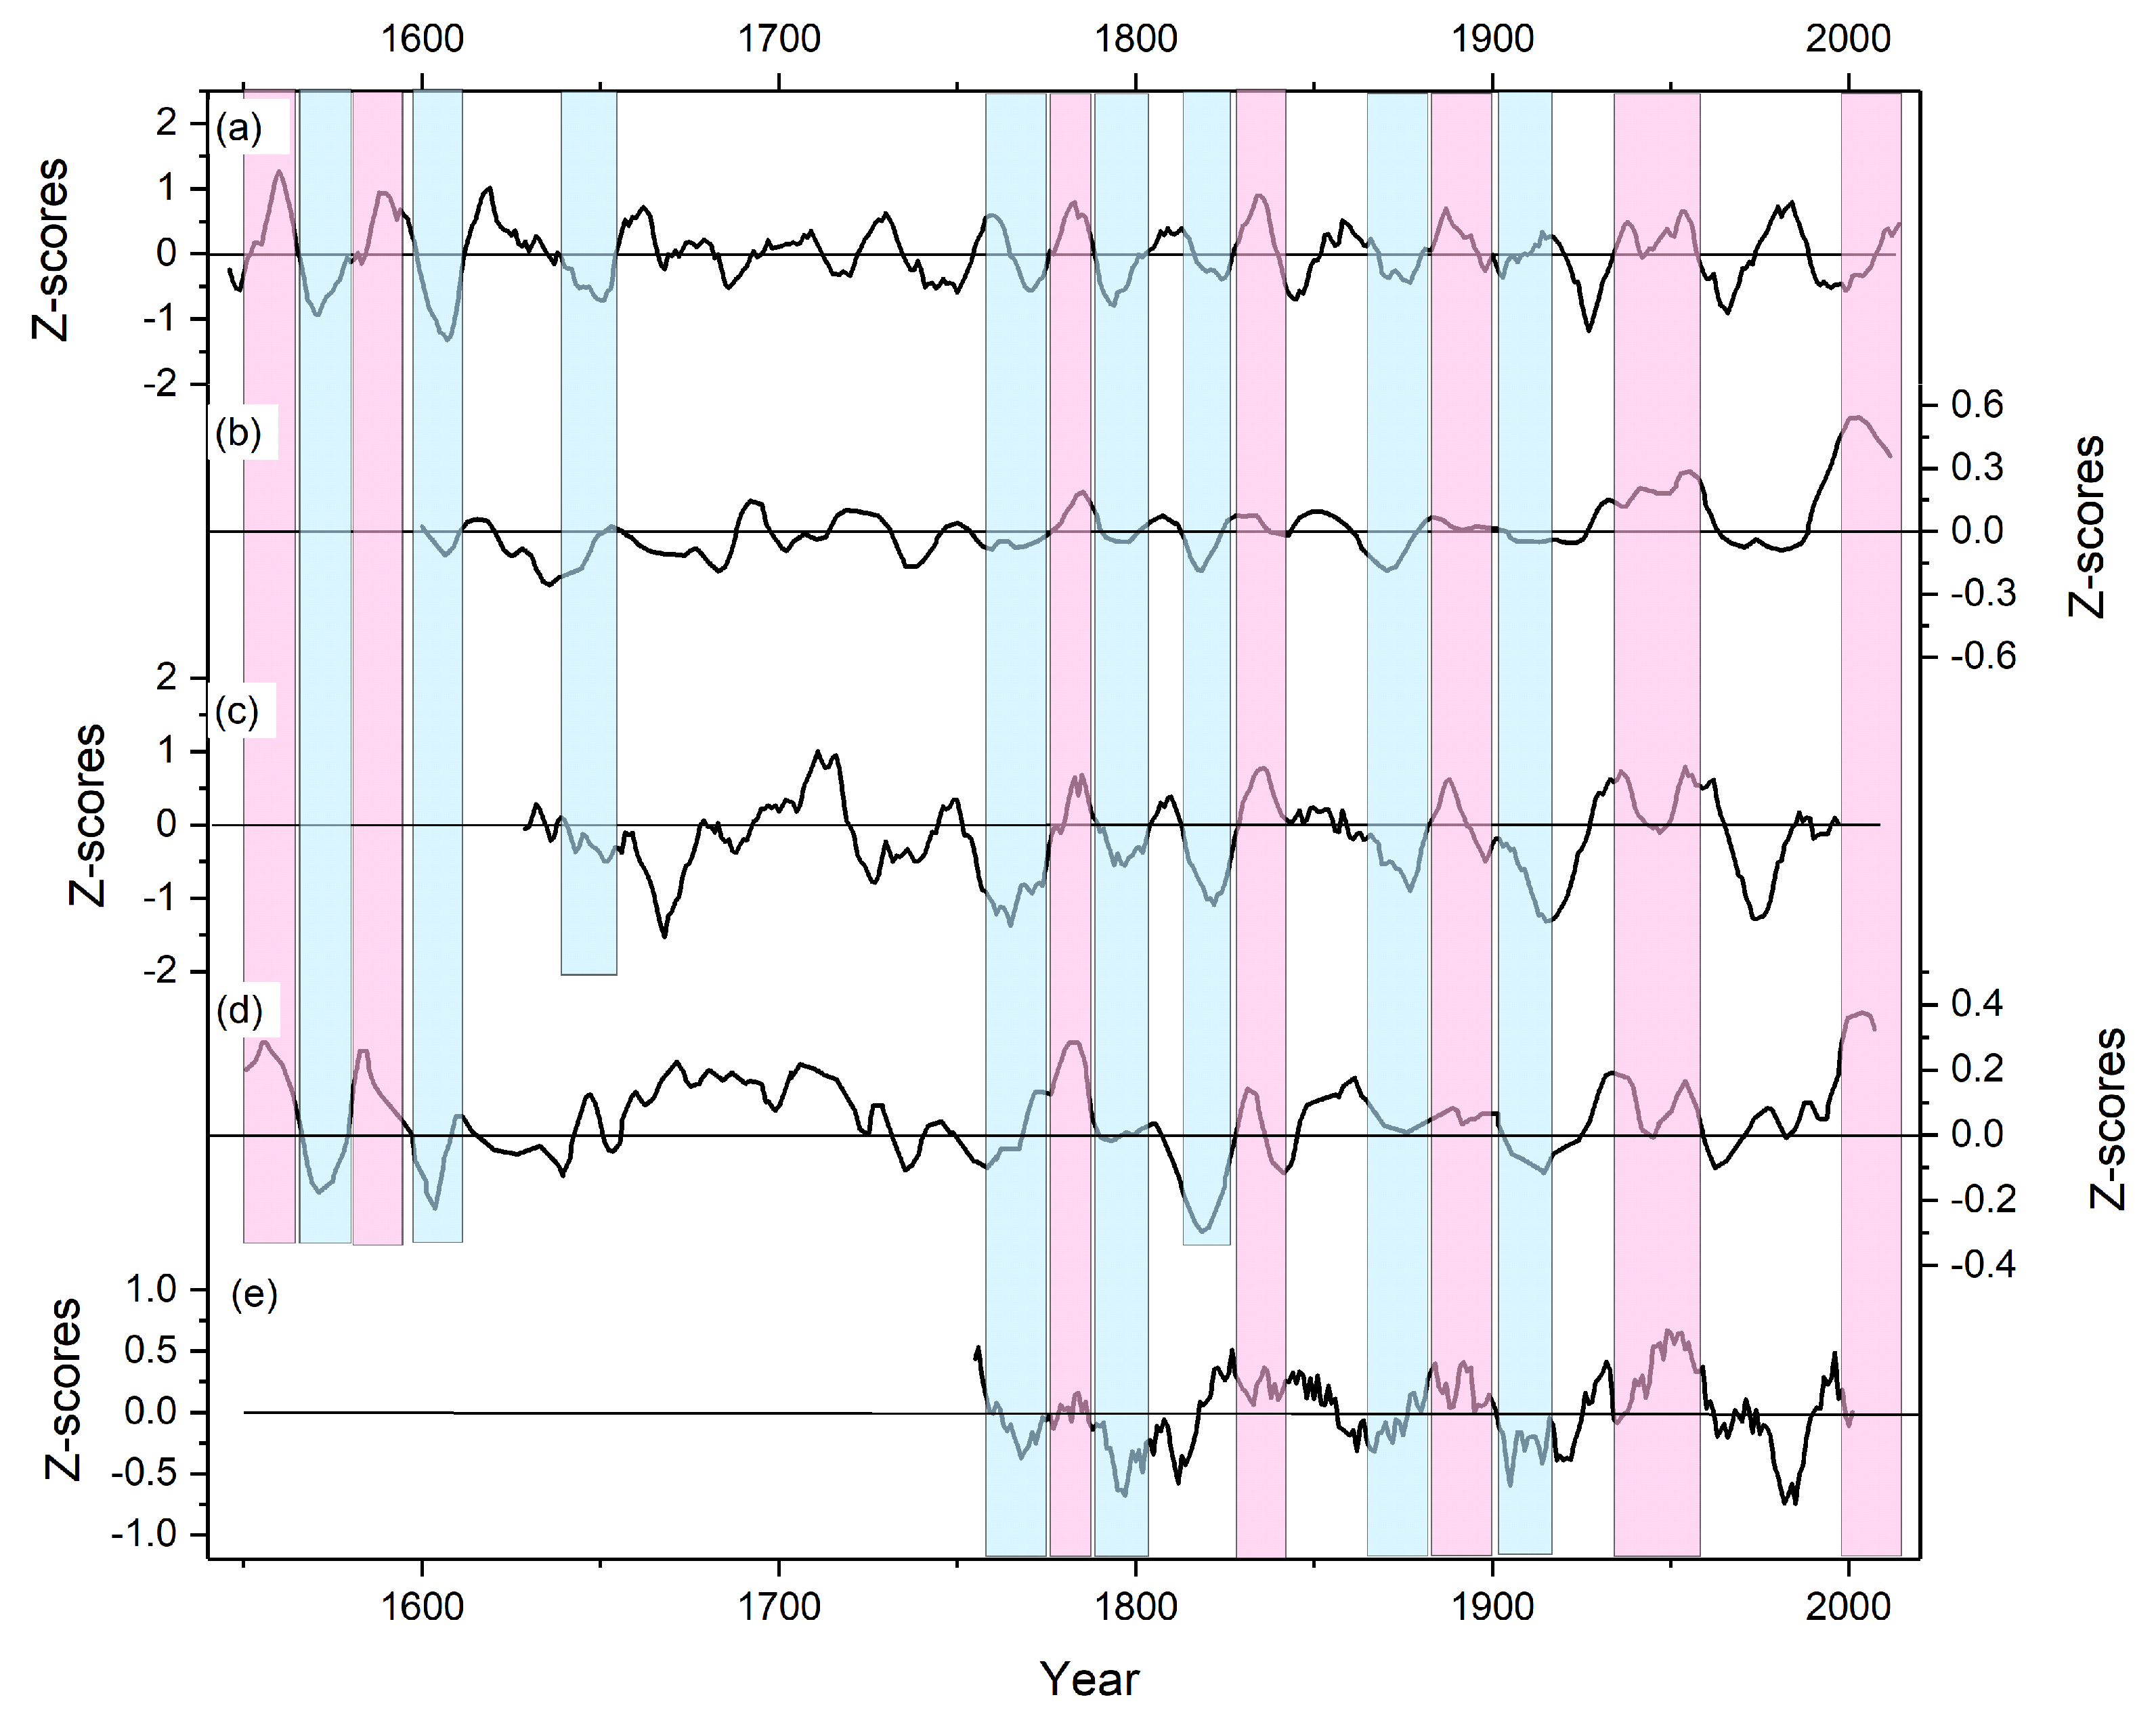
4.2.2. Comparison with Nearby Temperature Reconstructions
4.2.3. Glacier Fluctuations
4.2.4. Historical Events
4.3. Possible Driving Forces for the Temperature Variability in the Southeastern TP
5. Conclusions
Author Contributions
Funding
Data Availability Statement
Acknowledgments
Conflicts of Interest
References
- Yao, T.; Xue, Y.; Chen, D.; Chen, F.; Thompson, L.; Cui, P.; Koike, T.; Lau, W.K.M.; Lettenmaier, D.; Mosbrugger, V. Recent Third Pole’s Rapid Warming Accompanies Cryospheric Melt and Water Cycle Intensification and Interactions between Monsoon and Environment: Multidisciplinary Approach with Observations, Modeling, and Analysis. Bull. Am. Meteorol. Soc. 2019, 100, 423–444. [Google Scholar] [CrossRef]
- Feng, S.; Tang, M.; Wang, D. New evidence supports that the Tibetan Plateau is the trigger region of China. Chin. Sci. Bull. 1998, 43, 633–636. [Google Scholar]
- Webster, P.J.; Magaña, V.O.; Palmer, T.N.; Shukla, J.; Tomas, R.A.; Yanai, M.; Yasunari, T. Monsoons: Processes, predictability, and the prospects for prediction. J. Geophys. Res. Ocean. 1998, 103, 14451–14510. [Google Scholar] [CrossRef]
- Yao, T.; Masson-Delmotte, V.; Gao, J.; Yu, W.; Yang, X.; Risi, C.; Sturm, C.; Werner, M.; Zhao, H.; He, Y.; et al. A review of climatic controls on δ18O in precipitation over the Tibetan Plateau: Observations and simulations. Rev. Geophys. 2013, 51, 525–548. [Google Scholar] [CrossRef]
- Chen, F.; Shang, H.; Panyushkina, I.; Meko, D.; Li, J.; Yuan, Y.; Yu, S.; Chen, F.; He, D.; Luo, X. 500-year tree-ring reconstruction of Salween River streamflow related to the history of water supply in Southeast Asia. Clim. Dyn. 2019, 53, 6595–6607. [Google Scholar] [CrossRef]
- Cook, E.R.; Krusic, P.J.; Anchukaitis, K.J.; Buckley, B.M.; Nakatsuka, T.; Sano, M. Tree-ring reconstructed summer temperature anomalies for temperate East Asia since 800 C.E. Clim. Dyn. 2013, 41, 2957–2972. [Google Scholar] [CrossRef] [Green Version]
- Shi, J.; Lu, H.; Li, J.; Shi, S.; Wu, S.; Hou, X.; Li, L. Tree-ring based February–April precipitation reconstruction for the lower reaches of the Yangtze River, southeastern China. Glob. Planet Chang. 2015, 131, 82–88. [Google Scholar] [CrossRef] [Green Version]
- Deng, Y.; Gou, X.; Gao, L.; Yang, T.; Yang, M. Early-summer temperature variations over the past 563 yr inferred from tree rings in the Shaluli Mountains, southeastern Tibet Plateau. Quat. Res. 2014, 81, 513–519. [Google Scholar] [CrossRef]
- Fan, Z.X.; Bräuning, A.; Tian, Q.H.; Yang, B.; Cao, K.F. Tree ring recorded May–August temperature variations since A.D. 1585 in the Gaoligong Mountains, southeastern Tibetan Plateau. Palaeogeogr. Palaeoclimatol. Palaeoecol. 2010, 296, 94–102. [Google Scholar] [CrossRef]
- Fan, Z.X.; Bräuning, A.; Yang, B.; Cao, K.F. Tree ring density-based summer temperature reconstruction for the central Hengduan Mountains in southern China. Glob. Planet Chang. 2009, 65, 1–11. [Google Scholar] [CrossRef]
- Li, Z.; Liu, G.; Wu, X.; Wang, X. Tree-ring-based temperature reconstruction for the Wolong Natural Reserve, western Sichuan Plateau of China. Int. J. Climatol. 2015, 35, 3296–3307. [Google Scholar] [CrossRef]
- Yin, H.; Liu, H.; Linderholm, H.W.; Sun, Y. Tree ring density-based warm-season temperature reconstruction since A.D. 1610 in the eastern Tibetan Plateau. Palaeogeogr. Palaeoclimatol. Palaeoecol. 2015, 426, 112–120. [Google Scholar] [CrossRef]
- Zhu, H.F.; Shao, X.M.; Yin, Z.Y.; Huang, L. Early summer temperature reconstruction in the eastern Tibetan plateau since ad 1440 using tree-ring width of Sabina tibetica. Theor. Appl. Climatol. 2011, 106, 45–53. [Google Scholar] [CrossRef]
- Chen, F.; Yuan, Y.; Fan, Z.; Yu, S. A Winter Precipitation Reconstruction (CE 1810–2012) in the Southeastern Tibetan Plateau and Its Relationship to Salween River Streamflow Variations. Pure Appl. Geophys. 2018, 175, 2279–2291. [Google Scholar] [CrossRef]
- Deng, Y.; Gou, X.; Gao, L.; Yang, M.; Zhang, F. Spatiotemporal drought variability of the eastern Tibetan Plateau during the last millennium. Clim. Dyn. 2017, 49, 2077–2091. [Google Scholar] [CrossRef]
- Liang, E.; Shao, X.; Liu, X. Annual Precipitation Variation Inferred from Tree Rings Since A.D. 1770 for the Western Qilian Mts., Northern Tibetan Plateau. Tree Ring Res. 2009, 65, 95–103. [Google Scholar] [CrossRef]
- Sun, J.; Liu, Y. Tree ring based precipitation reconstruction in the south slope of the middle Qilian Mountains, northeastern Tibetan Plateau, over the last millennium. J. Geophys. Res. Atmos. 2012, 117, D08108. [Google Scholar] [CrossRef]
- Chen, F.; Shang, H.; Panyushkina, I.P.; Meko, D.M.; Yu, S.; Yuan, Y.; Chen, F. Tree-ring reconstruction of Lhasa River streamflow reveals 472 years of hydrologic change on southern Tibetan Plateau. J. Hydrol. 2019, 572, 169–178. [Google Scholar] [CrossRef]
- Gou, X.; Deng, Y.; Chen, F.; Yang, M.; Fang, K.; Gao, L.; Yang, T.; Zhang, F. Tree ring based streamflow reconstruction for the Upper Yellow River over the past 1234 years. Chin. Sci. Bull. 2010, 55, 4179–4186. [Google Scholar] [CrossRef]
- Li, J.; Shao, X.; Qin, N.; Li, Y. Runoff variations at the source of the Yangtze River over the past 639 years based on tree-ring data. Clim. Res. 2018, 75, 131–142. [Google Scholar] [CrossRef]
- Keyimu, M.; Li, Z.; Liu, G.; Fu, B.; Fan, Z.; Wang, X.; Wu, X.; Zhang, Y.; Halik, U. Tree-ring based minimum temperature reconstruction on the southeastern Tibetan Plateau. Quat. Sci. Rev. 2021, 251, 106712. [Google Scholar] [CrossRef]
- Yu, J.; Liu, Q.; Meng, S.; Zhou, G.; Shah, S.; Xu, Z. Summer temperature variability inferred from tree-ring records in the central Hengduan Mountains, southeastern Tibetan Plateau. Dendrochronologia 2018, 51, 92–100. [Google Scholar] [CrossRef]
- Duan, J.; Zhang, Q.B. A 449 year warm season temperature reconstruction in the southeastern Tibetan Plateau and its relation to solar activity. J. Geophys. Res. Atmos. 2014, 119, 11578–11592. [Google Scholar] [CrossRef]
- Huang, R.; Zhu, H.; Liang, E.; Liu, B.; Shi, J.; Zhang, R.; Yuan, Y.; Grießinger, J. A tree ring-based winter temperature reconstruction for the southeastern Tibetan Plateau since 1340 CE. Clim. Dyn. 2019, 53, 3221–3233. [Google Scholar] [CrossRef]
- Liang, E.; Shao, X.; Qin, N. Tree-ring based summer temperature reconstruction for the source region of the Yangtze River on the Tibetan Plateau. Glob. Planet Chang. 2008, 61, 313–320. [Google Scholar] [CrossRef]
- Harris, I.; Osborn, T.; Jones, P.; Lister, D. Version 4 of the CRU TS monthly high-resolution gridded multivariate climate dataset. Sci. Data 2020, 7, 109. [Google Scholar] [CrossRef] [Green Version]
- Huang, B.; Thorne, P.; Banzon, V.; Boyer, T.; Chepurin, G.; Lawrimore, J.; Menne, M.; Smith, T.; Vose, R.; Zhang, H.M. Extended Reconstructed Sea Surface Temperature, Version 5 (ERSSTv5): Upgrades, Validations, and Intercomparisons. J. Clim. 2017, 30, 8179–8205. [Google Scholar] [CrossRef]
- Holmes, R. Computer-Assisted Quality Control in Tree-Ring Dating and Measurement. Tree Ring Bull. 1983, 44, 69–75. [Google Scholar]
- Fritts, H. (Ed.) The Climate—Growth System. In Tree Rings and Climate; Academic Press: Amsterdam, The Netherlands, 1976; Chapter 5; pp. 207–245. [Google Scholar]
- Cook, E. A Time Series Analysis Approach to Tree Ring Standardization. Ph.D. Thesis, University of Arizona, Tucson, AZ, USA, 1985. [Google Scholar]
- ER, C.; Kairiukstis, L. Methods of Dendrochronology: Applications in the Environmental Sciences; Springer: Amsterdam, The Netherlands, 1990; 394p. [Google Scholar]
- Wigley, T.M.L.; Briffa, K.R.; Jones, P.D. On the Average Value of Correlated Time Series, with Applications in Dendroclimatology and Hydrometeorology. J. Appl. Meteorol. 1984, 23, 201–213. [Google Scholar] [CrossRef]
- Huang, N.E.; Shen, Z.; Long, S.R.; Wu, M.C.; Shih, H.H.; Zheng, Q.; Yen, N.C.; Tung, C.C.; Liu, H.H. The empirical mode decomposition and the Hilbert spectrum for nonlinear and non-stationary time series analysis. Proc. Math. Phys. Eng. Sci. 1998, 454, 903–995. [Google Scholar] [CrossRef]
- Wu, Z.; Huang, N. Ensemble Empirical Mode Decomposition: A Noise-Assisted Data Analysis Method. Adv. Adapt. Data Anal. 2009, 1, 1–41. [Google Scholar] [CrossRef]
- Jian, Y.; Liu, Q. Tree-ring reconstruction of June–August mean minimum temperature back to 1872 AD in the Qinling Mountains, Northwest China. Quat. Sci. 2018, 38, 971–980. (In Chinese) [Google Scholar]
- Xie, C.; Li, J.; Gao, Y. Tree-ring width based autumn and winter mean temperature reconstruction and its variation over the past 137 years in southwestern Sichuan Province. Quat. Sci. 2020, 40, 252–263. (In Chinese) [Google Scholar]
- Chen, F.; Zhang, Y.; Shao, X.; Li, M.; Yin, Z.Y. A 2000-year temperature reconstruction in the Animaqin Mountains of the Tibet Plateau, China. Holocene 2016, 26, 1904–1913. [Google Scholar] [CrossRef]
- Li, M.Y.; Wang, L.; Fan, Z.X.; Shen, C.C. Tree-ring density inferred late summer temperature variability over the past three centuries in the Gaoligong Mountains, southeastern Tibetan Plateau. Palaeogeogr. Palaeoclimatol. Palaeoecol. 2015, 422, 57–64. [Google Scholar] [CrossRef]
- Liang, E.; Liu, B.; Zhu, L.; Yin, Z.Y. A short note on linkage of climatic records between a river valley and the upper timberline in the Sygera Mountains, southeastern Tibetan Plateau. Glob. Planet Chang. 2011, 77, 97–102. [Google Scholar] [CrossRef]
- Holtmeier, F.K.; Broll, G. Sensitivity and response of northern hemisphere altitudinal and polar treelines to environmental change at landscape and local scales. Glob. Ecol. Biogeogr. 2005, 14, 395–410. [Google Scholar] [CrossRef]
- Bräuning, A.; Mantwill, B. Summer temperature and summer monsoon history on the Tibetan plateau during the last 400 years recorded by tree rings. Geophys. Res. Lett. 2004, 31, L24205. [Google Scholar] [CrossRef]
- Linderholm, H.W.; Bräuning, A. Comparison of high-resolution climate proxies from the Tibetan Plateau and Scandinavia during the last millennium. Quat. Int. 2006, 154–155, 141–148. [Google Scholar] [CrossRef]
- Lowell, T.V. As Climate Changes, So Do Glaciers. Proc. Natl. Acad. Sci. USA 2000, 97, 1351–1354. [Google Scholar] [CrossRef] [Green Version]
- He, Y.; Zhang, Z.; Theakstone, W.H.; Chen, T.; Yao, T.; Pang, H. Changing features of the climate and glaciers in China’s monsoonal temperate glacier region. J. Geophys. Res. Atmos. 2003, 108, 4530. [Google Scholar] [CrossRef]
- Xu, X.; Yi, C. Little Ice Age on the Tibetan Plateau and its bordering mountains: Evidence from moraine chronologies. Glob. Planet Chang. 2014, 116, 41–53. [Google Scholar] [CrossRef]
- Xu, P.; Zhu, H.; Shao, X.; Yin, Z. Tree ring-dated fluctuation history of Midui glacier since the little ice age in the southeastern Tibetan plateau. Sci. China Earth Sci. 2012, 55, 521–529. [Google Scholar] [CrossRef]
- Wen, K.G. China Meteorological Calamity Grand Ceremony: Sichuan; Meteorological Press: Beijing, China, 2005. (In Chinese) [Google Scholar]
- Duan, J.; Wang, L.; Li, L.; Chen, K. Temperature variability since A.D. 1837 inferred from tree-ring maximum density of Abies fabri on Gongga Mountain, China. Chin. Sci. Bull. 2010, 55, 3015–3022. [Google Scholar] [CrossRef]
- Allan, R.; Lindesay, J.; Parker, D. El Nino Southern Oscillation and climatic variability. Oceanogr. Lit. Rev. 1997, 44, 555. [Google Scholar]
- Bradley, R.S.; Diaz, H.F.; Kiladis, G.N.; Eischeid, J.K. ENSO signal in continental temperature and precipitation records. Nature 1987, 327, 497–501. [Google Scholar] [CrossRef]
- Zhu, H.; Shao, X.; Yin, J.; Xu, P.; Xu, Y.; Tian, H. August temperature variability in the southeastern Tibetan Plateau since AD 1385 inferred from tree rings. Palaeogeogr. Palaeoclimatol. Palaeoecol. 2011, 305, 84–92. [Google Scholar] [CrossRef]
- Gu, G.; Adler, R.F. Precipitation and Temperature Variations on the Interannual Time Scale: Assessing the Impact of ENSO and Volcanic Eruptions. J. Clim. 2011, 24, 2258–2270. [Google Scholar] [CrossRef] [Green Version]
- Trenberth, K.E.; Caron, J.M.; Stepaniak, D.P.; Worley, S. Evolution of El Niño-Southern Oscillation and global atmospheric surface temperatures. J. Geophys. Res. Atmos. 2002, 107, 4065. [Google Scholar] [CrossRef]
- Krishnamurthy, V.; Goswami, B.N. Indian Monsoon-ENSO Relationship on Interdecadal Timescale. J. Clim. 2000, 13, 579–595. [Google Scholar] [CrossRef]
- Su, M.; Wang, H. Relationship and its instability of ENSO—Chinese variations in droughts and wet spells. Sci. China Ser. D Earth Sci. 2007, 50, 145–152. [Google Scholar] [CrossRef]
- Braun, H.; Christl, M.; Rahmstorf, S.; Ganopolski, A.; Mangini, A.; Kubatzki, C.; Roth, K.; Kromer, B. Possible solar origin of the 1,470-year glacial climate cycle demonstrated in a coupled model. Nature 2005, 438, 208–211. [Google Scholar] [CrossRef] [PubMed] [Green Version]
- Li, M.; Duan, J.; Wang, L.; Zhu, H. Late summer temperature reconstruction based on tree-ring density for Sygera Mountain, southeastern Tibetan Plateau. Glob. Planet Chang. 2018, 163, 10–17. [Google Scholar] [CrossRef]
- Li, M.; Huang, L.; Yin, Z.Y.; Shao, X. Temperature reconstruction and volcanic eruption signal from tree-ring width and maximum latewood density over the past 304 years in the southeastern Tibetan Plateau. Int. J. Biometeorol. 2017, 61, 2021–2032. [Google Scholar] [CrossRef]
- Yang, B.; Kang, X.; Bräuning, A.; Liu, J.; Qin, C.; Liu, J. A 622-year regional temperature history of southeast Tibet derived from tree rings. Holocene 2010, 20, 181–190. [Google Scholar] [CrossRef]
- Mantua, N.J.; Hare, S.R.; Zhang, Y.; Wallace, J.M.; Francis, R.C. A Pacific Interdecadal Climate Oscillation with Impacts on Salmon Production. Bull. Am. Meteorol. Soc. 1997, 78, 1069–1079. [Google Scholar] [CrossRef]
- Zhang, Y.; Shao, X.M.; Yin, Z.Y.; Wang, Y. Millennial minimum temperature variations in the Qilian Mountains, China: Evidence from tree rings. Clim. Past 2014, 10, 1763–1778. [Google Scholar] [CrossRef] [Green Version]


| Calibration | Verification | |||||||||
|---|---|---|---|---|---|---|---|---|---|---|
| Period | r | R | R | F | Period | r | ST | ST1 | RE | CE |
| 1962–1990 | 0.574 | 0.330 | 0.305 | 13.30 | 1991–2019 | 0.699 | 22+/7− | 17+/11− | 0.267 | −0.03 |
| 1991–2019 | 0.699 | 0.489 | 0.470 | 25.79 | 1962–1990 | 0.574 | 20+/9− | 17+/11− | 0.103 | −0.20 |
| 1962–2019 | 0.579 | 0.336 | 0.324 | 28.30 | ||||||
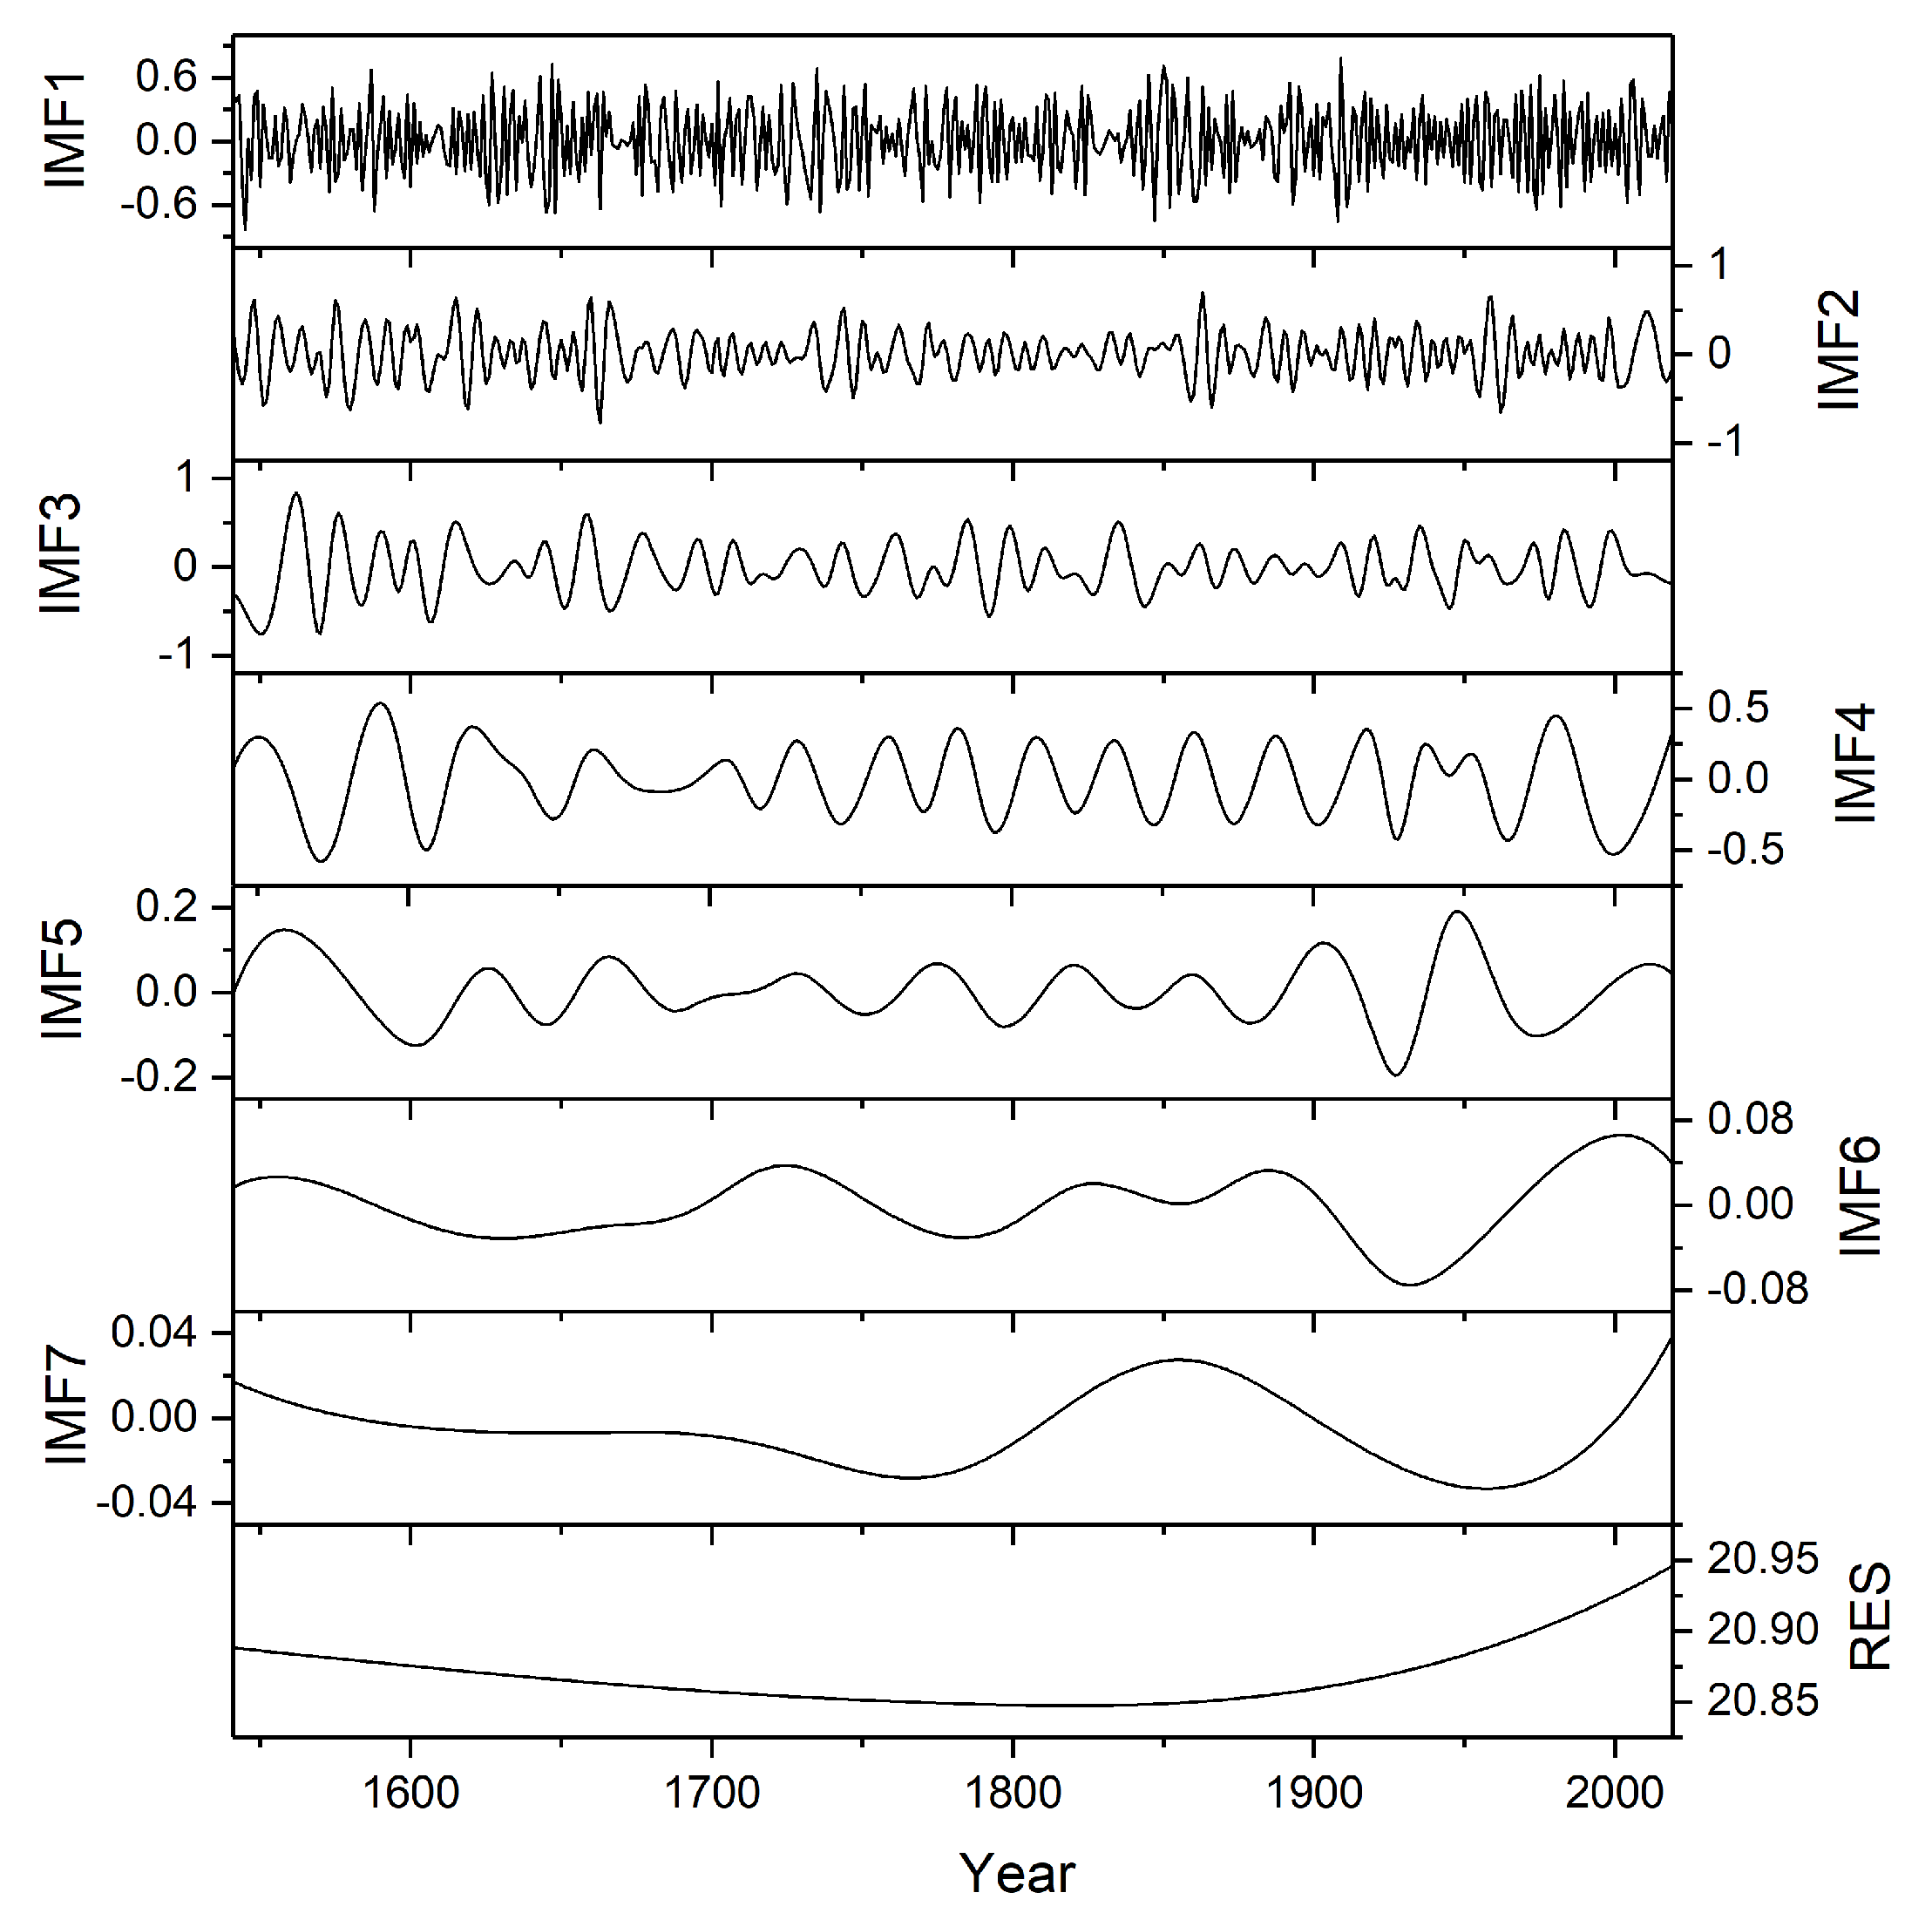
| Variable | IMF1 | IMF2 | IMF3 | IMF4 | IMF5 | IMF6 | IMF7 | RES |
|---|---|---|---|---|---|---|---|---|
| Major cycle (a) | 2.9–4.2 | 4.5–8.3 | 11.1–15.4 | 20–33.3 | 50.4 | 159.7 | 250 | |
| Contribution (%) | 35.11 | 19.50 | 23.98 | 19.28 | 1.58 | 0.30 | 0.09 | 0.15 |
| Correlation coefficient | 0.569 | 0.554 | 0.565 | 0.471 | 0.145 | 0.023 | 0.030 | 0.001 |
Publisher’s Note: MDPI stays neutral with regard to jurisdictional claims in published maps and institutional affiliations. |
© 2021 by the authors. Licensee MDPI, Basel, Switzerland. This article is an open access article distributed under the terms and conditions of the Creative Commons Attribution (CC BY) license (https://creativecommons.org/licenses/by/4.0/).
Share and Cite
Zhang, Y.; Li, J.; Zheng, Z.; Zeng, S. A 479-Year Early Summer Temperature Reconstruction Based on Tree-Ring in the Southeastern Tibetan Plateau, China. Atmosphere 2021, 12, 1251. https://doi.org/10.3390/atmos12101251
Zhang Y, Li J, Zheng Z, Zeng S. A 479-Year Early Summer Temperature Reconstruction Based on Tree-Ring in the Southeastern Tibetan Plateau, China. Atmosphere. 2021; 12(10):1251. https://doi.org/10.3390/atmos12101251
Chicago/Turabian StyleZhang, Yu, Jinjian Li, Zeyu Zheng, and Shenglan Zeng. 2021. "A 479-Year Early Summer Temperature Reconstruction Based on Tree-Ring in the Southeastern Tibetan Plateau, China" Atmosphere 12, no. 10: 1251. https://doi.org/10.3390/atmos12101251
APA StyleZhang, Y., Li, J., Zheng, Z., & Zeng, S. (2021). A 479-Year Early Summer Temperature Reconstruction Based on Tree-Ring in the Southeastern Tibetan Plateau, China. Atmosphere, 12(10), 1251. https://doi.org/10.3390/atmos12101251