Article

Multi-Media Exposure to Polycyclic Aromatic Hydrocarbons at Lake Chaohu, the Fifth Largest Fresh Water Lake in China: Residual Levels, Sources and Carcinogenic Risk

1
School of Energy and Environmental Engineering, University of Science and Technology Beijing, Beijing 100083, China
2
MOE Laboratory for Earth Surface Processes, College of Urban & Environmental Sciences, Peking University, Beijing 100871, China
3
Ministry of Education Key Laboratory Groundwater Circulation & Environmental Evolution, China University Geosciences Beijing, Beijing 100083, China
4
Beijing Municipal Key Lab Agriculture Environment Monitoring, Beijing 100097, China
5
State Key Laboratory of Lake Science and Environment, Nanjing Institute of Geography & Limnology, Chinese Academy of Sciences, Nanjing 210008, China
6
Center for Environmental Health Risk Assessment and Research, Chinese Research Academy of Environmental Sciences, Beijing 100012, China
7
China CDC Key Laboratory of Environment and Population Health, National Institute of Environmental Health, Chinese Center for Disease Control and Prevention, Beijing 100021, China
*
Author to whom correspondence should be addressed.
Atmosphere 2021, 12(10), 1241; https://doi.org/10.3390/atmos12101241
Submission received: 20 July 2021 / Revised: 14 September 2021 / Accepted: 19 September 2021 / Published: 23 September 2021
(This article belongs to the Special Issue Assessing Atmospheric Pollution and Its Impacts on the Human Health)

Abstract

:
The residual levels of 16 priority polycyclic aromatic hydrocarbons (PAHs) in environment media and freshwater fish were collected and measured from Lake Chaohu by using Gas chromatography-mass spectrometry. Potential atmospheric sources were identified by molecular diagnostic ratios and the positive matrix factorization (PMF) method. PAH exposure doses through inhalation, intake of water and freshwater fish ingestion were estimated by the assessment model recommended by US EPA. The carcinogenic risks of PAH exposure were evaluated by probabilistic risk assessment and Monte Carlo simulation. The following results were obtained: (1) The PAH16 levels in gaseous, particulate phase, water and fish muscles were 59.4 ng·m−3, 14.2 ng·m−3, 170 ng·L−1 and 114 ng·g−1, respectively. No significant urban-rural difference was found between two sampling sites except gaseous BaPeq. The relationship between gaseous PAHs and PAH in water was detected by the application of Spearman correlation analysis. (2) Three potential sources were identified by the PMF model. The sources from biomass combustions, coal combustion and vehicle emission accounted for 43.6%, 30.6% and 25.8% of the total PAHs, respectively. (3) Fish intake has the highest lifetime average daily dose (LADD) of 3.01 × 10⁻⁶ mg·kg−1·d−1, followed by the particle inhalation with LADD of 2.94 × 10⁻⁶ mg·kg−1·d−1. (4) As a result of probabilistic cancer risk assessment, the median ILCRs were 3.1 × 10⁻⁵ to 3.3 × 10⁻⁵ in urban and rural residents, which were lower than the suggested serious level but higher than the acceptable level. In summary, the result suggests that potential carcinogenic risk exists among residents around Lake Chaohu. Fish ingestion and inhalation are two major PAH exposure pathways.

1. Introduction

Polycyclic aromatic hydrocarbons (PAHs) are globally concerned pollutants because of their widespread occurrence, strong persistence and long-range transportation potential [1]. Furthermore, they possess potential toxicity, mutagenicity and carcinogenicity [2,3,4]. Studies have shown that human cancer causes of skin, lungs and bladder have always been associated with PAHs [5,6,7,8], and 16 PAHs are included on the priority pollutants list of the US EPA. PAHs have a wide variety of sources, including coal combustion, vehicle emission, coking industry and biomass burning [9,10,11]. After being emitted into the environment, PAHs may redistribute in environmental media and result in people being exposed to these pollutants through multiple pathways, including breathing in polluted air and particles, drinking water, dietary intake and dermal contact with contaminated soil [12,13]. Multi-media distribution and multi-pathway exposure render the assessment of PAH exposure complicated. Therefore, accurately evaluating the contribution of each exposure pathway, characterizing the carcinogenic risk and identifying the sensitive parameters in the exposure process are crucial to the management of PAH emission.
Water bodies act either as a sink [14] or as a source [15] for PAHs in the environment. The atmospheric PAHs can enter water system through wet deposition, dry deposition and gas exchange across the air–water interface [16,17,18]. Meanwhile, PAHs in water may accumulate in aquatic organisms by direct uptake from water through gills or skin or by the ingestion of suspended particles and contaminated food [19]. Residents living near the lake can be exposed to PAHs by inhaling polluted air and ingesting water and aquatic products.
Lake Chaohu is located in the Anhui Province, which belongs to one of the most developed areas in China, Yangtze River Delta Economic Zone. During the last decades, the PAHs’ emission in China, especially in the above-mentioned areas, increased greatly due to the increasing energy demand associated with rapid population growth and economic development and to the low efficiency of energy utilization [20]. Chaohu is famous for its fresh water fish. It is also the drinking water source of large cities such as Hefei and Maanshan. PAH pollution in water system of Chaohu may increase the risk of residents’ exposure through fish ingestion and drinking water. Therefore, in recent years, PAH exposure in Lake Chaohu has become a topic of concern. Some studies have been conducted on the PAH residual levels in environment media, source apportionment or environment behaviors [21,22,23,24,25]. Despite the progress in these directions, studies on three issues remain scarce. First, comparison among exposure contribution from different pathways are seldom reported. Second, carcinogenic risk due to total exposure remains unclear. Third, the factors influencing risk assessment are seldom studied. Hence, further studies on PAHs should be performed in order to obtain a comprehensive understanding of the risk profile of PAHs exposure among Chaohu residents.
In this research, EPA priority control PAHs were selected as target chemicals due to their extensive residence in the environment and their threat to public health. The contents of 16 l PAHs in air, particles, lake water and aquatic organisms were measured; physiological and behavior parameters influencing PAH exposure were collected; potential sources were identified; and cancer risks were calculated by US EPA model. The aims of this study were to elucidate the characteristics of multi-media PAH exposure of residents and to provide information for PAH management near Lake Chaohu.

2. Materials and Methods

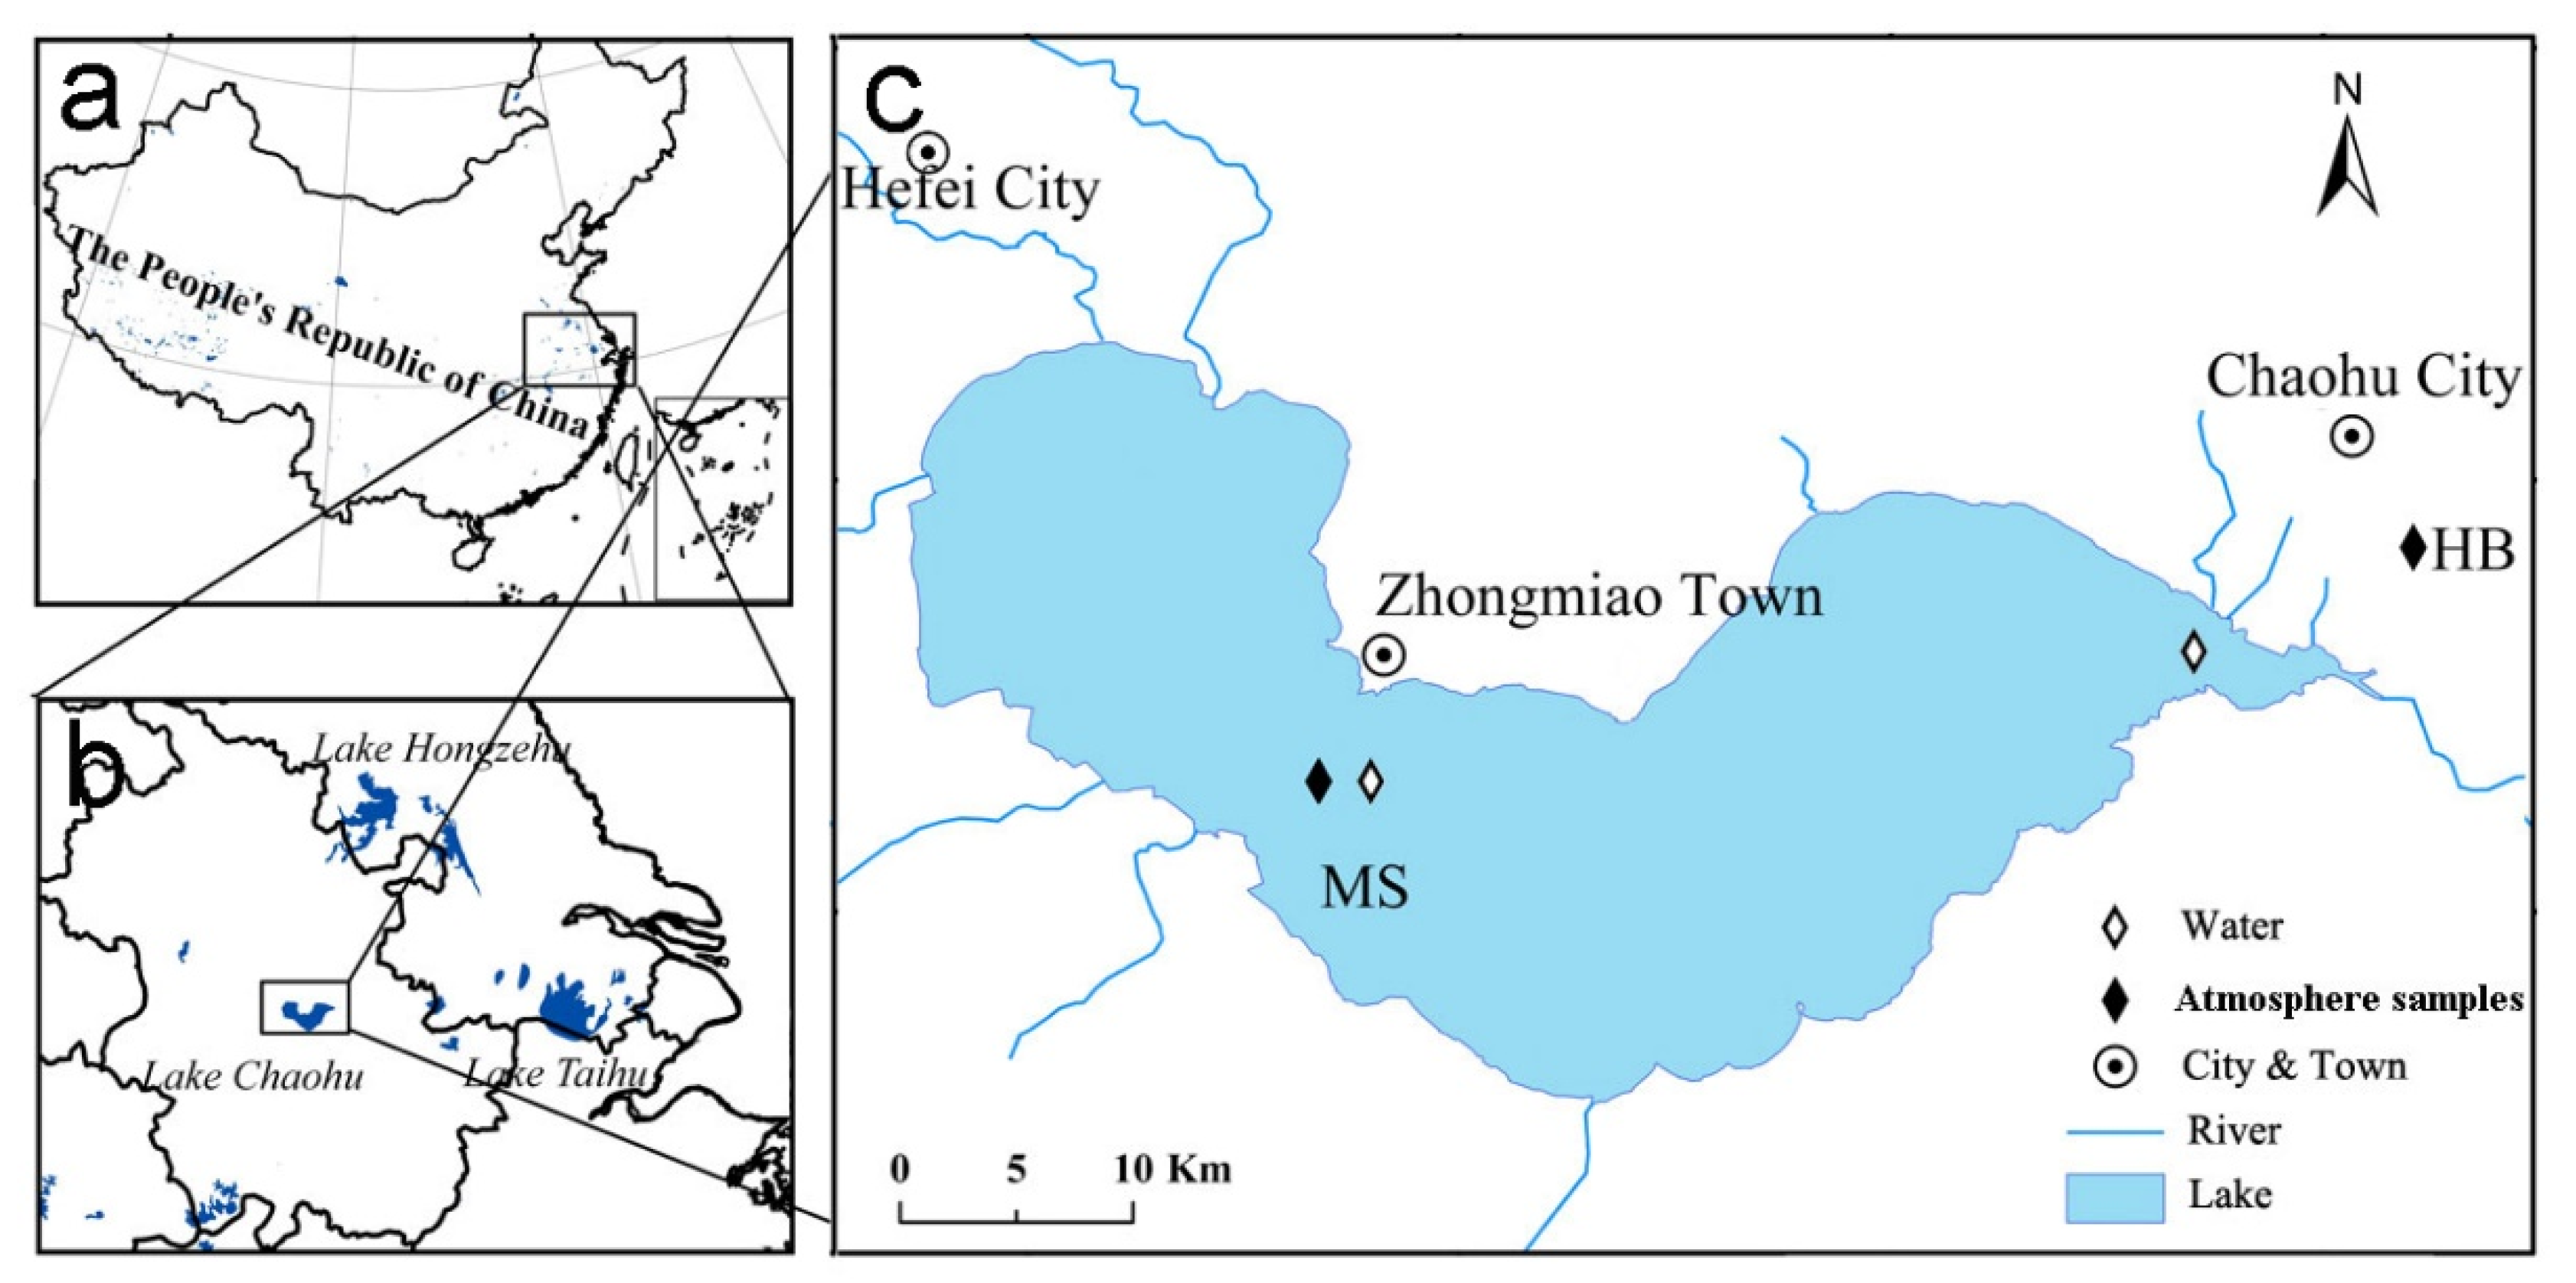
2.1. Sample Collection and Pretreatment

Two sampling sites were selected near Chaohu City and Zhongmiao Town as urban and rural sites (Figure 1). Atmosphere samples were collected once a month from May 2010 to April 2011 by high-volume samplers. Polyurethane foam (PUF) disk and glass fiber filter (GFF) were used to collect gaseous phase and particulate phase PAHs, respectively. Water was collected from two sampling sites selected near the atmospheric sites. After shaking and mixing, a one liter aliquot of each collected water sample was filtered through a 0.45 μm glass fiber filter using a filtration device consisting of a peristaltic pump (80EL005, Millipore Co., Billerica, MA, USA). Edible aquatic organisms, including spotted steed (Hemibarbus maculatus, HM), carp (Cyprinus carpio, CC), snail (Cipangopaludina chinensis Gray, CCG), topmouth culter (Culter eryropterus, CE), bluntnose black bream (Megalobrama amblycephala, MA), Chinese white prawn (Leander modestus Heller, LMH), whitebait (Hemisalanx prognathus Regan, HPR) and bighead carp (Aristichthys nobilis, AN), were randomly collected in the lake.
In the laboratory, PUF and GFF samples were added with surrogate standards of 2-fluoro-1, 10-biphenyl and p-terphenyl-d14 (J&K Scientific, Beijing, China, 2.0 mg mL 1) before measurement. The PUF was Soxhlet extracted with 150 mL 1:1 mixture of n-hexane and acetone for 8 h. GFF was extracted by 25 mL hexane/acetone mixture (1:1) using a microwave accelerated reaction system (CEM Corporation, Matthews, NC, USA). Microwave power was set at 1200 W, and the temperature program was set to the following: ramp up to 100 °C in 10 min and held at 100 °C for another 10 min. Both PUF and GFF extracts were concentrated to 1 mL by rotary evaporation at a temperature below 38 °C and then transferred to a silica/alumina chromatography for cleanup. The elution solution was collected, concentrated, conversed to hexane solution and then added with internal standards (Nap-d8, Ace-d10, Ant-d10, Chr-d12 and Perylene-d12, J&K Scientific Ltd., Beijing, China).
The water samples were extracted by using a solid phase extraction (SPE) system (Supelco, Bellefonte, PA, USA). C18 cartridges (500 mg, 6 mL, Supelco, Bellefonte, PA, USA) were prewashed with dichloromethane (DCM) and conditioned with methanol and de-ionized water. A 1 L water sample was added with surrogate standards, passed through the SPE system and was extracted. The cartridges were eluted with 10 mL of dichloromethane. The volume of the extracts was reduced by a vacuum rotary evaporator in a water bath and was adjusted to a volume of 1 mL with hexane. Internal standards were added for analysis.
The fish samples were pretreated on the same day after being delivered back to the temporary laboratory. The muscles on both sides of the dorsal and chest were mixed. After obtaining the wet weight, the samples were freeze dried (FDU-830, Tokyo Rikakikai Co., Tokyo, Japan) and grounded into a granular powder with a ball mill (MM400, Retsch GmbH, Haan, Germany). Two gram powder samples were weighed into an extraction tube, and the surrogate standards were added to the samples to indicate recovery. After microwave extraction, the extracts were pressure filtered and concentrated to approximately 1 mL and cleansed by GPC instrument (GPC800+, Lab Tech Ltd., Hongkong, China) with a Bio Beads SX-3 column (300 mm × 20 mm, Bio-Rad Laboratories, Inc., Hercules, CA, USA). Subsequently the concentrate was loaded in a silica gel SPE cartridge (6 mL, 500 mg, Supelco Co., Bellefonte, PA, USA). The cartridge was eluted by hexane and mixed solution of dichloromethane and hexane. The extracts were concentrated to 1 mL, transferred to vials, added with internal standards and sealed for analysis. The details of experiment have been reported in previous research [19,26].

2.2. Instrument Analysis

The samples were analyzed by using Agilent 6890 gas chromatography and a 5976C mass spectrometer detector with a HP-5MS fused silica capillary column (30 m × 0.25 mm × 0.25 μm). Helium was used as the carrier gas at a flow of 1 mL/min. The samples (1 μL) were injected by the autosampler under a splitless mode at a temperature of 220 °C. The column temperature program was as follows: 50 °C for 2 min, 10 °C/min to 150 °C, 3 °C/min for 240 °C, 240 °C for 5 min, 10 °C/min for 300 °C and 300 °C for 5 min. The ion source temperature of the mass spectrometer was 200 °C, the temperature of the transfer line was 250 °C and the temperature of the quadrupole was 150 °C. The compounds were quantified in the selected ion mode, and the calibration curve was quantified with the internal standard. There were three parallel samples in each species. The method blanks and procedure blanks were prepared following the same procedure.
The quantification was performed by the internal standard method. All of the solvents used were HPLC-grade pure (J&K Chemical, Beijing, China). All of the glassware was cleaned by using an ultrasonic cleaner (KQ-500B, Kun Shan Ultrasonic Instruments Co., Ltd., Kunshan, China) and heated to 400 °C for 6 h. In the sampling process, three parallel samples were been collected from each sample site. The laboratory blanks and sample blanks were analyzed with the true samples. A total of 16 priority control PAHs were measured. The PAH individuals, abbreviations as well as method recoveries in different environment media and aquatic organisms are shown in Table 1.

2.3. Positive Matrix Factorization (PMF)

In this study, positive matrix factorization method was applied in order to quantitatively identify the major sources. PMF is a useful factorization methodology that can determine source profile and contribution [27,28]. The PMF model can be expressed as follows:
X = G F + E
where X is the concentration matrix, consisting of n samples and m concentrations of the compounds (n × m); G is the factor contribution matrix; F is the factor profile matrix; and E (n × m) is the residual matrix. The elements of residual matrix are denoted as the following:
e i j = x i j k = 1 p g i k f k i
where xij, fki and gik are the corresponding elements of X, F and G, respectively. Non-negativity constraints are imposed on the contribution and profile matrices, and PMF simultaneously weights individual data points based on uncertainty. Q(E) is an object function and a criterion for the model, defined as the following:
Q ( E ) = i = 1 n j = 1 m ( e i j / s i j ) 2
where sij is the uncertainty of the jth compound in the ith sample.

2.4. Multi-Pathway Exposure and Risk Assessment

The BaP equivalent concentration (BaPeq) and toxicity equivalency factors (TEFs) were used to express the effects of exposure to mixtures of PAHs on health [29]. BaPeq is directly derived from the mass concentrations of different PAHs using TEFs. Therefore, they can be directly compared and contrasted [30]. In order to evaluate the total exposure to dietary PAHs, BaPeq based on BaP toxicity was determined using the following equation:
B a P e q =   C i × T E F
where Ci is the concentration of the PAH species in food, and TEFi is the toxic equivalence factor of the PAH’s congener i. (Table 1).
In accordance with the Exposure Factors Handbook [31], the lifetime average daily dose (LADD) of PAH exposure through inhalation (air and particle), aquatic product ingestion, and water intake was calculated as follows:
L A D D = C × I R × E F × E D B W × A T
where C is the concentration of PAHs in the environment media, and IR is the intake rate of PAHs through inhalation (IRinh, m3·day−1), water intake rate (IRwater, mL·day−1) and aquatic product intake rate (IRinh, g·day−1). EF is the exposure frequency (day·year−1); ED is the exposure duration (year); and BW is body weight (kg). AT is the average lifespan for carcinogens.
High uncertainty exists in risk assessment. Sample measurement errors were inevitable. There are also uncertainties in the parameters and estimates. In probabilistic risk assessment, exposure parameters are considered as random variables. In order to quantify experiment uncertainty and its impact on the estimation of expected risk, a 10,000 times Monte Carlo (MC) technique was used. The Crystal Ball software was employed to implement MC simulation.

3. Results and Discussions

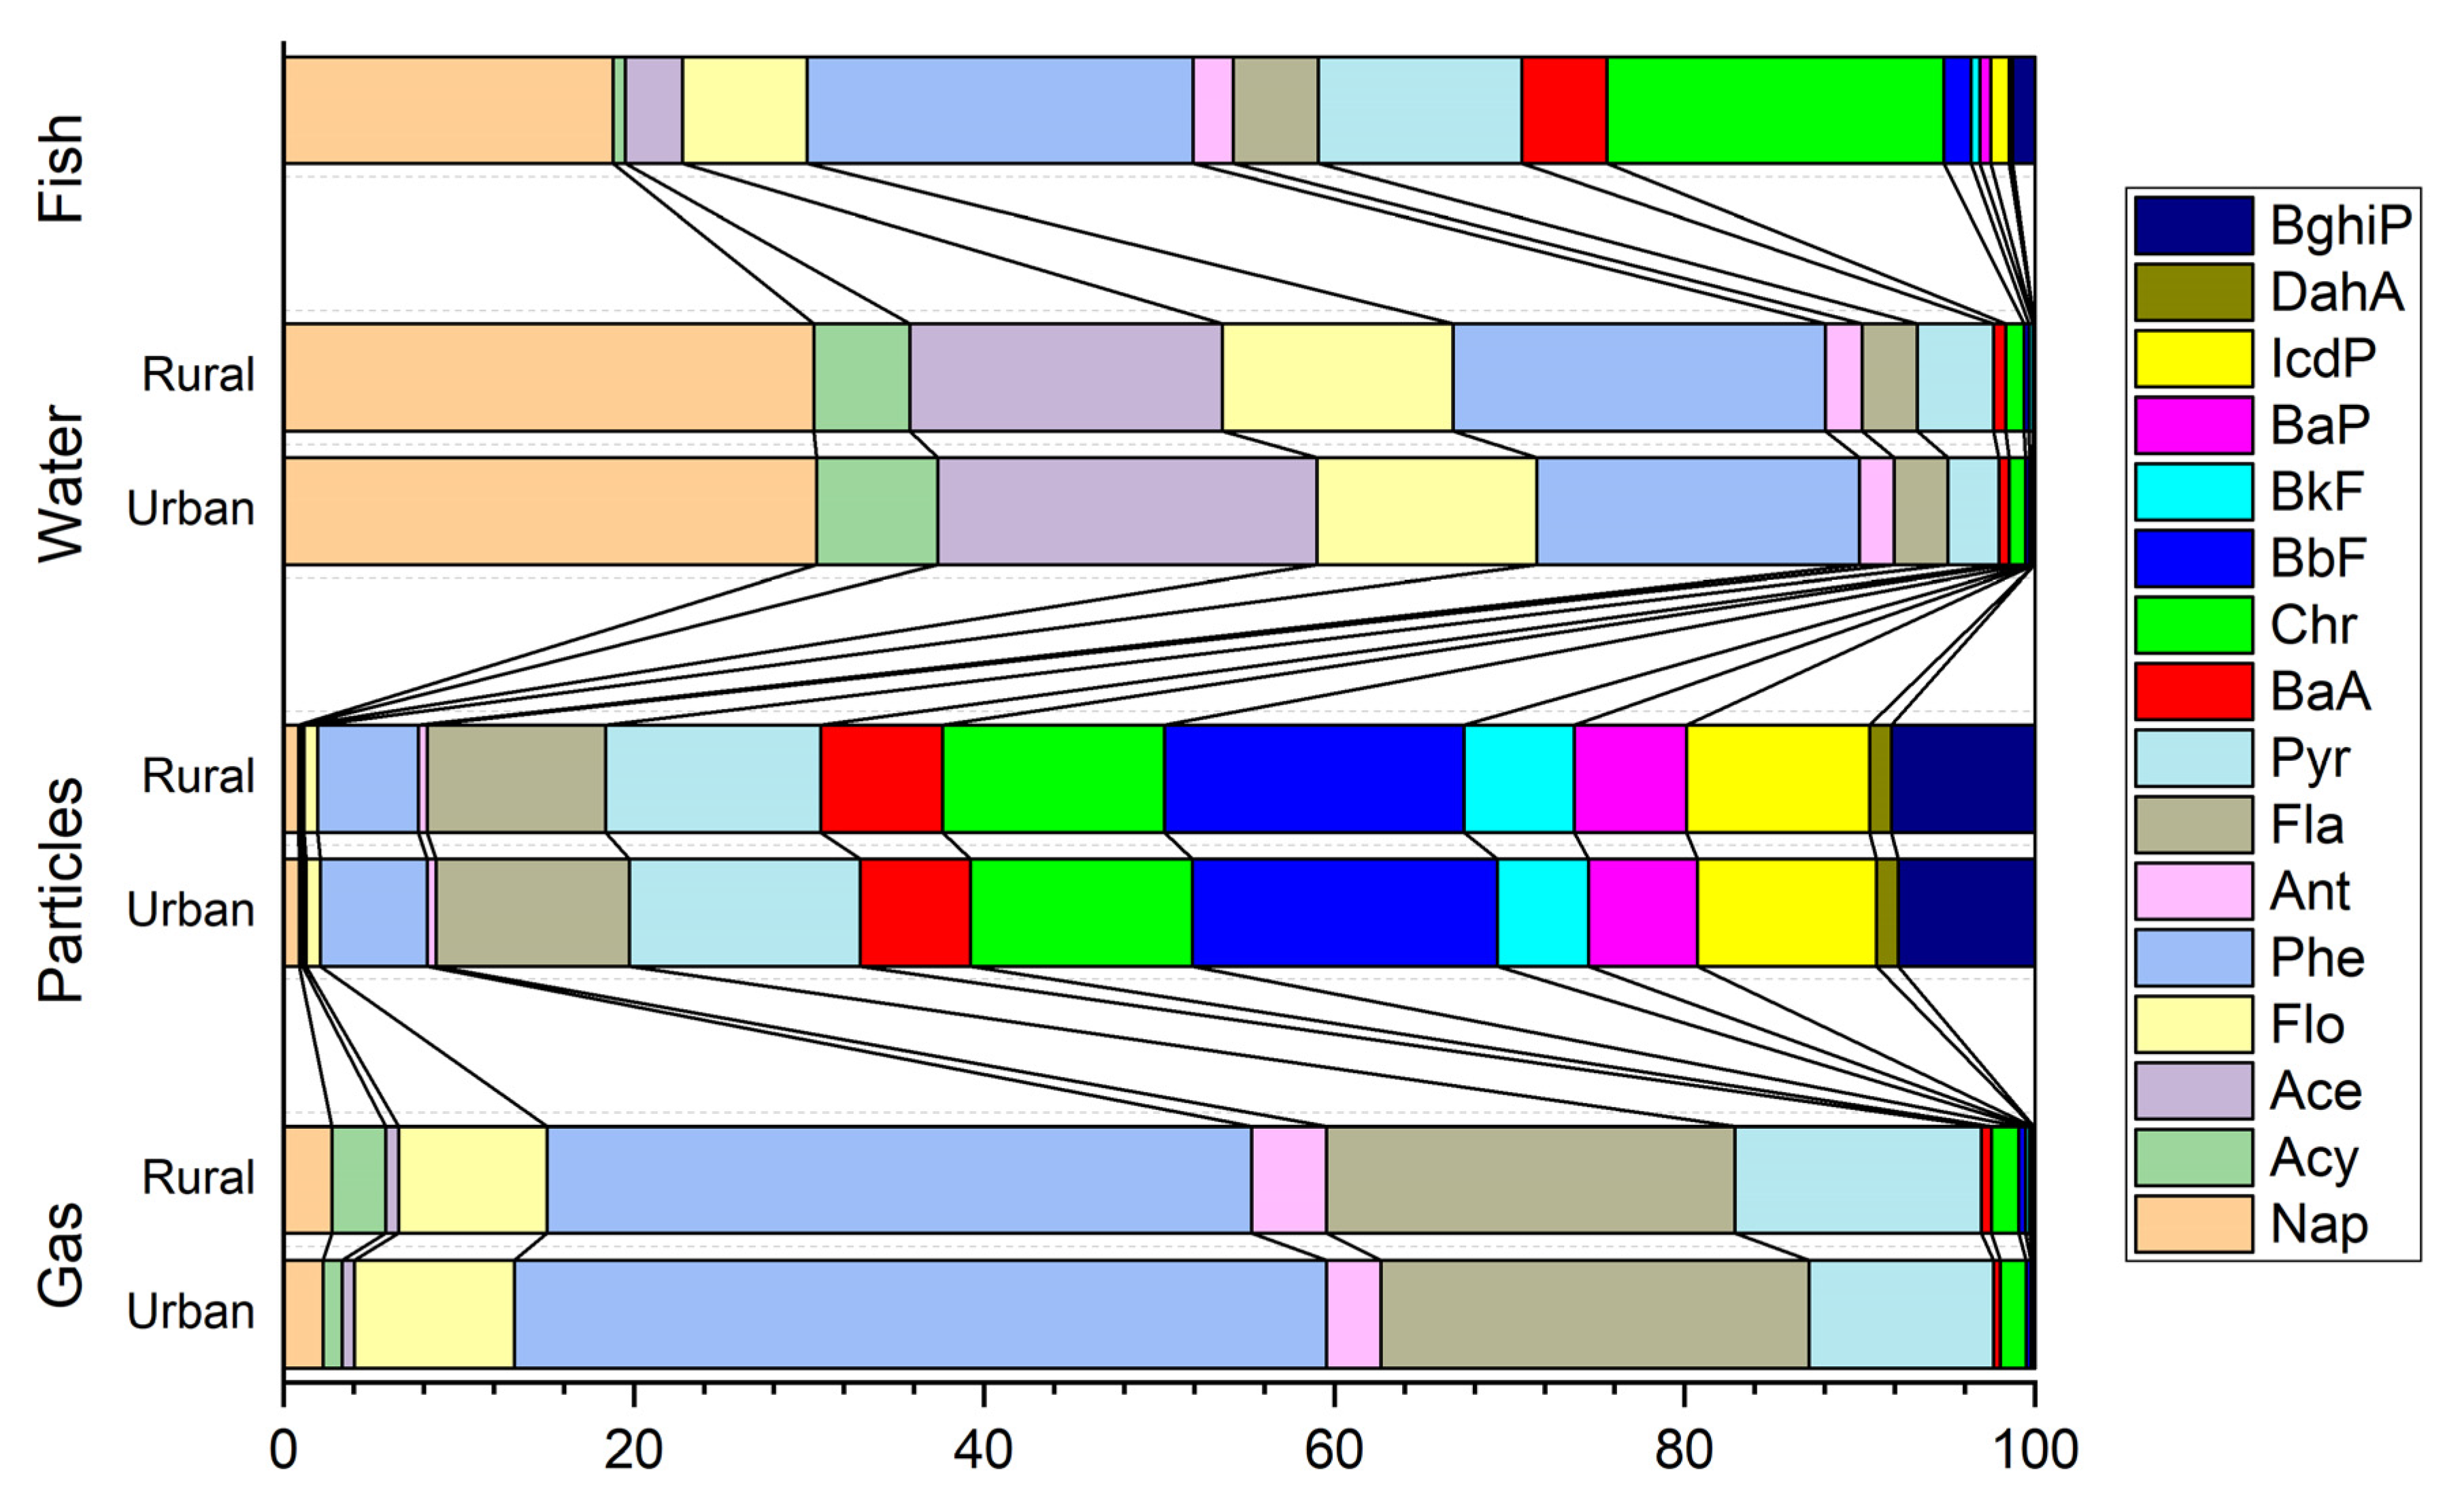
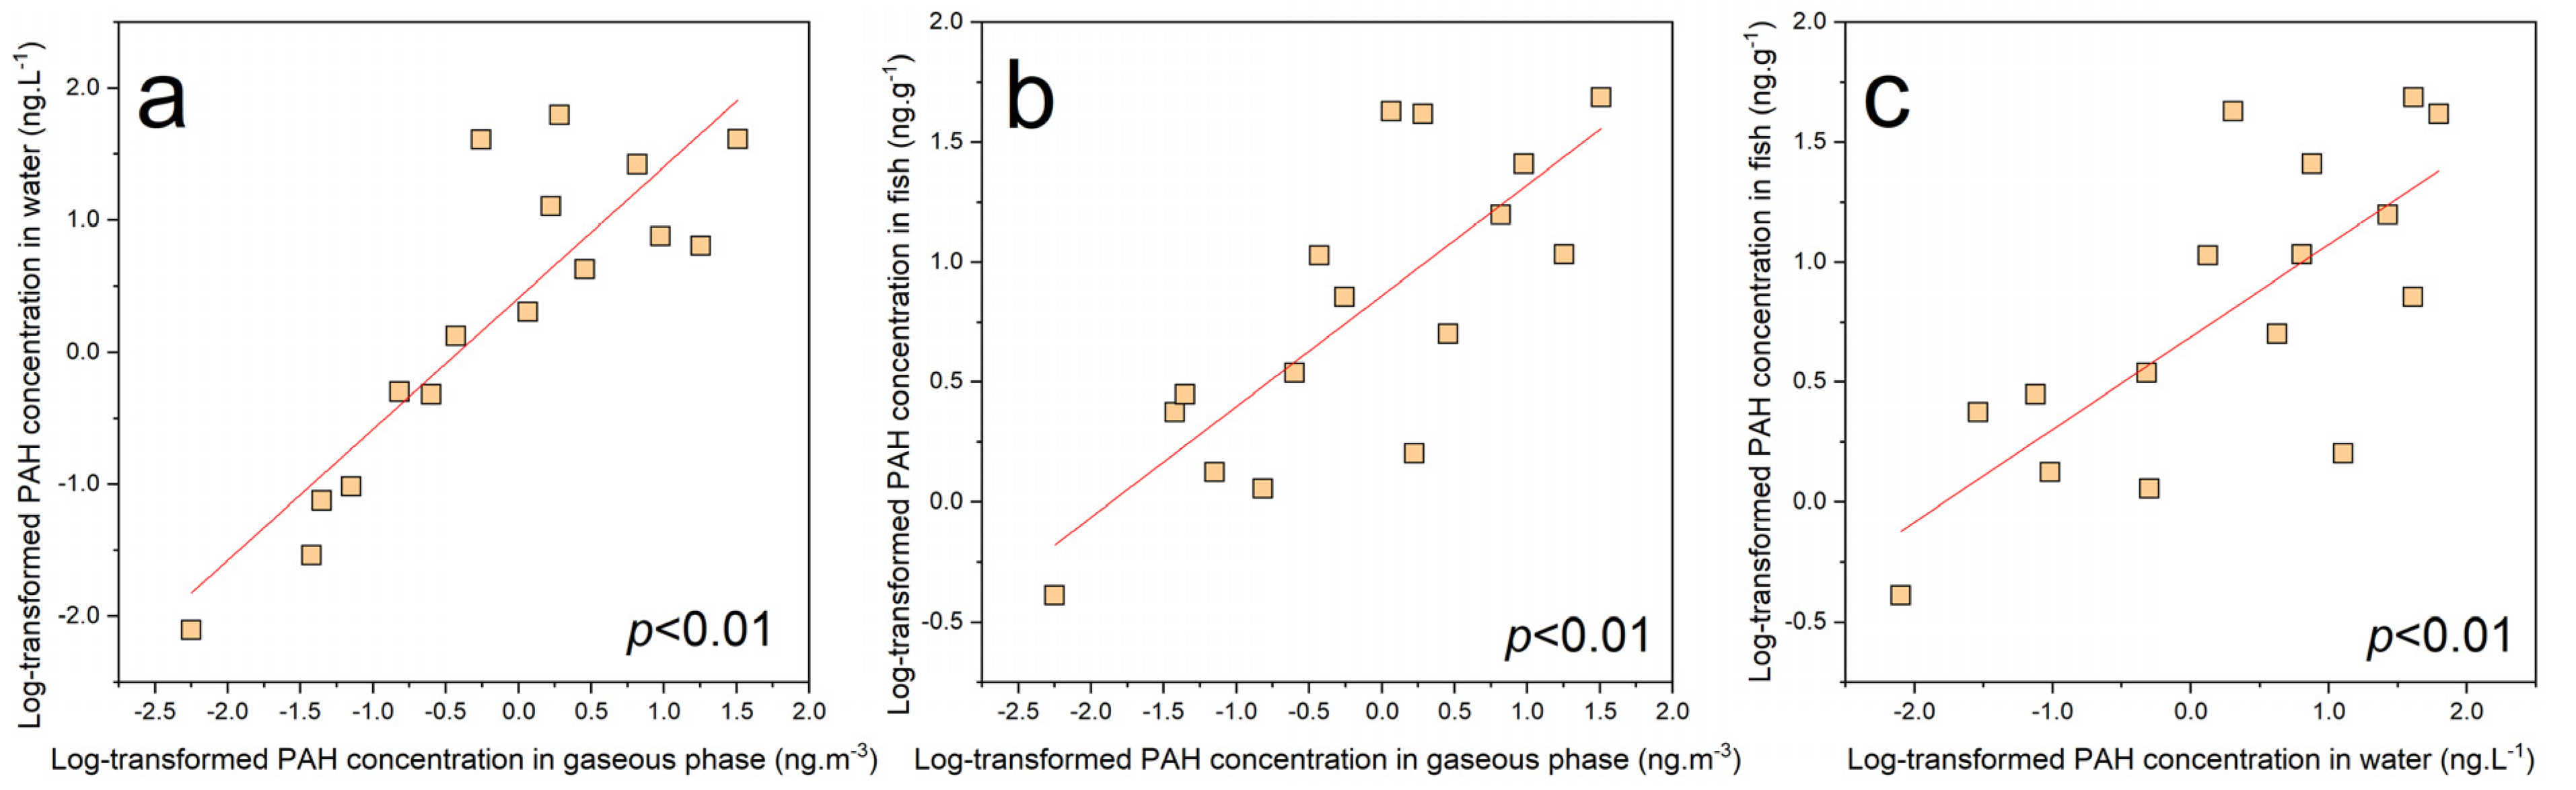
3.1. PAH Residual Levels in Environment Media

The levels of PAHs in the environmental media from Lake Chaohu are presented in Table 2. Sixteen priority PAHs were all detected during both the gaseous phase and particulate phase. In comparison, the detection rates of PAHs with higher than four rings in the water phase were very low due to their poor hydrophilic. The total concentrations of 16 priority PAHs (PAH16) in gaseous and particulate phases were 59.4 ± 51.4 ng·m−3 and 14.2 ± 23.5 ng·m−3, respectively. The average gaseous PAH16 concentrations in urban and rural sites were 3.59 times and 4.95 times higher than in particles. The atmospheric PAH16 residual level in this study was lower than the values reported in Guangzhou (337 ng·m−3) [32] and in Tianjin (752 ng·m−3) [33], but it was greater than the highest level reported in mountain Taishan (9.07 ng·m−3) [34]. Compared with data reported abroad, the PAH16 level was higher than data reported in Chesapeake Bay (5.31~71.6 ng·m−3) [35], Athens (4.8~76 ng·m−3) [36] and in southwest Europe (0.32 ng·m−3) [37]. PAH16 in the muscle of fish from Chaohu Lake (also including snail and shrimp) was also comparable with data reported from other freshwater fish in Hebei (4.76–144 ng/g) [20] and less than data reported in Shanxi (160 ng/g) [38]. Generally speaking, the PAH16 contents in environment media and fish indicated a low PAH pollution level in Lake Chaohu. In order to compare the toxicity of difference environment media, the concentrations were converted to BaPeq concentrations. Although the gaseous phase had much higher PAH16 content, the BaPeq was much higher in particles. The particulate BaPeq in urban and rural were 11.2 and 5.51 times higher than those in the gaseous phase. The difference between PAH16 and BaPeq can be attributed to PAH composition in gas and particles.
Spatial difference between urban and rural sites were compared by using the Kruskal–Wallis test. No significant difference was found between two sampling sites except gaseous BaPeq. A p < 0.05 significant difference was detected between urban and rural gaseous BaPeq concentrations. The results showed that the concentrations in most environment media were similar in urban and rural area. There may be two reasons accounting for the small spatial difference. First, both Chaohu City and Zhongmiao Town had small populations. No obvious different lifestyle was found between people in urban and rural areas. In particular, there is no obvious heating season in the area around Chaohu. Thus, local emission sources in urban and rural area were not obvious. Second, the city and the town were far away from the local thermal power plant and other industrial pollution sources, resulting in low local pollution levels.
The PAH compositions in environment media were illustrated in Figure 2. It can be observed that the water phase was dominated by the low molecular PAHs. PAHs with less than three rings accounted for 95.0% and 93.3% of total PAHs in water. The same ratios in gaseous phase were 87.1% and 82.9% in urban and rural samples. In the particulate phase, however, the PAHs with more than or equal to four rings contributed to 80.2% and 81.6% of the total PAHs. The high proportion of high molecular weight PAHs results in the increase in toxicity due to the high TEF of high molecular weight PAHs.
Spearman’s correlation analysis was used to detect the relationship between content of PAHs in gaseous, particulate phase, water and in aquatic animals. As a result, a significant positive correlation was found between gaseous phase and water phase (Figure 3a). It is reported that wet deposition, dry deposition and gas exchange across the air–water interface are the three major ways that PAHs can enter the water system. The result suggested that gas exchange across the air–water interface is probably an important way for atmospheric PAHs to affect the aquatic system [39]. In contrast, the relationship between particulate and dissolved PAHs was not significant (p = 0.116). This can be partly explained by the solubility of different composition in particles and gas phase. The solubility of high molecular weight PAHs was lower than the solubility of those with low molecular weight. On the other hand, high molecular weight PAHs dominated the particle component. Thus, concentration levels of PAHs in particles had a weak correlation with their concentration levels in water. Significant positive correlation was also found between PAH in water and in fish tissues, which indicates the effect of environmental concentration on organisms.

3.2. Source Apportionment

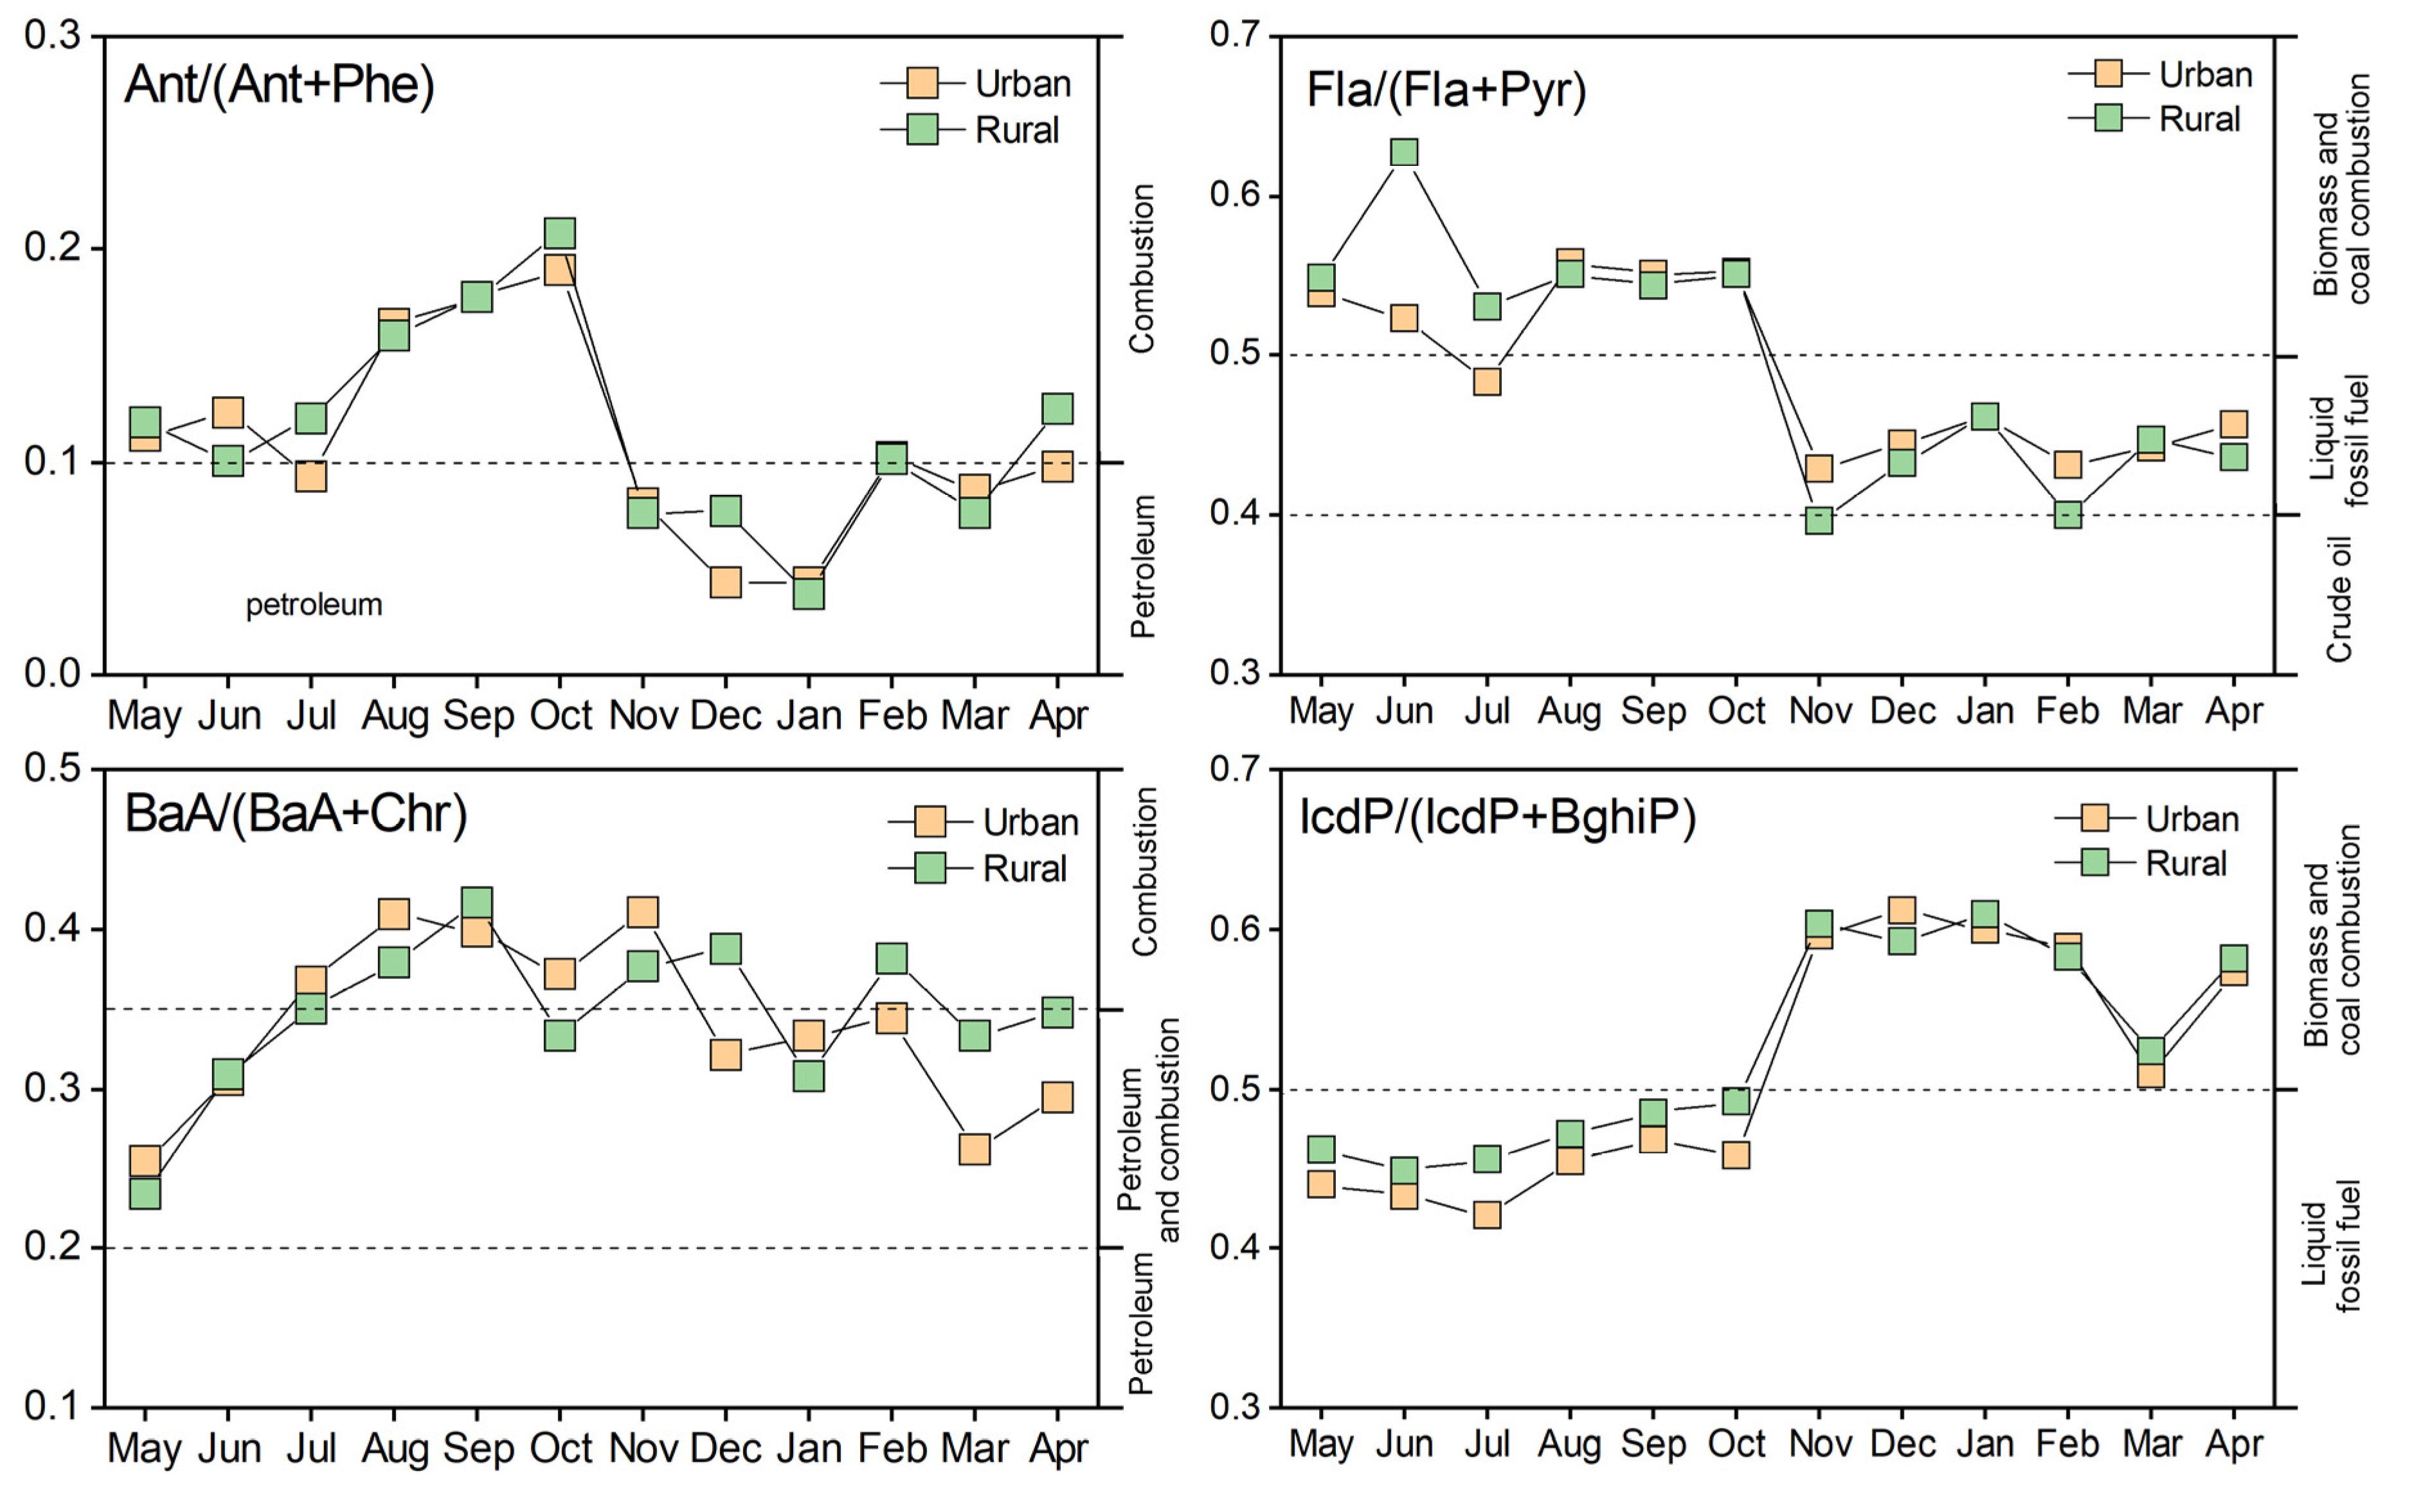
3.2.1. Molecular Diagnostic Ratios
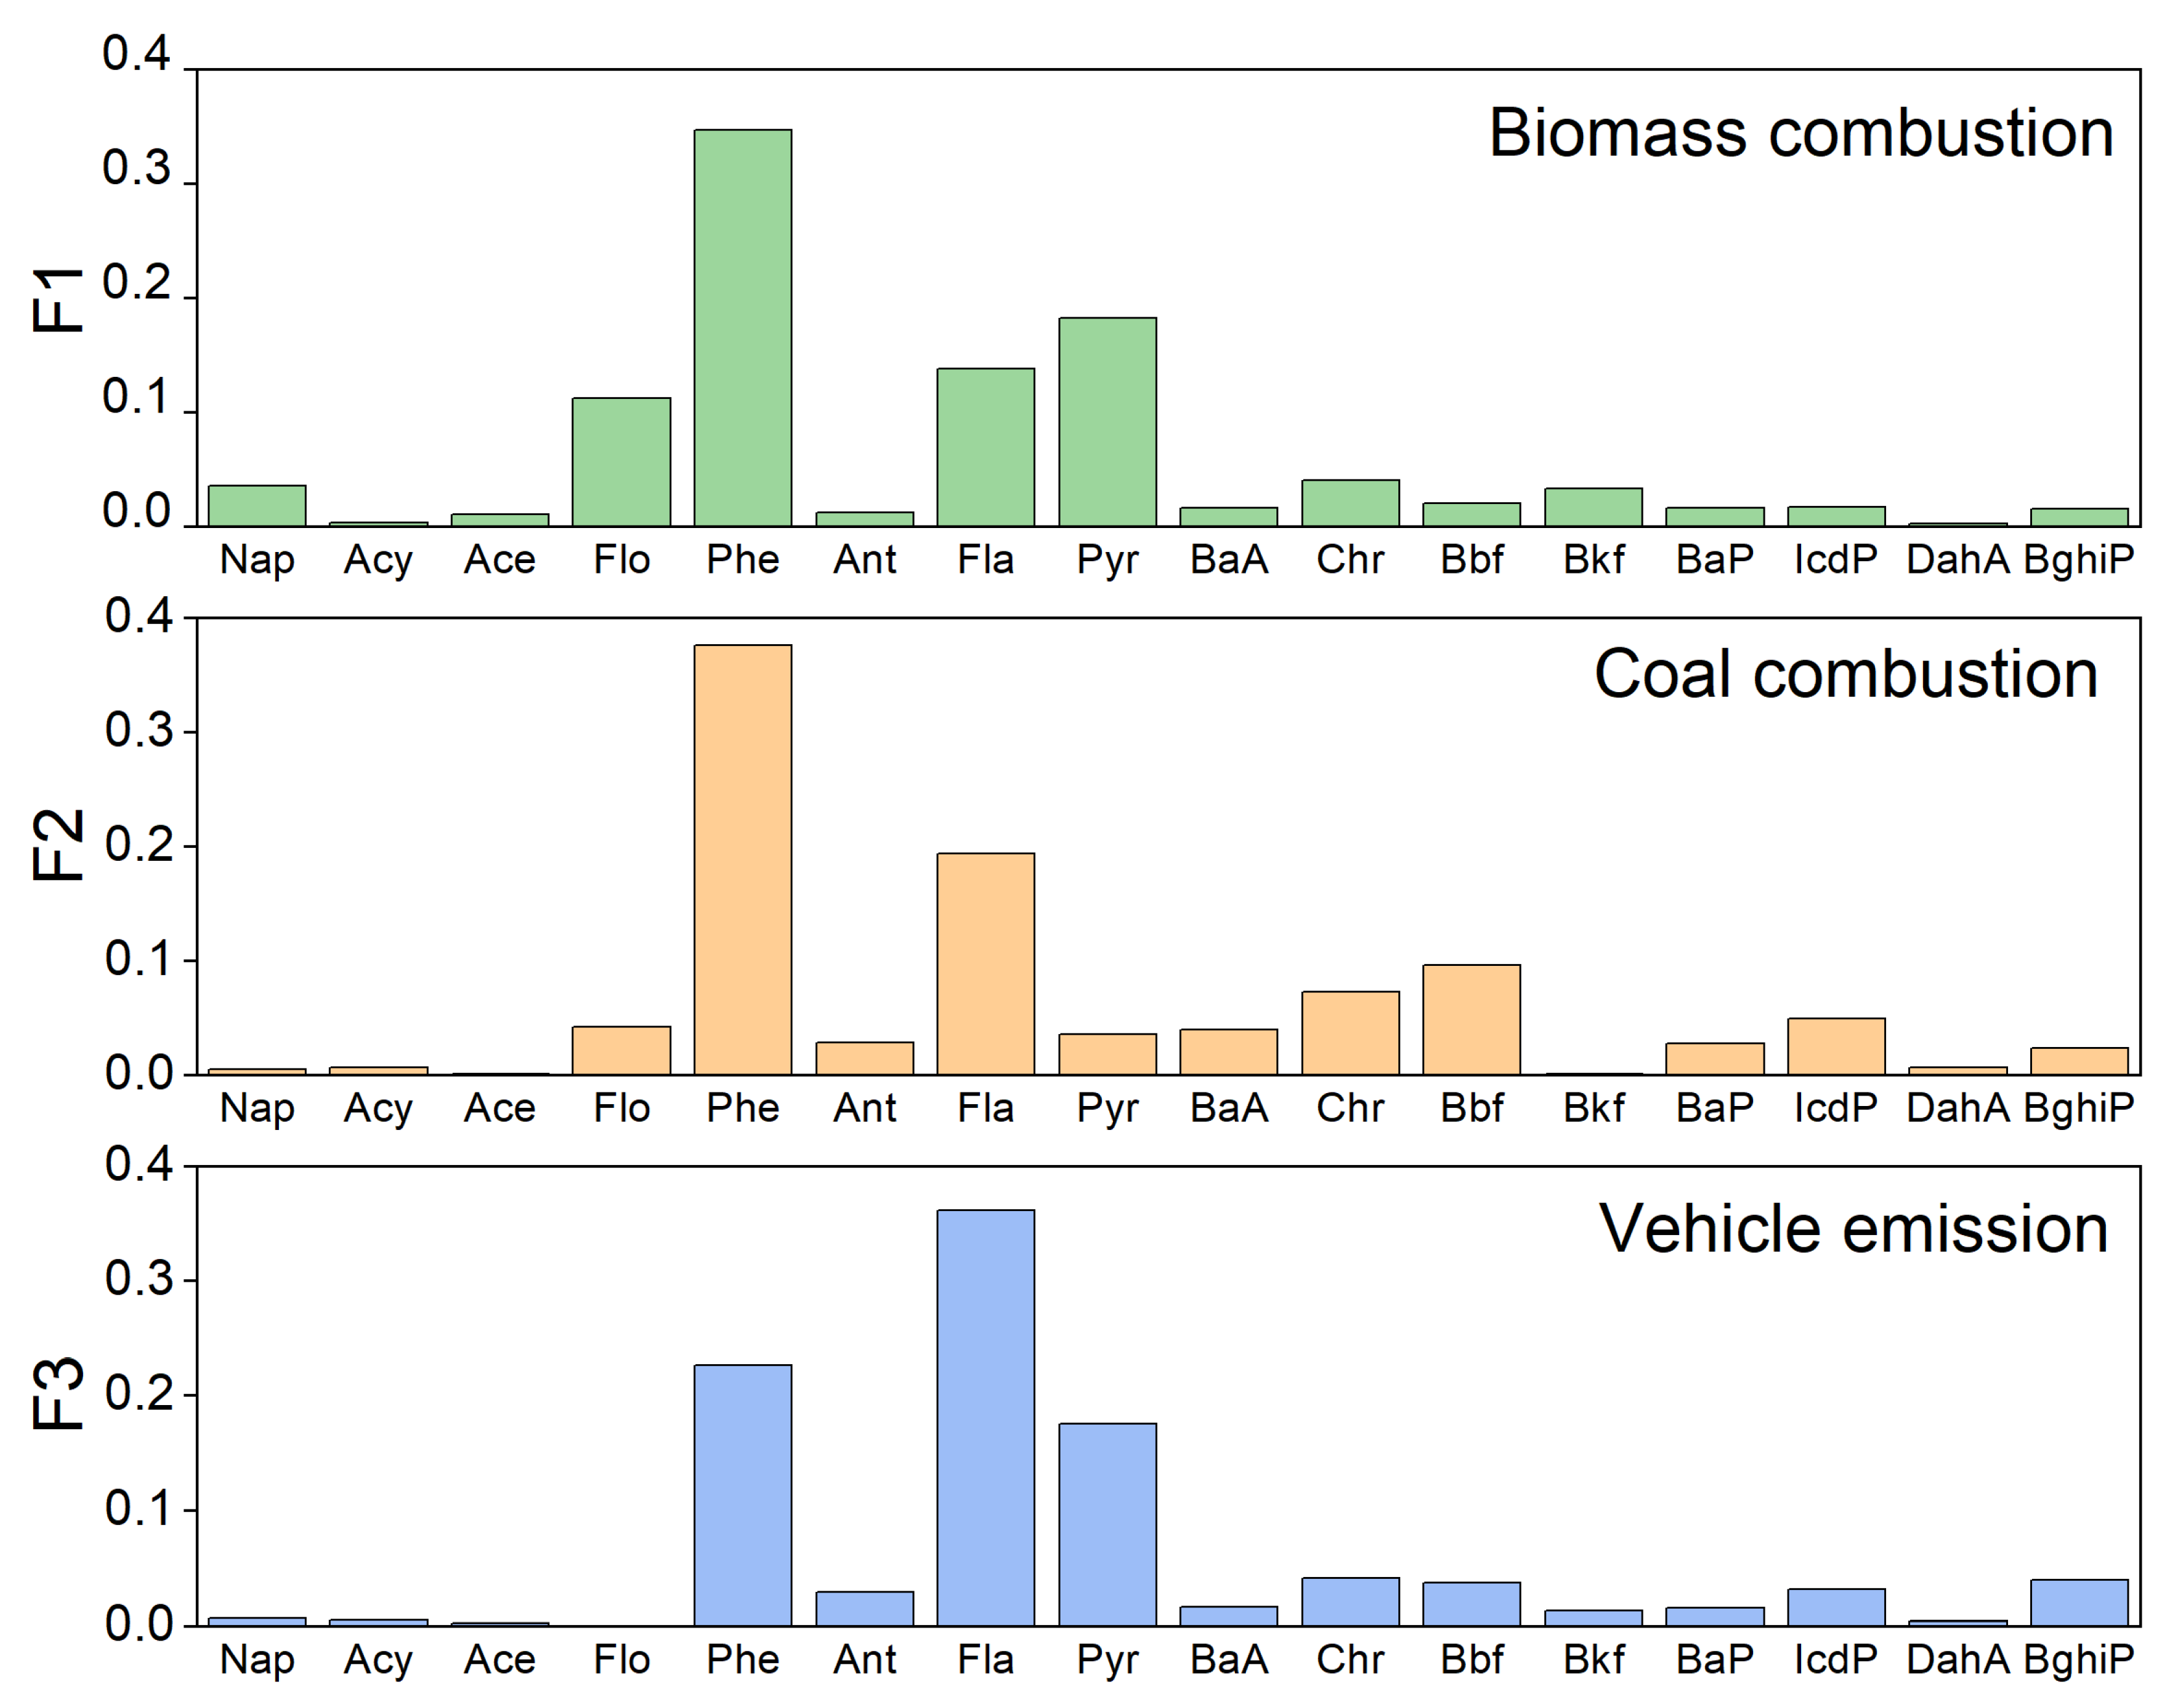
PAHs can be formed by multiple anthropogenic activities such as combustion of fossil fuels, or they can be formed naturally in the environment by oil seeps and plant debris and forest and prairie fires. Some methods have been established in order to identify PAH sources: for example, molecular diagnostic ratios (MDRs), the principal component analysis (PCA) method [37,40], the chemical material balance (CMB) model [41], the positive matrix factorization (PMF) method and stable carbon isotopic ratios analysis [42]. In this study, MDRs and PMF were used to identify the major sources and to obtain a reliable conclusion.
The MDR theory [17,43] is based on the hypothesis that some PAH ratios remain constant between the source and the receptor. The MDR method has been widely used in the identification of preliminary sources [44]. Based on the monitoring data, four normally used ratios were employed in this research. Common ratios used include Ant/(Ant + Phe) (mass 178), Fla/(Fla + Pyr) (mass 202), BaA/(BaA +Chr) (mass 228) and IcdP/(IcdP + BghiP) (mass 276).
The ratios of mass 178 increased from January and reached the peak in October (Figure 4). Generally, the ratios varied near the value of 0.1. The lowest value was obtained during the winter, and the highest value was achieved in the summer. For mass 178, a ratio < 0.10 usually is taken as an indication of petroleum, whereas a ratio > 0.10 indicates a dominance of combustion. From November to January, petroleum was the dominant source, and emission from combustion became the greatest contributor during the rest of the year. For mass 202, a ratio of 0.50 is usually defined as the petroleum/combustion transition, and point ratios between 0.40 and 0.50 are more characteristic of liquid fossil fuel (vehicle and crude oil) combustion, whereas ratios > 0.50 are characteristic of grass, wood or coal combustion. The ratios in our study indicated a strong influence of biomass and coal combustion before November, which was consistent with the result of mass 178. For mass 228, BaA/(BaA +Chr), ratios < 0.20 indicate petroleum sources, ratios from 0.20 to 0.35 indicate either petroleum or combustion and those > 0.35 imply combustion. The ratios from May to October were higher than 0.5, which indicated grass, wood or coal combustion. From November to April, the ratios were between 0.40 and 0.50, which was the characteristic of liquid fossil fuel combustion. For IcdP/(IcdP + BghiP), ratios < 0.20 likely indicates petroleum, those between 0.20 and 0.50 imply liquid fossil fuel combustion and ratios > 0.50 imply grass, wood and coal combustion. The ratios of mass 228 in our research indicated a mixture of petroleum or combustion. Combustion was the potential source from July to December. The ratios in our research suggested a potential combustion source [45].
The MDRs indicated that PAHs in Lake Chaohu were mainly from combustion and vehicle emission. We can also found that differences existed when we were using different PAH ratios. The use of PAH MDRs has been criticized in the past due to low accuracy. Overlap areas were reported between commonly applied ratios associated with different types of PAH emissions [44,46]. According to a study of MDRs based on the inventory and monitoring data over 20 years, it was found that the use of MDRs does not respond to known differences in atmospheric emission sources unless the source is strong [47]. due to the limitations of MDRs, a PMF model was also applied to detect the potential sources.

3.2.2. PMF Results

When the number of factors for PMF is three, good simulation has been achieved for most PAHs. Therefore, three components were extracted, and the source profiles of three factors are illustrated in Figure 5. It was found that factor one is predominately weighted by low molecular weight PAHs. Factor two is heavily weighted by the middle molecular weight PAHs, and factor three has a higher contribution in the PAHs with more than four rings. The first factor is predominately weighted by Acy, which has been proved to be a tracer of combustion of straws. In addition, factor one has high load on Fla, Pyr and Chr, which are the combustion products of firewood. Therefore, factor one appears to be biomass combustion. Factor two is predominately weighted by Phe and BbF. According to the literature, Flo, Phe and Ant are predominantly considered as coal combustion profiles. The high BbkF and Chr loads are also a typical sign of Chinese domestic coal emissions [2,17,48,49]. Factor two is supposed to be coal combustion emission. For factor three, BghiP has been identified as tracers of auto emissions, and IcdP is considered as a marker of diesel emission. It can be concluded that factor three represents emission from vehicle.
The percentages of the sources from the factors were estimated by PMF. These results showed that the sources from biomass combustions, coal combustion and vehicle emission accounted for 43.6%, 30.6% and 25.8% of the total PAHs, respectively. Compared with the result of MDRs, a similar conclusion was obtained by PMF and MRDs. It can also be observed that coal combustion plays an important part in local PAH emission. Our conclusion is different from some research studies conducted in China. Most domestic studies show that coal is the main source of pollution in China, which is related to the fact that coal is the main energy material in China. China is the largest coal producer and consumer in the world [50]. According to the National Bureau of Statistics, the coal production of China in 2018 was 3.5 billion tons, nearly half of the world’s production. Thus, the high coal consumption produces high PAH contribution to the atmosphere. In this study, the atmospheric samples were collected from Mushan island and Chaohu City. The former is a rural area far away from the city, while the latter is a small city with a small population and is a suburb surrounded by rural areas. Compared with coal combustion, firewood combustion is a more important method supplying energy in the research area.

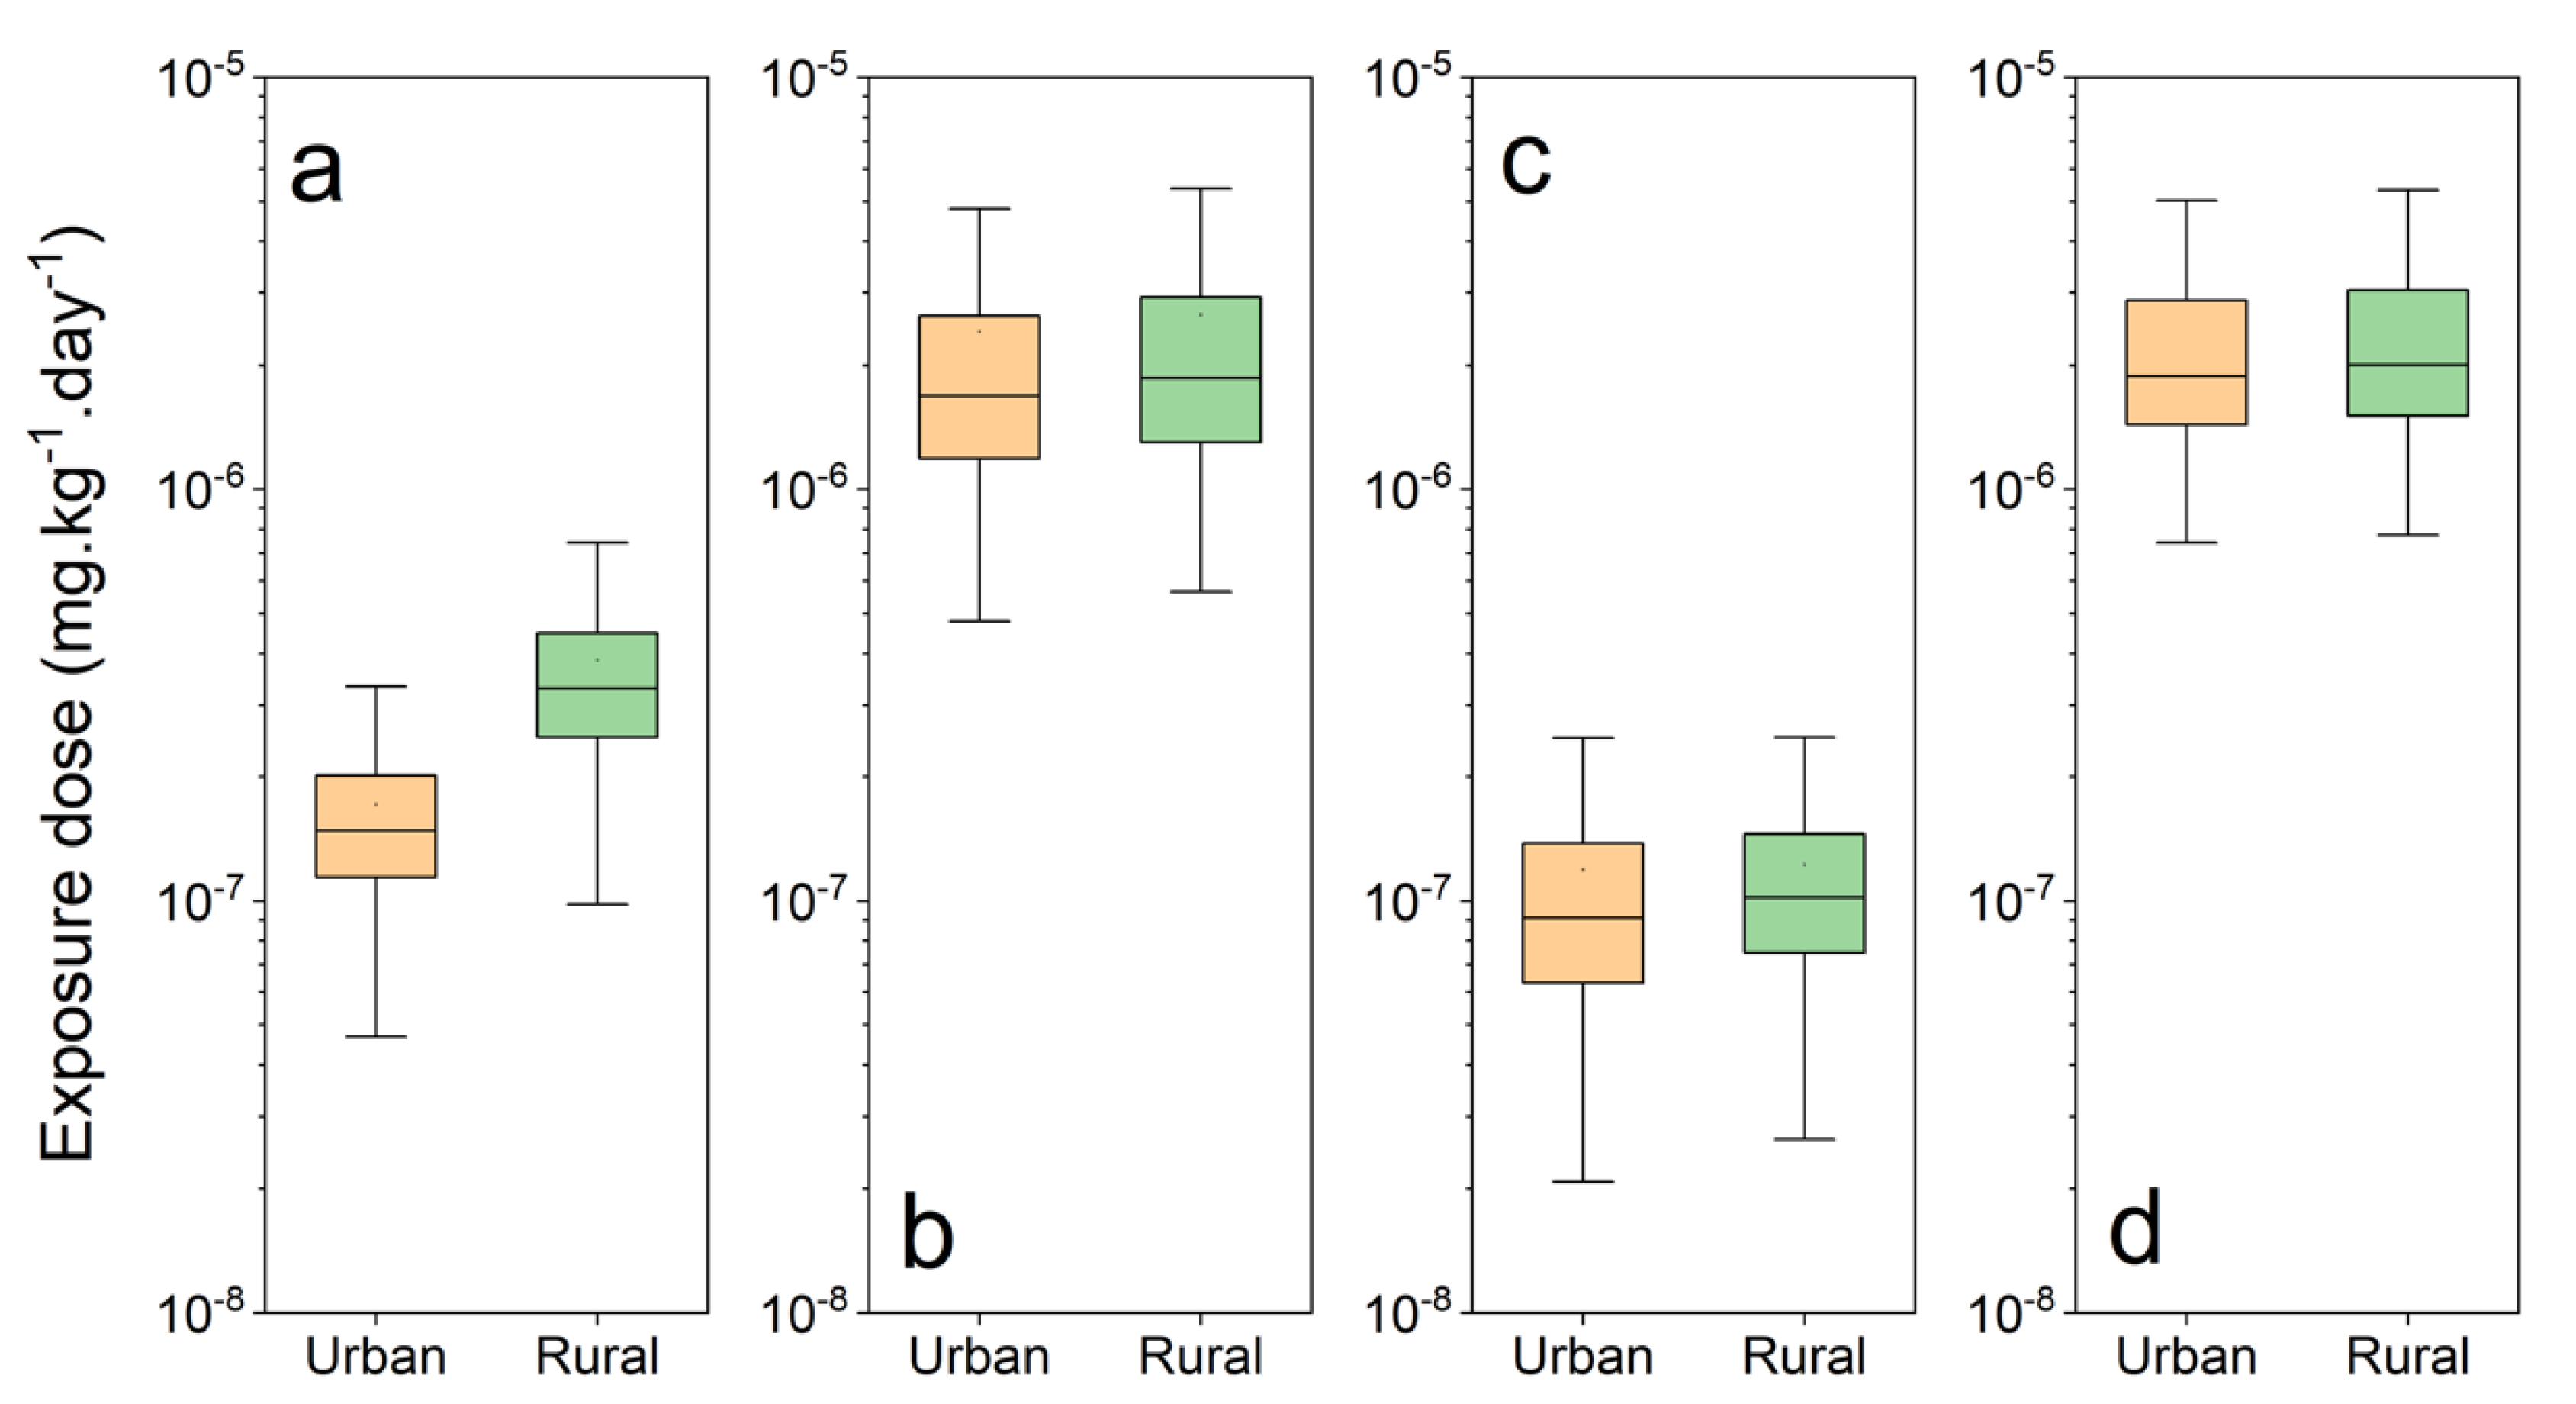
3.3. Exposure through Different Pathways

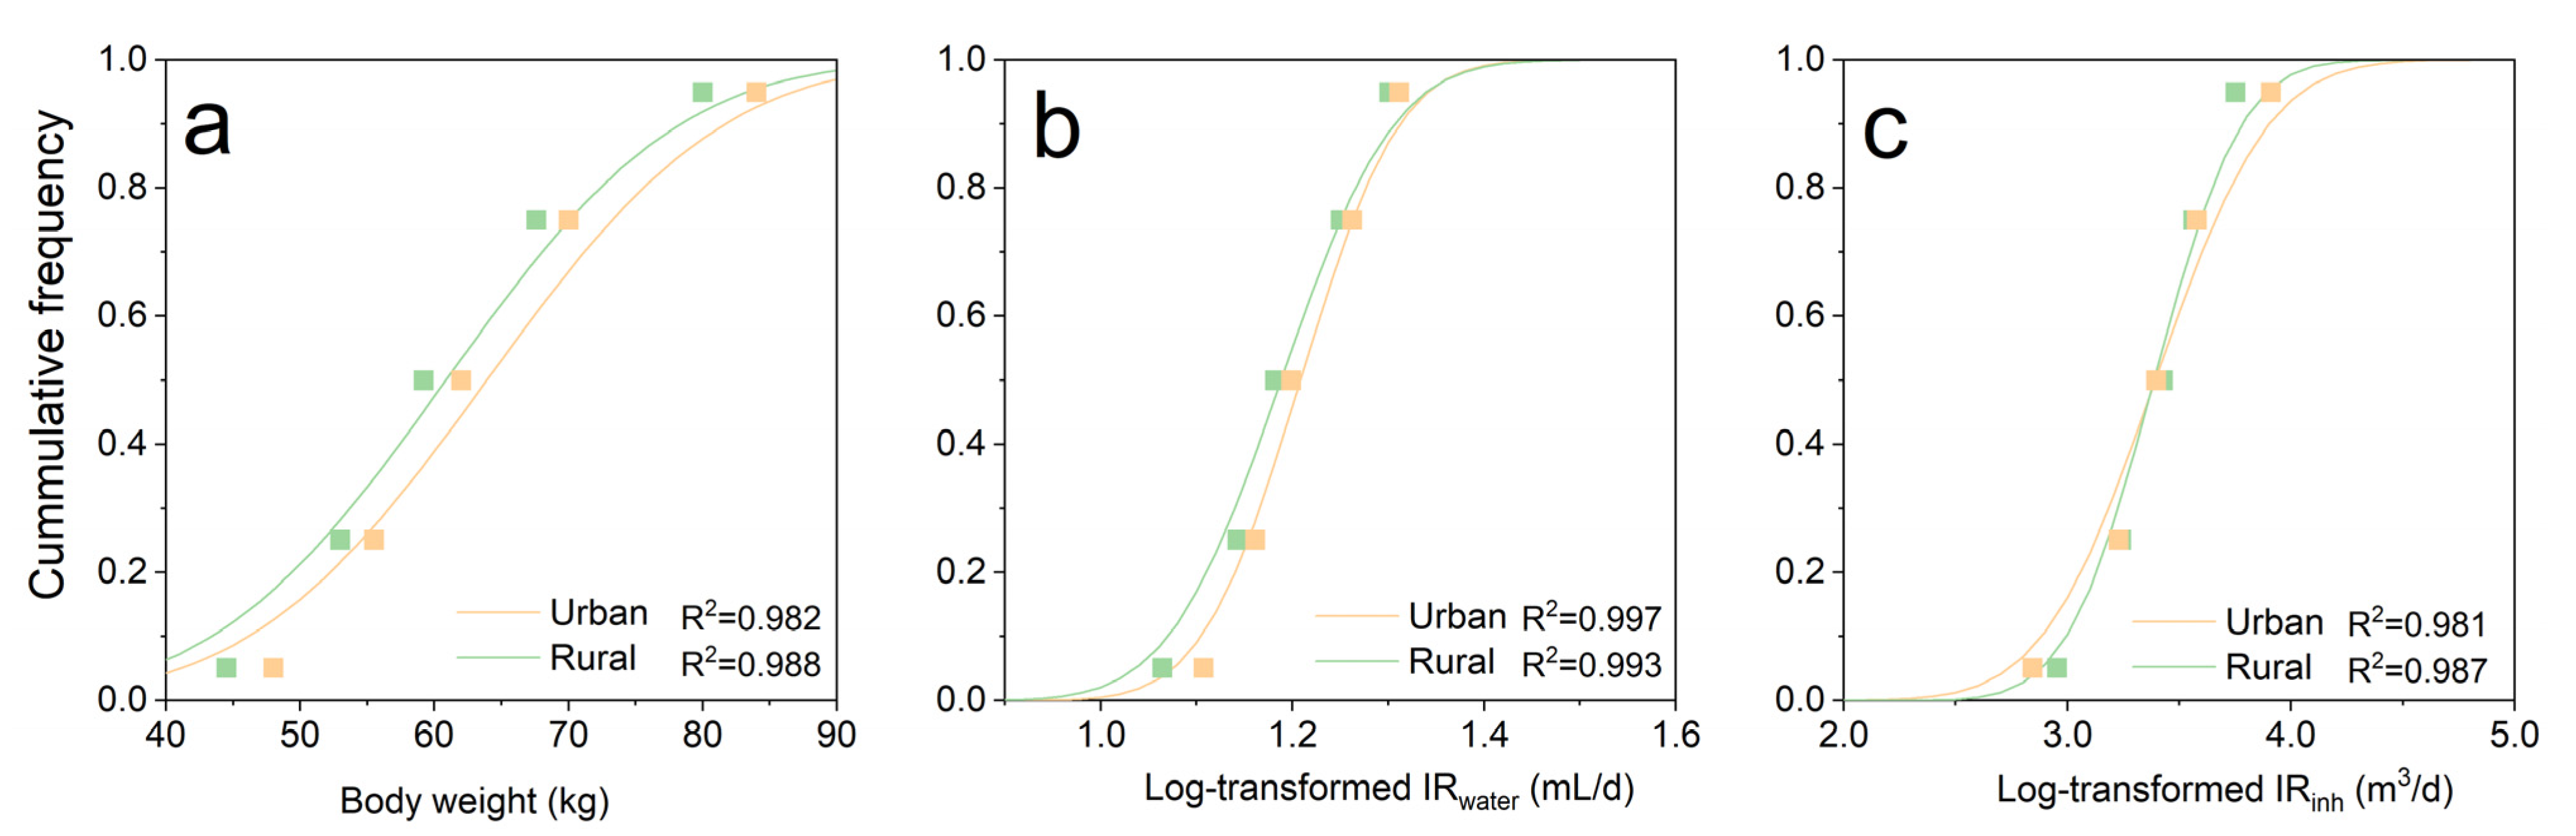
3.3.1. Derivation of Exposure Parameters

Three physiological and exposure behavior parameters including bodyweight, water intake rate and inhalation rate were collected from Exposure Factors Handbook of Chinese Population [51]. The distribution modes of parameters were fitted by regression models. Specifically, first, we considered a normal distribution for BW and log-normal distributions for the water intake rate and inhalation rate because the normal and log-normal distribution models are the most widely applied in studies on the exposure parameters [52,53]. Second, the 5th, 25th, 50th, 75th and 95th percentiles were collected from the Exposure Factors Handbook. The distribution of the parameters was fitted using the Gaussian function. The fit curves and parameters are shown in Figure 6 and Table 3, respectively. It can be observed that relatively good regression results were obtained for all three parameters. In addition, the intake rates of fish consumption in urban and rural were considered as constants. According to a survey conducted between 2010 and 2013, the average daily intakes of freshwater products per capita were 19.0 g/day and 11.1 g/day for the urban and rural populations, respectively [54].

3.3.2. Estimation of Exposure Doses

The lifetime average daily doses (LADD) of BaPeq exposure through inhalation (air and particle), aquatic product ingestion and water intake were calculated by 10,000 iterations of Monte Carlo simulation. The results were illustrated in Figure 7. BaPeq exposure through fish ingestion had the greatest contribution, with the average value of 3.01 × 10⁻⁶ (mg·kg−1·d−1). The LADD of residents in urban and rural were 2.97 × 10⁻⁶ (mg·kg−1·d−1) and 3.07 × 10⁻⁶ (mg·kg−1·d−1), respectively. Although the fish intake rate in urban residents was 1.71 times higher than that in rural, no obvious difference was observed between two population groups. Exposure through particle inhalation has a comparable contribution of 2.54 × 10⁻⁶ (mg·kg−1·d−1), which is one and two order of magnitude higher than exposure through gas inhalation and water ingestion, respectively. Our results are consistent with previous research. It has been reported that, for most non-occupationally exposed individuals, diet is the main route of exposure [55,56]. Inhalation of gaseous and particulate also had an ignorable contribution relative to the total BaPeq exposure.

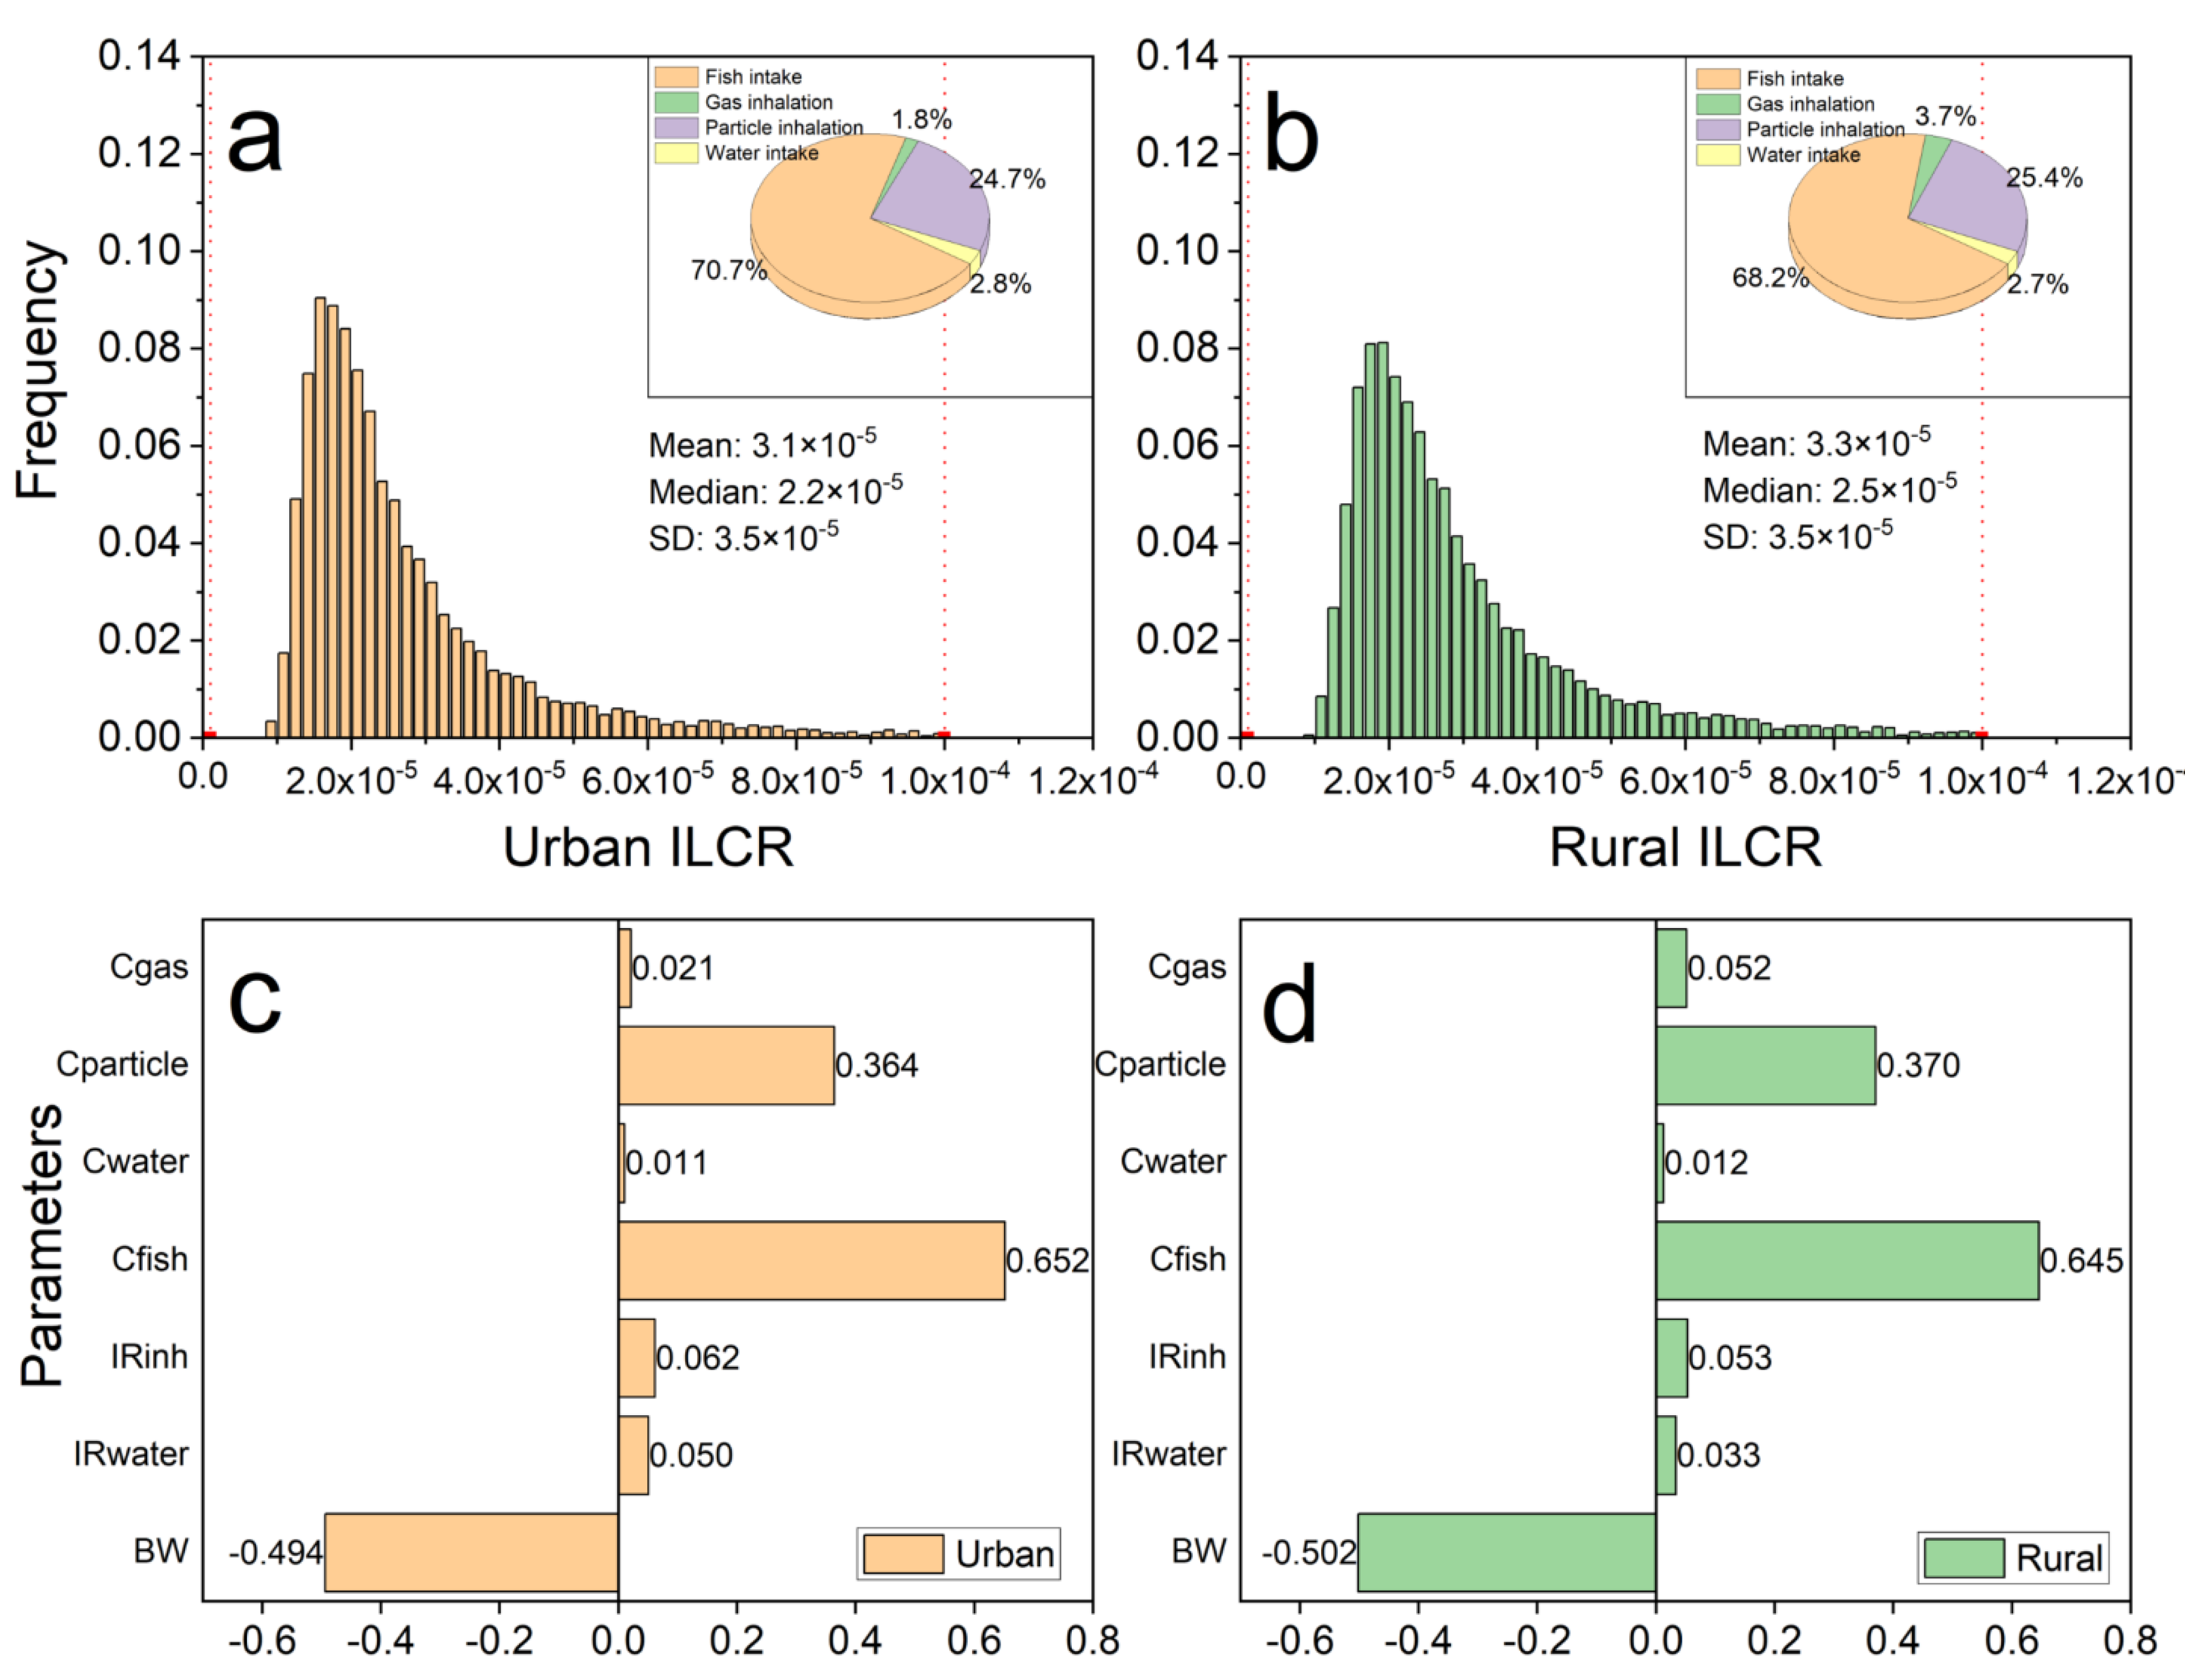
3.4. Carcinogenic Risk Assessment

The probabilistic cancer risk for urban and rural residents were obtained based on the results of Monte Carlo simulation and presented in Figure 8a,b. The median total PAHs ILCR was 3.1 × 10⁻⁵ to 3.3 × 10⁻⁵ in urban and rural residents, which showed a slightly higher carcinogenic risk for rural residents than that for urban residents. The difference can be attributed to the variation of exposure behaviors. A one in a million chance of additional human cancer over a 70-year lifetime (ILCR = 10−6) is considered acceptable or inconsequential, and one in ten thousand or greater (ILCR = 10−4) is considered serious (US EPA). Most of the surrogate samples generated by Monte Carlo distributed between the range of 10−6 and 10−4, which indicates potential ILCR risk. Due to the different end points, the carcinogenic slopes of inhalation and ingestion are quite different. Therefore, fish ingestion had much higher contribution than particle inhalation. Inhalation (including gas and particles) accounted for 26.5% and 29.1% of the total risk in urban and rural areas, respectively.
Parameter sensitivity was quantitatively assessed by the Spearman’s rank correlation coefficient of parameter and risk. The result was shown in Figure 8c,d. As the dominant exposure pathway, fish consumption had the highest risk contribution. PAH concentration in fish had the highest influence on the results of risk assessment. As the most important protection factor, the bodyweight was the second most sensitive parameter. PAH concentration associated with particles was the third most sensitive parameter in this research. It can also be observed that the sensitivity of exposure behavior parameters were relative low compared with media concentrations. This can be attributed to the small difference of these parameters among adults. As the most important behavior parameter, fish consumption rate was not treated as variables in the study due to the limited data support. However, the uncertainty of intake rate of fish should not be ignored due to the high contribution of fish intake on the total risk, which requires further research and more data support in the future.

4. Conclusions

PAHs in major environment samples were collected in Lake Chao for the entire year. Exposures through four pathways were estimated. ILCRs were characterized. The results found that the gaseous concentration had influence on the PAHs in the water according to the Spearman correlation analysis and may further affect the PAH content in fish tissues. Atmospheric transport is the source of the entire water system. The results of sources apportionment on atmospheric samples indicated the high contribution of biomass combustion. Probabilistic risk assessment suggested that inhalation and fish ingestion are two major pathways of PAH exposure, which are also the key processes in PAHs’ risk control for people near Lake Chaohu.

Author Contributions

Investigation, W.H., Q.H., X.K. and W.L.; writing—original draft, N.Q.; writing—review and editing, F.X. and Q.W. All authors have read and agreed to the published version of the manuscript.

Funding

This research was funded by China CDC Key Laboratory of Environment and Population Health, National Institute of Environmental Health, Chinese Center for Disease Control and Prevention (2021-CKL-01), by the Fundamental Research Funds for the Central Universities (FRF-TP-18-071A1) and by the National Natural Science Foundation of China (NSFC) (41977312, 41503104).

Institutional Review Board Statement

Not applicable.

Informed Consent Statement

Not applicable.

Acknowledgments

We also thank the help from National Environmental and Energy Base for International Science and Technology Cooperation.

Conflicts of Interest

All authors declare that they have no conflicts of interest or financial conflicts to disclose.

References

  1. Xu, F.-L.; Qin, N.; Zhu, Y.; He, W.; Kong, X.-Z.; Barbour, M.T.; He, Q.-S.; Wang, Y.; Ou-Yang, H.-L.; Tao, S. Multimedia fate modeling of polycyclic aromatic hydrocarbons (PAHs) in Lake Small Baiyangdian, Northern China. Ecol. Model. 2013, 252, 246–257. [Google Scholar] [CrossRef]
  2. Larsen, R.K.; Baker, J. Source apportionment of polycyclic aromatic hydrocarbons in the urban atmosphere: A comparison of three methods. Environ. Sci. Technol. 2003, 37, 1873–1881. [Google Scholar] [CrossRef]
  3. Fernandes, M.; Sicre, M.-A.; Boireau, A.; Tronczynski, J. Polyaromatic hydrocarbon (PAH) distributions in the Seine River and its estuary. Mar. Pollut. Bull. 1997, 34, 857–867. [Google Scholar] [CrossRef]
  4. Man, Y.B.; Mo, W.Y.; Zhang, F.; Wong, M.H. Health risk assessments based on polycyclic aromatic hydrocarbons in freshwater fish cultured using food waste-based diets. Environ. Pollut. 2020, 256, 113380. [Google Scholar] [CrossRef] [PubMed]
  5. Kim, K.-H.; Jahan, S.A.; Kabir, E.; Brown, R.J.C. A review of airborne polycyclic aromatic hydrocarbons (PAHs) and their human health effects. Environ. Int. 2013, 60, 71–80. [Google Scholar] [CrossRef] [PubMed]
  6. Miller, B.G.; Doust, E.; Cherrie, J.W.; Hurley, J.F. Lung cancer mortality and exposure to polycyclic aromatic hydrocarbons in British coke oven workers. BMC Public Health 2013, 13, 962. [Google Scholar] [CrossRef] [Green Version]
  7. Kuang, D.; Zhang, W.; Deng, Q.; Zhang, X.; Huang, K.; Guan, L.; Hu, D.; Wu, T.; Guo, H. Dose-response relationships of polycyclic aromatic hydrocarbons exposure and oxidative damage to DNA and lipid in coke oven workers. Environ. Sci. Technol. 2013, 47, 7446–7456. [Google Scholar] [CrossRef] [PubMed]
  8. Zhu, Y.; Duan, X.; Qin, N.; Li, J.; Tian, J.; Zhong, Y.; Chen, L.; Fan, R.; Yu, Y.; Wu, G.; et al. Internal biomarkers and external estimation of exposure to polycyclic aromatic hydrocarbons and their relationships with cancer mortality in a high cancer incidence area. Sci. Total Environ. 2019, 688, 742–750. [Google Scholar] [CrossRef] [PubMed]
  9. Rogge, W.F.; Hildemann, L.M.; Mazurek, M.A.; Cass, G.R.; Simoneit, B.R. Sources of fine organic aerosol.3. Road dust, tire debris, and organonetallic brake lining dust-roads as sources and sinks. Environ. Sci. Technol. 1993, 27, 1892–1904. [Google Scholar] [CrossRef]
  10. Wang, B.; Li, Z.; Ma, Y.; Qiu, X.; Ren, A. Association of polycyclic aromatic hydrocarbons in housewives’ hair with hyper-tension. Chemosphere 2016, 153, 315–321. [Google Scholar] [CrossRef]
  11. Qin, N.; He, W.; Kong, X.Z.; Liu, W.X.; He, Q.S.; Yang, B.; Ouyang, H.L.; Wang, Q.M.; Xu, F.L. Ecological risk assessment of polycyclic aromatic hydrocarbons (PAHs) in the water from a large Chinese lake based on multiple indicators. Ecol. Indic. 2013, 24, 599–608. [Google Scholar] [CrossRef]
  12. Andra, S.S.; Austin, C.; Wright, R.O.; Arora, M. Reconstructing pre-natal and early childhood exposure to multi-class organic chemicals using teeth: Towards a retrospective temporal exposome. Environ. Int. 2015, 83, 137–145. [Google Scholar] [CrossRef] [PubMed] [Green Version]
  13. Yu, Y.; Li, Q.; Wang, H.; Wang, B.; Wang, X.; Ren, A.; Tao, S. Risk of human exposure to polycyclic aromatic hydrocarbons: A case study in Beijing, China. Environ. Pollut. 2015, 205, 70–77. [Google Scholar] [CrossRef]
  14. Lohmann, R.; Jurado, E.; Pilson, M.E.; Dachs, J. Oceanic deep water formation as a sink of persistent organic pollutants. Geophys. Res. Lett. 2006, 33, 735. [Google Scholar] [CrossRef] [Green Version]
  15. Zhang, G.; Li, J.; Cheng, H.; Li, X.; Xu, W.; Jones, K.C. Distribution of organochlorine pesticides in the Northern South China Sea: Implications for land outflow and air−sea exchange. Environ. Sci. Technol. 2007, 41, 3884–3890. [Google Scholar] [CrossRef]
  16. Simonich, S.L.; Hites, R.A. Organic Pollutant Accumulation in Vegetation. Environ. Sci. Technol. 1995, 29, 2905–2914. [Google Scholar] [CrossRef] [PubMed]
  17. Simcik, M.F.; Eisenreich, S.J.; Lioy, P.J. Source apportionment and source/sink relationships of PAHs in the coastal atmosphere of Chicago and Lake Michigan. Atmos. Environ. 1999, 33, 5071–5079. [Google Scholar] [CrossRef]
  18. Franz, T.P.; Eisenreich, S.J.; Holsen, T.M. Dry Deposition of Particulate Polychlorinated Biphenyls and Polycyclic Aromatic Hydrocarbons to Lake Michigan. Environ. Sci. Technol. 1998, 32, 3681–3688. [Google Scholar] [CrossRef]
  19. Qin, N.; He, W.; Liu, W.; Kong, X.; Xu, F.; Giesy, J.P. Tissue distribution, bioaccumulation, and carcinogenic risk of polycyclic aromatic hydrocarbons in aquatic organisms from Lake Chaohu, China. Sci. Total Environ. 2020, 749, 141577. [Google Scholar] [CrossRef]
  20. Xu, F.-L.; Wu, W.-J.; Wang, J.-J.; Qin, N.; Wang, Y.; He, Q.-S.; He, W.; Tao, S. Residual levels and health risk of polycyclic aromatic hydrocarbons in freshwater fishes from Lake Small Bai-Yang-Dian, Northern China. Ecol. Model. 2011, 222, 275–286. [Google Scholar] [CrossRef]
  21. He, Y.; Qin, N.; He, W.; Xu, F. The impacts of algae biological pump effect on the occurrence, source apportionment and toxicity of SPM-bound PAHs in lake environment. Sci. Total Environ. 2021, 753, 141980. [Google Scholar] [CrossRef] [PubMed]
  22. Li, C.; Huo, S.; Yu, Z.; Xi, B.; Zeng, X.; Wu, F. Spatial distribution, potential risk assessment, and source apportionment of polycyclic aromatic hydrocarbons (PAHs) in sediments of Lake Chaohu, China. Environ. Sci. Pollut. Res. 2014, 21, 12028–12039. [Google Scholar] [CrossRef] [PubMed]
  23. Qin, N.; Kong, X.-Z.; He, W.; He, Q.-S.; Liu, W.-X.; Xu, F.-L. Dustfall-bound polycyclic aromatic hydrocarbons (PAHs) over the fifth largest Chinese lake: Residual levels, source apportionment, and correlations with suspended particulate matter (SPM)-bound PAHs in water. Environ. Sci. Pollut. Res. 2021, 1–13. [Google Scholar] [CrossRef]
  24. Wang, R.; Huang, Q.; Cai, J.; Wang, J. Seasonal variations of atmospheric polycyclic aromatic hydrocarbons (PAHs) sur-rounding Chaohu Lake, China: Source, partitioning behavior, and lung cancer risk. Atmos. Pollut. Res. 2021, 12. [Google Scholar] [CrossRef]
  25. Zhang, L.; Bai, Y.-S.; Wang, J.-Z.; Peng, S.-C.; Chen, T.-H.; Yin, D.-Q. Identification and determination of the contribution of iron–steel manufacturing industry to sediment-associated polycyclic aromatic hydrocarbons (PAHs) in a large shallow lake of eastern China. Environ. Sci. Pollut. Res. 2016, 23, 22037–22046. [Google Scholar] [CrossRef]
  26. Qin, N.; He, W.; Kong, X.-Z.; Liu, W.; He, Q.-S.; Yang, B.; Ouyang, H.-L.; Wang, Q.-M.; Xu, F.-L. Atmospheric partitioning and the air–water exchange of polycyclic aromatic hydrocarbons in a large shallow Chinese lake (Lake Chaohu). Chemosphere 2013, 93, 1685–1693. [Google Scholar] [CrossRef]
  27. Paatero, P. Least squares formulation of robust non-negative factor analysis. Chemom. Intell. Lab. Syst. 1997, 37, 23–35. [Google Scholar] [CrossRef]
  28. Liu, C.; Tian, F.; Chen, J.; Li, X.; Qiao, X. A comparative study on source apportionment of polycyclic aromatic hydrocarbons in sediments of the Daliao River, China: Positive matrix factorization and factor analysis with non-negative constraints. Chin. Sci. Bull. 2010, 55, 915–920. [Google Scholar] [CrossRef]
  29. Nisbet, I.C.T.; Lagoy, P.K. Toxic equaivalency factors (TEFs) for Polycyclic Aromatic-Hydrocarbons (PAHs). Regul. Toxicol. Pharmacol. 1992, 16, 290–300. [Google Scholar] [CrossRef]
  30. Taghvaee, S.; Sowlat, M.H.; Hassanvand, M.S.; Yunesian, M.; Naddafi, K.; Sioutas, C. Source-specific lung cancer risk assessment of ambient PM2.5-bound polycyclic aromatic hydrocarbons (PAHs) in central Tehran. Environ. Int. 2018, 120, 321–332. [Google Scholar] [CrossRef]
  31. Exposure Factors Handbook; EPA/600/P-95/002; US EPA: Washington, DC, USA, 1997.
  32. Li, J.; Zhang, G.; Li, X.; Qi, S.H.; Liu, G.Q.; Peng, X.Z. Source seasonality of polycyclic aromatic hydrocarbons (PAHs) in a subtropical city, Guangzhou, South China. Sci. Total Environ. 2006, 355, 145–155. [Google Scholar] [CrossRef] [PubMed]
  33. Liu, S.; Tao, S.; Liu, W.; Dou, H.; Liu, Y.; Zhao, J.; Little, M.G.; Tian, Z.; Wang, J.; Wang, L.; et al. Seasonal and spatial occurrence and distribution of atmospheric polycyclic aromatic hydrocarbons (PAHs) in rural and urban areas of the North Chinese plain. Environ. Pollut. 2008, 156, 651–656. [Google Scholar] [CrossRef] [PubMed]
  34. Zhen, Z.; Yin, Y.; Chen, K.; Zhen, X.; Zhang, X.; Jiang, H.; Wang, H.; Kuang, X.; Cui, Y.; Dai, M.; et al. Concentration and atmospheric transport of PM2.5-bound polycyclic aromatic hydrocarbons at Mount Tai, China. Sci. Total Environ. 2021, 786, 147513. [Google Scholar] [CrossRef] [PubMed]
  35. Gustafson, K.E.; Dickhut, R.M. Gaseous exchange of polycyclic aromatic hydrocarbons across the air−water interface of Southern Chesapeake Bay. Environ. Sci. Technol. 1997, 31, 1623–1629. [Google Scholar] [CrossRef]
  36. Mandalakis, M.; Tsapakis, M.; Tsoga, A.; Stephanou, E.G. Gas-particle concentrations and distribution of aliphatic hydro-carbons, PAHs, PCBs and PCDD/Fs in the atmosphere of Athens (Greece). Atmos. Environ. 2002, 36, 4023–4035. [Google Scholar] [CrossRef]
  37. Matos, J.; Silveira, C.; Cerqueira, M. Particle-bound polycyclic aromatic hydrocarbons in a rural background atmosphere of southwestern Europe. Sci. Total Environ. 2021, 87, 147666. [Google Scholar] [CrossRef]
  38. Xia, Z.; Duan, X.; Qiu, W.; Liu, D.; Wang, B.; Tao, S.; Jiang, Q.; Lu, B.; Song, Y.; Hu, X. Health risk assessment on dietary exposure to polycyclic aromatic hydrocarbons (PAHs) in Taiyuan, China. Sci. Total Environ. 2010, 408, 5331–5337. [Google Scholar] [CrossRef]
  39. Wu, X.; Wang, Y.; Zhang, Q.; Zhao, H.; Yang, Y.; Zhang, Y.; Xie, Q.; Chen, J. Seasonal variation, air-water exchange, and multivariate source apportionment of polycyclic aromatic hydrocarbons in the coastal area of Dalian, China. Environ. Pollut. 2019, 244, 405–413. [Google Scholar] [CrossRef]
  40. Křůmal, K.; Mikuška, P.; Horák, J.; Hopan, F.; Kuboňová, L. Influence of boiler output and type on gaseous and particulate emissions from the combustion of coal for residential heating. Chemosphere 2021, 278, 130402. [Google Scholar] [CrossRef]
  41. Teixeira, E.C.; Agudelo-Castañeda, D.M.; Mattiuzi, C.D.P. Contribution of polycyclic aromatic hydrocarbon (PAH) sources to the urban environment: A comparison of receptor models. Sci. Total Environ. 2015, 538, 212–219. [Google Scholar] [CrossRef]
  42. Feng, J.; Song, N.; Yu, Y.; Li, Y. Differential analysis of FA-NNC, PCA-MLR, and PMF methods applied in source apportionment of PAHs in street dust. Environ. Monit. Assess. 2020, 192, 727. [Google Scholar] [CrossRef]
  43. Dickhut, R.M.; Canuel, E.A.; Gustafson, K.E.; Liu, K.; Arzayus, K.M.; Walker, S.E.; Edgecombe, G.; Gaylor, M.O.; Macdonald, E.H. Automotive sources of carcinogenic polycyclic aromatic hydrocarbons associated with particulate matter in the Chesapeake Bay Region. Environ. Sci. Technol. 2000, 34, 4635–4640. [Google Scholar] [CrossRef]
  44. Davis, E.; Walker, T.R.; Adams, M.; Willis, R.; Norris, G.A.; Henry, R.C. Source apportionment of polycyclic aromatic hy-drocarbons (PAHs) in small craft harbor (SCH) surficial sediments in Nova Scotia, Canada. Sci. Total Environ. 2019, 691, 528–537. [Google Scholar] [CrossRef]
  45. Yunker, M.B.; Macdonald, R.; Vingarzan, R.; Mitchell, R.H.; Goyette, D.; Sylvestre, S. PAHs in the Fraser river basin: A critical appraisal of PAH ratios as indicators of PAH source and composition. Org. Geochem. 2002, 33, 489–515. [Google Scholar] [CrossRef]
  46. Galarneau, E. Source specificity and atmospheric processing of airborne PAHs: Implications for source apportionment. Atmospheric Environ. 2008, 42, 8139–8149. [Google Scholar] [CrossRef]
  47. Katsoyiannis, A.; Sweetman, A.; Jones, K.C. PAH molecular diagnostic ratios applied to atmospheric sources: A critical evaluation using two decades of source inventory and air concentration data from the UK. Environ. Sci. Technol. 2011, 45, 8897–8906. [Google Scholar] [CrossRef] [PubMed]
  48. Harrison, R.M.; Smith, A.D.J.T.; Luhana, L. Source Apportionment of Atmospheric Polycyclic Aromatic Hydrocarbons Collected from an Urban Location in Birmingham, UK. Environ. Sci. Technol. 1996, 30, 825–832. [Google Scholar] [CrossRef]
  49. Chen, Y.; Sheng, G.; Bi, X.; Feng, Y.; Mai, B.; Fu, J. Emission Factors for Carbonaceous Particles and Polycyclic Aromatic Hydrocarbons from Residential Coal Combustion in China. Environ. Sci. Technol. 2005, 39, 1861–1867. [Google Scholar] [CrossRef] [PubMed]
  50. Lin, B.-Q.; Liu, J.-H. Estimating coal production peak and trends of coal imports in China. Energy Policy 2010, 38, 512–519. [Google Scholar] [CrossRef]
  51. Xiuge, Z.; Xiao-li, D. Exposure Factors Handbook of Chinese Population; Ministry of Environmental Protection of the People′s Republic of China: Beijing, China, 2014.
  52. Chen, S.-C.; Liao, C.-M. Health risk assessment on human exposed to environmental polycyclic aromatic hydrocarbons pol-lution sources. Sci. Total Environ. 2006, 366, 112–123. [Google Scholar] [CrossRef] [PubMed]
  53. Liao, C.-M.; Chio, C.-P.; Chen, W.-Y.; Ju, Y.-R.; Li, W.-H.; Cheng, Y.-H.; Liao, V.; Chen, S.-C.; Ling, M.-P. Lung cancer risk in relation to traffic-related nano/ultrafine particle-bound PAHs exposure: A preliminary probabilistic assessment. J. Hazard. Mater. 2011, 190, 150–158. [Google Scholar] [CrossRef] [PubMed]
  54. Zhao, L.; He, Y. Monitoring Report on Nutrition and Health Status of Chinese Residents (2010–2013) Volume I: Dietary and Nutrient Intake; People’s Medical Publishing House Co., LTD: Beijing, China, 2018. [Google Scholar]
  55. Falcó, G.; Domingo, J.L.; Llobet, J.M.; Teixidó, A.; Casas, C.; Müller, L. Polycyclic Aromatic Hydrocarbons in Foods: Human Exposure through the Diet in Catalonia, Spain. J. Food Prot. 2003, 66, 2325–2331. [Google Scholar] [CrossRef] [PubMed]
  56. Martorell, I.; Nieto, A.; Nadal, M.; Perello, G.; Marce, R.M.; Domingo, J.L. Human exposure to polycyclic aromatic hydro-carbons (PAHs) using data from a duplicate diet study in Catalonia, Spain. Food Chem. Toxicol. 2012, 50, 4103–4108. [Google Scholar] [CrossRef] [PubMed]
Figure 1. The location of Lake Chaohu and sampling sites: (a) People’s Republic of China, (b) Anhui Province and (c) Lake Chaohu.
Atmosphere 12 01241 g001
Figure 2. PAHs composition in different environment media.
Atmosphere 12 01241 g002
Figure 3. Spearman correlation between PAH levels in environment media (a) water and gaseous phase (b) and fish tissues and gaseous phase (c) water and fish tissues.
Atmosphere 12 01241 g003
Figure 4. Seasonal and spatial variation of four ratios in atmospheric samples from Lake Chaohu.
Atmosphere 12 01241 g004
Figure 5. Factors of PMF analysis in Chaohu dustfall.
Atmosphere 12 01241 g005
Figure 6. Fitting of (a) bodyweight, (b) water intake rate and (c) inhalation rate of urban and rural population in Anhui Province.
Atmosphere 12 01241 g006
Figure 7. BaPeq exposure through different pathways: (a) gaseous phase; (b) particulate phase; (c) water intake; and (d) fish intake.
Atmosphere 12 01241 g007
Figure 8. Distributions of incremental lifetime cancer risk (a,b) and parameter sensitivity for urban and rural populations (c,d) derived using the Monte Carlo simulation.
Atmosphere 12 01241 g008
Table 1. Recoveries and toxicity equivalency factors (TEFs) of 16 PAHs.
AbbreviationPAHsGaseous (%)Particulate (%)Water (%)Aquatic Organisms (%)TEF
NapNaphthalene4647811150.001
AcyAcenaphthene;5148871010.001
AceAcenaphthylene6750811170.001
FloFluorene75571031050.001
PhePhenanthrene83691081070.001
AntAnthracene7771931010.01
FlaFluoranthene9887891130.001
PyrPyrene12488891220.001
BaABenzo[a]anthracene9997631020.1
ChrChrysene92102621190.01
BbFBenzo[b]fluoranthene121103431050.1
BkFBenzo[k]fluorant hene90111441020.1
BaPBenzo[a]pyrene;10810360871
IcdPDibenz[a,h]anthracene10211931890.1
DahAIndeno [1,2,3-cd]pyrene12711824931
BghiPBenzo[ghi]perylene65115241100.01
Table 2. Residual levels of PAH16 and BaPeq in environmental media.
CategoriesMediaUnitUrbanRuralKruskal-Wallis Test
MinMaxGMMinMaxGM ± SD
PAH16Gasng·m−322.118649.5 ± 46.010.918372.3 ± 54.3p = 0.157
Particleng·m−33.4182.513.8 ± 25.62.7469.314.6 ± 22.4p = 0.773
Waterng·L−157409171 ± 11959.6779169 ± 188p = 0.544
Fishng·g−118.51029114 ± 31518.51029114 ± 315
BaPeqGasng·m−30.040.380.14 ± 0.100.061.050.31 ± 0.26p = 0.010
Particleng·m−30.3810.11.57 ± 2.990.319.001.71 ± 2.74p = 0.840
Waterng·L−10.171.570.46 ± 0.420.261.360.54 ± 0.36p = 0.862
Fishng·g−10.2920.21.75 ± 6.240.2920.21.75 ± 6.24
PAH16: Tthe sum of 16 PAH components; GM: geometric mean; SD: standard deviation.
Table 3. Exposure parameters of adults for Monte Carlo simulation.
MediaUnitDistribution ModeUrbanRuralReferences
Waterng·LLog-NormalLN(−0.77, 0.68)LN(−0.62, 0.56)Measured
Gasng·m−3Log-NormalLN(−1.96, 0.67)LN(−1.18, 0.71)Measured
Particleng·m−3Log-NormalLN(0.45, 1.10)LN(0.54, 1.11)Measured
Fishng·g−3Log-NormalLN(0.56, 1.48)LN(0.56, 1.48)Measured
BWKgNormalN(63.90, 13.86)LN(60.86, 13.64)[53]
IR(water)mL·d−3Log-NormalLN(7.81, 0.91)LN(7.80, 0.70)[53]
IR(inh)m3·d−1Log-NormalLN(2.78,0.19)LN(2.74, 0.21)[53]
IR(fish)g·d−3Constant19.011.1[54]
Publisher’s Note: MDPI stays neutral with regard to jurisdictional claims in published maps and institutional affiliations.

