Article

Evaluation of Multiple Approaches to Estimate Daily Solar Radiation for Input to Crop Process Models

1
Department of Geophysics and Meteorology, Bogor Agricultural University, Bogor 16416, Indonesia
2
Department of Geography, Environment, and Spatial Sciences, Michigan State University, East Lansing, MI 48824, USA
*
Author to whom correspondence should be addressed.
Atmosphere 2021, 12(1), 8; https://doi.org/10.3390/atmos12010008
Submission received: 31 October 2020 / Revised: 18 December 2020 / Accepted: 18 December 2020 / Published: 23 December 2020
(This article belongs to the Special Issue Climate Data for Agricultural Applications: Downscaling and Scenarios)

Abstract

:
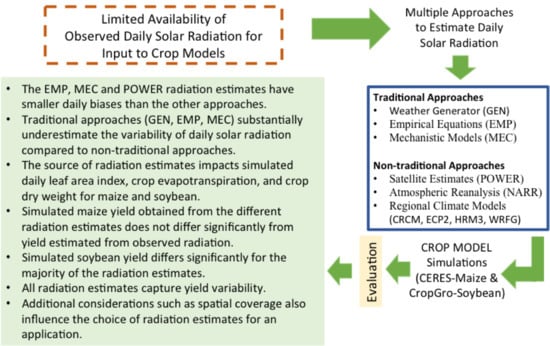
Daily solar radiation is a critical input for estimating plant growth and development, yet this variable is infrequently measured compared to other climate variables. This study evaluates the sensitivity of simulated maize and soybean production from the CERES-Maize and CROPGRO-Soybean modules of the Decision Support System for Agrotechnology Transfer (DSSAT) to daily solar radiation estimates obtained from traditional (stochastic, empirical, and mechanistic models) and non-traditional (satellite estimation, reanalysis datasets, and regional climate model simulations) approaches, using as an example radiation estimates for Hancock, Wisconsin, USA. When compared to observations, radiation estimates obtained from empirical and mechanistic models and a satellite-based dataset generally had smaller biases than other approaches. Daily solar radiation estimates from a reanalysis dataset and regional climate model simulations overestimate incoming daily solar radiation. When the radiation estimates were used as an input to CERES-Maize, no significant differences were found for maize yield obtained from the different radiation estimates compared to yield from observed radiation, even though differences were found in the daily values of leaf area index, crop evapotranspiration, and crop dry weight (biomass). In contrast, significant differences were found in simulated soybean yield from CROPGRO-Soybean for the majority of the radiation estimates.

Graphical Abstract

1. Introduction

Crop simulation models are useful for estimating crop biophysical processes under different environmental conditions, including climate variability and change, as well as simulating the potential impacts of changes in agricultural management practices on yields. Daily incoming solar radiation, together with precipitation and air temperature, is a critical input to crop models for estimating evapotranspiration, water stress, plant biomass production, and yield [1,2]. A concern is the limited availability of solar radiation observations for crop model applications, as worldwide this variable is infrequently measured compared to temperature and precipitation [3,4].
In the United States, solar radiation is not included in the measurements routinely taken by the two national in situ weather and climate observing networks with the longest period of record and greatest station densities (i.e., the Automated Surface Observing System (ASOS) and the Cooperative Observer Program (COOP)). Although daily solar radiation is observed as part of the Climate Reference Network (CRN), this network consists of only 114 stations [5,6], most of which are located outside of primary agricultural regions, and the record length (2002 to present) is relatively short. Radiation measurements are sometimes available from specialized meteorological networks, such as those maintained by universities and agricultural extension services, but their non-uniform coverage and varying quality control standards often limit their utility. Other sources of radiation observations include networks designed specifically for radiation monitoring, such as the Surface Radiation Budget Network (SURFRAD) [7,8] and the Baseline Radiation Network (BSRN) [9], or networks established for ecological monitoring, such as the National Ecological Observatory Network (NEON) [10,11]. However, these stations have relatively coarse spatial resolutions with few observing sites located in agricultural areas.
Given the limited availability of radiation measurements, point-based radiation models (i.e., stochastic, empirical, and mechanistic models) have been developed to estimate daily solar radiation at a location. Of these, stochastic methods are the most popular, especially for assessments of climate impacts on crop production [12,13,14,15]. Stochastic methods employ weather generators (e.g., WGEN [16] and SIMMETEO [17]) to generate, conditioned on the occurrence of wet and dry days, multiple time series of daily radiation for a particular site [18,19]. On the other hand, empirical models employ regression techniques to estimate solar radiation at a location from daily weather variables (e.g., [20]), whereas mechanistic models predict site-specific daily solar radiation from daily extra-terrestrial radiation [3,21].
A number of alternative sources of time series of daily solar radiation are also available, including reanalysis datasets (e.g., [22,23,24]), simulations from regional climate models (e.g., [25,26]), and estimations of radiation from satellites (e.g., [27]), although they have not been widely used for crop simulations. These gridded datasets potentially provide several advantages over traditional stochastic, empirical, and mechanistic radiation estimates. For instance, since daily radiation values can be directly extracted from these datasets, users do not need to apply further parameterization or model development. In addition, the gridded nature of the datasets, along with their relatively fine resolution (typically 50 km or less), provides uniform spatial coverage, enabling crop modeling over large geographic areas. Radiation estimates from regional climate simulations have an additional advantage in that projections of daily solar radiation for a future period are often available. This facilitates analyses of potential climate change impacts and adaptation options without the stationarity assumptions that characterize projections of future daily radiation obtained from many empirical and stochastic approaches.
The objectives of this study are to (1) compare observed solar radiation to estimated daily solar radiation from stochastic, empirical, and mechanistic models (referred to below as “traditional” approaches), and to satellite, reanalysis, and regional climate model radiation estimates (referred to below as “non-traditional” approaches), and (2) assess the sensitivity of simulated maize and soybean development and yield to the different sources of daily solar radiation inputs. The analysis was performed for Hancock, Wisconsin, an agricultural location in the Upper Great Lakes region of the United States for which a long-term record of daily solar radiation was available. Maize and soybean were selected because they are the two most widely grown crops in the region [28], and represent C4 (maize) and C3 (soybean) crop types with differing light saturation thresholds and photosynthetic mechanisms [29]. This analysis of multiple sources of daily solar radiation and their impacts on crop model simulations provides guidance for selecting daily solar radiation estimates for crop modeling, along with insights on interpreting crop model simulations obtained used different sources of solar radiation. In addition, our comprehensive evaluation extends and enriches previous work that focused on only a few sources of daily solar radiation (e.g., [30,31,32,33]).

2. Materials and Methods

2.1. Climate Observations and Study Period

Daily solar radiation observations for evaluating the different radiation estimates, along with the temperature and precipitation observations used as inputs to the stochastic, empirical and mechanistic models, were obtained from the Hancock, Wisconsin Agricultural Research Station (Figure 1), available from University of Wisconsin-Extension [34]. This station was selected because of its (1) relatively long period of record and (2) geographic proximity (~52 km) to an observing site (Necedah, Wisconsin) within the Climate Reference Network (CRN). Observations from the CRN station were used to assess the quality of the solar radiation measurements at Hancock, assuming that little difference should exist in the radiation time series given the proximity and similar elevation of the two locations.
The study period was constrained to 1990–2000, the period of overlap for the observations and the different sources of radiation estimates. Furthermore, within this period, a relatively large number (>20%) of observations were missing at the Hancock station in 1991, 1999 and 2000. These years were removed, and, as a result, only 1990 and 1992–1998 were included in the analysis, for a total of eight years. Although relatively short, an eight-year period was previously used to evaluate the performance of several mechanistic models and a weather generator to estimate daily solar radiation [19]. Missing temperature and precipitation observations during the analysis period were filled in with observations from the United States Historical Climate Network (USHCN) Hancock station [35], and missing daily solar radiation observations were filled in with the average of the non-missing observations for that date. For the development of the empirical and mechanistic models, the observations for the eight-year study period were divided two groups. Data from 1990, 1992, 1994, and 1997 were used for model calibration, and the remaining data were reserved for model validation. The percentage of missing observations was <1% for the calibration period and <3% for the validation period.

2.2. Daily Solar Radiation Estimates

Daily solar radiation is defined here as the daily mean downward shortwave radiation flux incident on a horizontal surface. Estimated daily solar radiation was obtained from multiple sources, namely a stochastic weather generator, an empirical equation, a mechanistic model, a satellite-based estimate, regional reanalysis, and suite of regional climate model simulations. All daily solar radiation estimates were converted to megajoules per meter squared (MJ m−2 day−1) for comparison and for input into the crop simulation model.

2.2.1. Stochastic Generation

Daily solar radiation was stochastically generated using the “WeatherMan” stochastic weather generator available in the Decision Support System for Agrotechnology Transfer (DSSAT) [36]. As noted by Mavromatis et al. [37], WeatherMan is a variant of the well-known WGEN [16] weather generator. In WeatherMan, all model parameters are estimated on a monthly basis. Daily values of the model parameters are calculated internally using linear interpolation to preserve the monthly means. The major advance over WGEN is that WeatherMan replaces coefficients of variation with standard deviations to stabilize model estimations when temperatures are close to 0 °C [37]. For this analysis, WeatherMan was parameterized using the daily series of precipitation and maximum and minimum temperature from the Hancock station for the 8-year analysis period.

2.2.2. Empirical Model

The regression equation developed by Ball et al. [20] to estimate daily incoming solar radiation at Keiser, Arkansas, United States, was recalibrated for the Hancock station. The Ball et al. model employs a General Linear Model in the form:
R s =   β 0 +   β 1 X 1 +   β 2 X 2 + β 3 X 3 + + β 12 X 12
where Rs is daily solar radiation (MJ m−2 day−1) and β0 and β1…12 are the intercept and regression coefficients, respectively. X1 and X5 are precipitation (mm) and precipitation squared; X2 and X6 are maximum temperature (°C) and maximum temperature squared; X3 and X7 are minimum temperature (°C) and minimum temperature squared; and X4 and X8 are day of the year and day of the year squared. The interaction terms are X9 (X1 * X3), X10 (X2 * X3), X11 (X1 * X2) and X12 (X2 * X4). The coefficient of determination (R2) and root mean square error (RMSE) for the comparison of the simulated and observed daily radiation were 0.75 and 4.05 MJ m−2 day−1, respectively, for the calibration period (1990, 1992, 1994, 1997) and 0.79 and 3.83 MJ m−2 day−1 for the validation period (1993, 1995, 1996, 1998).

2.2.3. Mechanistic Model

A number of mathematical models, which we label here as “mechanistic models”, have been developed to estimate solar radiation based on the fraction of extraterrestrial radiation (S0) reaching to the ground. This fraction is estimated as a function of the atmospheric transmissivity [20,38,39], which can be modeled based on temperature and precipitation [3]. For this study, the Hunt et al. [21] radiation model was used to estimate daily solar radiation at Hancock. This model was chosen as it was developed for Elora, Canada, which has a relatively similar climate to our study location. Daily solar radiation was estimated by:
S =   a 0 S 0 ( T max T min ) 0.5 + a 1 T max + a 2 P + a 3 P 2 + a 4
where S is the daily solar radiation (MJ m−2 day−1); a0, a1, a2, a3, a4 are the coefficients; S0 is the daily extraterrestrial solar radiation (MJ m2 day−1), Tmax and Tmin are the maximum and minimum daily temperatures (°C); and P is the daily precipitation (mm). The model uses equations previously defined by Spitters et al. [38] to estimate daily solar radiation at the top of atmosphere (S0):
S 0 = S sc [ 1 + 0.33 cos ( 360 t d 365 ) ] sin β
where S0 is the extra-terrestrial irradiance (J m−2 s−1); Ssc is the solar constant 1370 J m−2 s−1; the cosine term is the yearly course of the distance between the earth and sun expressed in degrees; td is the days since 1 January; and sin β, the sine of the elevation of the sun above the horizon, is defined as:
sin β = sin λ   sin δ + cos λ   cos δ   cos [ 15 ( t h 12 ) ]
where λ is the latitude of the site, th is the hour of the day (solar time), and δ is the solar declination for the day of year, measured in degrees and estimated by:
sin δ =   sin ( 23.45 ) cos [ 360 ( t d + 10 ) 365 ]
Following Spitters et al. [38], the daily value of S0 is calculated by integrating the extra-terrestrial irradiance from sunrise till sunset with day length (D) estimated as:
D = 12 + ( 24 180 ) arcsin ( tan λ tan δ )
The mechanistic model was parameterized using daily observations at Hancock for 1990, 1992, 1994, and 1997 and validated using the observations from 1993, 1995, 1996, and 1998. The R2 and RMSE between the simulated and observed solar radiation were 0.76 and 3.96 MJ m−2 day−1, respectively, for the calibration period, and 0.80 and 3.76 MJ m−2 day−1 for the validation period.

2.2.4. Satellite Radiation Estimates

Satellite estimates of surface incoming solar radiation at a 1° latitude/longitude resolution were obtained from the NASA Prediction of Worldwide Energy Resource (POWER) database [40]. Daily solar radiation in this database was inferred using the Pinker and Laszlo [41] radiative transfer model in conjunction with water vapor amounts from the Goddard Earth Observing System Data Assimilation System version 4. Please refer to the methodological summary provided by NASA [42] for more detailed information on the derivation of the radiation estimates. Daily series of surface insolation were extracted from the POWER archive for the grid point nearest to the Hancock station.

2.2.5. Reanalysis Radiation Estimates

The popular North American Regional Reanalysis (NARR) [19], which has a spatial resolution of approximately 32 km, was the reanalysis dataset chosen for the analysis. Three-hourly values of downward solar radiation flux, available from the National Center for Environmental Information [43], were extracted for the NARR grid point closest to Hancock and averaged to estimate daily solar radiation. The daily averages were calculated based on local time, using the 3-hourly values from 0900 UTC of the current day to 0600 UTC of the next day.

2.2.6. Regional Climate Model Simulations

Regional climate model simulations with a horizontal resolution of 50 km were obtained from the North American Regional Climate Change Assessment Program (NARCCAP) [44]. These simulations were chosen over other sources given their previous use in a broad range of applications [45]. NARCCAP simulations from four regional climate models—Canadian Regional Climate Model (CRCM), Experimental Climate Prediction Center/Regional Spectral Model (ECP2), Hadley Regional Model 3 (HRM3), and Weather Research and Forecasting model (WRFG)—were included in the analysis. All simulations employed coarse-scale (2.5° × 2.5°) NCEP/NCAR reanalysis fields [46] as lateral boundary conditions. For each model, the eight 3-hourly values of surface downwelling shortwave radiation from 0900 to 0600 UTC were averaged for the grid point closest to Hancock to obtain estimates of daily solar radiation.

2.3. Crop Yield Simulations

Two DSSAT modules, CERES-Maize and CROPGRO-Soybean, were used in this study. Each module uniquely calculates the conversion of incoming radiation to plant biomass though different photosynthetic processes. As summarized by Jones et al. [2], the CERES family of models employs radiation use efficiency, whereas the CROPGRO module utilizes leaf-level photosynthesis. DSSAT requires that users supply cropping management options such as crop variety, row spacing and planting date. This study generally adopted the cropping management options previously utilized by Andresen et al. [47], who investigated weather impacts on maize and soybean production in the Upper Great Lakes Region. The cropping management options used in the analysis are summarized in Table 1.

2.4. Evaluation Methods

Evaluation of the sensitivity of the crop simulations to the different sources of daily solar radiation involved the following three steps.

2.4.1. Daily Solar Radiation

Estimated daily solar radiation from the different sources was compared to observed daily solar radiation using R2 and RMSE, both of which have been widely used in previous studies (e.g., [3,20,21]). Similar to Rivington et al. [48], we also calculated the daily bias (bi) between the daily radiation estimates (Sei) and observations (Soi), averaged over the study period:
b i = Se i So i
Se i =   1 n j = 1 n Se ji   and   So i = 1 n j = 1 n So ji
where i is day, j is year, and n is the number of years.

2.4.2. Crop Growth and Development

Differences in solar radiation accumulation (SRAC), leaf area index by day (LAID), evapotranspiration accumulation (ETAC), and crop dry weight by day (CWAD) for major plant phenological stages (planting, emergence, anthesis, and maturity) were evaluated for both maize and soybean. For each combination of crop growth variable and radiation estimate, we first calculated RMSE and mean error (ME), where ME is defined as the average of the differences between the simulated values obtained using observed and estimated radiation for the eight study years. In addition, the evolution of SRAC, LAID, ETAC, and CWAD over the course of the 1993 growing season is provided to illustrate differences in simulated plant development by radiation estimate. Inspection of the plots for all years indicated that the differences in simulated plant development were similar for all years, and the choice of the example year has little influence on the interpretation.

2.4.3. Crop Yield

Following Garcia et al. [29], differences in crop yield obtained using estimated and observed daily solar radiation as inputs to the crop simulation models were evaluated using mean squared deviation (MSD), as defined by Kobayashi and Salam [49]. MSD is composed of three parts, namely squared bias (SB), squared difference between standard deviation (SDSD), and the lack of correlation weighted by the standard deviation (LCS). SB is a traditional measure of bias, SDSD provides an indication of how well the simulated yield obtained from the estimated daily solar radiation represents the variability of the simulated yield obtained using observed solar radiation, and LSC provides an indication of how well the pattern of the annual yield fluctuations is captured. Large values of MSD indicate less agreement between the simulated yields. The mathematical forms of MSD, SB, SDSD, and LCS are:
MSD = SB + SDSD + LCS
  SB = ( ( x ¯ y ¯ ) ) 2
  SDSD = ( ( SDx SDy ) ) 2
  LCS = 2 SDx SDy ( 1 r )
  SDx =   1 n i = 1 n ( x i x ¯ ) 2
SDy =   1 n i = 1 n ( y i y ¯ ) 2
where x ¯ and y ¯ are the means of crop yields obtained from the estimated (xi) and observed (yi) daily solar radiation, i is year, n is the length of study period, and SDx and SDy are the standard deviations of crop yields simulated using estimated and observed solar radiation, respectively.

3. Results

3.1. Solar Radiation

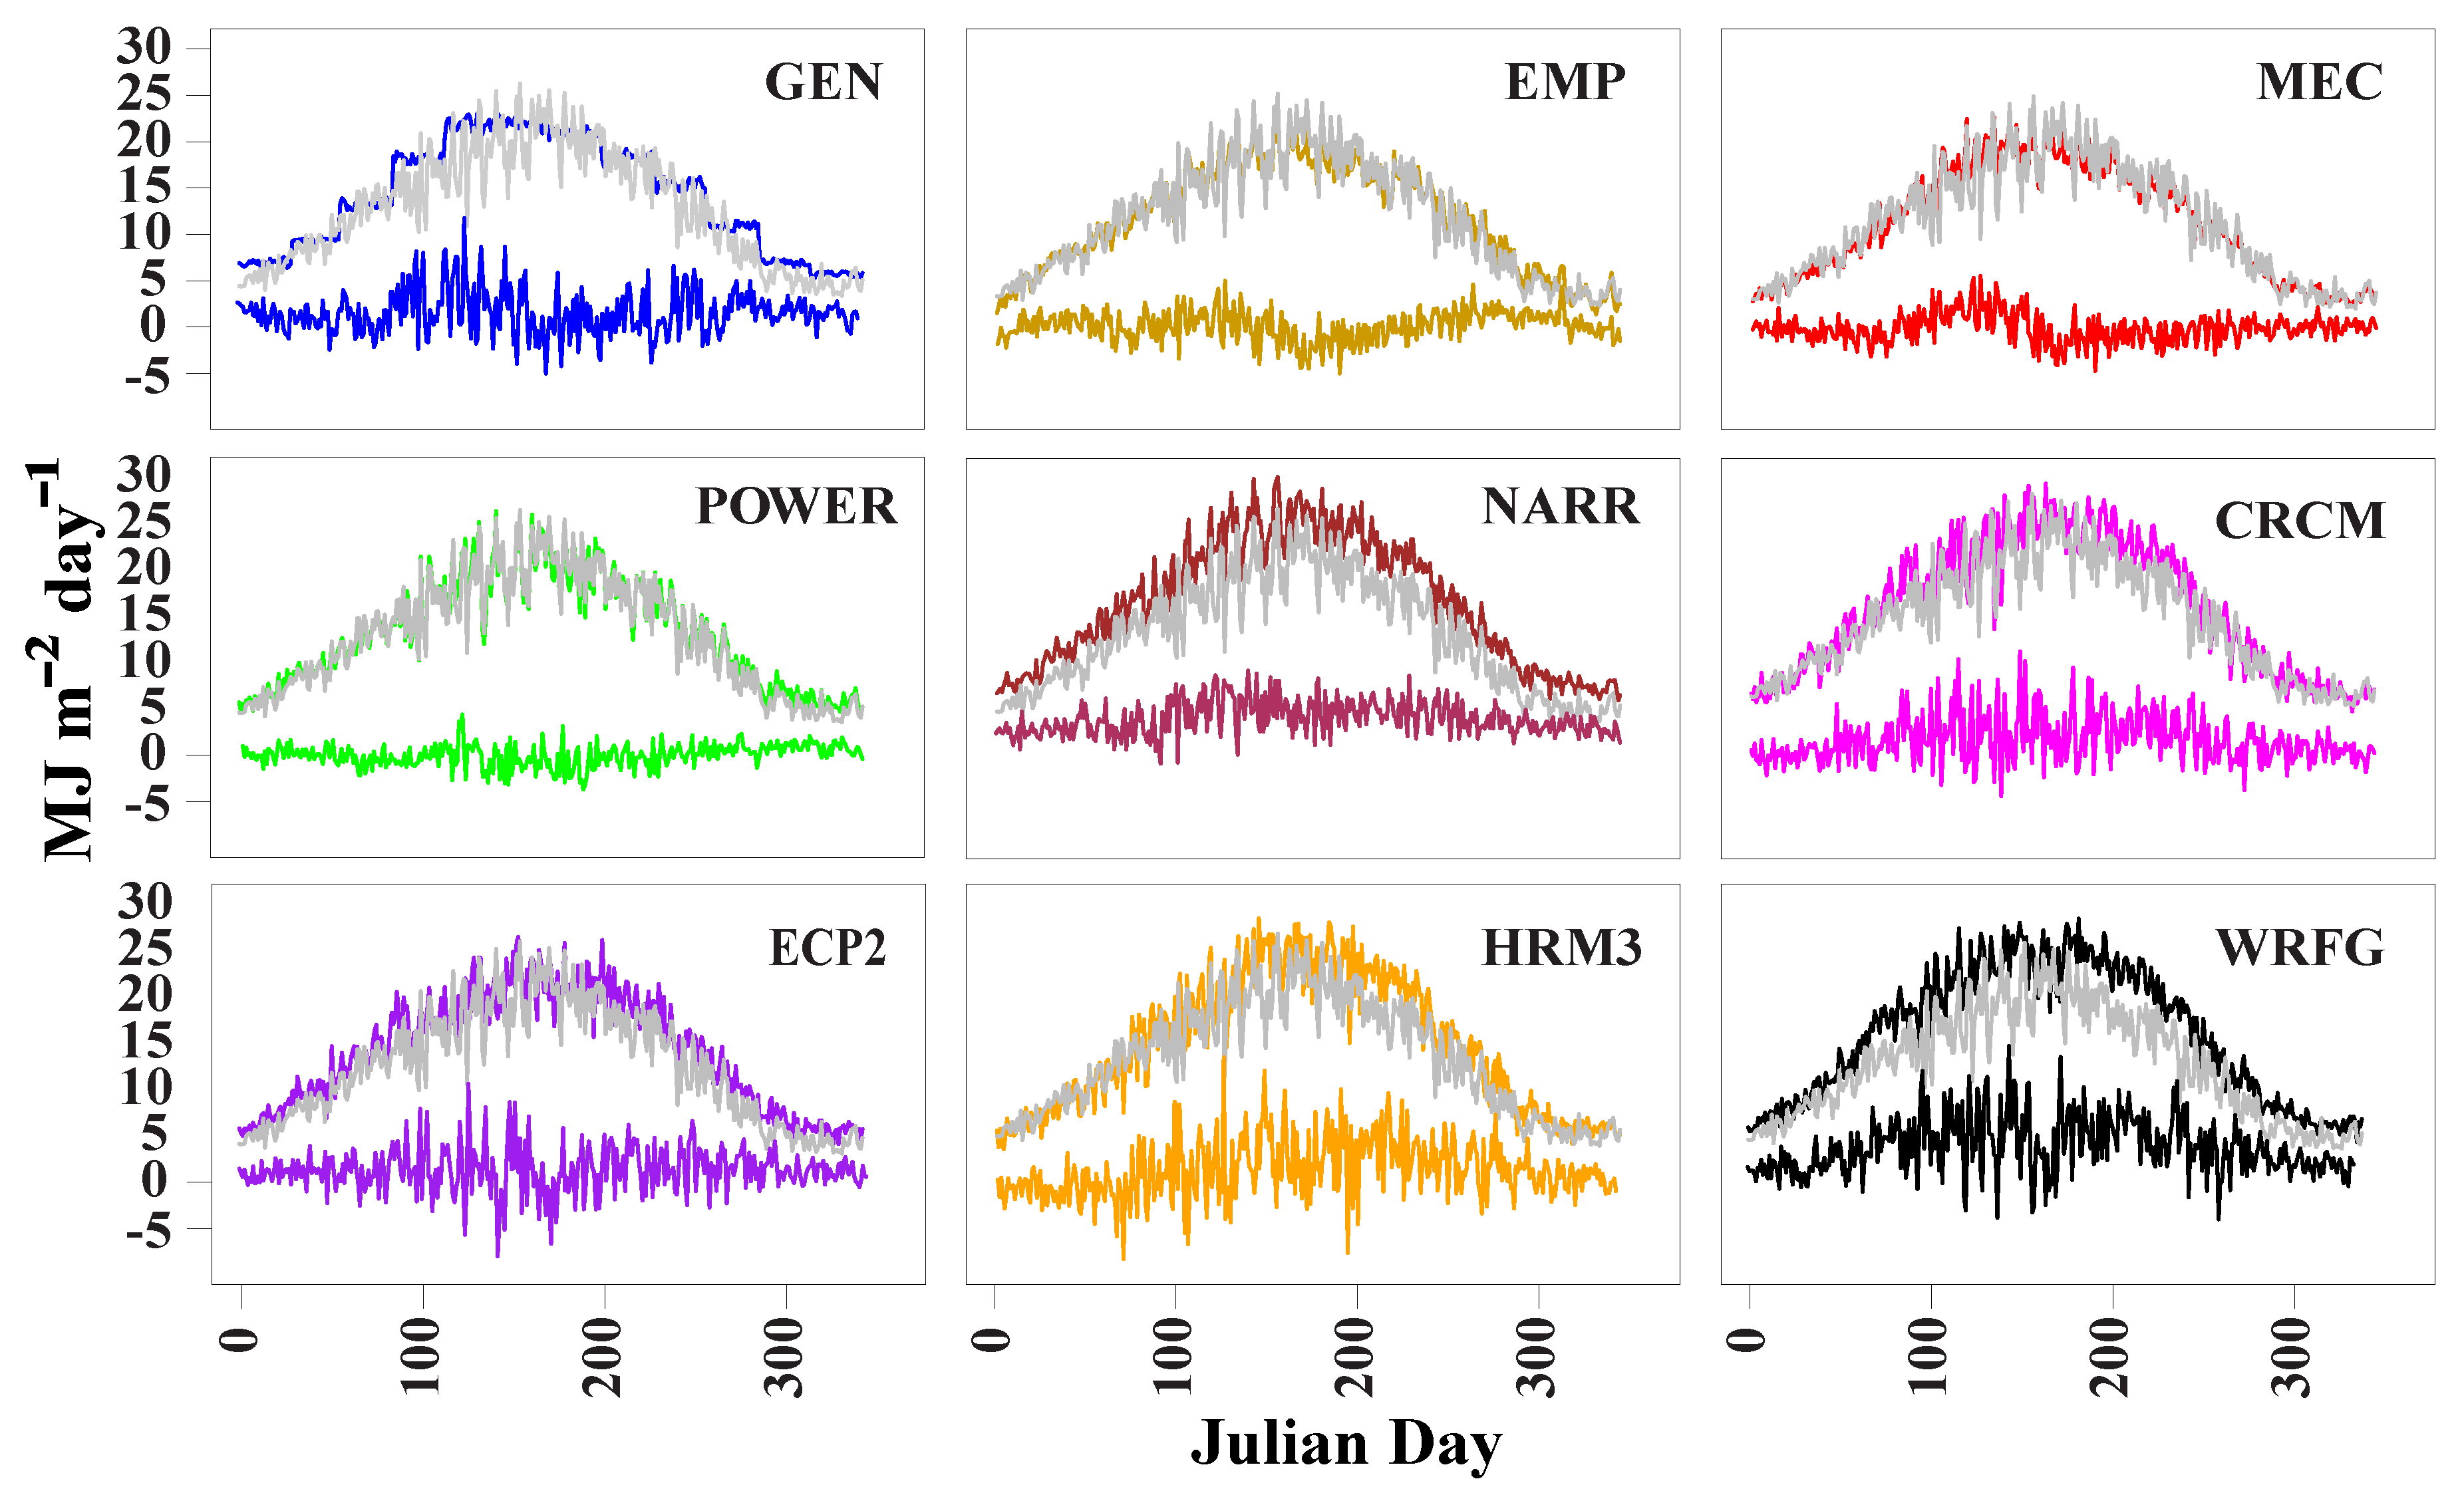
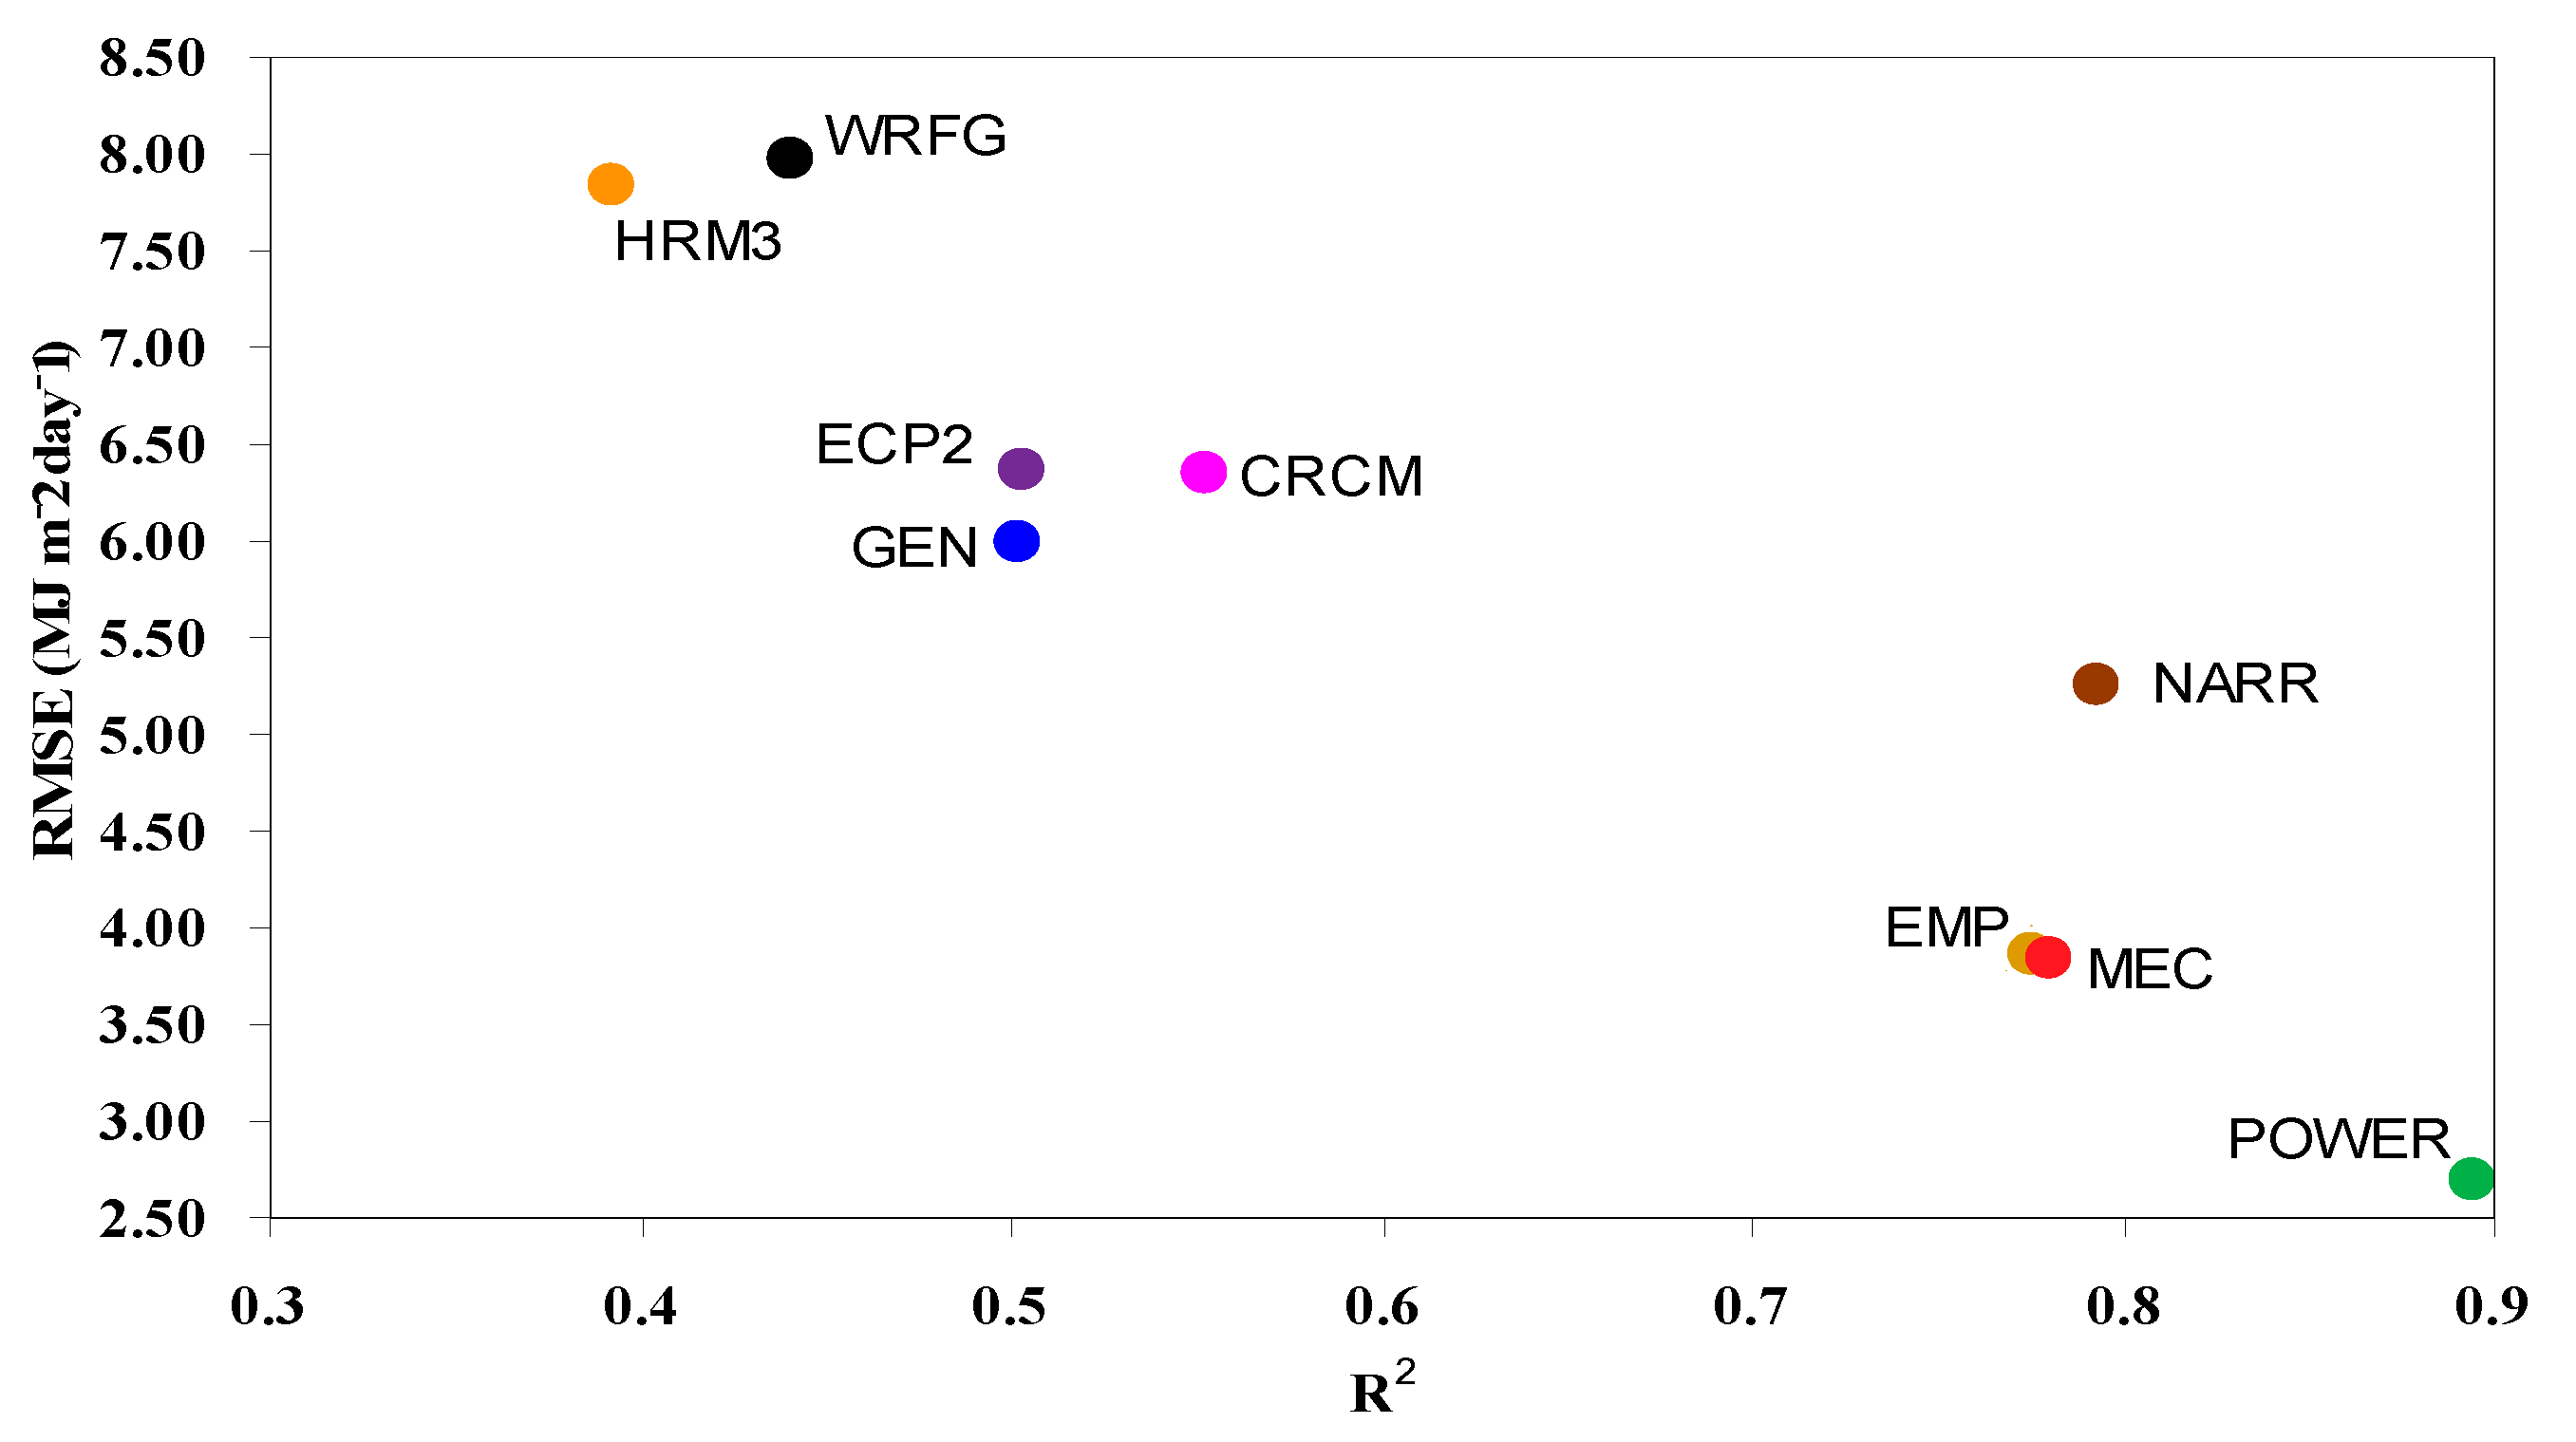
Mean daily observed and estimated solar radiation for the study period indicate that the radiation estimations capture the annual cycle of observed solar radiation (Figure 2). With the exception of the weather generator, there is relatively large day-to-day variability in the observed and estimated daily means. Large positive mean biases are evident for the daily radiation estimates obtained from the weather generator, reanalysis, and the outputs from the regional climate models, in comparison to the estimates obtained from the empirical and mechanistic models and the satellite-derived dataset. Further evaluation based on RMSE and R2 calculated for the calendar year suggests that several of the radiation sources (POWER, the empirical and mechanical models, and NARR) perform better than the commonly used weather generator in estimating the observed daily solar radiation (Figure 3). On the other hand, the RMSE and R2 values for the radiation estimates obtained from the regional climate models indicate either a similar (CRCM, ECP2) or poorer (HRM3, WRFG) performance when compared to the weather generator.
Differences in monthly means and standard deviations of daily solar radiation are also provided to help visualize intra-annual variations in the deviations between estimated and observed radiation (Table 2). Large differences between the estimated and observed monthly means are evident during much of the year, including the growing season, for NARR and the majority of the regional climate simulations. In contrast, differences in the monthly mean are small throughout the year for the radiation estimates obtained from the empirical and mechanistic models and POWER, although, with the exception of POWER, these methods substantially underestimate the standard deviation of daily solar radiation. The largest deviations in monthly standard deviation are evident for the weather generator, in agreement with the small variability in mean daily radiation plotted in Figure 2.

3.2. Crop Growth and Development

3.2.1. Accumulated Daily Solar Radiation (SRAC)

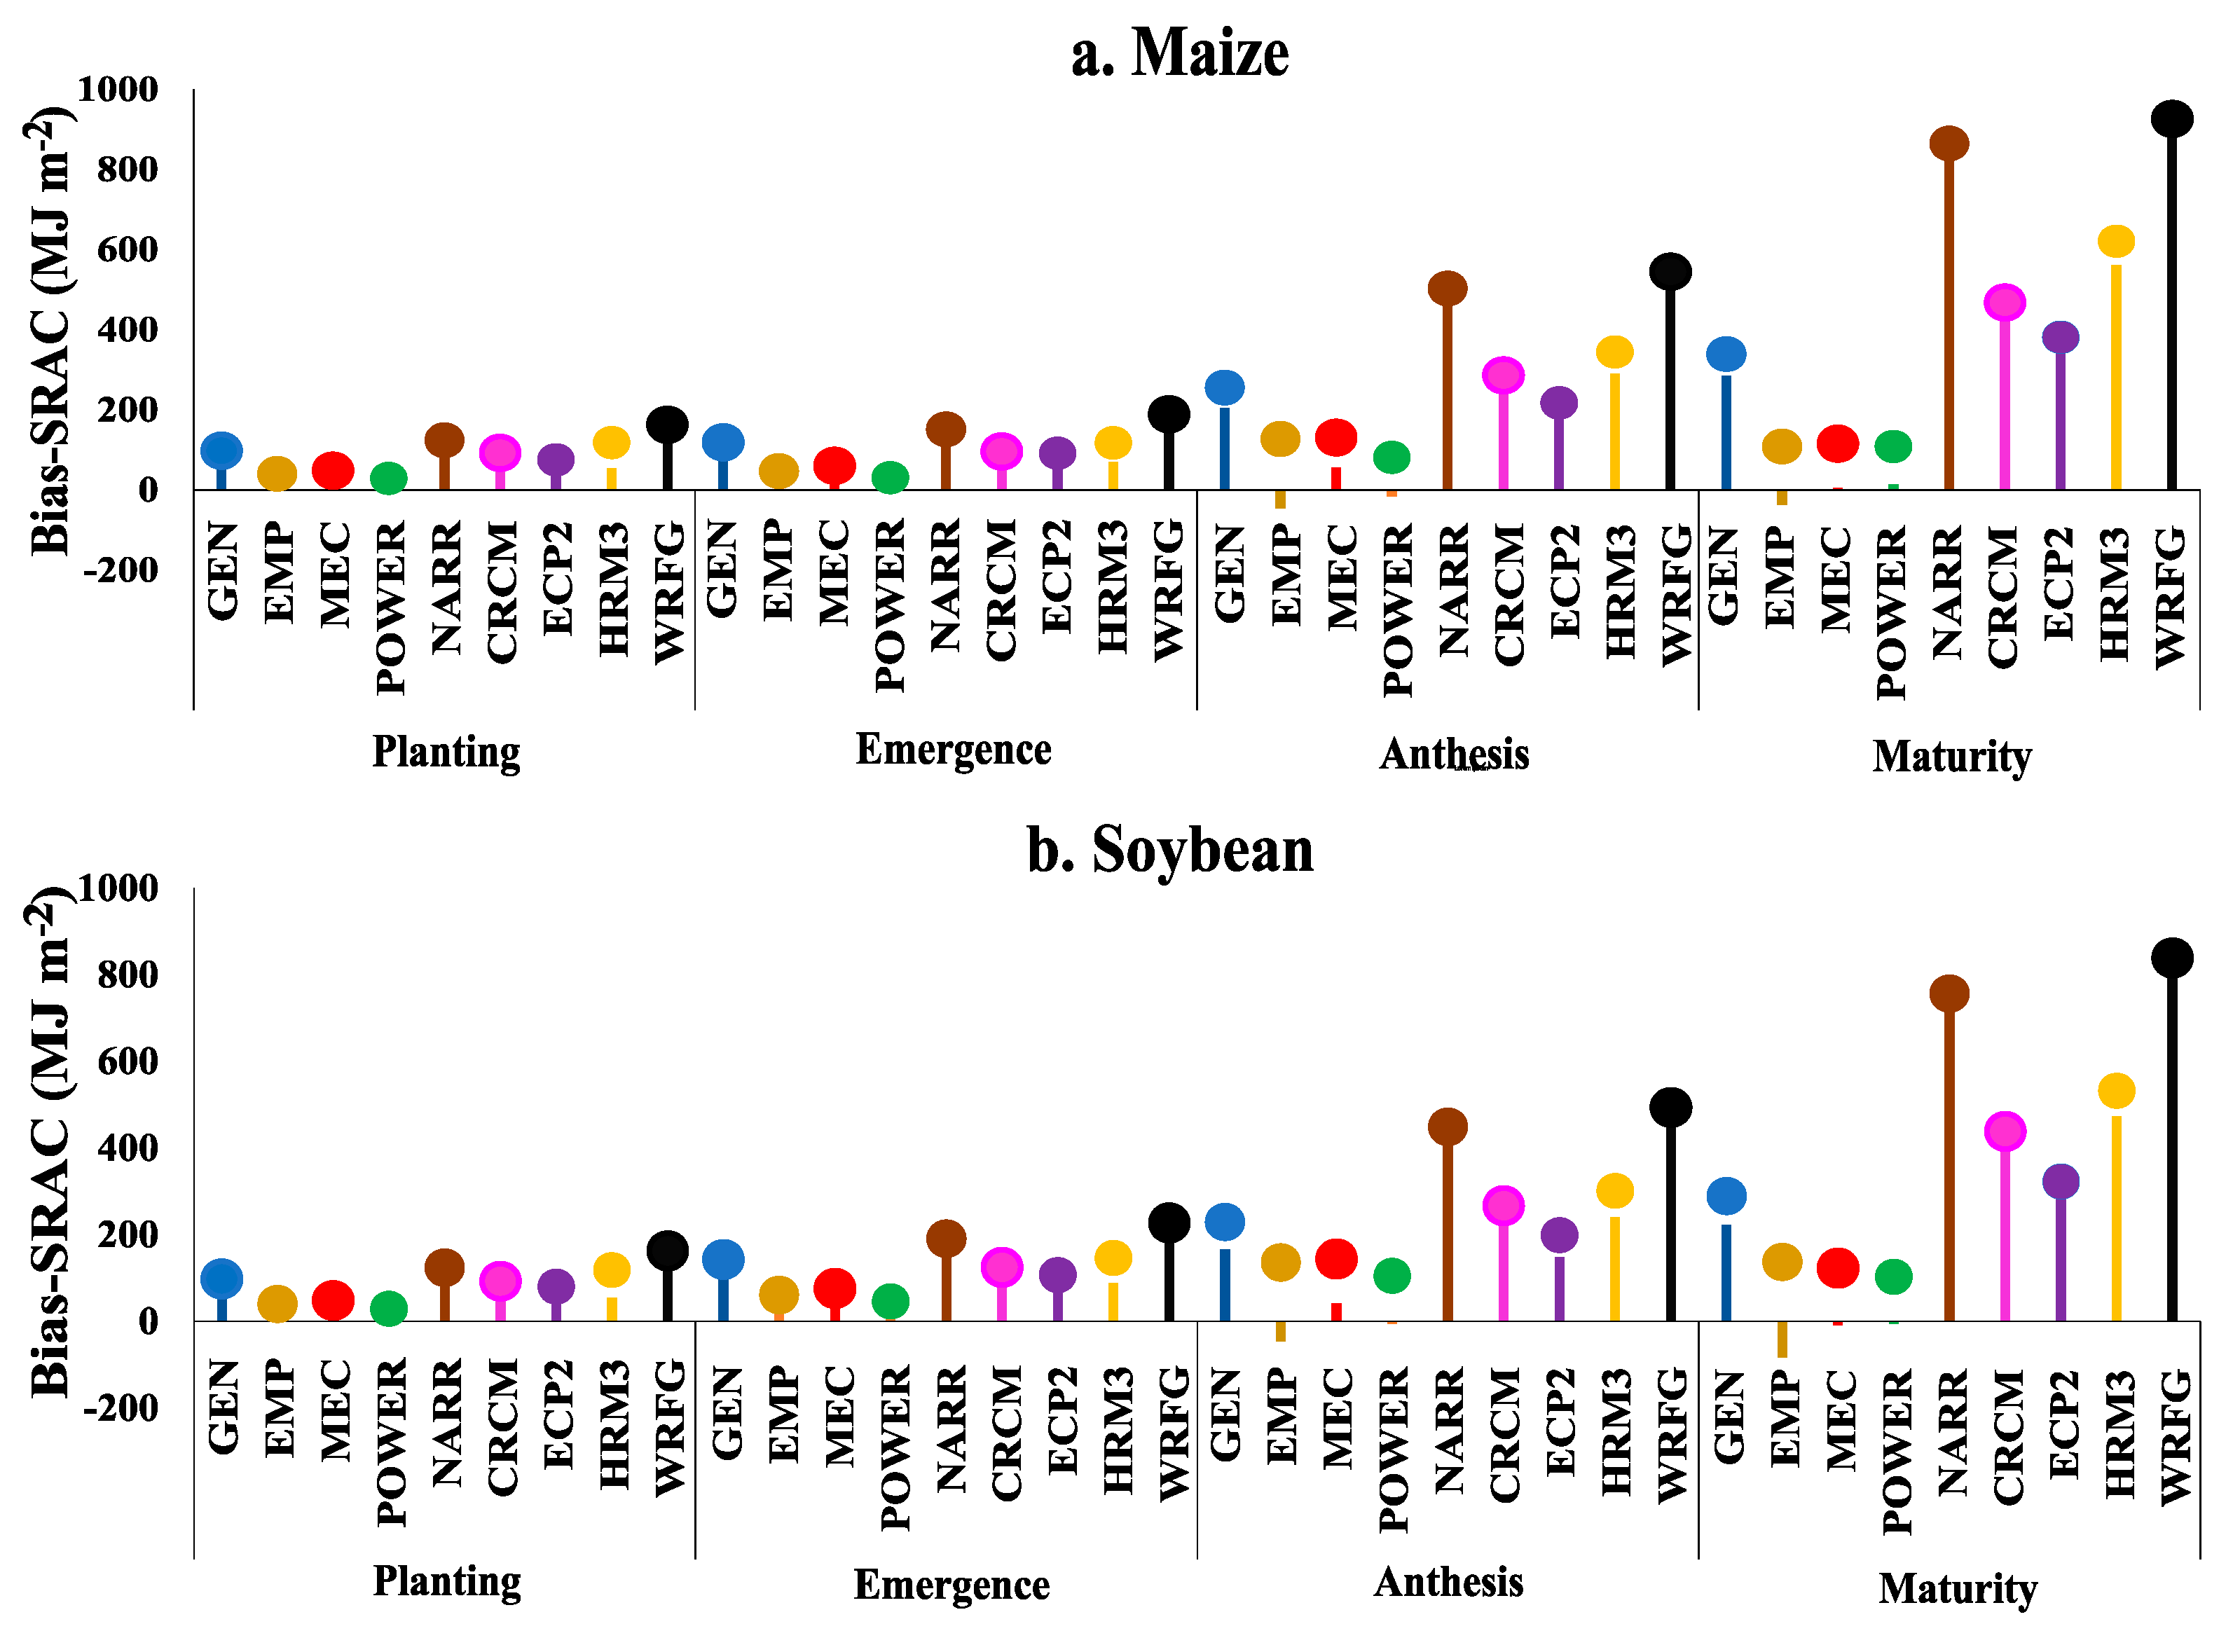
RMSE for SRAC is small for all the radiation sources at planting and emergence for both maize and soybean (Figure 4). RMSEs are larger at the start dates of the later plant stages (anthesis and maturity), with considerable differences evident between radiation sources. The smallest RMSEs are observed for the empirical and mechanistic models and POWER, and the largest for NARR and the regional climate models. Although the RMSEs for the weather generator are larger than those of the empirical and mechanistic models and POWER, they are substantially smaller than those for the other radiation sources. These findings are consistent with the large positive mean biases evident throughout the growing season in Figure 2 for NARR and the regional climate model simulations. While large mean biases are observed early in the growing season for the weather generator (Figure 2), biases later in the season are considerably smaller, contributing to the smaller RMSE values at anthesis and maturity for this radiation estimate. The small RMSEs for the empirical and mechanistic models and POWER are consistent with the small mean biases throughout the growing season.
As shown in Figure 4, the magnitudes of ME and RMSE are relatively similar for SRAC, considering that the majority of the ME values are positive (i.e., overestimation of SRAC). For maize, small negative (i.e., underestimation) values of ME are evident for the empirical model and for POWER at anthesis and for the empirical model at maturity. For soybean, the largest underestimation of SRAC is observed for the empirical model at anthesis and maturity. ME for the mechanistic model and POWER hovers near zero for these growth stages.
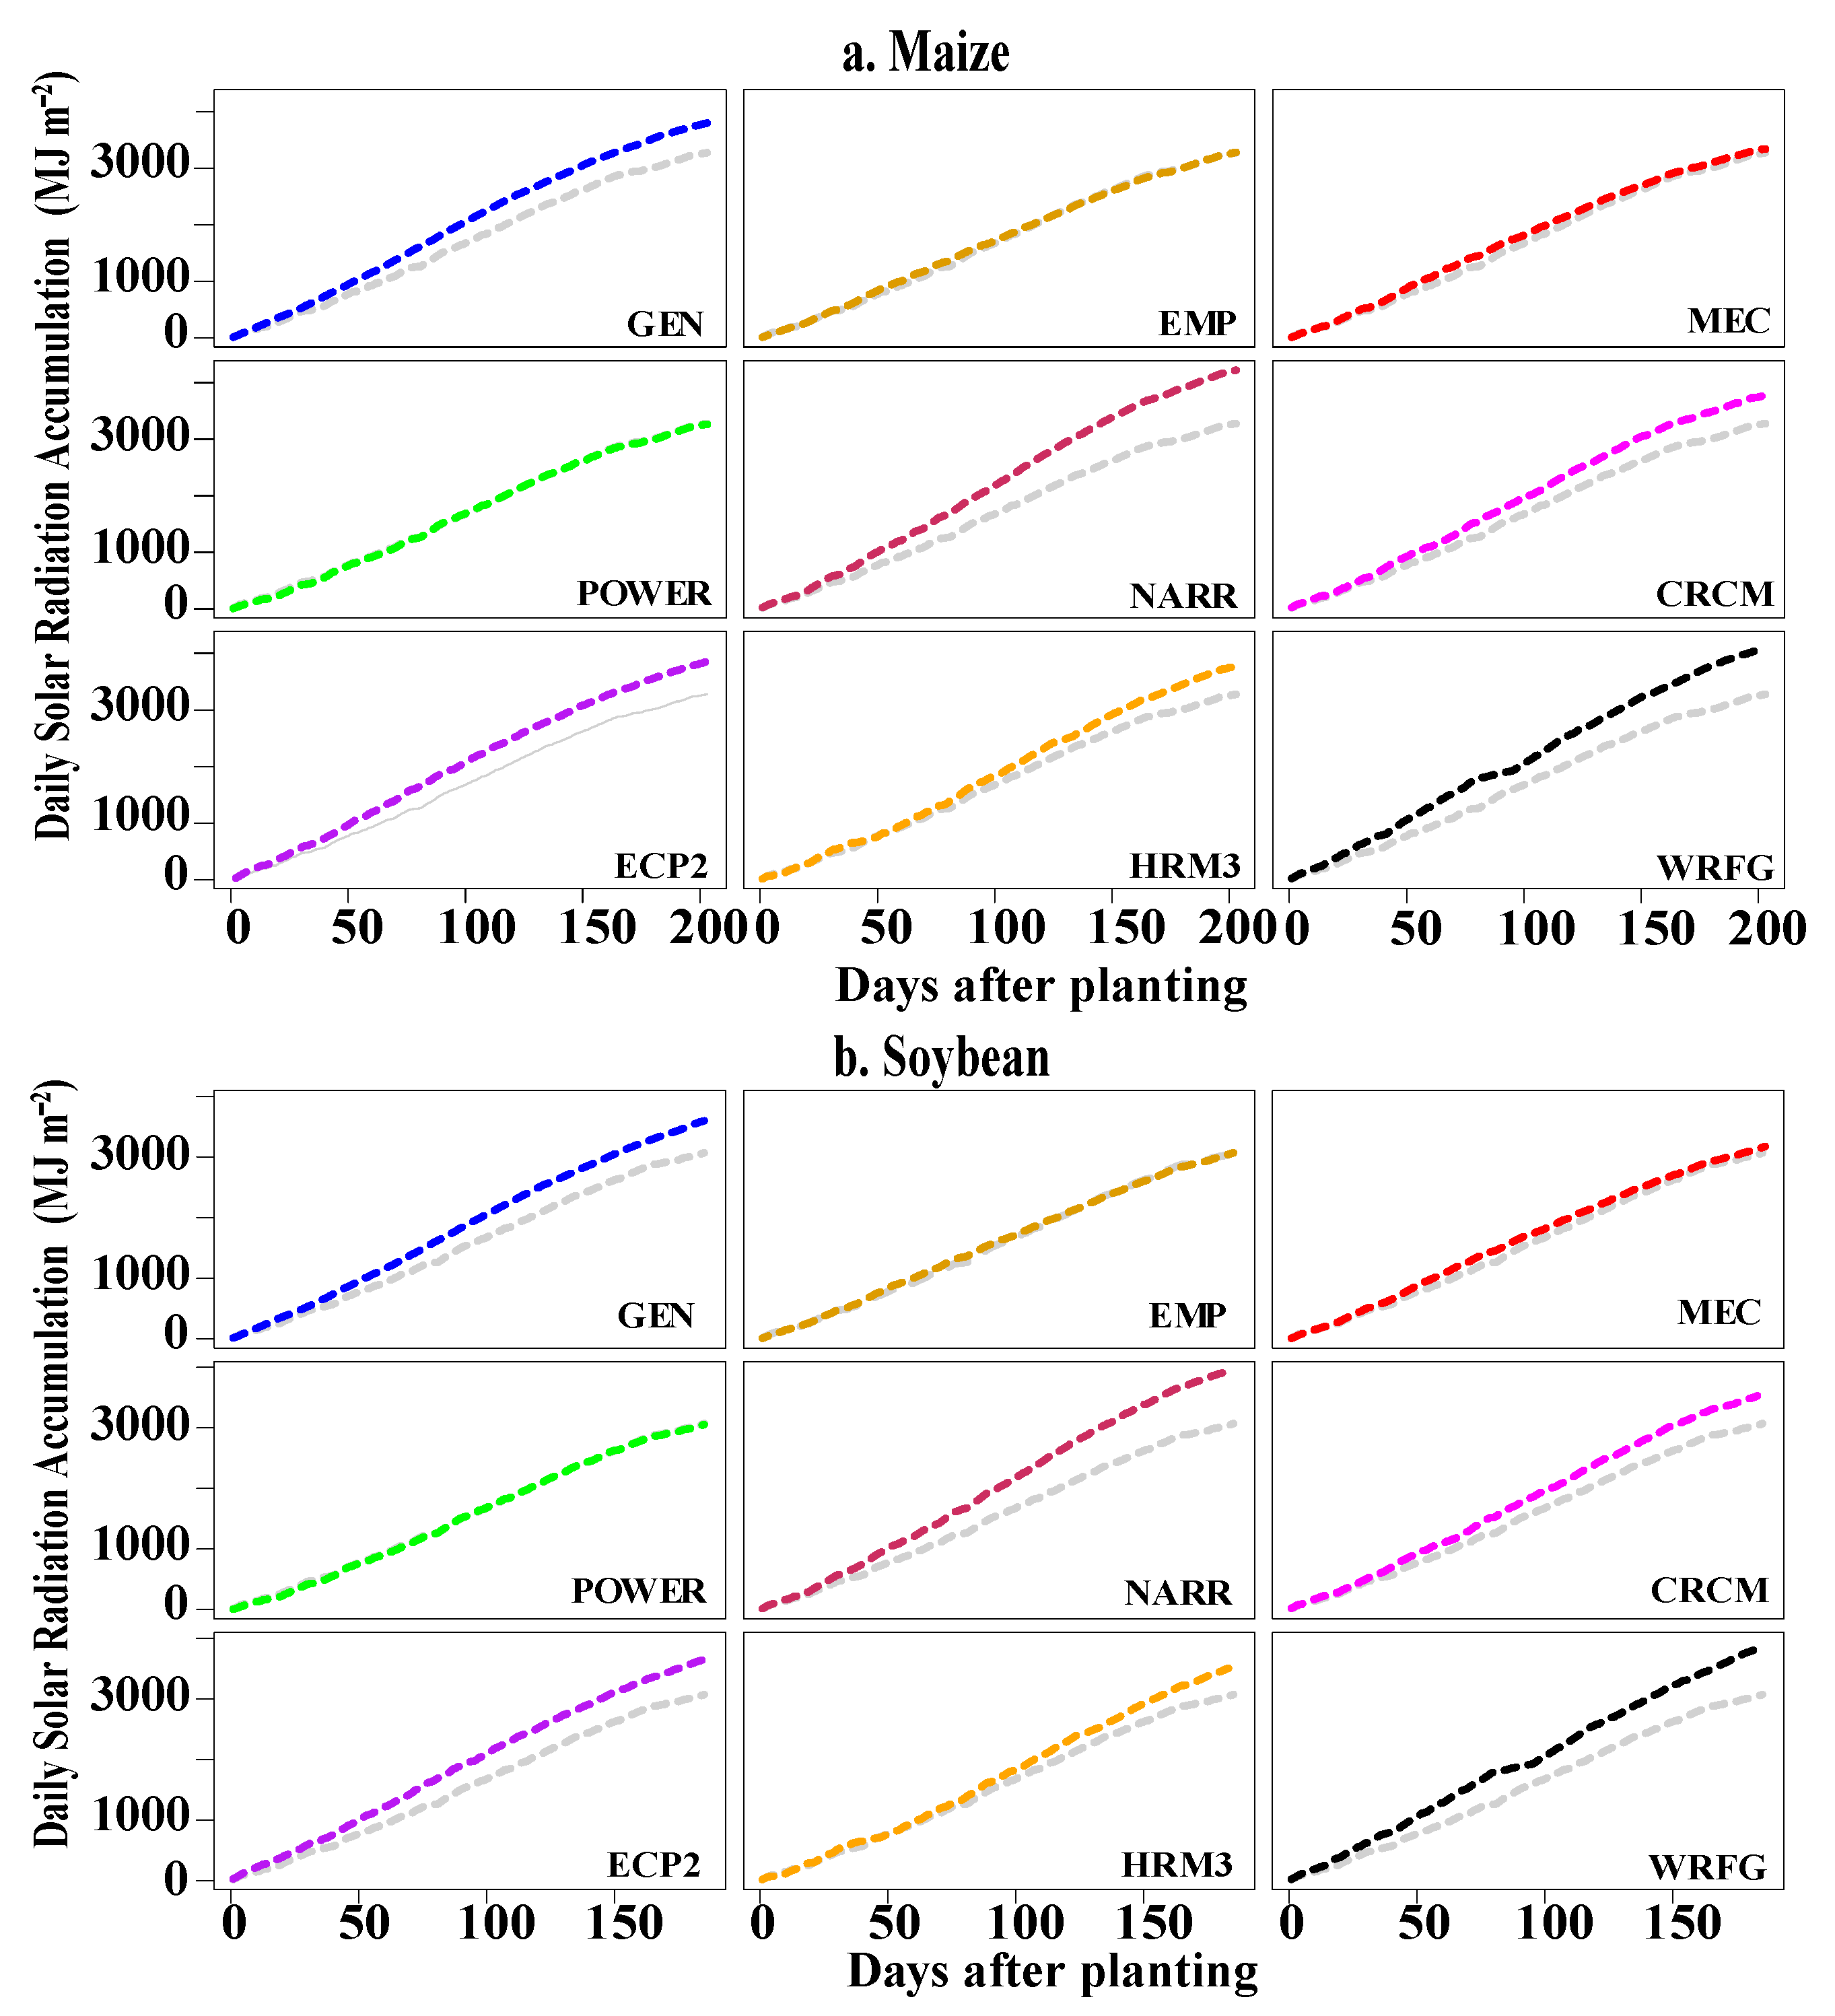
To further illustrate the differences between the radiation sources, estimated and observed SRAC are shown in Figure 5 for the 1993 crop model simulations according to days since planting (DAP). Substantial differences in the observed and estimated SRAC appear after approximately 80 DAP for maize and 70 DAP for soybean. Generally, SRAC obtained from the radiation estimates is larger than that obtained from observed solar radiation throughout the growing season, with the largest deviations evident for the weather generator, reanalysis, and climate models for both maize and soybean. The empirical and mechanistic models, along with POWER, are exceptions to this generalization. For these sources, SRAC obtained from the radiation estimates is similar to the values from observed radiation throughout the growing season.

3.2.2. Leaf Area Index (LAID)

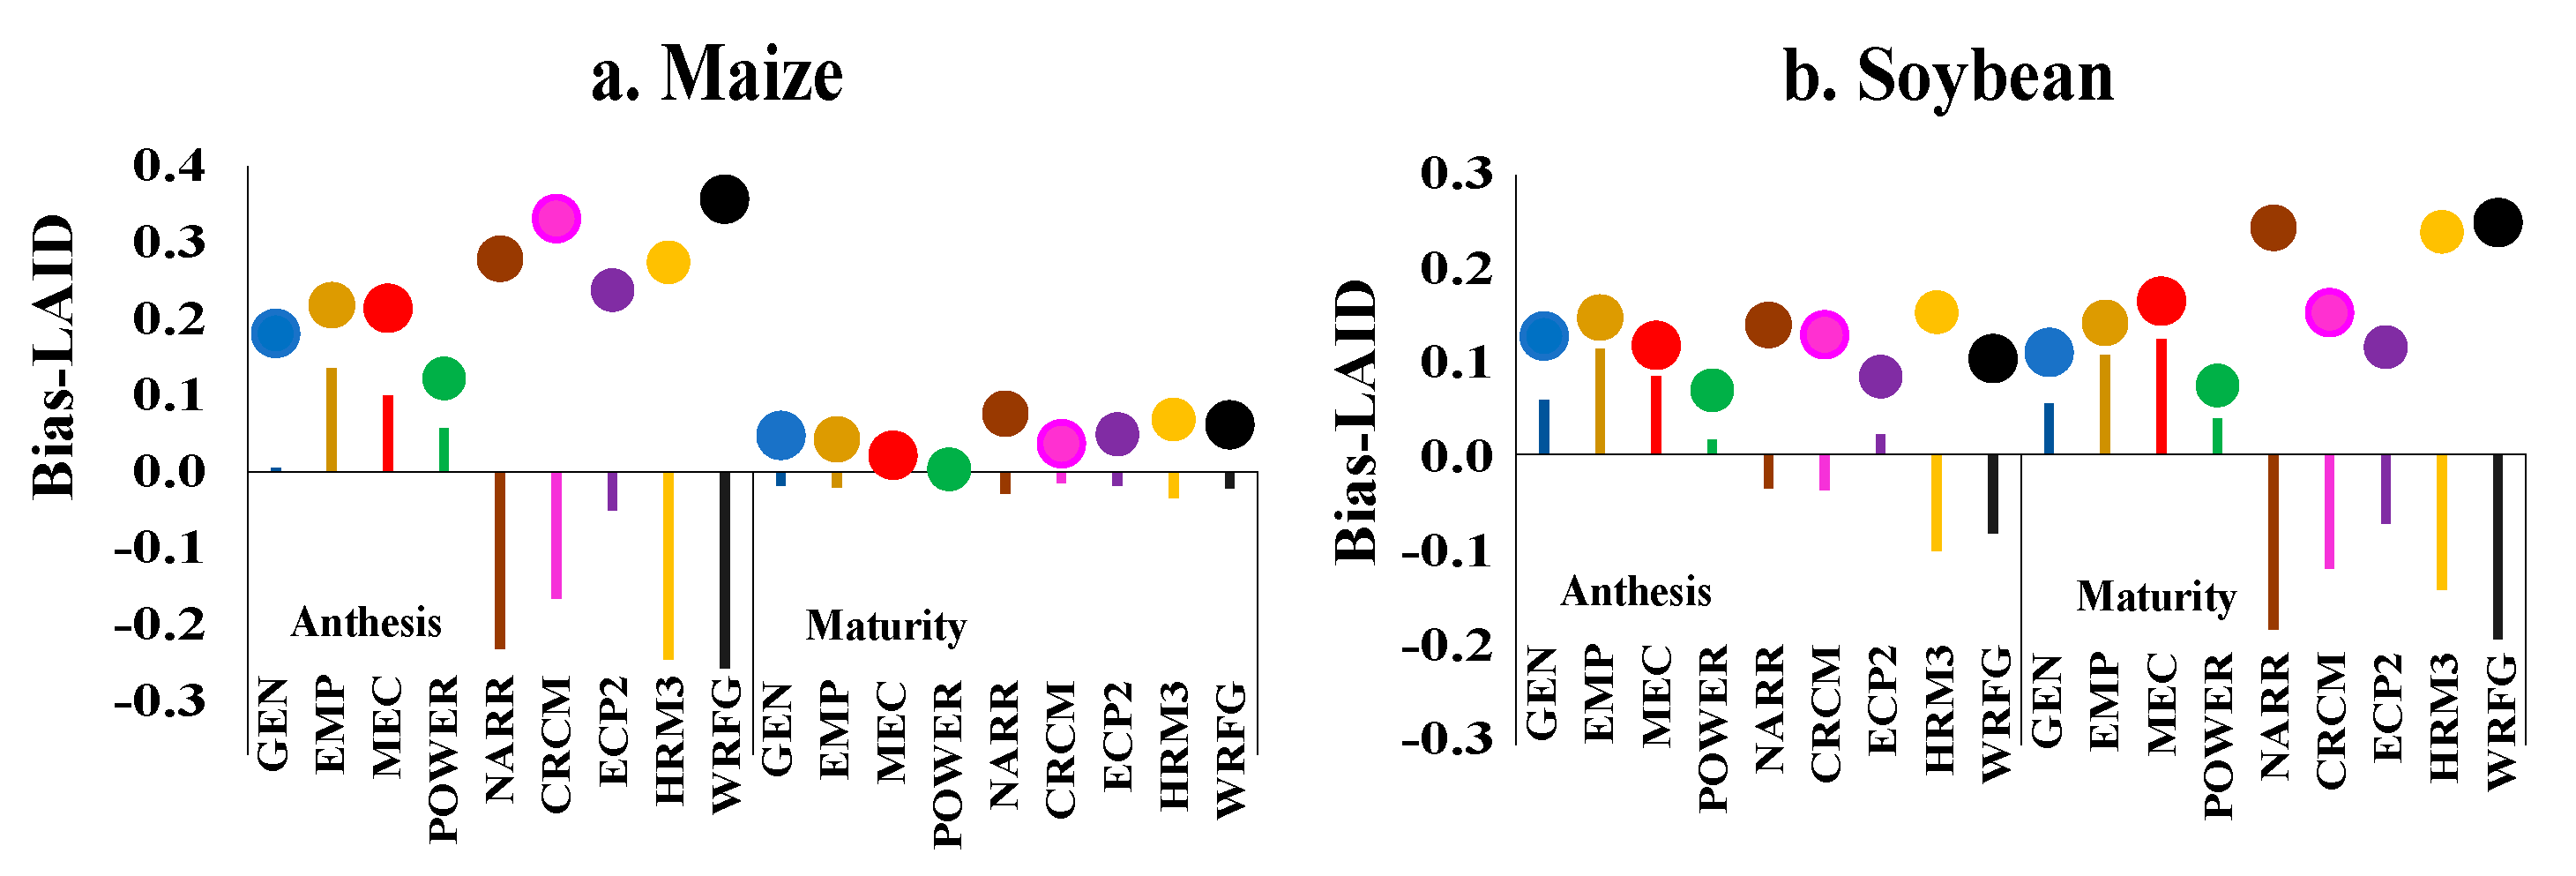
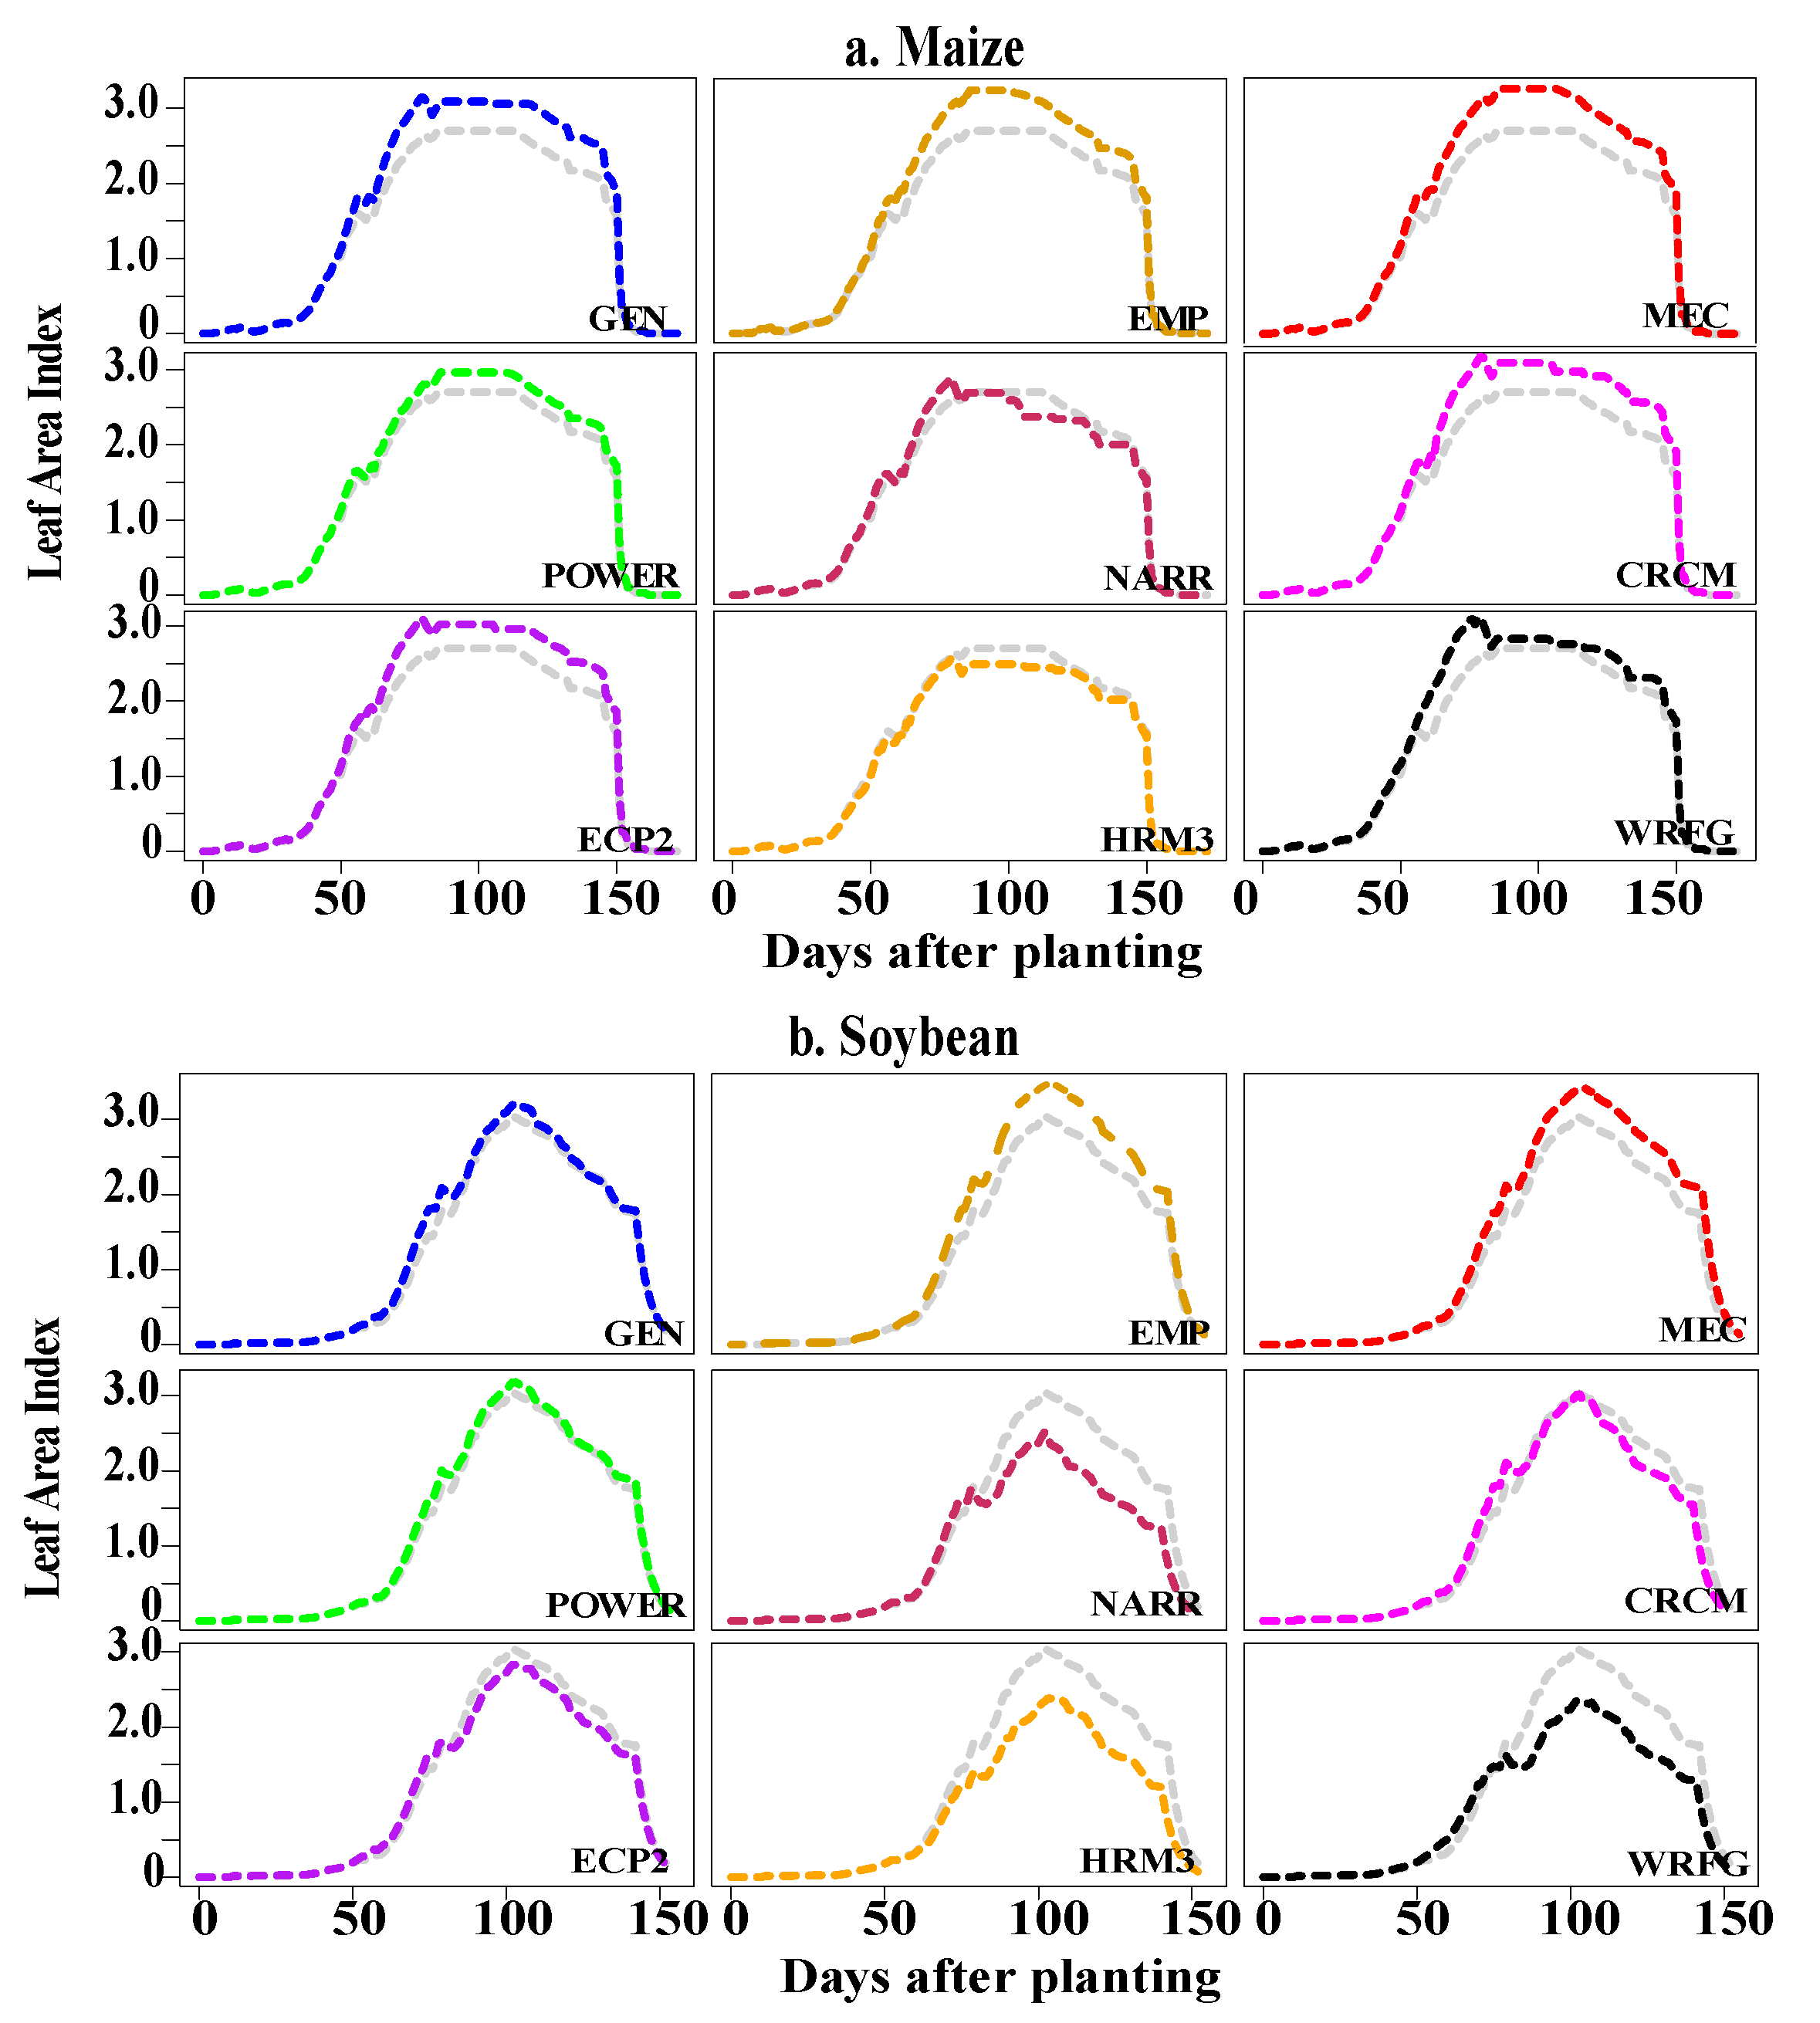
RMSEs at the start of anthesis for maize indicate relatively large discrepancies between the LAID obtained from the different radiation estimates and the LAID obtained from observed daily solar radiation (Figure 6). RMSEs are much smaller at the start of maturity when LAID substantially declines. RMSEs at anthesis are smallest for the weather generator, the empirical and mechanistic models, and POWER compared to the other radiation sources. ME at anthesis indicates modest underestimation of maize LAID by the empirical and mechanistic models and POWER and substantial overestimation by the reanalysis and regional climate models. The ME for the weather generator is small, approaching zero. The general pattern at anthesis of overestimation and underestimation of LAID by the various radiation estimates is similar for soybean, but, in contrast to maize, large MEs are also found at the start of maturity with the traditional radiation sources plus POWER overestimating LAID and the reanalysis and climate models underestimating LAID. The larger deviations for soybean are also evident from the daily LAID values for the 1993 simulation (Figure 7). These plots suggest that the deviations in LAID emerge around 80 DAP.

3.2.3. Accumulated Crop Evapotranspiration (ETAC)

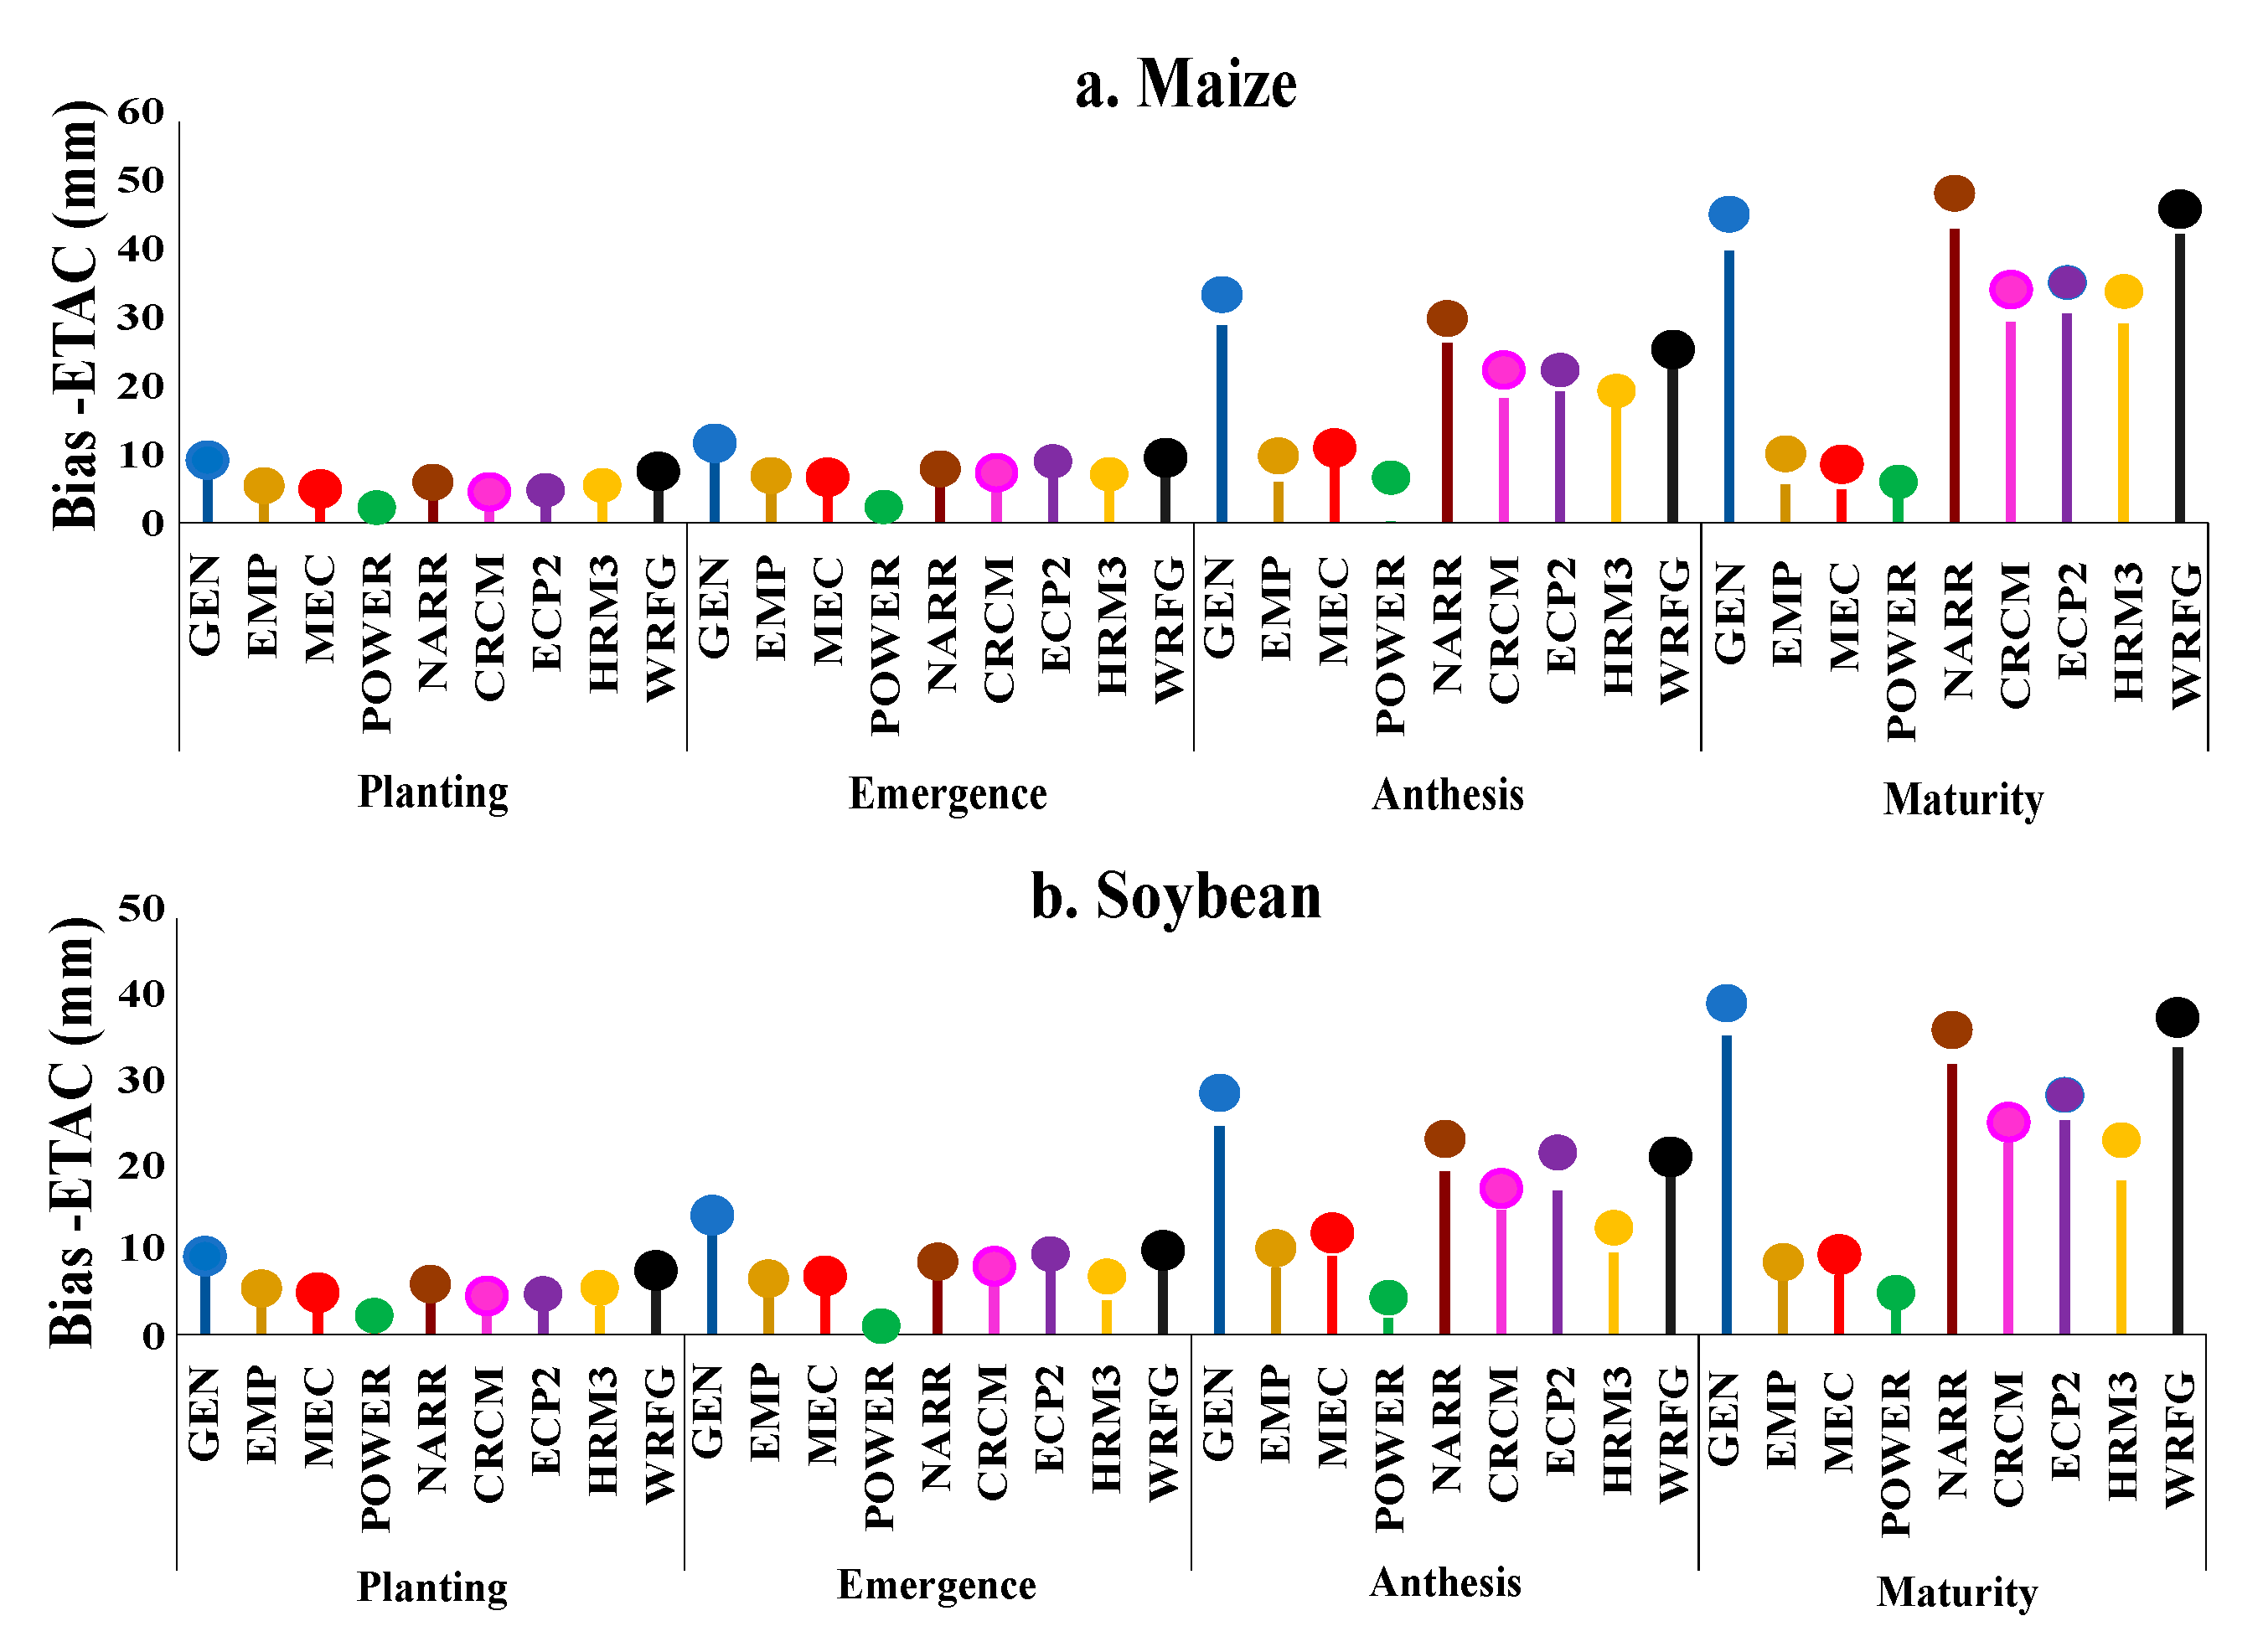
RMSEs for ETAC are similar for maize and soybean (Figure 8). For both crops, substantial discrepancies appear at the start of anthesis when photosynthesis processes are more active. RMSEs are smallest for the empirical and mechanistic models and POWER. Large RMSEs are evident for the other radiation sources, but particularly for the weather generator, NARR and the WRFG regional climate model. ETAC is overestimated by the different sources of radiation estimates compared to observed radiation. Consequently, the values of RMSE and ME are similar. The simulations for the 1993 growing season suggest that overestimation of ETAC emerges between 50 and 100 DAP, depending on the radiation source (Figure 9).

3.2.4. Accumulated Crop Dry Weight (CWAD)

For both maize and soybean, the impact of biases in the daily solar radiation estimates on CWAD is modest at the anthesis stage but substantial at maturity (Figure 10). RMSEs at the start of maturity range from approximately 250 to 900 kg ha−1 for maize for the different radiation sources and from approximately 150 to 400 kg ha−1 for soybean. At anthesis, MEs for maize display negative values for the reanalysis and climate models and positive values for the traditional radiation sources. In general, ME approaches zero at maturity with the exception of the substantial negative values for the HRM3 and WRFG models. For soybean, ME is slightly positive for the majority of the radiation estimates at anthesis. More variation is seen at maturity. At this crop stage, radiation estimates derived from the traditional approaches display positive MEs, whereas negative MEs are evident for the non-traditional sources (Figure 10).
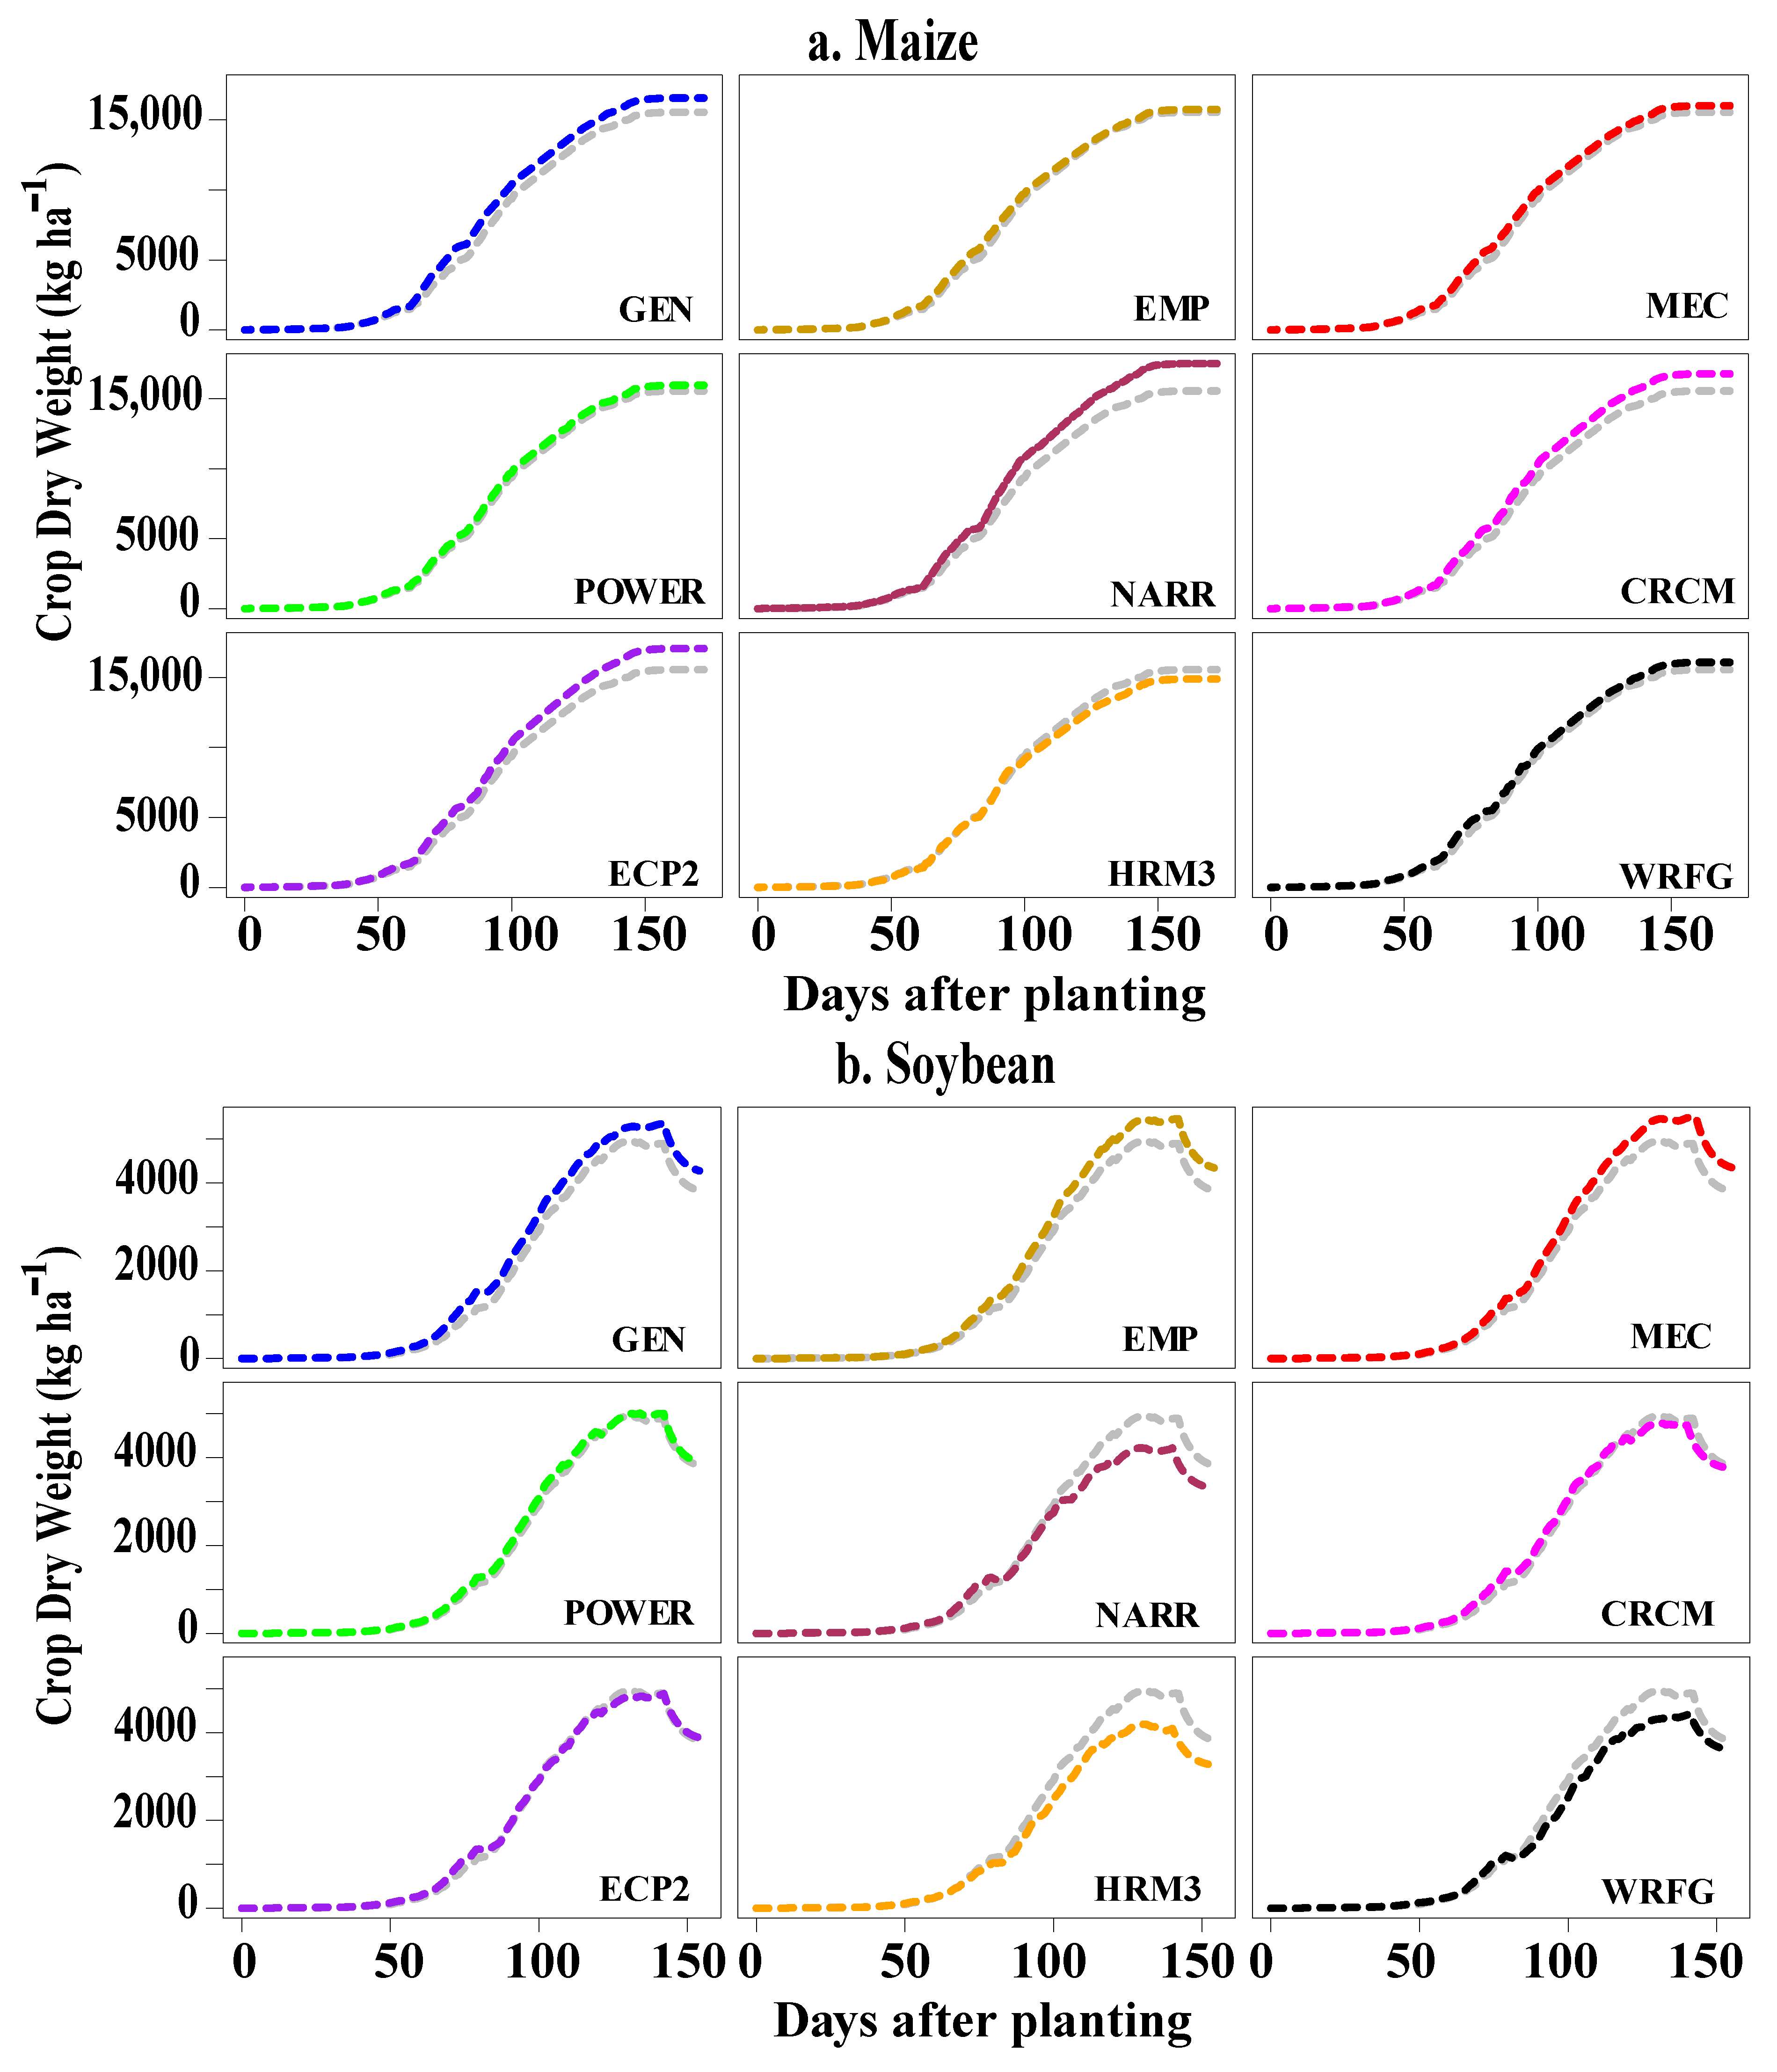
The simulations for the 1993 growing season further highlight the temporal development of the biases in CWAD and differences between crop types (Figure 11). For instance, NARR overestimated CWAD between anthesis and maturity for maize, but underestimated CWAD during this period for soybean. Deviations between CWAD obtained from the radiation estimates and that obtained from observed radiation emerge later in the growing season for soybean compared to maize, with the exception of the weather generator, for which deviations are evident at approximately 60 DAP for both crop types.

3.3. Crop Yield

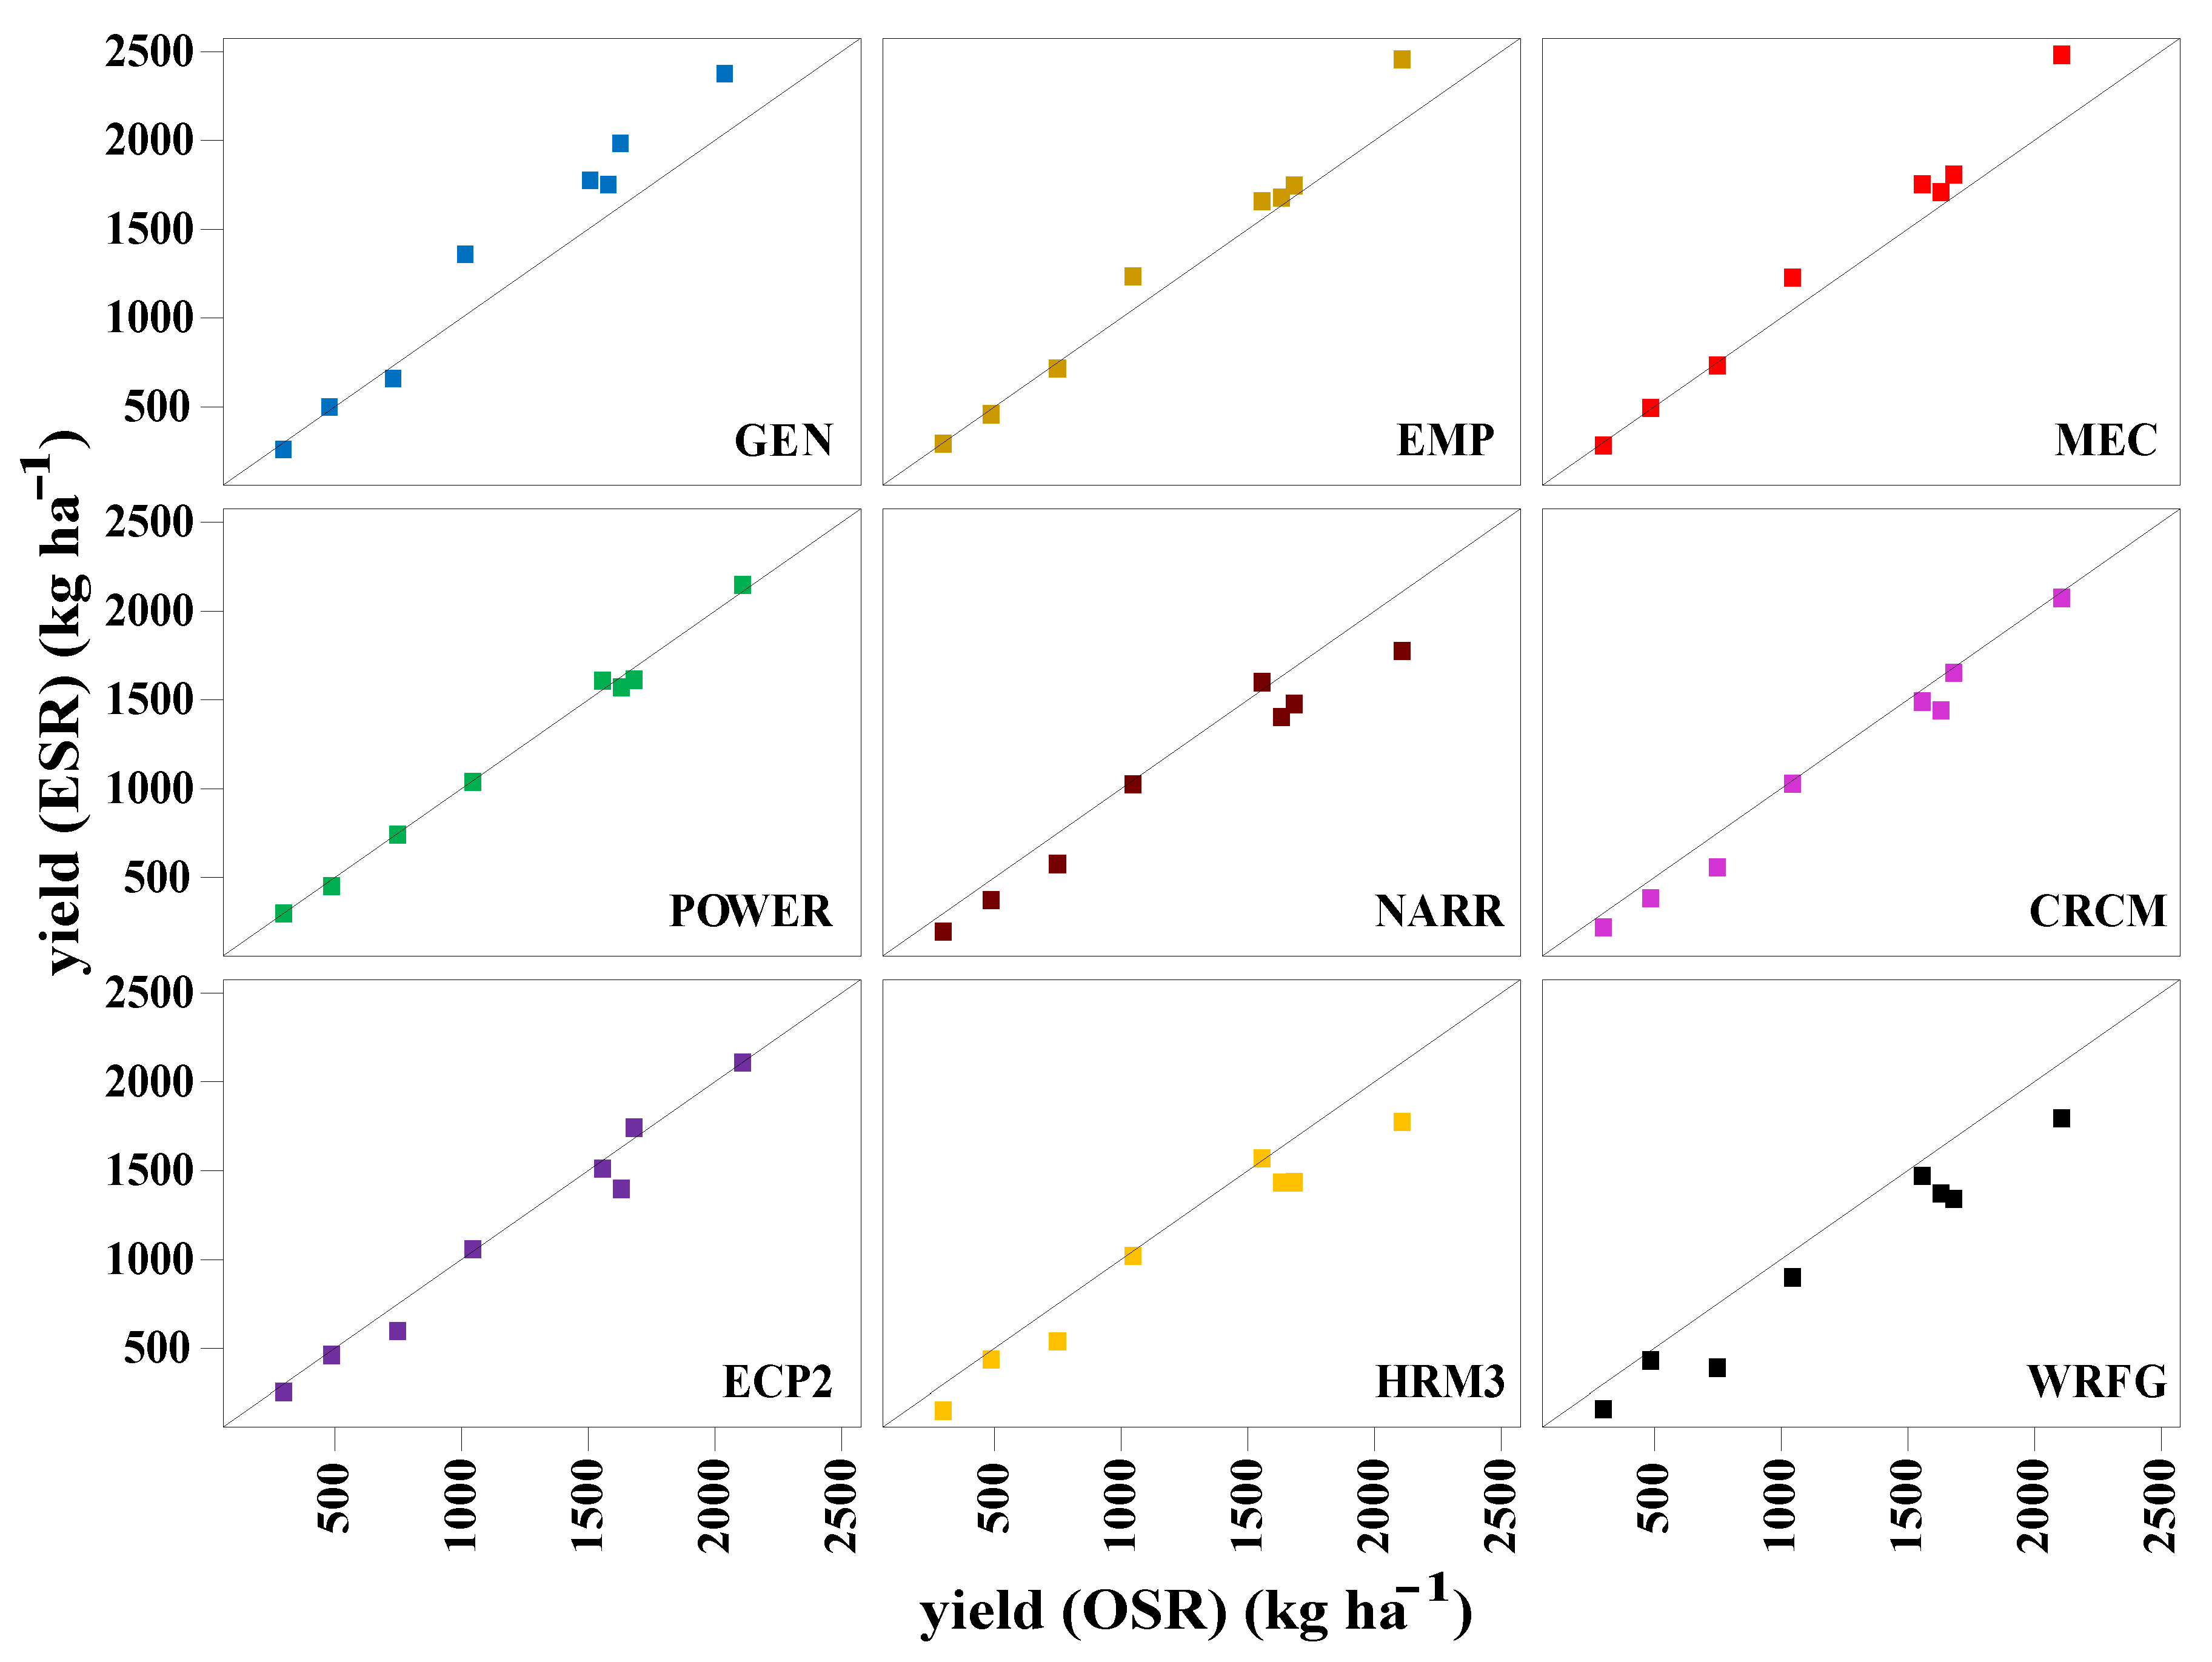
Scatterplots of maize and soybean yields simulated using daily observed and estimated solar radiation indicate a close agreement for all the radiation estimates, in spite of the differences observed above for the physiological processes (Figure 12 and Figure 13). Correspondence decreases somewhat as observed yield increases. Generally, simulated yields from the radiation estimates are higher (overestimation) and lower (underestimation) than the simulated yields from the observed daily radiation for maize and soybean, respectively.
The correspondence between yields obtained from the different radiation estimates and those obtained from observed radiation is confirmed by high (≥0.97) correlations (Table 3). Further evaluation using paired t-tests indicates that the differences in maize yields from estimated versus observed daily solar radiation are insignificant (two-tailed probability of 95%) for all the radiation sources. Even at the 90% confidence interval, the differences are significant only for the radiation estimates obtained from the regional climate models (with the exception of HRM3). In contrast, soybean yields are significantly impacted by the radiation source. With the exception of POWER and the ECP2 regional climate model, simulated yields are significantly different compared to those from observed daily radiation.
For maize yield, MSD was relatively high for NARR and the regional climate models. The high MSD values are primarily associated with large values for the LCS component of the MSD calculation, indicating differences in the pattern of the interannual variability of maize yields simulated using the estimated and observed daily solar radiation (Figure 14). The major contributor to MSD for soybean yield is generally squared biases (SB). This additional evaluation supports the significant differences in mean simulated soybean yield shown in Table 3. The SDSD is the next major contributor to MSD for traditional sources (GEN, EMP, MEC), which is in line with the relatively larger differences in the standard deviation of the simulated yields for these three radiation sources (Table 3), although F-tests indicated that the differences in the variance of the soybean yields are insignificant for all sources of estimated radiation.

4. Discussion

The primary goal of this research was to evaluate the use of different radiation estimates in crop process models. The findings presented above suggest considerable potential for the use of non-traditional sources of daily solar radiation for agricultural applications. One consideration, however, is that crop-specific differences exist. Maize yield obtained from the CERES−Maize simulations with estimated solar radiation as the input was always larger than that obtained with observed radiation for all the different sources of estimated radiation, including the POWER and empirical and mechanistic models, for which negative biases in radiation were observed for parts of the growing season. That said, the differences in the mean and variance of the simulated yield series were statistically insignificant, and, although the LCS component of the MSD statistic suggested otherwise, correlation coefficients indicated that the pattern of the simulated yields across the study period was also captured. In contrast, the source of radiation estimates did have an influence on the simulations of soybean yield from CROPGRO−Soybean. For the traditional methods of estimating daily solar radiation, differences in the mean and variance of the simulated yields were insignificant for only the empirical model. For the non-traditional sources, only the simulated yields from the POWER and NARCCAP ECP2 daily radiation estimates were in good agreement with the yields obtained using observed radiation. Although the POWER satellite-derived estimates agreed well with observations throughout most the growing season, the ECP2 estimates replicated the observed radiation well only during June and July, suggesting that the timing of the biases can affect simulated soybean yield.
Additional considerations also influence the choice of radiation estimate for an application, as summarized in Table 4. Availability is a key consideration. One reason for the current wide use of weather generators in agricultural applications is that they are already packaged in software systems such as DSSAT, although users must input the temperature and precipitation time series needed to parameterize the weather generator for an individual location. The non-traditional gridded datasets (POWER, NARR, NARCCAP) are also freely available, although some effort and computer expertise is required to download and extract the radiation information. An advantage of these radiation estimates over weather generators is that they retain the day-to-day relationships between radiation and other variables such as temperature and precipitation. Additional advantages of the gridded datasets are that no additional model development or parameterization are usually required, and the large geographic coverage, global in the case of POWER and across North America for NARR and NARCCAP.
The development of future projections of daily solar radiation for climate change assessments places additional constraints on the applicability of the different sources of radiation estimates investigated here. POWER is an observation-based dataset, and scenario development is for the most part limited to a “delta approach”, whereby daily time series are adjusted by a projected mean change obtained from control and future simulations of global climate models (see Winkler et al. [50] for a description of the delta downscaling method). This is also the case for reanalysis datasets such as NARR. Weather generators have frequently been used to develop climate change projections, although future changes in the variable(s) used to condition the weather generator (e.g., precipitation) can have unanticipated effects on the other variables (e.g., solar radiation) being simulated [51,52]. Although future projections of the climate variables included as predictors in empirical and mechanistic models are usually readily available, the underlying assumption of stationarity in the development of these models is a limitation when employing them to project future daily solar radiation. An advantage of the radiation estimates from regional climate simulations in these models can also be used to obtain physically consistent projections of future solar radiation.
Our findings also highlight the need for further evaluation of radiation estimates from traditional and non-traditional sources. Impacts of the different radiation estimates on simulations of crop development and yield need to be investigated for additional crops and geographic locations before broad recommendations regarding preferred sources of radiation estimates for crop process models can be made. In addition, our analysis was limited to only one example for each of the traditional and non-traditional radiation sources, with the exception of a suite of four regional climate models, although these are all driven by the same large-scale boundary conditions. Moreover, our selection of radiation estimates was constrained to sources popular in North America and available at the time this research effort was initiated. Future work needs to consider multiple weather generators, empirical and mechanical model formulations, satellite estimations, and reanalysis datasets, along with a larger suite of regional climate models. One particular source of radiation estimates that merits further investigation is the recently introduced ERA5 reanalysis [53], which has a similar spatial resolution as NARR. A recent evaluation of ERA5 radiation estimates suggested good agreement with observations for high latitude locations [54], and Wang and Chow [55] found that radiation estimates from ERA5 outperformed those from NARR when compared against observed solar radiation in Alaska. In addition, consideration of radiation estimates from a wider range of regional climate model simulations is needed, including additional simulations from the Coordinated Regional Climate Change Downscaling Experiment (CORDEX) [56]. Another avenue for further evaluation is the impact of the spatial resolution of gridded radiation estimates on the outcomes of the crop model simulations.
It was not our intent to provide a detailed evaluation of the causes of the biases in the radiation estimates, but rather to evaluate the impact of the radiation source on the outcomes of the crop simulation models. Nonetheless, our analyses provide some additional insights on the performance of the different radiation estimates. Although the estimates obtained from traditional mechanistic and empirical models generally agreed well with observed daily solar radiation based on several performance measures (bias, RMSE, equality of means), the gridded POWER satellite-based estimates performed as well, and, along with the radiation estimates obtained from the four NARCCAP models, better captured the variance compared to the traditional measures. The ability of the NARCCAP models to replicate observed solar radiation was shown to be model-dependent, with smaller biases seen for ECP2 and CRCM and considerably larger biases for WRFG and HRM3, although, collectively, biases were larger for the NARCCAP models compared to the other radiation sources. Daily radiation estimates obtained from NARR need to be used cautiously, as NARR consistently overestimates daily solar radiation. One concern of the commonly used weather generator is the substantially underestimated variance of daily solar radiation. Afshin and Gerrit [57] also found that the WGEN weather generator, on which WeatherMan is based, poorly simulated the variance of daily solar radiation.
Several of our findings are in good agreement with previous studies. For instance, the RMSE of 3.9 MJ m−2 day−1 for the radiation estimates obtained from the empirical model agree well with the RMSE value of 3.3 MJ m−2 day−1 reported by the original model developers [20] for their study site of Kaiser, Arkansas. Similarly, the RMSE of 3.9 MJ m−2 day−1 for the mechanistic model is similar to the 4.1 MJ m−2 day−1 value reported by the model developers [21] for Elora, Canada. The RSME and R2 values found here for the POWER radiation estimates for the grid point closest to Hancock are similar to those reported for multiple sites in China [31] and across the continental USA [30], suggesting that the POWER gridded dataset is a promising source of daily solar radiation for multiple midlatitude locations. Previous work which validated NARR fields with ground observations for locations across North America [58], within the Mississippi River Basin [59], and over the Pacific Northwest [60], also found that NARR tended to overestimate daily solar radiation. As discussed by Schroeder et al. [60] and Markovic et al. [58], this overestimation is likely due to the underestimation of cloud cover in the NARR atmospheric model component (i.e., the NCEP Eta model). Tarasova et al. [61], who evaluated the performance of the solar radiation scheme employed in the Eta model, reported a systematic bias in solar radiation estimates due to inaccuracies in cloud parameterization. The radiation estimates obtained from the NARCCAP regional climate models also display positive biases for most months of the year.

5. Conclusions

The sensitivity of simulated maize and soybean development and yield at Hancock, Wisconsin, to different sources of daily solar radiation estimates used as input for the CERES−Maize and CROPGRO−Soybean crop process models was investigated. The radiation estimates were obtained from traditional (stochastic generation, empirical and mechanistic models) and non-traditional (satellite estimation, reanalysis datasets, and regional climate model simulations) approaches. Comparisons of the radiation estimates to observed radiation at the study location indicated that the nature (e.g., magnitude, sign, and timing) of the biases differs considerably among the different radiation estimates, but that, in general, the biases associated with the non-traditional radiation sources are of similar magnitude to those of the traditional radiation sources.
The choice of radiation source did not significantly impact maize yield simulations from CERES−Maize, even though differences were observed among the radiation sources in daily values of LAID, ETAC, and CWAD. On the other hand, significant differences were found for simulated soybean yield from CROPGRO−Soybean for all but three of the radiation sources. Two of the three insignificant results were for non−traditional sources of radiation estimates (POWER satellite-based estimations and the NARCCAP EPC2 regional climate simulation), suggesting that non-traditional radiation datasets provide a viable alternative to traditional radiation estimates as input to CROPGRO−Soybean.
Further research is needed to assess the impacts of the choice of radiation estimate on crop modeling for other geographical locations, multiple crop types, and a broader range of radiation sources. Nonetheless, our findings point to the considerable potential utility of non-traditional sources of radiation estimates. Moreover, additional considerations, such as data availability and model transferability, need to be assessed when selecting a source of daily solar radiation estimates for agricultural applications, including climate change assessments for agriculture.

Author Contributions

Conceptualization, P., J.A.W. and J.A.A.; Formal analysis, P. and J.A.W.; Funding acquisition, P. and J.A.W.; Methodology, P., J.A.W. and J.A.A.; Resources, J.A.W. and J.A.A.; Software, J.A.A.; Supervision, J.A.W. and J.A.A.; Visualization, P.; Writing—original draft, P.; Writing—review & editing, P. and J.A.W. All authors have read and agreed to the published version of the manuscript.

Funding

This work was supported by a fellowship from the Fulbright Presidential Scholarship. Partial support was also provided by NSF grant CNH 0909378, USDA−NIFA grant APP #108628, and the Indonesian Ministry Education and Culture under World Class University (WCU) Program managed by Institut Teknologi Bandung.

Acknowledgments

The authors express our appreciation to Delta Yova Dwi Infrawan (Kresa.id) and Raden Eliasar Prabowo (Kresa.id) for their technical assistance in finalizing the graphical visualizations, and to the three reviewers for their valuable comments.

Conflicts of Interest

The authors declare no conflict of interest.

References

  1. Hoogenboom, G. Contribution of agrometeorology to the simulation of crop production and its applications. Agric. For. Meteorol. 2000, 103, 137–157. [Google Scholar] [CrossRef]
  2. Jones, J.W.; Hoogenboom, G.; Porter, C.H.; Boote, K.J.; Batchelor, W.D.; Hunt, L.A.; Wilkens, P.W.; Singh, U.; Gijsman, A.J.; Ritchie, J.T. The DSSAT cropping system model. Eur. J. Agron. 2003, 18, 235–265. [Google Scholar] [CrossRef]
  3. Liu, D.L.; Scott, B.J. Estimation of solar radiation in Australia from rainfall and temperature observations. Agric. For. Meteorol. 2001, 106, 41–59. [Google Scholar] [CrossRef]
  4. Ruiz-Arias, J.A.; Gueymard, C.A. Worldwide inter-comparison of clear-sky solar radiation models: Consensus-based review of direct and global irradiance components simulated at the earth surface. Sol. Energy 2018, 168, 10–29. [Google Scholar] [CrossRef]
  5. Leduc, S.; Diamond, H.J.; Palecki, M.A. The United States Climate Reference Network (USCRN) Annual Report for Fiscal Year 2009: US Climate Reference Network; NOAA/NESDIS National Climatic Data Center: Asheville, NC, USA, 2009; p. 32.
  6. Diamond, H.J.; Karl, T.R.; Palecki, M.A.; Baker, C.B.; Bell, J.E.; Leeper, R.D.; Easterling, D.R.; Lawrimore, J.H.; Meyers, T.P.; Helfert, M.R.; et al. U.S. Climate Reference Network after one decade of operations: Status and assessment. Bull. Am. Meteorol. Soc. 2013, 94, 485–498. [Google Scholar] [CrossRef]
  7. Augustine, J.A.; Hodges, G.B.; Cornwall, C.R.; Michalsky, J.J.; Medina, C.I. An update on SURFRAD—the GCOS Surface Radiation Budget Network for the Continental United States. J. Atmos. Ocean. Technol. 2005, 22, 1460. [Google Scholar] [CrossRef]
  8. Augustine, J.A.; DeLuisi, J.J.; Long, C.N. SURFRAD—A National Surface Radiation Budget Network for atmospheric research. Bull. Am. Meteorol. Soc. 2000, 81, 2341–2357. [Google Scholar] [CrossRef] [Green Version]
  9. Driemel, A.; Augustine, J.; Behrens, K.; Colle, S.; Cox, C.; Cuevas-Agulló, E.; Denn, F.M.; Duprat, T.; Fukuda, M.; Grobe, H.; et al. Baseline Surface Radiation Network (BSRN): Structure and data description (1992–2017). Earth Syst. Sci. Data 2018, 10, 1491–1501. [Google Scholar] [CrossRef] [Green Version]
  10. Keller, M.; Schimel, D.S.; Hargrove, W.W.; Hoffman, F.M. A continental strategy for the National Ecological Observatory Network. Front. Ecol. Environ. 2008, 6, 282–284. [Google Scholar] [CrossRef]
  11. Thomas, U.K.; Brian Robert, J.; Michele, A.K.; Michael, K. NEON: The first continental-scale ecological observatory with airborne remote sensing of vegetation canopy biochemistry and structure. J. Appl. Remote Sens. 2010, 4, 1–24. [Google Scholar]
  12. Apipattanavis, S.; Bert, F.; Podesta, G.; Rajagopalan, B. Linking weather generators and crop models for assessment of climate forecast outcomes. Agric. For. Meteorol. 2010, 150, 166–174. [Google Scholar] [CrossRef]
  13. Duveiller, G.; Donatelli, M.; Fumagalli, D.; Zucchini, A.; Nelson, R.; Baruth, B. A dataset of future daily weather data for crop modelling over Europe derived from climate change scenarios. Theor. Appl. Climatol. 2017, 127, 573–585. [Google Scholar] [CrossRef] [Green Version]
  14. Van Wart, J.; Grassini, P.; Yang, H.; Claessens, L.; Jarvis, A.; Cassman, K.G. Creating long-term weather data from thin air for crop simulation modeling. Agric. For. Meteorol. 2015, 209, 49–58. [Google Scholar] [CrossRef]
  15. Vesely, F.M.; Paleari, L.; Movedi, E.; Bellocchi, G.; Confalonieri, R. Quantifying uncertainty due to stochastic weather generators in climate change impact studies. Sci. Rep. 2019, 9, 9258. [Google Scholar] [CrossRef] [Green Version]
  16. Richardson, C.W.; Wright, D.A. WGEN: A Model for Generating Daily Weather Variables; US Department of Agriculture, Agricultural Research Service: Springfield, VA, USA, 1984; p. 83.
  17. Geng, S.; Devries, F.; Supit, I. A simple method for generating daily rainfall data. Agric. For. Meteorol. 1986, 36, 363–376. [Google Scholar] [CrossRef]
  18. Garcia, A.G.Y.; Hoogenboom, G. Evaluation of an improved daily solar radiation generator for the southeastern USA. Clim. Res. 2005, 29, 91–102. [Google Scholar] [CrossRef] [Green Version]
  19. Woli, P.; Paz, J.O. Evaluation of various methods for estimating global solar radiation in the southeastern United States. J. Appl. Meteorol. Climatol. 2012, 51, 972–985. [Google Scholar] [CrossRef]
  20. Ball, R.A.; Purcell, L.C.; Carey, S.K. Evaluation of solar radiation prediction models in North America. Agron. J. 2004, 96, 391–397. [Google Scholar] [CrossRef]
  21. Hunt, L.A.; Kuchar, L.; Swanton, C.J. Estimation of solar radiation for use in crop modelling. Agric. For. Meteorol. 1998, 91, 293–300. [Google Scholar] [CrossRef]
  22. Kanamitsu, M.; Ebisuzaki, W.; Woollen, J.; Yang, S.-K.; Hnilo, J.J.; Fiorino, M.; Potter, G.L. NCEP DOE AMIP-II Reanalysis (R-2). Bull. Am. Meteorol. Soc. 2002, 83, 1631–1643. [Google Scholar] [CrossRef]
  23. Gelaro, R.; McCarty, W.; Suárez, M.J.; Todling, R.; Molod, A.; Takacs, L.; Randles, C.A.; Darmenov, A.; Bosilovich, M.G.; Reichle, R.; et al. The Modern-Era Retrospective Analysis for Research and Applications, Version 2 (MERRA-2). J. Clim. 2017, 30, 5419–5454. [Google Scholar] [CrossRef] [PubMed]
  24. Mesinger, F.; DiMego, G.; Kalnay, E.; Mitchell, K.; Shafran, P.C.; Ebisuzaki, W.; Jović, D.; Woollen, J.; Rogers, E.; Berbery, E.H.; et al. North American Regional Reanalysis. Bull. Am. Meteorol. Soc. 2006, 87, 343–360. [Google Scholar] [CrossRef] [Green Version]
  25. Jacob, D.; Petersen, J.; Eggert, B.; Alias, A.; Christensen, O.B.; Bouwer, L.M.; Braun, A.; Colette, A.; Déqué, M.; Georgievski, G.; et al. EURO-CORDEX: New high-resolution climate change projections for European impact research. Reg. Environ. Chang. 2014, 14, 563–578. [Google Scholar] [CrossRef]
  26. Mearns, L.O.; Gutowski, W.; Jones, R.; Leung, R.; McGinnis, S.; Nunes, A.; Qian, Y. A regional climate change assessment program for North America. Eos Trans. AGU 2009, 90, 311. [Google Scholar] [CrossRef]
  27. White, J.W.; Hoogenboom, G.; Stackhouse, P.W., Jr.; Hoell, J.M. Evaluation of NASA satellite- and assimilation model-derived long-term daily temperature data over the Continental US. Agric. For. Meteorol. 2008, 148, 1574–1584. [Google Scholar] [CrossRef] [Green Version]
  28. GLRAG. Great Lakes; Atmospheric, Oceanic and Space Sciences Department, University of Michigan: Ann Arbor, MI, USA, 2000; pp. 69–76. [Google Scholar]
  29. Garcia, A.G.Y.; Guerra, L.C.; Hoogenboom, G. Impact of generated solar radiation on simulated crop growth and yield. Ecol. Model. 2008, 210, 312–326. [Google Scholar] [CrossRef]
  30. White, J.W.; Hoogenboom, G.; Wilkens, P.W.; Stackhouse, P.W., Jr.; Hoel, J.M. Evaluation of satellite-based, modeled-derived daily solar radiation data for the Continental United States. Agron. J. 2011, 103, 1242–1251. [Google Scholar] [CrossRef] [Green Version]
  31. Bai, J.; Chen, X.; Dobermann, A.; Yang, H.; Cassman, K.G.; Zhang, F. Evaluation of NASA satellite- and model-derived weather data for simulation of maize yield potential in China. Agron. J. 2011, 102, 9–16. [Google Scholar] [CrossRef]
  32. Jin, C.; Xiao, X.; Wagle, P.; Griffis, T.; Dong, J.; Wu, C.; Qin, Y.; Cook, D.R. Effects of in-situ and reanalysis climate data on estimation of cropland gross primary production using the vegetation photosynthesis model. Agric. For. Meteorol. 2015, 213, 240–250. [Google Scholar] [CrossRef] [Green Version]
  33. Abraha, M.G.; Savage, M.J. Comparison of estimates of daily solar radiation from air temperature range for application in crop simulations. Agric. For. Meteorol. 2008, 148, 401–416. [Google Scholar] [CrossRef]
  34. University of Wisconsin. UW Extension Ag Weather. 2010. Available online: https://agweather.cals.wisc.edu/awon (accessed on 8 December 2020).
  35. Menne, M.J.; Williams, C.N.; Vose, R.S. The US Historical Climatology Network monthly temperature data, Version 2. Bull. Am. Meteorol. Soc. 2009, 90, 993–1007. [Google Scholar] [CrossRef] [Green Version]
  36. Pickering, N.B.; Hansen, J.W.; Jones, J.W.; Wells, C.M.; Chan, V.K.; Godwin, D.C. Weatherman: A utility for managing and generating daily weather data. Agron. J. 1994, 86, 332–337. [Google Scholar] [CrossRef]
  37. Mavromatis, T.; Jagtap, S.S. Estimating solar radiation for crop modeling using temperature data from urban and rural stations. Clim. Res. 2005, 29, 233–243. [Google Scholar] [CrossRef]
  38. Spitters, C.J.T.; Toussaint, H.; Goudriaan, J. Separating the diffuse and direct component of global radiation and its implications for modeling canopy photosynthesis. 1. Components of incoming radiation. Agric. For. Meteorol. 1986, 38, 217–229. [Google Scholar] [CrossRef]
  39. Donatelli, M.; Bellocchi, G.; Fontana, F. Radest3.00: Software to estimate daily radiation data from commonly available meteorological variables. Eur. J. Agron. 2003, 18, 363–367. [Google Scholar] [CrossRef]
  40. NASA. The POWER Project. 2020. Available online: https://power.larc.nasa.gov/ (accessed on 8 December 2020).
  41. Pinker, R.T.; Laszlo, I. Modeling surface solar irradiance for satellite applications on a global scale. J. Appl. Meteorol. 1992, 31, 194–211. [Google Scholar] [CrossRef] [Green Version]
  42. NASA. Power Data Methodology. 2019. Available online: https://power.Larc.Nasa.Gov/docs/methodology/ (accessed on 6 October 2020).
  43. National Center for Environmental Information (NCEI), No Date, North American Regional Reanalysis (NARR). Available online: https://www.ncdc.noaa.gov/data-access/model-data/model-datasets/north-american-regional-reanalysis-narr (accessed on 8 December 2020).
  44. NARCCAP, North American Regional Climate Change Assessment Program. 2007. Available online: https://www.narccap.ucar.edu/ (accessed on 8 December 2020).
  45. Mearns, L.O.; Lettenmaier, D.P.; McGinnis, S. Uses of results of regional climate model experiments for impacts and adaptation studies: The example of NARCCAP. Curr Clim Chang. Rep. 2015, 1, 1–9. [Google Scholar] [CrossRef] [Green Version]
  46. Kalnay, E.; Kanamitsu, M.; Kistler, R.; Collins, W.; Deaven, D.; Gandin, L.; Iredell, M.; Saha, S.; White, G.; Woollen, J.; et al. The NCEP/NCAR 40-year reanalysis project. Bull. Am. Meteorol. Soc. 1996, 77, 437–471. [Google Scholar] [CrossRef] [Green Version]
  47. Andresen, J.A.; Alagarswamy, G.; Rotz, C.A.; Ritchie, J.T.; LeBaron, A.W. Weather impacts on maize, soybean, and alfalfa production in the Great Lakes region, 1895–1996. J. Agron. 2001, 93, 1059–1070. [Google Scholar] [CrossRef] [Green Version]
  48. Rivington, M.; Bellocchi, G.; Matthews, K.B.; Buchan, K. Evaluation of three model estimations of solar radiation at 24 UK stations. Agric. For. Meteorol. 2005, 132, 228–243. [Google Scholar] [CrossRef]
  49. Kobayashi, K.; Salam, M.U. Comparing simulated and measured values using mean squared deviation and its components. Agron. J. 2000, 92, 345–352. [Google Scholar] [CrossRef]
  50. Winkler, J.A.; Guentchev, G.S.; Perdinan; Tan, P.-N.; Zhong, S.; Liszewska, M.; Abraham, Z.; Niedźwiedź, T.; Ustrnul, Z. Climate scenario development and applications for local/regional climate change impact assessments: An overview for the non-climate scientist. Geogr. Compass 2011, 5, 275–300. [Google Scholar] [CrossRef]
  51. Wilby, R.L.; Dawson, C.W.; Barrow, E.M. SDSM-A decision support tool for the assessment of regional climate change impacts. Environ. Model. Softw. 2002, 17, 145–157. [Google Scholar] [CrossRef]
  52. Wilks, D.S. Adapting stochastic weather generation algorithms for climate change studies. Clim. Chang. 1992, 22, 67–84. [Google Scholar] [CrossRef]
  53. Hersbach, H.; Bell, B.; Berrisford, P.; Hirahara, S.; Horányi, A.; Muñoz-Sabater, J.; Nicolas, J.; Peubey, C.; Radu, R.; Schepers, D.; et al. The ERA5 Global Reanalysis. Q. J. R. Meteorol. Soc. 2020, 146, 1999–2049. [Google Scholar] [CrossRef]
  54. Babar, B.; Graversen, R.; Boström, T. Solar radiation estimation at high latitudes: Assessment of the CMSAF databases, ASR and ERA5. Sol. Energy 2019, 182, 397–411. [Google Scholar] [CrossRef]
  55. Wang, K.; Clow, G.D. Newly collected data across Alaska reveal remarkable biases in solar radiation products. Int. J. Climatol. 2020, 1–16. [Google Scholar] [CrossRef]
  56. Giorgi, F.; Jones, C.; Asrar, G.R. Addressing climate information needs at the regional level: The CORDEX framework. Bull. World Meteorol. Organ. 2009, 58, 175–183. [Google Scholar]
  57. Afshin, S.; Gerrit, H. Minimum data requirements for parameter estimation of stochastic weather generators. Clim. Res. 2003, 25, 109–119. [Google Scholar]
  58. Markovic, M.; Jones, C.G.; Winger, K.; Paquin, D. The surface radiation budget over North America: Gridded data assessment and evaluation of regional climate models. Int. J. Climatol. 2009, 29, 2226–2240. [Google Scholar] [CrossRef]
  59. Kumar, S.; Merwade, V. Evaluation of NARR and CLM3.5 outputs for surface water and energy budgets in the Mississippi River Basin. J. Geophys. Res. Atmos. 2011, 116, 1–21. [Google Scholar] [CrossRef] [Green Version]
  60. Schroeder, T.A.; Hember, R.; Coops, N.C.; Liang, S. Validation of solar radiation surfaces from MODIS and reanalysis data over topographically complex terrain. J. Appl. Meteorol. Climatol. 2009, 48, 2441–2458. [Google Scholar] [CrossRef]
  61. Tarasova, T.A.; Fernandez, J.P.R.; Pisnichenko, I.A.; Marengo, J.A.; Ceballos, J.C.; Bottino, M.J. Impact of new solar radiation parameterization in the Eta model on the simulation of summer climate over South America. J. Appl. Meteorol. Climatol. 2006, 45, 318–333. [Google Scholar] [CrossRef] [Green Version]
Figure 1. Location of the Hancock station and of the Necedah (44°1′34′′ N/90°4′26′′ W) CRN station used to evaluate the quality of the solar radiation time series at Hancock (44°8′1′′ N/89°31′23′′ W).
Atmosphere 12 00008 g001
Figure 2. Mean daily estimated (color) and observed (grey) solar radiation (upper lines) and mean biases (lower line) of estimated solar radiation at Hancock, Wisconsin for the eight-year study period. Abbreviations refer to the sources of estimated daily radiation, i.e., weather generator (GEN), empirical (EMP) and mechanistic (MEC) models, Prediction of Worldwide Energy Resource (POWER), North American Regional Reanalysis (NARR), and the North American Regional Climate Change Assessment Program (NARCCAP) regional climate models (Canadian Regional Climate Model (CRCM), Experimental Climate Prediction Center/Regional Spectral Model (ECP2), Hadley Regional Model 3 (HRM3), and Weather Research and Forecasting model (WRFG)).
Atmosphere 12 00008 g002
Figure 3. Root mean squared error (RMSE, MJ m−2 day−1) and the coefficient of determination (R2) with observed daily solar radiation for the various solar radiation estimates. See Figure 2 for definition of abbreviations.
Atmosphere 12 00008 g003
Figure 4. Root mean squared error (RMSE, colored circles) and mean error (ME, colored bars) of accumulated daily solar radiation (SRAC) for the different sources of estimated solar radiation at the start date of planting, emergence, anthesis, and maturity for maize (a) and soybean (b). See Figure 2 for definition of abbreviations.
Atmosphere 12 00008 g004
Figure 5. Growing season estimated (color) and observed (gray) accumulated daily solar radiation (SRAC) during 1993 for (a) maize and (b) soybean. See Figure 2 for definition of abbreviations. For both crops, planting occurred on April 1. For reference, the timing of crop stages for the 1993 simulations using observed radiation, in terms of days after planting, for maize (soybean) was 2 (11) for emergence, 86 (74) for anthesis and 172 (142) for maturity.
Atmosphere 12 00008 g005
Figure 6. Root mean squared error (RMSE, colored circles) and mean error (ME, colored bars) of daily leaf area index (LAID) for the different sources of estimated solar radiation at the start date of planting, emergence, anthesis, and maturity for maize (a) and soybean (b). See Figure 2 for definition of abbreviations.
Atmosphere 12 00008 g006
Figure 7. Growing season daily leaf area index (LAID) simulated from the different sources of estimated radiation (color) and observations (gray) during 1993 for (a) maize and (b) soybean. See Figure 2 for definition of abbreviations. For both crops, planting occurred on 1 April. For reference, the timing of crop stages for the 1993 simulations using observed radiation, in terms of days after planting, for maize (soybean) was 86 (74) for anthesis and 172 (142) for maturity.
Atmosphere 12 00008 g007
Figure 8. Root mean squared error (RMSE, colored circles) and mean error (ME, colored bars) of accumulated crop evaporation (ETAC) for the different sources of estimated solar radiation at the start date of planting, emergence, anthesis, and maturity for maize (a) and soybean (b). See Figure 2 for definition of abbreviations.
Atmosphere 12 00008 g008
Figure 9. Growing season accumulated crop evapotranspiration (ETAC) simulated from the different sources of estimated solar radiation (color) and observations (gray) during 1993 for (a) maize and (b) soybean. Note the change in the scale of the vertical axis for maize and soybean. See Figure 2 for definition of abbreviations. For both crops, planting occurred on April 1. For reference, the timing of crop stages for the 1993 simulations using observed radiation, in terms of days after planting, for maize (soybean) was 86 (74) for anthesis and 172 (142) for maturity.
Atmosphere 12 00008 g009
Figure 10. Root mean squared error (RMSE, colored circles) and mean error (ME, colored bars) of accumulated crop dry weight (CWAD) for the different sources of estimated solar radiation at the start date of planting, emergence, anthesis, and maturity for maize (a) and soybean (b). See Figure 2 for definition of abbreviations.
Atmosphere 12 00008 g010
Figure 11. Growing season accumulated crop dry weight (CWAD) simulated from the different sources of estimated solar radiation (color) and observations (gray) during 1993 for (a) maize and (b) soybean. Note the change in the scale of the vertical axis between maize and soybean. See Figure 2 for definition of abbreviations. For both crops, planting occurred on April 1. For reference, the timing of crop stages for the 1993 simulations using observed radiation, in terms of days after planting, for maize (soybean) was 86 (74) for anthesis and 172 (142) for maturity.
Atmosphere 12 00008 g011
Figure 12. Maize yield (kg ha−1) for the eight-year analysis period simulated using daily solar radiation observations and estimates as input to CERES−Maize. OSR and ESR refer to observed and estimated solar radiation, respectively. Note: the simulated yields for the empirical and the mechanistic models were combined for the calibration and validation periods.
Atmosphere 12 00008 g012
Figure 13. Soybean yield (kg ha−1) for the eight-year analysis period simulated using daily solar radiation observations and estimates as input to CROPGRO−Soybean. OSR and ESR refer to observed and estimated solar radiation, respectively. Note: the simulated yields for the empirical and the mechanistic models were combined for the calibration and validation periods.
Atmosphere 12 00008 g013
Figure 14. Mean squared deviation (MSD), squared bias (SB), squared difference between standard deviation (SDSD) and the lack of correlation weighted by the standard deviation (LCS) for maize (a) and soybean (b) yield simulated using daily solar radiation estimates compared to yield simulations using radiation observations. Please note the difference in the vertical axes for the two plots, reflecting the higher yields for maize compared to soybean. See Figure 2 for definitions of the abbreviations, and Section 2.4.3 for an explanation of MSD and its components.
Atmosphere 12 00008 g014
Table 1. The cropping management options for maize and soybean used for the Decision Support System for Agrotechnology Transfer (DSSAT) simulations.
Management RulesMaizeSoybean
Plant populations6 plants per m220 plants per m2
CultivarShort-season cultivar
Base temperature: 8 °C
Thermal time for juvenile phenological stages (P1): 200 degree days
Thermal time from silking to maturity (P2): 685 degree days
Generic Group 2
Planting datesAutomatically when simulated 5 cm soil temperature after 1 April is ≥10 °CAutomatically when simulated 5 cm soil temperature after 1 April is ≥10 °C
HarvestAt physiological maturityAt physiological maturity
Table 2. Percent difference by month in the mean and standard deviation of daily solar radiation for the different radiation sources compared to observed radiation at Hancock, Wisconsin. Bolded values indicate significant differences at the 99 percent probability level based on a paired t-test (assuming unequal variance) for equality of means or a F-test for equality of variance.
MonthGENEMPMECPOWERNARRCRCMECP2HRM3WRFG
Difference in monthly mean daily solar radiation (percent)
January19.0−3.7−1.68.039.2−3.721.5−4.922.0
February6.15.6−6.54.730.86.217.6−3.819.9
March4.1−2.2−6.6−1.020.410.111.3−3.026.7
April17.02.06.20.922.614.313.310.128.0
May18.92.910.12.427.910.68.910.825.7
June6.3−5.0−2.1−1.421.012.35.816.521.2
July1.1−8.4−6.0−3.419.911.53.712.721.7
August4.9−3.6−4.90.325.316.513.822.731.5
September10.94.1−3.33.729.113.016.319.530.1
October16.814.0−2.38.233.25.120.120.728.2
November33.321.32.521.754.911.432.220.743.6
December24.4−9.50.621.255.93.031.013.432.6
Difference in monthly standard deviation of daily solar radiation (percent)
January−72.89.7−25.98.0−14.713.6−12.512.712.5
February−84.3−28.5−33.34.7−21.114.4−13.514.03.3
March−81.8−34.4−34.7−1.0−11.913.5−10.320.0−1.3
April−78.4−37.3−36.20.9−14.1−1.6−15.58.7−4.2
May−76.3−34.4−36.02.4−13.44.0−10.715.8−5.7
June−77.7−31.8−33.1−1.4−15.0−4.1−10.3−0.51.3
July−84.9−35.1−38.8−3.4−16.12.7−6.411.03.6
August−77.0−23.8−30.00.3−17.5−6.9−4.6−7.8−9.8
September−77.4−20.5−33.93.7−16.9−5.7−9.82.9−11.3
October−73.0−1.6−28.58.2−11.11.1−8.37.90.2
November−78.22.3−37.921.7−14.710.2−8.111.78.8
December−58.438.5−29.421.2−21.314.2−16.55.910.9
Table 3. Percent difference in the mean and standard deviation of simulated maize and soybean yields using estimated versus observed daily solar radiation as input, and the correlation between the yield time series for the study period. Paired t-tests were used to test for equality of means and F-tests for equality of variances. Asterisks indicate two-tailed probabilities significant at the 90% (*), 95% (**) and 99% (***) probability levels.
Radiation SourcesMaizeSoybean
Difference in Mean (%)Difference in Standard Deviation (%)CorrelationDifference in Mean (%)Difference in Standard Deviation (%)Correlation
GEN2.63−2.290.9915.58 **24.370.99
EMP4.371.180.987.23 *15.110.99
MEC1.54−8.670.999.80 **17.560.99
POWER1.129.390.99−0.811.000.99
NARR3.347.570.99−11.78 ***−6.660.98
CRCM6.09 *4.210.98−7.32 ***3.210.99
ECP24.12 *5.320.99−4.372.090.99
HRM33.331.690.97−12.48 ***−6.820.98
WRFG6.73 *9.550.98−17.73 ***−7.280.98
Table 4. Strengths and limitations of traditional and non-traditional sources of daily solar radiation estimates.
Radiation SourceStrengthsLimitations
Traditional Methods
Weather Generator (WeatherMan)
  • Often included within widely used crop process software systems.
  • Requires only temperature and precipitation observations to parameterize.
  • Can be used for climate change projections, although future changes in the variable(s) used to condition the weather generator can have unanticipated effects on the other variables being simulated (including radiation).
  • When used as input to CERES−Maize, no significant difference in maize yield at study location* compared to yield obtained from observed radiation, in spite of overestimation of daily leaf area index (LAID) from anthesis to maturity.
  • Relatively long time series of temperature and precipitation needed for parameterization.
  • Day-by-day interrelationships between estimated radiation and observed temperature and precipitation are not directly retained.
  • Overestimated monthly mean daily radiation at study location in all months except March, July, and August.
  • Underestimated variance of daily solar radiation throughout the year.
  • When used as input to CROPGRO−Soybean, significant overestimation of soybean yield compared to yield obtained from observed radiation.
Empirical Model (modified from Ball et al. [20])
  • When used as input to crop models captured daily LAID, accumulated crop dry weight (CWAD) and accumulated crop evapotranspiration (ETAC) for both maize and soybean.
  • Simulated maize and soybean yield obtained using radiation estimates from empirical model did not differ significantly from simulated yield obtained from observed radiation.
  • Can be easily applied to the development of future projections of solar radiation, although assumes stationarity of the model with time.
  • Model development required by user.
  • Daily radiation observations needed for model development.
  • Multiple formulations (linear, nonlinear) possible.
  • Regional climate variations influence transferability of model to other locations.
  • Underestimation of mean daily solar radiation in summer; overestimation in autumn.
  • Underestimated variance of daily solar radiation during growing season.
Mechanistic Model (modified from Hunt et al. [21])
  • Deviations in monthly mean daily solar radiation compared to observations limited to winter and spring.
  • When used as input to crop models captured CWAD and ETAC for both maize and soybean.
  • Can be easily applied to the development of future scenarios of solar radiation, although assumes stationarity of the model with time.
  • Model development required by user.
  • Daily radiation observations needed for model development.
  • Regional climate variations influence transferability of model to other locations.
  • Underestimated variance of daily solar radiation throughout the year.
  • When used as input to crop models, overestimated LAID for both maize and soybean.
  • Simulated soybean yield (but not maize yield) significantly overestimated compared to yield obtained from observed radiation.
Non-Traditional Methods
Satellite estimation (POWER)
  • Downloadable gridded dataset.
  • Global coverage.
  • Continuously updated.
  • Insignificant deviations of monthly mean daily solar radiation and standard deviation from observed radiation during growing season.
  • Captured LAID, CWAD, and ETAC for both maize and soybean when input to crop models.
  • Simulated maize and soybean yield did not differ significantly from simulated yield obtained from observed radiation.
  • Coarser resolution (1° latitude × 1° longitude) may be insufficient in areas with steep gradients in cloud cover.
  • Overestimated mean and standard deviation of daily solar radiation during the cool season (October−February).
  • Observation-based dataset; applicable only for baseline when downscaling future projections from climate models.
Regional reanalysis (NARR)
  • Downloadable gridded dataset.
  • Coverage includes entire North America.
  • Continuously updated.
  • Coarse resolution (~32 km) limits spatial variability of daily radiation.
  • Significantly overestimates mean daily solar radiation and underestimates standard deviation.
  • When used as input to crop models underestimated LAID for soybean but not maize, overestimated ETAC for both crops, and overestimated (underestimated) CWAD for maize (soybean).
  • Significant underestimation of soybean yield, but not maize yield, compared to yield obtained from observed radiation.
  • For climate change applications, appropriate only as baseline when downscaling future projections from climate models.
Regional climate model simulations (CRCM, ECP2, HRM3, WRFG)
  • Downloadable gridded dataset.
  • Coverage includes entire North America.
  • NARCCAP models were able to simulate the variance of daily solar radiation at study location.
  • Projected values of daily solar radiation available for future period (2041–2070).
  • Coarse resolution (50 km) limits spatial variability of daily radiation.
  • Available only for specific present-day and future time slices.
  • Ability to simulate daily solar radiation varies by regional climate model.
  • Simulation of crop development varies by climate model, development stage, and crop type.
  • Soybean yield, but not maize yield, significantly overestimated compared to yield obtained from observed radiation.
  • Error introduced when global climate model (GCM) output is used for lateral boundary conditions or by limitations of the regional model may require debiasing before application.
Publisher’s Note: MDPI stays neutral with regard to jurisdictional claims in published maps and institutional affiliations.