Abstract
As global temperatures continue to rise unabated, episodes of heat-related catastrophes across the world have intensified. In Kenya, heatwave phenomena and their associated impacts are ignored and neglected due to several reasons, including unreliable and inconsistent weather datasets and heatwave detection metrics. Based on CHIRTS satellite infrared estimates and station blended temperature, this study investigated the spatiotemporal distribution of the heatwave events over Kenya during 1987–2016 using the Heatwave Magnitude Index daily (HWMId). The results showed that contrary to the absence of heatwave records in official national and international disaster database about Kenya, the country experienced heatwaves ranging from less severe (normal) to deadly (super-extreme) between 1987 and 2016. The most affected areas were located in the eastern parts of the country, especially in Garissa and Tana River, and in the west-northern side around the upper side of Turkana county. It was also found that the recent years’ heatwaves were more severe in magnitude, duration, and spatial extent. The highest magnitude of the heatwaves was recorded in 2015 (HWMId = 22.64) while the average over the reference period is around 6. CHIRTS and HWMId were able to reveal and capture most critical heatwave events over the study period. Therefore, they could be used respectively as data source and detection metrics, for heatwaves disaster emergency warning over short period as well as for long-term projection to provide insight for adaptation strategies.
1. Introduction
The effects of ongoing global warming are not only associated with changes in the mean climate but also the rapid intensification of extreme events, such as floods, droughts, and heatwaves [1]. According to the Fifth Assessment Report of the Intergovernmental Panel on Climate Change (IPCC AR5) in 2013, an obvious increasing trend in global mean surface temperature resulted in deadly heatwaves across the globe [2]. Several studies indicated that heatwaves have increased in duration, frequency, and intensity around the globe [3,4,5,6,7,8], directly causing damage to biological systems more than the changes in the mean climate [9,10]). In 2003, a heatwave event generally described as record-breaking resulted in catastrophic droughts and over 22,000 heat-related fatalities [7] in Europe. According to the global climate index, a total of 2928 people reportedly died in 2018 from heat-related extreme events, which was attributed to a string of deadly heatwaves that swept through the world in 2018 [8]. As greater proportions of people are exposed and susceptible to the negative effects of climate change in Africa, the continent remains at the center of climate change debates. For instance, [11] demonstrated that Africa is more likely to suffer from heatwaves as result of climate change.
Empirical studies demonstrated high consensus on the reality of alarming climate warming in Africa [12,13,14,15]. Recent studies considered Sub-Sahara Africa (SSA) as being a hotspot of extreme heat-related impacts [16]). From 1989 to 2009, a larger part of the Sahara experienced about 40–50 heatwave days per year (daily maximum apparent temperature greater than or equal to 41 °C) [17]. The duration and intensity of heatwaves were found to be rising disproportionately across the continent [11,18,19,20,21,22]. It was projected that these unusual heatwaves will intensify and occur on a regular basis by 2040 [1]. Moreover, exposure to extreme heatwave events were associated with increased morbidity and mortality since heatwaves have independent effects of daily ambient temperature (direct effect) and of persistent periods of heat (added effect), which could cause mass fatalities in vulnerable groups such as the elderly, children, and outdoor workers [23]. A multi-country observational study on heat mortality risk, [24] reported that the temperature percentile of minimum mortality varied from the 60th percentile in tropical areas to about the 80–90th percentile in temperate regions. However, heatwaves are commonly seen in Africa as ”normal” and the general perception is that people are adapted to cope with it. Heatwaves could be one of the most dangerous weather-related hazards in Africa, yet the most comprehensive list of past disasters events globally, the Emergency Events Database (EM-DAT), recorded only two heatwaves events from 1900–2019 (https://public.emdat.be) [25]. Heatwave is considered as a “silent killer” because it rarely receives adequate attention in Africa. This is partly due to the claim that Africa is already a hot continent and actual heatwaves might be mixed up with normal temperature conditions, which points to a crucial need to investigate the past heatwave records as an entry point to understanding complex heatwave impacts in Africa. In recent years, mainstreaming climate change in most aspects of development programs has been given great attention by several African governments. For example, it is the case of the Kenyan government which required more scientific basis and input on climate change to deliver a climate resilient development for its country and citizens.
Unlike flood and drought which were subjected to various research studies, the state of knowledge on heatwaves remains very weak or even inexistent in Kenya. This is largely due to lack of accurate weather data on current climate [26], which led to the misunderstanding of the heatwave concept and lack of endeavor to develop local heatwave and its impacts metrics integrating epidemiological information [1,8,27,28]. The scientific understanding of the quantitative distribution of heatwaves in the observed climate is essential for public awareness and decision-making on local intervention programs. A slight link between increasing temperature and heatwaves was made in Kenya [29], but this remains an assumption as the focus of the study was on temperature. Similarly, the study of [24] in Kenya showed that yearly life loss has positive association with increase in maximum temperature and mentioned a potential impact of heatwave on mortality rate in Kenya. In addition, suspicions and speculations about heatwave fact and their impacts have been stated as climate related hazard in Kenya [30]. Meanwhile, Kenya was mentioned as one the hotspot countries in Africa that has experienced an increasing heatwave magnitude during the last two decades [11]. The latter study used coarse spatial resolution of 0.75° reanalysis and few sparse station data covering the whole continent. Therefore, it is of great importance to use consistent and high-resolution data to establish the scientific evidence of observed heatwaves in Kenya.
A basic problem is that there is no universal heatwave metrics, different aspects of the core features of heatwaves such as duration and intensity have been considered by different authors to measure and identify heatwaves. There are mainly absolute and percentile-based threshold metrics, but absolute threshold-based approaches cannot be applied over a large heterogeneous region of varied thermal regime [18]. Furthermore, the indices based on fixed threshold temperature of 5 °C above climatology developed by [19] would not reflect the reality in areas like in the tropics where the daily variability in maximum temperature could be low. To overcome the limitations of fixed threshold and absolute threshold indices, the Expert Team on Climate Change Detection and Indices (ETCCDI; see http://etccdi.pacificclimate.org/list_27_indices.shtml) [31] developed the Warm Spell Duration Index (WSDI). However, only duration aspect is considered in the latter, meaning that two heatwaves of the same duration will be considered equally severe even if one of these has higher intensity than the other [20]. In order to adequately capture and compare the extreme heatwave events over the observed climate, it is important to adopt a comprehensive heatwave index that takes into account the intensity and length of the heatwave events. This led to the adoption of Heatwave Magnitude Index daily (HWMId) developed by [21], which integrates both the intensity and the duration.
The first of its kind to depict the temporal evolution and the spatial pattern of heatwaves in Kenya, this study analyzed heatwave climatology and its temporal trend, as well as the changes in the two most recent years (2015 and 2016) of the study period in order to draw attention on actual new features in the climate and the need for further study on future changes in heatwave hazards. This paper sought to detect heatwave episodes facts over Kenya from 1987 to 2016 using high-resolution daily data record of Climate Hazards center InfraRed Temperature with Stations (CHIRTS).
2. Materials and Methods
2.1. Study Area
Kenya is located in the tropics, nearly bisected by the Equator. The country is largely arid and semi-arid with distinct spatial variation of surface air temperature influenced by diverse climatic features and complex geomorphology and population density [30]. The climate is characterized by a bimodal rainfall pattern [32,33,34]. These seasons are driven by the Inter-Tropical Convergence Zone (ITCZ) which influences the distribution and patterns of rainfall and temperature fluctuations over the country [9,11]. The country is relatively warm throughout the year with the warmest months being December–February, followed by March–May, while June–August report the lowest temperatures [35,36]. Kenya’s elevation increases from the coast lowlands, putting the western side of the country at a higher elevation as compared to the eastern region [37].
2.2. Data Description
Accurate and finer resolution climate data are often requested from modeling research in key sectors such as health, economy, agriculture, and ecological applications [38]. This justifies the use of high-resolution satellite remotely sensed temperature blended with stations in this study to bridge the gap related to spatial and temporal inconsistencies of weather data faced in most African countries including Kenya. A new product, first in its kind and routinely updated data to support the monitoring of temperature extremes, Climate Hazards Center Infrared Temperature with Stations (CHIRTSmax) Climate Data Record (CDR) that directly combines satellite and station-based estimates of maximum temperature developed by [22] was used for this analysis.
A comprehensive description of how the dataset used in this study was developed can be found in [22,38]. Meanwhile, it should be noted that thermal infrared (TIR) distributions through maximum-compositing process similar to those used to develop Normalized Difference Vegetation Index (NDVI) was used to screen out cloud-contaminated observations, providing accurate gridded emission estimates [38]. The TIR-based monthly values were translated into standardized anomalies, and then converted into units of 2-m air temperature anomalies by multiplying these fields by observed standard deviations [22]. Moreover, the blending of the satellite and stations products is based on the expected contributions of the station data at a given location, which is derived from empirical covariograms that quantify the expected distance decay function [22,38]. To disaggregate the monthly CHIRTSmax to daily scale, ERA5 simulations downscaled based on bilinear interpolation were used [38].
Furthermore, studies on the dataset source revealed that the foundational dataset from which the CHIRTS-daily products were derived is the monthly CHIRTSmax product. Basically, three components were combined to create the monthly CHIRTSmax following [22,38]. These are:
- (1)
- CHTclim, a high-resolution (0.05° × 0.05°) monthly maximum temperature (Tmax) climatology developed with FAO station normals, ERA5 long-term average 2-m temperatures, latitude, longitude, and elevation as predictors using Moving Window Regression. The regression coefficient was individually generated for each location based on the density of the available data. Basically, a cubic function of the distance and a user-defined, regionally variable, maximum distance were used [36,38].
- (2)
- CHIRTmax, a high-resolution (0.05° × 0.05°) monthly time series based on remotely sensed infrared land surface emissions anomalies from GridSat B1 Thermal Infrared geostationary weather satellite observations.
- (3)
- CHTSmax, a high-resolution (0.05° × 0.05°) monthly time series of interpolated monthly Tmax anomalies fields based on Berkeley- Global Telecommunication System Tmax air temperature observations.
In this study, grid-based time series of daily maximum temperatures (0.05° × 0.05°) across the whole Kenya were analyzed as the focus is on heatwaves. The data used for the analysis covered 3 past decades (1987–2016), while the reference period used to compute the HWMId index was 32 years (1983–2014). The freely available dataset was extracted from the Climate Hazards Center data portal (http://data.chc.ucsb.edu/products/CHIRTSdaily/) [39].
2.3. Methodology
This study considered one of the most advanced heatwave detection metrics that considers both the duration and intensity of the heatwave. The novel Heatwave Magnitude Index daily (HWMId) [21], is adopted to detect spatiotemporal patterns of Kenya heatwaves for the period of 1987–2016. HWMId is an improved version of the Heatwave Magnitude Index (HWMI) [20], recently developed to accommodate some limitations of the latter. The HWMId is defined as the maximum magnitude of the heatwaves in a year, where a heatwave is defined as the period of at least three consecutive days with maximum temperature above 90th percentile threshold of the reference period 1983–2014 [22]. It sums excess temperatures beyond a certain threshold and merges durations and temperature anomalies of intense heatwave events into a single numeric indicator. This enables comparison of heatwaves with different length and peak magnitudes that have occurred in different regions and in different years. The author [21] expressed the 90th percentile, centered on 31 days windows as follows:
where denotes the set of data, d is a given day, ⋃ denotes the union of sets, is the daily maximum temperature in the day of the year y.
The index calculation is done on annual basics using the R programing language through it package and function called “extRemes” and “hwmid”, respectively, which output gives HWMId index as well as its associated duration and starting time. Nevertheless, the procedure could be described in three stages following the summary by [33].
- (a)
- The first stage consists of calculating the daily heatwave magnitude of each day () within the heatwave period (Equation (2)). () is assigned based on the normalized difference of the first and third quartile values of the time series of that particular day [21].where representing the maximum daily temperature on day d of the heatwave, and are the first and third quartile values, respectively, of 32 years’ time series composed of annual Tmaxs of the reference period 1983–2014.
- (b)
- The calculation of heatwave magnitude of all heatwaves in a year or season: the magnitude of each individual heatwave within each year (Mhw) is defined as the sum of the daily magnitudes of the consecutive days composing a heatwave.
- (c)
- The third stage is the calculation of the HWMId. It is the maximum value of Mhw occurring within a given summer, which represents the largest heatwave in that year and then defined as HWMId at that grid point for that year.
The analysis was done from 1987 to 2016 (30 years) while 32 years (1983–2014) was used as the reference period to calculate the index as requested in the R package. The most two recent years (2015 and 2016) were used as examples to appreciate the changes in recent days relatively to the reference period. Spatial mapping and probability density function were employed respectively, to display the spatial patterns and distributions. In addition, Man–Kendal test and Kolmogorov–Smirnov test were used to appreciate the statistical significance of the trend and the change in the spatial distribution, respectively. In order to classify the heatwave severity, this paper adopted heatwave categorization used in [11,18,22] as Table 1 indicates.

Table 1.
Classification of Heatwave Magnitude Index daily (HWMId).
3. Results
3.1. Heatwave Climatology
HWMId of heatwave events increased significantly across the years at 5% level in several regions of the country (about 6% of the total land area), particularly in Turkana, West Pokot, Mandera, Wajir, Garisa, and Tana River counties. The spatial coverage of statistically significant trend at 5% level in the durations was observed in about 5.8% of the total land area, while pattern was roughly similar to that of HWMId except West Pokot county, but extended to parts of Isiolo and Marsabit counties. Based on the heatwave classification in Table 1, extreme heatwave events were observed around Garissa, Tana River, Turkana, and West Pokot counties while most of the remaining areas experienced moderate to severe on average over 1987–2016 period (Figure 1a). Heatwave duration ranged from 3 to about 9 days with the longest recorded around Garissa, Tana River and Turkana counties (Figure 1b). It was observed that no single place recorded absolute zero heatwave event which implied a minimum duration of 3 days for each event.
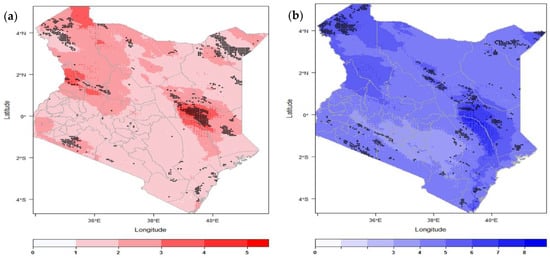
Figure 1.
Heatwave Climatology 1987–2016, HWMId (a) and heatwave duration (HWD) (b). The black “+” indicates area with significant increase at 5% level based on Man-Kendal test, the minimum duration is 3 days.
3.2. Heatwave Magnitude Index Daily (HWMId)
Figure 2 shows the yearly records and patterns of the most severe heatwave events from 1987 to 2016. It indicates that heatwave events from minor to disastrous episodes have occurred in Kenya every year across the study period. The magnitude of heatwave events varied from zero (no events) to the maximum magnitude of 22.64 in 2015. The top 5 most severe events (Super extreme) occurred in the last 15 years of the study period, especially in 1999, 2005, 2006, 2015, and 2016. The most affected areas were located in the eastern part of the country, especially in Garissa and Tana River counties where the super-extreme and very extreme heatwave phenomenon were observed. The most northern part of Turkana and Marsabit counties were also severely affected. Most parts of the country in most years experienced no (zero) to extreme heatwave events. It could also be seen that the recent years’ heatwaves were more severe in both magnitude and spatial extent.
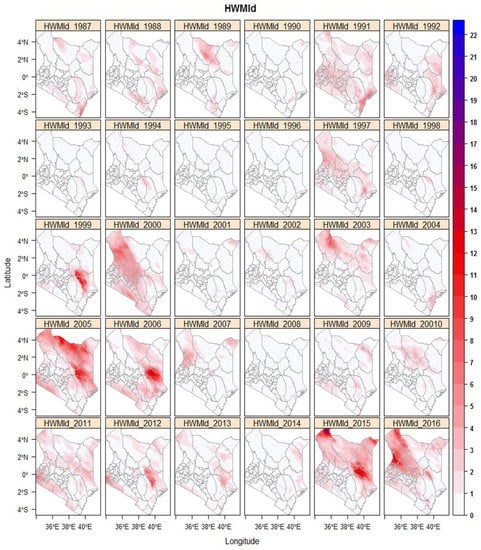
Figure 2.
Heatwave Magnitude Index daily (HWMId) 1987–2016. The white (0) indicates no heatwave event.
3.3. Heatwave Duration and Starting Dates Associated with the HWMId
Heatwave duration (HWD) ranged from 3 to 26 days (Figure 3). The longest duration was seen in 2016 around Turkana and West Pokot counties, follow by the heatwave of 2015 in the area of Tana River, Garissa and the upper northern side of Turkana. Most part of the remaining years and areas recorded heatwave events of less or equal to 14 days. Figure 4 presents the starting date associated with the heatwave events of Figure 2. Most heatwave events recorded in Kenya started around the months of February–March, November–December. Moreover, April and September recorded heatwave events as well as spot of heatwaves in other months.
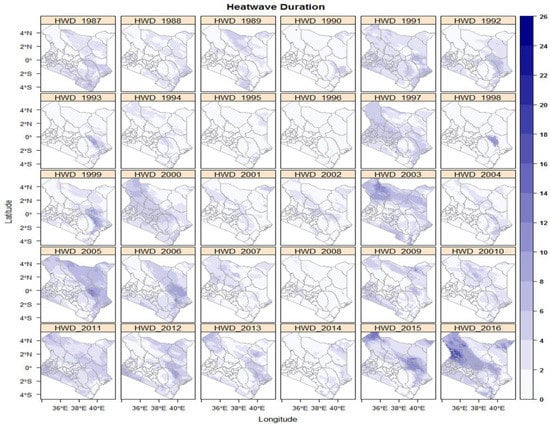
Figure 3.
Duration of heatwave events of Figure 2 in number of days 1987–2016. The white (0) indicates no heatwave event, the minimum duration is 3 days.
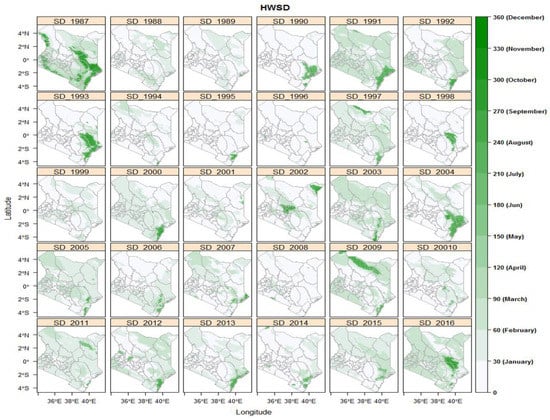
Figure 4.
Starting dates of heatwaves events of Figure 2 in nth days 1987–2016. The white (0) indicates no heatwave event.
3.4. Temporal Evolution and Recent Changes in Extreme Heatwave Events
Figure 5 displays the overall average temporal trend in affected areas by heatwaves and their associated duration across the whole country of Kenya. The affected areas have increased significantly reaching up to 60% and 47% of the total land area of Kenya in 2005 and 2015, respectively. Similarly, heatwaves duration has also increased significantly over the study period, with the longest duration been observed in 2016. The affected area could increase by 45% each year while the duration could move by around 2% annually. Figure 6 showed the changes in the most recent two years of the study period relatively to the reference period. Positive changes were experienced around the eastern and northern parts in 2015 and only in northern parts in 2016, while the other parts showed decreasing patterns. The shift in the most two recent year’s distributions as compared to the reference revealed a statistically significant positive shift at 5% level for the two years based on two sample Kolmogorov–Smirnov test.
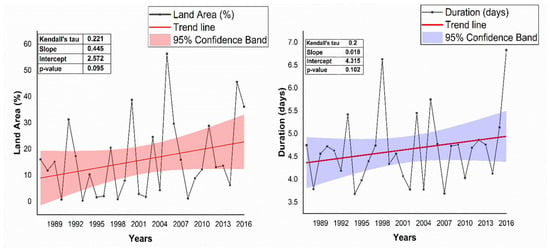
Figure 5.
Average Trend in heatwaves affected areas (left) and duration (right).
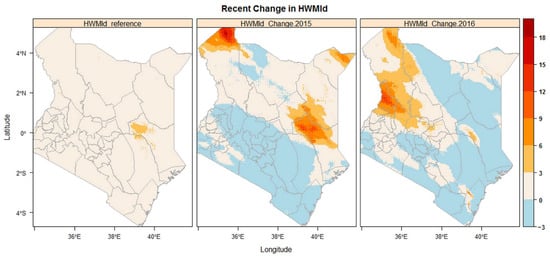
Figure 6.
Recent changes in HWMId 2015 (middle) and 2016 (right) relative to the reference period (left).
4. Discussion and Conclusions
A statistically significant increase in the HWMId and its associated duration were observed in the spatial pattern climatology over the period of 1987–2016. Heatwave phenomena from normal to super-extreme category had happened in Kenya over the past 3 decades. Eastern and Northern parts, especially around Tana River, Garissa, Isiolo, Mandera, Marsabit, and Turkana counties were shown to be the major hotspots for heatwave event over the past. These spatial patterns could be related to the fact that those regions are known for aridity and dryness and characterized by low vegetation cover in the country. Also, the mountainous areas around the central and western parts of the country generate a cool microclimate which can justify less heatwave magnitude significance trends observed in those areas. The increasing maximum temperature noticed by [30] across those areas could have a correlation with the occurrence of heatwave events.
The most severe heatwave event (super-extreme) recorded during this study period occurred in 2015. Interestingly, it was documented in Kenya news when a doctor attributed the death of a young student to extreme heat. Furthermore, 2015 was mentioned as the warmest years on record globally and in many individual countries above the 1961–1990 average by WMO [40]. Further, it was found that Africa was hit by very intense heatwaves during different season in 2015 [12]. These indicate that heat events perceived by the public were well captured by HWMId.
As revealed in the study by [4], most African countries or institutions lack heatwave detection metrics and their corresponding impacts. This is in line with the findings by [38] who also used HWMId across the whole of Africa and found that Kenya was one the hotspot countries which showed an increasing magnitude over the last two decades. Moreover, the general public in Africa often ignore the impact of high temperature as they seem to consider it as normal, although it could have substantial health effects and environment implications. For example, heatwave has dangerous effect on life expectancy, several stages of crop production as well as the ecological wellbeing in Africa [34]. These could explain why similar heatwaves in Europe could lead to thousands of deaths while heatwave impacts in Kenya are unknown.
About the starting dates, our results follow the findings of [29] which indicated the warmest months in Kenya are December–February, followed by March–May. The lengthy duration in recent years’ heatwave events is also confirmed by previous studies which found that the whole Africa has experienced longer heatwaves events in the last two decades of 20th century [9]. The spatial extent of heatwave events increased and spread faster since the beginning of the current century. The same observation was made over Africa by [11] who used reanalysis station data and demonstrated that extreme heatwaves increased to about 60.1% of land area per year between 2006 and 2015 as compared to 37.3% in the period from 1981 to 2005.
The results of this study showed that, contrary to the absence of heatwave record in official national and international disaster database in Kenya, the country experienced normal to super-extreme heatwave events between 1987 and 2016. A substantial increase in the trend of Heatwave Magnitude Index daily (HWMId) was observed, as well as remarkable extent in the duration and spatial extent of recent years. Along with the warming trend in Kenya and the spatiotemporal pattern of past heatwaves, it could be deduced that lethal heatwaves are likely to occur in the years to come. Unknown heatwaves or classified as unusual today could become a normal occurrence within 20 years said [9]. Moreover, by 2025, the occurrence of heatwaves with magnitude between 3 and 9 could be more likely to happen relative to the period 1979–2015 over Africa under both RCP4.5 and RCP8.5 [11]. This suggests a worst future for heatwave phenomenon in Kenya, as the climate is obviously going to warm more toward the end the current century [35].
Heatwaves have been the most under-rated weather hazard in Africa [4]. Unlike the remarkable impacts of other weather-related disasters such as drought and flood in Kenya, heatwave can nonetheless be deadly, costly, and damageable to health, infrastructure, agriculture, and the ecological system. For example, heatwaves can contribute significantly to morbidity among children and the elderly, reduce labor productivity during the hottest periods, and accelerate the degradation of infrastructures. It is therefore important to consider future projection of heatwaves in Kenya in future research work. HWMId could be used for emergency warning alerts for short period as well as providing long-term insight for adaptation strategies and actions.
This work investigated the evidence of heatwave events that occurred in Kenya from 1987 to 2016 to create awareness on heatwave patterns and their consequences which remained unknown to the general public in Kenya. The Heatwave Magnitude Index daily (HWMId) based on blended remotely sensed temperature blended with stations dataset (CHIRTS) were used. The study concludes:
- (1)
- Contrary to the absence of heatwave records in official national and international disaster database about Kenya, this study gives evidence of heatwaves ranging from less severe (normal) to deadly (super-extreme) experienced between 1987 and 2016.
- (2)
- Heatwaves have recently become more severe and longer than before, with remarkable and fast spread in the spatial extent of heatwave affected areas during the most recent years.
- (3)
- CHIRTS-daily Tmax and HWMId were able to capture most critical heatwave events over the study period. They could be used for heatwave disaster emergency warning over short period as well as for long-term projection to provide insight for adaptation strategies. Future works should focus on future projections to inform adaptation policy decision makers.
Author Contributions
Conceptualization, M.A. and Y.X.; methodology, M.A.; software, M.A.; formal analysis, M.A.; resources, Y.X.; data curation, T.D.; writing—original draft preparation, M.A. and A.G.; supervision, Y.X.; Writing the revised version, M.A. All authors have read and agreed to the published version of the manuscript.
Funding
This research was funded by UK GCRF project of Development Corridors Partnership (Sub-contract number: CON 2395-CAAS-19-7557, Advancing Capacity on Climate-resilient Development Corridors in East Africa).
Data Availability Statement
The data that support the findings of this study are openly available on Climate Hazards Center data portal. https://doi.org/10.15780/G2008H.
Acknowledgments
We are grateful to all our research lab mates and thank all the anonymous reviewers.
Conflicts of Interest
The authors declare no conflict of interest.
References
- Dosio, A. Projection of temperature and heat waves for Africa with an ensemble of CORDEX Regional Climate Models. Clim. Dyn. 2017, 49, 493–519. [Google Scholar] [CrossRef]
- Stocker, T.F.; Qin, D.; Plattner, G.-K.; Tignor, M.; Allen, S.K.; Boschung, J.; Nauels, A.; Xia, Y.; Bex, V.; Midgley, P.M. Climate Change 2013: The Physical Science Basis; Working Group I Contribution to the Fifth Assessment Report of the Intergovernmental Panel on Climate Change; Cambridge University Press: Cambridge, UK; New York, NY, USA, 2013. [Google Scholar] [CrossRef]
- Wu, Z.; Jiang, Z.-H.; Li, J.; Zhong, S.; Wang, L. Possible association of the western Tibetan Plateau snow cover with the decadal to interdecadal variations of northern China heatwave frequency. Clim. Dyn. 2012, 39, 2393–2402. [Google Scholar] [CrossRef]
- Harrington, L.J.; Otto, F.E.L. Reconciling theory with the reality of African heatwaves. Nat. Clim. Chang. 2020, 10, 796–798. [Google Scholar] [CrossRef]
- Ding, T.; Qian, W.; Yan, Z. Changes in hot days and heat waves in China during 1961-2007. Int. J. Clim. 2009, 30, 1452–1462. [Google Scholar] [CrossRef]
- Habeeb, D.; Vargo, J.; Stone, B. Rising heat wave trends in large US cities. Nat. Hazards 2015, 76, 1651–1665. [Google Scholar] [CrossRef]
- Schär, C.; Jendritzky, G. Climate change: Hot news from summer 2003. Nat. Cell Biol. 2004, 432, 559–560. [Google Scholar] [CrossRef]
- Eckstein, D.; Künzel, V.; Schäfer, L.; Winges, M. Global Climate Rate Index 2020 Who Suffers Most from Extreme Weather Events? Weather-Related Loss Events in 2018 and 1999 to 2018; Germanwatch: Bonn, Germany, 2020. [Google Scholar]
- Russo, S.; Marchese, A.F.; Sillmann, J.; Immé, G. When will unusual heat waves become normal in a warming Africa? Environ. Res. Lett. 2016, 11, 054016. [Google Scholar] [CrossRef]
- Nicholson, S.E.; Nash, D.J.; Chase, B.M.; Grab, S.W.; Shanahan, T.M.; Verschuren, D.; Asrat, A.; Lézine, A.-M.; Umer, M. Temperature variability over Africa during the last 2000 years. Holocene 2013, 23, 1085–1094. [Google Scholar] [CrossRef]
- Ceccherini, G.; Russo, S.; Ameztoy, I.; Marchese, A.F.; Carmona-Moreno, C. Heat waves in Africa 1981–2015, observations and reanalysis. Nat. Hazards Earth Syst. Sci. 2017, 17, 115–125. [Google Scholar] [CrossRef]
- Fontaine, B.; Janicot, S.; Monerie, P.-A. Recent changes in air temperature, heat waves occurrences, and atmospheric circulation in Northern Africa. J. Geophys. Res. Atmos. 2013, 118, 8536–8552. [Google Scholar] [CrossRef]
- Naik, M.; Abiodun, B.J. Projected changes in drought characteristics over the Western Cape, South Africa. Meteorol. Appl. 2020, 27, 1–14. [Google Scholar] [CrossRef]
- Gasparrini, A.; Armstrong, B. The Impact of Heat Waves on Mortality. Epidemiology 2011, 22, 68–73. [Google Scholar] [CrossRef] [PubMed]
- Tong, S.-L.; Wang, X.Y.; Guo, Y. Assessing the Short-Term Effects of Heatwaves on Mortality and Morbidity in Brisbane, Australia: Comparison of Case-Crossover and Time Series Analyses. PLoS ONE 2012, 7, e37500. [Google Scholar] [CrossRef] [PubMed]
- Herold, N.; Alexander, L.; Green, D.; Donat, M.G. Greater increases in temperature extremes in low versus high income countries. Environ. Res. Lett. 2017, 12, 034007. [Google Scholar] [CrossRef]
- Vizy, E.K.; Cook, K.H. Mid-Twenty-First-Century Changes in Extreme Events over Northern and Tropical Africa. J. Clim. 2012, 25, 5748–5767. [Google Scholar] [CrossRef]
- Chakraborty, D.; Sehgal, V.K.; Dhakar, R.; Ray, M.; Das, D.K. Spatio-temporal trend in heat waves over India and its impact assessment on wheat crop. Theor. Appl. Clim. 2019, 138, 1925–1937. [Google Scholar] [CrossRef]
- Frich, P.; Alexander, L.V.; Della-Marta, P.; Gleason, B.; Haylock, M.; Tank, A.M.G.K.; Peterson, T. Observed coherent changes in climatic extremes during the second half of the twentieth century. Clim. Res. 2002, 19, 193–212. [Google Scholar] [CrossRef]
- Russo, S.; Dosio, A.; Graversen, R.G.; Sillmann, J.; Carrão, H.; Dunbar, M.B.; Singleton, A.; Montagna, P.; Barbosa, P.; Vogt, J.V. Magnitude of extreme heat waves in present climate and their projection in a warming world. J. Geophys. Res. Atmos. 2014, 119, 12–500. [Google Scholar] [CrossRef]
- Russo, S.; Sillmann, J.; Fischer, E.M. Top ten European heatwaves since 1950 and their occurrence in the coming decades. Environ. Res. Lett. 2015, 10, 124003. [Google Scholar] [CrossRef]
- Funk, C.; Peterson, P.; Peterson, S.; Shukla, S.; Davenport, F.; Michaelsen, J.; Knapp, K.R.; Landsfeld, M.; Husak, G.; Harrison, L.; et al. A High-Resolution 1983–2016 Tmax Climate Data Record Based on Infrared Temperatures and Stations by the Climate Hazard Center. J. Clim. 2019, 32, 5639–5658. [Google Scholar] [CrossRef]
- Xu, Z.; Fitzgerald, G.; Guo, Y.; Jalaludin, B.; Tong, S. Impact of heatwave on mortality under different heatwave definitions: A systematic review and meta-analysis. Environ. Int. 2016, 89–90, 193–203. [Google Scholar] [CrossRef] [PubMed]
- Gasparrini, A.; Guo, Y.; Hashizume, M.; Lavigne, E.; Zanobetti, A.; Schwartz, J.; Tobias, A.; Tong, S.; Rocklöv, J.; Forsberg, B.; et al. Mortality risk attributable to high and low ambient temperature: A multicountry observational study. Lancet 2015, 386, 369–375. [Google Scholar] [CrossRef]
- EM-DAT. The International Disaster Database. Available online: https://public.emdat.be/ (accessed on 3 October 2020).
- Donat, M.G.; Alexander, L.V.; Yang, H.; Durre, I.; Vose, R.; Caesar, J. Global land-based datasets for monitoring climatic extremes. Bull. Am. Meteorol. Soc. 2013, 94, 997–1006. [Google Scholar] [CrossRef]
- Yang, W.; Seager, R.; Cane, M.A.; Lyon, B. The Annual Cycle of East African Precipitation. J. Clim. 2015, 28, 2385–2404. [Google Scholar] [CrossRef]
- Nicholson, S.E. On the factors modulating the intensity of the tropical rainbelt over West Africa. Int. J. Clim. 2009, 29, 673–689. [Google Scholar] [CrossRef]
- Victor, O.; Chen, H.; Gao, C.; Sagero, P.O. Variability of temperature properties over Kenya based on observed and reanalyzed datasets. Theor. Appl. Clim. 2017, 133, 1175–1190. [Google Scholar] [CrossRef]
- Ayugi, B.O.; Tan, G. Recent trends of surface air temperatures over Kenya from 1971 to 2010. Theor. Appl. Clim. 2018, 131, 1401–1413. [Google Scholar] [CrossRef]
- ETCCDI Climate Change Indices. Available online: http://etccdi.pacificclimate.org/list_27_indices.shtml (accessed on 25 December 2020).
- Camberlin, P.; Moron, V.; Okoola, R.; Philippon, N.; Gitau, W. Components of rainy seasons’ variability in Equatorial East Africa: Onset, cessation, rainfall frequency and intensity. Theor. Appl. Clim. 2009, 98, 237–249. [Google Scholar] [CrossRef]
- Dobricic, S.; Russo, S.; Pozzoli, L.; Wilson, J.; Vignati, E. Increasing occurrence of heat waves in the terrestrial Arctic. Environ. Res. Lett. 2020, 15, 024022. [Google Scholar] [CrossRef]
- Ragatoa, D.S.; Ogunjobi, K.O.; Klutse, N.A.B.; Okhimamhe, A.A.; Eichie, J.O. A change comparison of heat wave aspects in climatic zones of Nigeria. Environ. Earth Sci. 2019, 78, 111. [Google Scholar] [CrossRef]
- Omondi, P.A.; Awange, J.L.; Forootan, E.; Ogallo, L.A.; Barakiza, R.; Girmaw, G.B.; Fesseha, I.; Kululetera, V.; Kilembe, C.; Mbati, M.M.; et al. Changes in temperature and precipitation extremes over the Greater Horn of Africa region from 1961 to 2010. Int. J. Clim. 2014, 34, 1262–1277. [Google Scholar] [CrossRef]
- Funk, C.; Peterson, P.; Landsfeld, M.; Pedreros, D.; Verdin, J.; Shukla, S.; Husak, G.; Rowland, J.; Harrison, L.; Hoell, A.; et al. The climate hazards infrared precipitation with stations—a new environmental record for monitoring extremes. Sci. Data 2015, 2, 1–21. [Google Scholar] [CrossRef] [PubMed]
- Ongoma, V.; Chen, H. Temporal and spatial variability of temperature and precipitation over East Africa from 1951 to 2010. Theor. Appl. Clim. 2017, 129, 131–144. [Google Scholar] [CrossRef]
- Verdin, A.; Funk, C.; Peterson, P.; Landsfeld, M.; Tuholske, C.; Grace, K. Development and validation of the CHIRTS-daily quasi-global high-resolution daily temperature data set. Sci. Data 2020, 7, 1–14. [Google Scholar] [CrossRef] [PubMed]
- Climate Hazards Center CHIRTS-Daily. Available online: http://data.chc.ucsb.edu/products/CHIRTSdaily/ (accessed on 3 September 2020).
- WMO. WMO Statement on the Status of the Global Climate in 2012. WMO World Meteorol. Organ., no. 1108, p. WMO-No. 1108. 2016. Available online: https://library.wmo.int/index.php?lvl=author_see&id=1 (accessed on 25 December 2020).
Publisher’s Note: MDPI stays neutral with regard to jurisdictional claims in published maps and institutional affiliations. |
© 2020 by the authors. Licensee MDPI, Basel, Switzerland. This article is an open access article distributed under the terms and conditions of the Creative Commons Attribution (CC BY) license (http://creativecommons.org/licenses/by/4.0/).