Article

Impacts of the Tree Canopy and Chemical Reactions on the Dispersion of Reactive Pollutants in Street Canyons

by
Franchesca G. Gonzalez Olivardia
,
Tomohito Matsuo
*,
Hikari Shimadera
and
Akira Kondo
Graduate School of Engineering, Osaka University, 2-1 Yamadaoka Suita, Osaka 565-0871, Japan
*
Author to whom correspondence should be addressed.
Atmosphere 2021, 12(1), 34; https://doi.org/10.3390/atmos12010034
Submission received: 26 November 2020 / Revised: 22 December 2020 / Accepted: 24 December 2020 / Published: 30 December 2020

Abstract

:
Traffic-related air pollution in street canyons can cause health problems for pedestrians. In order to clarify the behavior of reactive pollutants, such as NOx and O3, in street canyons, a computational fluid dynamics (CFD) model coupled with a chemistry model and tree canopy model was developed, and then, a set of numerical experiments were performed to investigate the impacts of chemical reactions and aerodynamic effects of trees planted in a canyon. The results were compared with the observation data. Through the results of the numerical experiments designed to simulate a realistic urban street canyon, it was found that chemical reactions have a dominant impact on the NO/NO2 ratio and O3 concentration. While the tree canopy had little impact on the NO/NO2 ratio, it had a moderate impact on the flow field in the canyon and the amount of NOx and O3 in the canyon. In accordance with the aerodynamic effects of tree canopies, the local NOx concentration in the experiments increased and decreased by up to 51% and 11%, respectively. The current findings of this study demonstrate the utility of the proposed model for conducting air quality investigations in urban areas.

1. Introduction

Traffic-related air pollution is one of the key causes of respiratory and allergic diseases, including asthma, chronic obstructive pulmonary disease, and pneumonia [1]. In an urban street canyon, where tall buildings surround the street on both sides, several pollutants such as NO, NO2, CO, volatile organic compounds (VOCs), and fine particles such as PM2.5 and PM10 are emitted from vehicles and can circulate throughout the air. In order to develop effective measures to protect pedestrians from these roadside air pollutants, the behaviors of the pollutants in the street canyon need to be clarified.
The dispersion of pollutants is strongly affected by the flow field, and there are several factors that influence the flow field in street canyons. The aspect ratio is one of those factors. A large aspect ratio (large building height compared to the road width) creates low wind velocity in the canyon [1,2]. Within the canyon, roof shapes [3] and roof height differences between the windward and leeward buildings [4,5] can modify the flow pattern. In addition, the surface temperature of the buildings or ground, which increases in response to solar radiation, can have an impact on the flow field in the canyon [6,7,8].
To understand the flow field and the pollutant concentrations within a canyon, several tools can be utilized including field measurements [8], wind tunnel experiments [1,3,6,7,8,9,10], and computational fluid dynamics (CFD) simulations [1,4,5,6,7,8,9,10,11,12,13,14,15,16]. The field measurements provide the most reliable data about the actual behavior of pollutants dispersed in the canyon, but it is difficult to control the relevant conditions such as the aspect ratio, building shapes, wind velocity, wind direction, and so forth. Wind tunnel experiments and CFD simulations allow for more flexibility in terms of making adjustments to the properties of street canyons, and these approaches have been used to evaluate how each factor affects the flow field and pollutant dispersion in the canyon. In some studies, the results of wind tunnel experiments and CFD simulations were compared, and the findings indicated that appropriately designed CFD simulations can reproduce the results of wind tunnel experiments [6,8,9,10]. Therefore, CFD simulations were employed in this study.
There are two types of turbulence model have been used in CFD for evaluation of flow field in a street canyon, namely Reynolds-averaged Navier–Stokes (RANS) and large eddy simulation (LES). Moreover, the RANS models can be subdivided into several turbulence models such as standard k-ε model [17], the renormalization group k-ε model [18], the realizable k-ε model [19], the k-ω shear stress transport model [20], and so on. In the RANS models, the contribution of fluctuation of variables (such as wind velocity) is modeled by using closure equation(s), while the LES solves the large-scale motions of flow and models only the small turbulent eddies. In most cases, LES showed better accuracy than RANS [21,22], though RANS has been more commonly used [23]. Blocken et al. [24] supported to use steady RANS simulations for evaluating pedestrian-level wind speed for wind comfort assessment, because RANS simulations can provide accurate results and are faster and less expensive, even though LES is more accurate.
To date, most of the CFD models have only considered the momentum equation (Navier–Stokes equation), continuous equation, and conservation equations of energy and pollutants. However, CFD models can be used to consider additional effects to evaluate pollutant dispersion in street canyons more accurately. When trees are planted along the street, for example, the trees may prevent air flow and induce turbulent mixing. To consider this aerodynamic effect of tree canopies, several tree canopy models have been proposed [25,26,27,28]. The tree canopy models add a specific term into the momentum equation and transport equations of turbulent kinematic energy and its dissipation rate. Furthermore, Xue and Li studied the deposition of pollutants onto the tree canopies and found that the deposition effect was much smaller than the aerodynamic effect [29].
Chemical reactions also play an important role in the pollutant concentrations within the street canyon. It is known that NO, NO2, and O3 react rapidly in the atmosphere, and the reaction rate of these species depends on the concentrations of VOCs and sunlight. According to Jo and Park [30], the concentrations of NO and NO2 are higher at roadside sites than residential sites because of vehicle exhaust gasses, and subsequently, this leads to lower O3 concentrations at roadside sites than residential sites because of the titration reactions. There are some studies that have estimated the concentrations of NO, NO2, and O3 in street canyons by considering not only transportation, but also the chemical reactions in the canyon [11,12]. A few investigators have employed a complex chemical reaction model, namely, the Carbon Bond Mechanism version 4 (CBM-IV) developed by Gery et al. [31], and then, evaluations were carried out on the effects of concentrations of VOCs and the intensity of sunlight on the reaction rate of NO, NO2, and O3 [13,14,15].
Although CFD simulations are known to be a powerful tool for understanding the dispersion of pollutants in street canyons, few studies have considered the aerodynamic effects and the chemical reactions simultaneously. Since the flow field and the chemical reactions proceed gradually, the pollutant concentrations in the canyon may depend on the average residence time, which was evaluated by the flow field data. In other words, the impact of chemical reactions might be larger if the wind velocity in the canyon is slower because the low wind speed gives the pollutants more time to react before they are removed from the canyon. In order to understand the reactive pollutants concentration dispersion in realistic urban street canyon, it is necessary to simulate not only chemical reactions but also flow fields. There are a limited number of studies evaluating air pollution in a realistic urban geometry [32,33,34,35]. In these studies, however, only the work presented by Kwak et al. [32] employed the both of a complicated chemical reaction model and CFD, in which, however, the tree canopy model was not employed. In this study, therefore, the tree canopy model and chemical reaction model were employed simultaneously in the CFD model to evaluate the behavior of the pollutants in a street canyon.
This paper is structured as follows. In Section 2, the governing equations, tree canopy model, and chemical reaction model are described. The calculation conditions, such as the target domain, boundary conditions, and CFD tool setup, are presented in Section 3. The results of the simulations are presented and discussed in Section 4, and the conclusion is presented in the last section.

2. Methods

2.1. Governing Equations of the CFD

In this study, the governing equations of the dispersion of reactive pollutants in the urban canyon were defined as follows under the assumption of incompressible flow. In order to consider the turbulent flow, Reynolds decomposition was applied and the standard k-epsilon model [17] was used. In addition, the Boussinesq approximation was used to deal with buoyancy.
Reynolds decomposition:
ϕ = ϕ ¯ + ϕ ´ ,
where ϕ is some physical quantity (wind velocity, air temperature, pressure, etc.), ϕ ¯ is the ensemble average of ϕ , and ϕ ´ is the deviation from the ensemble average.
Continuity equation:
· U ¯ = 0 .
Momentum equation:
U ¯ t + ( U ¯ · ) U ¯ = 1 ρ p + β g ( T ¯ T r e f ) + · [ ν { U ¯ + ( U ¯ ) T } U ´ U ´ ¯ ] F U
U ´ U ´ ¯ = ν t { U ¯ + ( U ¯ ) T } 2 3 k I ,
k = 1 2 U ´ · U ´ .
ν t = C μ k 2 ε ,
where U is the wind velocity [m/s], ρ is the density [kg/m3], p is the pressure [Pa], β is the volume expansion rate [1/K], g is the gravity acceleration [m/s2], T is the air temperature [K], T r e f is the reference temperature [K], ν is the kinematic viscosity [m2/s], F U is the aerodynamic effects of trees (described in Section 2.2) [m/s2], ν t is the turbulent kinematic viscosity [m2/s], k is the kinematic energy [m2/s2], I is the unit matrix, and C μ is the constant of the standard k-epsilon model (0.09). In addition, superscript “T” means the transpose of the matrix.
Note that in the outdoor environment, turbulent viscosity ν t is much larger than molecular viscosity ν so that the molecular viscosity is almost negligible.
Heat conservation equation:
T ¯ t + U ¯ · T ¯ = · { ν P r ( T ¯ ) U ´ T ´ ¯ } ,
U ´ T ´ ¯ = ν t P r t ( T ¯ ) ,
where P r is the Prandtl number (0.9), and P r t is the turbulent Prandtl number (0.7).
Scalar transport equation:
C i ¯ t + U ¯ · C i ¯ = · { ν S c , i ( C i ¯ ) U ´ C i ´ ¯ } + S e , i + S r , i ,
U ´ C i ´ ¯ = ν t S c t , i ( C i ¯ ) ,
where C i is the concentration of the ith pollutant [ppb], S c , i is the Schmidt number of the ith pollutant [−], S e , i is an emission term [ppb/s], S r , i is a reaction term [ppb/s] calculated by CBM-IV (described in Section 2.3), and S c t , i is the turbulent Schmidt number of the pollutant [−].
In this study, the same Schmidt number (1.0) and turbulent Schmidt number (1.0) were selected for each pollutant.
Transport equation of kinematic energy and dissipation rate:
k t + U ¯ · k = · { ( ν + ν t σ k ) k } + ν t 2 { U ¯ + ( U ¯ ) T } 2 ε + F k ,
ε t + U ¯ · ε = · { ν t σ ε ε } + ε k [ C ε 1 ν t 2 { U ¯ + ( U ¯ ) T } 2 C ε 2 ε ] + F ε
where σ k σ ε , C ε 1 , C ε 2 , and C ε 3 are the constants of the standard k-epsilon model (1.0, 1.3, 1.44, 1.92, and −0.33, respectively), and F k (m2/s3) and F ε (1/s2) are the aerodynamic effects of trees (described in Section 2.2).

2.2. Tree Canopy Model

Trees lining the street improve the outdoor environment in many ways such as preventing strong gusts around tall buildings, providing shade, etc. On the other hand, trees may make pedestrian-level air quality worse by weakening the wind velocity and causing the retention of localized pollutants such as exhaust gasses from vehicles. In order to evaluate the impact of the aerodynamic effects of trees, several tree canopy models have been developed [25,26,27,28]. In this study, the following tree canopy model, which is the same as the model used by Yamada [26], was employed.
Aerodynamic effects of trees:
F U = η C f a U ¯ ( U ¯ · U ¯ ) ,
F k = η C f a ( U ¯ · U ¯ ) 3 / 2 ,
F ε = ε k C p ε l F k ,
where η is the fraction of the area covered with trees [-], C f is the drag coefficient for the canopy (0.2), and a is the leaf area density depending on the tree species [m2/m3].
In this study, η was set to 1.0 if the calculation grid was covered by the tree canopy; otherwise, it was set to 0.0.

2.3. Chemical Reaction Model

In the atmosphere, many reactions involving various chemical substances occur. When roadside air pollutants are considered, the reactions of NOx, O3, and VOCs are especially important. NO, which accounts for the majority of NOx emitted as automobile exhaust gas, reacts with O3 in the atmosphere to produce NO2 through the so-called titration reaction. NO2 is converted to NO and oxygen radicals by photolysis in the presence of ultraviolet light. Oxygen radicals react with oxygen and produce O3. VOCs also generate radicals and promote the conversion of NO to NO2. Therefore, the concentrations of NO, NO2, and O3 in the roadside air are affected not only by the ambient concentration and emission level of each pollutant, but also by the solar radiation and VOC concentrations. Equations (16)–(21) express these reactions.
NO + O 3 NO 2 + O 2 ,
NO 2 + h ν + M NO + O + M ,
O + O 2 O 3 ,
RH + h ν + OH R + H 2 O ,
R + O 2 ROO ,
ROO + NO RO + NO 2 ,
where h ν is the radiation (sunlight), and M represents the third body.
In this study, CBM-IV developed by Gery et al. [31] was employed to consider such chemical reactions in the street canyon. CBM-IV is a model for handling reactions of VOCs, NOx, HOx, and Ox, in which VOCs are lumped and classified in terms of carbon bond structures to reduce the reactions to be considered and save calculation costs. The term S r , i in Equation (9) is given by the CBM-IV model.

3. Simulation Setup

3.1. Calculation Domain and Period

The calculation domain and period used was the same as that in Gonzalez Olivardia et al. [13]. The calculation domain was developed based on the city of Umeda-Shinmichi (34.70° N, 135.50° E), Osaka City, Japan. The sizes of the calculation and analytical domains were 600 m × 600 m × 150 m (Figure 1a) and 100 m × 100 m × 20 m (Figure 1b), respectively. As shown in Figure 1, the sizes and locations of trees in the calculation domain were modified for simplification. The width and height of the tree canopy were 3.3 m and 12 m, respectively (z = 3–15 m). The number of calculation grid points was 358,632, with the size of the finest grid cell being 3.3 × 3.3 × 1.0 m. The calculation period ranged from 6:00 p.m. on 22 August 2010, to 12:00 p.m. on 23 August 2010, including a 6-h spin-up period for which the data were not used in the analysis.

3.2. Boundary Conditions

Lateral boundary conditions of the wind velocity, air temperature, and pollutant concentrations were derived from the weather research and forecasting (WRF) model and the community multiscale air quality (CMAQ) modeling system, the same as in Gonzalez Olivardia et al. [13]. The physics parameterizations and input data for WRF/CMAQ were the same as those used by Shimadera et al. [36]. Emission data for CMAQ were produced from the same datasets as those used by Uranishi et al. [37].
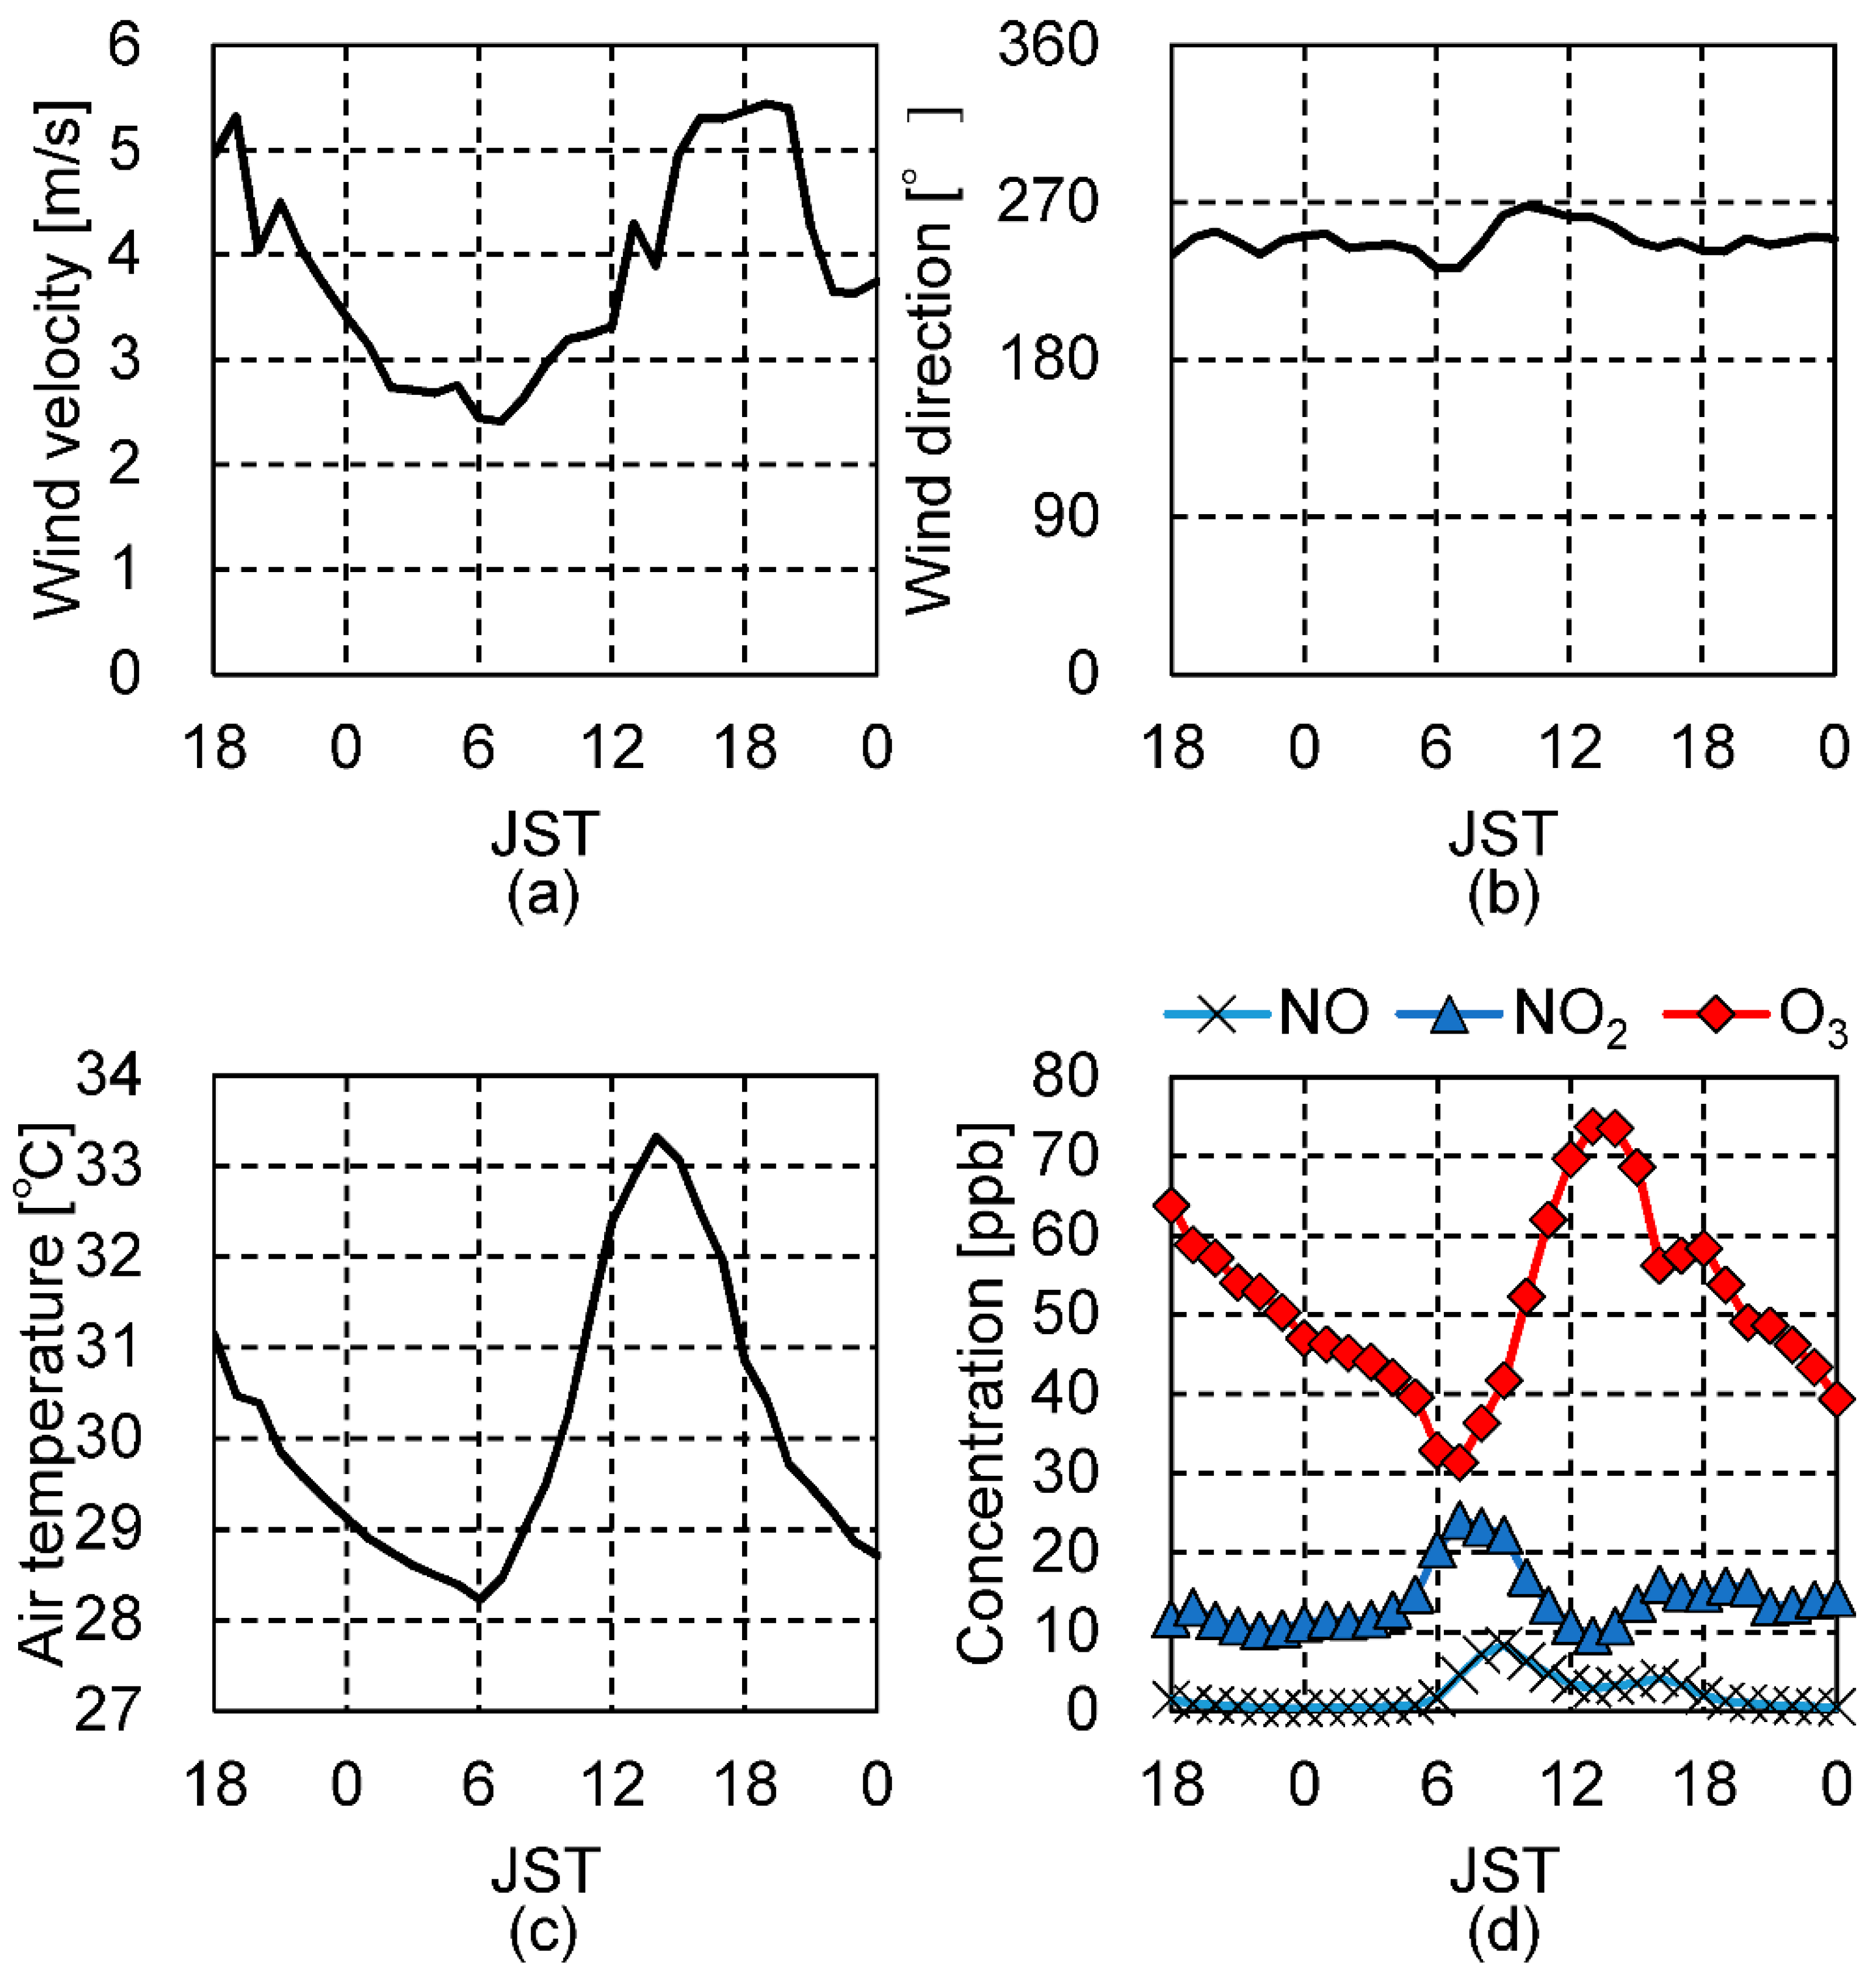
The grid resolution of WRF/CMAQ is courser than that of the CFD model. Therefore, in order to consider the vertical variation of boundary conditions, interpolation based on Monin–Obukhov similarity theory was applied for the temperature and velocity, and that based on linear interpolation was applied for pollutant concentrations. The diurnal variations of wind velocity, air temperature, and concentrations of NO, NO2, and O3 are shown in Figure 2.
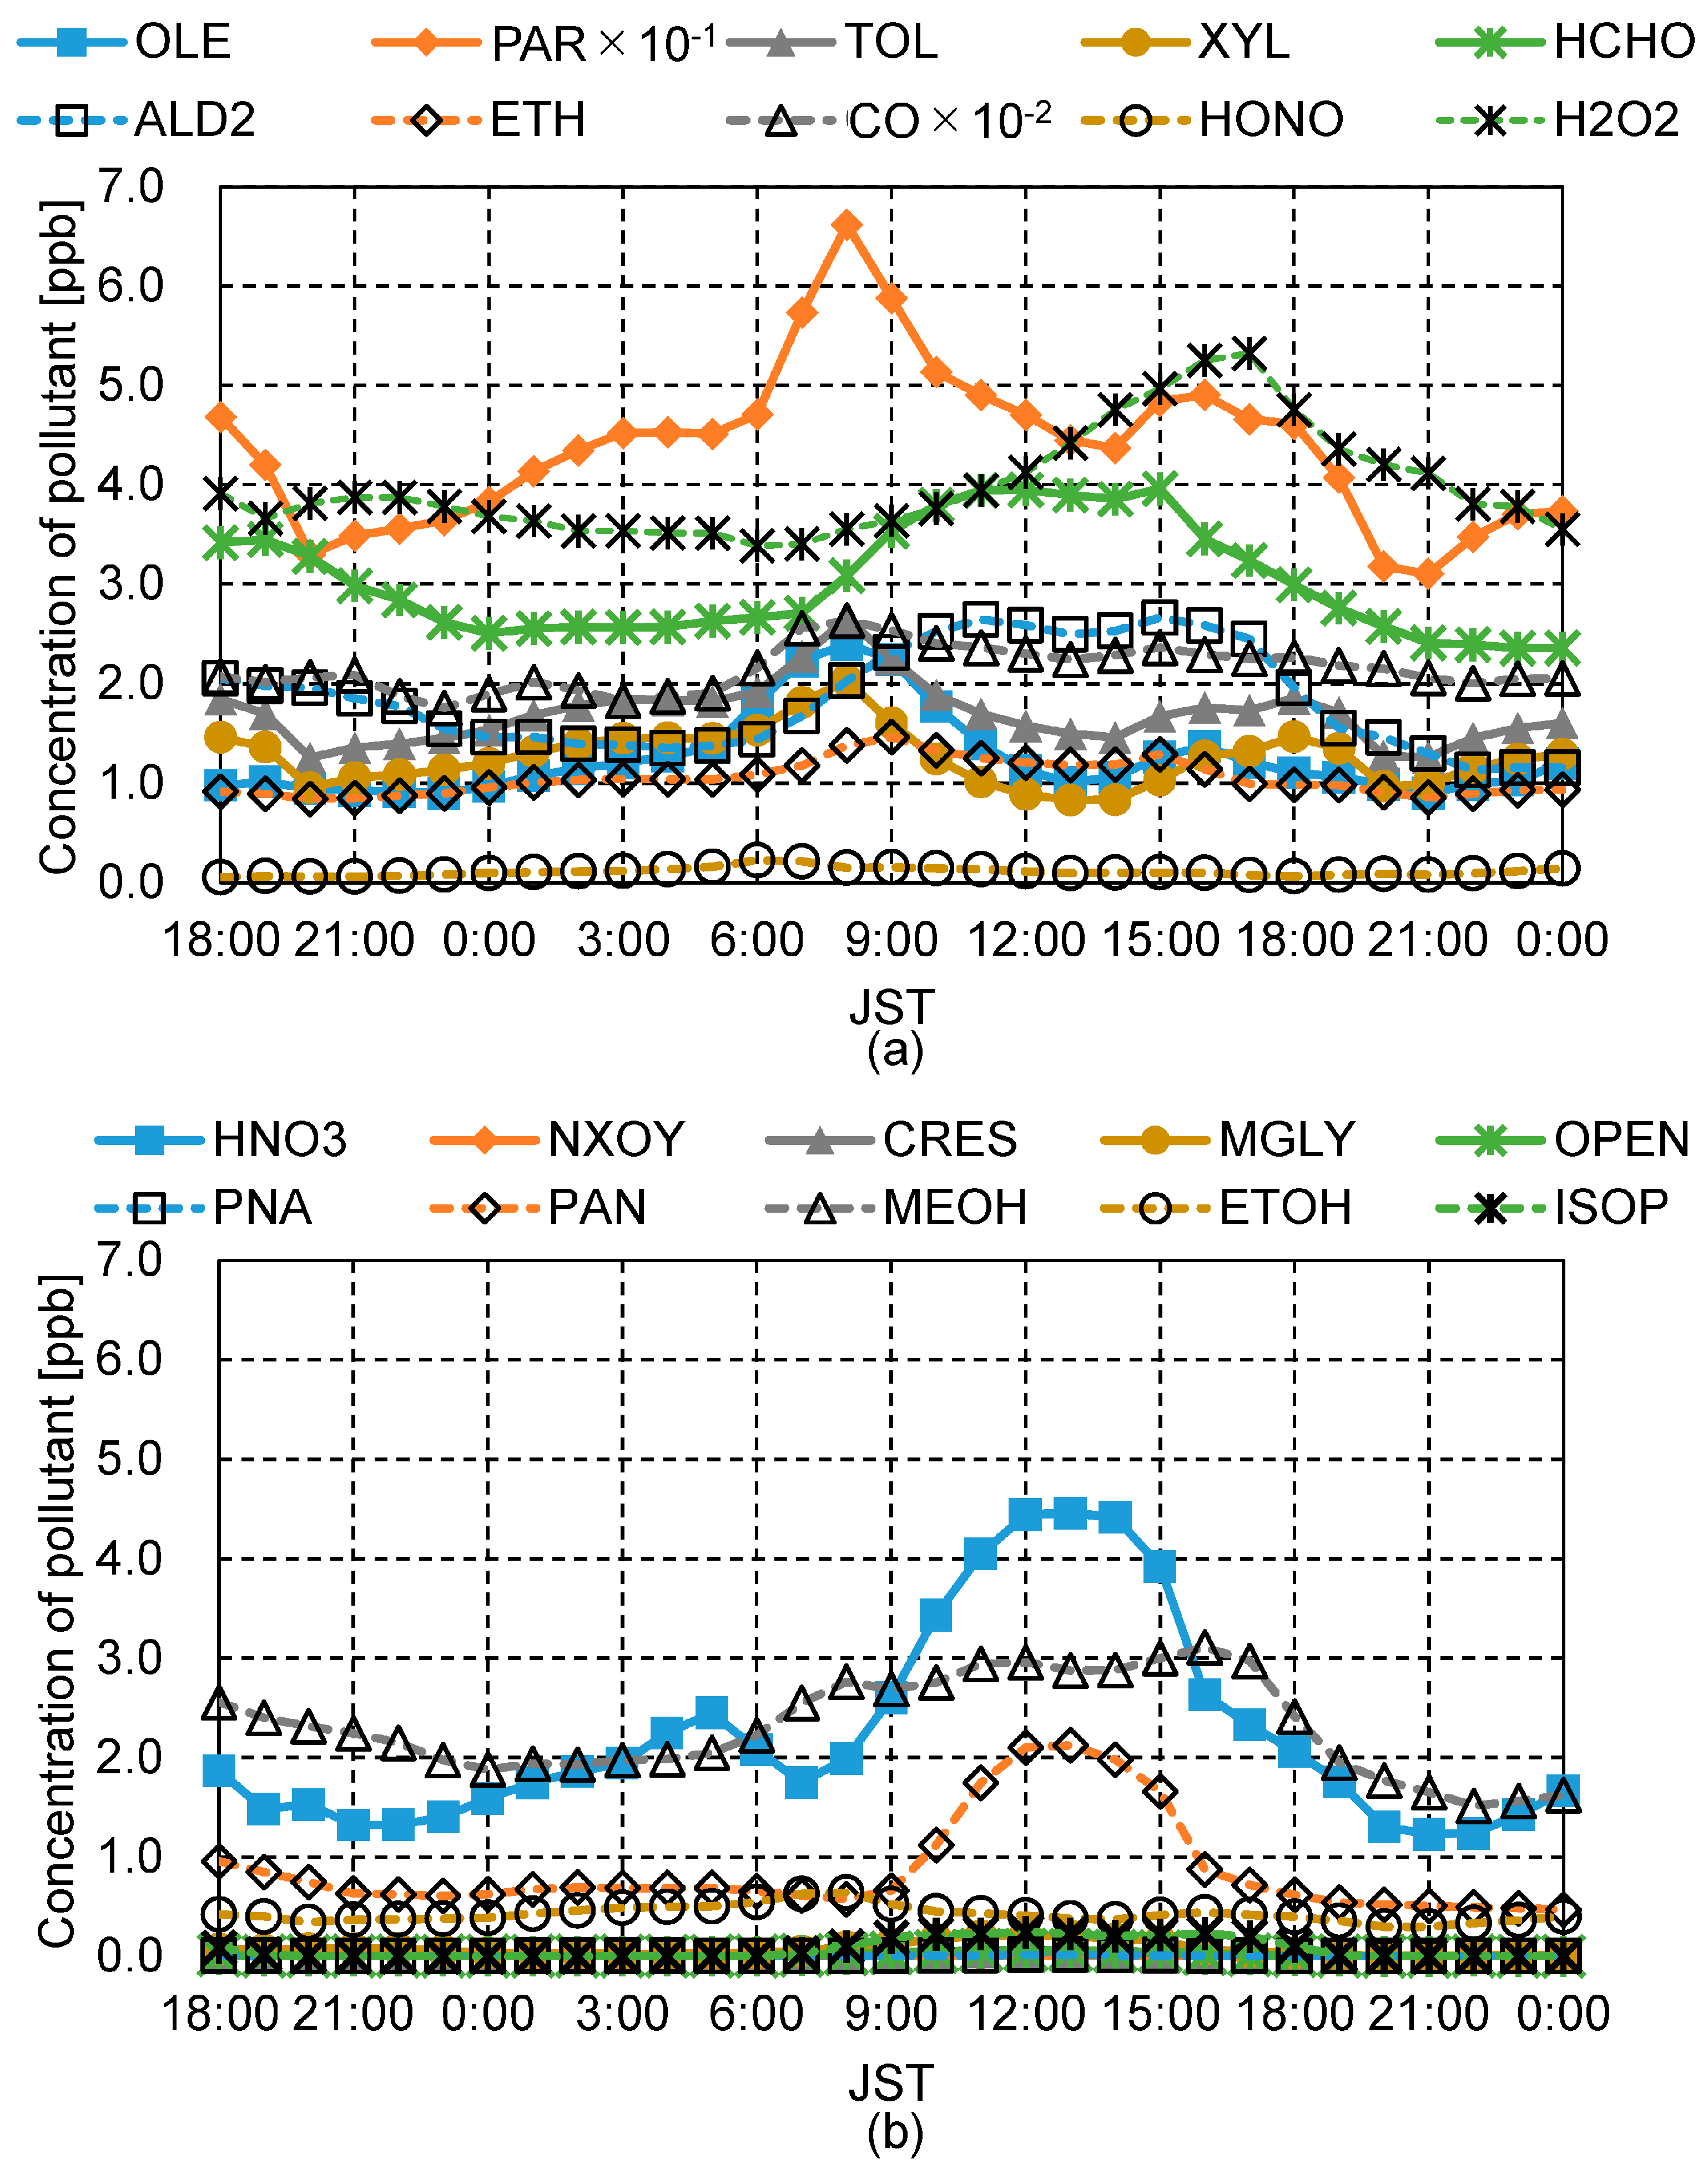
The boundary concentration of the other species such as VOCs are shown in Figure A1. In addition, the list of short names of considered species is shown in Table A1. The wind was relatively weak in the morning and strong in the evening. The wind direction was almost western throughout the target period. The air temperature reached minimum and maximum values at 6:00 and 14:00, respectively. The area was clear from clouds throughout the target period.
In this study, the radiation was omitted in the temperature calculation. Thus, the air temperature was mainly determined by only the lateral boundary conditions, and this might have led to some minor errors. According to the research of Chew et al. [8], however, full-scale field measurements showed a negligible thermal effect on the flow field in the canyon. On the other hand, the impact of solar radiation on the photolysis reaction was taken into an account in this study. It was calculated by determining if direct solar radiation was present in each calculation grid, in which the solar position and building shapes were taken into account. In a building shadow, only the diffuse solar radiation contributed to the photolysis reactions.
The amounts of the pollutants emitted from the vehicles were estimated from the Japan Auto-Oil Program (JATOP) Emission Inventory Data Base (JEI-DB) [38] (Figure 3 for NO and NO2; Figure A2 for the other pollutants). The pollutants were assumed to be emitted at heights ranging from 0 m to 2 m, and the emission rate was the same on each road. The emission rate was highest at 9:00 because of the rush hour traffic.

3.3. CFD Tool Setup

The CFD model was developed based on Open Source Field Operation and Manipulation (OpenFOAM) version 4, the open source CFD tool box. All of the governing equations were discretized by the finite volume method. The 2nd order upwind scheme (linear upwind scheme) was used for discretization of the divergence of wind velocity, and the 1st order upwind scheme was used for that of others. The 2nd order central difference scheme was used for discretization of the gradient. In addition, as a pressure–velocity calculation procedure, the PIMPLE algorithm, the combination of SIMPLE [39] and PISO [40] algorithms, was used.

3.4. Calculation Cases

In this study, four calculations were conducted. In the “noChem” case, no chemical/photochemical reactions and tree model were implemented. In the “Base” case, chemical reactions were considered by CBM-IV models, but the tree model was not employed. In the “TreeS” and “TreeD” cases, trees were planted along the road, and the chemical reactions also were considered. In the two tree cases, the leaf area density (LAD) of the tree canopies differed. Specifically, the values of LAD in TreeS (sparse) and TreeD (dense) were 0.42 and 1.59, respectively.

4. Results and Discussion

4.1. Impact of the Aerodynamic Effect of Trees on the Flow Field

Figure 4 and Figure 5 show the flow fields at z = 3.0 m height for each of the cases and stream tracers around the analysis domain, respectively (the figures of the noChem case were omitted because the results were identical to those of the Base case). The boundary condition of the wind direction was almost always westerly (Figure 2b). Therefore, in the canyon, the wind mainly came from the gaps between buildings on the west side and from the south of the canyon; the wind flowed in the north direction in accordance with the orientation of the main street. In addition, the wind velocity within the canyon changed in accordance with the wind velocity outside the canyon. When the wind velocity was large (e.g., at 20:00), the main stream could be observed more clearly. The stream tracers for each flow field are shown in Figure 5. As shown in the figure, differences between the flow field with low wind velocity (9:00 and 12:00) and that with high wind velocity (20:00) existed. When the wind speed outside of the canyon was low, there was a large eddy in the southern part of the canyon, and wind that came from the gaps between buildings blew down the street to the northern part of the canyon. When the wind speed was high, there was a main stream along the east half of the street.
By comparing the cases, it was found that the wind speed was larger in the Base case than that of the TreeS and TreeD cases because there were no tree canopies that decelerated the flow in the Base case (Figure 5). The dense tree canopy (TreeD) led to a lower wind speed than the sparse canopy (TreeS). In most cases, only a slight impact of the tree canopy on the flow pattern was observed. When the wind velocity was largest (20:00), however, the tree canopy showed a large influence on the flow pattern, in which the tree canopy interrupted the wind that typically penetrated the west side walkway. On the one hand, this interruption caused poor ventilation in the walkway on the west side of the canyon, while on the other hand, it may protect pedestrians from the pollutants emitted on the roadway. In order to clarify the impact of tree canopies on the pedestrian-level air quality, pollutant concentration fields should be evaluated.

4.2. Impact of the Chemical Reactions on Pedestrian-Level Pollutant Concentrations

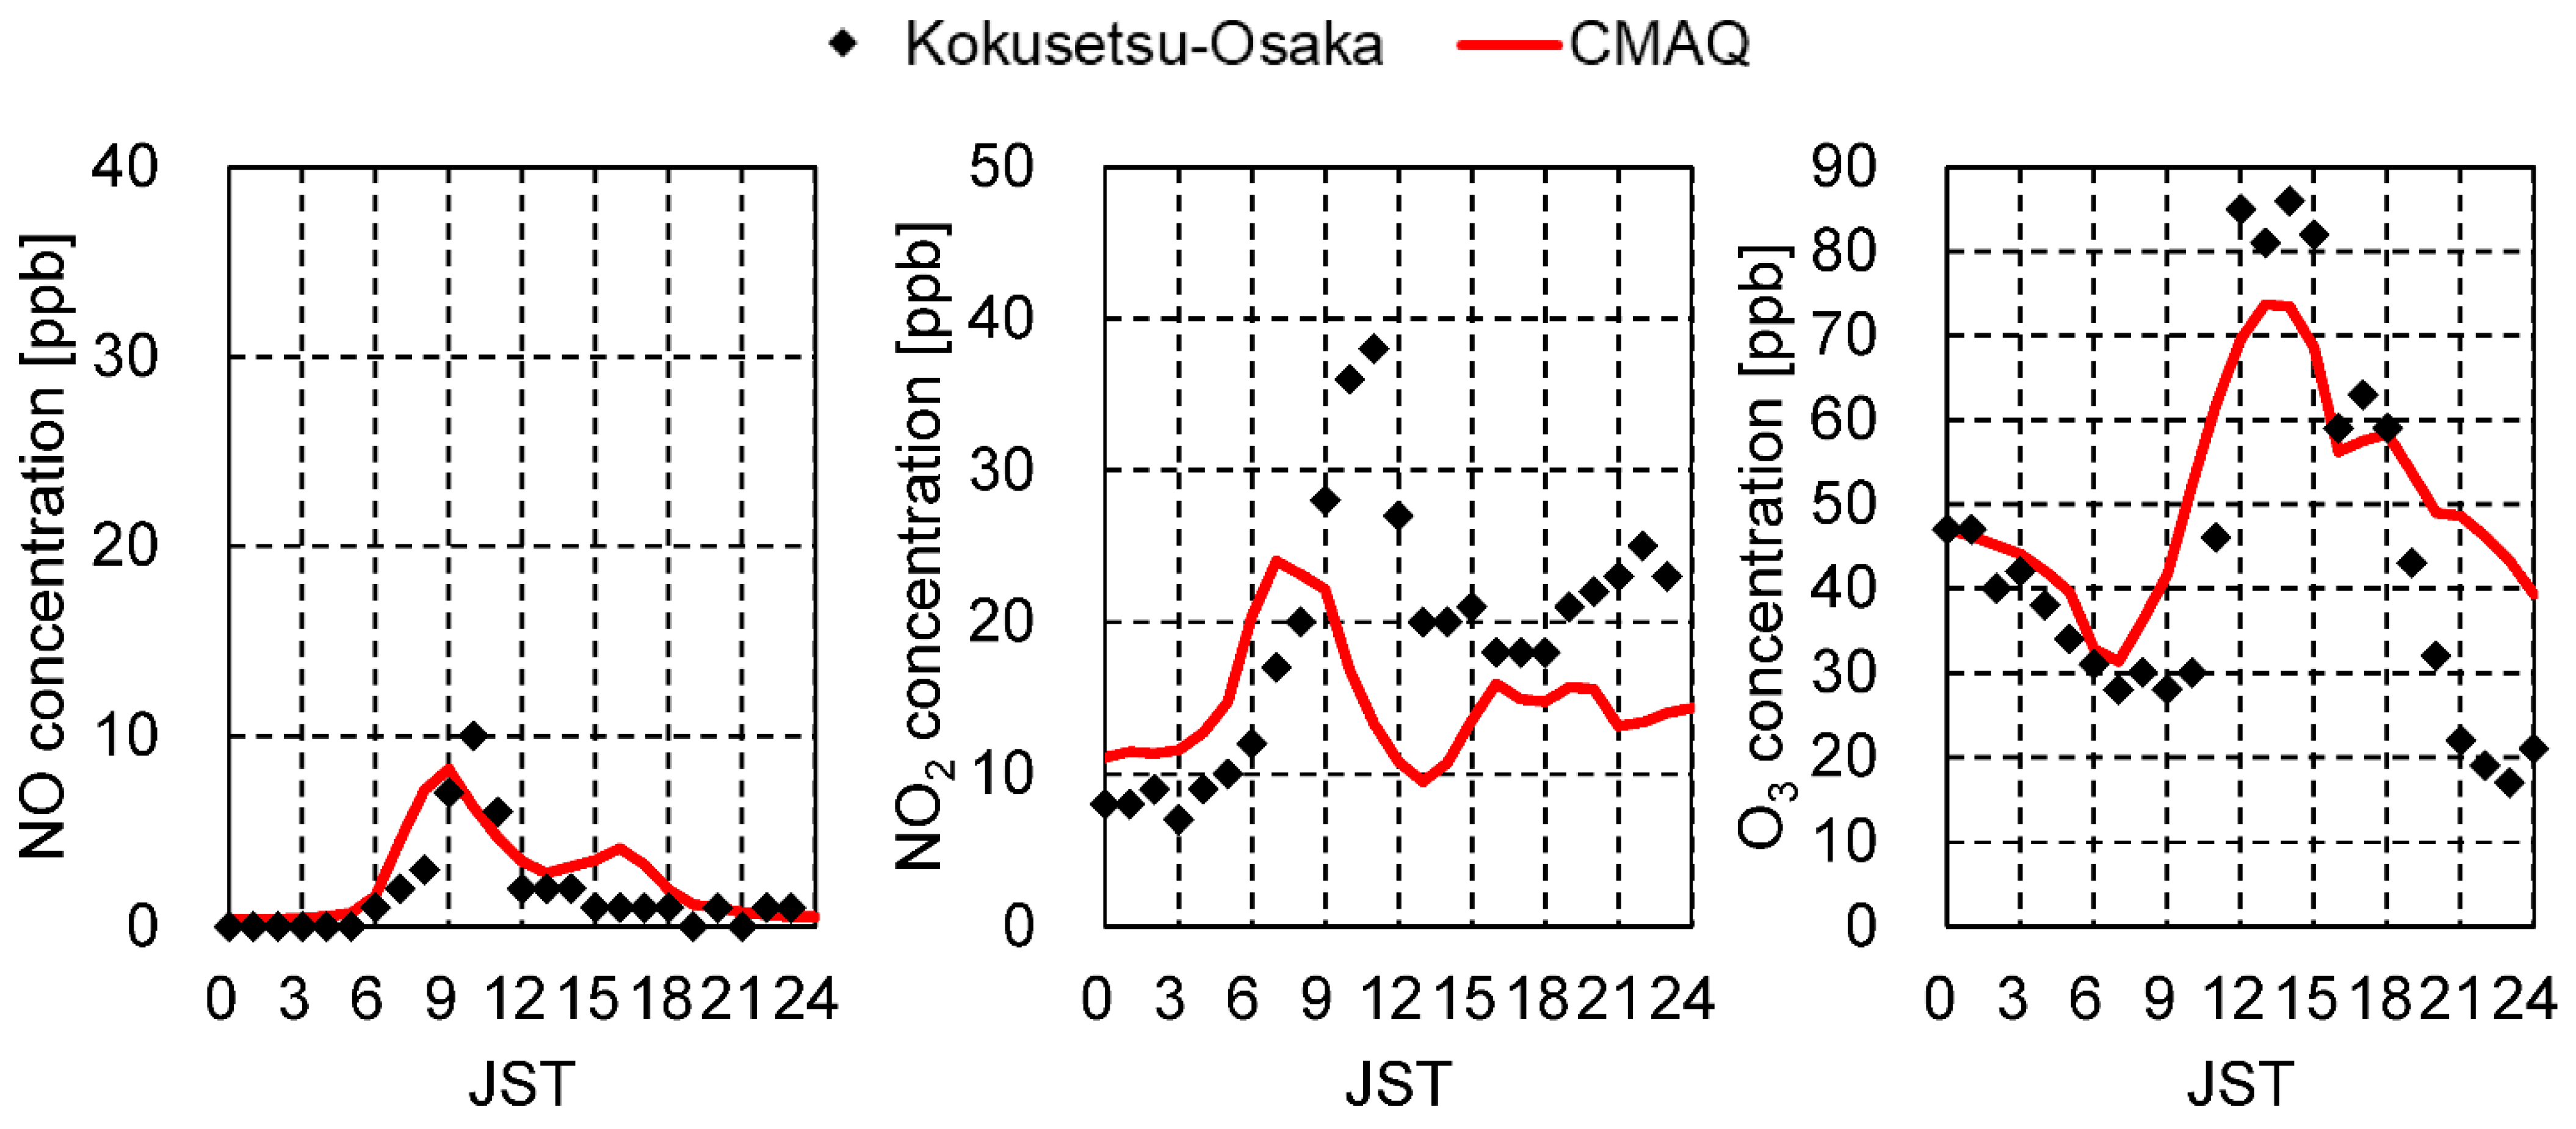
In order to validate the model, the model results were compared to the observed data. Figure 6 shows the time series of NO, NO2, and O3 concentration outside the canyon. The observation data was obtained at Kokusetsu-Osaka station locating 4 km east-southeast of analysis domain, and the station indicate the pollutants concentration in ambient (not in roadside). According to Figure 6, CMAQ calculation shows roughly good agreement with Kokusetsu-Osaka data, while NO2 concentration was underestimated from 9:00 to 15:00. This discrepancy affected the CFD results because CMAQ results were used as the lateral boundary conditions for CFD calculation.
Figure 7 shows the time series of NO, NO2, and O3 concentration in the canyon. The observation data was obtained at Umeda-Shinmichi station located at east side of the main street (Figure 1). The observed data of O3 is missing because O3 is not observed at Umeda-Shinmichi station. CFD results (Base, noChem, TreeS, and TreeD) shows better agreement than those of air quality model (CMAQ). The NOx (NO + NO2) concentration was underestimated because of the boundary NO2 concentration (Figure 6). Considering this shortage of NO2 concentration at the boundary, in Base, TreeS, and TreeD cases, NO2 concentration was a little overestimated in contrast to the underestimation of NO, which might indicate that the titration reaction occurs a little excessively in these cases.
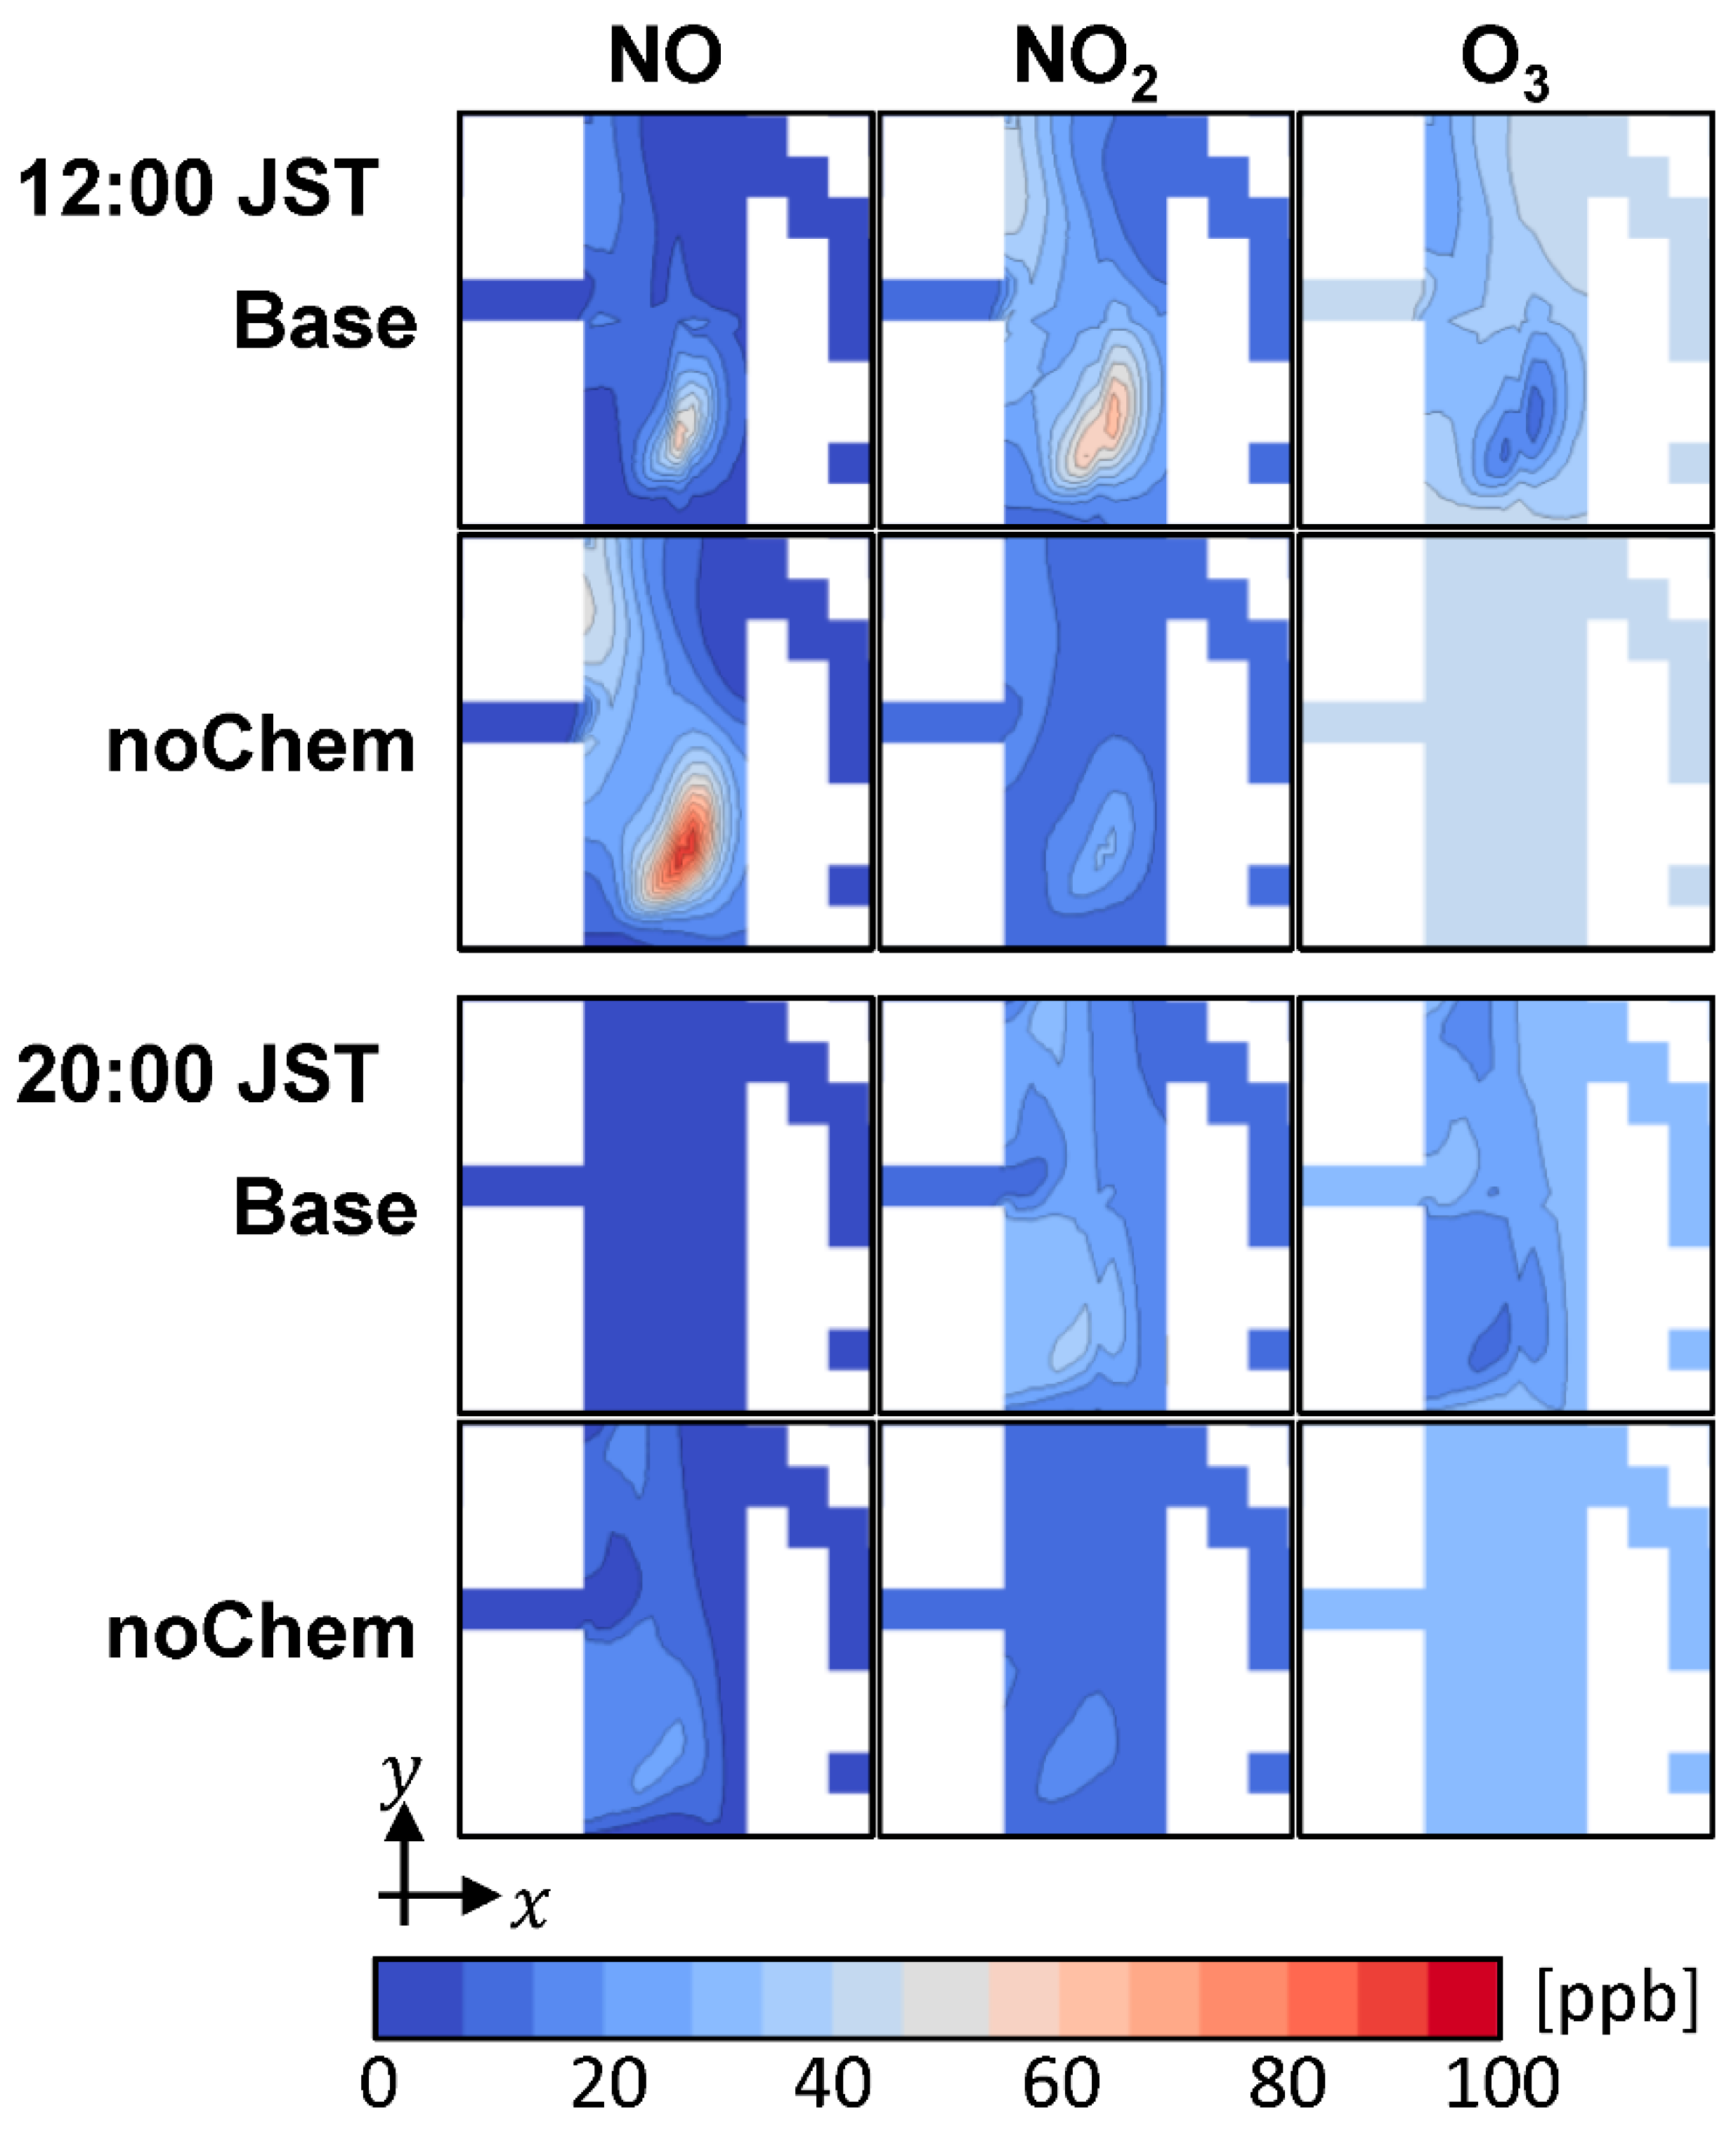
Figure 8 shows the concentration fields of NOx and O3. In the noChem case, the NO concentration was much higher than the NO2 concentration because the NOx emissions from the roadway consisted mostly of NO as shown in Figure 4. In addition, the O3 concentration was almost the same as that of the boundary condition in the noChem case because there was no source of O3 in the canyon. In contrast, high NO2 concentrations and low O3 concentrations were observed in the Base case because of the titration reaction of NO and O3 that occurred, which is expressed by Equation (16).
By comparing the data for 12:00 and 20:00 in the Base case, it was found that the NO concentration at 20:00 was much lower than that at 12:00, which indicates that NO generation due to the photolysis reaction of NO2 might play an important role that offsets the titration reaction effect to some degree. In the daytime, the photolysis reaction occurs and converts NO2 into NO and O3 (Equations (17) and (18)). In the nighttime, however, the photolysis reaction does not occur because of the lack of sunlight, so the titration reaction has more of a dominant impact on the NOx and O3 concentrations at this time.

4.3. Impact of the Trees on Pedestrian-Level Pollutant Concentrations

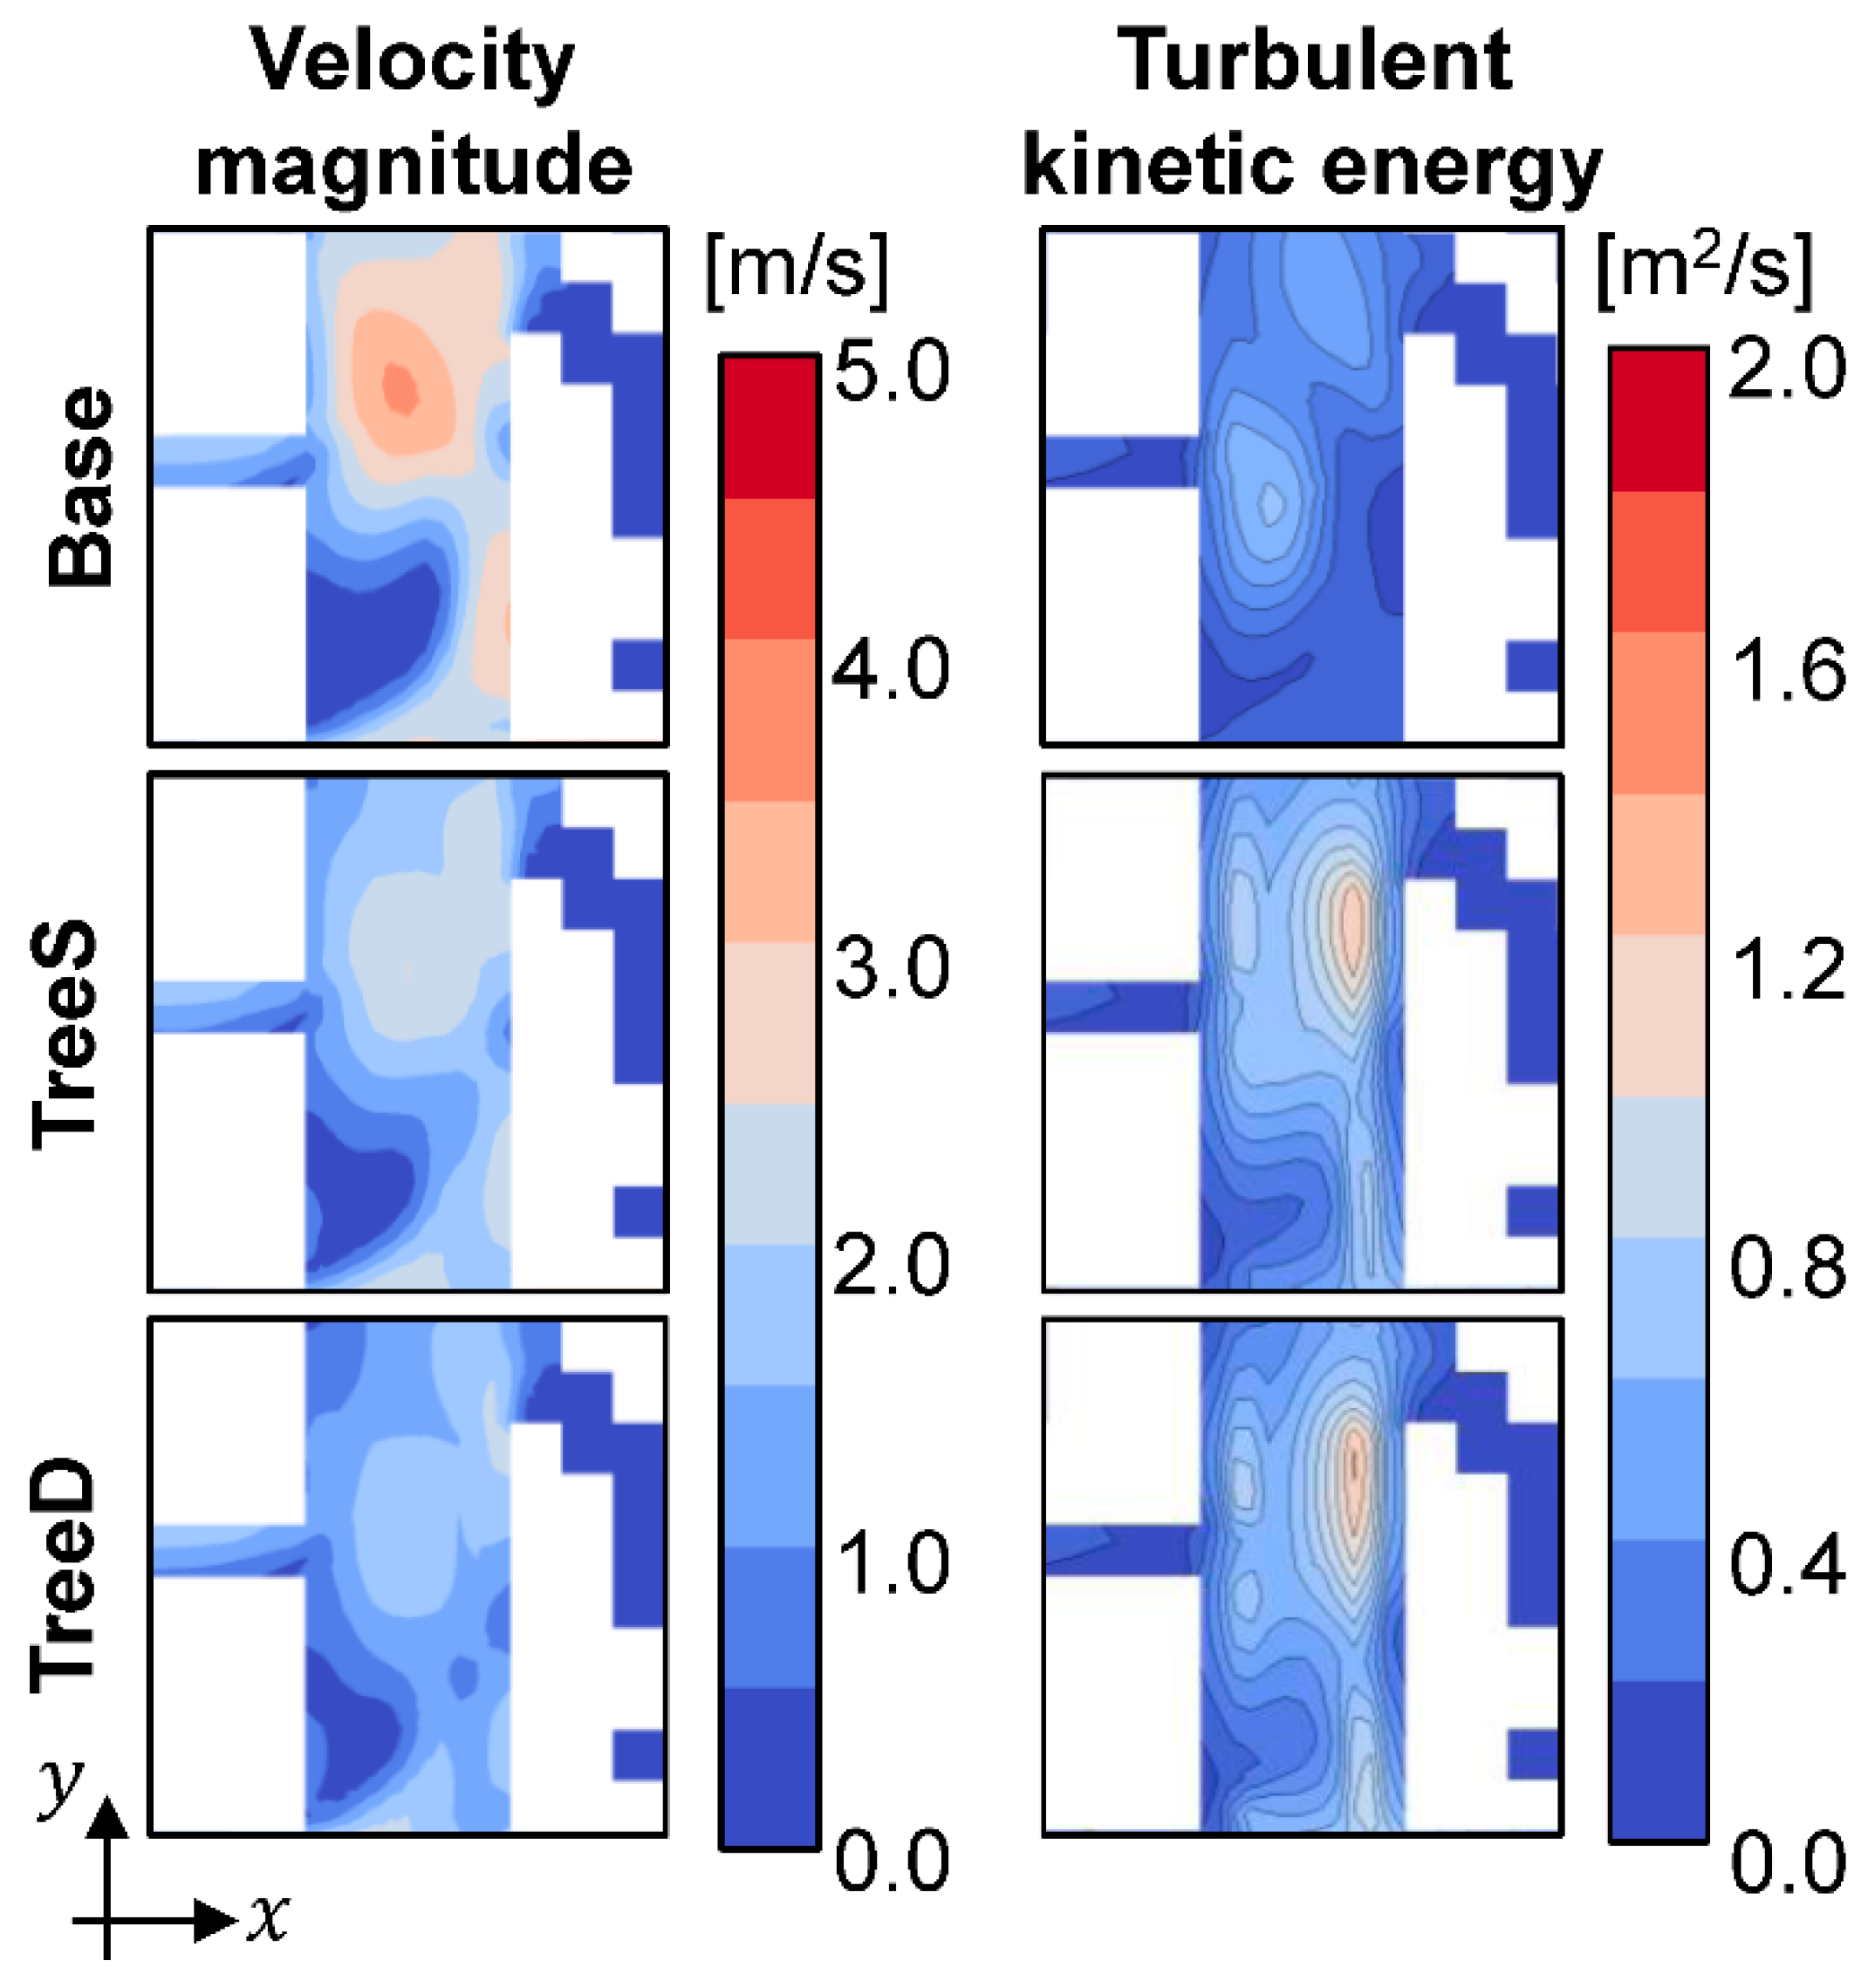
The distributions of the wind velocity magnitude and turbulent kinetic energy (TKE) in the canyon are shown in Figure 9. Since tree canopies not only decelerate the wind velocity, but also influence the kinematic energy (Equation (15)), the turbulent kinetic viscosity and turbulent diffusion coefficient are also enlarged (Equations (6) and (10)). As shown in Figure 9, in the TreeS and TreeD cases, a lower wind speed and higher TKE were observed than those in the Base case. In addition, the TreeD case showed a lower wind speed and higher TKE than those in the TreeS case. Therefore, in the Tree cases, the average NOx concentration was higher as a result of the lower wind speed, and its distribution was more moderate (lower peak value) due to the higher TKE than in the Base case (Figure 10). In addition, the NO/NO2 ratio became lower in TreeD case than in TreeS case. This indicates that the contribution of chemical reaction is larger in TreeD case because of the lower wind speed.
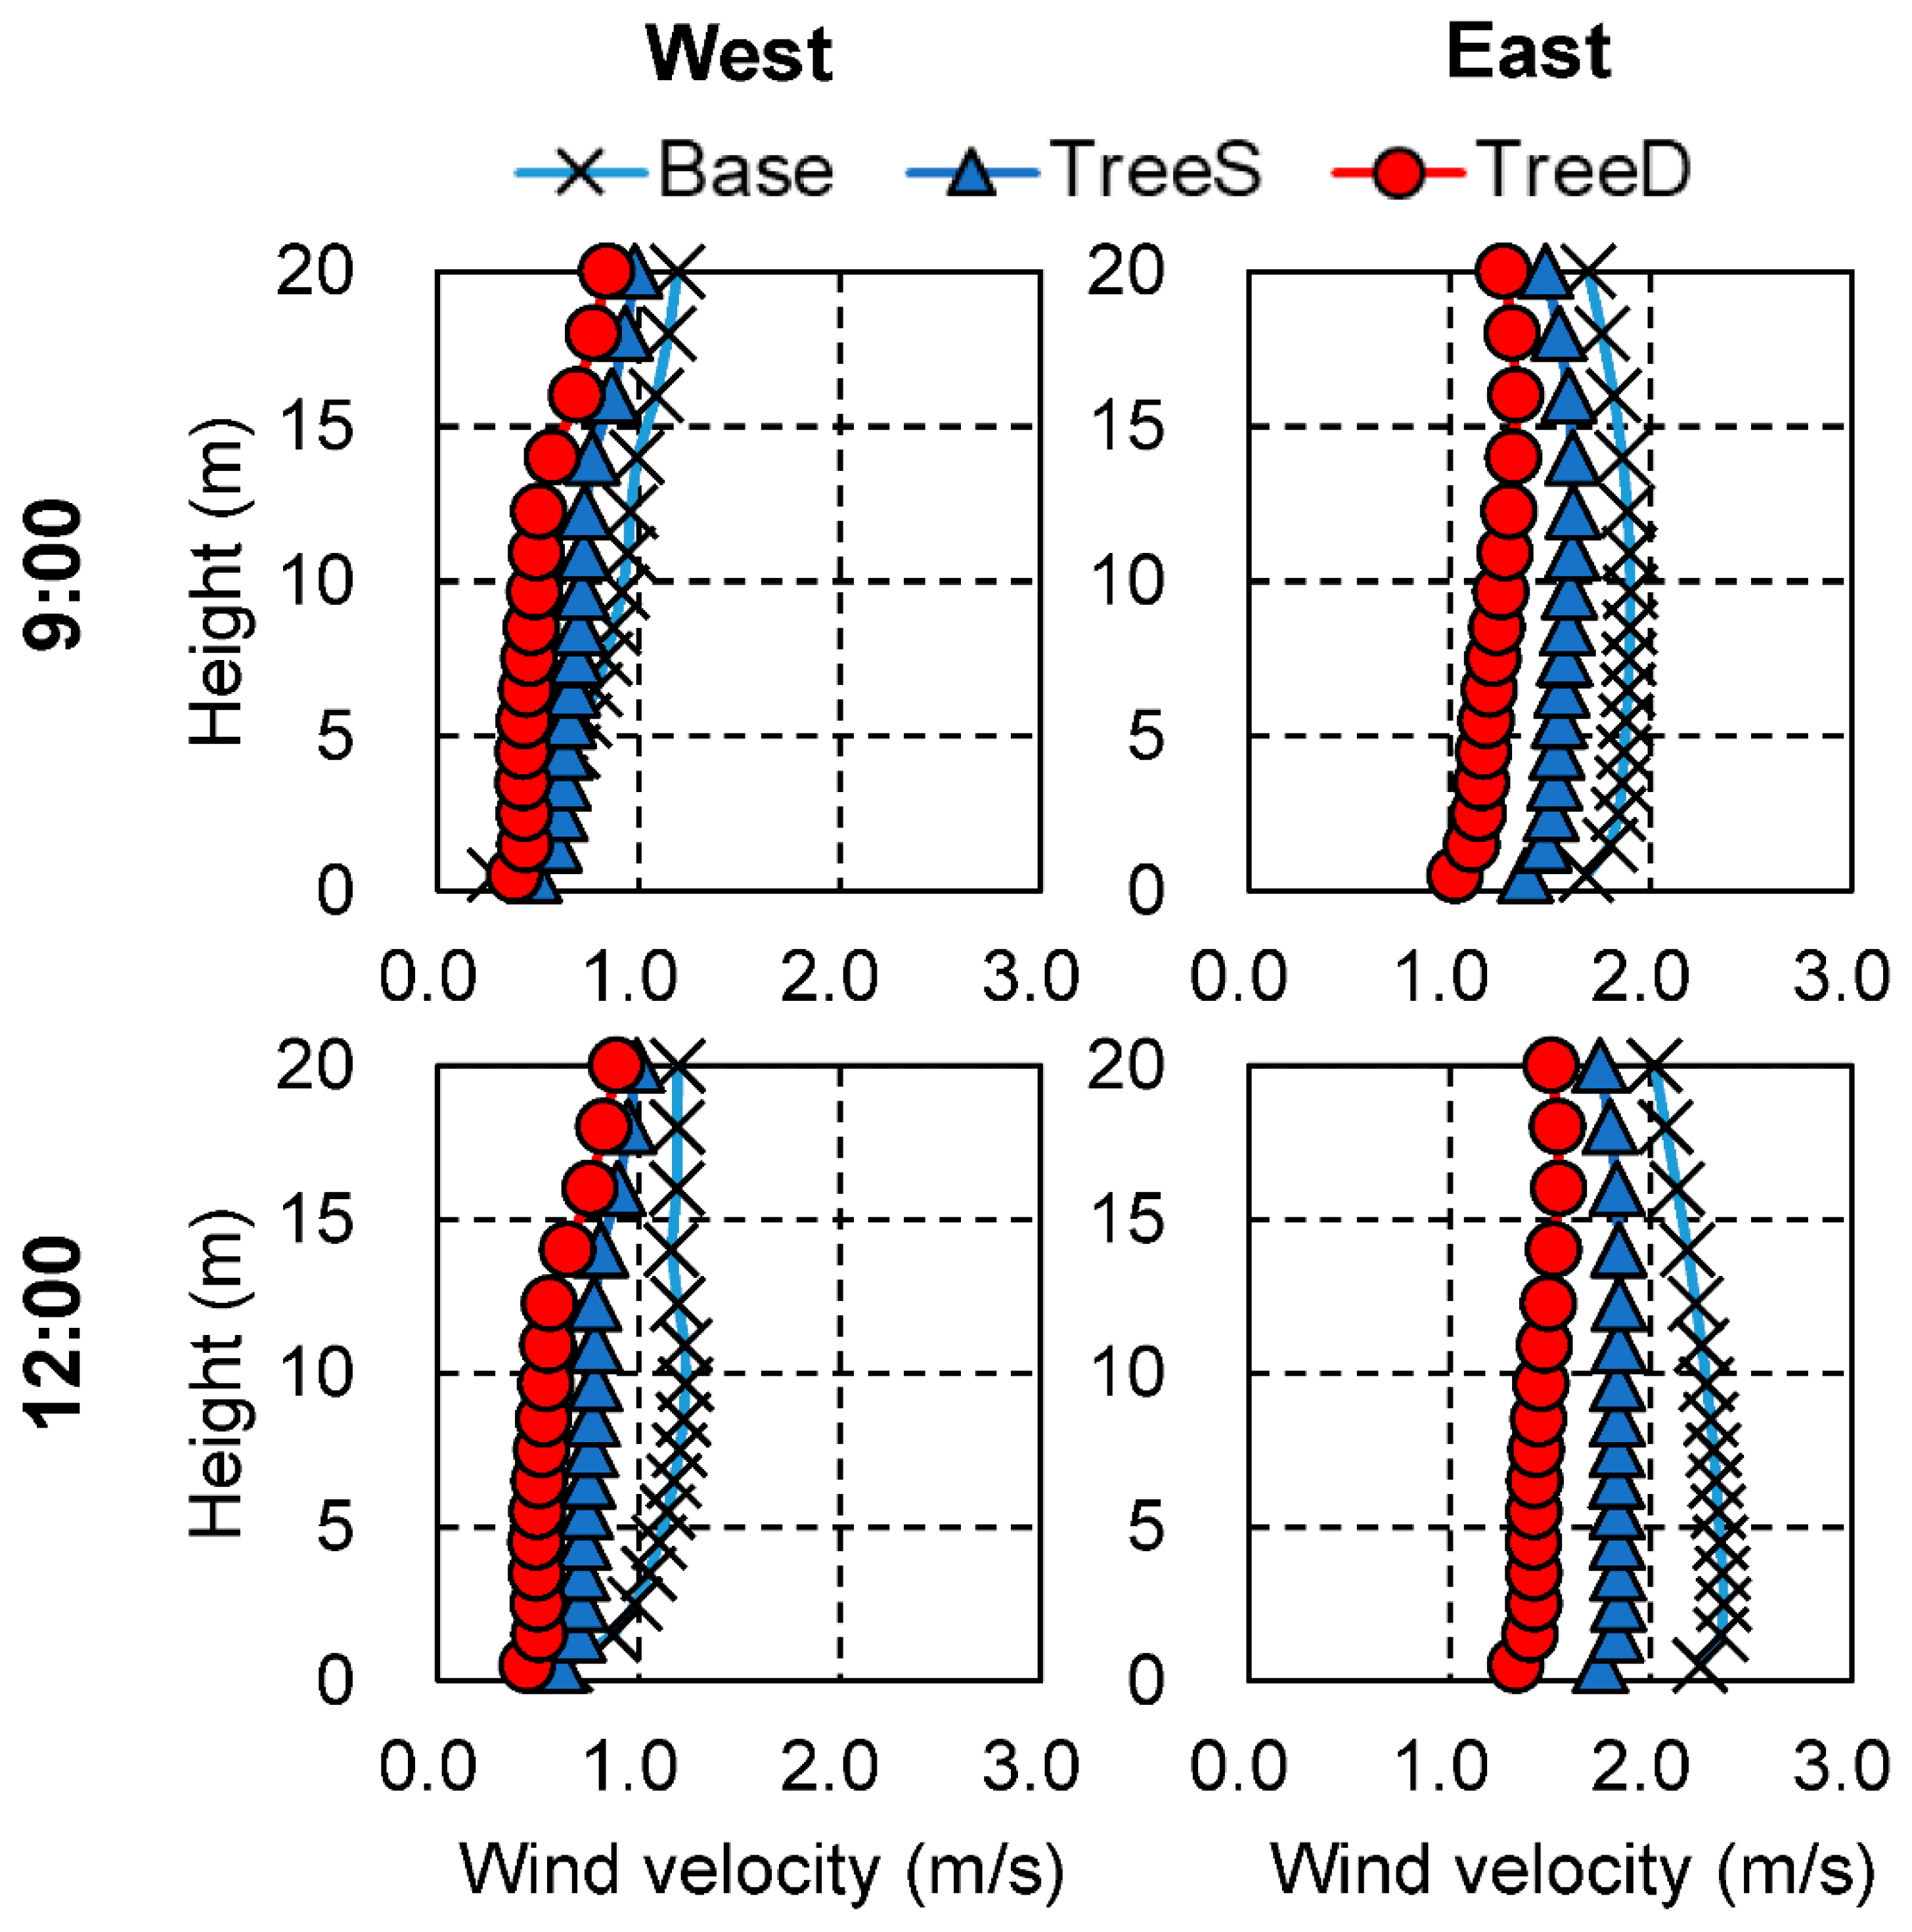
Vertical profiles of the velocity magnitude in the Base, TreeS, and TreeD cases are shown in Figure 11. The tree canopy almost always weakened the wind in the canyon. In addition, larger LAD values led to more significant differences.
Vertical profiles of pollutant concentrations in the Base case are shown in Figure 12. The vertical profiles were obtained separately for the west and east sidewalk. Figure 12 also shows the concentration difference between the Base case and Tree cases. In the TreeS and TreeD cases, the NOx (NO + NO2) concentration at z = 3.0 m on the west sidewalk at 12:00 was higher than that in the Base case by 14.5 ppb and 23.2 ppb (21% and 33%), respectively. In TreeD case, in addition to the larger increase of NOx concentration, larger decrease of O3 concentration was also occurred, because the lower wind speed causes stagnation of pollutants and provide a chance of chemical reaction. On the other hand, the NOx concentration on the east side was lower in the TreeS and TreeD cases than that in the Base case by 5.6 ppb and 5.9 ppb (10% and 11%), respectively.
The impact of tree canopy on the wind velocity is larger in the east sidewalk than in the west sidewalk, and larger at 12:00 than at 9:00 (Figure 11). The concentration difference, however, is larger in the west sidewalk or at 9:00. These results indicate that the impact of tree canopy on the pollutant concentration is more important in the domain in which the wind speed is relatively small.
The difference between the Base and Tree case became highest at 9:00, when the emission rate was highest during the day (Figure 4). As shown in Figure 12, NOx concentrations on the west sidewalk were higher in the TreeS and TreeD cases than that in the Base case by 28.3 ppb and 45.8 ppb (32% and 51%), respectively. The NOx concentrations on the east sidewalk were lower in the TreeS and TreeD cases than that in the Base case by 5.6 ppb and 5.9 ppb (10% and 11%), respectively. At higher LAD values of the tree canopy, the effect of the tree canopy became larger.
In accordance with these results, it was concluded that the effect of planting trees along the road to prevent road emissions of reactive pollutants from entering the sidewalk would be minor because of the trees also increase the pollutant concentrations by weakening the wind.

5. Conclusions

In this study, the behavior of NOx and O3 as reactive pollutants in a realistic street canyon was investigated by using a CFD model coupled with a chemical reaction model and tree canopy model.
Through the results of the numerical experiments designed to simulate a realistic urban street canyon, it was found that chemical reactions have a dominant impact on the NO/NO2 ratio and O3 concentration. In the canyon, the emitted NO was rapidly reacted with O3 and converted to NO2, therefore the NO concentration in the canyon was low except during daytime when the photolysis reaction rapidly occurs.
While the tree canopy had little impact on the NO/NO2 ratio, it had a moderate impact on the wind velocity in the canyon and the amount of NOx and O3 in the canyon, especially when the wind speed was relatively lower. The effect of tree canopy on the wind velocity depended on the flow field, and it was more significant where the wind speed was higher. On the other hand, the impact of the tree canopy on pollutants concentration was significant where the wind speed was lower, because lower wind speed caused stagnation of pollutants and provide a chance of chemical reaction
According to these findings, it can be concluded that chemical reactions and the aerodynamic effect of the tree canopy have an influential effect on the behavior of reactive pollutants in street canyons, and chemical reaction models and tree canopy models can be used to estimate roadside air pollution more accurately. In addition, in future work, the model should be improved to deal with other pollutants such as particulate pollutions to evaluate roadside air pollution more comprehensively.

Author Contributions

Conceptualization, A.K. and T.M.; methodology, F.G.G.O. and T.M.; software, T.M. and H.S.; validation, F.G.G.O. and T.M.; formal analysis, F.G.G.O. and T.M.; writing—original draft preparation, T.M.; writing—review and editing, F.G.G.O. and H.S; supervision, A.K. All authors have read and agreed to the published version of the manuscript.

Funding

This research received no external funding.

Institutional Review Board Statement

Not applicable.

Informed Consent Statement

Not applicable.

Data Availability Statement

The observed data presented in this article can be found here: http://soramame.taiki.go.jp/DownLoad.php (in Japanese). The emission data presented in this article was obtained from the Japan Petroleum Energy Center (JPEC) and are available from https://www.pecj.or.jp/en/ with the permission of JPEC.

Conflicts of Interest

The authors declare no conflict of interest.

Appendix A

The boundary condition and emission intensity are shown here.
Table A1. The list of chemical substances and their short names.
SpeciesShort Names
Nitric oxideNO
Nitrogen dioxideNO2
Nitrogen oxideNXOY
Nitrous acidHONO
Nitric acidHNO3
Peroxynitric acidPNA
OzoneO3
Hydrogen peroxideH2O2
Carbon monoxideCO
FormaldehydeHCHO
High molecular weight aldehydes (RCHO, R>H)ALD2
Peroxyacyl nitratePAN
Paraffin carbon bondPAR
Olefinic carbon bondOLE
EtheneETH
TolueneTOL
Cresol and higher molecular weight phenolsCRES
High molecular weight aromatic oxidation ring fragmentOPEN
XyleneXYL
MethylglyoxalMGLY
IsopreneISOP
MethanolMEOH
EthanolETOH
Figure A1. (a,b)Diurnal variation of pollutants concentrations at a height of around 29 m (the center of the first layer of the WRF/CMAQ grids) from 18:00 on August 22 to 24:00 on 23 August 2010.
Atmosphere 12 00034 g0a1
Figure A2. Emission rate of pollutants except NOx from 18:00 August 22 to 24:00 23 August 2010.
Atmosphere 12 00034 g0a2

References

  1. Leung, K.K.; Liu, C.H.; Wong, C.C.C.; Lo, J.C.Y.; Ng, G.C.T. On the Study of Ventilation and Pollutant Removal Over Idealized Two-Dimensional Urban Street Canyons. Build. Simul. 2012, 5, 359–369. [Google Scholar] [CrossRef]
  2. Li, X.X.; Leung, D.Y.C.; Liu, C.H.; Lam, K.M. Physical Modeling of the Flow Field Inside Urban Street Canyons. J. Appl. Meteorol. Clim. 2008, 47, 2058–2067. [Google Scholar] [CrossRef]
  3. Allegrini, J. A Wind Tunnel Study on Three-Dimensional Buoyant Flows in Street Canyons With different Roof Shapes and Building Lengths. Build. Environ. 2018, 143, 71–88. [Google Scholar] [CrossRef]
  4. Li, Z.; Zhang, H.; Wen, C.Y.; Yang, A.S.; Juan, Y.-H. Effects of Height-Asymmetric Street Canyon Configurations on Outdoor Air Temperature and Air Quality. Build. Environ. 2020, 183, 107195. [Google Scholar] [CrossRef]
  5. Reiminger, N.; Vazquez, J.; Blond, N.; Dufresne, M.; Wertel, J. CFD Evaluation of Mean Pollutant Concentration Variations in Step-Down Street Canyons. J. Wind Eng. Ind. Aerodyn. 2020, 196, 104032. [Google Scholar] [CrossRef]
  6. Allegrini, J.; Dorer, V.; Carmeliet, J. Buoyant Flows in Street Canyons: Validation of CFD Simulations with Wind Tunnel Measurements. Build. Environ. 2014, 72, 63–74. [Google Scholar] [CrossRef]
  7. Cui, P.Y.; Li, Z.; Tao, W.Q. Wind-Tunnel Measurements for Thermal Effects on the Air Flow and Pollutant Dispersion Through Different Scale Urban Areas. Build. Environ. 2016, 97, 137–151. [Google Scholar] [CrossRef]
  8. Chew, L.W.; Glicksman, L.R.; Norford, L.K. Buoyant Flows in Street Canyons: Comparison of RANS and LES at Reduced and Full Scales. Build. Environ. 2018, 146, 77–87. [Google Scholar] [CrossRef]
  9. Hertwig, D.; Efthimiou, G.C.; Bartzis, J.G.; Leitl, B. CFD-RANS Model Validation of Turbulent Flow in a Semi-Idealized Urban Canopy. J. Wind Eng. Ind. Aerodyn. 2012, 111, 61–72. [Google Scholar] [CrossRef]
  10. Tominaga, Y.; Stathopoulos, T. CFD Modeling of Pollution Dispersion in a Street Canyon: Comparison between LES and RANS. J. Wind Eng. Ind. Aerodyn. 2011, 99, 340–348. [Google Scholar] [CrossRef] [Green Version]
  11. Baik, J.-J.; Kang, Y.-S.; Kim, J.-J. Modeling Reactive Pollutant Dispersion in an Urban Street Canyon. Atmos. Environ. 2007, 41, 934–949. [Google Scholar] [CrossRef]
  12. Baker, J.; Walker, H.L.; Cai, X. A Study of the Dispersion And transport of Reactive Pollutants in and above Street Canyons—A Large Eddy Simulation. Atmos. Environ. 2004, 38, 6883–6892. [Google Scholar] [CrossRef]
  13. Gonzalez Olivardia, F.G.; Qi, Z.; Matsuo, T.; Shimadera, H.; Kondo, A. Analysis of Pollutant Dispersion in a Realistic Urban Street Canyon Using Coupled CFD and Chemical Reaction Modeling. Atmosphere 2019, 10, 479. [Google Scholar] [CrossRef] [Green Version]
  14. Kwak, K.-H.; Baik, J.-J. A CFD Modeling Study of the Impacts of NOx and VOC Emissions on Reactive Pollutant Dispersion in and above a Street Canyon. Atmos. Environ. 2012, 46, 71–80. [Google Scholar] [CrossRef]
  15. Kwak, K.-H.; Baik, J.-J. Diurnal Variation of NOx and Ozone Exchange between a Street Canyon and the Overlying Air. Atmos. Environ. 2014, 86, 120–128. [Google Scholar] [CrossRef]
  16. Munera, F.; Favale, G.; Vardoulakis, S.; Solazzo, E. Modelling Dispersion of Traffic Pollution in a Deep Street Canyon: Application of CFD and Operational Models. Atmos. Environ. 2009, 43, 2303–2311. [Google Scholar] [CrossRef]
  17. Launder, B.E.; Spalding, D.B. The Numerical Computation of Turbulent Flows. Comp. Methods Appl. Mech. Eng. 1974, 3, 269–289. [Google Scholar] [CrossRef]
  18. Yakhot, V.; Orszag, S.A. Renormalization Group Analysis of Turbulence. I. Basic Theory, J. Sci. Comput. 1986, 1, 3–51. [Google Scholar] [CrossRef] [Green Version]
  19. Shih, T.; Liou, W.W.; Shabbir, A.; Yang, Z.; Zhu, J. A New k-e Eddy Viscosity Model for High Reynolds Number Turbulent Flows. Comput. Fluids 1995, 24, 227–238. [Google Scholar] [CrossRef]
  20. Menter, F.R. Eddy Viscosity Transport Equations and Their Relation to the k-e Model. J. Fluids Eng. 1997, 119, 876–884. [Google Scholar] [CrossRef]
  21. Lau, G.E.; Ngan, K. Analysins Urban Ventilation in Building Arrays with the Age Spectrum and Mean Age of Pollutants. Build. Environ. 2018, 131, 288–305. [Google Scholar] [CrossRef]
  22. Antoniou, N.; Montazeri, H.; Wigo, H.; Neophytou, M.K.-A.; Blocken, B.; Sandberg, M. CFD and Wind-Tunnel Analysis of Outdoor Ventilation in a Real Compact Heterogeneous Urban Area: Evaluation Using “Air Delay”. Build. Environ. 2017, 126, 255–372. [Google Scholar] [CrossRef]
  23. Peng, Y.; Buccorieri, R.; Gao, Z.; Ding, W. Indices Employed for the Assessment of “Urban Outdoor Ventilation”—A Review. Atmos. Environ. 2020, 223, 117211. [Google Scholar] [CrossRef]
  24. Blocken, B.; Stathopoulos, T.; van Beeck, J.P.A.J. Pedestrian-Level Wind Conditions around Buildings: Review of Wind-Tunnel and CFD Techniques and Their Accuracy for Wind Comfort Assessment. Build. Environ. 2016, 100, 50–81. [Google Scholar] [CrossRef]
  25. Hiraoka, H. Modeling of Turbulent Flows within Plant/Urban Canopies. J. Wind Eng. Ind. Aerodyn. 1993, 46–47, 173–182. [Google Scholar] [CrossRef]
  26. Yamada, T. A Numerical Model Study of Turbulent Airflow in and above a Forest Canopy. J. Meteorol. Soc. Jpn. 1982, 60, 439–454. [Google Scholar] [CrossRef] [Green Version]
  27. Uno, I.; Ueda, H.; Wakamatsu, S. Numerical Modeling of the Nocturnal Urban Boundary Layer. Bound. Layer Meteorol. 1989, 49, 77–98. [Google Scholar] [CrossRef]
  28. Green, S.R. Modelling Turbulent Air Flow in a Stand of Widely-Spaced Trees. PHOENICS J. Comput. Fluid Dyn. Appl. 1992, 5, 294–312. [Google Scholar]
  29. Xue, F.; Li, X. The Impact of Roadside Trees on Traffic Released PM10 in Urban Street Canyon: Aerodynamic and Deposition Effects. Sustain. Cities Soc. 2017, 30, 195–204. [Google Scholar] [CrossRef]
  30. Jo, W.-K.; Park, J.-H. Characteristics of Roadside Air Pollution in Korean Metropolitan City (Daegu) over Last 5 to 6 Years: Temporal Variations, Standard Exceedances, and Dependence on Meteorological Conditions. Chemosphere 2005, 59, 1557–1573. [Google Scholar] [CrossRef]
  31. Gery, M.W.; Whitten, G.Z.; Killus, J.P.; Dodge, M.C. A Photochemical Kinetics Mechanism for Urban and Regional Scale Computer Modeling. J. Geophys. Res. 1989, 94, 12925–12956. [Google Scholar] [CrossRef]
  32. Kwak, K.-H.; Baik, J.-J.; Ryu, T.-H.; Lee, S.-H. Urban Air Quality Simulation in a High-Rise Building Area Using a CFD Model Coupled with Mesoscale Meteorological and Chemistry-Transport Models. Atmos. Environ. 2015, 100, 167–177. [Google Scholar] [CrossRef]
  33. Fu, X.; Xiang, S.; Liu, Y.; Yu, J.; Mauzerall, D.L.; Tao, S. High-Resolution Simulation of Local Traffic-Related NOx Dispersion and Distribution in a Complex Urban Terrain. Envion. Pollut. 2020, 263, 114390. [Google Scholar] [CrossRef] [PubMed]
  34. Varatti, G.; Fabbi, S.; Bigi, A.; Lupascu, A.; Tinarelli, G.; Teggi, S.; Brusasca, G.; Mutler, T.M.; Ghermandi, G. Towards the Coupling of a Chemical Transport Model with a Micro-Scale Lagrangian Modelling System for Evaluation of Urban NOx Levels in a European Hotspot. Atmos. Environ. 2020, 223, 117285. [Google Scholar] [CrossRef]
  35. Jose, R.S.; Perez, J.L.; Gonzalez-Barras, R.M. Assessment of Mesoscale and Microscale Simulations of a NO2 Episode Supported by Traffic Modelling at Microscopic Level. Sci. Total Environ. 2021, 752, 141992. [Google Scholar] [CrossRef] [PubMed]
  36. Shimadera, H.; Kojima, T.; Kondo, A. Evaluation of Air Quality Model Performance for Simulating Long-Range Transport and Local Pollution of PM2.5 in Japan. Adv. Meteorol. 2016, 5694251. [Google Scholar] [CrossRef] [Green Version]
  37. Uranishi, K.; Ikemori, F.; Shimadera, H.; Kondo, A.; Sugata, S. Impact of Field Biomass Burning on Local Pollution and Long-Range Transport of PM2.5 in Northeast Asia. Environ. Pollut. 2019, 244, 414–422. [Google Scholar] [CrossRef] [PubMed]
  38. Japan Petroleum Energy Center. Technical Report of the Japan Auto-Oil Program: Emission Inventory of Road Transport in Japan; JPEC-2011AQ-02-06; Japan Petroleum Energy Center (JPEC): Tokyo, Japan, 2012; p. 136. (In Japanese) [Google Scholar]
  39. Patankar, S.V.; Spalding, D.B. A Calculation Procedure for Heat, Mass and Momentum Transfer in Three-Dimensional Parabolic Flows. Int. J. Heat Mass Transf. 1972, 15, 1787–1806. [Google Scholar] [CrossRef]
  40. Issa, R.I.; Gosman, A.D.; Watkins, A.P. The Computation of Compressible and Incompressible Recirculating Flows by a Non-Iterative Implicit Scheme. J. Comput. Phys. 1986, 62, 66–82. [Google Scholar] [CrossRef]
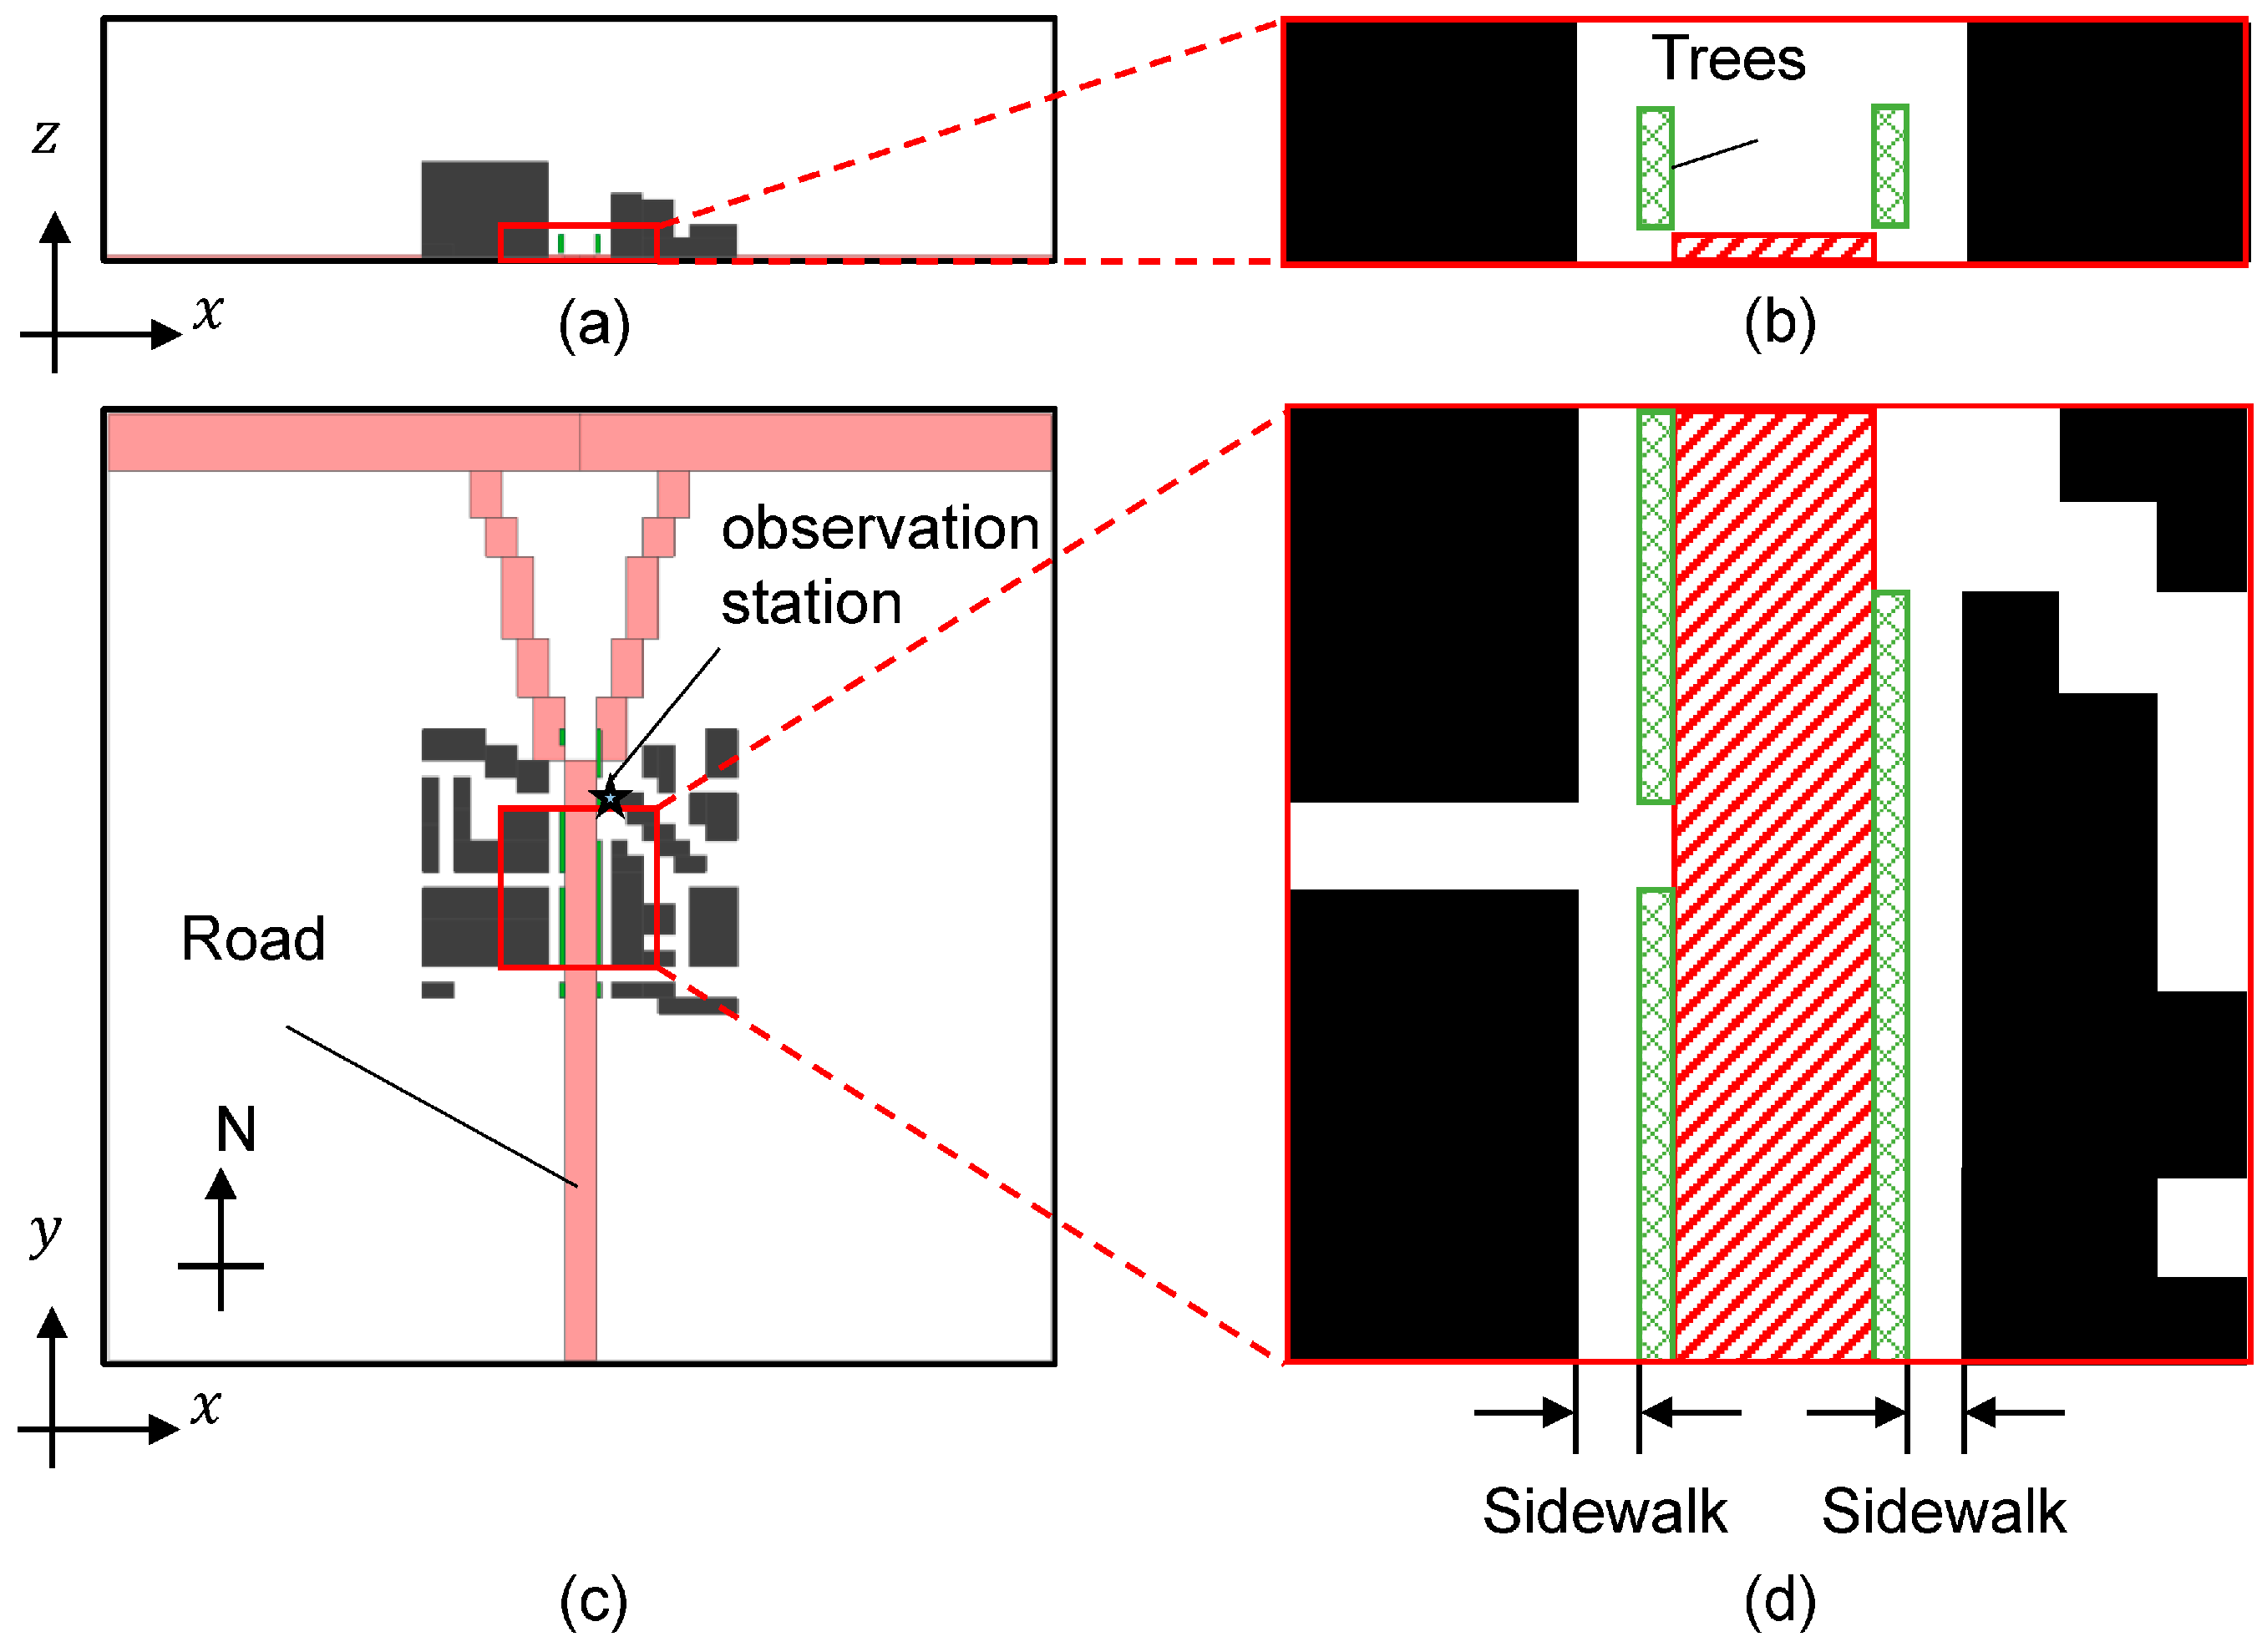
Figure 1. The lateral (a,b) and top (c,d) views of the calculation (a,c) and analysis (b,d) domains. The black, crosshatched and diagonal stripe rectangles indicate the buildings, roads and trees, respectively. Star indicates the observation station (Umeda-Shinmichi).
Atmosphere 12 00034 g001
Figure 2. Diurnal variation of wind speed (a), wind direction (b) (0° means northern wind and 90° means eastern wind), air temperature (c) and pollutants concentrations (d) at height of around 29 m (the center of the first layer of WRF/CMAQ grids) from 18:00 August 22 to 24:00 August 23, 2010. The time is shown based on Japan standard time (JST).
Atmosphere 12 00034 g002
Figure 3. NOx emission rate of road from 0:00 to 24:00 23 August 2010.
Atmosphere 12 00034 g003
Figure 4. Flow fields at a 3.0 m height at 9:00, 12:00, and 20:00 for each case.
Atmosphere 12 00034 g004
Figure 5. Stream tracers around the analysis domain at 9:00, 12:00 and 20:00 for each case (flow fields at 15:00 was omitted because these were similar to that at 20:00, respectively.).
Atmosphere 12 00034 g005
Figure 6. Time series of pollutants concentration outside the canyon. Kokusetsu-Osaka is the observation station locating 4 km east-southeast of analysis domain. CMAQ is the calculation results of CMAQ (described in Section 3.2).
Atmosphere 12 00034 g006
Figure 7. Time series of pollutants concentration inside the canyon. Umeda-shinmichi is the observation station locating in calculation domain (see Figure 1), at which O3 was not observed. CMAQ is the calculation results of CMAQ, which was used as the boundary condition of the CFD calculations.
Atmosphere 12 00034 g007
Figure 8. Pollutant concentration fields at a 3.0 m height at 12:00 and 20:00 for each case.
Atmosphere 12 00034 g008
Figure 9. Wind velocity magnitude and distributions of TKE at 12:00 at 3.0 m height for each case.
Atmosphere 12 00034 g009
Figure 10. Pollutant concentrations at 12:00 at 3.0 m height for each case.
Atmosphere 12 00034 g010
Figure 11. Vertical profiles of wind velocity that were spatially averaged in the y-direction in the analysis domain at 9:00 and 12:00 for each case.
Atmosphere 12 00034 g011
Figure 12. Vertical profiles of pollutant concentrations that were spatially averaged in the y-direction in the analysis domain at (a) 9:00 and (b) 12:00 for the Base case (upper), and vertical profiles of the pollutant concentration difference between the TreeS and Base cases (middle) and between the TreeD and Base cases (lower). The differences were calculated by subtracting the Base case concentration from the Tree case concentration.
Atmosphere 12 00034 g012
Publisher’s Note: MDPI stays neutral with regard to jurisdictional claims in published maps and institutional affiliations.