Phosphate Buffer Solubility and Oxidative Potential of Single Metals or Multielement Particles of Welding Fumes

 ,
,
Abstract
1. Introduction
2. Materials and Methods
2.1. Welding Fume-Certified Reference Materials
2.2. Phosphate Buffer Preparation
2.3. Metal Salts Preparation
2.4. Extraction of Metals from WF CRMs
2.5. Total Mineralization of WF
2.6. Determination of the Metal PB Solubility
2.7. DTT Method
3. Results and Discussion
3.1. Total Elemental Contents in WF CRMs
3.2. PB Solubility of Transition Metals in WF CRMs
3.3. OPDTT of Individual Transition Metals
3.4. Regression Equations of OPDTT
3.5. OPDTT of Soluble Transition Metals from WF CRMs
4. Conclusions
Author Contributions
Funding
Institutional Review Board Statement
Informed Consent Statement
Data Availability Statement
Acknowledgments
Conflicts of Interest
Appendix A

| Metal | Form | OEL-8 h (mg m−3) | OEL-15 min (mg m−3) |
|---|---|---|---|
| Aluminum | Welding fumes | 5 | |
| Aluminum | Al2O3 | 10 | |
| Baryum | Soluble compounds | 0.5 | |
| Beryllium | Beryllium compounds | 0.002 | |
| Cadmium | Oxides | 0.05 | |
| Chromium | Chrome (VI) | 0.001 | 0.005 |
| Copper | Fumes | 0.2 | |
| Iron | Fe2O3 and fumes | 5 | |
| Lead | Metallic and Lead compounds | 0.1 | |
| Manganese | Mn3O4 and fumes | 1 | |
| Nickel | Oxide and trioxide | 1 | |
| Titanium | Titanium dioxide | 10 | |
| Vanadium | 0.05 | ||
| Zinc | Oxide and fumes | 5 |
| Test | Principles and Common Units | Detection | Sensitivity to | References |
|---|---|---|---|---|
| AA | O2 consumption rate (nmol min−1 mg−1) | Clark electrode | Transition metals (Cu, Mn) | [31,40,46] |
| AA consumption rate (nmol AA min−1 μg−1) | UV absorbance at 265 nm | |||
| DTT | DTT consumption rate (nmol of DTT min−1 μg−1) | Vis absorbance at 412 nm | Organic compounds (PAHs and quinones) Transition metals (Cu, Zn, Cr, Fe, Ni, Mn) | [38,39,51] |
| DCFH | DCF production rate (nmol H2O2 min−1 μg−1) | Excitation at 485 nm Emission at 535 nm | ROS (H2O2) (ZnO, NiO, Ag) on the surface of ultrafine particles | [47,48,49] |
| SSWF-1 | |||||||
| Analyte | n | Certified Value | Indicative Value | ||||
| % m/m | % m/m | ||||||
| Chromium | 7 | 8.40 | ± | 0.40 | |||
| Copper | 10 | 0.40 | ± | 0.12 | |||
| Iron | 9 | 29.80 | ± | 0.90 | |||
| Manganese | 7 | 22.90 | ± | 0.50 | |||
| Nickel | 10 | 3.70 | ± | 0.20 | |||
| Zinc | 9 | 0.27 | ± | 0.08 | |||
| MSWF-1 | |||||||
| Analyte | n | Certified Value | Indicative Value | ||||
| % m/m | % m/m | ||||||
| Aluminum | 1 | 0.42 | |||||
| Calcium | 1 | 0.85 | |||||
| Chromium | 3 | 0.04 | ± | 0.01 | |||
| Copper | 11 | 0.27 | ± | 0.03 | |||
| Iron | 6 | 42.80 | ± | 0.70 | |||
| Lead | 1 | 0.005 | |||||
| Magnesium | 1 | 0.08 | |||||
| Manganese | 10 | 1.48 | ± | 0.03 | |||
| Nickel | 2 | 0.01 | |||||
| Zinc | 9 | 21.70 | ± | 0.90 | |||
| Parameter | Setting |
|---|---|
| Introduction system | Conventional, Sapphire injector (1.5 mm), PFA-ST microflow nebulizer, PFA cyclonic spray chamber (7 mm baffle), Peltier cooler (+2 °C/−5 °C) |
| Mode | Dynamic reaction cell (DRC), reaction gas H2 (2.5 mL min−1), Plasma 1250 W, HNO3 (2%), 20 sweeps |
| Internal standard | 69Ga, 103Rh (1 µg L−1) |
| Quality control (QC) | Multi elementary solution (400 ng L−1) |
| Element | LOD Total Content 1 (µg g−1) | Total Content 1 (µg g−1) | LOD in PB 2 (µg g−1) | PB-soluble Concentration in PB 2 (µg g−1) | PB-soluble Fraction 3 (%) | |||
|---|---|---|---|---|---|---|---|---|
| MSWF | SSWF | MSWF | SSWF | MSWF | SSWF | |||
| Ag | 10 | 31 ± 1 | 30.51 ± 0.44 | 0.05 | 2.17 ± 0.24 | 2.18 ± 0.41 | 7.00 ± 0.63 | 7.30 ± 0.95 |
| Al | 100 | 3850 ± 60 | 2080 ± 340 | 0.67 | 48 ± 19 | 15 ± 7 | 1.24 ± 0.31 | 0.71 ± 0.10 |
| As | 0.69 | 15 ± 1 | 84 ± 9 | 0.08 | 6.70 ± 1.50 | 14 ± 2 | 45 ± 10 | 17 ± 3 |
| B | 130 | 299 ± 11 | 299.26 ± 0.23 | 0.20 | 29 ± 11 | 35 ± 13 | 9.8 ± 4.2 | 11 ± 5 |
| Ba | 2.30 | 413 ± 30 | 33 ± 1 | 0.27 | N/A | N/A | N/A | N/A |
| Be | 0.48 | 1.13 ± 0.04 | 1.10 ± 0.10 | 0.01 | N/A | N/A | N/A | N/A |
| Bi | 0.21 | 0.62 ± 0.02 | 2.34 ± 0.27 | 0.01 | N/A | N/A | N/A | N/A |
| Cd | 0.37 | 0.86 ± 0.03 | 0.84 ± 0.04 | 0.01 | N/A | N/A | N/A | N/A |
| Ce | 0.05 | 2 ± 1 | 0.20 ± 0.08 | 0.01 | 0.029 ± 0.01 | 0.03 ± 0.01 | 1.45 ± 0.11 | 14.47 ± 0.75 |
| Co | 0.34 | 16 ± 1 | 279 ± 15 | 0.01 | 0.51 ± 0.20 | 6.04 ± 0.66 | 3 ± 1 | 2.17 ± 0.25 |
| Cr | 1.40 | 338 ± 9 | 79,800 ± 4300 | 0.17 | 1.51 ± 0.50 | 407 ± 34 | 0.70 ± 0.31 | 0.50 ± 0.05 |
| Cs | 0.16 | 0.38 ± 0.01 | 0.38 ± 0.01 | 0.01 | N/A | N/A | N/A | N/A |
| Cu | 1.60 | 2508 ± 84 | 4050 ± 220 | 0.73 | 274 ± 27 | 248 ± 38 | 10.93 ± 1.09 | 5.95 ± 0.99 |
| Fe | 120 | 451,600 ± 7200 | 327,000 ± 17,000 | 0.37 | 18 ± 10 | 554 ± 32 | 0.03 ± 0.06 | 0.17 ± 0.01 |
| Hg | 13 | 51 ± 2 | 50.60 ± 0.52 | 0.19 | N/A | N/A | N/A | N/A |
| K | 430 | 3240 ± 330 | 1570 ± 990 | 1100 | N/A | N/A | N/A | N/A |
| La | 0.10 | 0.91 ± 0.36 | 0.30 ± 0.10 | 0.01 | N/A | N/A | N/A | N/A |
| Li | 0.73 | 3 ± 1 | 2.14 ± 0.04 | 0.01 | 1.00 ± 0.30 | 0.18 ± 0.21 | 33 ± 11 | 10 ± 11 |
| Mg | 140 | 3520 ± 150 | 2770 ± 340 | 6.50 | 170 ± 150 | 91 ± 42 | 4.80 ± 3.60 | 3.35 ± 0.73 |
| Mn | 7.10 | 13,070 ± 460 | 189,500 ± 10,900 | 0.39 | 448 ± 69 | 15,900 ± 2100 | 3.42 ± 0.58 | 8.39 ± 1.20 |
| Mo | 0.47 | 8 ± 4 | 891 ± 48 | 0.06 | 1.04 ± 0.42 | 368 ± 60 | 13 ± 6 | 41 ± 7 |
| Na | 83 | 1660 ± 710 | 880 ± 240 | 2.30 | N/A | N/A | N/A | N/A |
| Ni | 1.03 | 96.70 ± 6.40 | 35,100 ± 1900 | 0.02 | <LOD | 747 ± 100 | N/A | 2.11 ± 0.31 |
| Pb | 0.58 | 39 ± 1 | 31.00 ± 0.85 | 0.01 | 0.60 ± 0.40 | 0.52 ± 0.38 | 1.46 ± 1.04 | 2 ± 1 |
| Pd | 0.61 | 1.42 ± 0.10 | 1.42 ± 0.01 | 0.01 | N/A | N/A | N/A | N/A |
| Pt | 0.44 | 1.03 ± 0.04 | 1.02 ± 0.02 | 0.01 | N/A | N/A | N/A | N/A |
| Rb | 7.02 | 16 ± 1 | 16.26 ± 0.23 | 2.50 | N/A | N/A | N/A | N/A |
| Sb | 0.32 | 25 ± 2 | 42 ± 2 | 0.01 | 5 ± 2 | 7 ± 2 | 20 ± 9 | 15 ± 5 |
| Se | 10 | 29 ± 8 | 42 ± 5 | 0.20 | N/A | N/A | N/A | N/A |
| Si | 3000 | 28,500 ± 2800 | 33,300 ± 1600 | 4 | 16,000 ± 12,000 | 35,000 ± 38,000 | N/A | N/A |
| Sn | 2.50 | 32 ± 4 | 111 ± 5 | 0.01 | N/A | N/A | N/A | N/A |
| Sr | 0.15 | 47 ± 4 | 9 ± 1 | 0.1 | 1 ± 1 | 1 ± 1 | 2 ± 2 | 11 ± 12 |
| Th | 0.10 | 0.30 ± 0.10 | 0.24 ± 0.01 | 0.01 | N/A | N/A | N/A | N/A |
| TI | 1000 | 2.12 ± 0.25 | 0.30 ± 0.01 | 32 | N/A | N/A | N/A | N/A |
| Ti | 0.13 | 3528 ± 1100 | 3340 ± 980 | 0.10 | 640 ± 160 | 840 ± 240 | 18 ± 3 | 24 ± 4 |
| U | 0.10 | 0.24 ± 0.01 | 0.32 ± 0.13 | 0.01 | N/A | N/A | N/A | N/A |
| V | 0.47 | 5 ± 1 | 197 ± 9 | 0.01 | 0.47 ± 0.47 | 19 ± 2 | 9 ± 10 | 10 ± 1 |
| W | 15 | 34 ± 1 | 34.26 ± 0.22 | 0.78 | N/A | N/A | N/A | N/A |
| Zn | 10 | 211,400 ± 7700 | 2324 ± 81 | 0.32 | 5570 ± 930 | 78 ± 36 | 2.64 ± 0.48 | 3.43 ± 0.75 |
| Experimental Conditions and Bioaccessibility | This Study | Berlinger et al. [81] | ||
|---|---|---|---|---|
| Conditions | Dissolution media (pH) Quantity | Phosphate buffer (7.4) 1 mg | Hatch’s solution (7.4) Filter | |
| Material Element | HSE-SSWF-1 | HSE-MSWF-1 | Mix of WF | |
| Bioaccessibility (%) | Fe Cr Ni Zn Cu Mn | 0.17 ± 0.01 0.51 ± 0.05 2.11 ± 0.31 3.43 ± 0.75 5.95 ± 0.99 8.39 ± 1.20 | 0.03 ± 0.06 0.70 ± 0.31 N/A 2.64 ± 0.48 10.93 ± 1.09 3.42 ± 0.58 | <1 4–6 4–6 13–27 13–27 13–27 |
| Conditions | Charrier and Anastasio [38] | This Study |
|---|---|---|
| Common conditions | 100 µmol L−1 DTT in 0.1 mol L−1 phosphate buffer pH 7.4 37 °C DTNB in 0.1 mol L−1 phosphate buffer TNB absorbance measured at 412 nm | |
| Sample volume | <100 µL | 100 µL |
| DTT volume | 3000 µL Shaking table (speed 4) | 100 µL 15 s shaking |
| Extra reagent | At a known time take 500 µL aliquot of reaction mixture 0.5 mL of 10% trichloracetic acid | / |
| DTNB volume | 50 µL DTNB 10 mmol L −1 shaking | 100 µL DTNB 140 µmol L−1 shaking (5 s) |
| DTT/DTNB reaction time | 5 min | 5 s |
| Extra reagent | 2 mL of 0.4 mol L−1 Tris Base pH (8.9) 20 mmol L−1 EDTA | / |
| Oxidant | Reducer | E° (V) pH 7.4 * |
|---|---|---|
| H2O2 | H2O | +1.776 |
| Mn3+ | Mn2+ | +1.541 |
| O2 | H2O | +1.229 |
| MnO2 | Mn2+ | +0.888 |
| Fe3+ | Fe2+ | +0.771 |
| CrO42- | Cr(OH)3 | +0.519 |
| Cu2+ | Cu | +0.342 |
| Cu2+ | Cu+ | +0.153 |
| Ni2+ | Ni | −0.257 |
| DTT-oxidized | DTT-reduced | −0.330 |
| Fe2+ | Fe | −0.447 |
| Zn2+ | Zn | −0.762 |
| Cr(OH)3 | Cr | −1.091 |
| Mn2+ | Mn | −1.185 |


References
- Antonini, J.M.; Lewis, A.B.; Roberts, J.R.; Whaley, D.A. Pulmonary effects of welding fumes: Review of worker and experimental animal studies. Am. J. Ind. Med. 2003, 43, 350–360. [Google Scholar] [CrossRef] [PubMed]
- IARC. Welding, Molybdenum Trioxide, and Indium Tin Oxide; IARC Monograph Group on the Evaluation of Carcinogenic Risks to Humans: Lyon, France, 2018; Volume 118, ISBN 978-92-832-0156-4. [Google Scholar]
- Cena, L.G.; Keane, M.J.; Chisholm, W.P.; Stone, S.; Harper, M.; Chen, B.T. A Novel Method for Assessing Respiratory Deposition of Welding Fume Nanoparticles. J. Occup. Environ. Hyg. 2014, 11, 771–780. [Google Scholar] [CrossRef] [PubMed]
- Office of Labor Statistics Occupational Outlook Handbook. Welders, Cutter, Solders, and Brazers; U.S. Department of Labor: Washington, DC, USA, 2016.
- Office of Labor Statistics Occupational Outlook Handbook Employment. Welders, Cutter, Solders, and Brazers; Department of Labor: Washington, DC, USA, 2012.
- Zimmer, A.T.; Biswas, P. Characterization of the aerosols resulting from arc welding processes. J. Aerosol Sci. 2001, 32, 993–1008. [Google Scholar] [CrossRef]
- Witschger, O.; Fabries, J.-F. Particules ultrafines et santé au travail—Caractéristiques et effets potentiels sur la santé. Cah. Notes Doc. 2005, 15, 21–35. [Google Scholar]
- Berlinger, B.; Benker, N.; Weinbruch, S.; L’Vov, B.; Ebert, M.; Koch, W.; Ellingsen, D.G.; Thomassen, Y. Physicochemical characterisation of different welding aerosols. Anal. Bioanal. Chem. 2011, 399, 1773–1780. [Google Scholar] [CrossRef]
- Floros, N. Welding fume main compounds and structure. Weld. World 2018, 62, 311–316. [Google Scholar] [CrossRef]
- Antonini, J.M.; Clarke, R.W.; Krishna, M.G.G.; Sreekanthan, P.; Jenkins, N.; Eagar, T.W.; Brain, J.D. Freshly generated stainless steel welding fume induces greater lung inflammation in rats as compared to aged fume. Toxicol. Lett. 1998, 98, 77–86. [Google Scholar] [CrossRef]
- Berlinger, B.; Ellingsen, D.G.; Náray, M.; Záray, G.; Thomassen, Y. A study of the bio-accessibility of welding fumes. J. Environ. Monit. 2008, 10, 1448. [Google Scholar] [CrossRef]
- Ricaud, M. Fumées de Soudage Et Des Techniques Connexes. 2017. Available online: http://www.inrs.fr/media.html?refINRS=ED%206132 (accessed on 20 August 2019).
- Ulfvarson, U. Survey of air contaminants from welding. Scand. J. Work Environ. Health 1981, 7, 1–28. [Google Scholar]
- Buerke, U.; Schneider, J.; Rösler, J.; Woitowitz, H.-J. Interstitial pulmonary fibrosis after severe exposure to welding fumes. Am. J. Ind. Med. 2002, 41, 259–268. [Google Scholar] [CrossRef]
- Antonini, J.M. Health Effects Associated with Welding. In Comprehensive Materials Processing; Elsevier: Amsterdam, The Netherlands, 2014; pp. 49–70. ISBN 978-0-08-096533-8. [Google Scholar]
- Donaldson, K. Ultrafine particles. Occup. Environ. Med. 2001, 58, 211–216. [Google Scholar] [CrossRef] [PubMed]
- Zeidler-Erdely, P.C.; Kashon, M.L.; Battelli, L.A.; Young, S.-H.; Erdely, A.; Roberts, J.R.; Reynolds, S.H.; Antonini, J.M. Pulmonary inflammation and tumor induction in lung tumor susceptible A/J and resistant C57BL/6J mice exposed to welding fume. Part. Fibre Toxicol. 2008, 5, 12. [Google Scholar] [CrossRef] [PubMed]
- Harris, M. Welding fume is a Group 1 carcinogen with no OEL and no method—Suggestions for a path forward. J. Occup. Environ. Hyg. 2019, 16, 367–371. [Google Scholar] [CrossRef] [PubMed]
- ACGIH. Welding fumes, not otherwise specified. In Documentation of the Threshold Limit Values for Chemical Substances; American Conference of Governmental Industrial Hygienists: Cincinnati, OH, USA, 2001; Volume 3, pp. 1726–1727. [Google Scholar]
- GESTIS. GESTIS International Limit Values. Available online: https://limitvalue.ifa.dguv.de/ (accessed on 15 October 2020).
- Oberdörster, G.; Maynard, A.; Donaldson, K.; Castranova, V.; Fitzpatrick, J.; Ausman, K.; Carter, J.; Karn, B.; Kreyling, W.; Lai, D.; et al. Principles for characterizing the potential human health effects from exposure to nanomaterials: Elements of a screening strategy. Part. Fibre Toxicol. 2005, 2, 8. [Google Scholar] [CrossRef]
- Wilson, M.R.; Lightbody, J.H.; Donaldson, K.; Sales, J.; Stone, V. Interactions between ultrafine particles and transition metals in vivo and in vitro. Toxicol. Appl. Pharmacol. 2002, 184, 172–179. [Google Scholar] [CrossRef]
- Graczyk, H.; Lewinski, N.; Zhao, J.; Sauvain, J.-J.; Suarez, G.; Wild, P.; Danuser, B.; Riediker, M. Increase in oxidative stress levels following welding fume inhalation: A controlled human exposure study. Part. Fibre Toxicol. 2015, 13, 31. [Google Scholar] [CrossRef]
- Graczyk, H.; Lewinski, N.; Zhao, J.; Concha-Lozano, N.; Riediker, M. Characterization of Tungsten Inert Gas (TIG) Welding Fume Generated by Apprentice Welders. Ann. Occup. Hyg. 2016, 60, 205–219. [Google Scholar] [CrossRef]
- Riediker, M. Cardiovascular Effects of Fine Particulate Matter Components in Highway Patrol Officers. Inhal. Toxicol. 2007, 19 (Suppl. 1), 99–105. [Google Scholar] [CrossRef]
- Newby, D.E.; Mannucci, P.M.; Tell, G.S.; Baccarelli, A.A.; Brook, R.D.; Donaldson, K.; Forastiere, F.; Franchini, M.; Franco, O.H.; Graham, I.; et al. Expert position paper on air pollution and cardiovascular disease. Eur. Heart J. 2015, 36, 83–93. [Google Scholar] [CrossRef]
- Xiong, Q.; Yu, H.; Wang, R.; Wei, J.; Verma, V. Rethinking Dithiothreitol-Based Particulate Matter Oxidative Potential: Measuring Dithiothreitol Consumption versus Reactive Oxygen Species Generation. Environ. Sci. Technol. 2017, 51, 6507–6514. [Google Scholar] [CrossRef]
- Antonini, J.; Lawryk, N.; Murthy, G.; Brain, J. Effect of welding fume solubility on lung macrophage viability and function in vitro. J. Toxicol. Environ. Health A 1999, 58, 343–363. [Google Scholar] [CrossRef] [PubMed]
- Antonini, J.; Leonard, S.; Roberts, J.; Solano, L.C.; Young, S.-H.; Shi, X.; Taylor, M. Effect of stainless steel manual metal arc welding fume on free radical production, DNA damage, and apoptosis induction. Mol. Cell. Biochem. 2005, 279, 17–23. [Google Scholar] [CrossRef] [PubMed]
- Mudway, I.S.; Stenfors, N.; Duggan, S.T.; Roxborough, H.; Zielinski, H.; Marklund, S.L.; Blomberg, A.; Frew, A.J.; Sandström, T.; Kelly, F.J. An in vitro and in vivo investigation of the effects of diesel exhaust on human airway lining fluid antioxidants. Arch. Biochem. Biophys. 2004, 423, 200–212. [Google Scholar] [CrossRef] [PubMed]
- Stoeger, T.; Takenaka, S.; Frankenberger, B.; Ritter, B.; Karg, E.; Maier, K.; Schulz, H.; Schmid, O. Deducing in Vivo Toxicity of Combustion-Derived Nanoparticles from a Cell-Free Oxidative Potency Assay and Metabolic Activation of Organic Compounds. Environ. Health Perspect. 2009, 117, 54–60. [Google Scholar] [CrossRef] [PubMed]
- Karlsson, H.L.; Gliga, A.R.; Calléja, F.M.; Gonçalves, C.S.; Wallinder, I.O.; Vrieling, H.; Fadeel, B.; Hendriks, G. Mechanism-based genotoxicity screening of metal oxide nanoparticles using the ToxTracker panel of reporter cell lines. Part. Fibre Toxicol. 2014, 11, 41. [Google Scholar] [CrossRef]
- McCarrick, S.; Wei, Z.; Moelijker, N.; Derr, R.; Persson, K.-A.; Hendriks, G.; Wallinder, I.; Hedberg, Y.; Karlsson, H. High variability in toxicity of welding fume nanoparticles from stainless steel in lung cells and reporter cell lines: The role of particle reactivity and solubility. Nanotoxicology 2019, 13, 1293–1309. [Google Scholar] [CrossRef]
- Janssen, N.A.H.; Yang, A.; Strak, M.; Steenhof, M.; Hellack, B.; Gerlofs-Nijland, M.E.; Kuhlbusch, T.; Kelly, F.; Harrison, R.; Brunekreef, B.; et al. Oxidative potential of particulate matter collected at sites with different source characteristics. Sci. Total Environ. 2014, 472, 572–581. [Google Scholar] [CrossRef]
- Hedayat, F.; Stevanovic, S.; Miljevic, B.; Bottle, S.; Ristovski, Z.D. Review-evaluating the molecular assays for measuring the oxidative potential of particulate matter. Chem. Ind. Chem. Eng. Q. 2014, 21, 201–210. [Google Scholar] [CrossRef]
- Visentin, M.; Pagnoni, A.; Sarti, E.; Pietrogrande, M.C. Urban PM2.5 oxidative potential: Importance of chemical species and comparison of two spectrophotometric cell-free assays. Environ. Pollut. 2016, 219, 72–79. [Google Scholar] [CrossRef]
- Hung, H.-F.; Wang, C.-S. Experimental determination of reactive oxygen species in Taipei aerosols. J. Aerosol Sci. 2001, 32, 1201–1211. [Google Scholar] [CrossRef]
- Charrier, J.G.; Anastasio, C. On dithiothreitol (DTT) as a measure of oxidative potential for ambient particles: Evidence for the importance of soluble transition metals. Atmos. Chem. Phys. Print 2012, 12, 11317–11350. [Google Scholar] [CrossRef]
- Fang, T.; Verma, V.; Guo, H.; King, L.E.; Edgerton, E.S.; Weber, R.J. A semi-automated system for quantifying the oxidative potential of ambient particles in aqueous extracts using the dithiothreitol (DTT) assay: Results from the Southeastern Center for Air Pollution and Epidemiology (SCAPE). Atmos. Meas. Tech. 2015, 8, 471–482. [Google Scholar] [CrossRef]
- Fang, T.; Verma, V.; Bates, J.T.; Abrams, J.; Klein, M.; Strickland, M.J.; Sarnat, S.E.; Chang, H.H.; Mulholland, J.A.; Tolbert, P.E.; et al. Oxidative potential of ambient water-soluble PM2.5; in the southeastern United States: Contrasts in sources and health associations between ascorbic acid (AA) and dithiothreitol (DTT) assays. Atmos. Chem. Phys. 2016, 16, 3865–3879. [Google Scholar] [CrossRef]
- Verma, V.; Rico-Martinez, R.; Kotra, N.; King, L.; Liu, J.; Snell, T.W.; Weber, R.J. Contribution of Water-Soluble and Insoluble Components and Their Hydrophobic/Hydrophilic Subfractions to the Reactive Oxygen Species-Generating Potential of Fine Ambient Aerosols. Environ. Sci. Technol. 2012, 46, 11384–11392. [Google Scholar] [CrossRef]
- Lin, M.; Yu, J.Z. Dithiothreitol (DTT) concentration effect and its implications on the applicability of DTT assay to evaluate the oxidative potential of atmospheric aerosol samples. Environ. Pollut. 2019, 251, 938–944. [Google Scholar] [CrossRef]
- Massimi, L.; Ristorini, M.; Simonetti, G.; Frezzini, M.A.; Astolfi, M.L.; Canepari, S. Spatial mapping and size distribution of oxidative potential of particulate matter released by spatially disaggregated sources. Environ. Pollut. 2020, 266, 115271. [Google Scholar] [CrossRef]
- Bates, J.T.; Fang, T.; Verma, V.; Zeng, L.; Weber, R.J.; Tolbert, P.E.; Abrams, J.Y.; Sarnat, S.E.; Klein, M.; Mulholland, J.A.; et al. Review of Acellular Assays of Ambient Particulate Matter Oxidative Potential: Methods and Relationships with Composition, Sources, and Health Effects. Environ. Sci. Technol. 2019, 53, 4003–4019. [Google Scholar] [CrossRef]
- Pietrogrande, M.; Russo, M.; Zagatti, E. Review of PM Oxidative Potential Measured with Acellular Assays in Urban and Rural Sites across Italy. Atmosphere 2019, 10, 626. [Google Scholar] [CrossRef]
- Di Stefano, E.; Eiguren-Fernandez, A.; Delfino, R.J.; Sioutas, C.; Froines, J.R.; Cho, A.K. Determination of metal-based hydroxyl radical generating capacity of ambient and diesel exhaust particles. Inhal. Toxicol. 2009, 21, 731–738. [Google Scholar] [CrossRef]
- Venkatachari, P.; Hopke, P.K. Development and Laboratory Testing of an Automated Monitor for the Measurement of Atmospheric Particle-Bound Reactive Oxygen Species (ROS). Aerosol Sci. Technol. 2008, 42, 629–635. [Google Scholar] [CrossRef]
- Sauvain, J.-J.; Rossi, M.J.; Riediker, M. Comparison of Three Acellular Tests for Assessing the Oxidation Potential of Nanomaterials. Aerosol Sci. Technol. 2013, 47, 218–227. [Google Scholar] [CrossRef]
- King, L.E.; Weber, R.J. Development and testing of an online method to measure ambient fine particulate reactive oxygen species (ROS) based on the 2′,7′-dichlorofluorescin (DCFH) assay. Atmos. Meas. Tech. 2013, 6, 1647–1658. [Google Scholar] [CrossRef]
- Calas, A.; Uzu, G.; Martins, J.M.F.; Voisin, D.; Spadini, L.; Lacroix, T.; Jaffrezo, J.-L. The importance of simulated lung fluid (SLF) extractions for a more relevant evaluation of the oxidative potential of particulate matter. Sci. Rep. 2017, 7, 11617. [Google Scholar] [CrossRef] [PubMed]
- Cho, A.K.; Sioutas, C.; Miguel, A.H.; Kumagai, Y.; Schmitz, D.A.; Singh, M.; Eiguren-Fernandez, A.; Froines, J.R. Redox activity of airborne particulate matter at different sites in the Los Angeles Basin. Environ. Res. 2005, 99, 40–47. [Google Scholar] [CrossRef]
- Chung, M.Y.; Lazaro, R.A.; Lim, D.; Jackson, J.; Lyon, J.; Rendulic, D.; Hasson, A.S. Aerosol-Borne Quinones and Reactive Oxygen Species Generation by Particulate Matter Extracts. Environ. Sci. Technol. 2006, 40, 4880–4886. [Google Scholar] [CrossRef]
- Jiang, H.; Jang, M.; Sabo-Attwood, T.; Robinson, S.E. Oxidative potential of secondary organic aerosols produced from photooxidation of different hydrocarbons using outdoor chamber under ambient sunlight. Atmos. Environ. 2016, 131, 382–389. [Google Scholar] [CrossRef]
- McWhinney, R.D.; Badali, K.; Liggio, J.; Li, S.-M.; Abbatt, J.P.D. Filterable Redox Cycling Activity: A Comparison between Diesel Exhaust Particles and Secondary Organic Aerosol Constituents. Environ. Sci. Technol. 2013, 47, 3362–3369. [Google Scholar] [CrossRef]
- McWhinney, R.; Zhou, S.; Abbatt, J. Naphthalene SOA: Redox activity and naphthoquinone gas-particle partitioning. Atmos. Chem. Phys. 2013, 13, 9731–9744. [Google Scholar] [CrossRef]
- Saffari, A.; Hasheminassab, S.; Shafer, M.M.; Schauer, J.J.; Chatila, T.A.; Sioutas, C. Nighttime aqueous-phase secondary organic aerosols in Los Angeles and its implication for fine particulate matter composition and oxidative potential. Atmos. Environ. 2016, 133, 112–122. [Google Scholar] [CrossRef]
- Atkinson, R.W.; Samoli, E.; Analitis, A.; Fuller, G.W.; Green, D.C.; Anderson, H.R.; Purdie, E.; Dunster, C.; Aitlhadj, L.; Kelly, F.J.; et al. Short-term associations between particle oxidative potential and daily mortality and hospital admissions in London. Int. J. Hyg. Environ. Health 2016, 219, 566–572. [Google Scholar] [CrossRef]
- Shiraiwa, M.; Ueda, K.; Pozzer, A.; Lammel, G.; Kampf, C.J.; Fushimi, A.; Enami, S.; Arangio, A.M.; Fröhlich-Nowoisky, J.; Fujitani, Y.; et al. Aerosol Health Effects from Molecular to Global Scales. Environ. Sci. Technol. 2017, 51, 13545–13567. [Google Scholar] [CrossRef] [PubMed]
- Abrams, J.Y.; Weber, R.J.; Klein, M.; Samat, S.E.; Chang, H.H.; Strickland, M.J.; Verma, V.; Fang, T.; Bates, J.T.; Mulholland, J.A.; et al. Associations between Ambient Fine Particulate Oxidative Potential and Cardiorespiratory Emergency Department Visits. Environ. Health Perspect. 2017, 125, 107008. [Google Scholar] [CrossRef] [PubMed]
- Costabile, F.; Gualtieri, M.; Canepari, S.; Tranfo, G.; Consales, C.; Grollino, M.G.; Paci, E.; Petralia, E.; Pigini, D.; Simonetti, G. Evidence of association between aerosol properties and in-vitro cellular oxidative response to PM1, oxidative potential of PM2.5, a biomarker of RNA oxidation, and its dependency on combustion sources. Atmos. Environ. 2019, 213, 444–455. [Google Scholar] [CrossRef]
- Jiang, H.; Ahmed, C.M.; Canchola, A.; Chen, J.Y.; Lin, Y.H. Use of Dithiothreitol Assay to Evaluate the Oxidative Potential of Atmospheric Aerosols. Atmosphere 2019, 10, 571. [Google Scholar] [CrossRef]
- Manigrasso, M.; Simonetti, G.; Astolfi, M.L.; Perrino, C.; Canepari, S.; Protano, C.; Antonucci, A.; Avino, P.; Vitali, M. Oxidative Potential Associated with Urban Aerosol Deposited into the Respiratory System and Relevant Elemental and Ionic Fraction Contributions. Atmosphere 2020, 11, 6. [Google Scholar] [CrossRef]
- Borlaza, L.J.S.; Cosep, E.M.R.; Kim, S.; Lee, K.; Joo, H.; Park, M.; Bate, D.; Cayetano, M.G.; Park, K. Oxidative potential of fine ambient particles in various environments. Environ. Pollut. 2018, 243, 1679–1688. [Google Scholar] [CrossRef]
- Adamson, I.Y.R.; Prieditis, H.; Vincent, R. Pulmonary Toxicity of an Atmospheric Particulate Sample Is Due to the Soluble Fraction. Toxicol. Appl. Pharmacol. 1999, 157, 43–50. [Google Scholar] [CrossRef]
- Adamson, I.Y.R.; Prieditis, H.; Hedgecock, C.; Vincent, R. Zinc Is the Toxic Factor in the Lung Response to an Atmospheric Particulate Sample. Toxicol. Appl. Pharmacol. 2000, 166, 111–119. [Google Scholar] [CrossRef]
- Voutsa, D.; Samara, C. Labile and bioaccessible fractions of heavy metals in the airborne particulate matter from urban and industrial areas. Atmos. Environ. 2002, 36, 3583–3590. [Google Scholar] [CrossRef]
- Midander, K.; Pan, J.; Leygraf, C. Elaboration of a test method for the study of metal release from stainless steel particles in artificial biological media. Corros. Sci. 2006, 48, 2855–2866. [Google Scholar] [CrossRef]
- Caboche, J.; Perdrix, E.; Malet, B.; Alleman, L.Y. Development of an in vitro method to estimate lung bioaccessibility of metals from atmospheric particles. J. Environ. Monit. 2011, 13, 621–630. [Google Scholar] [CrossRef]
- McNeilly, J.D.; Heal, M.R.; Beverland, I.J.; Howe, A.; Gibson, M.D.; Hibbs, L.R.; MacNee, W.; Donaldson, K. Soluble transition metals cause the pro-inflammatory effects of welding fumes in vitro. Toxicol. Appl. Pharmacol. 2004, 196, 95–107. [Google Scholar] [CrossRef] [PubMed]
- Donaldson, K.; Tran, L.; Jimenez, L.A.; Duffin, R.; Newby, D.E.; Mills, N.; MacNee, W.; Stone, V. Combustion-derived nanoparticles: A review of their toxicology following inhalation exposure. Part. Fibre Toxicol. 2005, 2, 10. [Google Scholar] [CrossRef] [PubMed]
- Sauvain, J.-J.; Rossi, M.J. Quantitative Aspects of the Interfacial Catalytic Oxidation of Dithiothreitol by Dissolved Oxygen in the Presence of Carbon Nanoparticles. Environ. Sci. Technol. 2016, 50, 996–1004. [Google Scholar] [CrossRef]
- Leclercq, B.; Alleman, L.Y.; Perdrix, E.; Riffault, V.; Happillon, M.; Strecker, A.; Lo-Guidice, J.-M.; Garçon, G.; Coddeville, P. Particulate metal bioaccessibility in physiological fluids and cell culture media: Toxicological perspectives. Environ. Res. 2017, 156, 148–157. [Google Scholar] [CrossRef]
- Keane, M.; Stone, S.; Chen, B. Welding fumes from stainless steel gas metal arc processes contain multiple manganese chemical species. J. Environ. Monit. 2010, 12, 1133–1140. [Google Scholar] [CrossRef]
- Hanley, K.W.; Andrews, R.; Bertke, S.; Ashley, K. Manganese Fractionation Using a Sequential Extraction Method to Evaluate Welders’ Shielded Metal Arc Welding Exposures During Construction Projects in Oil Refineries. J. Occup. Environ. Hyg. 2015, 12, 774–784. [Google Scholar] [CrossRef]
- Butler, O.; Musgrove, D.; Stacey, P. Preparation and Certification of Two New Bulk Welding Fume Reference Materials for Use in Laboratories Undertaking Analysis of Occupational Hygiene Samples. J. Occup. Environ. Hyg. 2014, 11, 604–612. [Google Scholar] [CrossRef]
- Unceta, N.; Séby, F.; Malherbe, J.; Donard, O.F.X. Chromium speciation in solid matrices and regulation: A review. Anal. Bioanal. Chem. 2010, 397, 1097–1111. [Google Scholar] [CrossRef]
- Pelfrêne, A.; Cave, M.R.; Wragg, J.; Douay, F. In Vitro Investigations of Human Bioaccessibility from Reference Materials Using Simulated Lung Fluids. Int. J. Environ. Res. Public. Health 2017, 14, 112. [Google Scholar] [CrossRef]
- Hatch, G.E. Comparative Biology of the Normal Lung; Parent, R.A., Ed.; CRC Press: Boca Raton, FL, USA, 1992; pp. 617–632. [Google Scholar]
- Lyu, Y.; Guo, H.; Cheng, T.; Li, X. Particle Size Distributions of Oxidative Potential of Lung-Deposited Particles: Assessing Contributions from Quinones and Water-Soluble Metals. Environ. Sci. Technol. 2018, 52, 6592–6600. [Google Scholar] [CrossRef] [PubMed]
- Mbengue, S.; Alleman, L.; Flament, P. Size-distributed metallic elements in submicronic and ultrafine atmospheric particles from urban and industrial areas in northern France. Atmos. Res. 2014, 135–136, 35–47. [Google Scholar] [CrossRef]
- Berlinger, B.; Weinbruch, S.; Ellingsen, D.G.; Zibarev, E.; Chashchin, V.; Chashchin, M.; Thomassen, Y. On the bio-accessibility of 14 elements in welding fumes. Environ. Sci. Process. Impacts 2019, 21, 497–505. [Google Scholar] [CrossRef] [PubMed]
- Burgess, W. Potential exposures in the manufacturing industry—their recognition and control. In Patty’s Industrial; Clayton, G.D., Clayton, F.E., Eds.; Wiley-Interscience: New York, NY, USA, 1991; pp. 595–674. [Google Scholar]
- Keane, M.; Stone, S.; Chen, B.; Slaven, J.; Schwegler-Berry, D.; Antonini, J. Hexavalent chromium content in stainless steel welding fumes is dependent on the welding process and shield gas type. J. Environ. Monit. 2009, 11, 418–424. [Google Scholar] [CrossRef]
- Berlinger, B.; Skogen, U.; Meijer, C.; Thomassen, Y. Workplace exposure to particulate matter, bio-accessible, and non-soluble metal compounds during hot work processes. J. Occup. Environ. Hyg. 2019, 16, 378–386. [Google Scholar] [CrossRef]
- MétroPol. MétroPol M-43 (2016) Chrome VI. Available online: http://www.inrs.fr/publications/bdd/metropol/fiche.html?refINRS=METROPOL_43 (accessed on 19 October 2020).
- Ruby, M.V.; Schoof, R.; Brattin, W.; Goldade, M.; Post, G.; Harnois, M.; Mosby, D.E.; Casteel, S.W.; Berti, W.; Carpenter, M.; et al. Advances in Evaluating the Oral Bioavailability of Inorganics in Soil for Use in Human Health Risk Assessment. Environ. Sci. Technol. 1999, 33, 3697–3705. [Google Scholar] [CrossRef]
- Jenkins, N.T.; Pierce, W.M.-G.; Eagar, T. Particle size distribution of gas metal and flux cored arc welding fumes. Weld. J. 2005, 84, 156–163. [Google Scholar]
- Jenkins, N.T. Chemistry of Airborne Particles from Metallurgical Processing. Ph.D. Thesis, Massachusetts Institute of Technology, Cambridge, MA, USA, September 2003. [Google Scholar]
- Bau, S.; Rousset, D.; Payet, R.; Keller, F.-X. Characterizing particle emissions from a direct energy deposition additive manufacturing process and associated occupational exposure to airborne particles. J. Occup. Environ. Hyg. 2020, 17, 59–72. [Google Scholar] [CrossRef]
- Mamede, A.-S.; Nuns, N.; Cristol, A.-L.; Cantrel, L.; Souvi, S.; Cristol, S.; Paul, J.-F. Multitechnique characterisation of 304 L surface states oxidised at high temperature in steam and air atmospheres. Appl. Surf. Sci. 2016, 369, 510–519. [Google Scholar] [CrossRef]
- Feng, X.D.; Dang, Z.; Huang, W.L.; Yang, C. Chemical speciation of fine particle bound trace metals. Int. J. Environ. Sci. Technol. 2009, 6, 337–346. [Google Scholar] [CrossRef]
- Daellenbach, K.R.; Uzu, G.; Jiang, J.; Cassagnes, L.-E.; Leni, Z.; Vlachou, A.; Stefenelli, G.; Canonaco, F.; Weber, S.; Segers, A.; et al. Sources of particulate-matter air pollution and its oxidative potential in Europe. Nature 2020, 587, 414–419. [Google Scholar] [CrossRef]
- Park, M.; Joo, H.S.; Lee, K.; Jang, M.; Kim, S.D.; Kim, I.; Borlaza, L.J.S.; Lim, H.; Shin, H.; Chung, K.H.; et al. Differential toxicities of fine particulate matters from various sources. Sci. Rep. 2018, 8, 1–11. [Google Scholar] [CrossRef]
- Rice, T.M.; Clarke, R.W.; Godleski, J.J.; Al-Mutairi, E.; Jiang, N.-F.; Hauser, R.; Paulauskis, J.D. Differential Ability of Transition Metals to Induce Pulmonary Inflammation. Toxicol. Appl. Pharmacol. 2001, 177, 46–53. [Google Scholar] [CrossRef] [PubMed]
- Fujitani, Y.; Furuyama, A.; Tanabe, K.; Hirano, S. Comparison of Oxidative Abilities of PM2.5 Collected at Traffic and Residential Sites in Japan. Contribution of Transition Metals and Primary and Secondary Aerosols. Aerosol Air Qual. Res. 2017, 17, 574–587. [Google Scholar] [CrossRef]
- Kachur, A.V.; Held, K.D.; Koch, C.J.; Biaglow, J.E. Mechanism of Production of Hydroxyl Radicals in the Copper-Catalyzed Oxidation of Dithiothreitol. Radiat. Res. 1997, 147, 409–415. [Google Scholar] [CrossRef] [PubMed]
- Kumagai, Y.; Koide, S.; Taguchi, K.; Endo, A.; Nakai, Y.; Yoshikawa, T.; Shimojo, N. Oxidation of Proximal Protein Sulfhydryls by Phenanthraquinone, a Component of Diesel Exhaust Particles. Chem. Res. Toxicol. 2002, 15, 483–489. [Google Scholar] [CrossRef]
- Krȩżel, A.; Leśniak, W.; Jeżowska-Bojczuk, M.; Młynarz, P.; Brasuñ, J.; Kozłowski, H.; Bal, W. Coordination of heavy metals by dithiothreitol, a commonly used thiol group protectant. J. Inorg. Biochem. 2001, 84, 77–88. [Google Scholar] [CrossRef]
- Kaiwar, S.P.; Rao, C.P. In vitro reduction of Cr(VI) by low molecular weight biomimetic components: A comparative study using UV-Vis spectroscopy. Chem. Biol. Interact. 1995, 95, 89–96. [Google Scholar] [CrossRef]
- Gustafsson, J.P. Visual MINTEQ 3.1. 2020. Available online: https://vminteq.lwr.kth.se/download/ (accessed on 4 May 2020).
- Kohen, R.; Nyska, A. Oxidation of biological systems: Oxidative stress phenomena, antioxidants, redox reactions, and methods for their quantification. Toxicol. Pathol. 2002, 30, 620–650. [Google Scholar] [CrossRef]
- Charrier, J.G.; Anastasio, C. Impacts of antioxidants on hydroxyl radical production from individual and mixed transition metals in a surrogate lung fluid. Atmos. Environ. 2011, 45, 7555–7562. [Google Scholar] [CrossRef] [PubMed]
- Jin, K.; Park, J.; Lee, J.; Yang, K.D.; Pradhan, G.K.; Sim, U.; Jeong, D.; Jang, H.L.; Park, S.; Kim, D.; et al. Hydrated Manganese(II) Phosphate (Mn3(PO4)2.3H2O) as a Water Oxidation Catalyst. J. Am. Chem. Soc. 2014, 136, 7435–7443. [Google Scholar] [CrossRef] [PubMed]
- Sigg, L.; Behra, P.; Stumm, W. Chimie des Milieux Aquatiques—5e Edition: Cours et Exercices Corrigés; Dunod: Malakoff, France, 1992; ISBN 978-2-10-059254-8. [Google Scholar]
- Charrier, J.G.; McFall, A.S.; Vu, K.K.-T.; Baroi, J.; Olea, C.; Hasson, A.; Anastasio, C. A bias in the “mass-normalized” DTT response—An effect of non-linear concentration-response curves for copper and manganese. Atmos. Environ. 2016, 144, 325–334. [Google Scholar] [CrossRef] [PubMed]
- Leonard, S.S.; Chen, B.T.; Stone, S.G.; Schwegler-Berry, D.; Kenyon, A.J.; Frazer, D.; Antonini, J.M. Comparison of stainless and mild steel welding fumes in generation of reactive oxygen species. Part. Fibre Toxicol. 2010, 7, 32. [Google Scholar] [CrossRef]
- Verma, V.; Shafer, M.M.; Schauer, J.J.; Sioutas, C. Contribution of transition metals in the reactive oxygen species activity of PM emissions from retrofitted heavy-duty vehicles. Atmos. Environ. 2010, 44, 5165–5173. [Google Scholar] [CrossRef]
- Lin, M.; Yu, J.Z. Effect of metal-organic interactions on the oxidative potential of mixtures of atmospheric humic-like substances and copper/manganese as investigated by the dithiothreitol assay. Sci. Total Environ. 2019, 697, 134012. [Google Scholar] [CrossRef]
- Krawic, C.; Zhitkovich, A. Toxicological Antagonism among Welding Fume Metals: Inactivation of Soluble Cr(VI) by Iron. Chem. Res. Toxicol. 2018, 31, 1172–1184. [Google Scholar] [CrossRef]
- Butler, O.; Musgrove, D. Certification Report: Reference Material HSL SSWF-1, Elements in Stainless Steel Welding Fume, AS/2012/11; Health and Safety Laboratory: Buxton, UK, 2012.
- Butler, O.; Musgrove, D. Certification Report: Reference Material HSL MSWF-1, Elements in Mild Steel Welding Fume, AS/2012/11; Health and Safety Laboratory: Buxton, UK, 2012.
- Rumble, J. Archive Handbook of Chemistry and Physics 100st Edition, 100th ed.; CRC Press: Boca Raton, FL, USA, 2019. [Google Scholar]


| SSWF-1 | ||||
| Element | Ref. Value 1 (%) | Total Content 2 (µg g−1) | PB-soluble Concentration 3 (µg g−1) | PB Solubility 1 (%) |
| Cr | 8.40 ± 0.40 | 79,800 ± 4300 | 407 ± 34 | 0.51 ± 0.05 |
| Cu | 0.40 ± 0.12 | 4050 ± 220 | 248 ± 38 | 5.95 ± 0.99 |
| Fe | 29.80 ± 0.90 | 327,000 ±17,000 | 554 ± 32 | 0.17 ± 0.01 |
| Mn | 22.90 ± 0.50 | 189,500 ± 10,900 | 15,900 ± 2100 | 8.39 ± 1.20 |
| Ni | 3.70 ± 0.20 | 35,100 ± 1900 | 747 ± 100 | 2.11 ± 0.31 |
| Zn | 0.27 ± 0.08 | 2324 ± 81 | 78 ± 36 | 3.43 ± 0.75 |
| MSWF-1 | ||||
| Element | Ref. Value 1 (%) | Total Content 2 (µg g−1) | PB-Soluble Concentration 3 (µg g−1) | PB Solubility 1 (%) |
| Cr | 0.04 ± 0.01 | 338 ± 9 | 1.51 ± 0.50 | 0.70 ± 0.31 |
| Cu | 0.27 ± 0.03 | 2508 ± 84 | 274 ± 27 | 10.93 ± 1.09 |
| Fe | 42.80 ± 0.70 | 451,600 ± 7200 | 18 ± 10 | 0.03 ± 0.06 |
| Mn | 1.48 ± 0.03 | 13,070 ± 460 | 448 ± 69 | 3.42 ± 0.58 |
| Ni | 0.01 ± N/A | 96.70 ± 6.40 | <LOD | N/A |
| Zn | 21.70 ± 0.90 | 211,400 ± 7700 | 5570 ± 930 | 2.64 ± 0.48 |
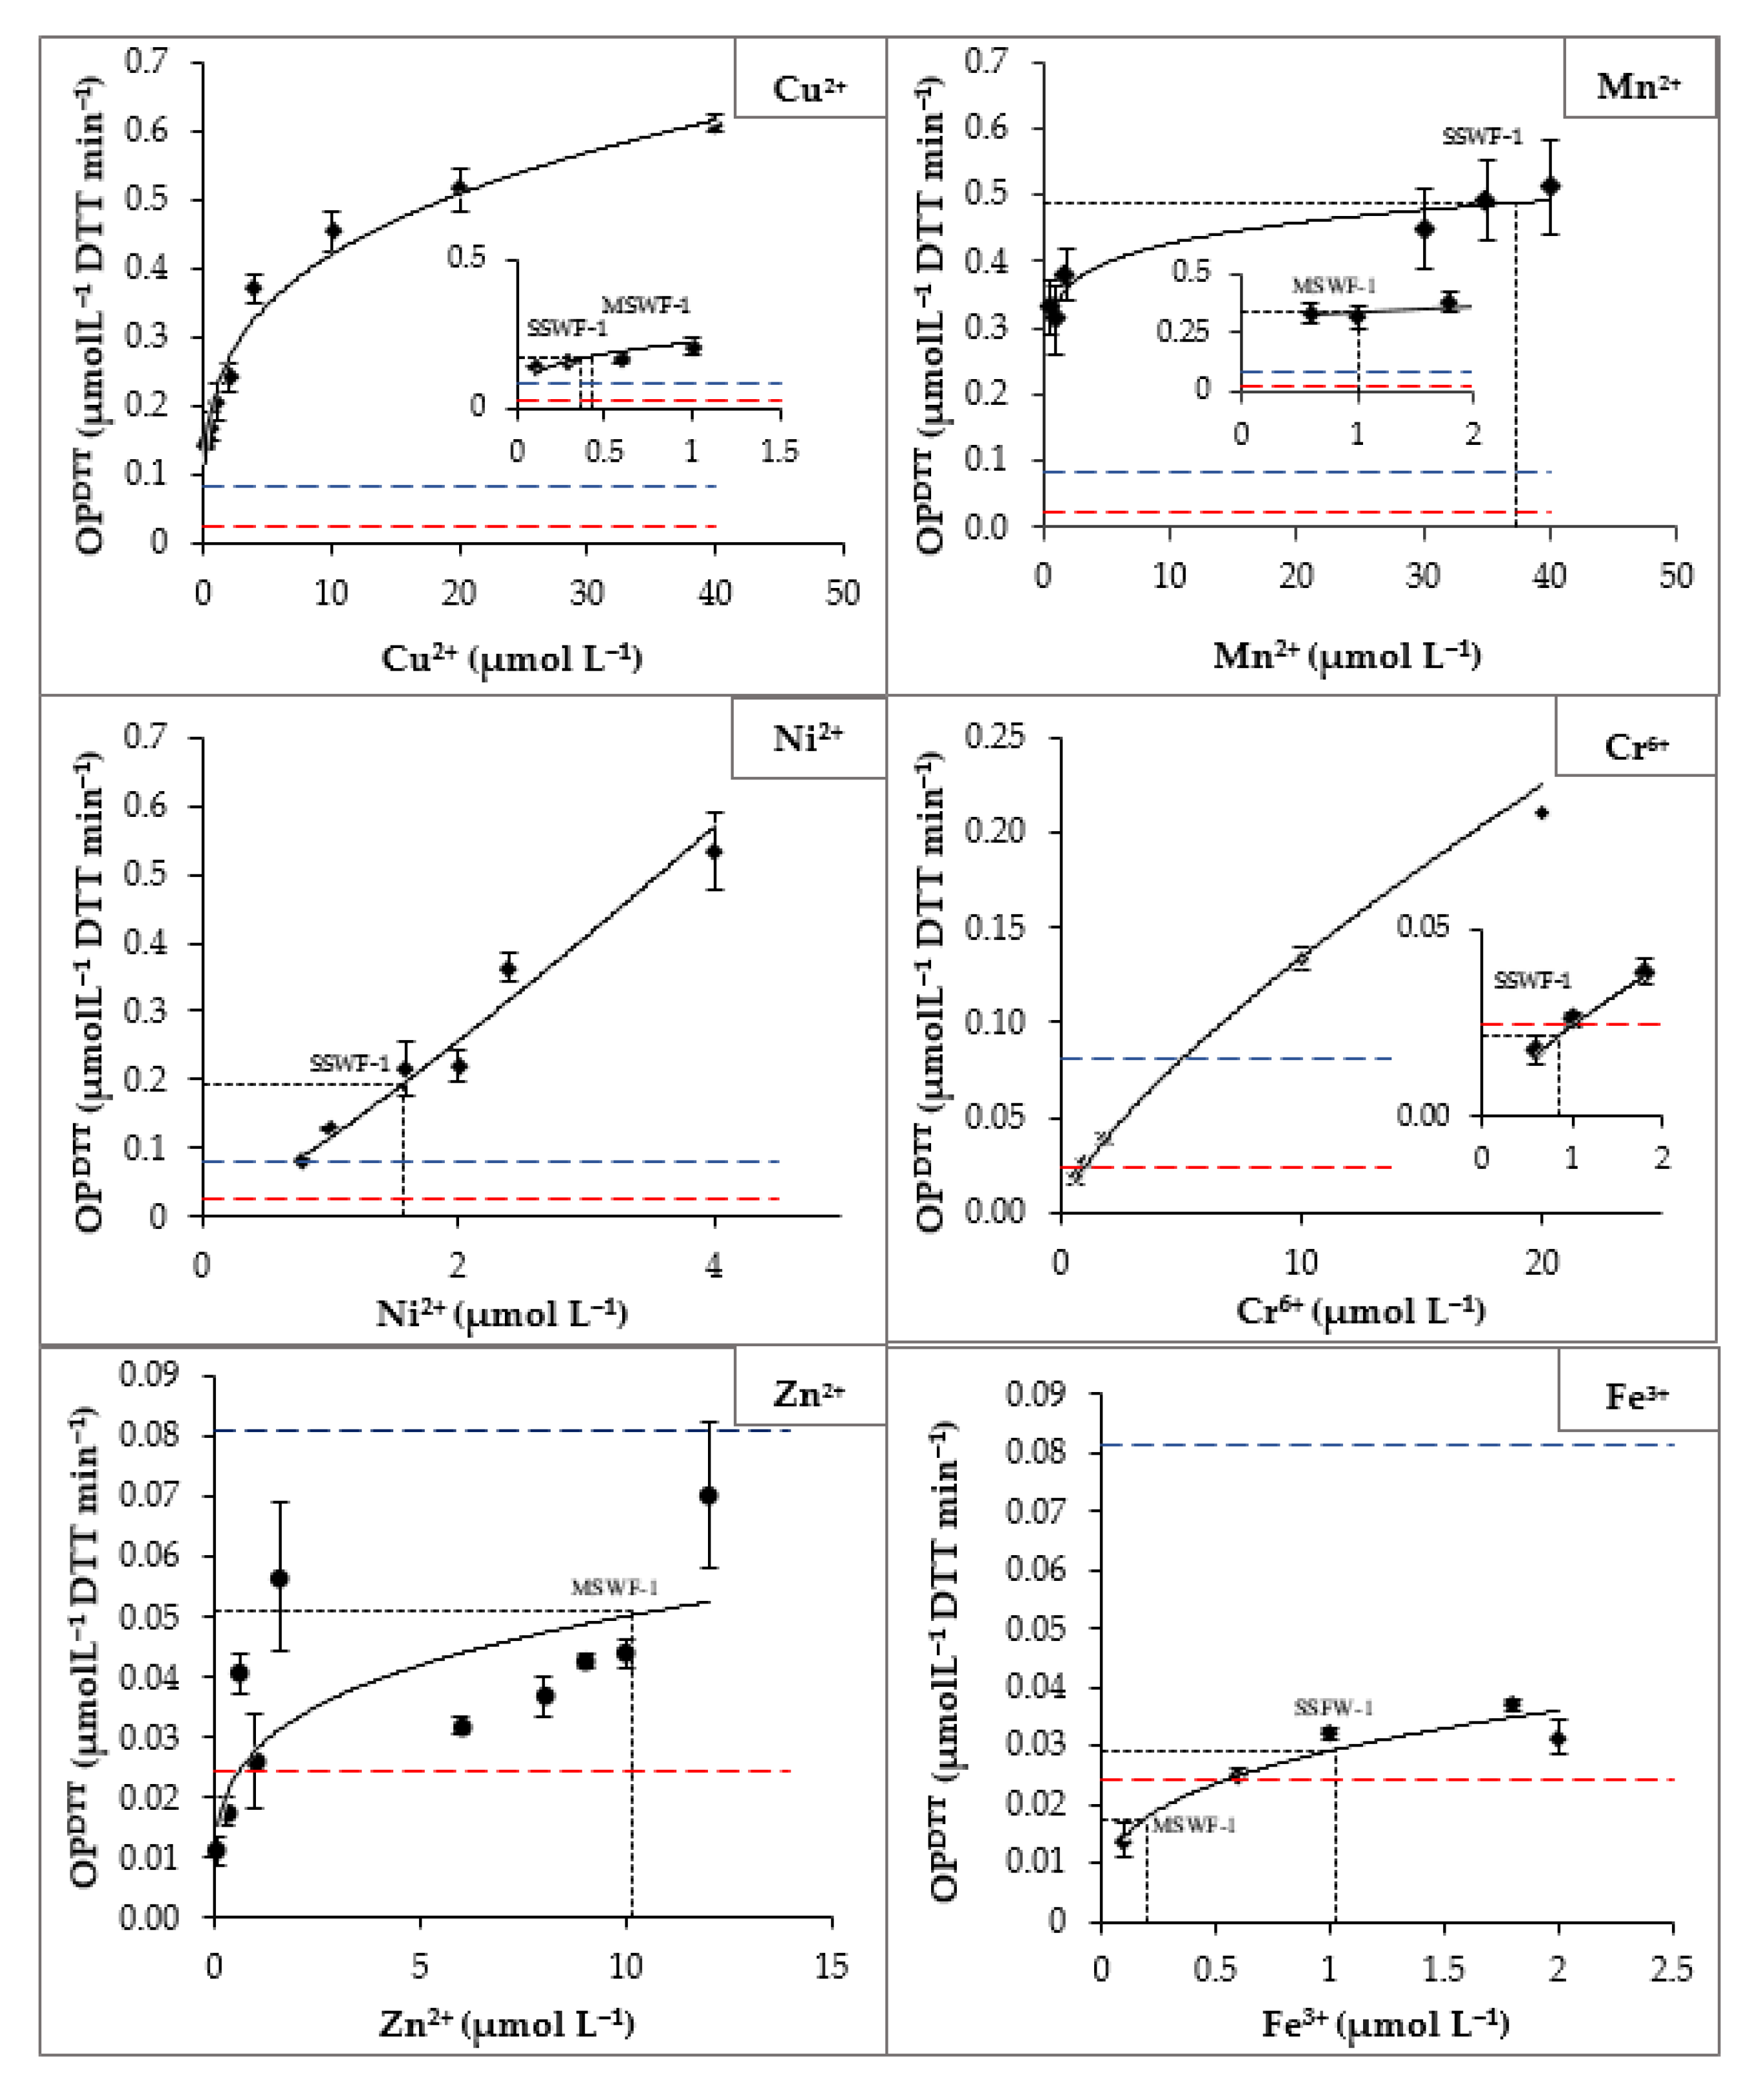
| Species | Experimental OPDTT (µmol DTT L−1 min−1) a | Range of Concentrations Tested (µmol L−1) | Regression Equations b | R2 | n c |
|---|---|---|---|---|---|
| Cr (VI) | 0.026 ± 0.003 | 0.6–20 | y = 0.0242 × x0.7441 | 0.99 | 5 |
| Cu (II) | 0.207 ± 0.032 | 0.1–40 | y = 0.2221 × x0.2759 | 0.96 | 9 |
| Fe (III) | 0.032 ± 0.001 | 0.1–2 | y = 0.0291 × x0.3065 | 0.95 | 5 |
| Mn (II) | 0.312 ± 0.052 | 0.6–40 | y = 0.3377 × x0.1016 | 0.93 | 6 |
| Ni (II) | 0.128 ± 0.023 | 0.8–4 | y = 0.1150 × x1.1546 | 0.96 | 6 |
| Zn (II) | 0.026 ± 0.002 | 0.1–12 | y = 0.0278 × x0.2551 | 0.62 | 10 |
Publisher’s Note: MDPI stays neutral with regard to jurisdictional claims in published maps and institutional affiliations. |
© 2020 by the authors. Licensee MDPI, Basel, Switzerland. This article is an open access article distributed under the terms and conditions of the Creative Commons Attribution (CC BY) license (http://creativecommons.org/licenses/by/4.0/).
Share and Cite
Ghanem, M.; Perdrix, E.; Alleman, L.Y.; Rousset, D.; Coddeville, P. Phosphate Buffer Solubility and Oxidative Potential of Single Metals or Multielement Particles of Welding Fumes. Atmosphere 2021, 12, 30. https://doi.org/10.3390/atmos12010030
Ghanem M, Perdrix E, Alleman LY, Rousset D, Coddeville P. Phosphate Buffer Solubility and Oxidative Potential of Single Metals or Multielement Particles of Welding Fumes. Atmosphere. 2021; 12(1):30. https://doi.org/10.3390/atmos12010030
Chicago/Turabian StyleGhanem, Manuella, Esperanza Perdrix, Laurent Yves Alleman, Davy Rousset, and Patrice Coddeville. 2021. "Phosphate Buffer Solubility and Oxidative Potential of Single Metals or Multielement Particles of Welding Fumes" Atmosphere 12, no. 1: 30. https://doi.org/10.3390/atmos12010030
APA StyleGhanem, M., Perdrix, E., Alleman, L. Y., Rousset, D., & Coddeville, P. (2021). Phosphate Buffer Solubility and Oxidative Potential of Single Metals or Multielement Particles of Welding Fumes. Atmosphere, 12(1), 30. https://doi.org/10.3390/atmos12010030