Article

Diagnosing ISO Forecast from GloSea5 Using Dynamic-Oriented ISO Theory

1
Collaborative Innovation Center on Forecast and Evaluation of Meteorological Disasters and Earth System Modeling Center, Key Laboratory of Meteorological Disaster of Ministry of Education, Joint International Research Laboratory of Climate and Environment Change, Department of Atmospheric Science, Nanjing University of Information Science and Technology, Nanjing 210044, China
2
International Pacific Research Center, Department of Atmospheric Sciences, University of Hawaii, Honolulu, HI 96822, USA
3
Research Institute, 4D Solution, Co., Ltd., Seoul 08511, Korea
4
Operational Systems Development Department, National Institute of Meteorological Sciences (NIMS)/Korea Meteorological Administration (KMA), Jeju 63568, Korea
*
Author to whom correspondence should be addressed.
Atmosphere 2021, 12(1), 114; https://doi.org/10.3390/atmos12010114
Submission received: 23 November 2020 / Revised: 29 December 2020 / Accepted: 11 January 2021 / Published: 15 January 2021
(This article belongs to the Section Atmospheric Techniques, Instruments, and Modeling)

Abstract

:
A Madden–Jillian oscillation (MJO) and boreal summer intraseasonal oscillation (BSISO) are important climate variabilities, which affect a forecast of weather and climate. In this study, the MJO and the BSISO hindcasts from the Global Seasonal Forecast System, version 5 (GS5) were diagnosed using dynamic-oriented theories. We additionally analyzed the GS5 climatological run to identify whether the weakness of the GS5 hindcast results from the model physics or initialization processes. The GS5 hindcast captures three-dimensional dynamics and thermodynamics structure of MJO eastward propagation well in the Indian Ocean. The model produces the boundary layer (BL) moisture convergence anomalies to the east of the MJO deep precipitation with easterly anomalies associated with the Kelvin wave. The enhanced BL moisture convergence increases upward transport of moisture from the surface to the lower troposphere, inducing the moist lower troposphere and the positive convective instability by destabilization of the lower atmosphere and, thus, generating the next convection to the east of MJO deep convection and promoting MJO eastward propagation. However, the signal for eastward propagation is relatively weak in the Maritime Continent (MC) and the Western Pacific (WP). To improve the MJO eastward propagation in the MC and WP, improved heating induced by shallow (or congestus) clouds interacting with enhanced BL dynamics may be required. On the other hand, the GS5 hindcast reproduces the BSISO northward propagation reasonably well in the Indian Ocean, which is attributed to positive vorticity anomalies induced by strong vertical shear.

1. Introduction

The Madden–Julian oscillation (MJO) shows a convective system propagating eastward with a 20–70-day period over 15° S and 15° N. The sub-seasonal-scale prediction related to MJO is important for the forecast of extreme temperature, typhoons, heavy precipitation, and El Nino events [1,2,3]. Although the MJO predictions using general circulation models (GCM) have improved considerably, many prediction systems have a limitation to forecast the observed MJO characteristics [4].
Various mechanisms have been proposed to understand the propagation of the MJO. Many studies suggested the moisture–convection interaction and the transport of moist static energy may be a dominant factor for MJO [5,6]. A study [5] revealed that equatorward moisture advection and latent heat flux induced by wind may be critical for MJO simulation. Another process for the MJO is a coupled Kelvin and Rossby wave theory [7,8]. This theory emphasizes the interaction between a convective heating and boundary layer moisture convergence associated with the coupled Rossby–Kelvin wave. The boundary layer moisture convergence may induce major MJO propagation. The heating and moisture that are induced by boundary layer convergence precede the MJO major precipitation, which leads to the MJO-scale coupled Kelvin–Rossby wave structure with eastward propagation. Previous studies found that the stepwise transition from shallow to deep convection may be critical for MJO eastward propagation [9,10]. They emphasized the occurrence of shallow and congestus clouds before the development of the MJO deep convection and their gradual change to deep convection. The interaction between stratiform cloud and wave has been proposed for MJO [11,12]. They suggested that the stratiform clouds produce diabatic heating, which generates eddy available potential energy for MJO, which promotes the MJO eastward propagation.
Many studies found that cloud interacting with radiative processes may be a dominant mechanism for MJO [13,14]. The observation shows radiative heating anomalies are related to convective heating anomalies. A recent study [15] suggested a trio-interaction theory, which emphasizes the interaction among dynamics, moisture, and convective heating. The theory includes not only coupled Rossby–Kelvin dynamic mode but also moisture mode theories. They showed that the boundary layer dynamics can lead to the MJO eastward propagation, and the moisture and convective heating may contribute to the speed of eastward propagation [16,17,18].
Many studies have evaluated the forecast data on MJO propagation. A previous study5 showed that the NCEP climate forecast system version 2 does not capture MJO eastward propagation. A study [19] that the European Centre for Medium-Range Weather Forecast ensemble prediction system often produces poor MJO propagations due to both absent convective anomalies and incorrect ocean–atmosphere coupled processes in the Western Pacific and Maritime Continent. Another study [5] found from hindcast data of the Forecast-Oriented Low Ocean Resolution (FLOR) version of the Geophysical Fluid Dynamics Laboratory (GFDL) model a strong dependency of MJO prediction skill on target phase. A study [20] found that most reforecast data produce poor MJO propagation over the Maritime Continent due to incorrect cloud-radiation feedback. These results show that the MJO prediction for eastward propagation is still a big challenge issue although the MJO prediction skill has been considerably improved over a few past decades.
Boreal summer intraseasonal oscillation (BSISO) moves northward significantly in the Indian Ocean. The BSISO northward propagation begins near the equator, extends to the Bay of Bengal, affecting typhoon activities and extreme weather events [21,22,23].
Many processes have been proposed to understand the BSISO northward propagation in the Indian Ocean, including air-sea interaction, moisture advection in the boundary layer, and vorticity anomalies generated by vertical shear. The first is the dynamic theories encompassing wave dynamics and vorticity-wind shear [23,24,25]. A study suggested that the northward propagation of ISO convection may be generated by inducing a boundary layer moisture convergence to the north of the BSISO convection center [23]. Another study [26] suggested that not only moisture advection in the boundary layer but also barotropic vorticity anomalies contribute to the northward movement of BSISO precipitation. Another study [23] demonstrated that the interaction among wave dynamics, vorticity anomalies, and vertical wind shear is the dominant process for BSISO northward propagation in the Indian Ocean. The second is the role of convective momentum transport, which may induce boundary layer convergence by a secondary meridional circulation under the presence of an easterly shear [27]. The third is an effect of shallow convection has been emphasized [28].
A new version of the seasonal forecast system (hereafter “GS5”) was developed operationally. The GS5 is improved compared to that of the previous forecast system (GS4) in a few aspects: (1) increasing horizontal resolution of atmosphere, land, sea-ice, and ocean models; (2) a new initialization for the ocean and sea-ice model using three-dimensional-variation ocean data assimilation [29,30]. It was reported that the performance of the GS5 was improved for ENSO with reduced errors The GS5 shows better predictability for both the Arctic oscillation and the North Atlantic variability. It also shows improved prediction skills for the northwestern Pacific subtropical high which controls East Asia summer monsoon.
This study describes the analysis of the MJO and BSISO simulation using dynamic-oriented diagnostics. Section 2 introduces the GS5 sub-seasonal prediction system and describes the data and diagnostic methods used in this study. Section 3 exhibits the dynamic and thermodynamic structure of MJO, and we explain how the GS5 captures MJO eastward propagation and BSISO northward propagation. Section 4 shows a summary and further suggestions for better MJO simulation.

2. Data and Methods

We used the hindcast dataset produced by the sub-seasonal-to-seasonal prediction system of the Korea Meteorological Administration (KMA), which was formally operated by the Met Office (UKMO). The period of hindcasts is 1991–2016 with three ensemble members. The initial conditions for three ensembles are generated by the stochastic kinetic energy backscatter scheme, version 2 [31] (SKEB2). The predictions start on the 1st, 9th, 17th, and 25th of each month and are integrated for seven months [20]. To derive an average of MJO and BSISO performance, all hindcast datasets are composited from 1 November to 30 April. Additionally, we analyzed the climatological run (1991–2016) with the 1990s fixed forcings with one ensemble to estimate the model performance [32]. The precipitation anomalies are used from the Global Precipitation Climatology Project (GPCP) daily data [33] (1997–2016). The circulation, moisture, and temperature anomalies are derived from the European Center for Medium-Range Weather Forecast Reanalysis (ERA) version 5 [34] (1991–2016). National Oceanic and Atmospheric Administration (NOAA) outgoing longwave radiation data are used during 1991–2016 [35].
The GS5 includes atmosphere, land, ocean, and sea-ice components as a coupled model. The Met Office Unified Model Global Atmosphere 6.0 (GA6) is used for the atmosphere. The Nucleus for European Modeling of the Ocean (NEMO) is used for ocean, the Joint U.K. Land Environment Simulator (JULES) is implemented for land and the Los Alamos Sea Ice Model (CICE) is used for sea ice. The OASIS version 3 is used for a coupler [36]. The grid size of the atmosphere is about 0.55° degrees and 85 levels horizontally and vertically, respectively. The horizontal resolution of the ocean model is 0.258° degrees.
The GA6 includes a mass flux convective parameterization. The convection scheme is based on a single cloud [37]. This scheme allows only one cloud type among deep, middle, and shallow clouds when convection occurs. The shallow convection is generated when the neutral buoyancy level of a cloud is below 2.5 km, and the convective velocity of updraft is smaller than 0.02 m s−1. Otherwise, convection is treated as a deep cloud. The mid-level scheme occurs when the instabilities exit above the top of deep or shallow convection. The mass flux closure for deep convection uses a convective available potential energy (CAPE), while the closure for shallow convection is based on a simplified turbulence kinetic energy (TKE) budget. The entrainment rate for shallow convection is larger than that for deep convection [37].
The diagnostics used in this study are useful to examine whether a model produces the eastward propagation of the MJO statistically based on dynamical reasons [7]. The diagnostics are developed by regressing 20–70-day filtered anomalies of the diagnostic variables against the precipitation anomalies at the equatorial eastern Indian Ocean (EIO;10° S–10° N, 80 °–100° E), because the corresponding MJO precipitation and circulation are also most active and show symmetric features about the equator. These diagnostics select specific variables to show the structure of the intrinsic MJO mode. The first is boundary layer moisture convergence—the BLMC couples the Kelvin and Rossby waves and convection together, which selects eastward propagation because the BLMC is favorable for the MJO eastward propagation by generating lower-tropospheric heating and available potential energy to the east of precipitation center. The second is horizontal circulation. It was shown that the observed MJO propagation is linked to its horizontal circulation structure in the lower troposphere [7]. The low-level circulation anomaly includes a Kelvin wave to the east of the MJO deep convection and a Rossby wave to the west. It is observed that the ratio of maximum Rossby westerly speed to the maximum Kelvin easterly speed is about 0.8. The horizontal circulation structure depends on the characteristic of the convective heating. Since the convective heating is different from each model due to different parameterizations, it may induce different interactions between convective heating and equatorial wave dynamics. Thus, the horizontal circulation is included as a target variable for the MJO diagnostics. The third is the equivalent potential temperature (EPT). The observations show deep convection of the MJO occurs after the development of a deep moist layer in the lower troposphere. It also has been found that the maximum boundary layer moisture convergence occurs before the enhanced moisture field in the lower troposphere. The observed EPT shows an eastward-tilted vertical structure in the lower troposphere and the convective instability defined by the difference of the EPT between the lower and upper (or middle) troposphere is positive or enhanced before the development of MJO major convection [38]. Therefore, the horizontal structure of the EPT associated with the MJO center and convective instability is considered to be a diagnostic of the MJO.
For BSISO, we use diagnostics based dynamic theory and air-sea interaction. The diagnostics are made by regressing 20–70-day filtered anomalies of the variables against the precipitation anomalies at the equatorial eastern Indian Ocean (5° S–5° N, 80°–100° E), because the northward propagation of the BSISO is dominant between EIO and the Bay of the Bengal. The dynamic theory includes the role of vorticity anomalies induced by vertical wind shear and meridional moisture advection. It has been suggested that the presence of the mean state vertical shear generates the barotropic vorticity anomalies. The vorticity anomalies can be converted to the boundary layer moisture at the north of the BSISO center, contributing to BSIO northward propagation [23,24,25]. The air–sea interaction was also examined whether it can explain the northward propagation of ISO or not. It is found that warm SST anomalies by air–sea interaction destabilize the lower troposphere to the north of convection, which leads to northward propagation.

3. Results

3.1. Mean Climate in the Boreal Winter

Figure 1 shows biases of climatology in 2 m temperature, zonal winds in the lower troposphere, and precipitation from the GS5 hindcast and the GS5 climatological run during the boreal winter season (November–March). The GS5 hindcast shows weak warming in the Indian Ocean and moderate warming in the Maritime Continent and Western Pacific (Figure 1a), suggesting that the zonal gradient of mean near-surface temperature increase in the Indian Ocean. On the other hand, wet biases occur in the western Indian Ocean and Western Pacific but dry bias in the eastern Indian Ocean and Maritime Continent (Figure 1c). The biases of precipitation induce anomalous ascending motion in the western Indian Ocean and anomalous descending motion in the eastern Indian Ocean, which strengthens the Walker circulation and the anomalous easterly in the lower troposphere over the Indian Ocean (Figure 1e). The easterly anomalies in the Indian Ocean may be unfavorable for the MJO eastward propagation. Compared to those of the GS5 hindcast, the GS5 climatological run shows a weak warm bias of 2 m temperature in the western Indian Ocean, while weak cooling in the Western Pacific. The horizontal pattern of precipitation bias is similar to those of the GS5 hindcast. Corresponding zonal wind bias of the GS5 climatological run resembles those of the GS5 hindcast run, suggesting that the precipitation and zonal wind biases in the hindcast may be associated with the model systematic biases.

3.2. Basic Diagnostics in MJO Properties

The mean field biases systematically affect the MJO variance. Figure 2 shows the biases of filtered precipitation variance from the GS5 hindcast and GS5 climatological run. In the observation, the peak of the total variance is seen in the Indian Ocean and Western Pacific. The filtered variance only explains about 35–40% of the total variance (not shown). The GS5 hindcast reproduces the horizontal structure of variances reasonably but underproduces the variances in the Indian Ocean and Western Pacific. On the other hand, the GS5 climatological run overestimates the variance in the western Indian Ocean and Western Pacific. This result suggests that the initialization processes are related to the suppressed MJO amplitude of the GS5 hindcast.
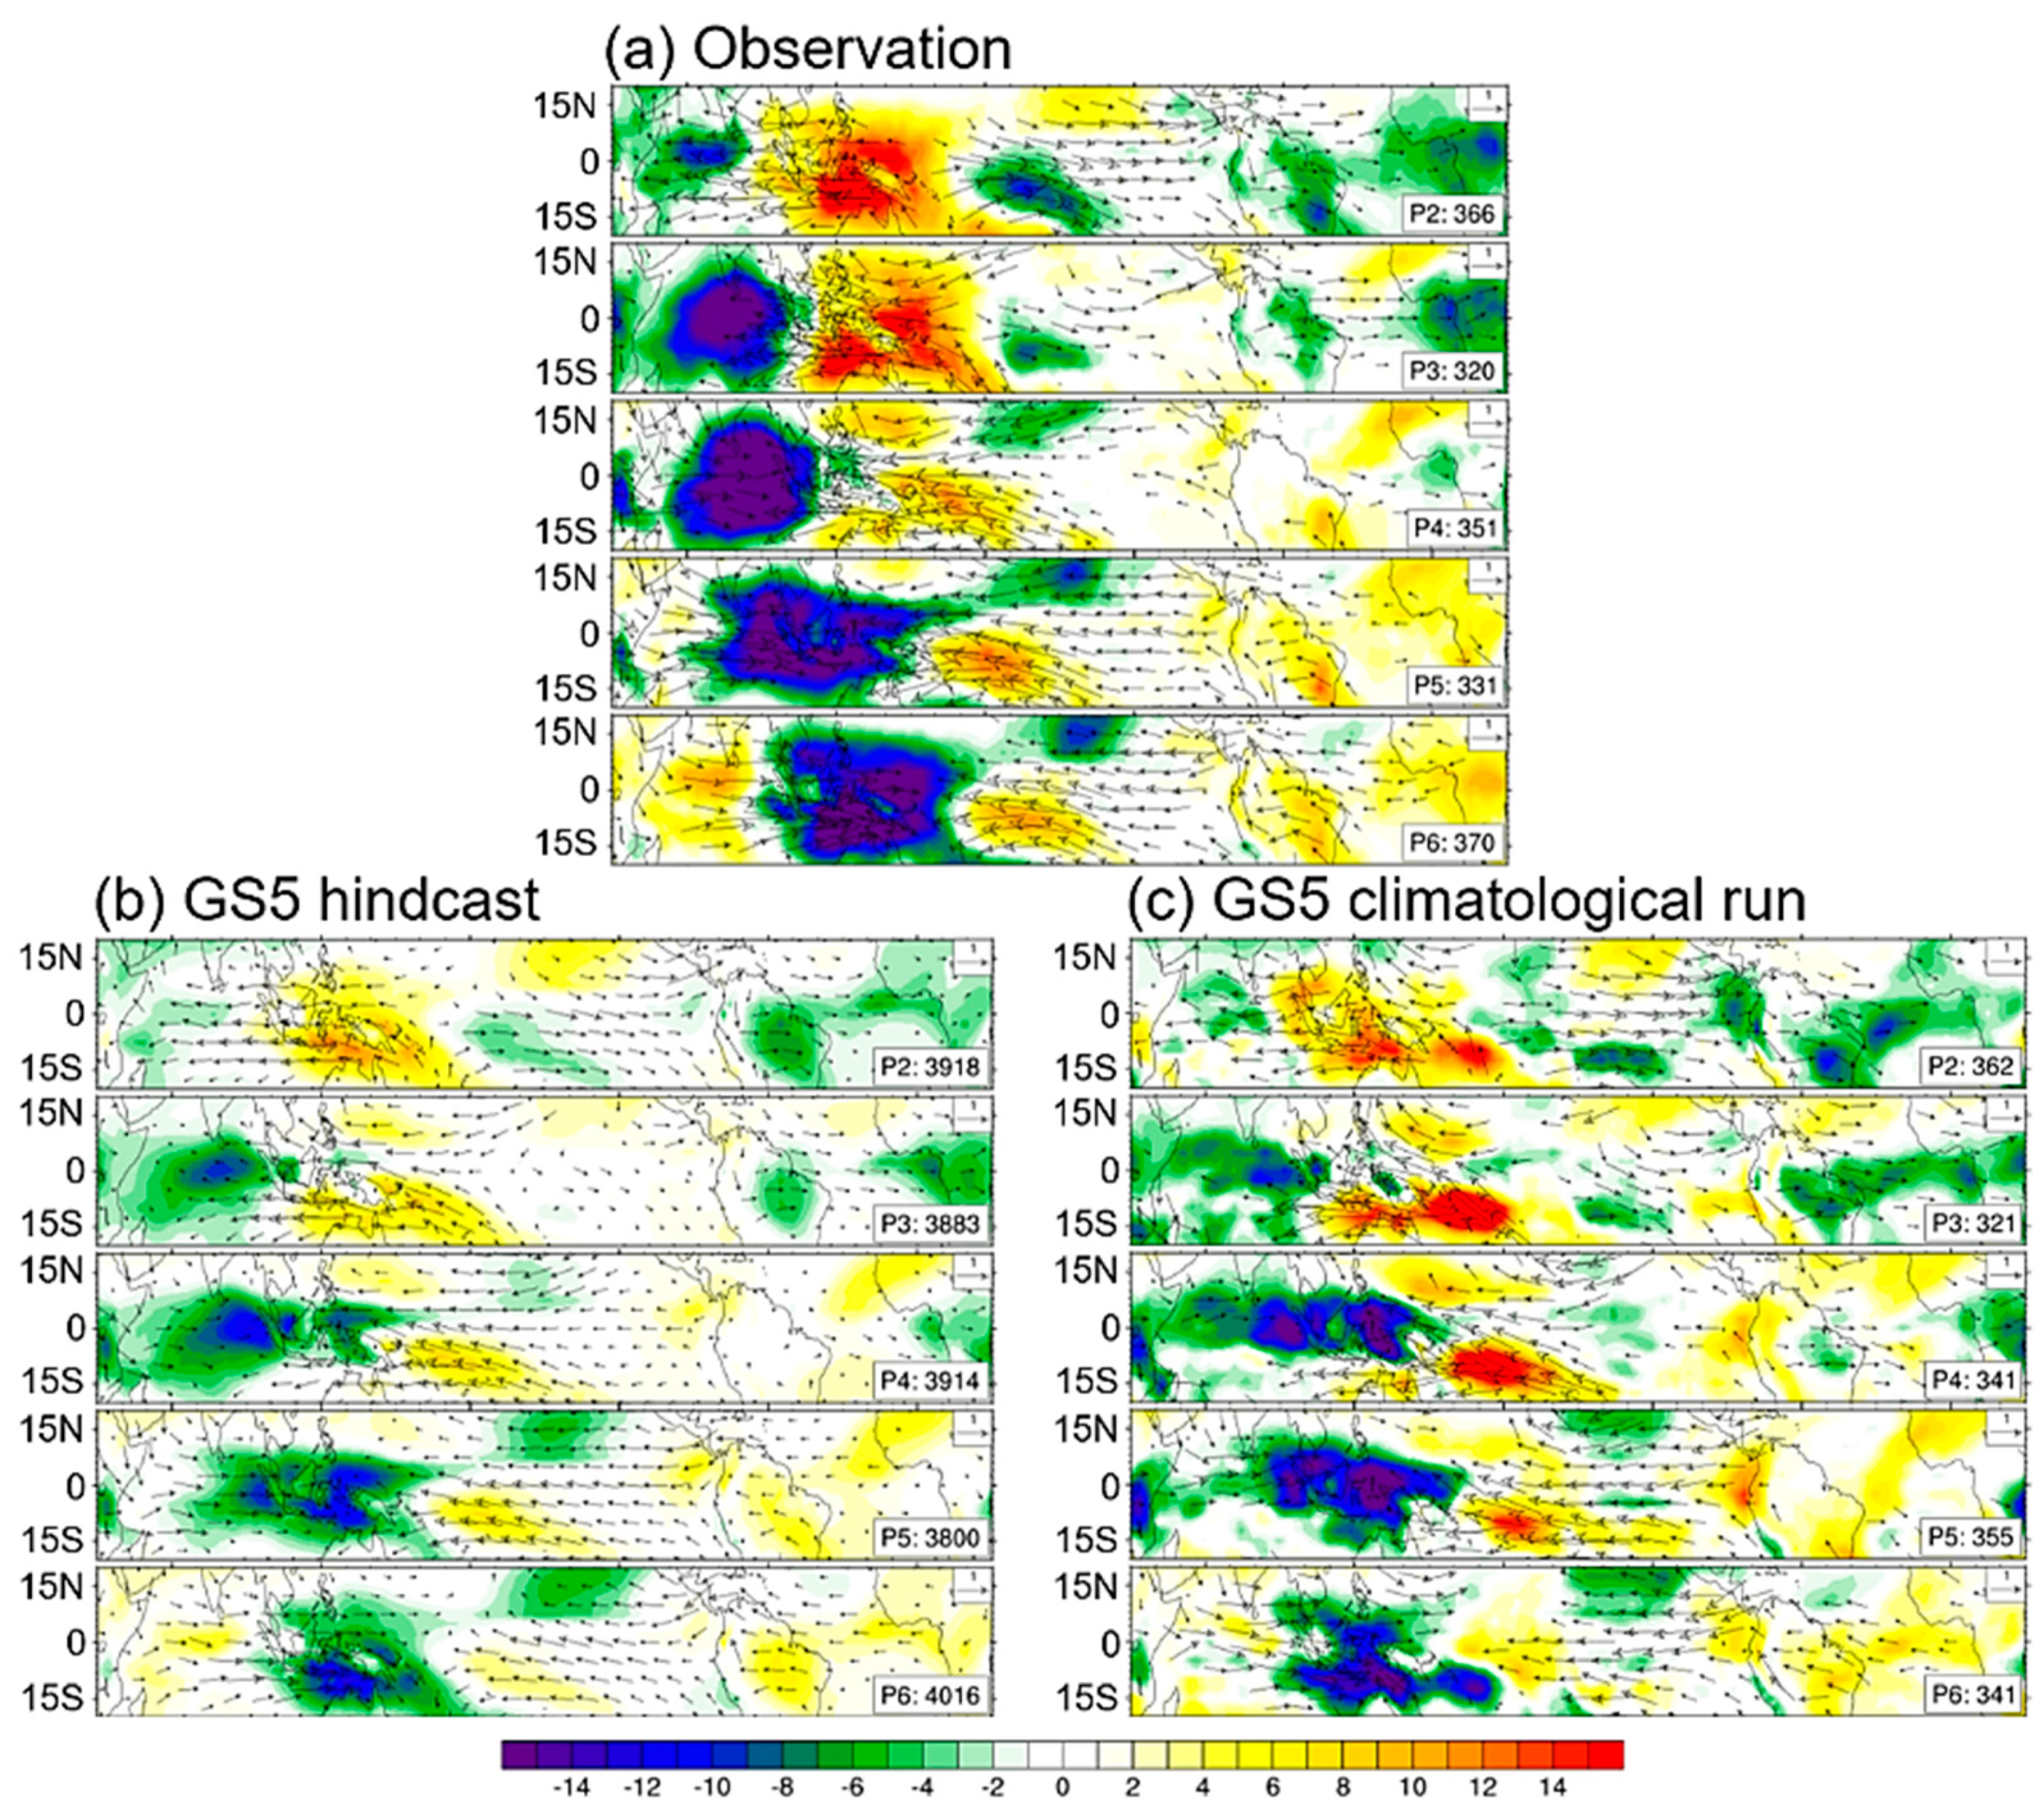
To examine the characteristics of MJO propagation in the Indian Ocean and Western Pacific in the model, phase 2 to phase 6 in the composite life cycles of outgoing longwave radiation (OLR) and horizontal winds at 850 hPa (U850) associated with the MJO is shown in Figure 3. The GS5 hindcast successfully captures the MJO eastward propagation in the Indian Ocean. However, the magnitude of convective anomalies is weaker than the observation from the Maritime Continent to the Western Pacific. The propagation of MJO convection near the equator is weakened at phase 6 to phase 8, suggesting that the eastward propagation in the GS5 is relatively weak in the Western Pacific. Compared to GS5 hindcast, the climatological run of the GS5 shows more intensified convective anomalies from the Maritime Continent to the Western Pacific at phase 6 to phase 8.
Figure 4 shows the analysis for the frequency–wavenumber spectrum of the precipitation anomalies from the observation, the GS5 hindcast, and the GS5 climatological run. In the observation, a maximum power occurs at 40–50-day periods and zonal wavenumber one. It is observed that the power for westward propagation is much weaker than those of the eastward movement. The GS5 hindcast has relatively strong eastward power at 40 days and relatively weak power at 70-day periods, suggesting that the GS5 hindcast simulates shorter periods than the observation. The GS5 hindcast can capture the planetary scale of convective anomalies (zonal wavenumber one) but fails to simulate a relatively small scale (zonal wavenumber two or three). The major weakness in the GS5 hindcast is a relatively weak power for both westward and eastward propagation compared to the counterpart of observation. The climatological run of the GS5 has eastward power at 50 days, which is longer than that of the GS5 hindcast and closer to the observation. The magnitude of the eastward propagation is larger than that of the GS5 hindcast but still weaker than the observation. The weak power of the GS5 hindcast are consistent with weak convective anomalies in MJO life cycle composite (e.g., Figure 3b) and weak variance (e.g., Figure 2a).
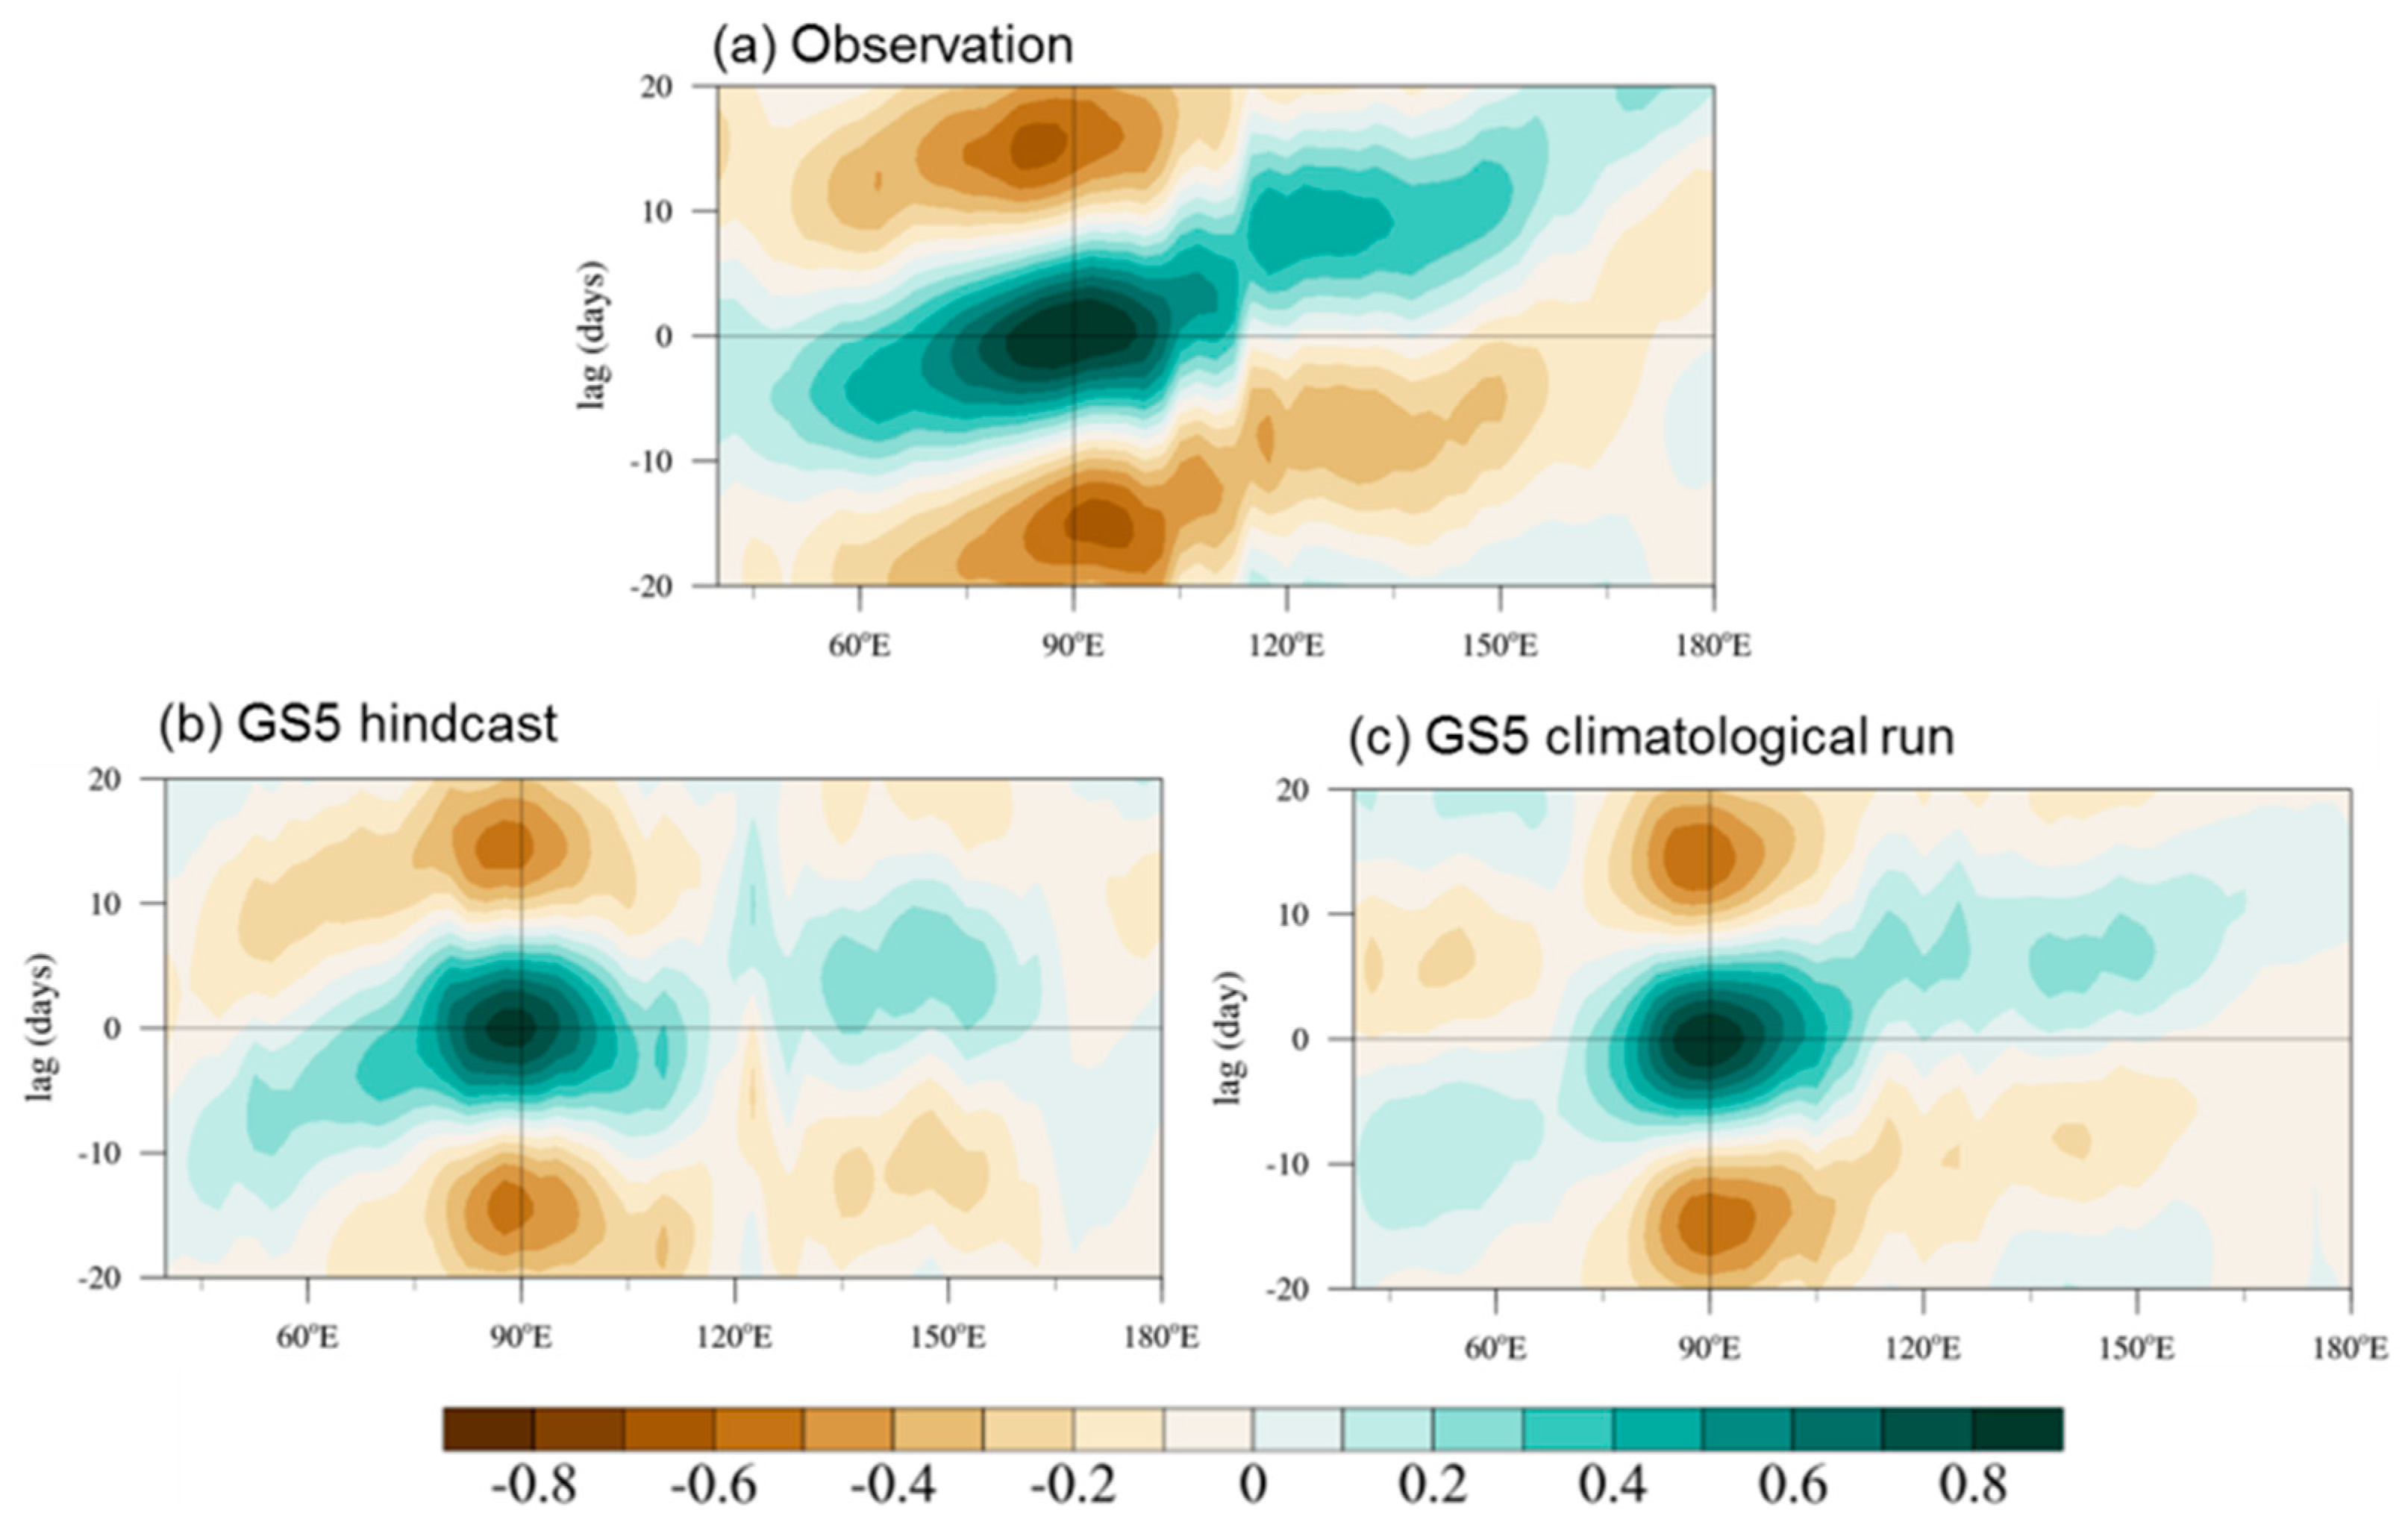
Figure 5 shows the lead–lag correlation of the MJO precipitation in the Indian Ocean and the Western Pacific. Because strong MJO eastward propagation occurs in the eastern Indian Ocean, the precipitation in the eastern Indian Ocean (80°–100° E, 10° S–10° N) was used as a reference. Observations show that the MJO precipitation moves eastward with a speed of 5.0 m s−1 for all events. The GS5 hindcast reproduces MJO eastward propagation. However, the magnitude of the propagation is relatively weaker, and the speed is faster (6.5 m s−1) in the Indian Ocean than the observation. In the Western Pacific and Maritime Continent, the signal for MJO eastward propagation of the MJO is not strong compared to the observation (Figure 5b). There is a strong propagation barrier around 120° E, where weak westward propagations are simulated. The weak westward propagation is consistent with the result of frequency–wave number spectrum analysis that shows the moderate power at westward propagation and a small horizontal scale. Compared to that of the GS5 hindcast, the GS5 climatological run shows weak eastward propagation in the Indian Ocean but stronger in the Western Pacific, suggesting that the weak eastward propagation of the GS5 hindcast in the Western Pacific may be related to the initialization processes rather than the model systematic biases.

3.3. Evaluation of MJO Simulations Using Dynamic-Oriented Diagnostics

We examine how the GS5 hindcast simulates the MJO eastward propagation in the IO but failed in the Maritime Continent and Western Pacific by analyzing the circulation and thermodynamic fields. By analyzing the boundary layer moisture convergence (Figure 6), the EPT (Figure 7), and convective instability (Figure 8), we can then conclude how the model simulates an MJO-related dynamic and thermodynamics structure. In the east of the MJO deep convection, the enhanced boundary moisture convergence increases moisture in the free atmosphere, which enhances the convective instability and further heating that affects horizontal circulation and boundary layer moisture convergence.
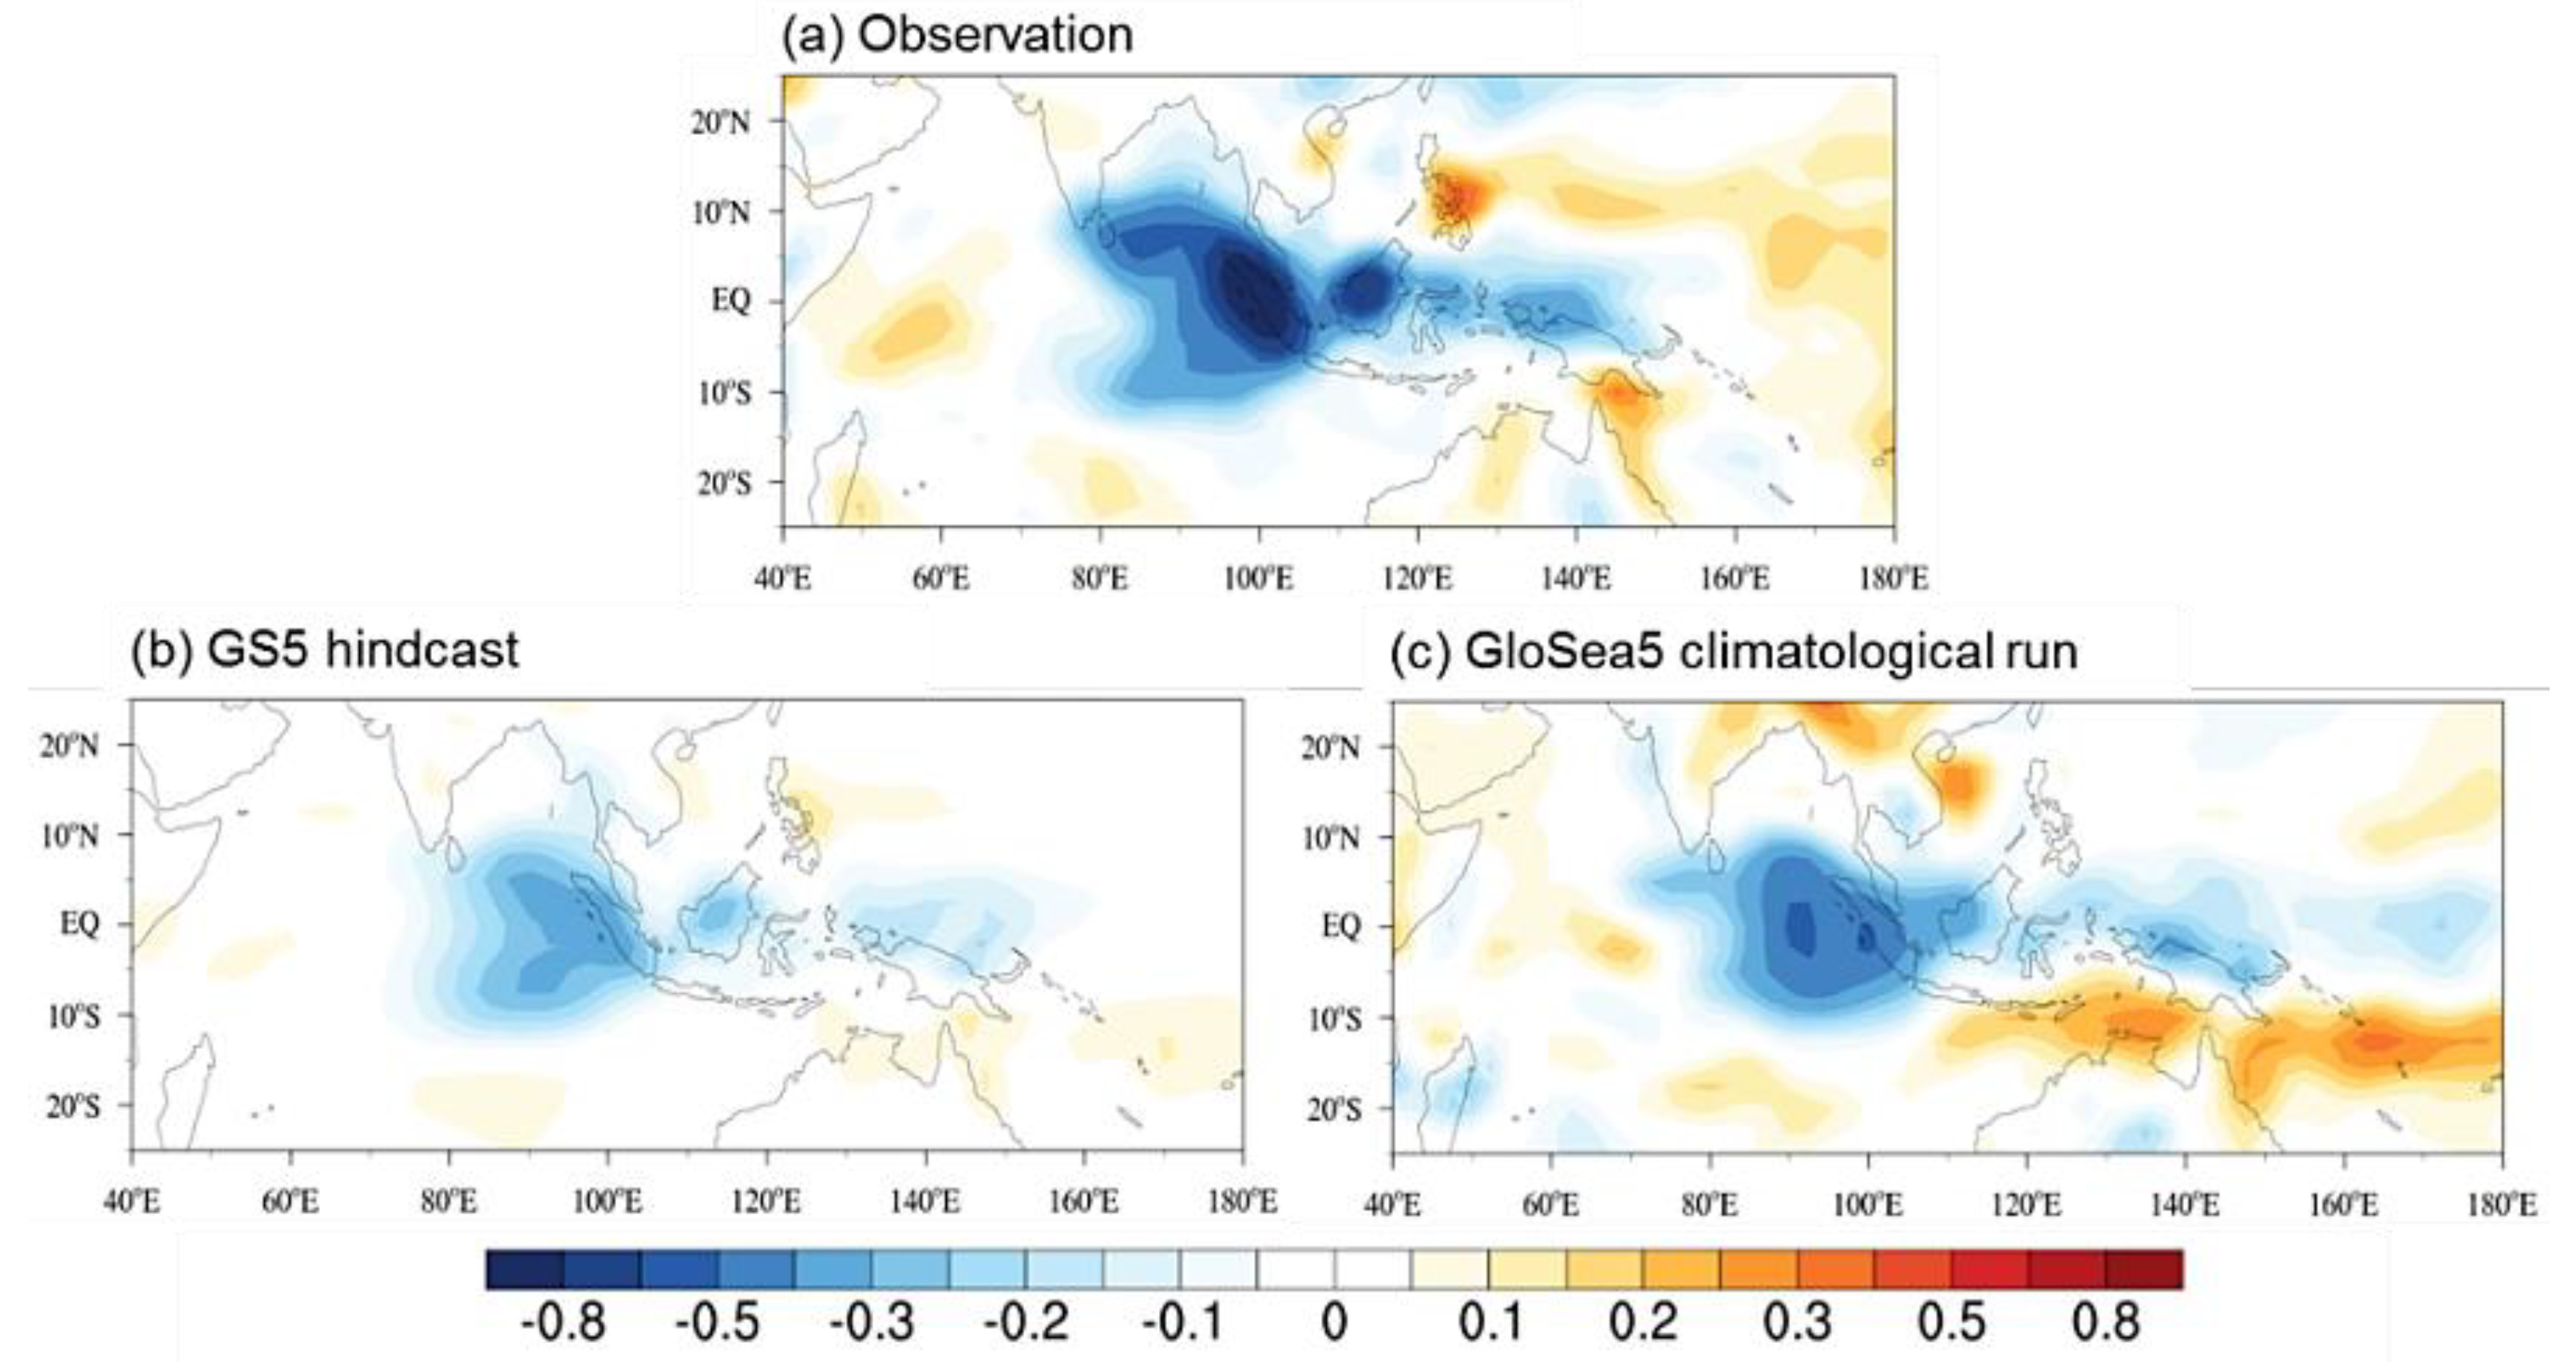
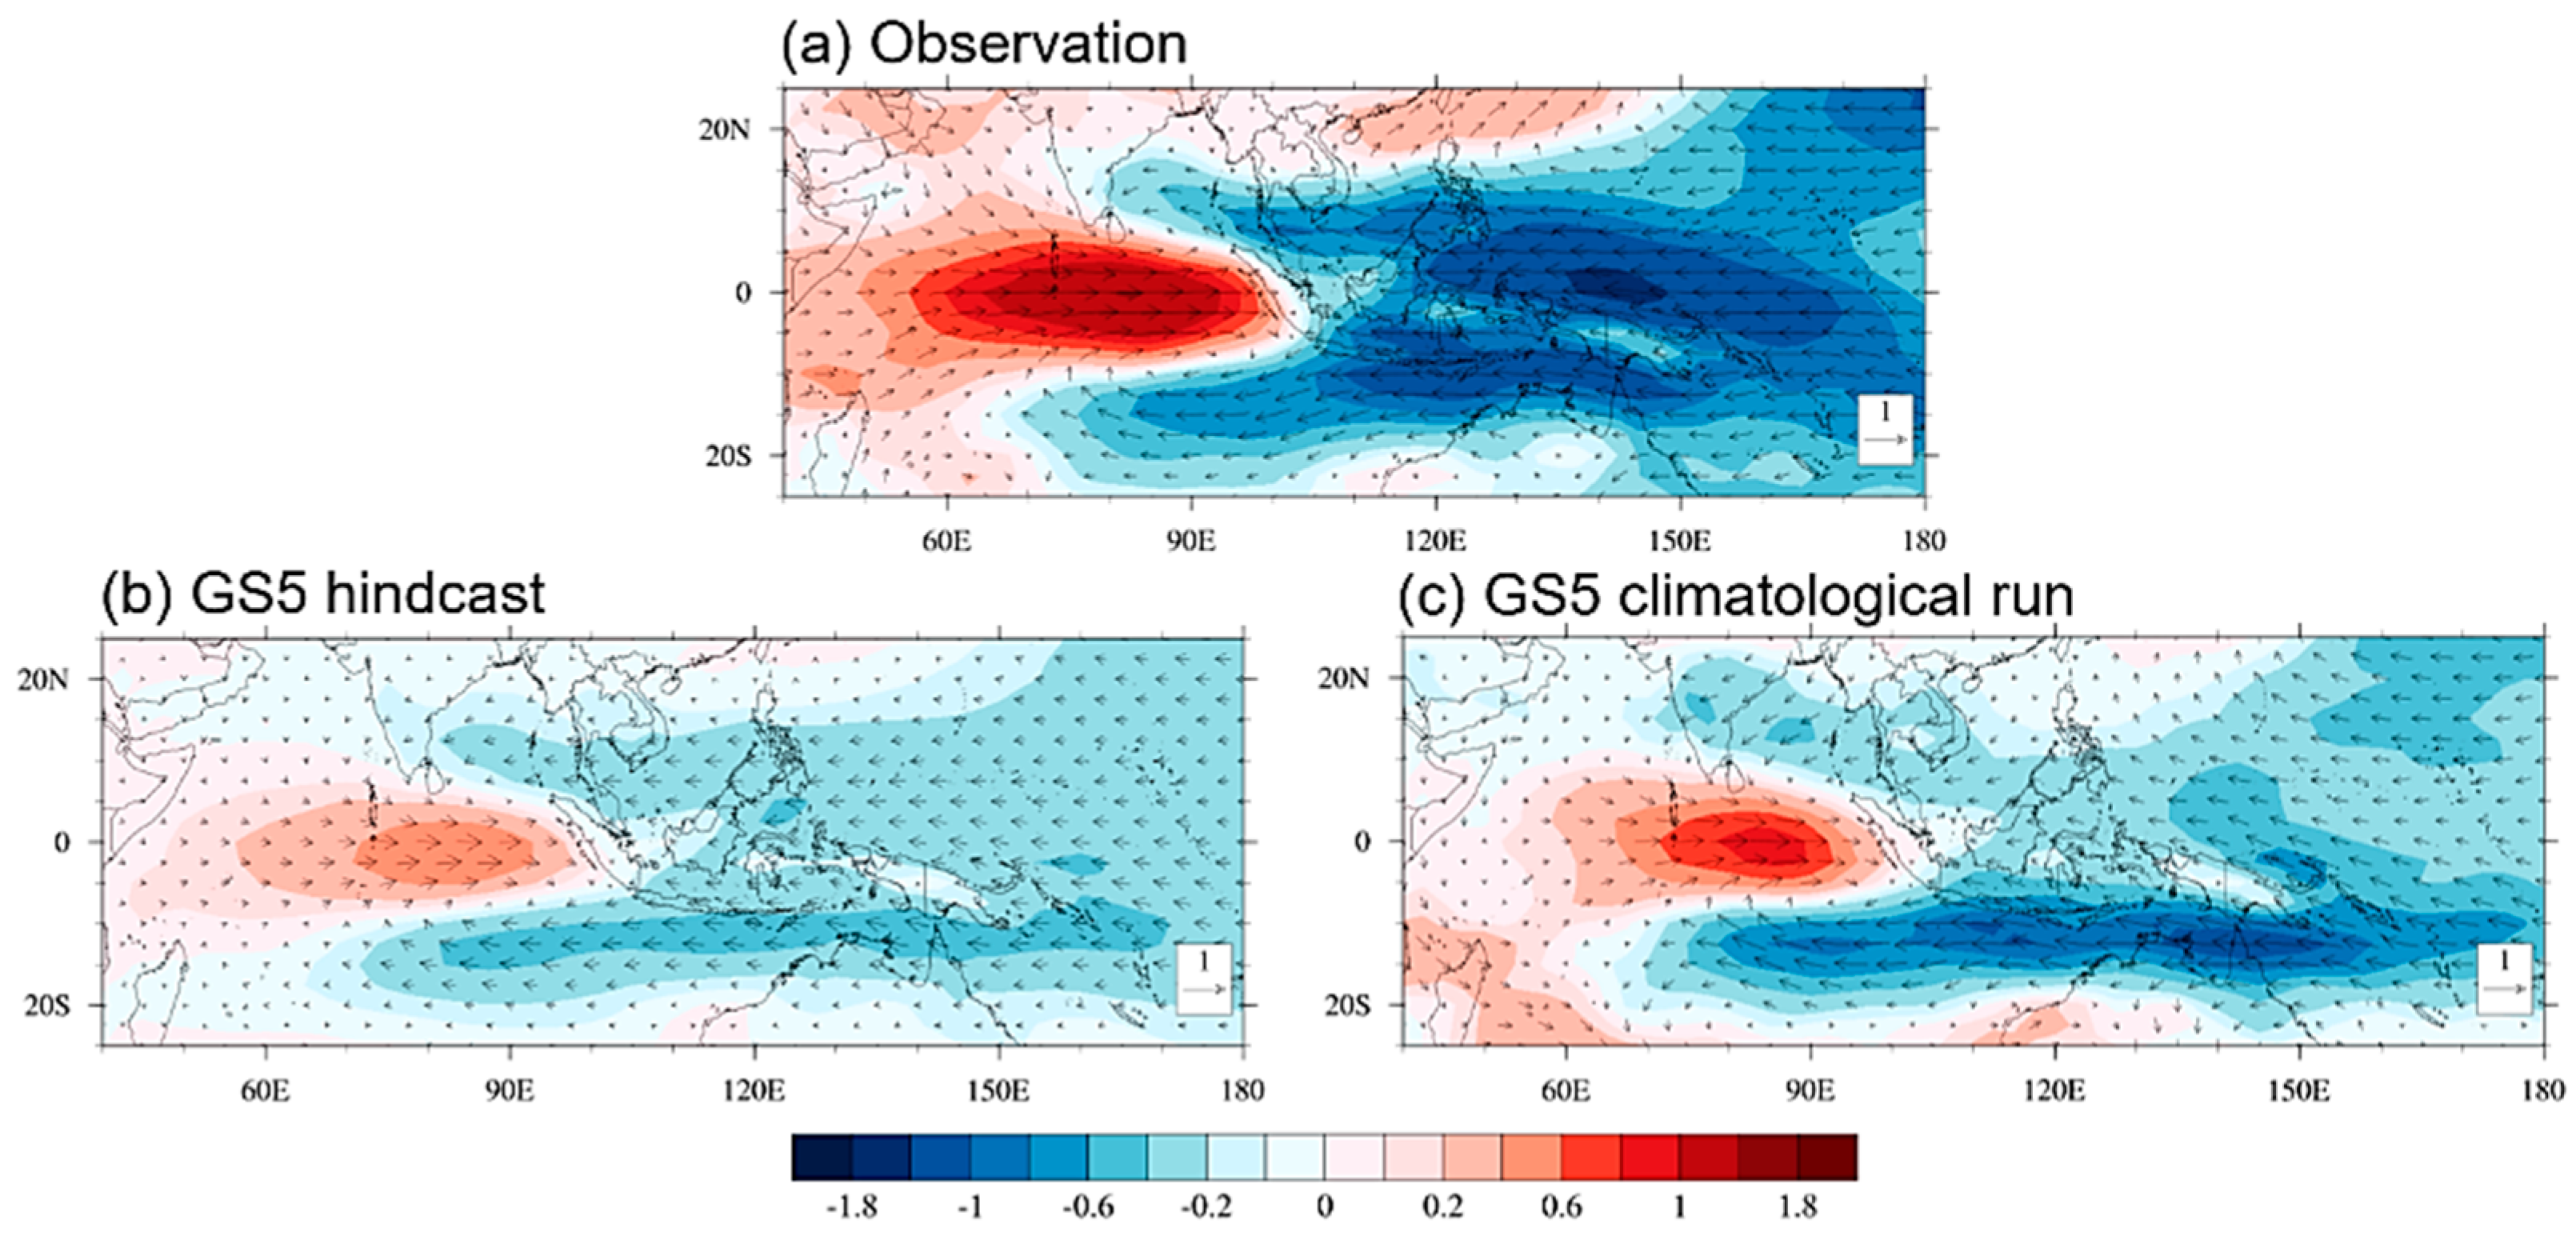
The 925 hPa boundary layer convergence from observation, the GS5 hindcast, and the GS5 climatological run are shown in Figure 6. In the observation, a peak of the BLMC occurs in the eastern Indian Ocean (EIO) where the major MJO precipitation center is generated. The magnitude of the BLMC in the Maritime Continent and Western Pacific is similar to that in the Indian Ocean. The GS5 hindcast reproduces the horizontal structure—its pattern is very similar to the observation with a pattern correlation of 0.80. However, the GS5 hindcast underproduces the magnitude in the Western Pacific. The magnitude of the BLMC over the EIO is larger than observation but weaker than the observation in the Western Pacific and Maritime Continent. Compared to the GS5 hindcast, the GS5 climatological run produces increased BLMC anomalies over the Indian Ocean and Western Pacific, but the magnitude is slightly weaker than the observation. These results suggested that the weak BLMC anomalies may result from initialization processes rather than model deficiencies.
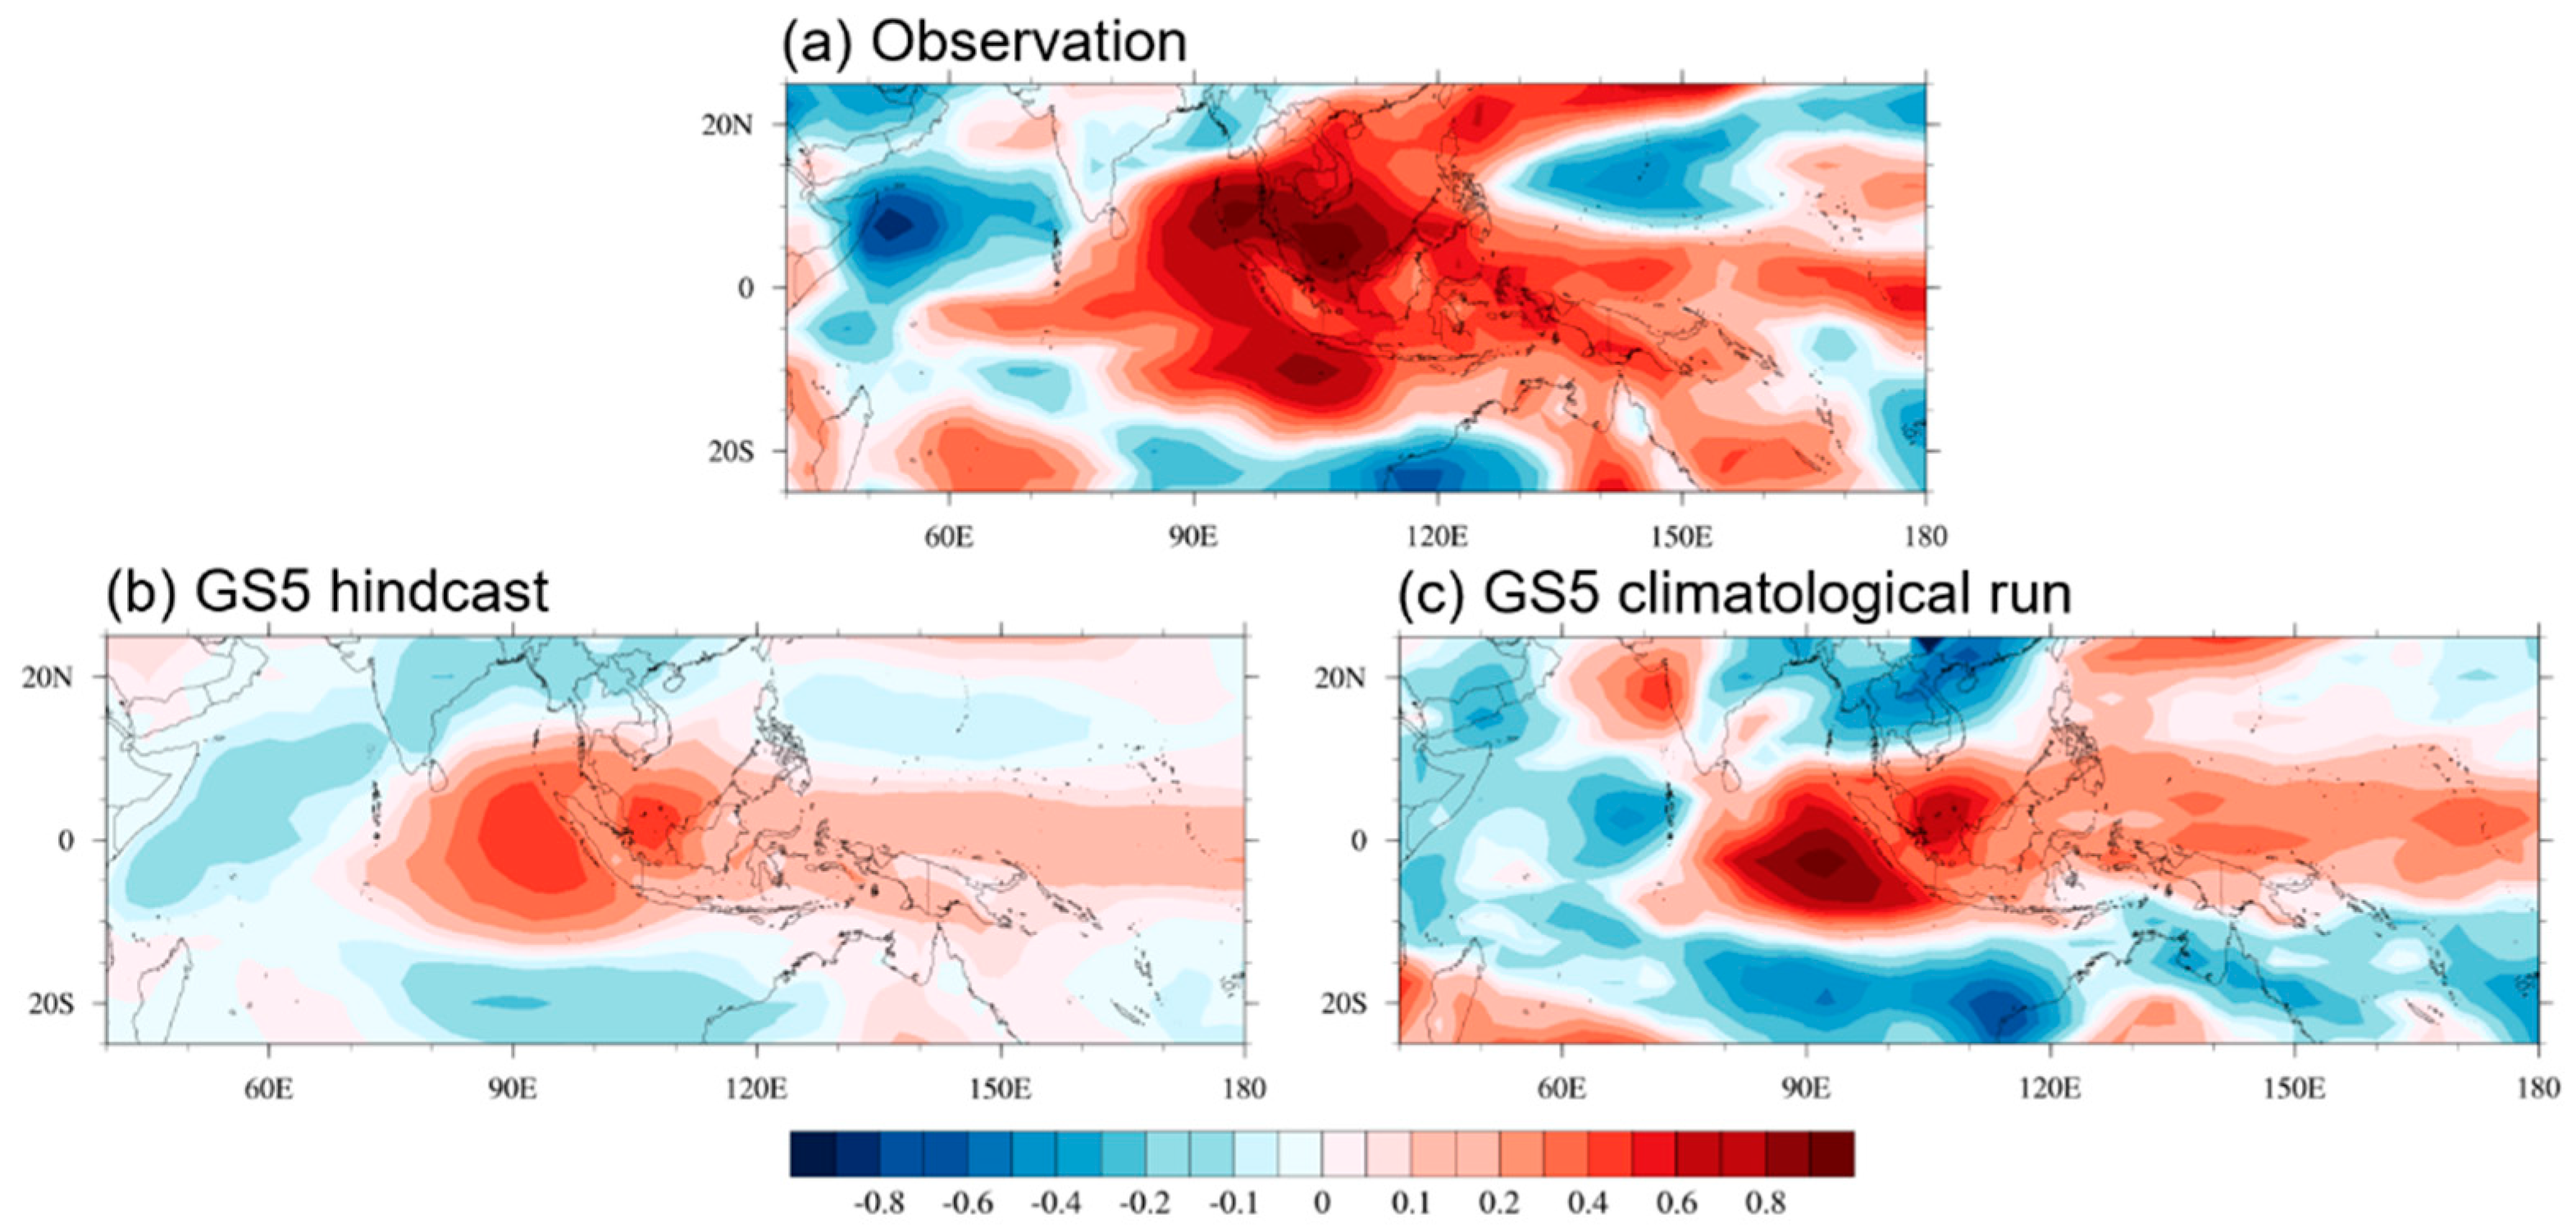
The BLMC can generate vertical motion, which transports the heat and moisture from the boundary layer to the lower troposphere. Previous studies suggested that the moist layer is gradually deepened from the surface in advance of the deep convective of the MJO [39]. The change in EPT anomalies primarily represents moisture variation, since the temperature anomaly is small in the tropical lower troposphere. We examined the EPT anomalies to better depict the moistening and destabilization processes. Figure 7 presents a horizontal pattern of the EPT anomalies from the observed, the GS5 hindcast, and the GS5 climatological run. In observation, the positive EPT occurs in the eastern Indian Ocean and Western Pacific. The maximum of the EPT is observed around 90° E, where the MJO deep convection occurs. The EPT anomaly extends eastward dominantly, indicating that the moistening in the lower atmosphere occurs before the MJO precipitation. Note that the horizontal patterns of the EPT anomalies are very similar to those of the boundary layer moisture convergence, indicating that, in the lower level, an increased EPT may result from strong BLMC. The GS5 hindcast reproduces the observed horizontal structure of EPT at 850 hPa successfully with a pattern correlation of 0.76. However, the strength of the EPT at the east of the MJO major precipitation is weaker than the observation, indicating that the lower atmosphere is less moistened at the east of the MJO precipitation. On the other hand, the horizontal pattern of the EPT anomalies from the GS5 climatological run resembles the observation. The magnitude of the EPT anomalies at the east of the MJO convection center is stronger than that of the GS5 hindcast. Note that the horizontal pattern of the EPT from the GS5 hindcast (or climatological run) is consistent with corresponding BLMC anomalies.
A pre-moistening in the lower troposphere may induce a positive convective instability in advance of MJO major precipitation. Figure 8 shows the horizontal structure of the convective instability anomalies from observation, the GS5 hindcast, and the GS5 climatological run. The difference between the EPT at 850 hPa and the EPT at 400 hPa is used as a convective instability index [25], because this index can represent the destabilizing condition before the MJO major precipitation. In the observation, a convective instability at the MJO major precipitation is negative, but it changes to positive in the Maritime Continent and Western Pacific, suggesting that the next convection may be generated there. The GS5 hindcast produces negative instability in the Indian Ocean and positive instability at the Maritime Continent and Western Pacific, but the magnitude is weaker than the observation. The GS5 climatological run produces stronger positive instability in the Western Pacific but still weaker than the observation. The weak convective instability is associated with weak EPT at the lower troposphere (e.g., Figure 7).
The convective heating by shallow or congestus clouds that was enhanced by the positive EPT may change the circulation structure related to the MJO. The observation shows the Kelvin wave is closely coupled with the Rossby wave around the convective center in the eastern Indian Ocean (Figure 9). The peak of easterly at the equator is comparable to the peak of westerly. The horizontal circulation pattern of the GS5 hindcast is similar to the observed circulation patterns. The GS5 hindcast shows the Rossby (Kelvin) wave pattern in the west (east) of the MJO precipitation, showing a coupled Kelvin–Rossby wave structure. However, the magnitude of the easterly anomalies is weaker than the observation. The westerly is slightly stronger than the easterly. Compared to the GS5 hindcast, the GS climatological run shows similar horizontal structures of the circulation with a relatively large magnitude. However, the magnitude of the easterly anomalies is weaker than that of the westerly. This result indicates that the weak low pressure in the east of MJO precipitation and easterlies from the GS5 hindcast may be attributed to the parameterization deficiency from the GS5 hindcast.

3.4. Diagnosing BSISO Simulations

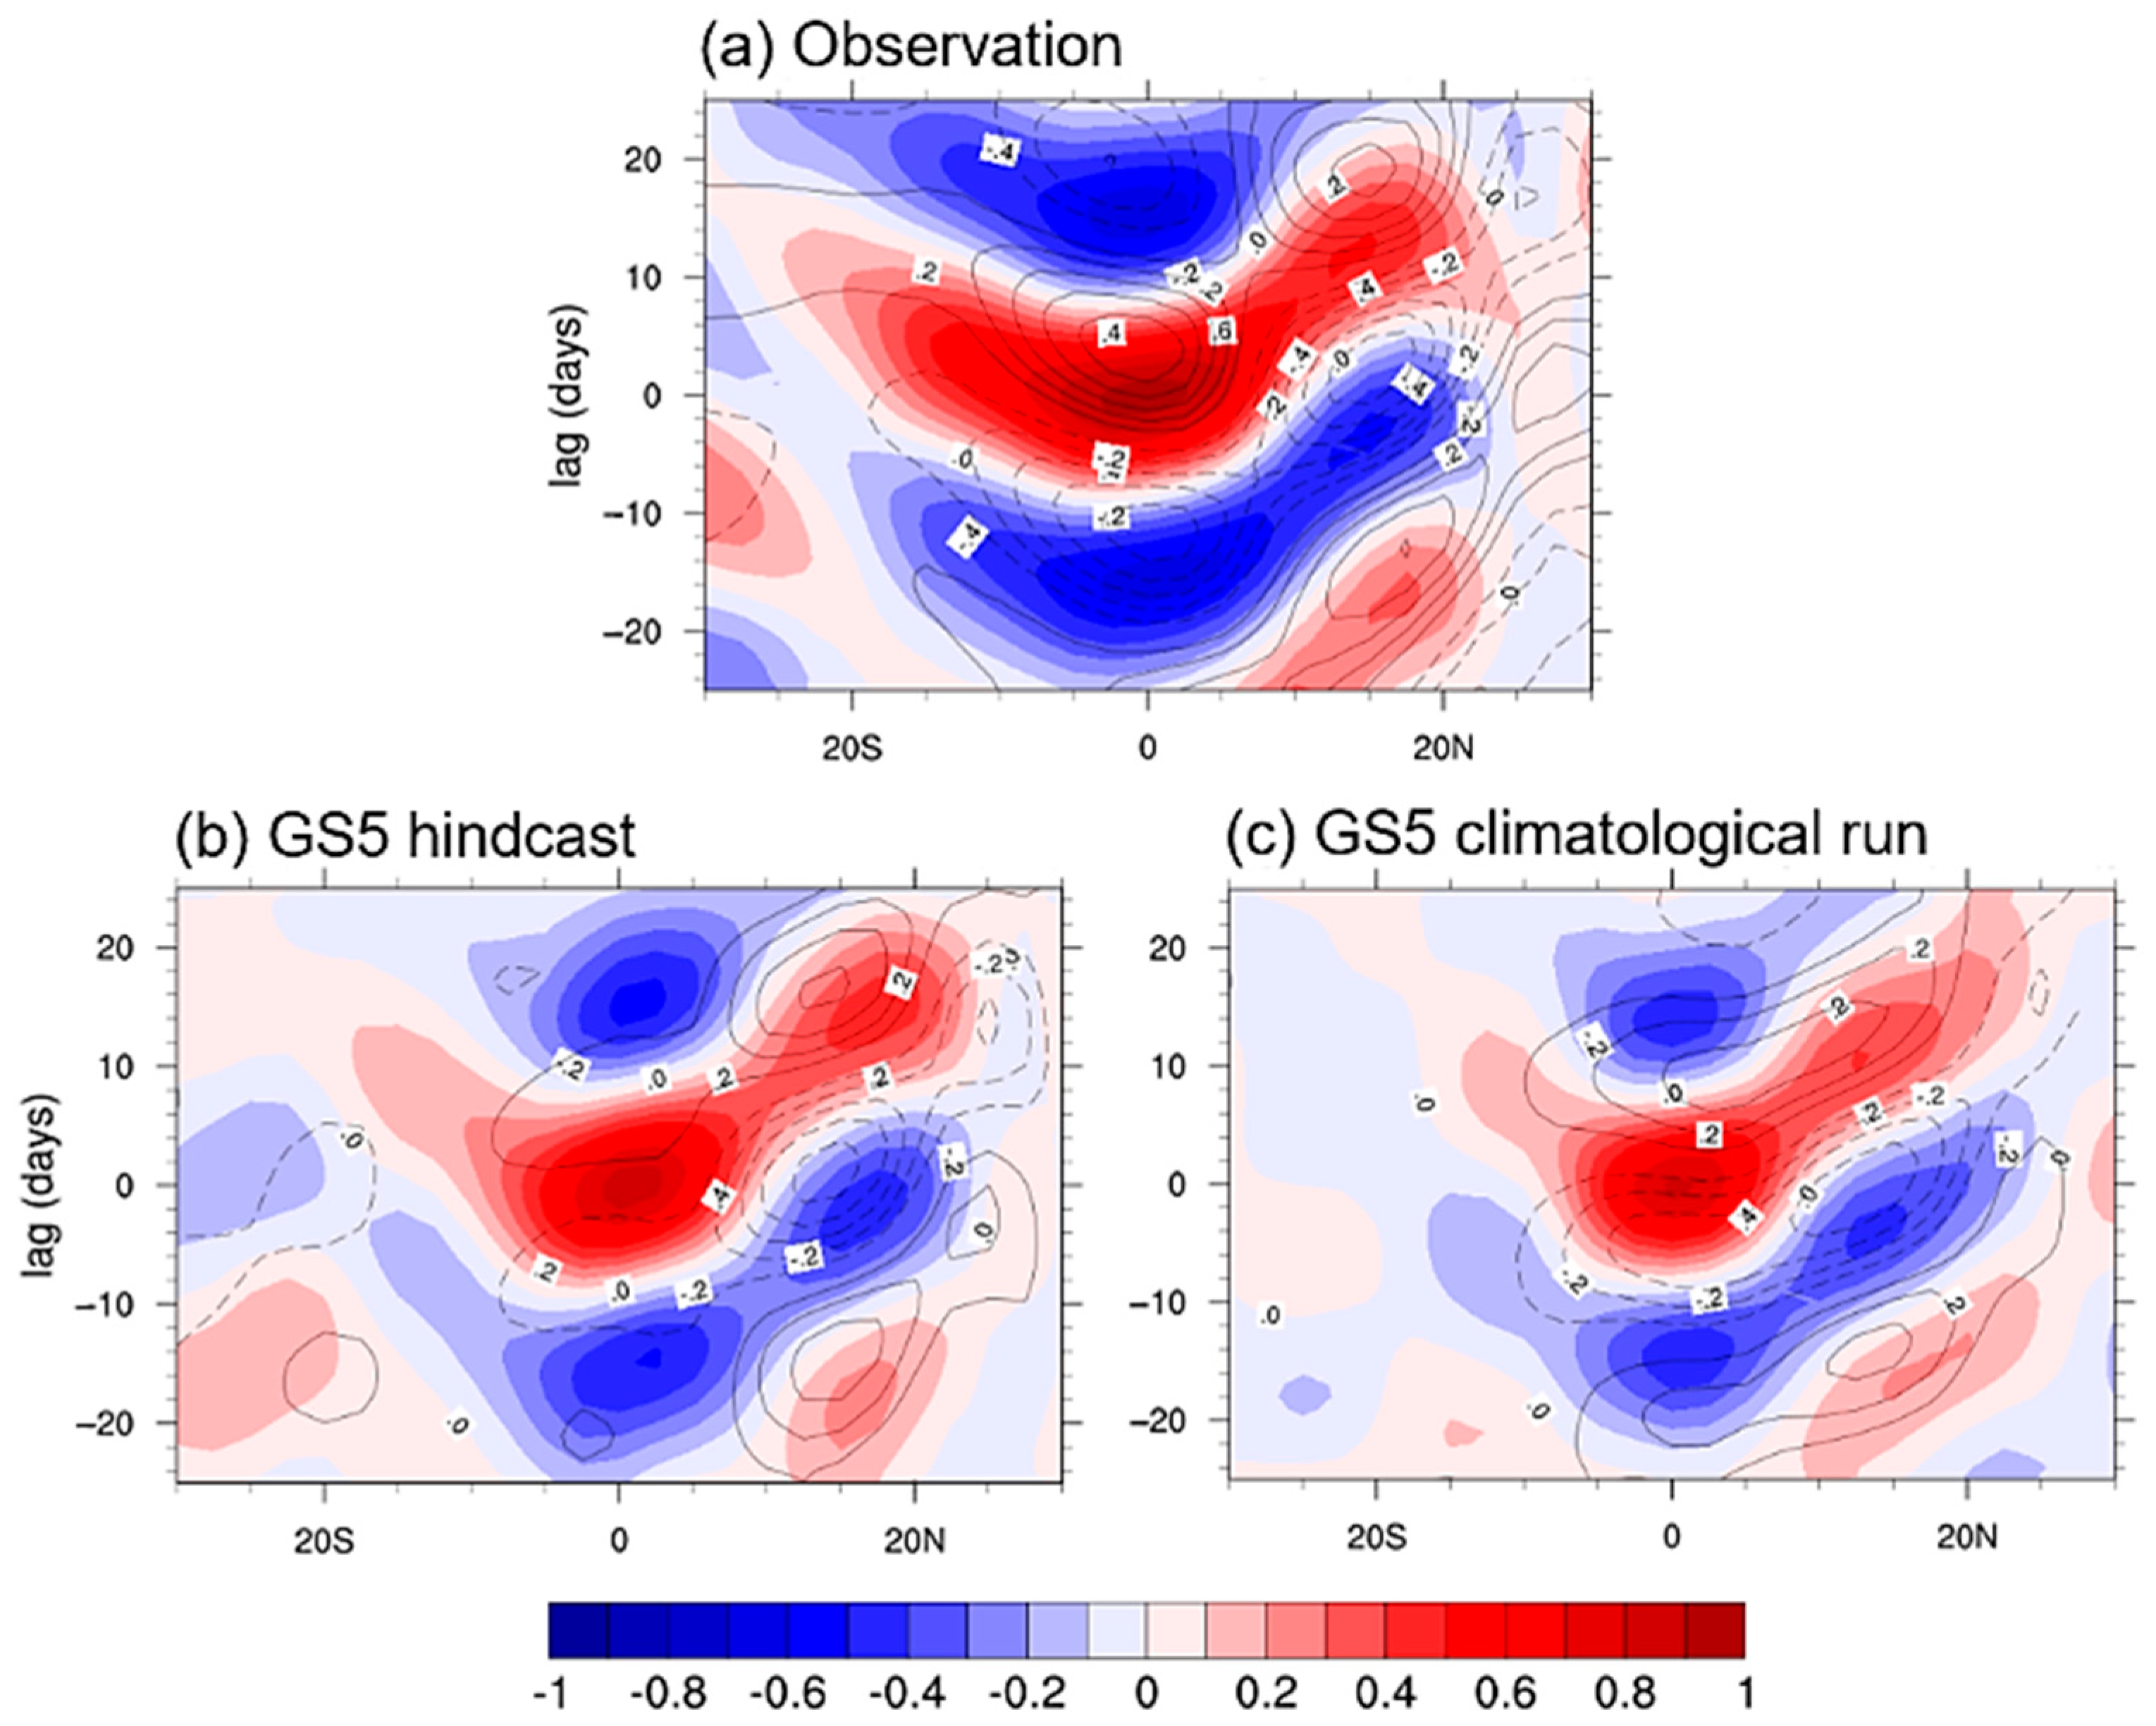
The meridional structure of lagged correlation diagrams of intraseasonal oscillation (ISO) precipitation from the observation and the GS5 hindcast and the GS5 climatological run are shown in Figure 10. It is observed that the BSISO precipitation moves northward with a speed of 1 m s−1 from the equator to the Bay of the Bengal in the eastern Indian Ocean. In the GS5 hindcast, BSISO precipitation moves northward significantly in the EIO. However, the magnitude of the northward movement is relatively weak, and the speed of the movement is relatively slow with 0.8 m s−1. The GS5 climatological run produces observed northward propagation between 0°–20° N with 0.9 m s−1, which is closer to the observation.
We examined mean-field circulation to understand which processes generate the ISO northward propagation in the GS5 hindcast. Figure 11a shows the mean vertical zonal wind shear for the boreal summer (May–October). The difference between zonal wind at 200 hPa and zonal wind at 850 hPa (U200 minus U850) is defined as vertical shear in the eastern Indian Ocean. The observation shows the easterly vertical shear from 10° S to 25° N and the maximum shear occurs near 5° N. The GS5 hindcast captures the meridional structure of vertical shear reasonably. However, the peak of the vertical shear occurs at about 10° N, which shifts northward.
A barotropic vorticity anomaly may be generated by the strong vertical shear, which can generate the barotropic effects [23]. The meridional structure of vorticity anomalies at 925 hPa in the eastern Indian Ocean is shown in Figure 11b. The observation shows dominant positive vorticity anomalies near the ISO convection center and northward propagation (~15° N). The model reproduces the meridional structure of the vorticity anomalies successfully. The peak of vorticity is larger than the observation and its location shifts northward, suggesting that vertical wind shear is closely associated with the vorticity anomalies. The change in vorticity can generate BLMC at 925 hPa (Figure 11c). In observation, the peak of BLMC occurs around the ISO center. The BLMC anomalies are positive up to 15° N, implying that convection can be generated there. The GS5 hindcast simulates stronger BLMC than the observation between 5° S and 12° N but weaker around 15° N–20° N. The abundant moisture in the lower atmosphere generates positive EPT anomalies. The positive EPT can generate a positive convective instability there. Figure 11d shows the meridional pattern of convective instability. It is observed that convective instability at the ISO major convection is negative, but it turns positive to the north of ISO precipitation (5° N–20° N), suggesting that the next convection can be generated there. The GS5 hindcast simulates the observed meridional pattern of convective instability with a slightly stronger magnitude.
On the other hand, between 15° N–20° N, the vorticity anomalies and the BLMC are smaller than the observation, but the convective instability is higher than the observation, which suggests that other mechanisms or processes may play a role on the BSISO northward propagation there. We examined the meridional advection of mean moisture and air–sea interaction. The meridional gradient of mean moisture is smaller than the observation between 15° N–20° N, suggesting that the meridional advection of mean moisture plays a minor role in the BSISO northward propagation there (Figure 11e). For the air–sea interaction mechanism, the regressed SST anomalies from the GS5 hindcast are comparable with the observation between 15° N–20° N, indicating that air–sea interaction may be critical for the BSISO northward propagation there (Figure 11f).

4. Summary and Discussion

In this study, the MJO simulation of the GS5 hindcast was examined. The MJO propagation pattern of the GS5 hindcast is close to the observation. To diagnose the MJO simulation of the GS5 hindcast, we used dynamic-oriented trio-interaction theory, which emphasizes how the BL convergence affects the lower tropospheric moistening and heating. The results show that the GS5 has a better performance of the MJO structure for the eastward propagation with observed thermodynamic structures.
The GS5 hindcast simulates positive BLMC anomalies at the east of the MJO precipitation center with relatively weak magnitude, which enhances the moistening of the lower troposphere. The enhanced EPT facilitates the MJO convective instability, which generates the MJO eastward propagation. The result of the GS5 hindcast shows the important role of the boundary layer moisture convergence, which interacts with convective heating and wave dynamics in the lower troposphere, which is consistent with the trio-interaction theory [15]. The GS5 hindcast reproduces a reasonable MJO dynamic and thermodynamic pattern. The equivalent potential temperature (EPT) extends eastward in the lower troposphere, suggesting that the GS5 hindcast can reproduce the moistening and the destabilization before the MJO deep convection center.
However, the GS5 hindcast needs to be improved for more accurate MJO prediction—the signal of MJO propagation is relatively weak in the Maritime Continent and Western Pacific. In the aspect of the mean state field, the easterly anomalies are not favorable for the eastward propagation of the MJO. Based on dynamic-oriented diagnostic, the GS5 hindcast data simulate relatively weak BLMC at the east of MJO convection center, particularly over the Maritime Continent. Additionally, the climatological run of the GS5 shows a similar problem in BLMC anomalies, suggesting that the weak BLMC anomalies may result from the model problem rather than the initialization processes of the hindcast data. We speculate that the weak BLMC can be improved by adding a convective trigger or new shallow convection. For example, if we added a convective trigger, it would enhance diabatic heating to the east of the MJO major precipitation in the lower tropospheric, which increases Kelvin waves easterly (lower pressure) and enhances the BL moisture convergence (BLMC) to the east of the MJO center. The shallow convection can reinforce the upward transport of moisture and heat from the boundary layer to the lower troposphere, thus increasing the BLMC feedback to the shallow and congestus cloud heating. As a result, the shallow convective schemes can promote the interaction between the BLMC and shallow/congestus cloud heating and enhance both the BLMC and lower tropospheric heating to the east of the MJO center [18,25]. We do not know what causes the faster propagation speed clearly, but it is assumed that it may be dependent on precipitation intensity. This issue will be examined in the subsequent studies.
In this study, the role of vorticity anomalies generated by vertical zonal wind shear, meridional moisture advection of the mean specific humidity, and air–sea interaction on BSISO northward propagation of the GS5 hindcast data are investigated in the eastern Indian Ocean. The GS5 hindcast simulates realistic northward propagation of the ISO precipitation over EIO with a slightly slower speed of about 0.85 m s−1 from EIO to the Bay of Bengal. The model captures the observed vertical wind shear over the EIO during boreal summer; it generates cyclonic vorticity by coupling the barotropic and baroclinic modes, and it increases the EPT by the enhanced boundary layer moisture convergence (BLMC). The increased EPT in the lower level generates positive convective instability to the north of the ISO precipitation and thus ISO northward propagation. On the other hand, it is found that the air–sea interaction mechanism is dominant between 15°–20° N rather than vorticity anomalies by zonal wind shear.

Author Contributions

Y.-M.Y., K.-Y.K., J.-Y.M., and Y.-K.H. conceived the idea. T.S. performed the analyses. Y.-M.Y. and J.-Y.M. wrote the manuscript. All authors provided critical feedback and helped shape the research, analysis, and manuscript. All authors have read and agreed to the published version of the manuscript.

Funding

This research was funded by the Korea Meteorological Administration Research and Development Program, grant number KMI2020-01310.

Institutional Review Board Statement

Not applicable.

Informed Consent Statement

Not applicable.

Data Availability Statement

All observed data used in this study are publicly available, and new data generated from this study are available upon request.

Acknowledgments

This work was funded by the Korea Meteorological Administration Research and Development Program under Grant KMI2020-01310. We acknowledge the Met Office for allowing us to use data from GS5 climate model control experiments (GC2).

Conflicts of Interest

The authors declare no conflict of interest.

References

  1. Shi, L.; Alves, O.; Hendon, H.H.; Wang, G.; Anderson, D. The role of stochastic forcing in ensemble forecasts of the 1997/98 El Nino. J. Clim. 2009, 22, 2526–2540. [Google Scholar] [CrossRef]
  2. Vitart, F.; Molteni, F. Simulation of the Madden–Julian Oscillation and its teleconnections in the ECMWF forecast system. Q. J. R. Meteorol. Soc. 2010, 136, 842–855. [Google Scholar] [CrossRef]
  3. Waliser, D.E. Intraseasonal variability. In The Asian Monsoon; Springer: Berlin/Heidelberg, Germany, 2006; pp. 203–257. [Google Scholar]
  4. Jiang, X.; Waliser, D.E.; Xavier, P.K.; Petch, J.; Klingaman, N.P.; Woolnough, S.J.; Guan, B.; Bellon, G.; Crueger, T.; DeMott, C.; et al. Vertical structure and physical processes of the Madden–Julian Oscillation: Exploring key model physics in climate simulations. J. Geophys. Res. Atmos. 2015, 120, 4718–4748. [Google Scholar] [CrossRef]
  5. Maloney, E.D.; Sobel, A.H.; Hannah, W.M. Intraseasonal variability in an aquaplanet general circulation model. J. Adv. Model. Earth Syst. 2010, 2, 1–24. [Google Scholar] [CrossRef]
  6. Benedict, J.J.; Benedict, J.J.; Maloney, E.D.; Sobel, A.H.; Frierson, D.M.W. Gross moist stability and MJO simulation skill in three full-physics GCMs. J. Atmos. Sci. 2014, 71, 3327–3349. [Google Scholar] [CrossRef]
  7. Wang, B. Dynamics of tropical low-frequency waves: An analysis of the moist Kelvin wave. J. Atmos. Sci. 1988, 45, 2051–2065. [Google Scholar] [CrossRef]
  8. Wang, B.; Rui, H. Dynamics of the coupled moist Kelvin–Rossby wave on an equatorial β-plane. J. Atmos. Sci. 1990, 47, 397–413. [Google Scholar] [CrossRef] [Green Version]
  9. Kikuchi, K.; Takayabu, Y.N. The development of organized convection associated with the MJO during TOGA COARE IOP:trimodal characteristics. Geophys. Res. Lett. 2004, 31, L10104131. [Google Scholar] [CrossRef]
  10. Katsumata, M.; Johnson, R.H.; Ciesielski, P.E. Observed synoptic-scale variability during the developing phase of an ISO over the Indian Ocean during MISMO. J. Atmos. Sci. 2009, 66, 3434–3448. [Google Scholar] [CrossRef] [Green Version]
  11. Kuang, Z. A moisture–stratiform instability for convectively coupled waves. J. Atmos. Sci. 2008, 65, 834–854. [Google Scholar] [CrossRef]
  12. Fu, X.; Wang, B. Critical roles of the stratiform rainfall in sustaining the Madden–Julian Oscillation: GCM experiments. J. Clim. 2009, 22, 3939–3959. [Google Scholar] [CrossRef]
  13. Lee, M.I.; Kang, I.-S.; Kim, J.-K.; Mapes, B.E. Influence of cloud–radiation interaction on simulating tropical intraseasonal oscillation with an atmospheric general circulation model. J. Geophys. Res. Atmos. 2001, 106, 14219–14233. [Google Scholar] [CrossRef]
  14. Raymond, D.J. A new model of the Madden–Julian Oscillation. J. Atmos. Sci. 2001, 58, 2807–2819. [Google Scholar] [CrossRef]
  15. Wang, B.; Liu, F.; Chen, G. A trio-interaction theory for Madden–Julian Oscillation. Geosci. Lett. 2016, 3, 34. [Google Scholar] [CrossRef] [Green Version]
  16. Yang, Y.-M.; Lee, J.-Y.; Wang, B. The Tibetan Plateau uplift is crucial for eastward propagation of Madden–Julian Oscillation. Sci. Rep. 2019, 9, 15478. [Google Scholar] [CrossRef] [PubMed] [Green Version]
  17. Yang, Y.-M.; Wang, B.; Lee, J.-Y. Mechanisms of northward propagation of boreal summer intraseasonal oscillation revealed by climate model experiments. Geophys. Res. Lett. 2019, 46, 3417–3425. [Google Scholar] [CrossRef]
  18. Wang, B.; Lee, S.-S.; Waliser, D.E.; Zhang, C.; Sobel, A.; Maloney, E.; Li, T.; Jiang, X.; Ha, K.-J. Dynamics-oriented diagnostics for the Madden–Julian Oscillation. J. Clim. 2018, 31, 3117–3135. [Google Scholar] [CrossRef]
  19. Kim, H.; Webster, P.J.; Toma, V.E.; Kim, D. Predictability and prediction skill of the MJO in two operational forecasting systems. J. Clim. 2014, 27, 5364–5378. [Google Scholar] [CrossRef]
  20. Lim, Y.; Son, S.; Kim, D. MJO prediction skill of the subseasonal-to-seasonal prediction models. J. Clim. 2018, 31, 4075–4094. [Google Scholar] [CrossRef]
  21. Maloney, E.D.; Hartmann, D.L. The Madden-Julian oscillation, Barotropic dynamics, and North Pacific tropical cyclone formation. Part I: Observations. J. Atmos. Sci. 2001, 58, 2545–2558. [Google Scholar] [CrossRef] [Green Version]
  22. Moon, J.-Y.; Wang, B.; Ha, K.-J.; Lee, J.-Y. Teleconnections associated with Northern Hemisphere summer monsoon intraseasonal oscillation. Clim. Dyn. 2013, 40, 2761–2774. [Google Scholar] [CrossRef]
  23. Wang, B.; Xie, X. A model for the boreal summer intraseasonal oscillation. J. Atmos. Sci. 1997, 54, 72–86. [Google Scholar] [CrossRef] [Green Version]
  24. Jiang, X.; Li, T.; Wang, B. Structures and mechanisms of the northward propagating boreal summer intraseasonal oscillation. J. Clim. 2004, 17, 1022–1039. [Google Scholar] [CrossRef]
  25. Yang, Y.-M.; Lee, J.-Y.; Wang, B. Dominant Process for Northward Propagation of Boreal Summer Intraseasonal Oscillation Over the Western North Pacific. Geophys. Res. Lett. 2020, 47, e2020GL089808. [Google Scholar] [CrossRef]
  26. DeMott, C.A.; Stan, C.; Randall, D.A. Northward propagation mechanisms of the boreal summer intraseasonal oscillation in the ERA-Interim and SP-CCSM. J. Clim. 2013, 26, 1973–1992. [Google Scholar] [CrossRef]
  27. Liu, F.; Wang, B.; Kang, I.-S. Role of barotropic convective momentum transport in the intraseasonal oscillation. J. Clim. 2015, 28, 4908–4920. [Google Scholar] [CrossRef] [Green Version]
  28. Liu, F.; Zhao, J.; Fu, X.; Huang, G. The role of shallow convection in promoting the northward propagation of boreal summer intraseasonal oscillation. Theor. Appl. Climatol. 2018, 131, 1387–1395. [Google Scholar] [CrossRef]
  29. Mogensen, K.; Balmaseda, M.; Weaver, A.T.; Martin, M.; Vidard, A. NEMOVAR: A variational data assimilation system for the NEMO ocean model. In ECMWF Newsletter; Walter, Z., Ed.; ECMWF: Reading, UK, 2009; Volume 120, pp. 17–21. [Google Scholar]
  30. Mogensen, K.; Balmaseda, M.A.; Weaver, A.T. The NEMOVAR ocean data assimilation system as implemented in the ECMWF ocean analysis for System 4. In Technical Report TR-CMGC-12-30; CERFACS: Toulouse, France, 2012. [Google Scholar]
  31. Bowler, N.; Arribas, A.; Beare, S.; Mylne, K.E.; Shutts, G. The local ETKF and SKEB:Upgrades to the MOGREPS short-range ensemble prediction system. Q. J. R. Meteorol. Soc. 2009, 135, 767–776. [Google Scholar] [CrossRef]
  32. Williams, K.D.; Harris, C.M.; Bodas-Salcedo, A.; Camp, J.; Comer, R.E.; Copsey, D.; Fereday, D.; Graham, T.; Hill, R.; Hinton, T.; et al. The Met Office Global Coupled model 2.0 (GC2) configuration. Geosci. Model Dev. 2015, 8, 1509–1524. [Google Scholar] [CrossRef] [Green Version]
  33. Adler, R.F.; Huffman, G.J.; Chang, A.; Ferraro, R.; Xie, P.P.; Janowiak, J.; Rudolf, B.; Schneider, U.; Curtis, S.; Bolvin, D.; et al. The version-2 global precipitation climatology project (GPCP) monthly precipitation analysis (1979–present). J. Hydrometeorol. 2003, 4, 1147–1167. [Google Scholar] [CrossRef]
  34. Hersbach, H.; Bell, B.; Berrisford, P.; Hirahara, S.; Horányi, A.; Muñoz-Sabater, J.; Nicolas, J.; Peubey, C.; Radu, R.; Schepers, D.; et al. The ERA5 global reanalysis. Q. J. R. Meteorol. Soc. 2020. [Google Scholar] [CrossRef]
  35. Liebmann, B.; Catherine, A.S. Description of a Complete (Interpolated) Outgoing Longwave Radiation Dataset. Bull. Am. Meteorol. Soc. 1996, 77, 1275–1277. [Google Scholar]
  36. Valcke, S. The OASIS3 coupler: A European climate modelling community software. Geosci. Model Dev. 2013, 6, 373–388. [Google Scholar] [CrossRef] [Green Version]
  37. Gregory, D.; Rowntree, P.R. A massflux convection scheme with representation of cloud ensemble characteristics and stability dependent closure. Mon. Weather Rev. 1990, 118, 1483–1506. [Google Scholar] [CrossRef]
  38. Hsu, P.-C.; Li, T. Role of the boundary layer moisture asymmetry in causing the eastward propagation of the Madden–Julian Oscillation. J. Clim. 2012, 25, 4914–4931. [Google Scholar] [CrossRef] [Green Version]
  39. Johnson, R.H.; Ciesielski, P.E.; Ruppert, J.H., Jr.; Katsumata, M. Sounding-based thermodynamic budgets for DYNAMO. J. Atmos. Sci. 2015, 72, 598–622. [Google Scholar] [CrossRef]
Figure 1. November–April bias of climatological T2m (K), precipitation (mm day−1), and surface zonal wind (m s −1) from the GS5 hindcast data (a,c,e) and the GS5 climatological run (b,d,f).
Atmosphere 12 00114 g001
Figure 2. Biases of 20–70 days filtered precipitation (mm−2 day−2) and the ratio of filtered to the total variance from GS5 hindcast (a,c) and GS5 climatological run (b,d). The shading represents statistically significant areas (95% confidence level).
Atmosphere 12 00114 g002
Figure 3. Composite of 20–70-day outgoing longwave radiation (OLR, color) and surface wind anomalies (vectors) based on a function of the MJO phase during boreal winter (November–April). (a) observation, (b) GS5 hindcast data, and (c) GS5 climatological run. The zonal wind anomalies with statistically 99% significance are drawn. The numbers of each panel represent the number of days used for composite for each phase. The number of days used for the observation and the GS5 climatological run is 4500 days (25y × 180 days), whereas the number for the GS5 hindcast data is 56,000 days (25y × 180 × 4 (hindcast dataset number per month) × 6 (November–April).
Atmosphere 12 00114 g003
Figure 4. Frequency–wavenumber spectrum of precipitation (mm−2 day−2) averaged over 10° N–10° S from (a) observation, (b) the GS5 hindcast, and (c) the GS5 climatological run during boreal winter (November–April). Twenty to seventy day filtered data were used for calculation.
Atmosphere 12 00114 g004
Figure 5. Lagged correlation of 20–70 days filtered precipitation averaged over 10° S–10° N from (a) observation, (b) the GS5 hindcast, and (c) the GS5 climatological run. The precipitation over the equatorial Indian Ocean (10° S–10° N, 80°–100° E) during boreal winter (NDJFMA) is used as a reference. Horizontal (vertical) black line represents zero lag (longitude of 90° E).
Atmosphere 12 00114 g005
Figure 6. The regressed 20–70-day filtered 925 hPa boundary layer moisture convergence (day−1) onto filtered precipitation (20–70 days) averaged over the eastern Indian Ocean (10° S–10° N, 80°–100° E) from (a) observation, (b) GS5 hindcast data, and (c) GS5 climatological run. The strengths of regression are fixed to a 3 mm day−1.
Atmosphere 12 00114 g006
Figure 7. The regressed 20–70-day filtered 850 hPa equivalent potential temperature (EPT; °C) onto filtered precipitation (20–70 days) averaged over the eastern Indian Ocean (10° S–10° N, 80°–100° E) from (a) observation, (b) GS5 hindcast data, and (c) GS5 climatological run. The strengths of regression are fixed to a 3 mm day−1.
Atmosphere 12 00114 g007
Figure 8. The regressed 20–70-day filtered convective instability (°C) onto filtered precipitation (20–70 days) averaged over the eastern Indian Ocean (10° S–10° N, 80°–100° E) from (a) observation, (b) GS5 hindcast data, and (c) GS5 climatological run. The strengths of regression are fixed to a 3 mm day−1. The convective instability is defined as EPT at 850 hPa minus EPT at 400 hPa.
Atmosphere 12 00114 g008
Figure 9. The regressed 20–70-day filtered 850 hPa winds (m s−1; vector) and zonal wind speed (m s−1; shading) onto filtered precipitation (20–70 days) averaged over the eastern Indian Ocean (10° S–10° N, 80°–100° E) from (a) observation, (b) GS5 hindcast data, and (c) GS5 climatological run. The strengths of regression are fixed to a 3 mm day−1.
Atmosphere 12 00114 g009
Figure 10. Lagged correlation of 20–70 days filtered precipitation (zonal wind at 850 hPa) averaged over 80°–100° E from (a) observation, (b) the GS5 hindcast, and (c) the GS5 climatological run during boreal summer (May–October). The intraseasonal oscillation (ISO) precipitation averaged over 80° E–100° E and 5° S–5° N was used as a reference for calculating the correlation. The shading shows precipitation, and the contour is the zonal wind at 850 hPa.
Atmosphere 12 00114 g010
Figure 11. Meridional pattern of (a) mean state zonal shear (U200–U850; m s−1) and (e) mean specific humidity (925 hPa) averaged over 80°–100°E from observation (dashed black with black mark) and the GS5 hindcast (solid black with blank mark) during boreal summer (May–November). The Meridional variation of regressed ISO (b) vorticity (s−1) at 925 hPa, (c) boundary layer moisture convergence (day−1) at 925 hPa, (d) convective instability (°C), and (f) SST (°C) averaged over 80°–100° E from observation and model simulations. We use the 20–70 day filtered precipitation anomaly averaged over 5° S–5° N and 80°–100° E as a reference for calculating (bd,f).
Atmosphere 12 00114 g011
Publisher’s Note: MDPI stays neutral with regard to jurisdictional claims in published maps and institutional affiliations.