Article

Integrated Flood Forecasting and Warning System against Flash Rainfall in the Small-Scaled Urban Stream

Urban Flood Research Institute, University of Seoul, Seoul 02504, Korea
*
Author to whom correspondence should be addressed.
Atmosphere 2020, 11(9), 971; https://doi.org/10.3390/atmos11090971
Submission received: 19 August 2020 / Revised: 7 September 2020 / Accepted: 7 September 2020 / Published: 11 September 2020

Abstract

:
The flood forecasting and warning system enable an advanced warning of flash floods and inundation depths for disseminating alarms in urban areas. Therefore, in this study, we developed an integrated flood forecasting and warning system combined inland-river that systematized technology to quantify flood risk and flood forecasting in urban areas. LSTM was used to predict the stream depth in the short-term inundation prediction. Moreover, rainfall prediction by radar data, a rainfall-runoff model combined inland-river by coupled SWMM and HEC-RAS, automatic simplification module of drainage networks, automatic calibration module of SWMM parameter by Dynamically Dimensioned Search (DDS) algorithm, and 2-dimension inundation database were used in very short-term inundation prediction to warn and convey the flood-related data and information to communities. The proposed system presented better forecasting results compared to the Seoul integrated disaster prevention system. It can provide an accurate water level for 30 min to 90 min lead times in the short-term inundation prediction module. And the very short-term inundation prediction module can provide water level across a stream for 10 min to 60 min lead times using forecasting rainfall by radar as well as inundation risk areas. In conclusion, the proposed modules were expected to be useful to support inundation forecasting and warning systems.

1. Introduction

Urban flooding is one of the most severe hazards in most cities worldwide. In particular, small-scale urban streams with very small watersheds and a flood travel time of 1 h to 3 h can cause severe damage to property and human life during heavy rainfall and floods. Rainstorms and floods have caused severe property damage and heavy casualties and hampered commercial activities, adversely affecting urban life [1,2]. Studies by the Intergovernmental Panel on Climate Change (IPCC) have shown that such extreme events will increase in frequency and intensity [3]. It has been observed that the frequency of localized heavy rain has been greatly increased and the scale of damage tends to be larger in the city of Seoul [4]. In 2020, 1 person died, 28 were marooned by the flood because of flash rainfall with an intensity of 57 mm/h at the location of Dorim stream, which is a small-scale stream in South Korea. At the time, the rainfall intensity did not show a large damage intensity scale, but a fatal accident occurred because preemptive actions such as flood forecasting, warning, and evacuation of dwellers were not performed well in that area [5]. Hence, it is necessary to mitigate flood damage through accurate and proactive urban forecasting of floods caused by small-scale urban streams. For the mitigation of flood disasters and damage in urban areas, it is necessary to estimate the damage that can be caused by rainfall runoff and reduce flood damage through structured and unstructured measures. The Seoul Metropolitan City in South Korea installed 529 river crisis management facilities such as automatic alarm facilities, text message boards, CCTVs, warning lights, emergency ladders, etc for 13 regional rivers. Moreover, civil servants and neighborhood patrols members have been designated officers in charge for evacuating people in the event of a heavy rainfall. Public servants operate the integrated disaster prevention system to acquire water level data for each municipality and stream in real time and broadcast flood warnings (depending on the water level), make advance announcements, provide riverside warnings, evacuate citizens from the riverside, issue a flood watch [6]. However, unlike flood forecasting in large inundation vulnerable areas, which is made using satellite and radar data from the Korea Meteorological Agency (KMA) and Han River Flood Control Office, flood forecasting for small- and medium-scale streams with a short flood travel time is still performed using real-time water level data, which makes the surrounding regions vulnerable to flood disasters in the event of heavy rainfall. In countries with well-established flood protection systems, studies have been actively conducted to systematically establish unstructured flood protection alternatives. Especially, the construction of real-time disaster warning systems has substantially raised concerns. Lin, et al. [7] develop an intelligent hydroinformatics integration platform (IHIP) to provide online forecasting of regional flood depths through the use of the latest hydroinformatics technologies such that actions can be efficiently taken to mitigate flood risks. And Li-Chiu, et al. [8] proposed a forecasting model which is composed of three steps: classification, point forecasting, and spatial expansion using classification module, SVM and spatial expansion module. While the use of radar measurements for urban hydrological applications has increased considerably in recent years [9,10,11], the accuracy of radar forecasts in small and medium cities remains limited because of uncertainties associated with rainfall prediction models [12]. Recently, artificial neural network (ANN) models have received considerable attention from scientists, and research has been conducted on the learning and prediction of hydrological time series data such as rainfall, discharge, and remote sensing data by various ANN models [13]. On the basis of a review of previous studies on the learning and prediction of hydrological time series data by various ANN models, we observed that recurrent neural networks (RNNs) show good performance when trained with long-term time series data [14,15]. Caihong et al. [16] employed ANN and Long Short-Term Memory (LSTM) for simulating the rainfall-runoff process on the basis of flood events and observed that the special units of the forget gate rendered the LSTM model better suited for the simulation and more intelligent than the ANN model. Furthermore, they found that the LSTM model was more stable than the ANN model and showed better simulation performance by considering different lead time modeling. Jinle et al. [17] used LSTM models for predicting precipitation on the basis of meteorological data after identifying the correlation between meteorological variables and precipitation. The prediction accuracy was improved by determining the relative importance of the input variables. Furthermore, Tianyu et al. [18] constructed T multivariate single-step LSTM networks using information on spatial and temporal dynamics of rainfall and early discharge to forecast flash floods in mountainous catchments. The most successful and frequently used RNN is the LSTM, which is trained with time series. The LSTM, a special type of RNN, is designed to overcome a drawback of the traditional RNN, namely, its incapability to learn long-term dependencies. Its development is regarded as a milestone in studies on time series problems in the field of machine learning. These previous researches, which have used hydrological time series data to train an RNN, achieved reliable prediction results by developing a neural network model, setting the hyperparameter, and compiling a large number of high-quality input data. This strategy can be applied for real-time flood forecasting for small and medium scale urban streams with a short flood travel time and for proactively devising flood protection measures.
Timely and accurate forecasts in flood-prone areas are essential prerequisites for the provision of reliable early warning systems. The objective of this paper is to develop the integrated inundation forecasting and warning system combined inland and river. It is an efficient real-time inundation forecasting and warning system, presenting the two type modules during flash rainfall periods, the short-term inundation prediction with a data-driven method, and the very short-term inundation prediction with a model-driven method.
In the short-term inundation prediction module, the water level data were used as input, and the LSTM model was used as the computational method to develop the point forecasting module to yield the inundation depth forecasts at control points. Forecasting the water level of the data-driven method used neural networks has shown the strength to calculate high accurate prediction results with long lead time if the high quality, consistency, and the enormous volumes of water level data were constructed. It can proactively convey powerful messages fastly and intuitively about warning of flash flooding to the public and civil servants to help decision-making on flood damage reduction.
Besides, in the very short-term inundation prediction module of the model-driven method, the results of the detailed predictions of urban flood-dynamics were presented. The great benefit of the physically-based model simulation is the ability to directly model inundations and impacts connected with the high spatially variability of rainfall forecast. However, the use of a model-driven method was always neglected due to some reasons such as high-resolution inundation modeling of large and complex cityscapes induce long computation times, and the requirement of special infrastructure and high-performance computers. Therefore, in this study, to address the highly dynamic nature of the rainfall-runoff model in urban areas, hydrodynamic simulations combined inland and river with automatic parameter estimation by DDS were implemented and to improve the long computation times, the automatic simplification module and 2-dimension inundation database are applied. Among all, hydrodynamic simulation combined inland and river is a critically essential process in urban areas because there are many drainage networks around the stream and it causes flash flood damage extremely especially in greatly urbanized.
This real-time urban flood forecasting and warning system based on the data-driven and model-driven method can be efficiently used to reduce flood risks endangering residents and properties by flash floods and sufficiently support synthetic decision-making for prevention. The combined system of the data-driven module using LSTM and the model-driven module using radar and rainfall-runoff models can enable an advanced warning of probable flash floods and regional inundation depths for disseminating alarms in flood-threatened areas with 10 min to 90 min lead time. These results show more preemptive and accurate flood forecasting and warning results with over 30 min lead time compared to current systems that rely on real-time data in the urban area, so it can be fully utilized for urban flood forecasting and citizen evacuation.

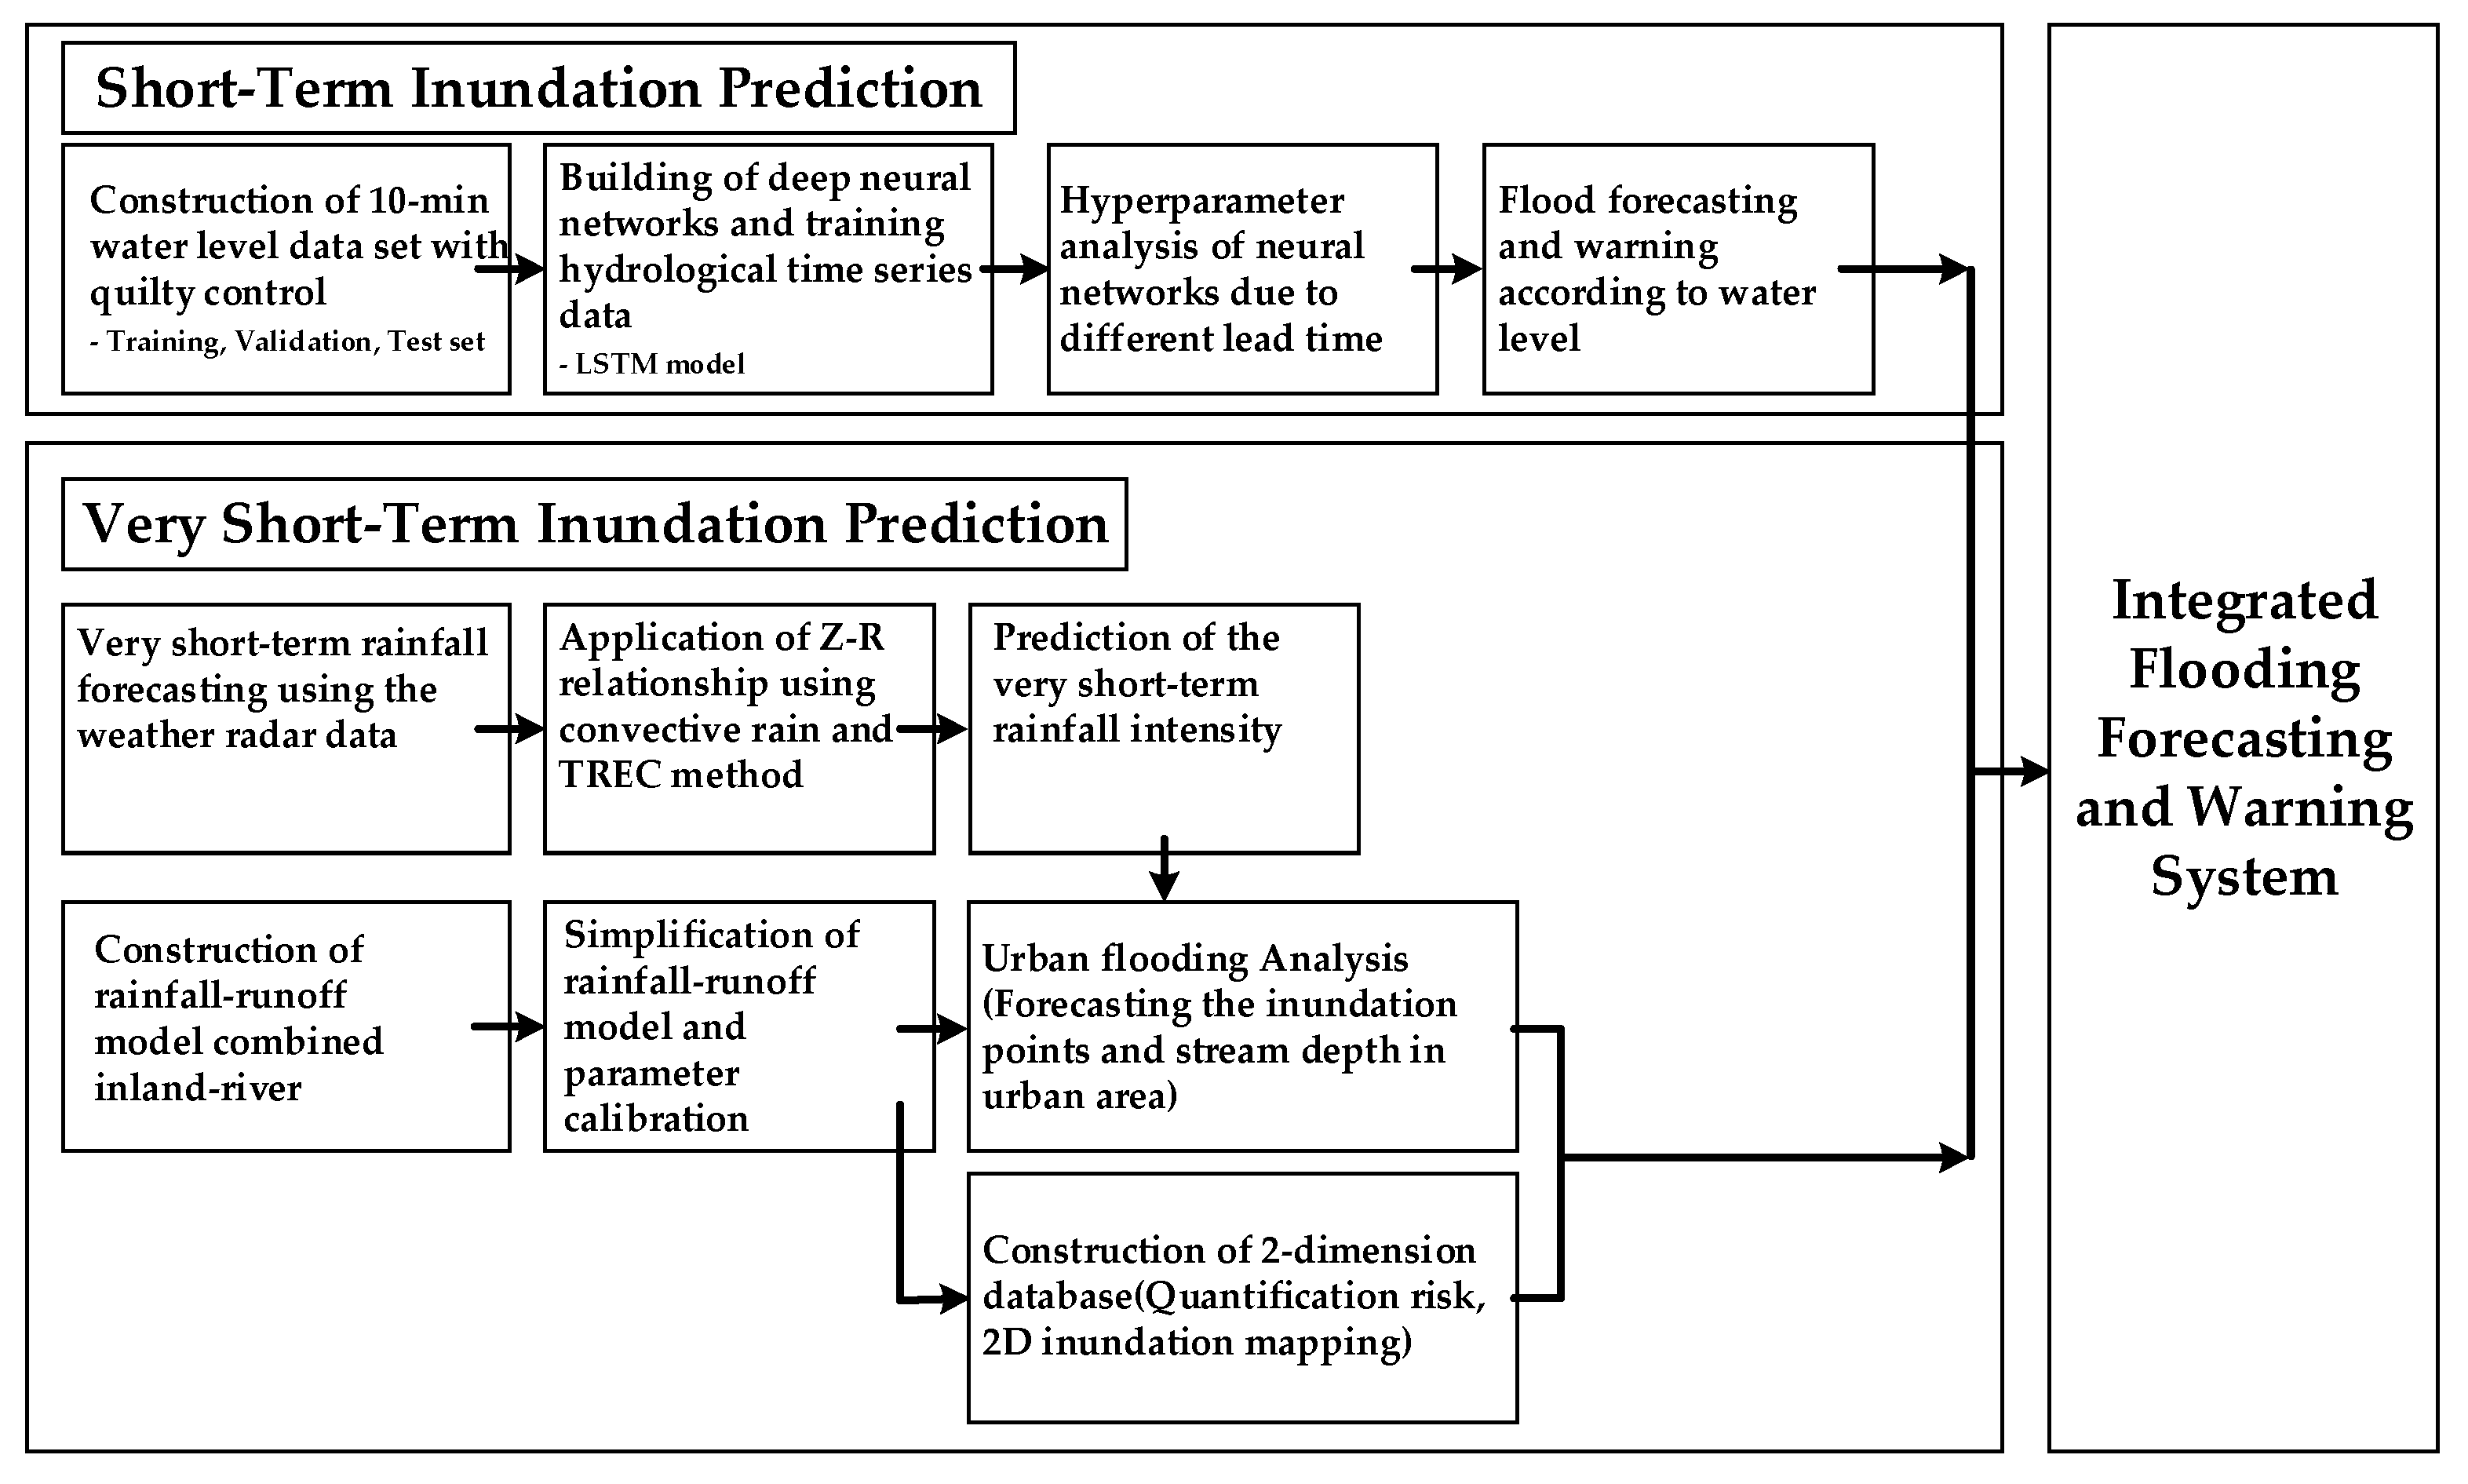
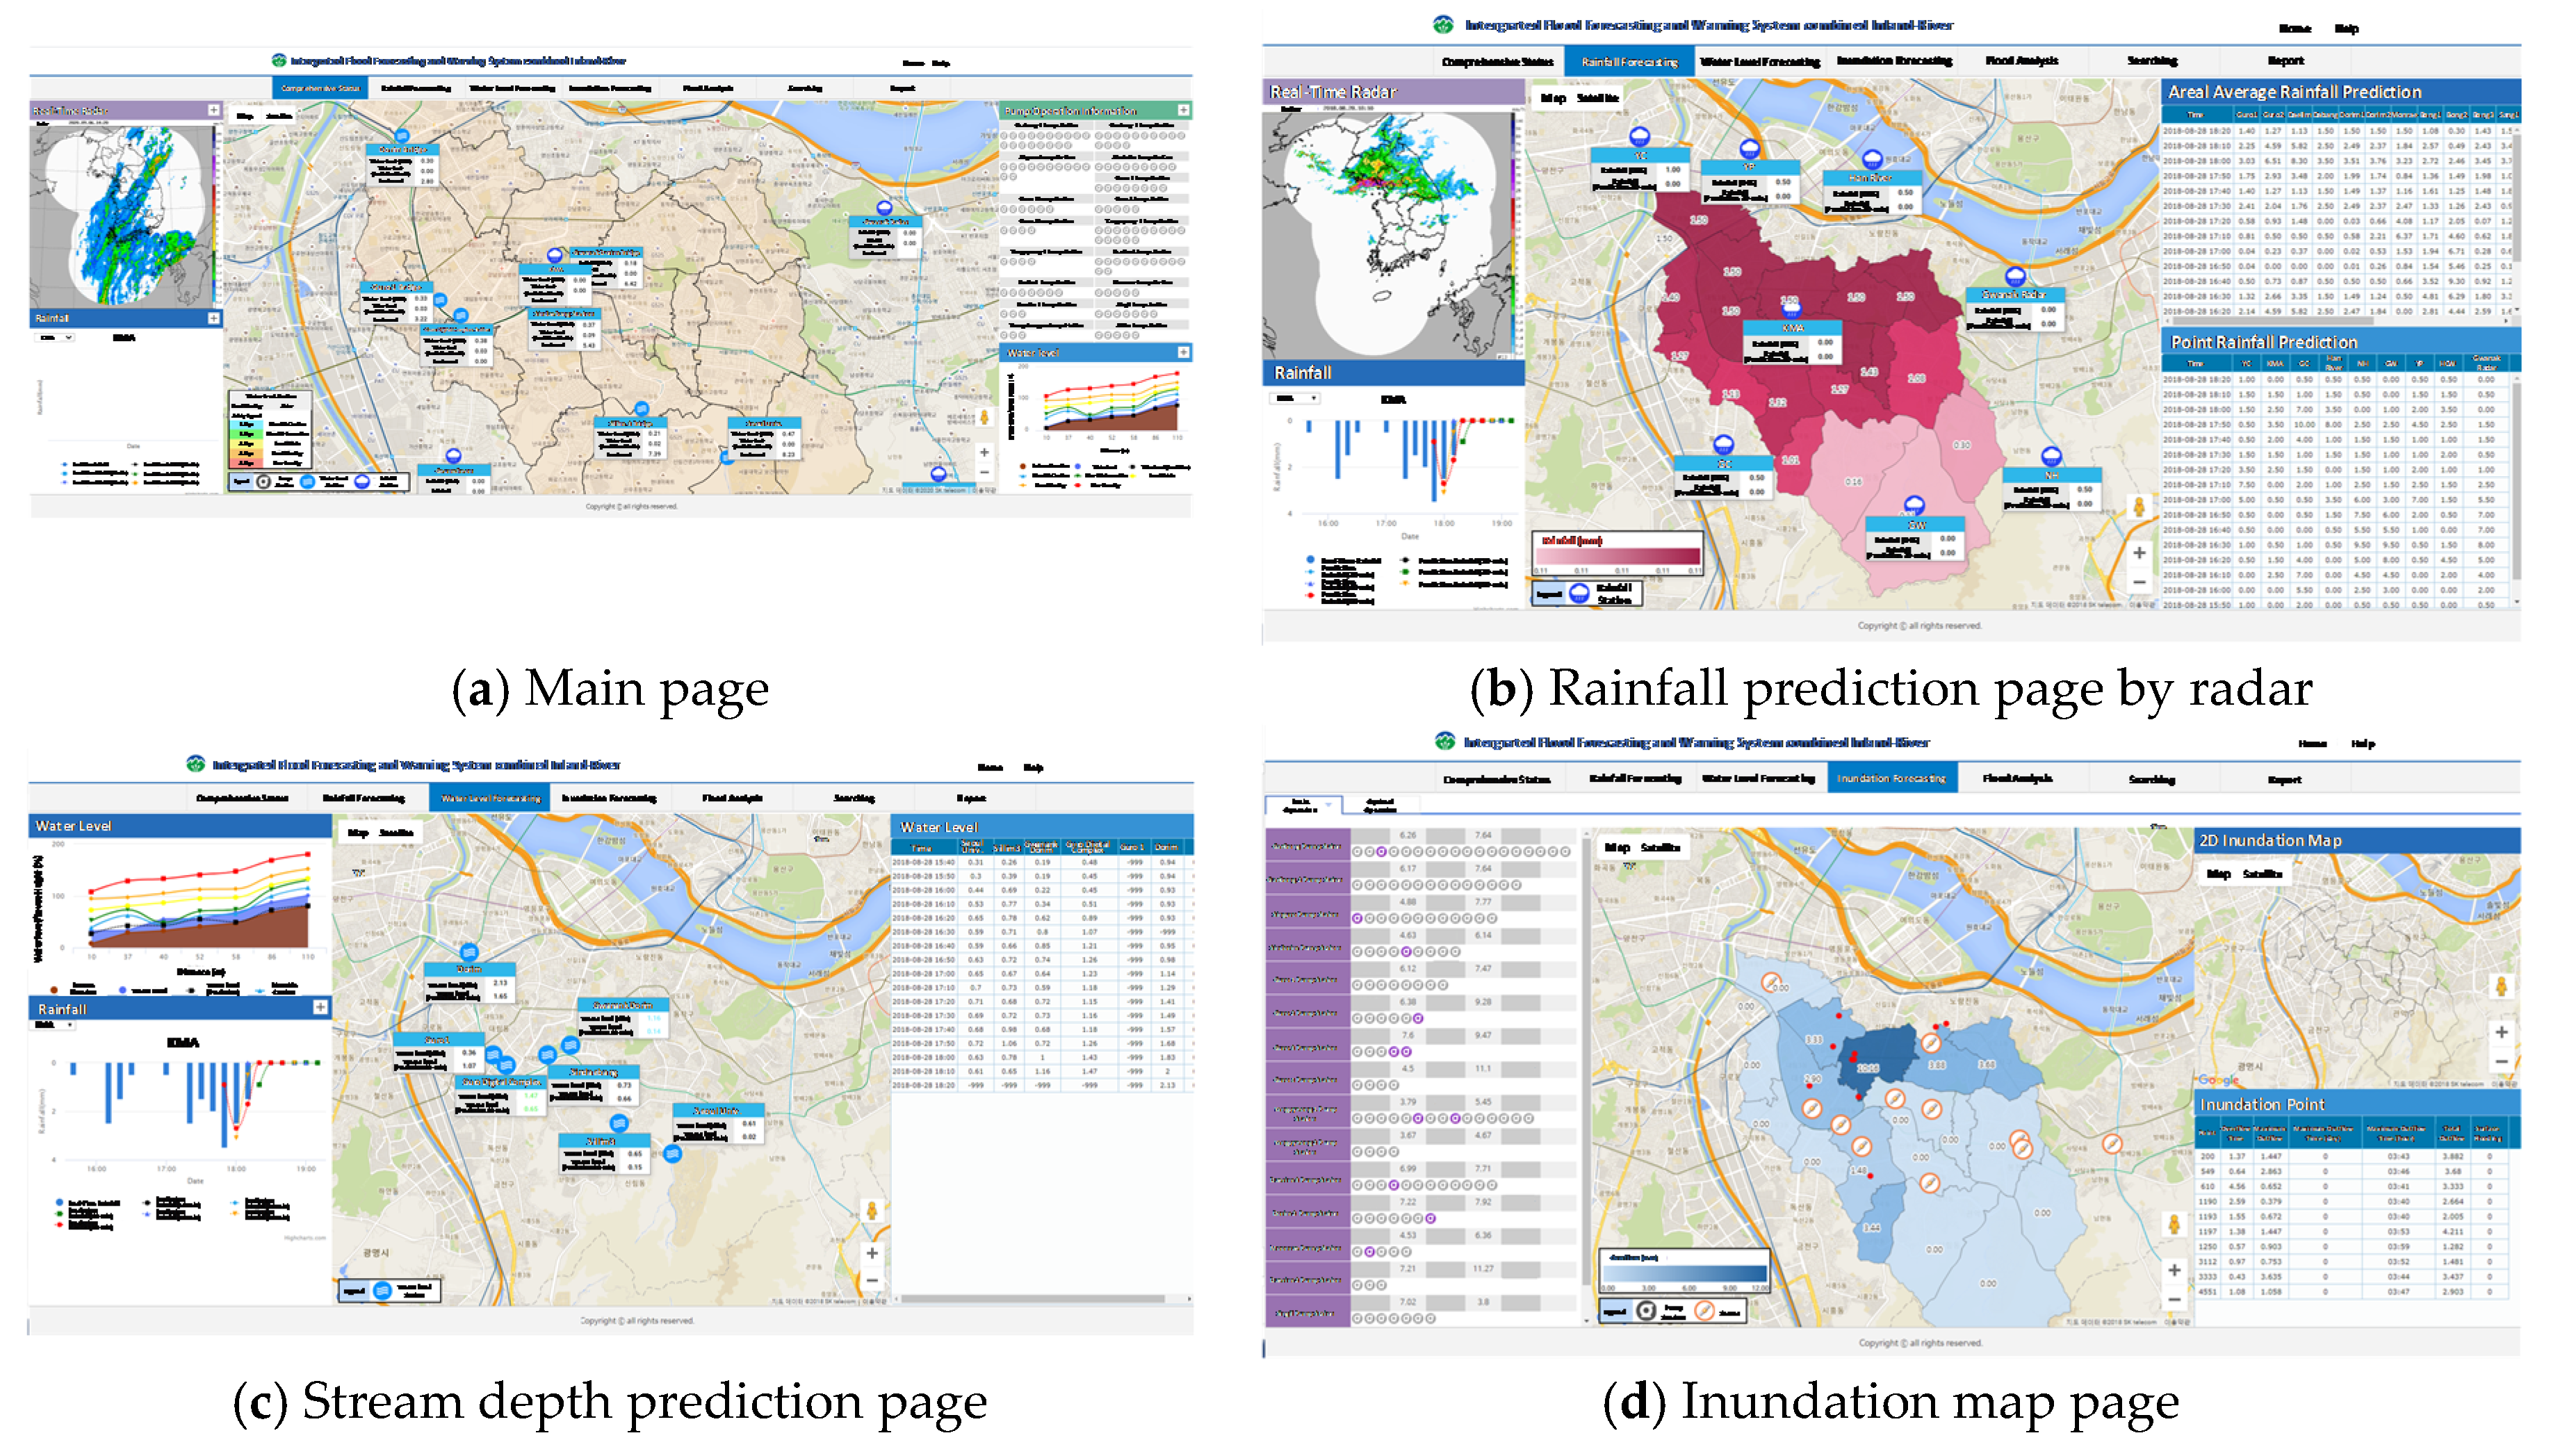
2. The Integrated Flood Forecasting and Warning System

A flowchart of the integrated flood forecasting and warning system is shown in Figure 1. The proposed system is composed of two steps: the short-term inundation prediction and the very short-term inundation prediction. Details of these two steps are described as follows.

2.1. Short-Term Inundation Prediction

The Short-term inundation prediction module of the integrated flood forecasting and warning system is carried out by LSTM. The LSTM model proposed by Hochreiter and Schmidhuber [19] helps solve the gradient vanishing problem in an RNN by creating a path, through the introduction of self-loops, along which the gradient can flow for a long time. This implies that the weights can be changed at each time step by training the connection weights or by directly specifying them as hyperparameters, unlike the RNN (in which weights are fixed). The LSTM consists of multivariate single-step networks with information on spatial and temporal dynamics of rainfall and the water level as inputs. This module has predicted the urban stream depth by training the time series data of upstream depths. In order to determine the optimal prediction result, various training cases of LSTM were set up to forecast stream depth of target point according to training conditions of water level. Furthermore, the effects of the various inputs on urban flood forecasts for different lead times were analyzed through a parameter analysis. The lead times for each training group were set up in the range 30 min to 90 min for forecasting the water level at the target point.
The programming language of Python 3.7 is chosen with other libraries, such as Scikit-learn, Keras, Pandas, Numpy, and so on and the LSTM model is developed with the Deep-Learning framework TensorFlow 2.0 using jupyter notebook. The hyperparameter for each network model was calibrated automatically by a random search method of Keras tuner after specifying an appropriate range for the variables, instead of a grid search method, which is time-consuming. Grid search and manual search are the most widely used strategies for hyperparameter optimization. But, empirically and theoretically that randomly chosen trials are more efficient than grid search [20]. Granting random search the same computational budget, random search finds better hyperparameters by effectively searching a larger, less promising configuration space. We define the LSTM with 10 neurons in the first hidden layer and 5 neurons in the second hidden layer. The optimal hyperparameters were calculated for the validation dataset and the forecast result was analyzed for the test set. The mean square error (MSE) was used as a loss function, Rectified Linear Unit (ReLU) was used as a activation function and the Adam technique was chosen for the optimization algorithm with 0.001 [21]. Furthermore, He initialization was chosen to avoid the overfitting problem [22], and L2 regularization with 0.01, early stopping was also employed.

2.2. Very Short-Term Inundation Prediction

The critical technology of the very short-term inundation prediction module is divided into five parts: (A) forecasting rainfall using radar data; (B) constructing rainfall-runoff model of drainage networks combined inland-river; (C) simplification of the rainfall-runoff model using automatic simplification module; (D) parameter calibration of Storm Water Management Model (SWMM) using DDS and (E) setting up the 2-dimension inundation database. In the first step, the short-term rainfall forecasting using the radar data was implemented. It can be estimated for 10 min to 120 min before rainfall prediction with 10 min lead time using the Tracking Radar Echoes by Correlation (TREC) technique. In the second step, the rainfall-runoff model of drainage networks combined inland-river was built using coupled SWMM and the Hydrologic Engineering Center—River Analysis System (HEC-RAS). In the third step, the rainfall-runoff model, which is made the whole drainage networks in Dorim, was simplified by automatic simplification method. In the final step, the parameters of the SWMM model were calibrated automatically using a DDS to improve parameter uncertainty. The 2-dimension inundation database was built in advance by the rainfall-runoff model made of whole drainage networks in an urban area based on different rainfall and durations scenarios and it has been chosen and provided according to prediction rainfall by radar.

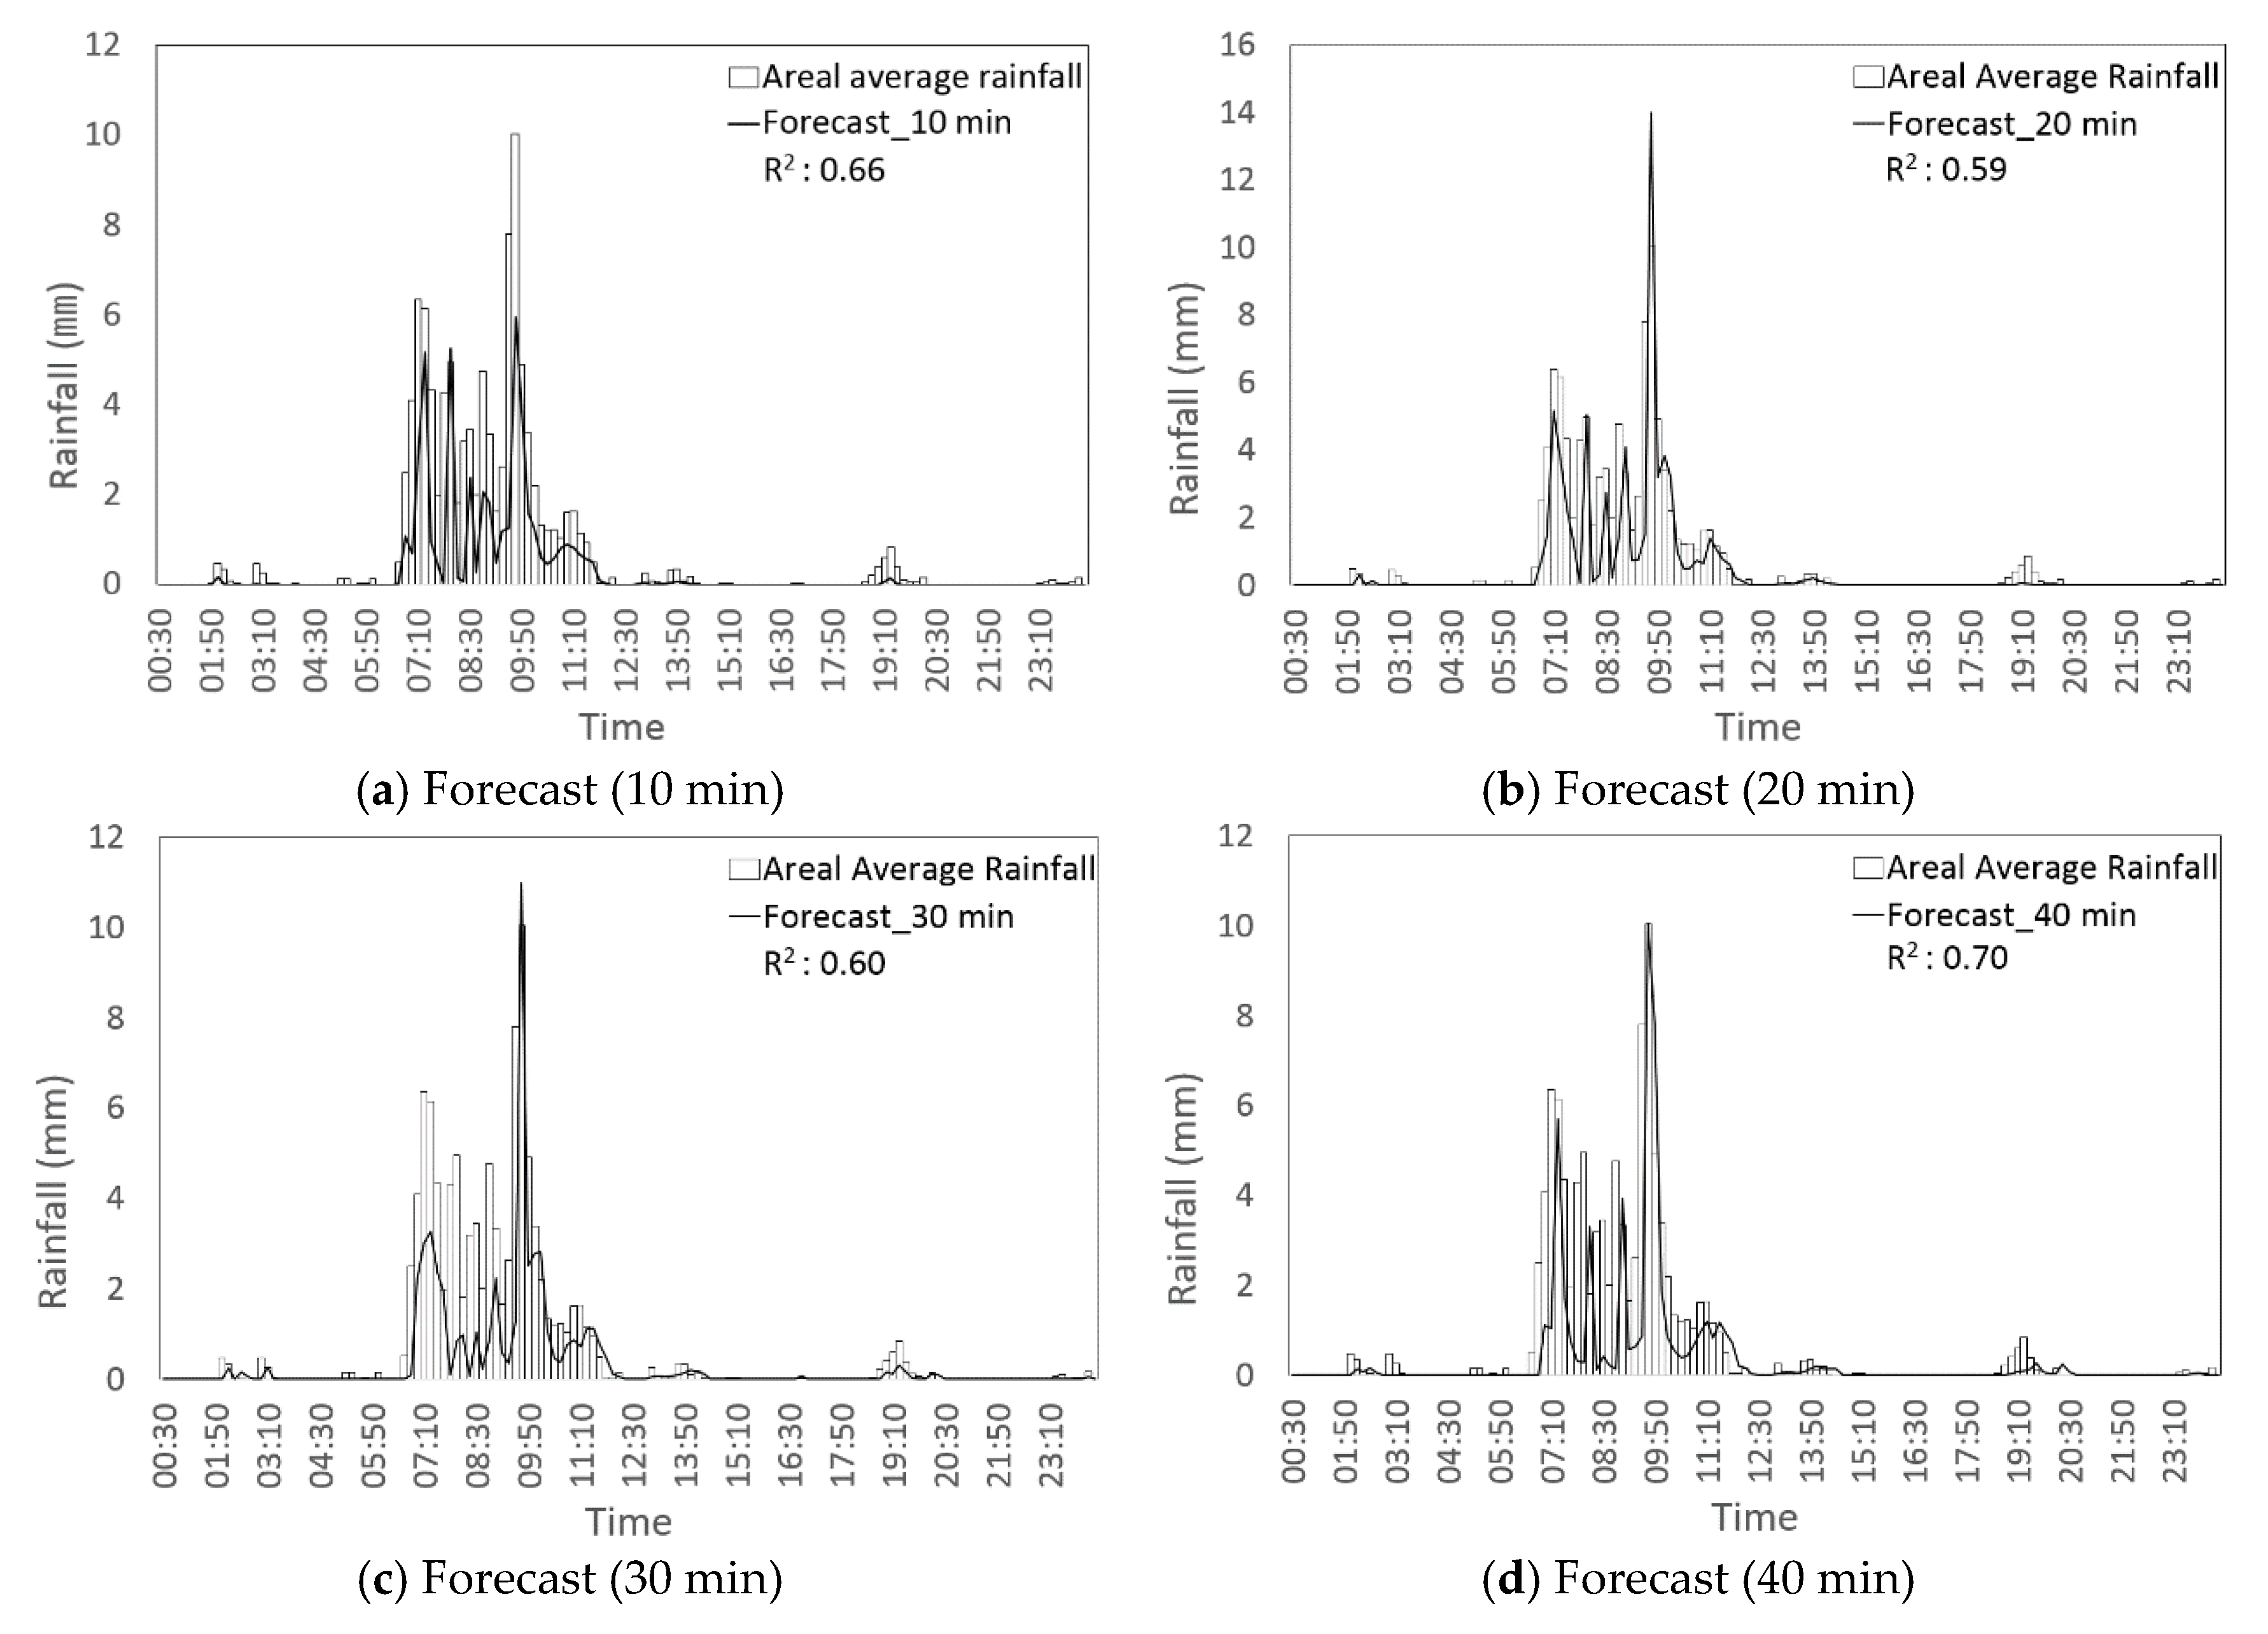
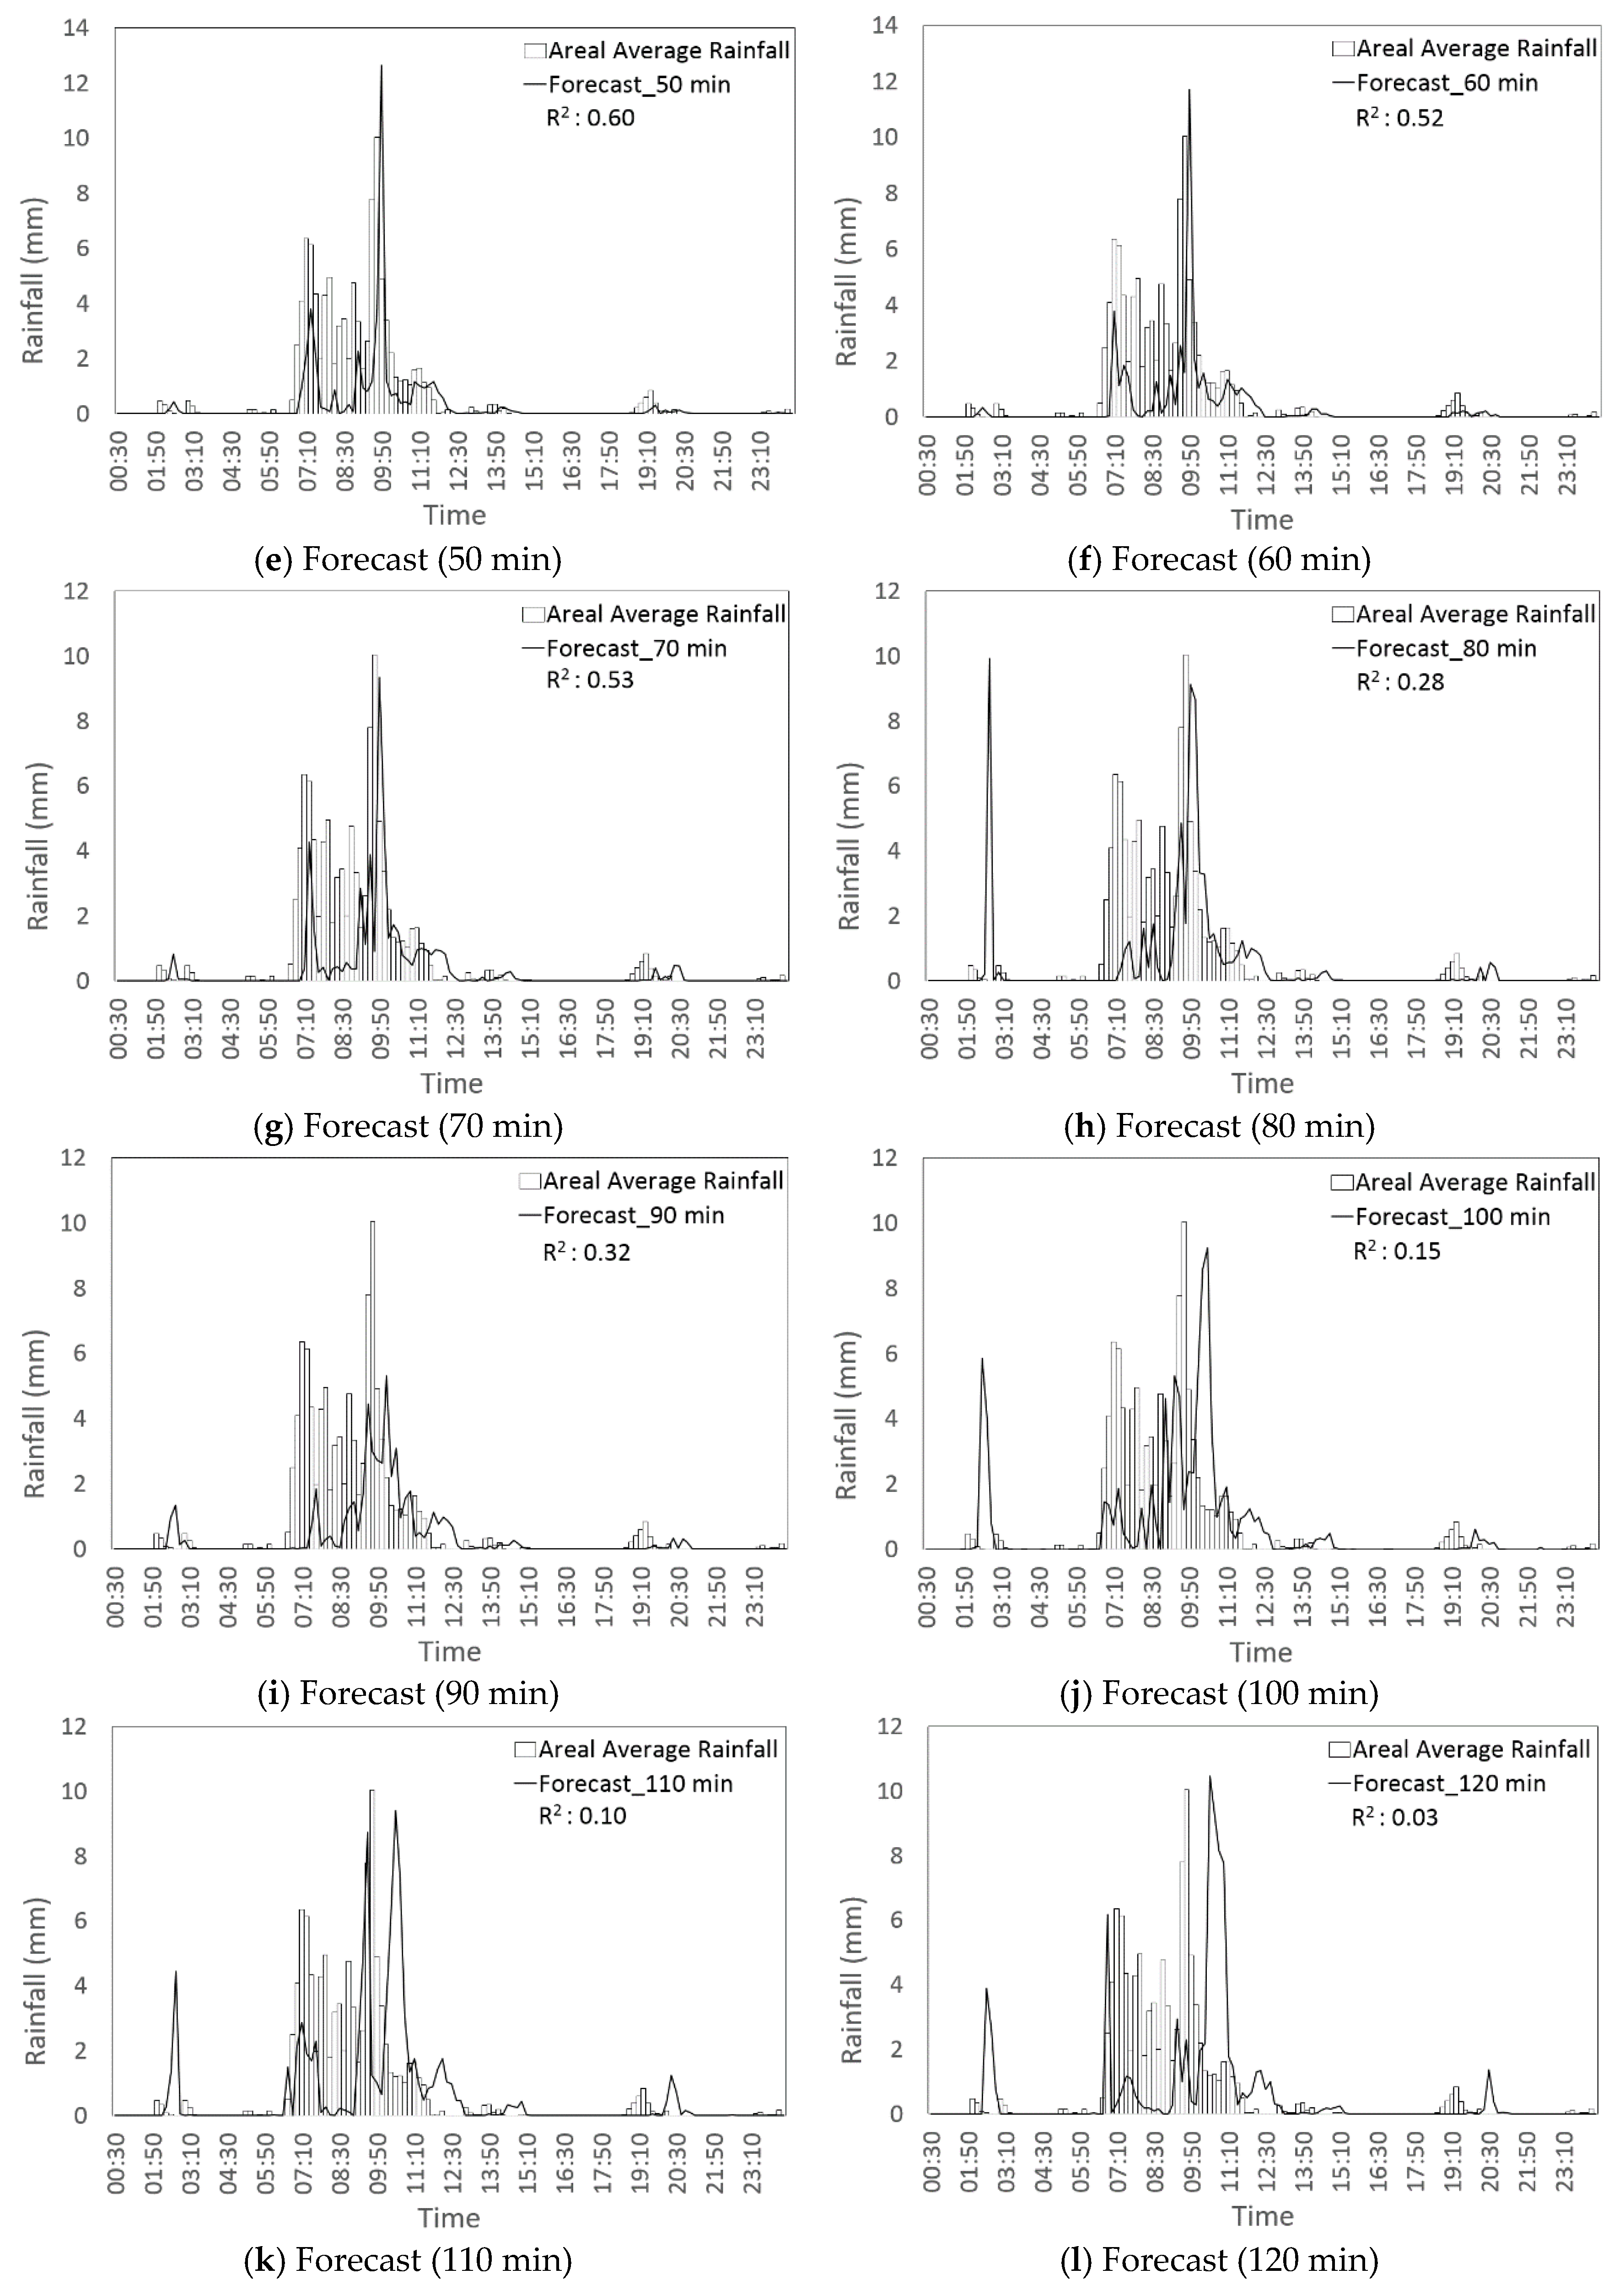
2.2.1. Rainfall Forecasting by Radar

The very short-term rainfall forecasting module of integrated flood forecasting and warning system was implemented using the radar data of Korea Meteorological Administration (KMA). KMA is operating 11 radars for the purpose of monitoring and forecasting dangerous weather conditions, flooding, and monitoring the military operation area. In this study, the Gwanak mountain meteorological radar was selected. The Gwanaksan meteorological radar has been installed in the center of the metropolitan area, playing a very important role in monitoring and forecasting dangerous weather. In addition, it has been upgraded to the dual-polarization radar from the single-polarization radar to improve rainfall prediction performance in urban areas in 2016. The rainfall prediction module forecasts rainfall up to 120 min at 10 min intervals using radar data. To this end, a Constant Altitude Plan Position Indicator (CAPPI) calculation program was developed, and the optimal movement patterns of intensive rainfall events using radar data are analyzed, and quantitative rainfall estimation is performed through the Z-R relational equation. The Tropical Z-R relationship (Z = 334R1.19) has applied as an optimal radar Z-R relation, which is confirmed that the accuracy is improved over 20 mm/h heavy rainfall [23]. In order to predict the direction of rainfall in weather radar data, TREC is used. TREC is the first kind of radar-based nowcasting method, proposed by Rinehart and Garvey [24]. It is an image processing algorithm that calculates correlation coefficients between successive images of radar echoes and uses the maximum values to obtain the motion vectors of different regions. During calculations, if the regions for determining the correlation coefficient is set too large, the average moving direction and moving speed of the entire rainfall are obtained. On the contrary, if the regions are set too small, it is not easy to obtain meaningful results. In addition, the spatial position (calculation radius) between the two regions reflects the maximum distance of rainfall, so it must be determined within a physically meaningful range. Therefore, in this study, the size of the region was set to 21 km, and the size of the calculated radius was set to 7 km, reflecting the values suggested in the study by Kim and Kim [25]. Through this process, the linear motion of the rainfall during the targeted prediction time was predicted using the calculated motion vector field and reflectivity data. The function of the Z-R relationship algorithm is written as:
dBZ = 10 logZ
Z = D 6 mm 6 m 3
Z = a R b mm 6 m 3
where Z is the factor of radar reflection (mm6/m3); R, rainfall intensity (mm/h); a and b, experienced constants.

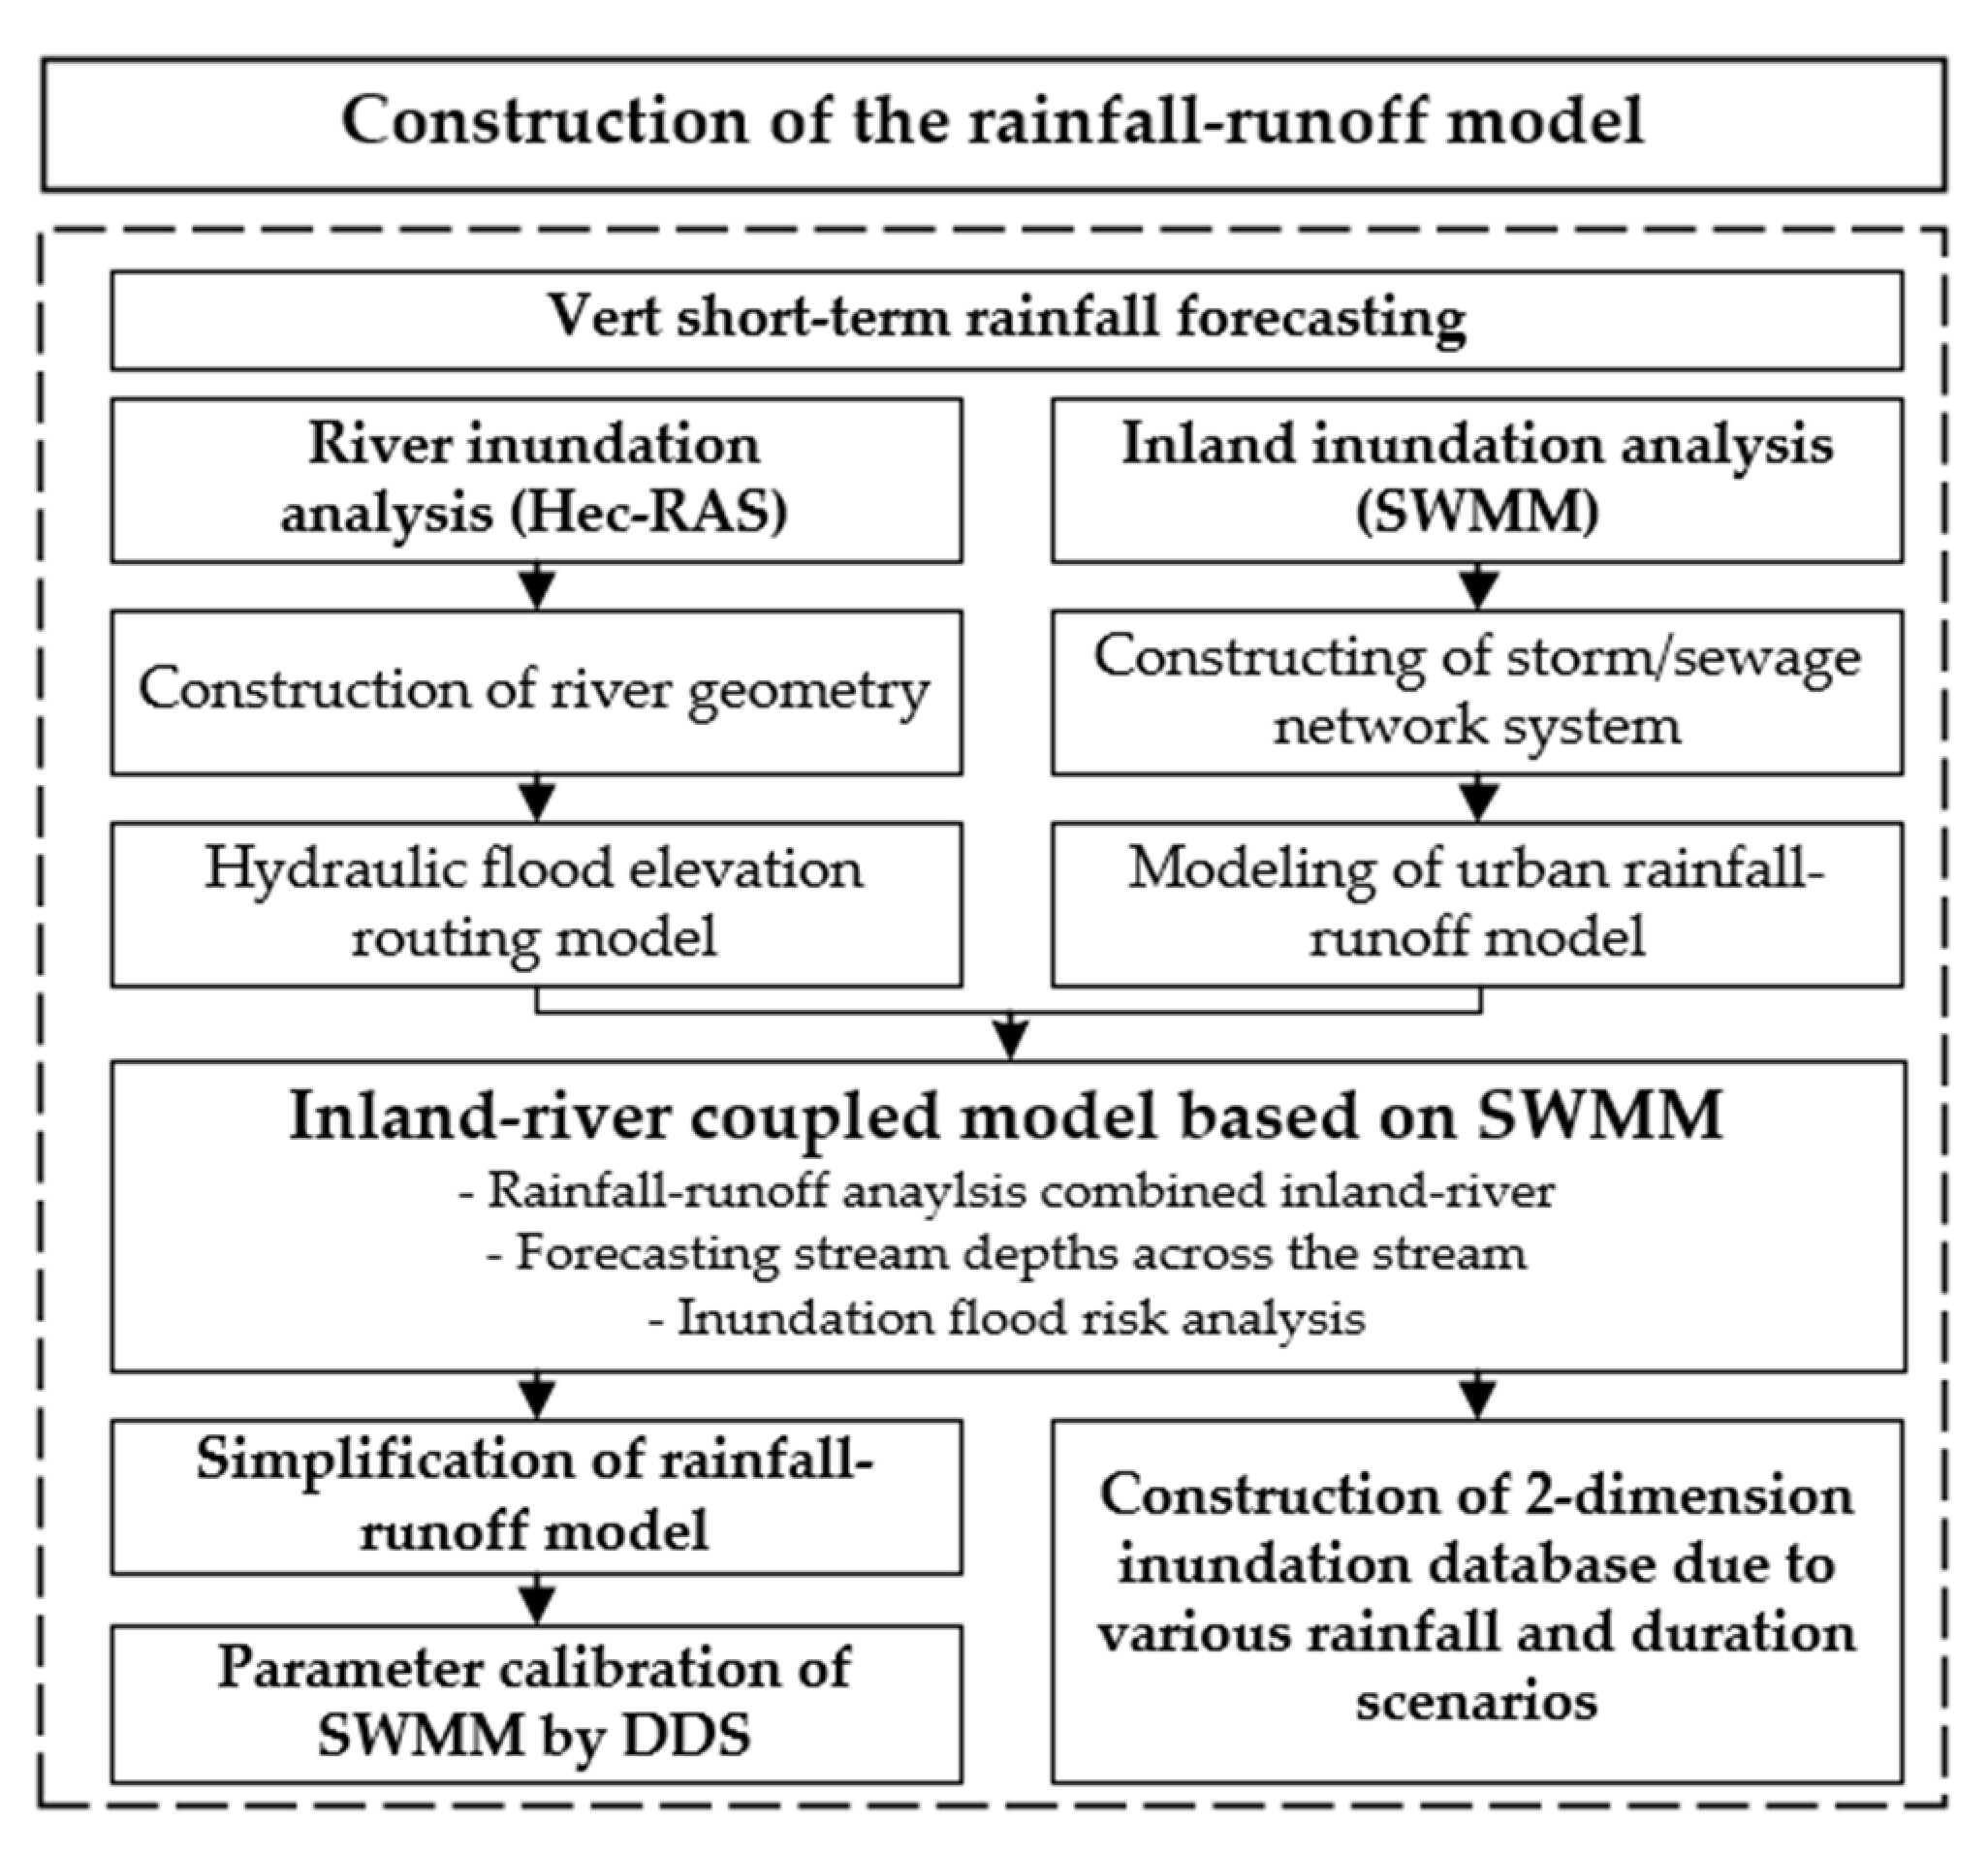
2.2.2. Construction of the Rainfall-Runoff Model

Reliable drainage network modeling is an essential component in urban flood forecasting and risk assessment. Urban inundation has occurred attribute to a combination of river flooding and poor drainage of inland. In fact, in the case of urban basins, there are many drainage networks around the stream, which causes flooding frequently. However, most of the prospective studies on flooding have not been able to organically link urban inundation with river flooding and inland flooding. To improve this condition, there is a need for a combination of river channel geometry and sewage channel system. Therefore, we constructed the rainfall-runoff model of drainage networks combined inland-river. The hydraulic flood elevation routing model of HEC-RAS combined into the sewage network system of SWMM to consider the correlation between the water level of the stream and inland drainage facilities in the urban area. This rainfall-runoff module base on the Dynamic wave method of flood routing in SWMM is then coupled with HEC-RAS, leading to an integrated drainage network model. Figure 2 shows the process of constructing the rainfall-runoff model.
Not only that, Drainage network simplification by automatic simplification technology has been implemented to apply this module to real-time urban flooding. The rainfall-runoff model made of whole drainage networks in the major urban area such as Seoul is vast and complex, making it unsuitable for real-time urban flood forecasting. Therefore, the rainfall-runoff model should be simplified. The results of the simplified model showed that the integrated rainfall-runoff module can model and interpret flows with greatly decreased computational time at various channel sections and nodes in common with a not simplified model. And the simplified model has effectively given catchment responses for peak flow and volume of runoff which is considered as one of the essential components of urban drainage planning to mitigate the risk of flood. Figure 3 and Table 1 show the process of drainage network simplification and the simplified rainfall-runoff model of SWMM.
A global optimization algorithm, DDS, is introduced for automatic calibration of watershed simulation models. SWMM can simulate the rainfall-runoff characteristics of an urban area using various parameters such as the diversity of land use, topography and the high spatial variability of rainfalls, but this model contain effective physical and conceptual model parameters which are either difficult or impossible to directly measure. Therefore, to apply these models, model parameters have to be adjusted to fit the observed runoff results. DDS selected as the optimization algorithm of the integrated rainfall-runoff module is designed for calibration problems with many parameters, requires no algorithm parameter tuning, and automatically scales the search to find good solutions within the maximum number of user-specified function evaluations [26]. Table 2 shows the DDS algorithm.
2D inundation numerical model is a widely used tool for flood inundation mapping. However, even high-performance computing equipment has spent substantial computing time running a 2-dimensional numerical model, so it is not appropriate the real-time inundation forecasting and warning. We have built an inundation database for various rainfall scenarios using Two-dimensional Unsteady FLOW (TUFLOW) engine and the inundation potential database was planned to be applied in emergency management according to similar rainfall patterns. The flash floods that result in serious damages frequently occur about 1 h to 24 h duration; thus, various probable rainfall and the design rainfall pattern of 1 h to 24 h duration were applied for numerical simulations. Furthermore, Huff’s method [27] was employed to estimate the temporal distribution of the design rainfall for a watershed. Through this module, the emergency managers can easily compare the current rainfall conditions with the design rainfalls to estimate the flood extents and depths by using the inundation potential database during floods.

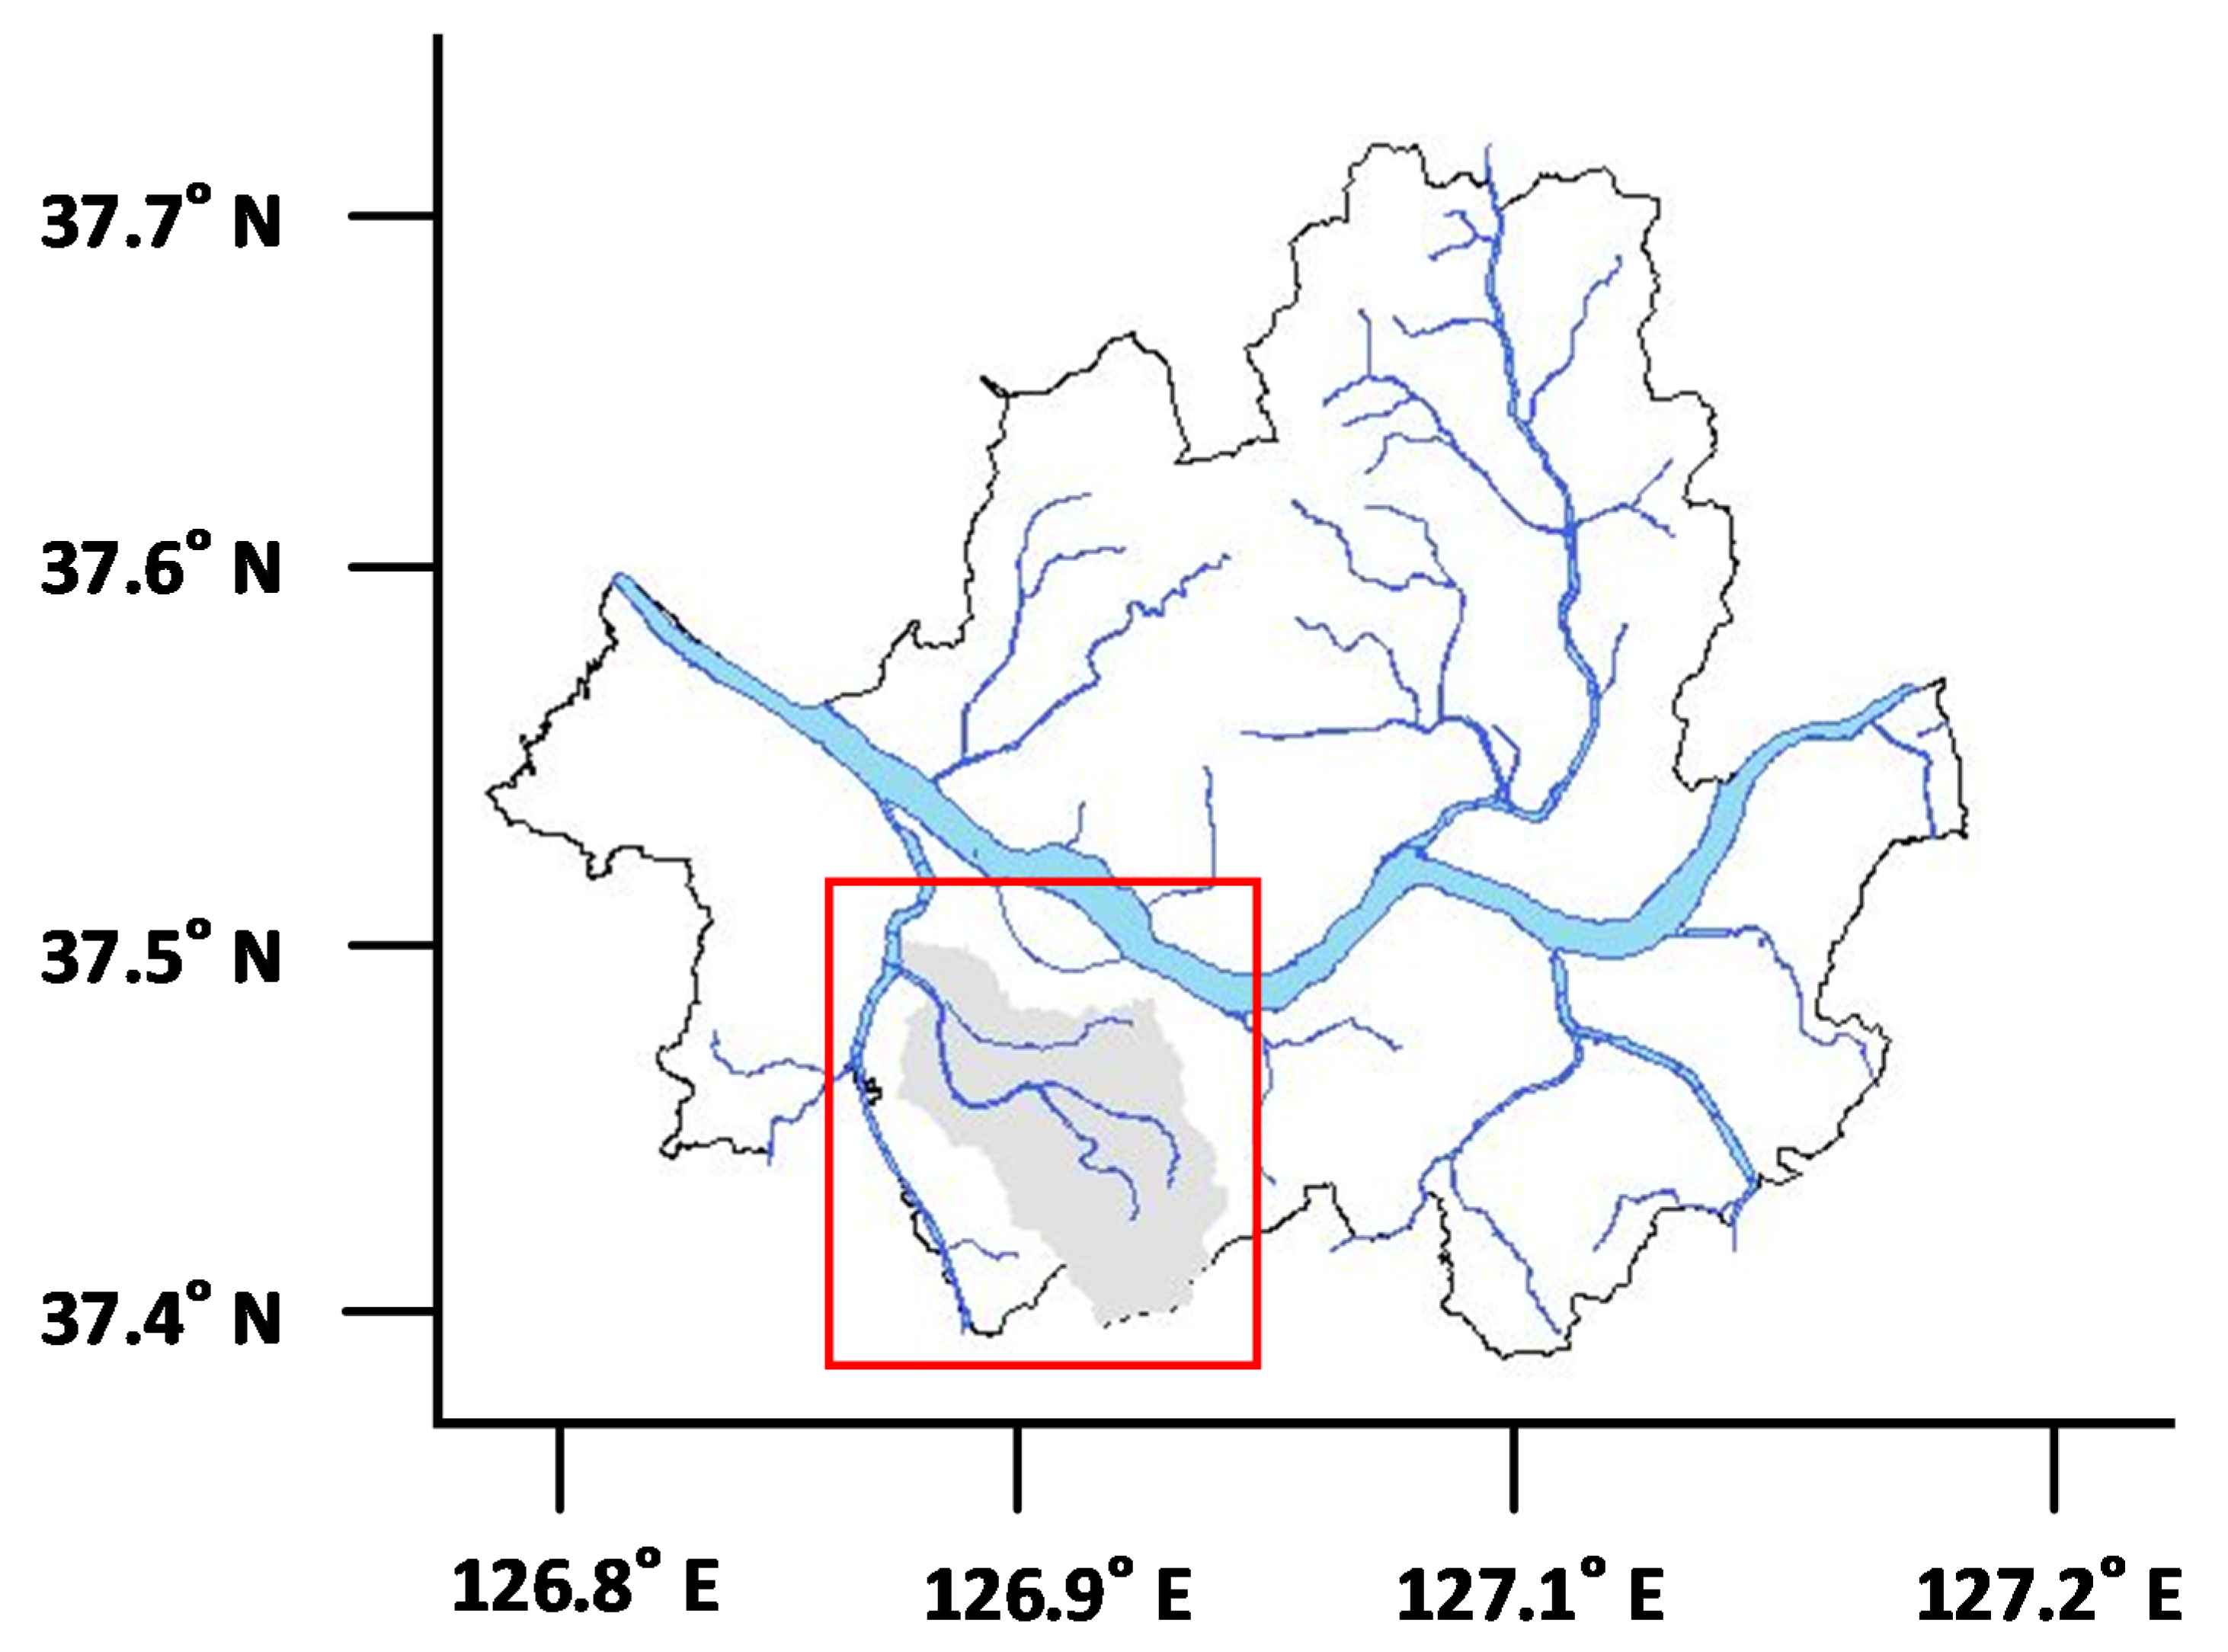
3. Study Area and Data Processing

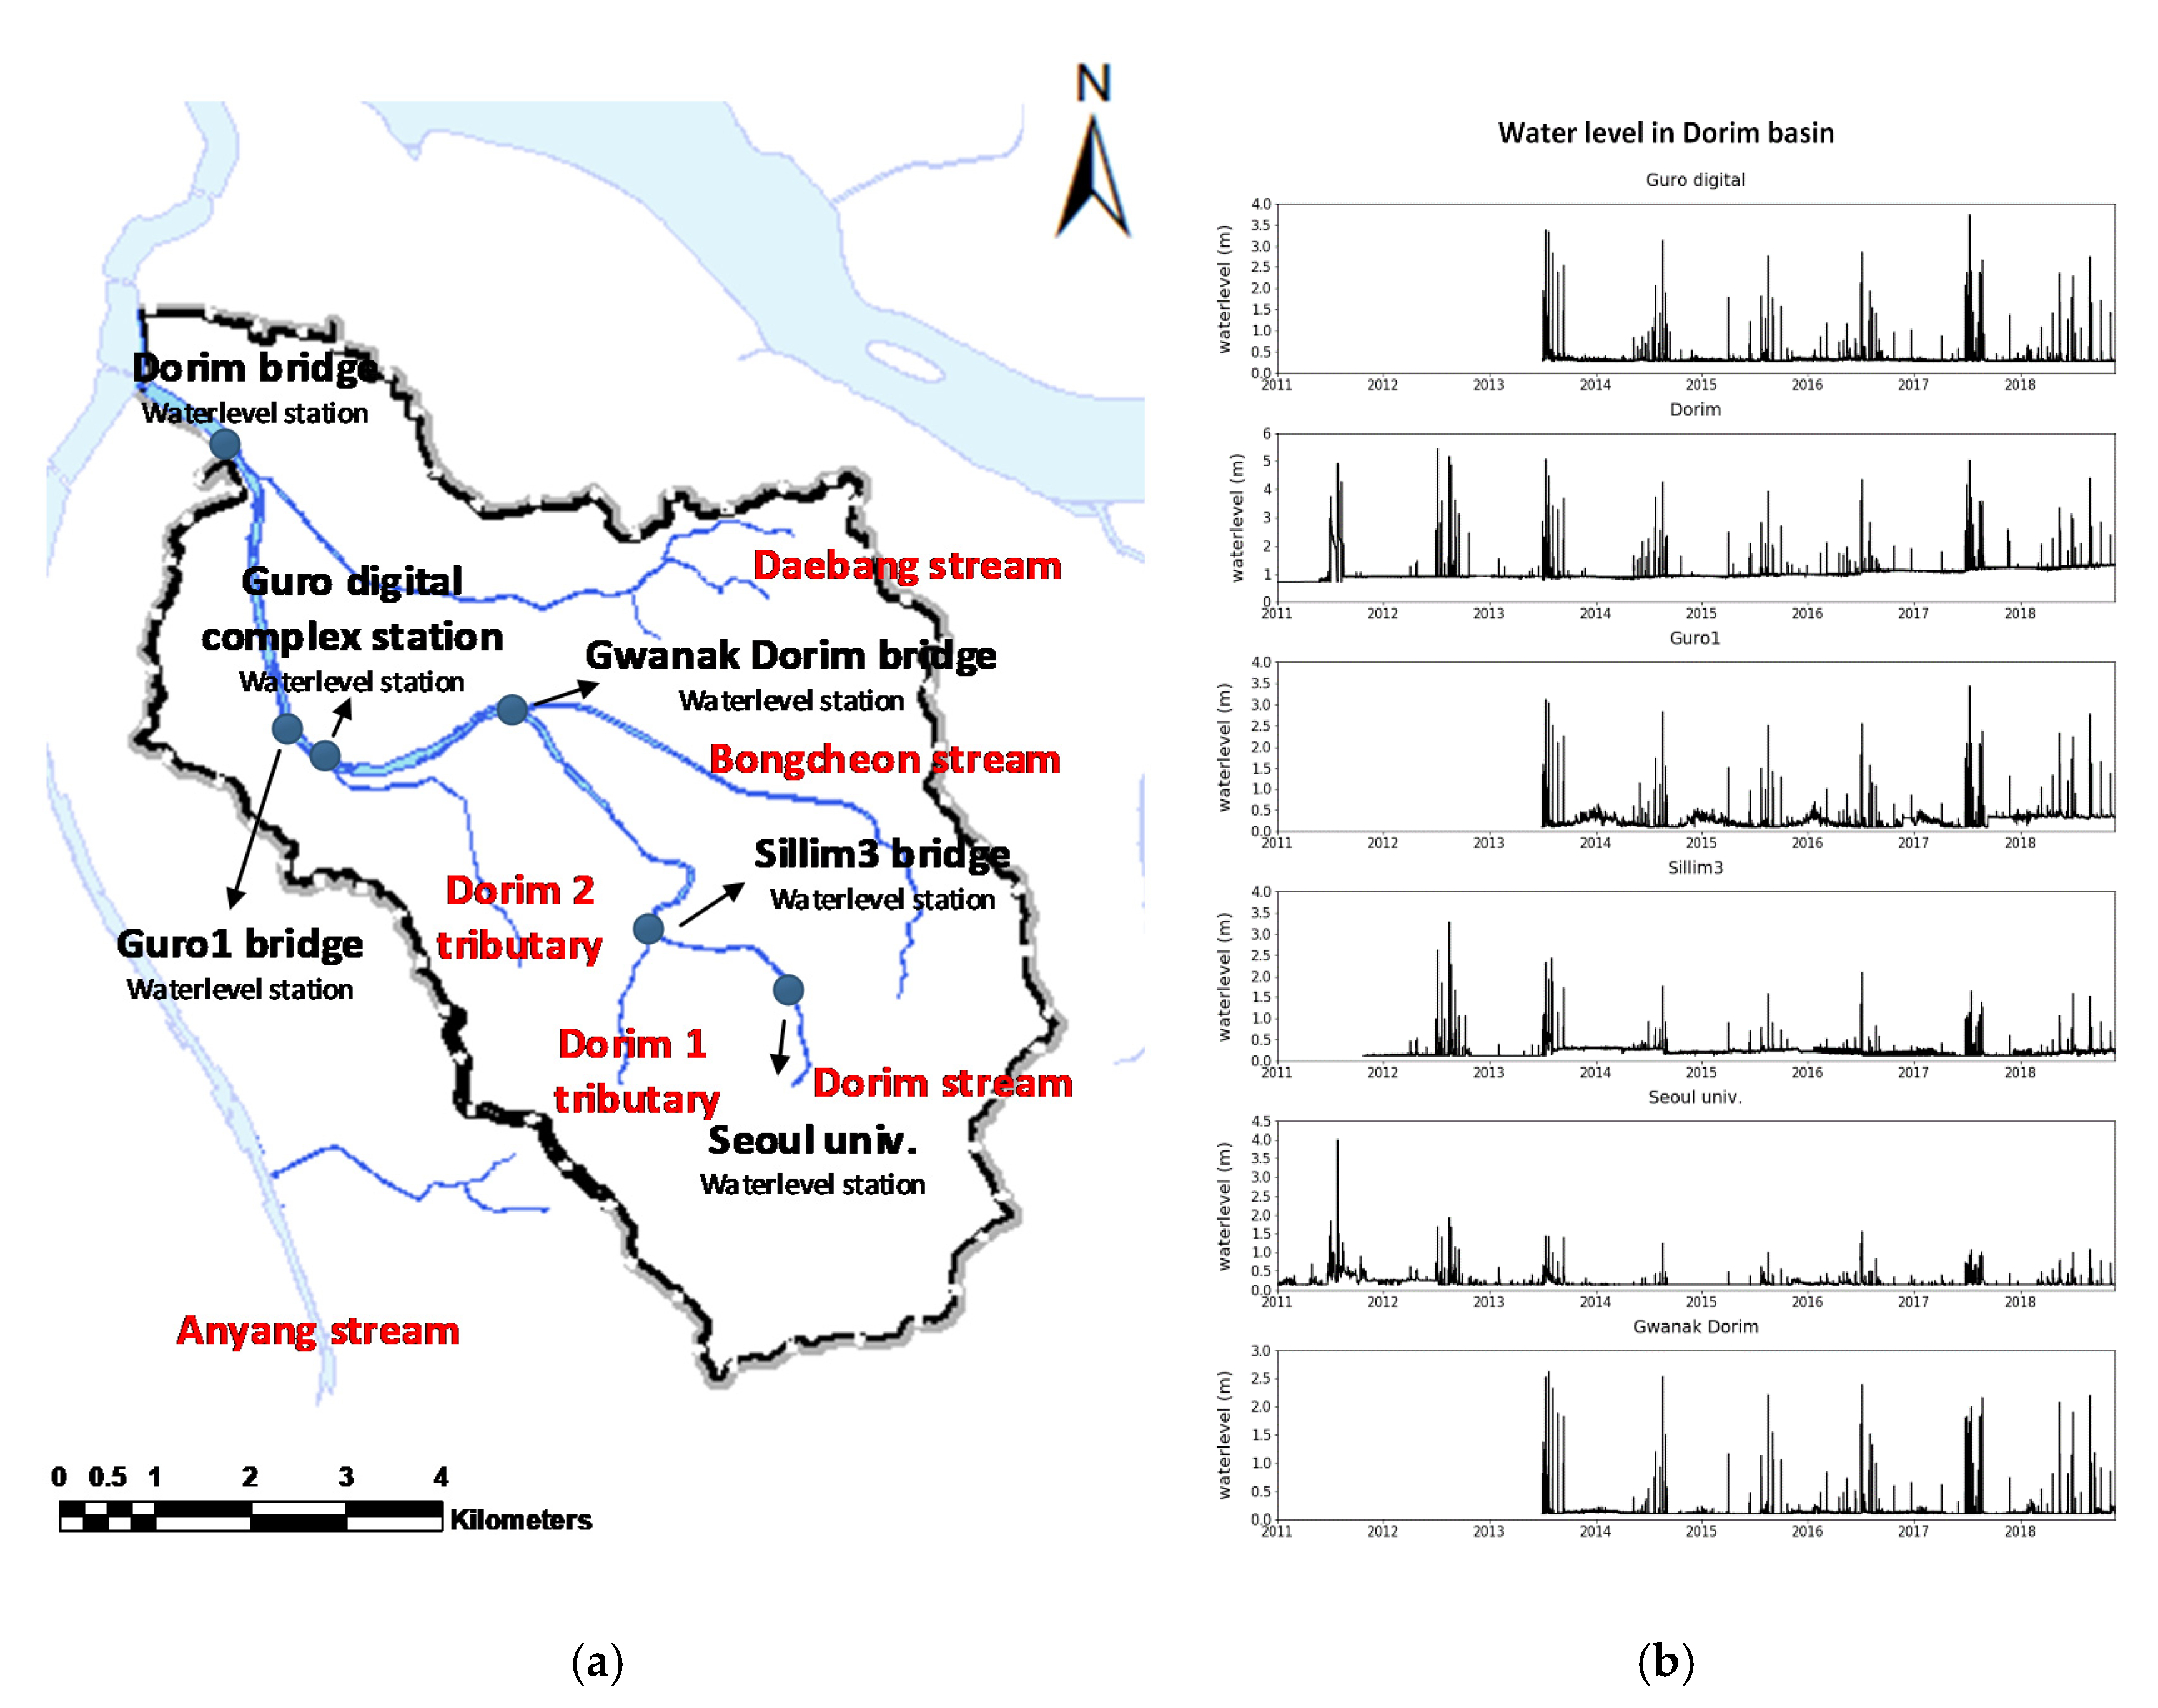
3.1. Study Area and Runoff Model

The Seoul Metropolitan City manages a total of 34 inundation-vulnerable areas. Among them, Dorim basin, which was chosen as the target watershed, is the one of the inundation-vulnerable districts and has small-scale stream. Dorim basin has an area of 42.5 km2 and the Dorim stream has a length of 14.51 km (Figure 4). Upstream catchments of watersheds in Dorim stream are mountainous with steep land slopes, the surface runoffs concentrate rapidly to channel flowing into the downstream urban area once the storm rainfall starts. So, flash flood frequently causes loss of human life and property in this area. Figure 5 shows the rainfall–runoff model of drainage networks in Dorim basin. In result of the constructing drainage networks (all basin of Dorim area), the number of conduits is 32,471 (Figure 5a). After simplification, the number of conduits is 243 (Figure 5b). Although the number of conduits substantially decreases as the criteria of the cumulative drainage area, it was presented that SWMM parameters was calculated automatically and basin area was the same as before the simplification.

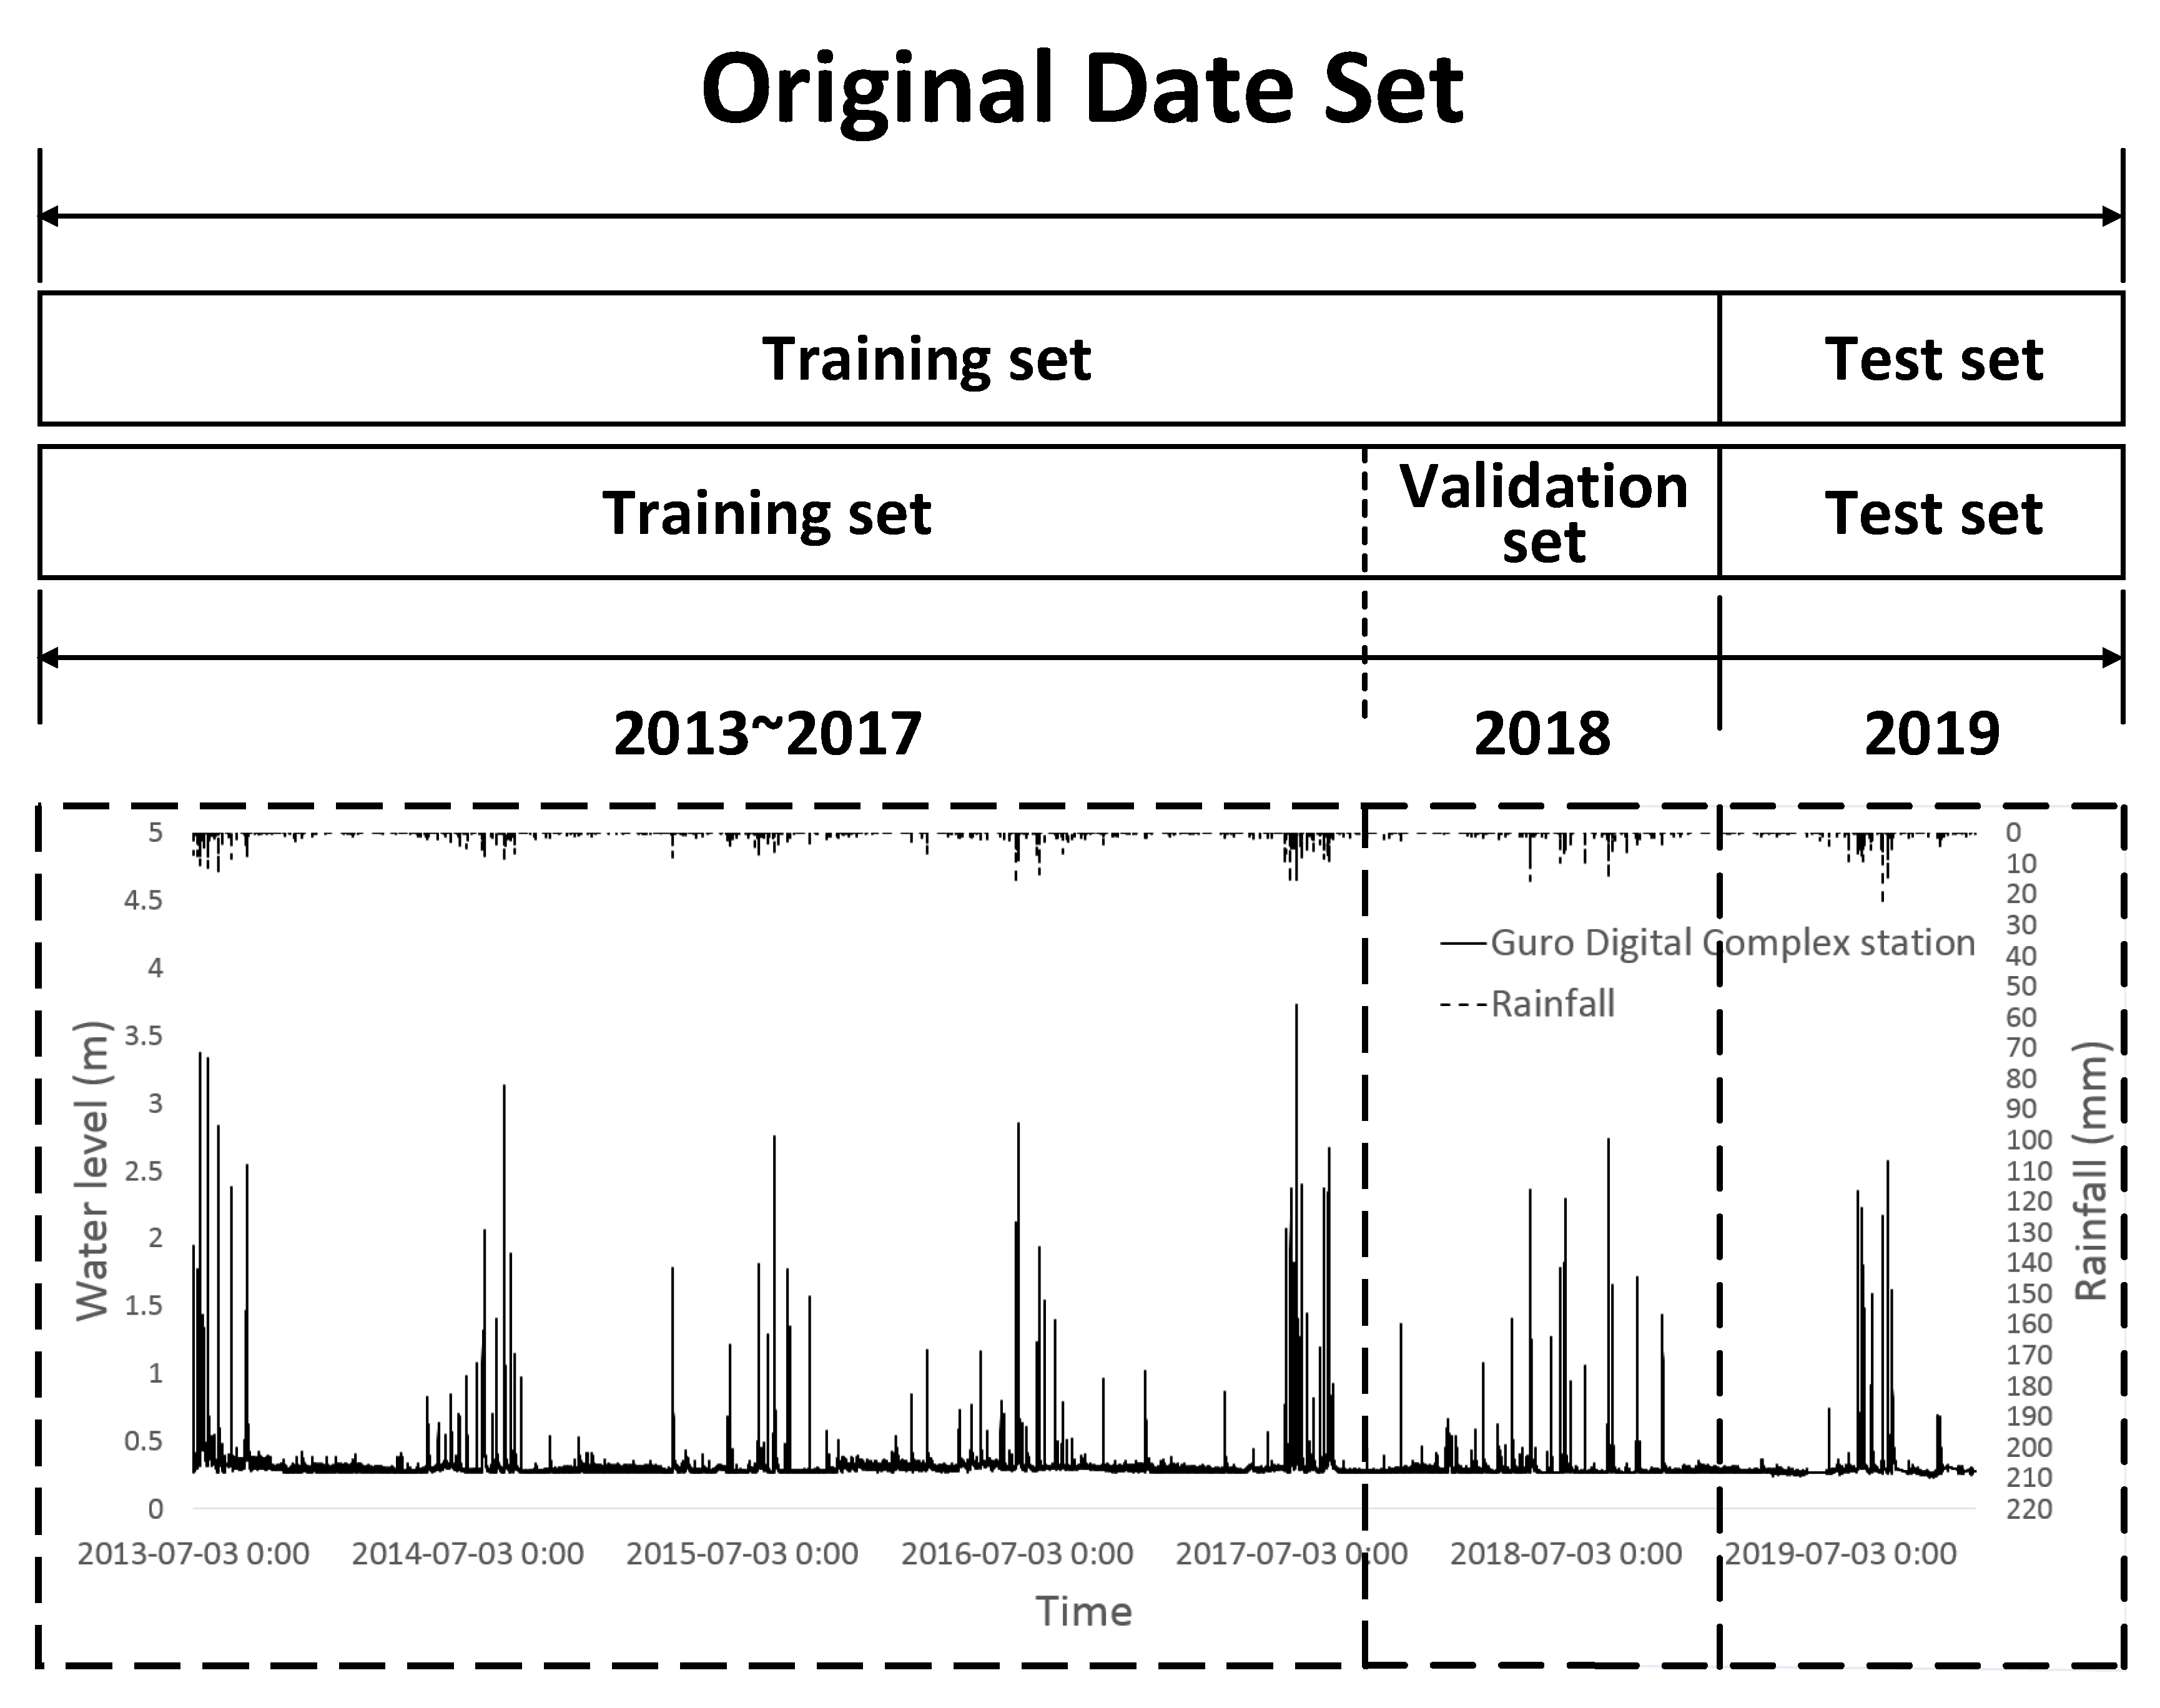
3.2. Hydrological Time Series Data

For the construction of a hydrological time series data set for training LSTM, water level data in the Dorim stream were obtained from Seoul and district offices. The Seoul Metropolitan City has installed 32 water level stations at Han River and 19 monitoring systems at branch streams to record the water level. Among them, water level data from Dorim bridge, Sindaebang, and Sillim 3 bridge stations in Dorim basin are provided. Water level data from Seoul University, Gwanak Dorim bridge, Guro Digital Complex station, and Guro1 Bridge stations were also obtained from each district office. Figure 6 shows the location map of water level stations and the water level data in Dorim stream after performing quality control. Dorim stream is fed by four tributaries, Daebang stream, Bongcheon stream, and Droim 1 and 2 tributaries. Among them, Dorim 2 tributary flows into the Dorim stream located in Sillim 3 bridge, Bongcheon stream flows into Gwanak Dorim bridge, and Dorim 1 tributary flows into Guro Digital Complex station. In water level data, Dorim bridge, Sindaebang, and Guro 1 bridge was excepted from training. There were a lot of outliers in Dorim bridge station because it used to be influenced by the backwater of Ahnyang stream located downstream of Dorim stream, a lot of missing values in Sindaebang station, and a readjustment of water level station in Guro 1 bridge. Table 3 shows the statistical characteristics of water level data set.
A calibration strategy of training set, validation set, and test set size ratio is important to present statistically significant results. However, since before getting great performance, it is not easy to determine the statistical significance. Nevertheless, since approximate values of the error rates of time-series data forecasting on similar tasks are known, it is possible to estimate what reasonable size a test set should have [28]. In this study, the data sets were divided based on the number of rainfall events. Data from 2011 to 2017 were the training dataset, data in 2018 were the validation dataset, and data in 2019 were the test dataset (Figure 7).

4. Application and Evaluation of Integrated System

4.1. Model Application

The LSTM model was trained with water level data to predict stream depth in the short-term inundation prediction module for 2019. Guro Digital Complex station was selected for the target point for predicting the stream depth and flood warning. This is the most dangerous point where accidents were frequently caused by flooding. Furthermore, rainfall forecasting using radar and numerical analysis of drainage networks in real-time were carried out in the very short-term inundation prediction module. 2-dimension inundation maps were also provided to point inundation warning area.

4.1.1. Application of Short-Term Inundation Prediction

Tributaries inflow have a substantially influence on forecasting results of water level by LSTM. Therefore, we have constructed the training sets with various input combinations to consider tributaries inflow. They showed the training group due to water level data (Table 4) and the accuracy of the forecasting result. The module of the short-term inundation prediction was carried out with LSTM on 26 July 2019. The forecasting results for Cases 1, in which training was performed using only one upstream depth data, did not reflect good forecasting model performance because other streams flow into Dorim stream. However, the forecasting results obtained with depth data of two points, case 2 showed better accuracy than case 1 result. Moreover, the forecasting results for Case 3, which involved the training with depth data of three points, indicated the best performance. It means that tributary data is very important to predict downstream depth in Dorim basin. Case 3 also presented that if sufficient depth data are acquired and the data quality is improved, the forecasting result based on depth data can reflect sufficiently good performance. Through these results, the LSTM with training three points water level stations was selected as forecasting model of short-term inundation prediction module. After quantitative and qualitative analysis of LSTM, we also scatter the observed and simulated water level values (Figure 8). The values LSTM R2 are 0.9695, 0.9653, and 0.9823, respectively due to lead time. The LSTM has high values of R2 indicating that this model could well reflect the relationship between observed and forecasting depth so that forecasting model with lead time 90 min is quite possible to predict and warning stream flooding. It is sufficiently can warn and evacuate the resident if accurate water level prediction with 90 min lead time is led in flash rainfall.

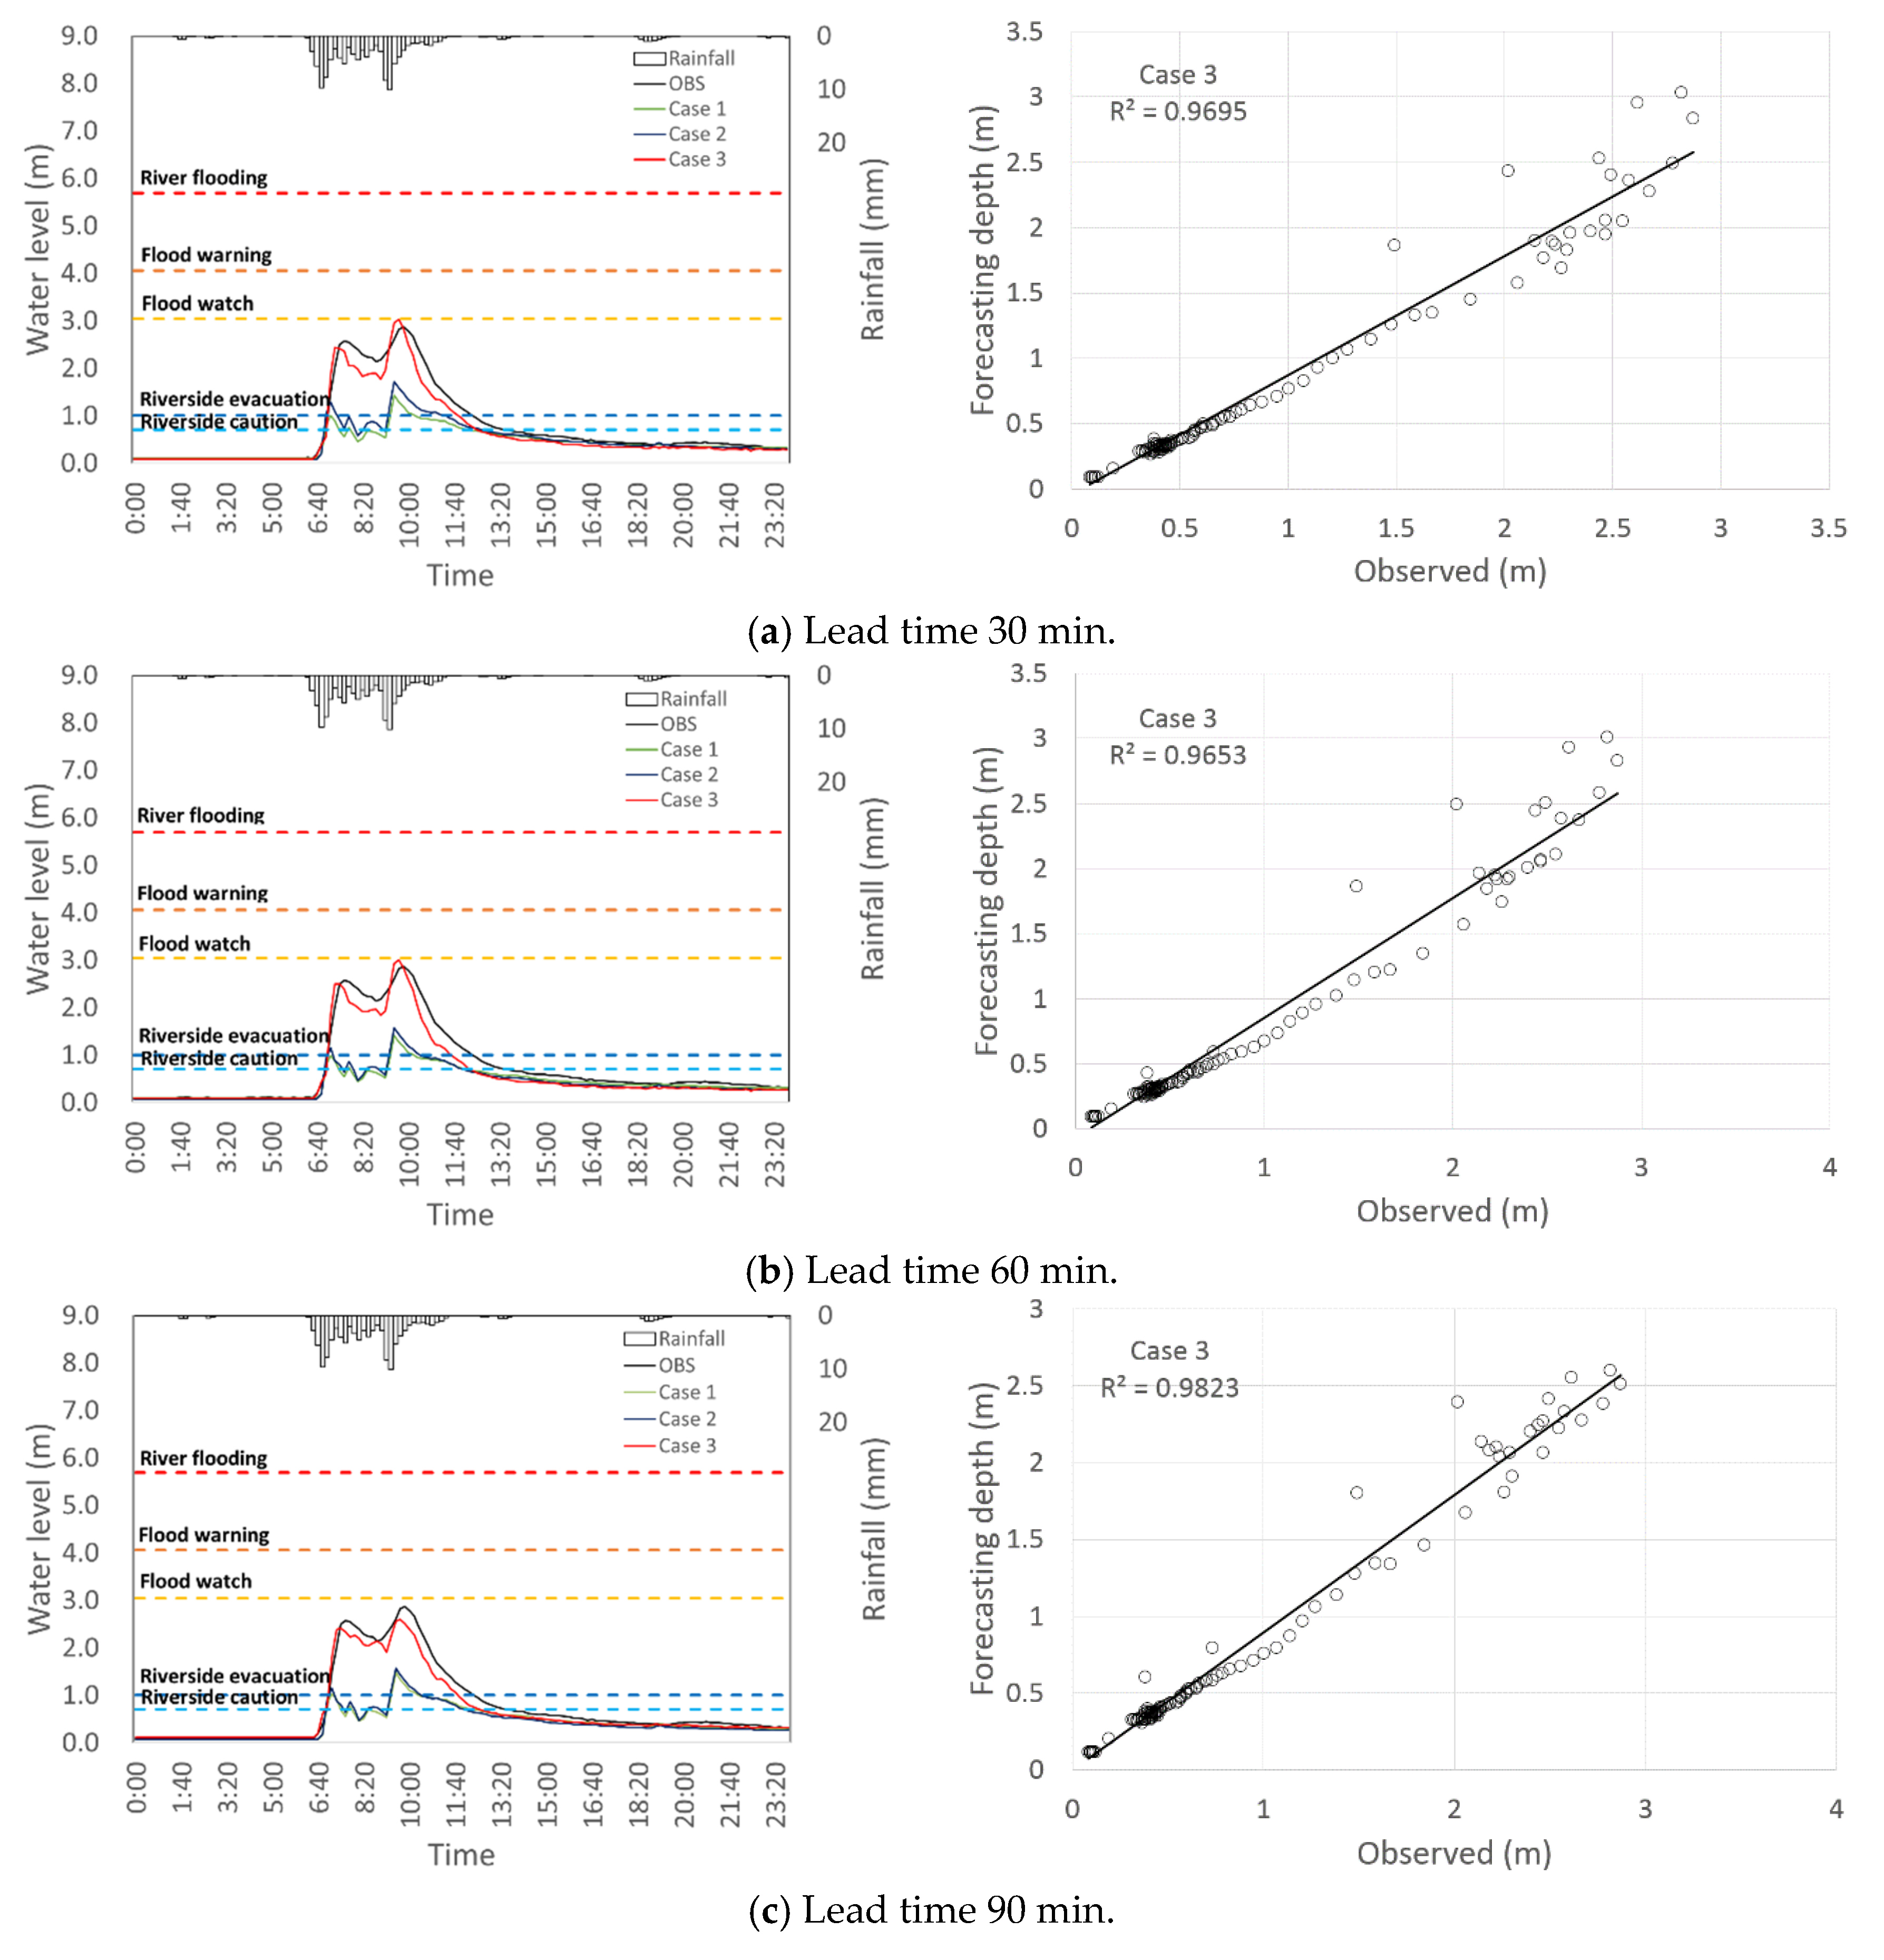
4.1.2. Application of Very Short-Term Inundation Prediction

Rainfall forecasting results by radar in the very short-term inundation prediction were applied. This module generated the forecasting rainfall with from 10 min to 120 min lead time for the Automatic Weather station (AWS) 8 points of KMA near Dorim basin. After that, it converted to the areal average rainfall and the accuracy of forecasting results was compared with that of AWS rainfall data on 26 July 2019 (Figure 9). As a result, the forecasting results until 70 min were good predicted, the accuracy from 80 min began to decrease sharply. Among these forecasting results, the 40 min forecasting rainfall result predicted by radar was applied to the simplified rainfall–runoff model to calculate the stream depth and accuracy of analyzed results was examined. The analysis points were selected as the water level stations in Dorim basin (Seoul University, Sillim3 bridge, Gwanak Dorim bridge, Guro Digital Complex station, and Guro1 Bridge). Figure 10 shows that analyzed stream depth results were compared with the data of water level stations on 26 July 2019. Table 5 makes the comparison of performances of SWNN rainfall–runoff model for stream depth prediction. This is the quantitative analysis of the SWMM model using four preference criteria. Due to the characteristics of predicted rainfall results by radar, which did not predict the initial rainfall well, R2 and NSE of the upstream where Seoul University is located were relatively low, but the predictive performance of the downstream, Gwanak Dorim, and Guro 1 bridge was 0.80 and 0.81, respectively, at 40 min lead time which presented good prediction performance. After 50 min lead time, the values of MAE and RMSE are all increased sharply. These cases illustrate that the 40 min lead time is the most appropriate time to forecast and warn urban flooding.

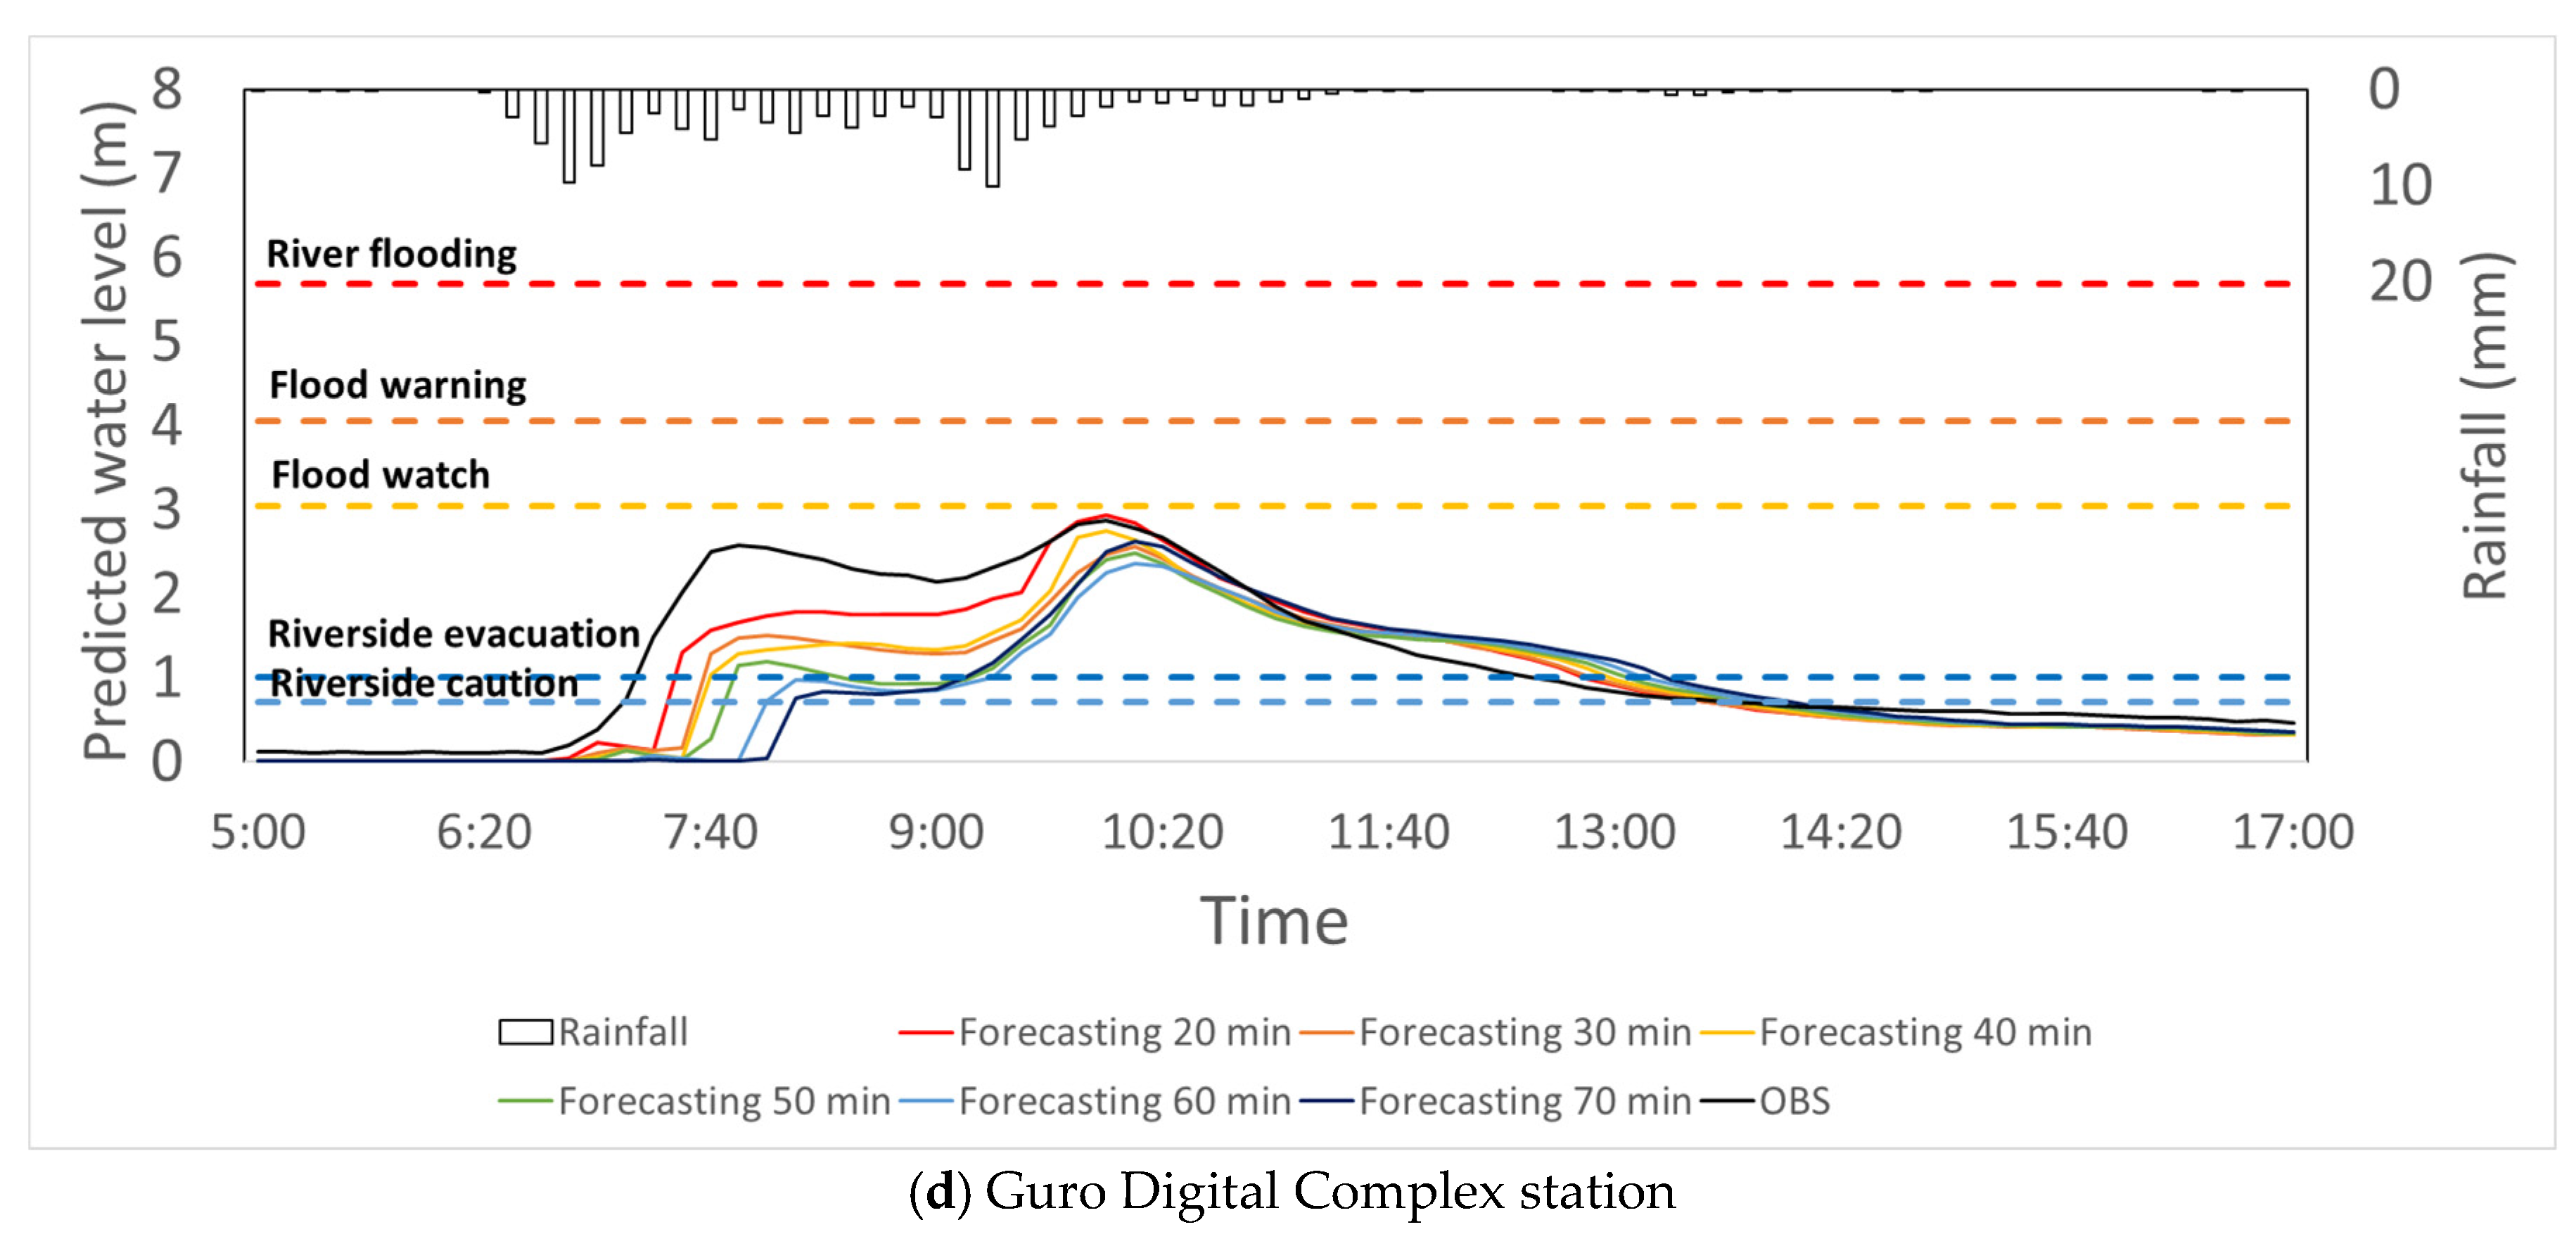
4.1.3. Evaluation of the Integrated Flood Forecasting and Warning System

The prediction of peak depth and warning time of flood is critical for flood forecasting and warning process. Therefore, to evaluate the applicability of integrated flood forecasting and warning system, the forecasting results of integrated flood forecasting and warning system were compared with River Emergency Evacuation Notification System (REENS) operated by Seoul Metropolitan Office which used real-time stream depth to warn flooding (Table 6). There was the first warning, “riverside caution” at 07:10 on 26 July 2019 in observed stream depth of Guro Digital Complex station and the second warning, “riverside evacuation” at 7:20. REENS also issued simultaneously both warnings, “riverside caution” and “riverside evacuation” at 07:10. The short-term inundation prediction modules of LSTM that have lead time from 30 min to 90 min issued exactly the riverside warning time as with observations (OBS). Moreover, early warnings were implemented with from 30 min to 90 min through training the lead time data. The very short-term inundation prediction modules of SWMM that have lead time 20 min to 40 min analyzed the riverside warning time 10-min later compared with OBS because initial rainfall forecasting has lower performance in this rainfall event. However, early warnings were able to be implemented with from 10 min to 20 min through rainfall prediction by radar. These forecasting results illustrate that both modules can be forecasting and warning urban flooding adequately. The short-term inundation prediction module based on the data-driven method can predict the stream depth with long lead times and high-quality forecasting performance. The very short-term inundation prediction module based on the model-driven method has a slightly shorter lead time than the data-driven method because of time-consuming SWMM analysis but it presents the rainfall and inundation forecasting results across the watershed as well as 2-dimensional inundation maps for decision-making in the web pages (Figure 11) [29]. In addition, it is expected that ability of urban flood forecasting and warning in the integrated flood forecasting and warning system can be increased through improve the accuracy of rainfall prediction by radar, advancement of rainfall–runoff model and growth of observed hydrology time series data.

5. Conclusions

A real-time flood forecasting and warning can proactively convey a powerful message about the warning of flash floods and inundation depths in urban areas, together with the effectiveness of possible countermeasures to citizens and civil servants. Therefore, we developed the integrated flood forecasting and warning system combined inland-river that systematized technology to quantify flood risk and flood forecasting to provide effective flood warning in the urban area. It consisted of the short-term inundation prediction module with data-driven method and the very short-term inundation prediction module with model-driven method. LSTM was used to predict the stream depth in the short-term inundation prediction and very short-term rainfall prediction by radar data, construction of a rainfall–runoff model combined inland-river by coupled SWMM and HEC-RAS, automatic simplification module of drainage networks, automatic calibration module of SWMM parameter by DDS, construction of the 2-dimension inundation database by various rainfall scenario to warn inundation risk areas were used in very short-term inundation prediction to warn and convey the flood-related data and information to communities.
An application to Dorim basin which is one of the Seoul Metropolitan’s inundation vulnerable areas is performed to clearly demonstrate the superiority of the proposed system. First, according to the LSTM model in the short-term inundation prediction module, it is observed that the stream depth in the study area is predicted well from 30 min to 90 min lead time. Second, in the very short-term inundation prediction module, rainfall from 10 min to 70 min lead time was predicted with a good performance by radar. Moreover, these results are provided to the rainfall–runoff model of SWMM with an automatic simplification method and DDS optimization algorithm applied. Forecasting results of stream depth across the river are also predicted with great performance until 40-min lead time. Finally, 2-dimension inundation maps are presented through the inundation database which is made due to various rainfall and duration scenarios. The proposed model can be improved through improving the accuracy of rainfall prediction by radar, the advancement of the rainfall–runoff model, and the growth of observed hydrology time series data. We expect that it can be effectively applied to reduce human and property damage caused by flood.

Author Contributions

Conceptualization, resources, formal analysis, and writing—original draft, J.H.L.; conceptualization, methodology, and writing—review and editing, Y.-I.M.; and writing—review and editing, G.M.Y. and H.T.M. All authors have read and agreed to the published version of the manuscript.

Funding

This work was supported by the 2018 Research Fund of the University of Seoul.

Acknowledgments

The University of Seoul has financially supported this research. The authors would like to thank the anonymous reviewers for their valuable comments and suggestions to improve the quality of the paper.

Conflicts of Interest

The authors declare no conflict of interest.

References

  1. Karamouz, M.; Hosseinpour, A.; Nazif, S. Improvement of urban drainage system performance under climate change impact: Case study. J. Hydrol. 2010, 16, 395–412. [Google Scholar] [CrossRef]
  2. Wu, X.S.; Wang, Z.L.; Guo, S.L.; Liao, W.L.; Zeng, Z.Y.; Chen, X.H. Scenario-based projections of future urban inundation within a coupled hydrodynamic model framework: A case study in Dongguan City, China. J. Hydrol. 2017, 547, 428–442. [Google Scholar] [CrossRef]
  3. IPCC. Climate Change 2014: Synthesis Report; Pachauri, R.K., Meyer, L.A., Eds.; IPCC: Geneva, Switzerland, 2014; pp. 1–151. [Google Scholar]
  4. Kim, S.M.; Tachikawa, Y.; Takara, K. Recent flood disasters and progress of disaster management system in Korea. Annu. Disaster Prevent. Res. Inst. Kyoto Univ. 2007, 50, 15–31. [Google Scholar]
  5. Blong, R. A Review of Damage Intensity Scales. Nat. Hazards 2003, 29, 57–76. [Google Scholar] [CrossRef]
  6. Seoul Metropolitan City. River Emergency Evacuation Notification System. 2013. Available online: http://203.142.217.120/ (accessed on 19 August 2020).
  7. Lin, G.F.; Lin, Y.H.; Chou, Y.C. Development of a real-time regional-inundation forecasting model for the inundation warning system. J. Hydroinform. 2013, 15, 1391–1407. [Google Scholar] [CrossRef]
  8. Chang, L.C.; Chang, F.J.; Yang, S.N.; Kao, I.F.; Ku, Y.Y.; Kuo, C.L.; Amin, I.M.Z.M. Building an intelligent hydroinformatics integration platform for regional flood inundation warning systems. Water 2018, 11, 9. [Google Scholar] [CrossRef] [Green Version]
  9. Berne, A.; Delrieu, G.; Creutin, J.D.; Obled, C. Temporal and spatial resolution of rainfall measurements required for urban hydrology. J. Hydrol. 2004, 299, 166–179. [Google Scholar] [CrossRef]
  10. Bruni, G.; Reinoso, R.; Giesen, N.C.; Clemens, F.H.L.R.; Veldhuis, J.A.E. On the sensitivity of urban hydrodynamic modelling to rainfall spatial and temporal resolution. Hydrol. Earth Syst. 2015, 19, 691–709. [Google Scholar] [CrossRef] [Green Version]
  11. Einfalt, T.; Arnbjerg-Nielsen, K.; Golz, C.; Jensen, N.E.; Quirmbachd, M.; Vaes, G.; Vieux, B. Towards a roadmap for use of radar rainfall data in urban drainage. J. Hydrol. 2004, 299, 186–202. [Google Scholar] [CrossRef]
  12. Foresti, L.; Reyniers, M.; Seed, A.; Delobbe, L. Development and verification of a real-time stochastic precipitation nowcasting system for urban hydrology in Belgium. Hydrol. Earth Syst. 2016, 12, 6831–6879. [Google Scholar] [CrossRef]
  13. Shi, X.; Gao, Z.; Lausen, L.; Wang, H.; Yeung, D.Y.; Wong, W.K.; Woo, W.C. Deep Learning for Precipitation Nowcasting: A Benchmark and a New Model. Available online: http://papers.nips.cc/paper/7145-deep-learning-for-precipitation-nowcasting-a-benchmark-and-a-new-model (accessed on 19 August 2020).
  14. Chang, F.J.; Chen, P.A.; Lu, Y.R.; Huang, E.; Chang, K.Y. Real-time multi-step-ahead water level forecasting by recurrent neural networks for urban flood control. J. Hydrol. 2014, 517, 836–846. [Google Scholar] [CrossRef]
  15. Kim, H.U.; Bae, T.S. Preliminary study of deep learning-based precipitation prediction. J. Korean Soc. Surv. 2017, 35, 423–430. [Google Scholar]
  16. Hu, C.; Wu, Q.; Li, H.; Jian, S.; Li, N.; Lou, Z. Deep learning with a long short-term memory networks approach for rainfall-runoff simulation. Water 2018, 10, 1543. [Google Scholar] [CrossRef] [Green Version]
  17. Kang, J.; Wang, H.; Yuan, F.; Wang, Z.; Huang, J.; Qiu, T. Prediction of precipitation based on recurrent neural networks in Jingdezhen. Atmosphere 2020, 11, 246. [Google Scholar] [CrossRef] [Green Version]
  18. Song, T.; Ding, W.; Wu, J.; Liu, H.; Zhou, H.; Chu, J. Flash flood forecasting based on long short-term memory networks. Water 2019, 12, 109. [Google Scholar] [CrossRef] [Green Version]
  19. Bergstra, J.; Bengio, Y. Random search for hyper-parameter optimization. J. Mach. Learn. Res. 2012, 13, 281–305. [Google Scholar]
  20. Hochreiter, S.; Schmidhuber, J. Long short-term memory. Neural Comput. 1997, 9, 1735–1780. [Google Scholar] [CrossRef]
  21. Kingma, D.; Ba, J. Adam: A Method for Stochastic Optimization. Available online: https://arxiv.org/abs/1412.6980 (accessed on 19 August 2020).
  22. He, K.; Zhang, X.; Ren, S.; Sun, J. Delving Deep into Rectifiers: Surpassing Human-Level Performance on Imagenet Classification. Available online: https://www.cv-foundation.org/openaccess/content_iccv_2015/html/He_Delving_Deep_into_ICCV_2015_paper.html (accessed on 19 August 2020).
  23. Atlas, D.; Ulbrich, C.; Marks, F.D.; Amitai, E.; Williams, C.R. Systematic variation of drop size and radar-rainfall relations. J. Geophys. Res. 1999, 104, 6155–6169. [Google Scholar] [CrossRef]
  24. Rinehart, R.E.; Garvey, T. Three dimensional storm motion detection by conventional weather radar. Nature 1978, 273, 287–289. [Google Scholar] [CrossRef]
  25. Kim, G.; Kim, J.P. Development of a short term rainfall forecast model using sequential CAPPI data. J. Korean Soc. Civ. Eng. 2009, 29, 543–550. (In Korean) [Google Scholar]
  26. Tolson, B.A.; Shoemaker, C.A. Dynamically dimensioned search algorithm for computationally efficient watershed model calibration. Water Resour. Res. 2007, 43, W01413. [Google Scholar] [CrossRef]
  27. Huff, F.A. Time distribution of rainfall in heavy storm. Water Resour. Res. 1967, 3, 1007–1019. [Google Scholar] [CrossRef]
  28. Guyon, I.; Makhoul, J.; Schwartz, R.; Vapnik, V. What size test set gives good error rate estimates? IEEE Trans. Pattern Anal. Mach. Intell. 1998, 20, 52–64. [Google Scholar] [CrossRef]
  29. University of Seoul, Integrated Flood Forecasting and Warning System Combined Inland-River. 2018. Available online: http://210.125.181.27:10001/IRFF/index.-do (accessed on 19 August 2020).
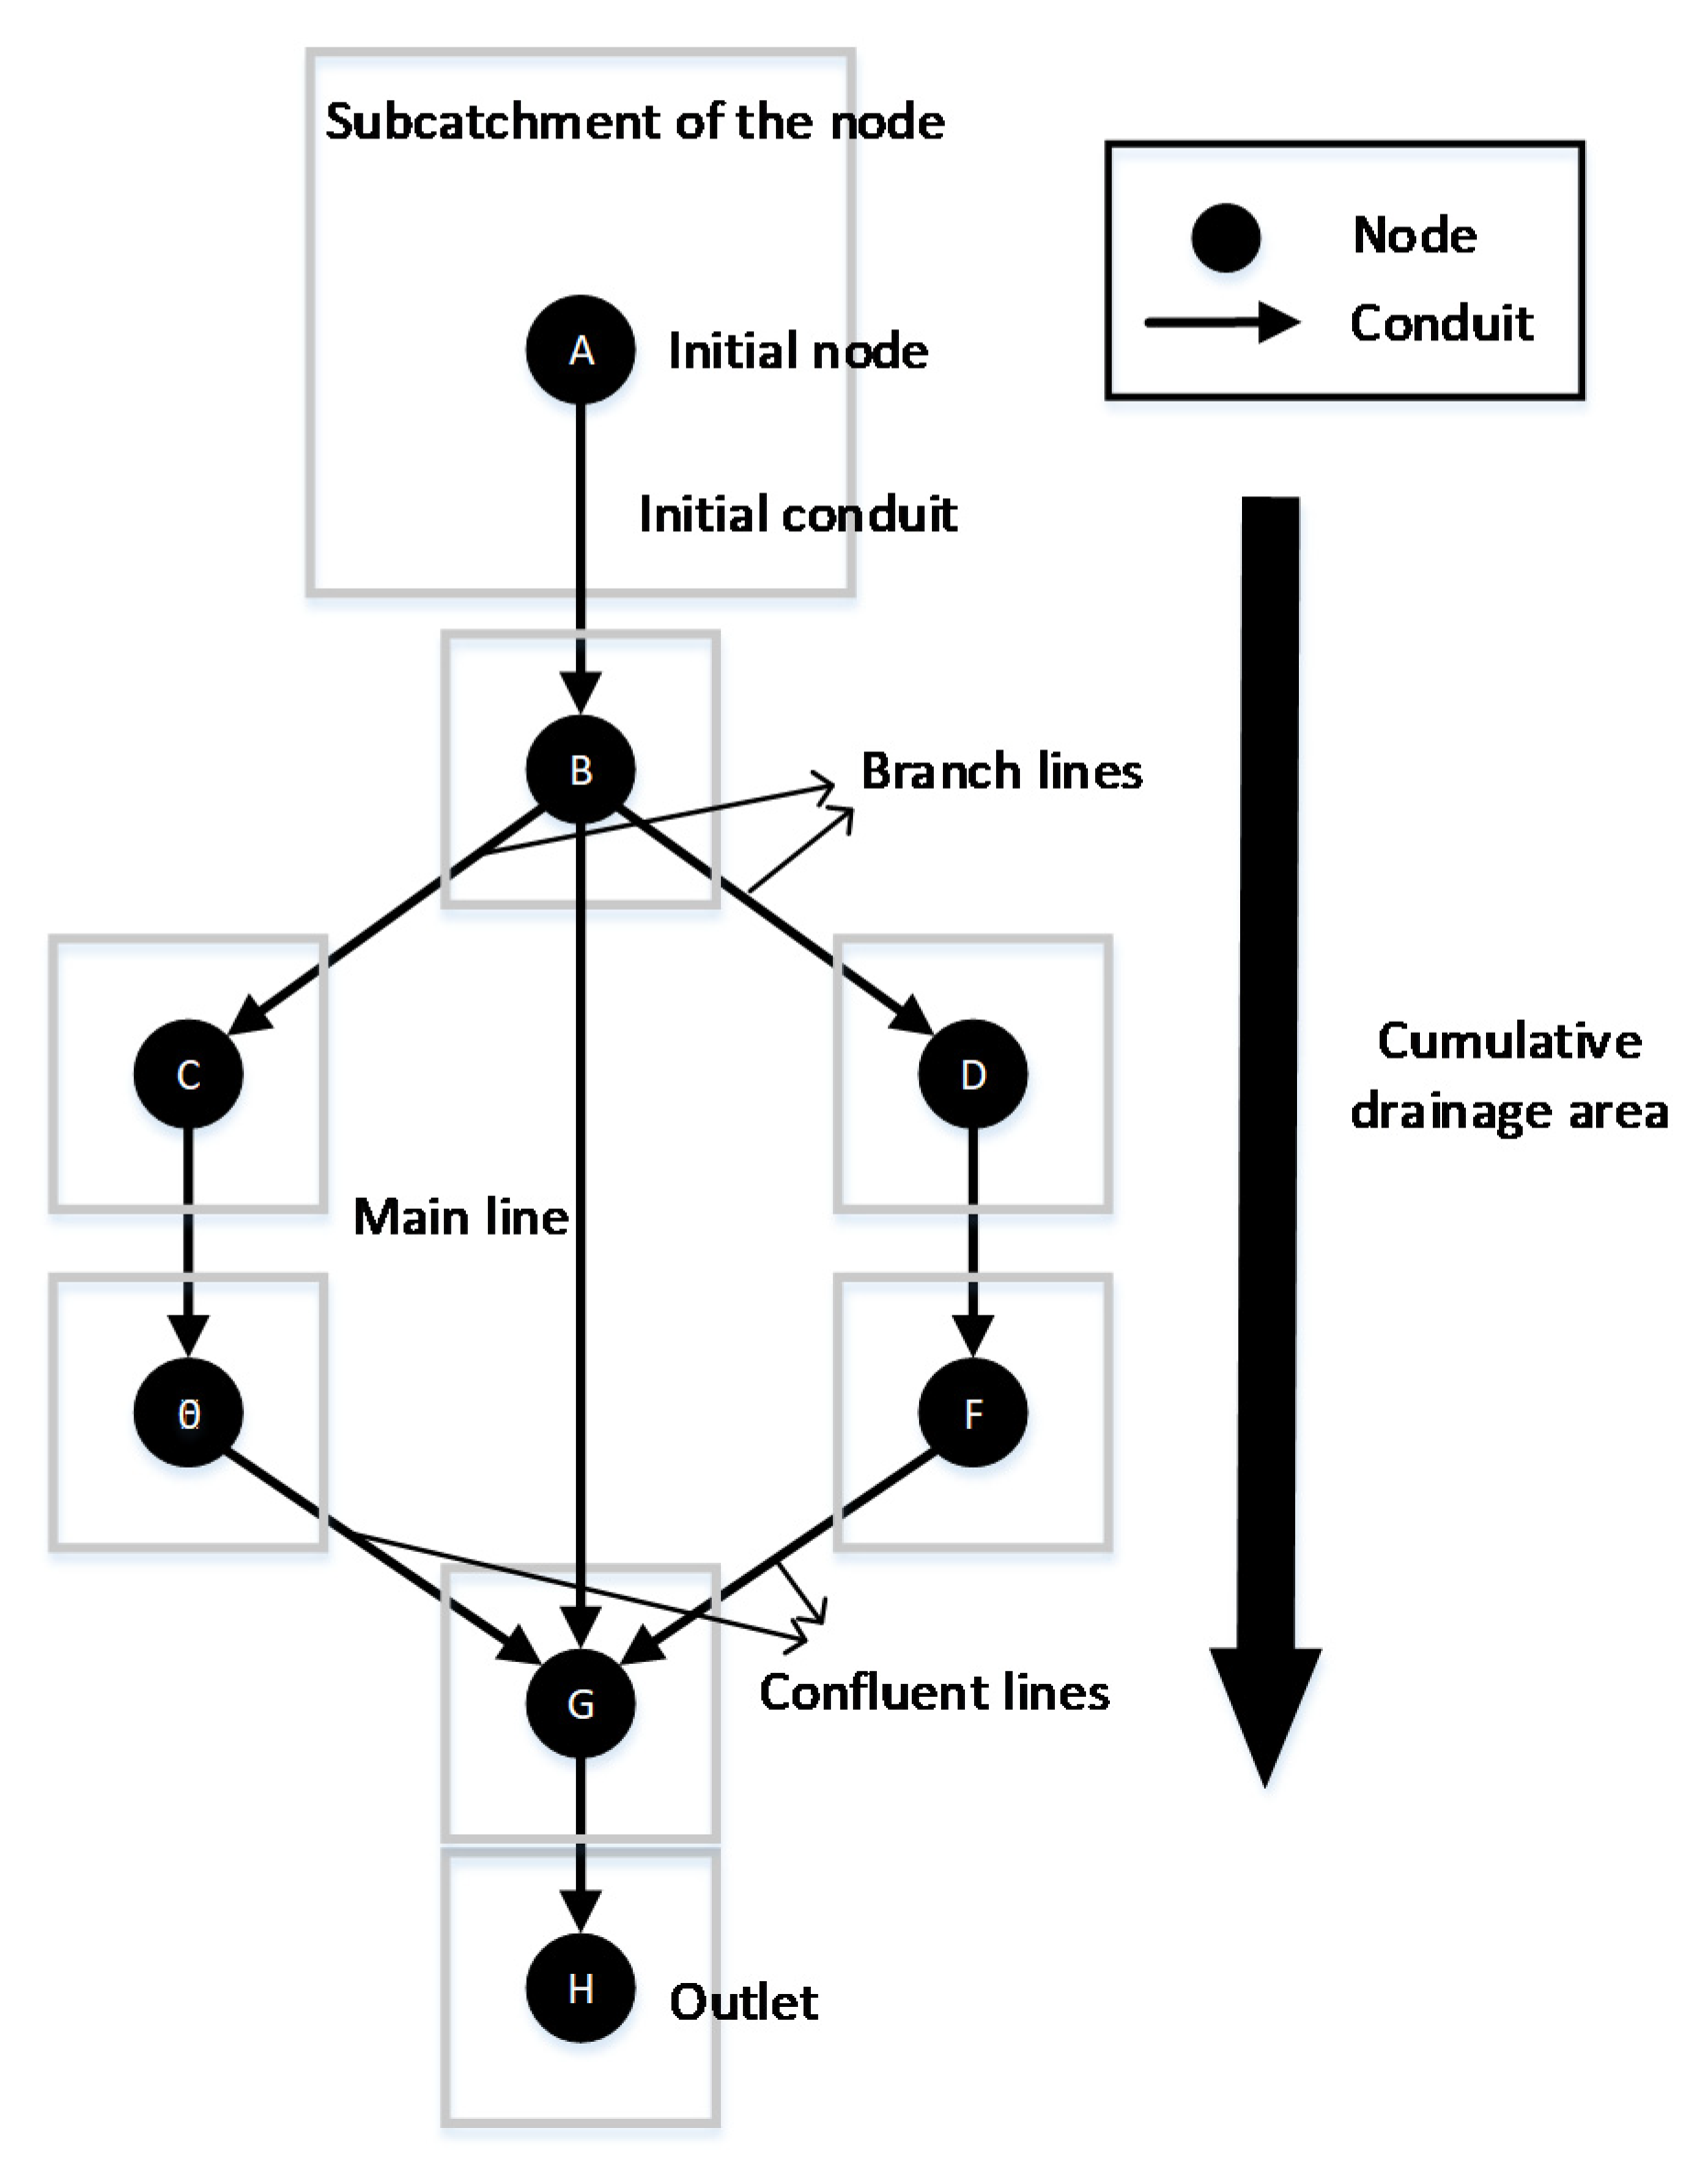
Figure 1. Schematic structure of the integrated flood forecasting and warning system for urban basin.
Atmosphere 11 00971 g001
Figure 2. Process of constructing the rainfall-runoff model.
Atmosphere 11 00971 g002
Figure 3. Drainage networks simplification structure.
Atmosphere 11 00971 g003
Figure 4. Map of the study area in Seoul metropolitan city.
Atmosphere 11 00971 g004
Figure 5. The simplified result of drainage networks in rainfall–runoff model of Dorim basin (a) before simplification; (b) after simplification.
Atmosphere 11 00971 g005
Figure 6. Locations of the Dorim basin. (a) Location map of water level stations in Dorim stream; (b) water level data with quality control in Dorim stream.
Atmosphere 11 00971 g006
Figure 7. Building of hydrologic time series data sets (training set, validation set, test set) in the short-term inundation prediction module.
Atmosphere 11 00971 g007
Figure 8. Prediction results of Long Short-Term Memory (LSTM) due to varying lead times on Guro Digital Complex station and scatter plot of the observed and the simulated stream depth in training 3 water level stations. (a) Lead time 30 min. (b) Lead time 60 min. (c) Lead time 90 min.
Atmosphere 11 00971 g008
Figure 9. Predicted areal average rainfall by radar due to forecast lead time in Dorim basin. (a) Forecast (10 min). (b) Forecast (20 min). (c) Forecast (30 min). (d) Forecast (40 min). (e) Forecast (50 min). (f) Forecast (60 min). (g) Forecast (70 min). (h) Forecast (80 min). (i) Forecast (90 min). (j) Forecast (100 min). (k) Forecast (110 min). (l) Forecast (120 min).
Atmosphere 11 00971 g009aAtmosphere 11 00971 g009b
Figure 10. Rainfall–runoff results of SWMM, the predicted water level by radar forecast rainfall across Dorim stream. (a) Seoul University. (b) Sillim 3 bridge. (c) Gwank Dorim bridge. (d) Guro Digital Complex station.
Atmosphere 11 00971 g010aAtmosphere 11 00971 g010b
Figure 11. Integrated flood forecasting and warning system in web page Ref [29]. (a) Main page. (b) Rainfall prediction page by radar. (c) Stream depth prediction page. (d) Inundation map page.
Atmosphere 11 00971 g011
Table 1. Process of drainage networks simplification.
StepDetail Process
1st step
Checking of the initial condition
Searching the initial conduit and node
Calculating the cross-sectional area of flow
Checking the branch conduits and nodes
Checking the outlet
2nd step
Calculating of the drainage area
Calculating the cumulative drainage area of all nodes from upstream point
3rd step
Calculating of the branch line and mainline
User can define the cumulative drainage area to distinguish branch line and main line
4th step
Calculating of the parameter
Calculating the parameters of nodes and conduits to be deleted in simplification process
5th step
Building of the drainage network
Building the simplified drainage network(.inp)
Table 2. Dynamically dimensioned search (DDS) algorithm (Tolson, B.A. and Shoemaker, C.A., 2007).
StepDetail Process
1st stepDefine DDS input:
Neighborhood perturbation size parameter, γ (0.2 is default)
Maximum # of function evaluation, 𝓂
Vectors of lower, X min , and upper, X max , bounds for all D decision variables
Initial solution, X 0 = [ X 1 , , X D ]  
2nd stepSet counter to 1, i − 1, and evaluate objective function F at initial solution, F( X 0 ) :
F best = F ( X 0 ) ,   and   X best = X 0
3rd stepRandomly select J of the D decision variables for inclusion in neighborhood, { Ν }:
Calculate probability each decision variable is included in { Ν } as a function of the current iteration count: P(i) = 1 − ln(i)/ln( 𝓂 )
FOR d = 1,   D   decision   variables ,   add   d   to   { Ν } with probability P
IF { Ν } empty, select one random d for { Ν }
4th stepFor j = 1,   J decision variables in { Ν }, perturb X j best   using a standard normal random variable, Ν (0,1), reflecting at decision variable bounds if necessary:
  X j new = X j best + σ j N ( 0 , 1 ) ,   where   σ j = Υ ( X j max X j min )
IF   X j new < X j min ,   reflect   perturbation :
X j new = X j min + ( X j min X j new )
IF   X j new > X j max ,   set   X j new = X j min
IF   X j new > X j max ,   reflect   perturbation :
X j new = X j max ( X j new X j max )
IF   X j new < X j min ,   set   X j new = X j max
5th stepEvaluate F( X new )   and   update   current   best   solution   if   necessary :
IF   F ( X j new ) F best ,   update   new   best   solution :
F best = F ( X new )   and   X best = X new
6th stepUpdate iteration count, i = i+1, and check stopping criterion:
IF i = m, STOP, print output (e.g., F best   &   X best )
ELSE go to STEP 3
Table 3. Statistical characteristics of water level data set.
Data SetStationMinMaxAvg.STDEV
Training setGuro Digital Complex station0.27 3.73 0.31 0.103
Gwanak Dorim bridge0.102.620.120.069
Sillim 3 bridge0.122.420.210.087
Seoul University0.141.560.160.067
Validation setGuro Digital Complex station0.27 2.74 0.30 0.108
Gwanak Dorim bridge0.082.200.130.086
Sillim 3 bridge0.041.590.200.060
Seoul University.0.011.080.120.089
Test setGuro Digital Complex station0.23 2.57 0.29 0.091
Gwanak Dorim bridge0.081.890.140.061
Sillim 3 bridge0.081.430.160.049
Seoul University0.010.990.110.074
Table 4. Training group due to training conditions in water level data.
CaseModelDataInput VariableOutput Variable
Case 1LSTMWater levelWse (t), Wse (t − 1), ..., Wse (t − τ)Wgdc (t + 3)
Wgdc (t + 6)
Wgdc (t + 9)
Case 2Wse (t), Wse (t − 1), ..., Wse (t − τ)
Wsil (t), Wsil (t − 1), ..., Wsil (t − τ)
Case 3Wse (t), Wse (t − 1), ..., Wse (t − τ)
Wsil (t), Wsil (t − 1), ..., Wsil (t − τ)
Wgdb (t), Wgdb (t − 1), ..., Wgdb (t − τ)
Wgdc = Water level data of Guro Digital Complex station, Wgdb = Water level data of Gwanak Dorim bridge, Wsil = Water level data of Sillim3 bridge, Wse = Water level data of Seoul University. t = Current time, τ = previous time.
Table 5. Comparison of performances of SWMM for stream depth prediction (lead time from 20 min to 70 min by radar).
StationsForecast 20 minForecast 30 min
R2RMSENSEMAER2RMSENSEMAE
Seoul University0.35 0.34 −1.71 0.30 0.41 0.35 −1.73 0.30
Sillim 3 birdge0.83 0.23 0.18 0.21 0.82 0.25 0.08 0.21
Gwank Dorim bridge0.94 0.14 0.86 0.13 0.82 0.21 0.69 0.15
Guro Digital Complex station 0.93 0.40 0.48 0.35 0.85 0.46 0.31 0.38
StationsForecast 40 minForecast 50 min
Seoul University0.34 0.35 −1.82 0.31 0.36 0.36 −1.91 0.32
Sillim 3 birdge0.80 0.25 0.03 0.22 0.62 0.27 −0.14 0.23
Gwank Dorim bridge0.81 0.21 0.69 0.15 0.67 0.27 0.50 0.17
Guro Digital Complex station 0.83 0.46 0.30 0.38 0.71 0.52 0.10 0.41
StationsForecast 60 minForecast 70 min
Seoul University0.36 0.35 −1.89 0.31 0.37 0.35 −1.80 0.31
Sillim 3 birdge0.61 0.27 −0.15 0.22 0.68 0.27 −0.09 0.22
Gwank Dorim bridge0.56 0.30 0.38 0.18 0.57 0.29 0.41 0.18
Guro Digital Complex station 0.60 0.56 −0.04 0.42 0.55 0.57 −0.06 0.41
Table 6. Comparison of flood warning time in SWMM, LSTM, and River Emergency Evacuation Notification System (REENS).
Flood WarningRiverside CautionRiverside Vacuation
Observation7:107:20
REENS7:107:10
LSTM (30 min lead time)6:50 (7:20)6:50 (7:20)
LSTM (60 min lead time)6:20 (7:20)6:20 (7:20)
LSTM (90 min lead time)5:40 (7:10)5:50 (7:20)
SWMM (20 min lead time)7:00 (7:20)7:00 (7:20)
SWMM (30 min lead time)7:00 (7:30)7:00 (7:30)
SWMM (40 min lead time)6:50 (7:30)6:50 (7:30)
( ) = Warning time by forecasting analysis.

