Article

Benzo[a]pyrene in the Ambient Air in the Czech Republic: Emission Sources, Current and Long-Term Monitoring Analysis and Human Exposure

1
Czech Hydrometeorological Institute, Ambient Air Quality Department, Na Šabatce 17, 143 06 Praha, Czech Republic
2
Helmholtz-Zentrum Geesthacht (HZG), Institute of Coastal Research, Max-Planck-Str. 1, D-21502 Geesthacht, Germany
*
Author to whom correspondence should be addressed.
Atmosphere 2020, 11(9), 955; https://doi.org/10.3390/atmos11090955
Submission received: 3 July 2020 / Revised: 10 August 2020 / Accepted: 28 August 2020 / Published: 7 September 2020
(This article belongs to the Special Issue Ambient Air Quality in the Czech Republic)

Abstract

:
This paper provides a detailed, thorough analysis of air pollution by benzo[a]pyrene (BaP) in the Czech Republic. The Czech residential sector is responsible for more than 98.8% of BaP, based on the national emission inventory. According to the data from 48 sites of the National Air Quality Monitoring Network, the range of annual average concentration of BaP ranges from 0.4 ng·m−3 at a rural regional station to 7.7 ng·m−3 at an industrial station. Additionally, short-term campaign measurements in small settlements have recorded high values of daily benzo[a]pyrene concentrations (0.1–13.6 ng·m−3) in winter months linked to local heating of household heating. The transboundary contribution to the annual average concentrations of BaP was estimated by the CAMx model to range from 46% to 70% over most of the country. However, the contribution of Czech sources can exceed 80% in residential heating hot spots. It is likely that the transboundary contribution to BaP concentrations was overestimated by a factor of 1.5 due to limitations of the modeling approach used. During the period of 2012–2018, 35–58% of the urban population in the Czech Republic were exposed to BaP concentrations above target. A significant decreasing trend, estimated by the Mann-Kendall test, was found for annual and winter BaP concentrations between 2008 and 2018.

1. Introduction

Polycyclic aromatic hydrocarbons (PAHs) are ubiquitously distributed in the environment [1]. They are common by-products of combustion processes of fossil fuels and wood. PAHs represent a group of substances, many of which have toxic teratogenic, mutagenic or carcinogenic properties [2,3]. They affect fetal growth. Prenatal exposure to PAHs is related to markedly lower birth weight [2] and probably also has negative effects on the cognitive development of young children [4]. Due to their physical and chemical properties, all these substances can be transported over long distances and deposited in remote areas [5,6,7]. PAHs can bioaccumulate, enter the food chain [1] and be toxic to the environment.
Benzo(a)pyrene, occurring in the atmosphere primarily bound to particulate matter, has been set as a suitable marker of ambient air pollution caused by PAHs. A European directive has set a target value of 1 ng·m−3 for the total content of BaP in the PM10 fraction, averaged over a calendar year [8], with the aim of avoiding, preventing or reducing harmful effects on human health and/or the environment as a whole. The WHO has not drafted a guideline for BaP, which is a potent carcinogen. The reference level of 0.12 ng·m−3 was estimated assuming the WHO unit risk for lung cancer for PAH mixtures and an acceptable risk of additional lifetime cancer of approximately 1 × 10⁻⁵ [9,10].
Residential combustion as an important source of PAHs and other air pollutants are responsible for the majority of anthropogenic emissions of BaP in Europe. Such emissions are linked to adverse health effects, especially in urban and suburban areas where emissions and population densities are higher [11]. A modeling study of Europe [11] stated that it is necessary to assess concentrations of BaP in Europe, as an indicator for PAHs, and quantify their health-related effects. The European Environmental Agency estimates that in 2017, 17% of the EU−28 urban population was exposed to above-target annual mean BaP concentrations; this is the lowest value since 2008. As in previous years, values above 1 ng·m−3 are predominantly found in Central and Eastern Europe. The highest concentrations were recorded mainly at stations in Poland and the Czech Republic [12].
Air pollution by BaP is one of the main problems associated with ensuring air quality in the Czech Republic. BaP concentrations exhibit significant intra-annual variation with maxima in winter that are related to emissions from seasonal anthropogenic sources (local heating units) and generally worsened dispersion conditions.
The aim of this study is to assess the current levels and long-term trends of air pollution by benzo(a)pyrene in the Czech Republic, together with their causes. A transboundary contribution to the annual mean concentrations of BaP is also quantified via a modeling-based approach.

2. Materials and Methods

2.1. Area Description

The Czech Republic is located in Central Europe. The topography of the Czech Republic consists predominantly of hills and highlands. More than two thirds of the territory is located below 500 m altitude, with the large majority of the rest between 500 m and 1000 m and only 1% above 1000 m.
The climate in the Czech Republic is mild; it could be classified as somewhere between continental and maritime. It has 4 seasons. Local variations of weather and climate are influenced by ruggedness and altitude. The average annual air temperature in the Czech Republic usually varies from 5.5 to 9.5 °C. The coldest months of the year are December, January and February. The hottest are July and August. Usually, precipitation in the Czech Republic is at a maximum in July and a minimum in February. Currently, about 60% of the population lives in cities with more than 5000 inhabitants [13,14].

2.2. Sampling and Analytical Methods

In the Czech Republic, concentrations of BaP in the PM10 fraction as measured at manual monitoring stations form the basis for the evaluation of air quality. The monitoring stations are placed mainly in cities and in areas with known high BaP concentrations (Figure 1). In 2018, BaP concentrations were measured at 48 monitoring sites (Table A1). The majority of stations are located in cities, with 28 urban and suburban stations. Transport and industrial contributions to BaP are monitored at six traffic and nine industrial stations. Background levels of BaP concentrations are monitored at 5 rural monitoring stations.
PM10 samples are taken by low or high volume samplers on a quartz filter. The samples are processed in certified chemical laboratories and analyzed by high pressure liquid chromatography (HPCL) or gas chromatography with mass detection (GC/MS). The measured concentrations of BaP are daily averaged value and are collected with a minimum three-day frequency. The concentrations measured at the pollution monitoring stations are stored in the Czech national Air Quality Information System (AQIS) database. The lower detection limit is 0.04 ng·m−3 for GC/MS and 0.10 ng·m−3 for HPLC. The measurement uncertainty of BaP is up to 25%.
Short-term monitoring of BaP concentrations in small settlements has been made in campaigns within the Czech national project TITSMZP704—Measurement and Analysis of Air Pollution with Emphasis on the Evaluation of the Share of Individual Groups of Sources. These are case studies that monitor the variability of short-term BaP concentrations during the heating season under the specific conditions of particular small settlements. As this is an ongoing project finishing in 2021, here we will present only a sample of data from 3 small settlements (Figure 1)—Bochovice, Černíny and Hřivice—to show the level of BaP concentrations in villages where they are not regularly monitored and where solid fuel heating is predominant. Bochovice is a small village with 143 inhabitants with 58 houses, which are heated by solid fuels. In Černíny there are 370 permanent residents and 140 houses out of 167 are heated by coal or wood. Hřivice is a village with 631 inhabitants, with 251 houses heated by coal or wood. We also present the Kladno-Švermov locality as an example of an area surrounding a current monitoring station measuring very high levels of air pollution caused by local heating. Kladno-Švermov is a district to the north of Kladno city situated in a shallow valley, where almost 5000 people live. It has a high building density with both central and local heating.

2.3. Emission Calculation

BaP is mainly a product of incomplete combustion of organic substances at temperatures between 300 and 600 °C. Unsurprisingly, the main contribution to total BaP emission in the Czech Republic is from combustion of solid fuels in low-capacity boilers. This is mainly household fuel combustion for heating, cooking and water heating (residential sector).
BaP emissions from the residential sector are calculated on the basis of emission factors for various combinations of fuel type and installed combustion plant (see Table A2, Table A3, Table A4 and Table A5 in Appendix B). The combinations used are set from the annually updated distribution of solid fuel and type of heating equipment (Table A5 in Appendix B), resulting in country specific emission factors which reflect the particular circumstances for a given year. For the purpose of national emission inventory, the total fuel consumption in households is determined by the Czech statistical office [13]. The emissions in this model are calculated as a sum for the whole country and comprise local heating, cooking and water heating. This national model uses emission factors at nominal heat output.
For territorial distribution of residential heating emissions, a bottom-up up approach is used. The emissions are calculated for each basic territorial unit—municipalities and city districts—and comprise only the local heating from permanently occupied households. The fuel consumption at a basic territorial unit is calculated based on the average annual heating amount and specific fuel type consumption per average housing type. The base data are obtained from the 2011 Population Census (number of households, their type of heating and average floor area) and the results of the ENERGO 2015 statistical survey (share of given fuel burned in a particular installation type, share of insulated/noninsulated flats). The year-by-year changes in fuel consumption are mostly influenced by the characteristics of the heating period, which is expressed as the number of heating degree days (the sum of the differences between the reference indoor temperature and the average daily outdoor temperature on heating days). Other regional annually updated parameters are the number of households and their type of heating. Solid fuel parameters and the share of solid fuel consumption according to the installation type of the combustion plant are annually updated at a national level, based on the statistics of boiler sales ascertained by the Ministry of Industry and Trade and data from the subsidy program for the boiler replacements. Solid fuel parameters are updated according to the results of the survey on supplies and quality of solid fuels in the Czech Republic carried out by the TEKO company [15]. The regional calculation model uses a 15/85 boiler operating mode, i.e., 15% of time at nominal heat output and 85% at lower heat output. This assumption is in accordance with the Ecodesign Directive 2009/125/EC. Calculation model for the territorial distribution of emissions is more sensitive to climatic conditions in a given year than model for the national emission inventory. The highest emission difference between these two models is in 2014 and 2018, when the heating period was mild and short (see Table A6 in Appendix B).
Emission factors of solid fuels for local heating were obtained from measurement results of the most common fuel and boiler type combinations used for household heating in the Czech Republic. These measurements were carried out at the Energy Research Center of VSB-TUO [16] during the years 2008–2016. Emission factors for liquid and gas fuel were taken from the Emission inventory guidebook [17].
The transport sector comprises emissions from road transport, railways, air and water transport, off-road transport used in agriculture, forestry, building construction and area transport within large industrial enterprises. Emissions are calculated at the Transport Research Center [18] in an up-to-date version of the COPERT program [19] based on nationwide fuel consumption.
BaP emissions from combustion in nonresidential stationary sources such as power and heat generation, combustion processes in industry and manufacturing, institutions and services and waste incineration are calculated from activity data and given emission factors; national emission factors are estimated for a particular sector or taken from the Guidebook [17]. Emissions from industrial sources are either reported by the operator or calculated from activity data and emission factors.

2.4. Spatial Mapping and Population Exposure

The methodology used for the creation of the BaP concentration maps is a linear regression model followed by an interpolation of its residuals; rural and urban areas are mapped separately and then merged by population density [20]. The methodology is referred to as the Regression—Interpolation—Merging Mapping (RIMM) method and is used for air quality mapping in the Czech Republic and elsewhere in Europe as well [11,21,22]. The estimate of concentrations is calculated using the relationship:
Z ^ s 0 = c + a 1 · X 1 s 0 + a 2 · X 2 s 0 + + a p · X p s 0 + R ^ s 0 ,
where Z ^ is the estimated concentration value at point s 0 , Xi are the various supplementary data, c and ai are the parameters of the linear regression model and R ^ is the spatial interpolation of the residuals of the linear regression model at point s 0 , calculated on the basis of the residuals at the points of measurement.
The primary data for creating air pollution maps of BaP are concentrations measured at individual monitoring stations. Since there are only a limited number of monitoring stations and their spatial representativeness is variable, various supplementary (secondary) data are also used. These secondary data both provide comprehensive information about the entire territory and also exhibit regression dependence on the measured data. The main secondary sources of information are outputs of dispersion models, which combine data from emission inventories and meteorological data. In the Czech Republic, the secondary data mainly used are annual mean concentrations provided by EMEP/MSC-E [23] together with annual mean concentrations from the Czech Gaussian model SYMOS. Other supplementary data can be provided by maps of annual mean PM10 and PM2.5 concentrations.
The kriging and Inverse Distance Weighting (IDW) techniques are used as interpolation methods [24]. Interpolation of residuals using IDW is calculated using the relationship:
R ^ s 0 = i = 1 N R s i d 0 i β i = 1 N 1 d 0 i β ,
where R ^ is the estimate of the field of residuals at point s0, R(si) is the residual of the linear regression model at the measuring site si, N is the number of surrounding stations used in the interpolation, d0i is the distance between points s0 and si, and β is the weight.
In case of ordinary kriging, the interpolation of the residuals is calculated using the relationship:
R ^ s 0 = i = 1 N λ i · R s i ,   with   i = 1 N λ i = 1 ,
where R(si) is the residual of the linear regression model at the measuring site si and λi are estimated weights based on the theory of spatial statistics [24] derived from a variogram fitted to an empirical variogram 2γν(h) of the field of residuals. The variogram expresses the dependence of the variability between points on the mutual distance between the points and the empirical variogram is calculated as follows:
2 γ ν h = 1 n i , j ; d i j = h ± δ R s i R s j 2 ,
where R are the residuals at measuring points si and sj, dij is the distance between points si and sj,
n is the number of pairs of stations si and sj whose mutual distance is h ± δ, and δ is the tolerance.
The calculated urban and rural map layers are subsequently merged by a layer of population density α:
Z ^ s 0 = Z ^ r s 0 , f o r   α s 0 α 1 α 2 α s 0 α 2 α 1 Z ^ r s 0 + α s 0 α 1 α 2 α 1 Z ^ u s 0 , f o r   α 1 < α s 0 < α 2 Z ^ u s 0 , f o r   α s 0 α 2 ,
where Z ^ is the final estimate of the concentration at point s0, r, Ẑu is the concentration for the rural or urban map layer, and α1, α2 are the classification intervals corresponding to the population density. For the BaP concentration maps α1 was set to 200 inhabitants per km2 and α2 was set to 1000 inhabitants per km2.
The entire concept of separate mapping of rural and urban pollution is based on the assumption that r(s0) ≤ u(s0) for BaP. For areas where this assumption is not fulfilled, a third layer created in a similar fashion to the urban and rural layers is used; this third layer is created using all the background stations without distinguishing between urban and rural stations.
The maps are constructed with a spatial resolution of 1 × 1 km2. The uncertainty of the map was assessed using the cross-validation method: concentration at the location of a measuring site is always estimated from other station data only, thus providing an objective estimate of the map quality away from measurement site locations. In this article, the uncertainty of the maps is expressed by the relative root-mean-square error (RRMSE):
RRMSE = 1 N i = 1 N Z ^ s i Z s i 2 R M S E 1 N i = 1 N Z s i · 100 ,  
where Z is the measured value of the concentration at point si, Z ^ is its estimate using cross-validation and N is the number of measuring stations. The spatial distribution of the uncertainty was not estimated. It should be noted that the cross-validation is applied only during the interpolation of residuals; parameters of linear regression are always estimated using all the stations. Therefore, the overall uncertainty of the maps is somewhat underestimated. The uncertainties (RRMSE) were calculated for each map layer separately and were up to 30% for urban and over 60% for rural areas. The higher uncertainty of rural areas is due to lack of measurements at rural regional stations and the absence of more extensive measurements in smaller settlements in the Czech Republic.
The annual mean BaP concentration maps 2012–2018 were prepared at CHMI during the annual air quality assessments. Estimation of population exposure to above-target BaP concentrations were calculated based on maps of BaP and population density data with resolution 1 × 1 km [13].

2.5. Trend Analysis

Trends of annual average BaP concentrations were analyzed at six selected monitoring stations in the Czech Republic (Figure 1). Five stations were classified as urban or suburban, the remaining station was classified as a rural regional station. Station selection was based on their classification and the quantity of data availability for trend analysis. We focus on data from urban and suburban monitoring sites since one of the aims of this study is to assess human exposure to BaP concentrations. For a comprehensive overview, the data from the Košetice rural regional site are also presented.
Trends for annual, winter (October–March) and summer (April–September) average concentrations are analyzed. The authors annually prepare average monthly concentrations of BaP for the “Air Pollution in the Czech Republic” yearbooks [22] (the newest report) and have partitioned this data into winter and summer periods. From April to September, average monthly BaP concentrations are usually below or just above the target value while for the rest of the year they very often exceed the target value.
Temporal trends, i.e., annual averages of BaP concentrations and emission, were analyzed using the nonparametric Mann-Kendall trend test with a level of significance of 0.05 [25,26]. This test is among the most widely used statistical methods for this kind of data [27,28,29,30,31] and is particularly useful since it tolerates missing values and the data need not conform to any particular distribution. Moreover, as only relative rather than absolute magnitudes of the data are used, this test is less sensitive towards incomplete data capture and special meteorological conditions leading to extreme values [32] that often affect air quality data.
If a linear trend is significant, the slope and severity of the trend is estimated by Sen’s test [32]. For all stations, annual average concentration and emission were analyzed for the same 2008−2018 time period. There were no missing averaged annual data.
We used R-Studio software for statistical analyses [33]. The maps were created using the geographic information system ArcGIS by ESRI [34].

2.6. Source Apportionment

During the update of the National air quality plans (NAQP) in 2018, a transboundary contribution to annual mean concentrations of BaP in 2015 had to be quantified. It is known that polycyclic aromatic hydrocarbons including BaP undergo gas-particle partitioning and degradation in the atmosphere, but these processes are not fully understood and other processes, e.g., secondary organic aerosol coating can protect PAHs from ozone degradation during long range transport [35]. Due to the limited time for the update of NAQP and unavailability of ready-to-use models for PAHs long-range transport, a chemical transport model CAMx v5.41 [36] was adopted to account for BaP as a passive tracer. The limitations of this approach are discussed further in the text.
The CAMx model was run in two nested domains d01 and d02 with 14.1-km and 4.7-km resolution respectively (Figure 2). The transboundary contribution was estimated with a brute-force method. Sources outside the Czech Republic were set to zero. The spatial distribution of concentrations originating from Czech sources within the 4.7-km CAMx grid was determined by the Gaussian model SYMOS [37] at 0.5-km resolution:
C C Z _ s c a l e d i = C C Z · S i j = 1 n S j / n ,
where CCZ is the contribution of Czech sources calculated by the CAMx model in a 4.7-km grid, S(i) is total contribution of Czech sources in subgrid point i calculated by the SYMOS model and n is number of subgrid points. Next, a relative contribution of sector C of Czech sources was determined:
P C i = S c i S i · C C Z _ s c a l e d i C n o n C Z + C C Z _ s c a l e d i · 100 ,
where CnonCZ is the contribution of sources outside of the Czech Republic calculated by the CAMx model in a 4.7-km grid, and Sc(i) is the contribution of the Czech sources (sector C only) in subgrid point i calculated by the SYMOS model.
Meteorological inputs with a 1-h time step were derived from the assimilation cycle of the numerical weather prediction model ALADIN/CE version ALARO [38] operated at the CHMI at 4.7-km resolution and with 87 vertical levels. In the assimilation cycle, the analysis at 0, 6, 12 and 18 UTC was followed by a 6-h forecast. Analysis of upper-air parameters combines the driving model ARPEGE with mesoscale structures of the ALADIN model through DFI blending complemented by 3DVAR assimilation of observations [39]. Analysis of surface temperature and relative humidity is based on optimal interpolation and serves as an input to the Interaction Soil Biosphere Atmosphere (ISBA) scheme describing exchanges between the atmosphere and the land surface [40]. The 68 lowest ALADIN levels were aggregated into 26 CAMx levels, with the top of the lowest level at approximately 50 m and the highest level at approx. 10 km above ground.
High-resolution BaP emissions for the Czech Republic were taken from the calculation model for territorial distribution. For the Polish Silesian and Lesser Poland Vovoidships, BaP emissions were estimated by the ATMOTERM company within the LIFE-IP MAŁOPOLSKA project (LIFE14 IPE/PL/000021). For Slovakia, emissions from the SNAP 2 sector were taken from the national emission inventory. For other sectors in Slovakia and the rest of the modeling domain, a top-down emission inventory based on the TNO emission inventory [41] was used: emissions for the year 2015 were estimated by linear interpolation and then distributed to ten sectors following the SNAP nomenclature. Industrial emissions were allocated to sources registered in the European point source emission register E-PRTR [42] and remaining industrial emissions as well as emissions from area sources were distributed using the “industrial area” land cover class from the Corine Land Classification (CLC) database [43]. For the spatial distribution of residential heating, a combination of population density and urban area was used, assuming different fuel mixes in metropolitan and rural areas. Typically, rural areas exhibit a larger per capita emission of BaP due to the increased usage of coal and wood. A map of annual emissions used is shown in Figure 2.
The time distribution of the residential heating emissions in the Czech Republic and Silesian and Lesser Poland Vovoidships was based on temperature profiles, otherwise factors for month, day of the week and hour of the day were used [44,45]. For the vertical distribution of point source emissions from top-down inventory, typical point source parameters based on the analysis of the data from the Czech database were used for each SNAP category.

3. Results

3.1. Emissions of Benzo(a)pyrene

In 2018, the residential sector accounted for more than 98.8% of total Czech BaP emissions (15.56 t out of total 15.74 t). The remaining percentage was produced mainly by the transport sector (0.78%, 122 kg), especially passenger cars (0.48%, 76 kg). The industrial share of total BaP emissions was 0.27% (43 kg) and the share of institutions and services 0.10% (16 kg). The emissions from industrial sources are year-round, in contrast with local heating, especially in the Moravian-Silesian region. There is also a higher proportion of coal combustion in households in this region, which is reflected in a higher BaP emission load. The contributions from the different sources of BaP emissions have not changed significantly in the last 10 years. Almost 58% of BaP emissions from the residential sector are produced by combustion of fuel wood, and the consumption of wood is still increasing (Table A2 in Appendix B). In contrast, coal consumption is decreasing in recent years, which is reflected in its decreasing share of emissions (Figure 3). In 2018, approximately 15% of households were using solid fuels for local heating, and these households are responsible for more than 98% of total BaP emissions in the Czech Republic.
Figure 4 presents BaP emissions from combustion of solid fuel in the residential sector in 2018 sorted by combustion installation and fuel type. More than 50% of total BaP emissions from the residential sector are estimated to be from fuel combustion in over-fire boilers and about 30% from fuel combustion in fireplaces and stoves.

3.2. Ambient Air Concentrations of BaP and Population Exposure

The map of annual average concentration of BaP in 2018 is shown in Figure 5. Areas where BaP concentrations were higher than the target value of 1 ng·m−3 (above-target) are indicated in red or brown in the figure. The thresholds correspond to the upper and lower assessment thresholds of 0.6 ng m−3 and 0.4 ng m−3, the target value of 1.0 ng m−3 set by EU legislation [8], and to 2.0 ng m−3 to distinguish the most polluted areas in the Czech Republic. High values of BaP concentrations were estimated in the North East of the Czech Republic, referred to as the Ostrava region. Other contaminated areas include the Kladno district (West of Prague), areas of Prague and a number of smaller towns. Areas with above-target concentrations comprised 12.6% of the Czech territory in 2018. The lowest annual average concentrations of BaP were estimated to be in locations distant from emission sources and therefore free from direct exposure (i.e., natural mountain areas). The range of measured concentration of BaP in 2018 was from 0.4 ng·m−3 at the Košetice rural station to 7.7 ng·m−3 at the Ostrava-Radvanice industrial station.
Further annual mean BaP concentration maps from 2012 to 2017, which were used in the population exposure estimation, are listed in Appendix C. Based on comparison of population numbers living in areas with the different BaP concentrations, it can be stated that there is no marked trend in the period between 2012 and 2018 (Figure 6). The average value of the percentage of the population living in the above-target areas was 49.6% during the years 2012 to 2018. The lowest number of inhabitants living in the above-target areas was estimated in 2018 (35.5%). The highest number of inhabitants (57.9%) exposed to above-target concentrations of BaP was estimated for the years 2012 and 2017. Thirty-three percent of inhabitants on average in 2012 to 2018 lived in places with concentrations of 0.7–1.0 ng·m−3. On average, between 2012 and 2018, 7.4% of the population lived in areas with BaP concentration lower than 0.4 ng·m−3, with values ranging from 3.5% in 2013 to 11% in 2014.
Figure 7 shows selected measured daily concentrations of BaP in the winter seasons of 2017 and 2018 at three project locations (Bochovice, Černíny and Hřivice) together with the data from the CHMI Kladno-Švermov station. In Kladno-Švermov, Bochovice, Černíny and Hřivice, the average concentrations of BaP were 8.0 ± 5.7, 2.1 ± 2.1 ng·m−3, 2.2 ± 2.0 ng·m−3 and 5.4 ± 3.2 ng·m−3 respectively. The highest daily average concentration of BaP over the sampling campaign—24.5 ng·m−3—was observed in the Kladno-Švermov station whereas the lowest daily average concentration of BaP (0.1 ng·m−3) was recorded in Černíny. The limited amount data obtained by these campaign measurements, which were only obtained in winter, does not allow for calculation of annual average concentrations. Nevertheless, in Bochovice and Černíny the target limit value (1 ng·m−3) established by European legislation was exceeded on 59% and 54% of measurement days, respectively. In contrast, the average daily BaP concentrations monitored in Hřivice and Kladno-Švermov were below the target limit in only one case.

3.3. BaP Concentration and Emission Trends

Table 1 presents the BaP annual average concentrations during the study period 2008−2018. Annual average concentrations from 2008 to 2018 were analyzed at six selected sites (five urban and suburban stations, one rural regional station). The highest annual average value from all stations, which was 2.1 ng·m−3, was from 2008, with a range between 0.4 and 6 ng·m−3. When including only the five urban and suburban stations, the highest annual average value of 2.5 ng·m−3, with the same range, was also seen in 2008. The years with the lowest average BaP concentration of 1.6 ng·m−3 were 2014−2018; the widest range was between 0.4 and 3.9 ng·m−3 in 2015. When including only urban and suburban stations, the lowest annual average value of 1.8 ng·m−3 was detected in 2016, 2017 and 2018; the widest range was between 0.7 and 3.7 ng·m−3 in 2017. The average and median value for all stations for the entire study period are 1.8 ng·m−3 and 1.2 ng·m−3 respectively. The average and median value for urban and suburban stations is 2 ng·m−3 and 1.4 ng·m−3, respectively.
In contrast, the highest annual average value of 0.7 ng·m−3 at the Košetice rural regional site, representing the wider area without the local emission, was measured in 2013. The lowest annual average value and the median of 0.4 ng·m−3 was recorded for six years (2008, 2011, 2014−2016, 2018). The median value for the Košetice site is 0.5 ng·m−3.
With respect to the main emission source of BaP (Figure 3), i.e., local heating causing higher levels of BaP in ambient air, we assessed concentration trends specified for the winter (October–March) and summer (April–September) period and for the year as a whole (Figure 8, Figure 9 and Figure 10). More detailed graphs presenting the course of annual, winter and summer concentrations using boxplots at each measuring station can be found in Appendix D, Figure A2.
Around 65% of annual average concentrations from suburban and urban stations during the study period were higher than the target value of 1 ng·m−3 [8]. For the sake of completeness, this figure was around 96% for the winter periods and 7% for the summer period, respectively. Only one rural regional site registered no above-target concentration during the entire study period.
Comparing the annual average values for all stations between 2008 and 2018, there is a decrease of 27% in the BaP annual average concentration and a 24% decrease for winter and 50% decrease for summer average concentrations (Figure 8, Figure 9 and Figure 10). For urban and suburban stations, the situation is very similar with a 28%, 25% and 49% decrease for the annual, winter and summer periods respectively (Figure 8, Figure 9 and Figure 10).
The Mann–Kendall test was used to assess the monotonic trend of BaP at selected monitoring sites (Table 2). Concerning annual averages, significant decreasing trends were detected at two stations (Kladno-Švermov with p value = 0.01 and Sen’s slope of −0.15 ng·m−3·year−1 and Ostrava-Poruba with p value < 0.005 and Sen’s slope of −0.12 ng·m−3·year−1). Concerning winter averages, the significant decreasing trend was detected at the same stations—Kladno-Švermov with p–Value < 0.005 and Sen’s slope of −0.28 ng·m−3·year−1, Ostrava-Poruba with p–Value = 0.03 and Sen’s slope of −0.21 ng·m−3·year−1.
The average annual and average winter concentrations overall for all stations exhibited a significant decreasing trend. The decrease per year in the BaP concentration was equal to 0.05 ng·m−3 for annual averages and 0.09 ng·m−3 for winter averages, respectively. For urban and suburban stations, the annual and average winter concentrations showed a similar significant decrease is similar—0.06 ng·m−3 for annual averages and 0.11 ng·m−3 for winter averages, respectively. No clear trend was found for BaP summer concentrations.
In terms of total BaP emission for the Czech Republic, 2013 was the year with the highest annual mean value, which was 17.5 t. BaP emissions increased by more than 11% between 2009 and 2010. This increase was due to the implementation of new statistical data for hard coal consumption from 2010. In addition, the years 2010 and 2013 were characterized by long and cold heating season compared to other years. After 2013, BaP emissions had a decreasing trend supported by milder winter seasons (especially 2014 and 2018) but also by decreasing coal consumption and especially the replacement of high-emission boilers. Consequently, no significant trend (p–Value = 0.88) was found for BaP emission development (for more details, see Section 3.1). Moreover, no correlation (p–Value = 0.054) was found between emission and the concentrations from the Košetice rural regional site representing background levels in the Czech Republic.

3.4. Source Apportionment

The transboundary contribution to annual average concentration, as estimated by the CAMx model in its 4.7-km resolution grid mode, is 46–70% for most (80%) of the territory of the Czech Republic, with a median value of 57% (Figure 11). The highest transboundary contribution is modeled in the relatively clean Western and Southern parts of the country and in the North-Eastern mountain regions (cf. Figure 5). When subgrid scaling is applied, the contribution of Czech sources can exceed 80% in residential heating hot spots (Figure 12). Three categories of Czech sources with a relative contribution to annual average concentration exceeding 10% were identified: residential heating—the absolutely dominant Czech source on most of the Czech territory; road transport—only in large cities Prague and Brno and in vicinity of major roads; and coke oven plants in the Ostrava agglomeration.
When mapped annual average BaP concentration is multiplied by the relative contribution of transboundary sources, regions in the North-East parts of the Czech Republic are still above 1 ng·m−3, which indicates that the target value cannot be reached without significant reduction of BaP emissions in Poland in hand with measures to mitigate Czech sources.
The reliability of source apportionment results depends of course heavily on the emission inventory and dispersion model used. As stated above, BaP was treated as passive pollutant in CAMx, which can probably lead to overestimation of long range transport due to neglect of its degradation. Nevertheless, emission inventory plays probably the more important role. At the beginning of our modeling effort in 2017, there was only a limited amount of European-scale BaP emission inventory available that could be used in air quality models (authors were aware of [46]; gridded BaP emissions for 2015 were made available by EMEP in December 2017 and marked as unofficial data evaluation purposes only [47]). For this reason we used a top-down inventory based on [41].
Annual average BaP concentration modeled by the CAMx domain d02 was compared with measurements. Annual statistics at station locations were taken from Air Quality e-Reporting [48]. Statistics for the Czech stations were taken from the CHMI’s Air Quality Information System, since there was an error in data provided to the AQ e-Reporting. Since annual statistic in AQ e-Reporting do not include information on station classification, all available data marked as valid and verified were used. As can be seen from Figure A3 and Figure A4 and Table A7 in Appendix E, we get the best agreement with observations for the Czech stations (model/observation 0.3–3.6 with median 1.5). For Poland, values are generally underestimated (model/observation 0.1–1.5 with median 0.4), while for Germany and Austria the model largely overestimates measured values (model/observation 4–17.7 with median 5 for Germany and 1.9–26.1 with median 7.8 for Austria). This results in a clear South-West to North-East gradient in model bias. It seems reasonable to expect that the model bias will lead to overestimation of the transboundary contribution in the Southern part of the Czech Republic and to its underestimation in Northern parts (especially in the Ostrava agglomeration). To confirm this assumption, the transboundary contribution to annual average BaP concentrations was compared with data provided by EMEP/MSC-E [23] (transboundary contribution to annual mean concentration provided via personal communication with A. Gusev). For this purpose, CAMx results were aggregated to the EMEP 50-km grid. From Figure A5 we can see that over approximately one third of the Czech Republic the transboundary contribution estimated by this study and by EMEP does not differ by more than 5% (absolute difference). Compared to the EMEP results, the transboundary contribution in the South-central part of the Czech Republic is 10–20% higher, while in the Ostrava agglomeration it is 5–7% lower. Nevertheless it must be noted that EMEP results are based on EMEP/CEIP gridded emission for 2015 [47], where the total BaP emissions for the Czech Republic were estimated to be 8 t based on the Czech 2017 submission. This number was corrected to 16 t in resubmission in 2019. Therefore, the contribution of Czech sources must be underestimated approximately by a factor of two in EMEP results leading to overestimation of relative transboundary contributions by a factor of 1.1–1.6. From the text above it seems likely that modeling only the dispersion of BaP can lead to an overestimation of the transboundary contribution of BaP in the Czech Republic by factor of 1.5.

4. Discussion

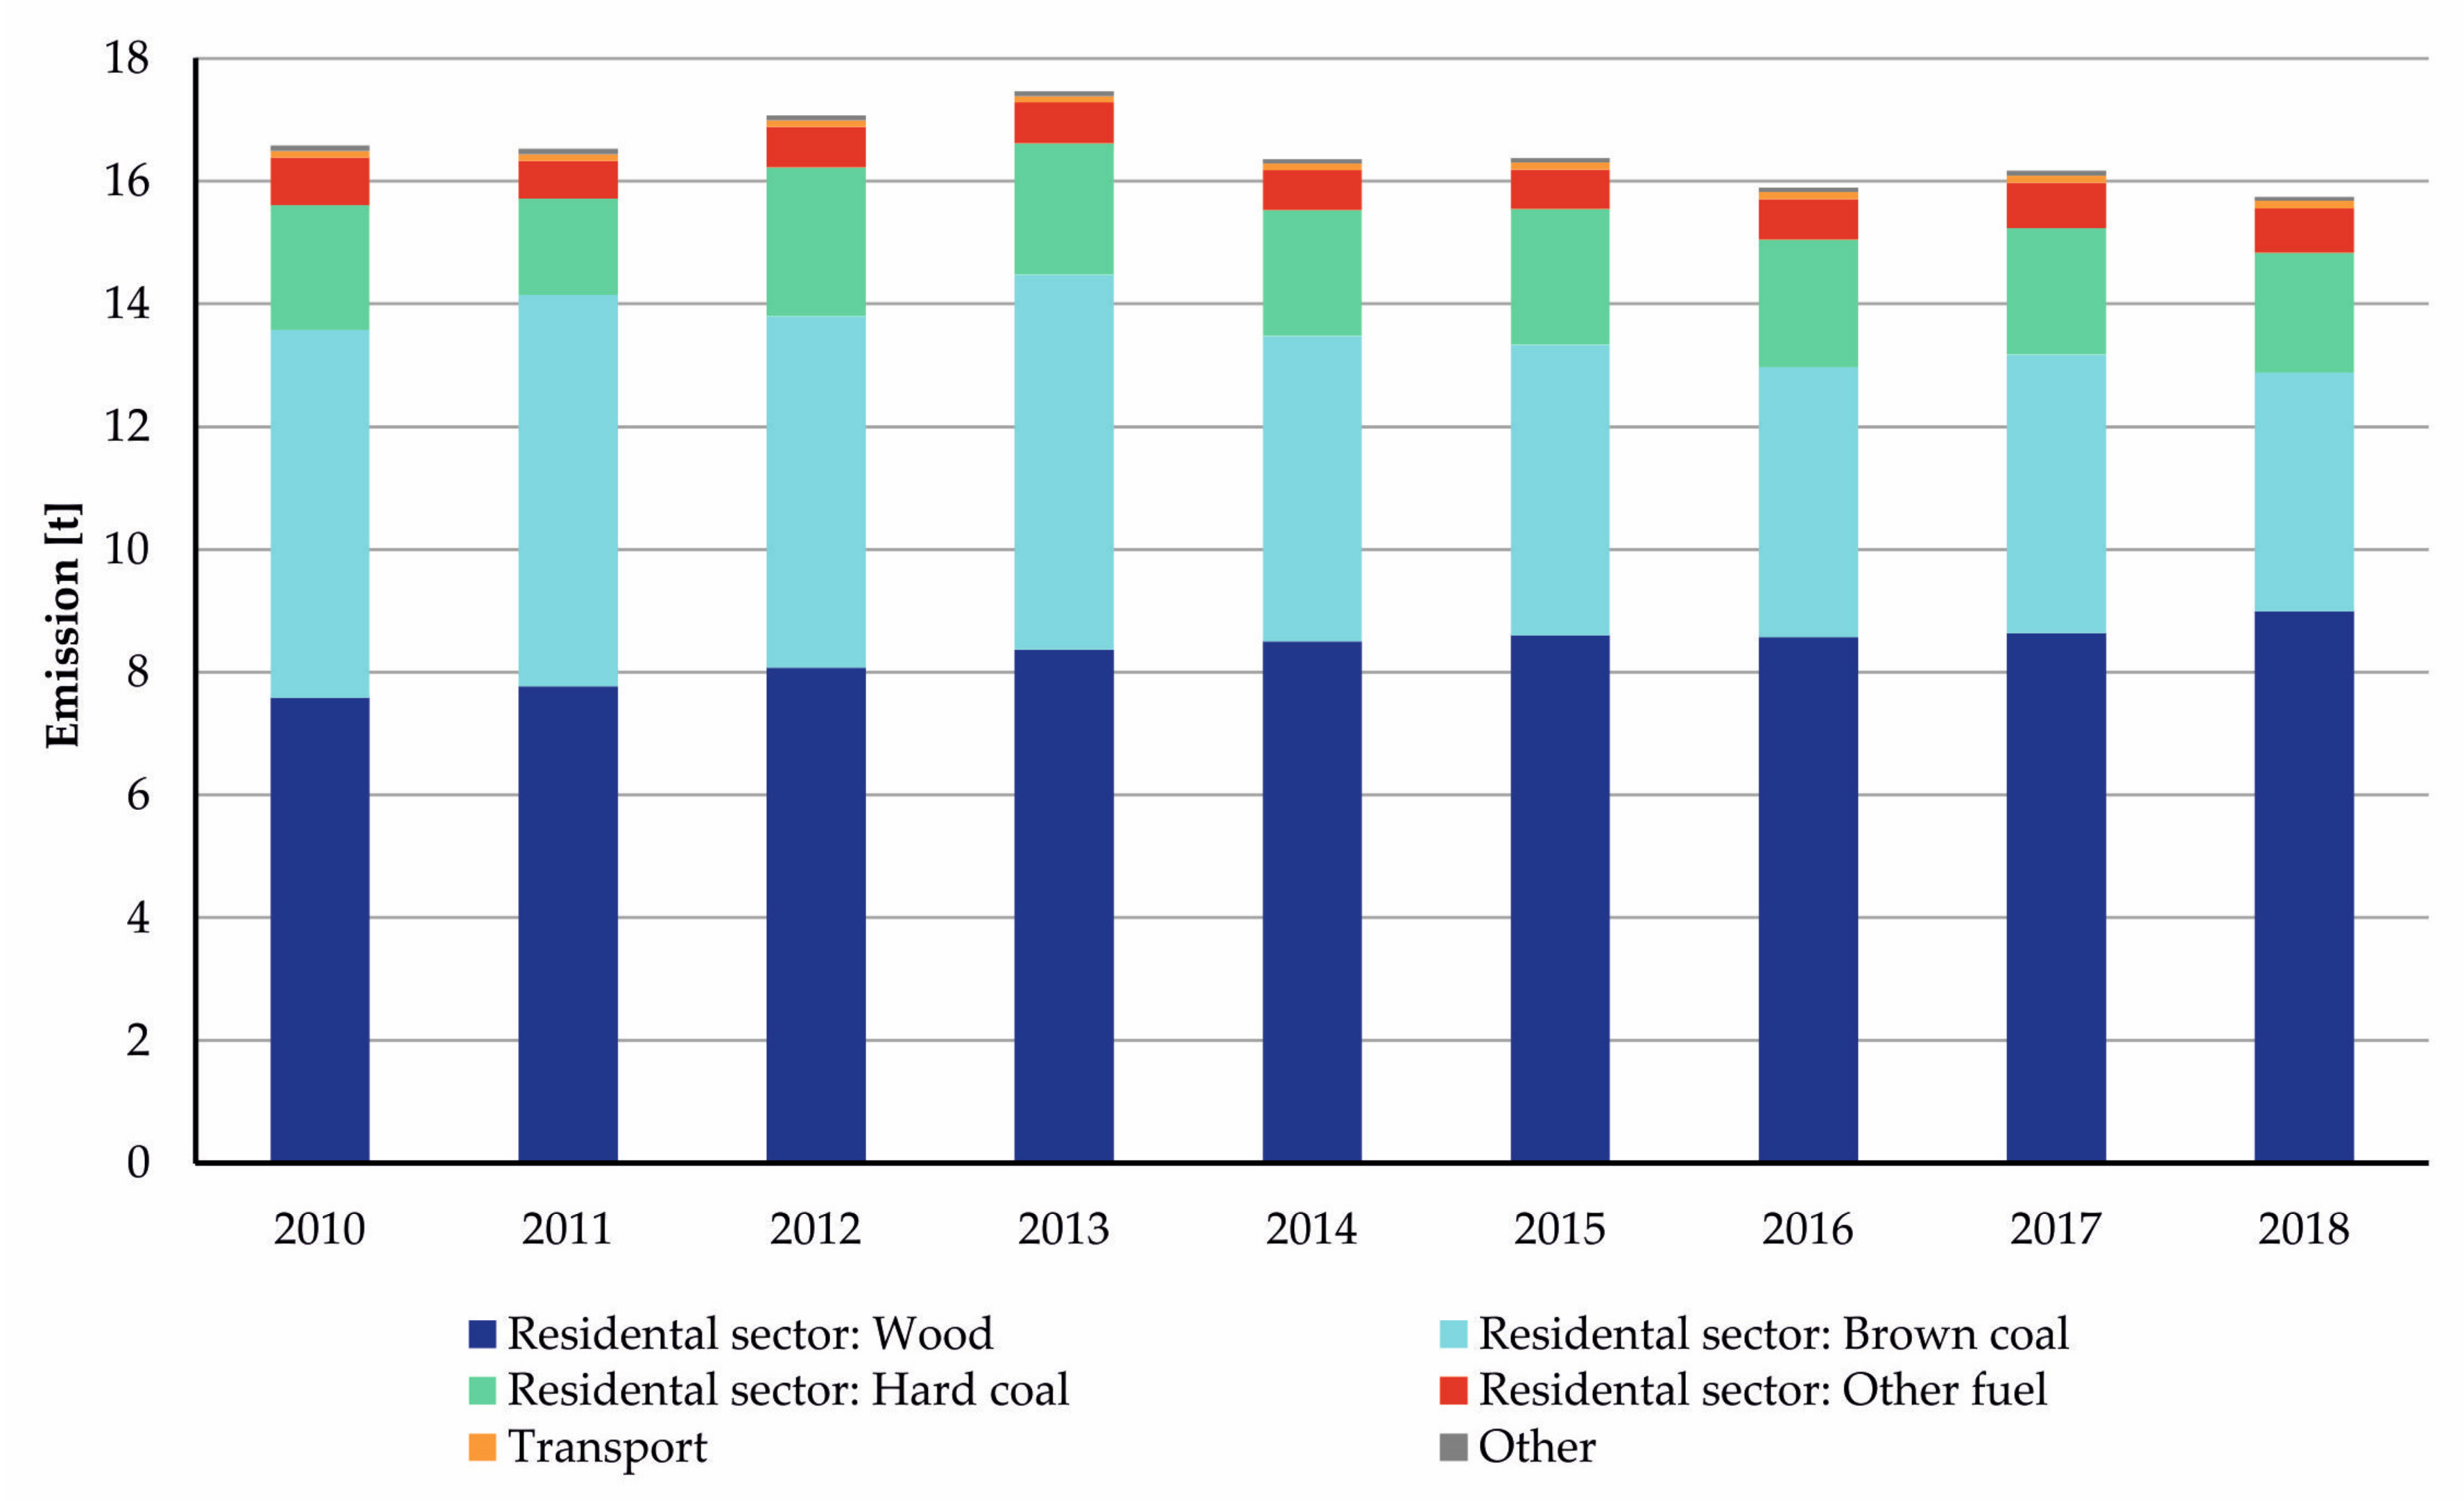
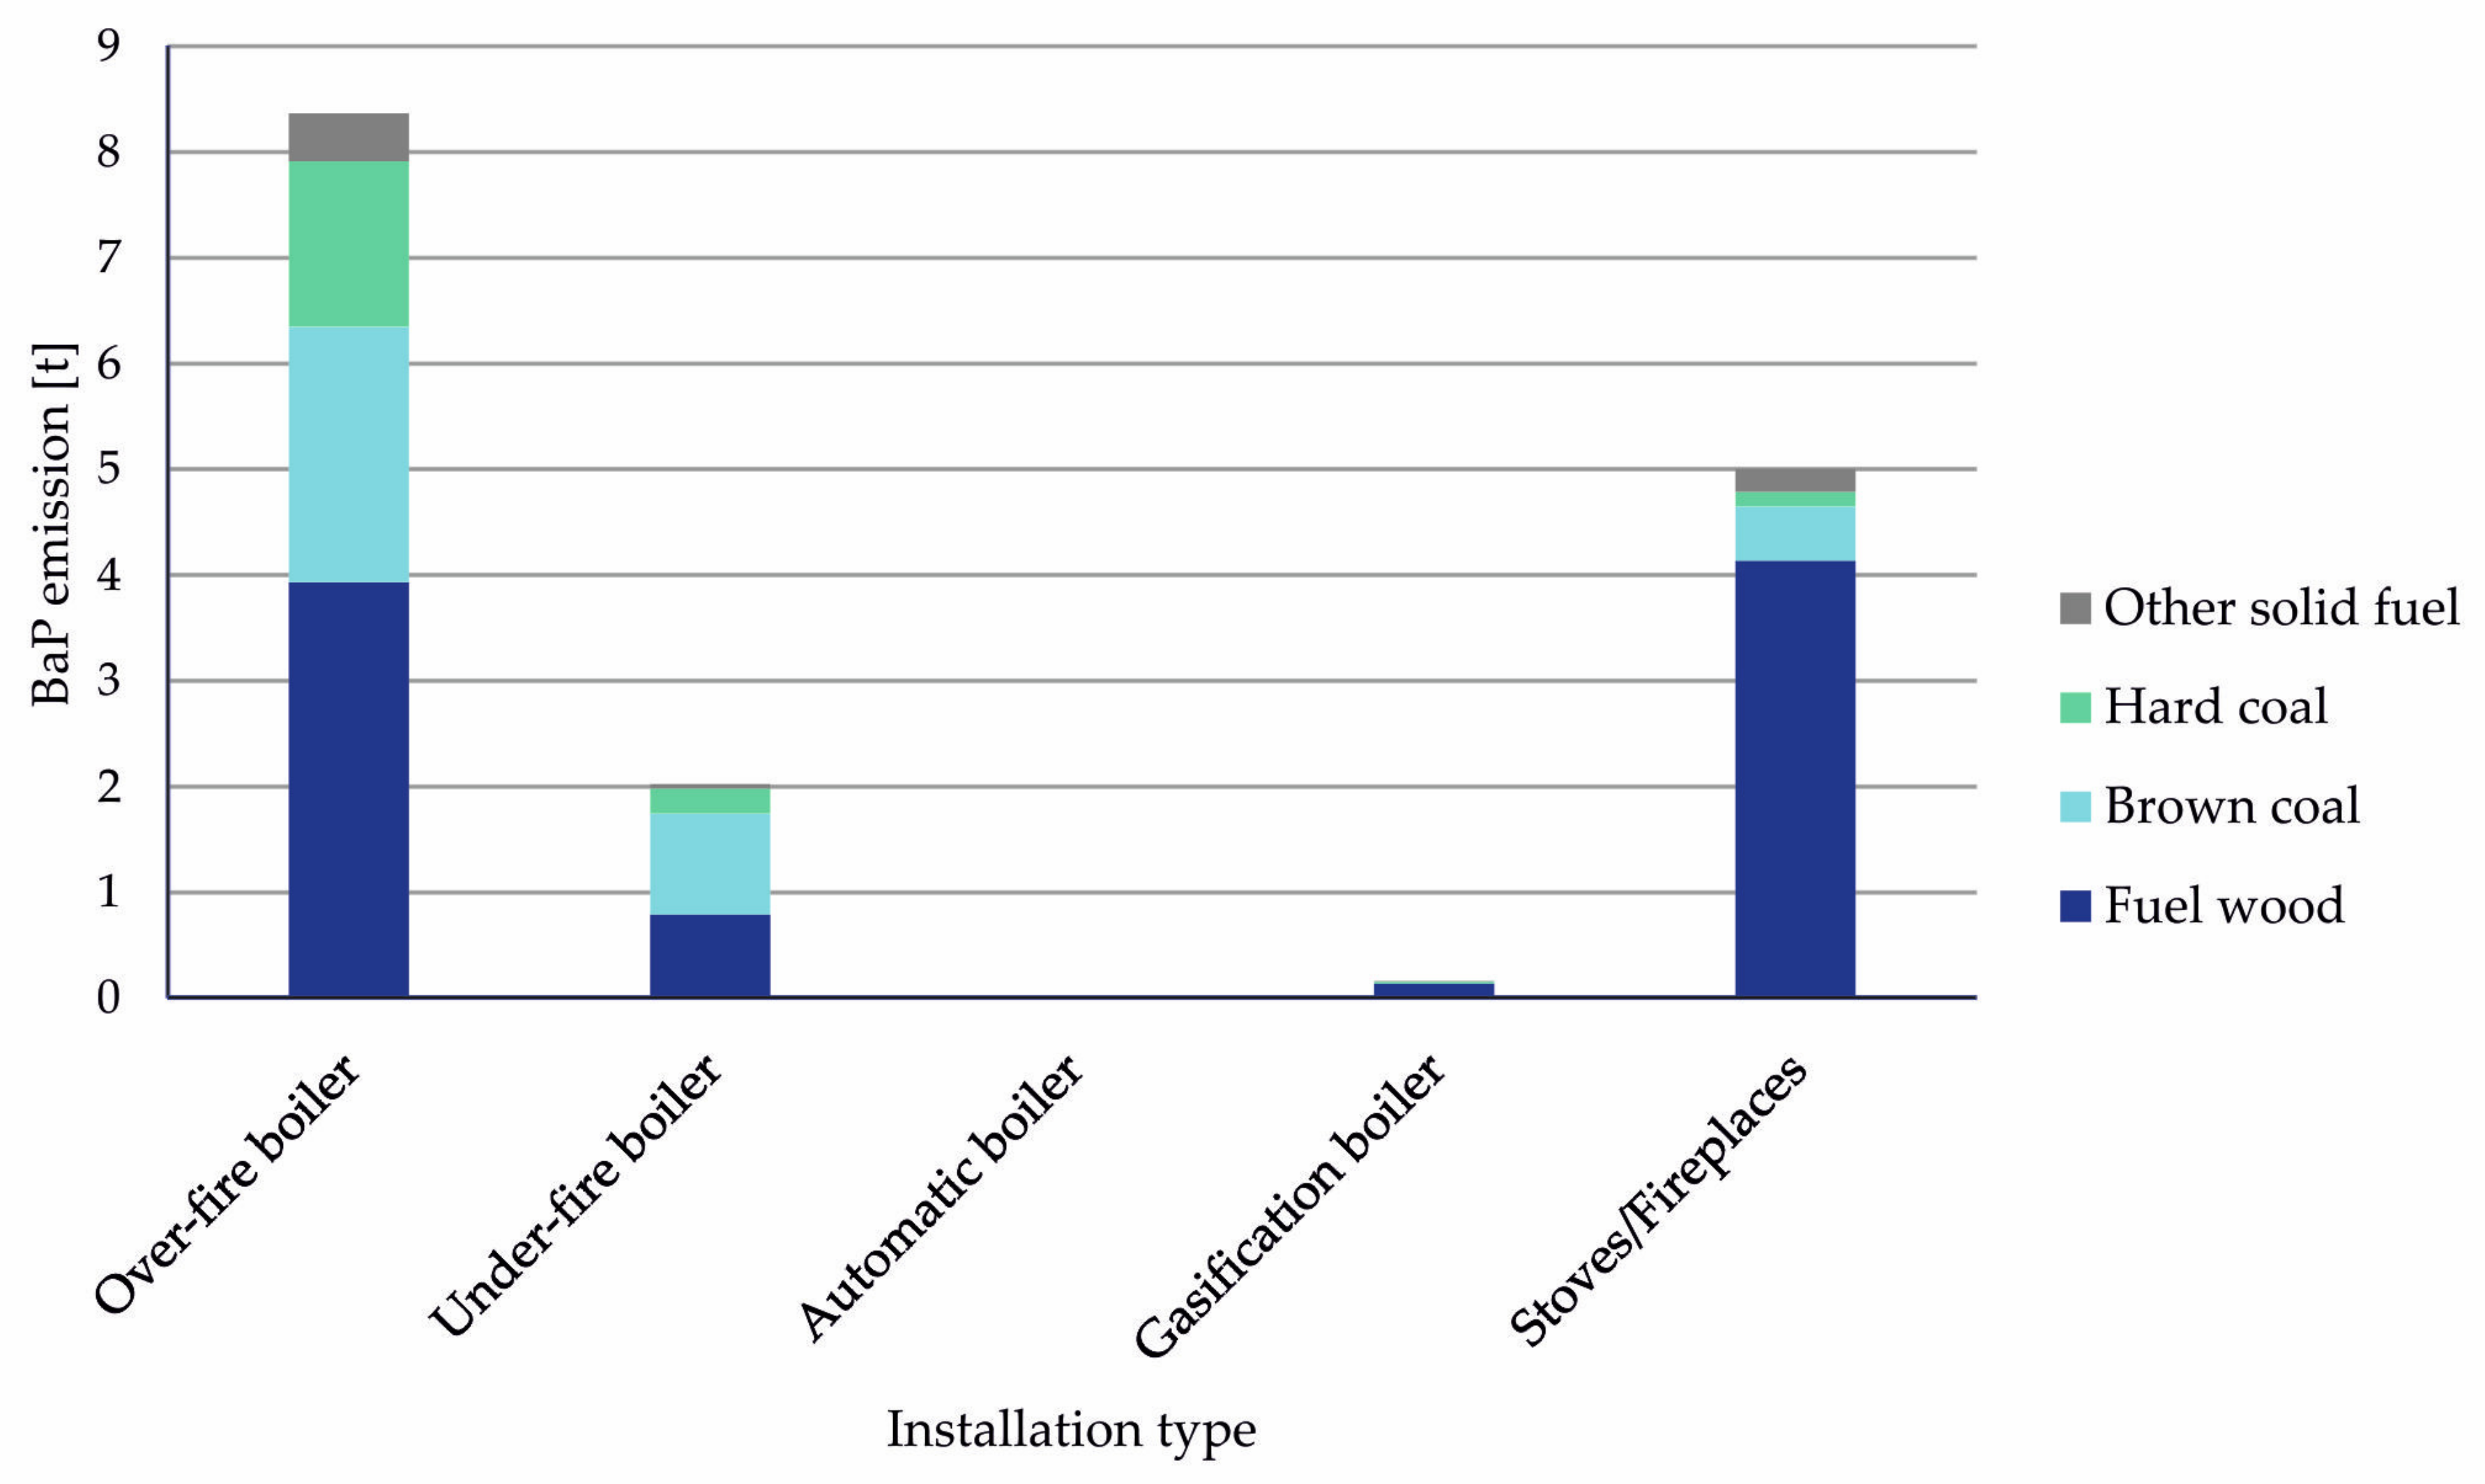
Transport, industry and services combined do not contribute more than 2% to BaP emissions. The main source of BaP emissions in the Czech Republic is overwhelmingly local heating, especially the combustion of solid fuels in older types of boiler constructions with over-fire and under-fire type of burners (Figure 3 and Figure 4). Compared to other European countries, the Czech Republic has the second highest average BaP emission per capita from the residential sector (1.5 g/(person·year)). The highest average emission is in Poland (1.6 g/(person·year)) whereas the EU average is 0.4 g/(person·year) [49].
The main reason for a high share of BaP emissions from local heating in the Czech Republic is specifically the combustion of solid fuel in older type of boilers (over-fire and under-fire). However, these types of boilers are being gradually replaced by low-emission boilers or by other types of heating. In 2018, the share of over-fire and under-fire boilers was estimated to be around 69%. These replacements are being accelerated by the legislative requirements of Act 201/2012 Coll. [50] that stipulates that after September 2022 only low-emission boilers meeting the parameters of at least 3rd boiler class (as defined in the EN 303-5:2012 [51]) can be in operation for solid fuel combustion in households. The replacement of old boilers was supported by a subsidy program between 2015 and 2019, with the aim of replacing up to 100,000 high-emission boilers. However, replacement of the boiler itself is not a guarantee of efficient emission reduction if the boiler is not operated properly in accordance with operating instructions.
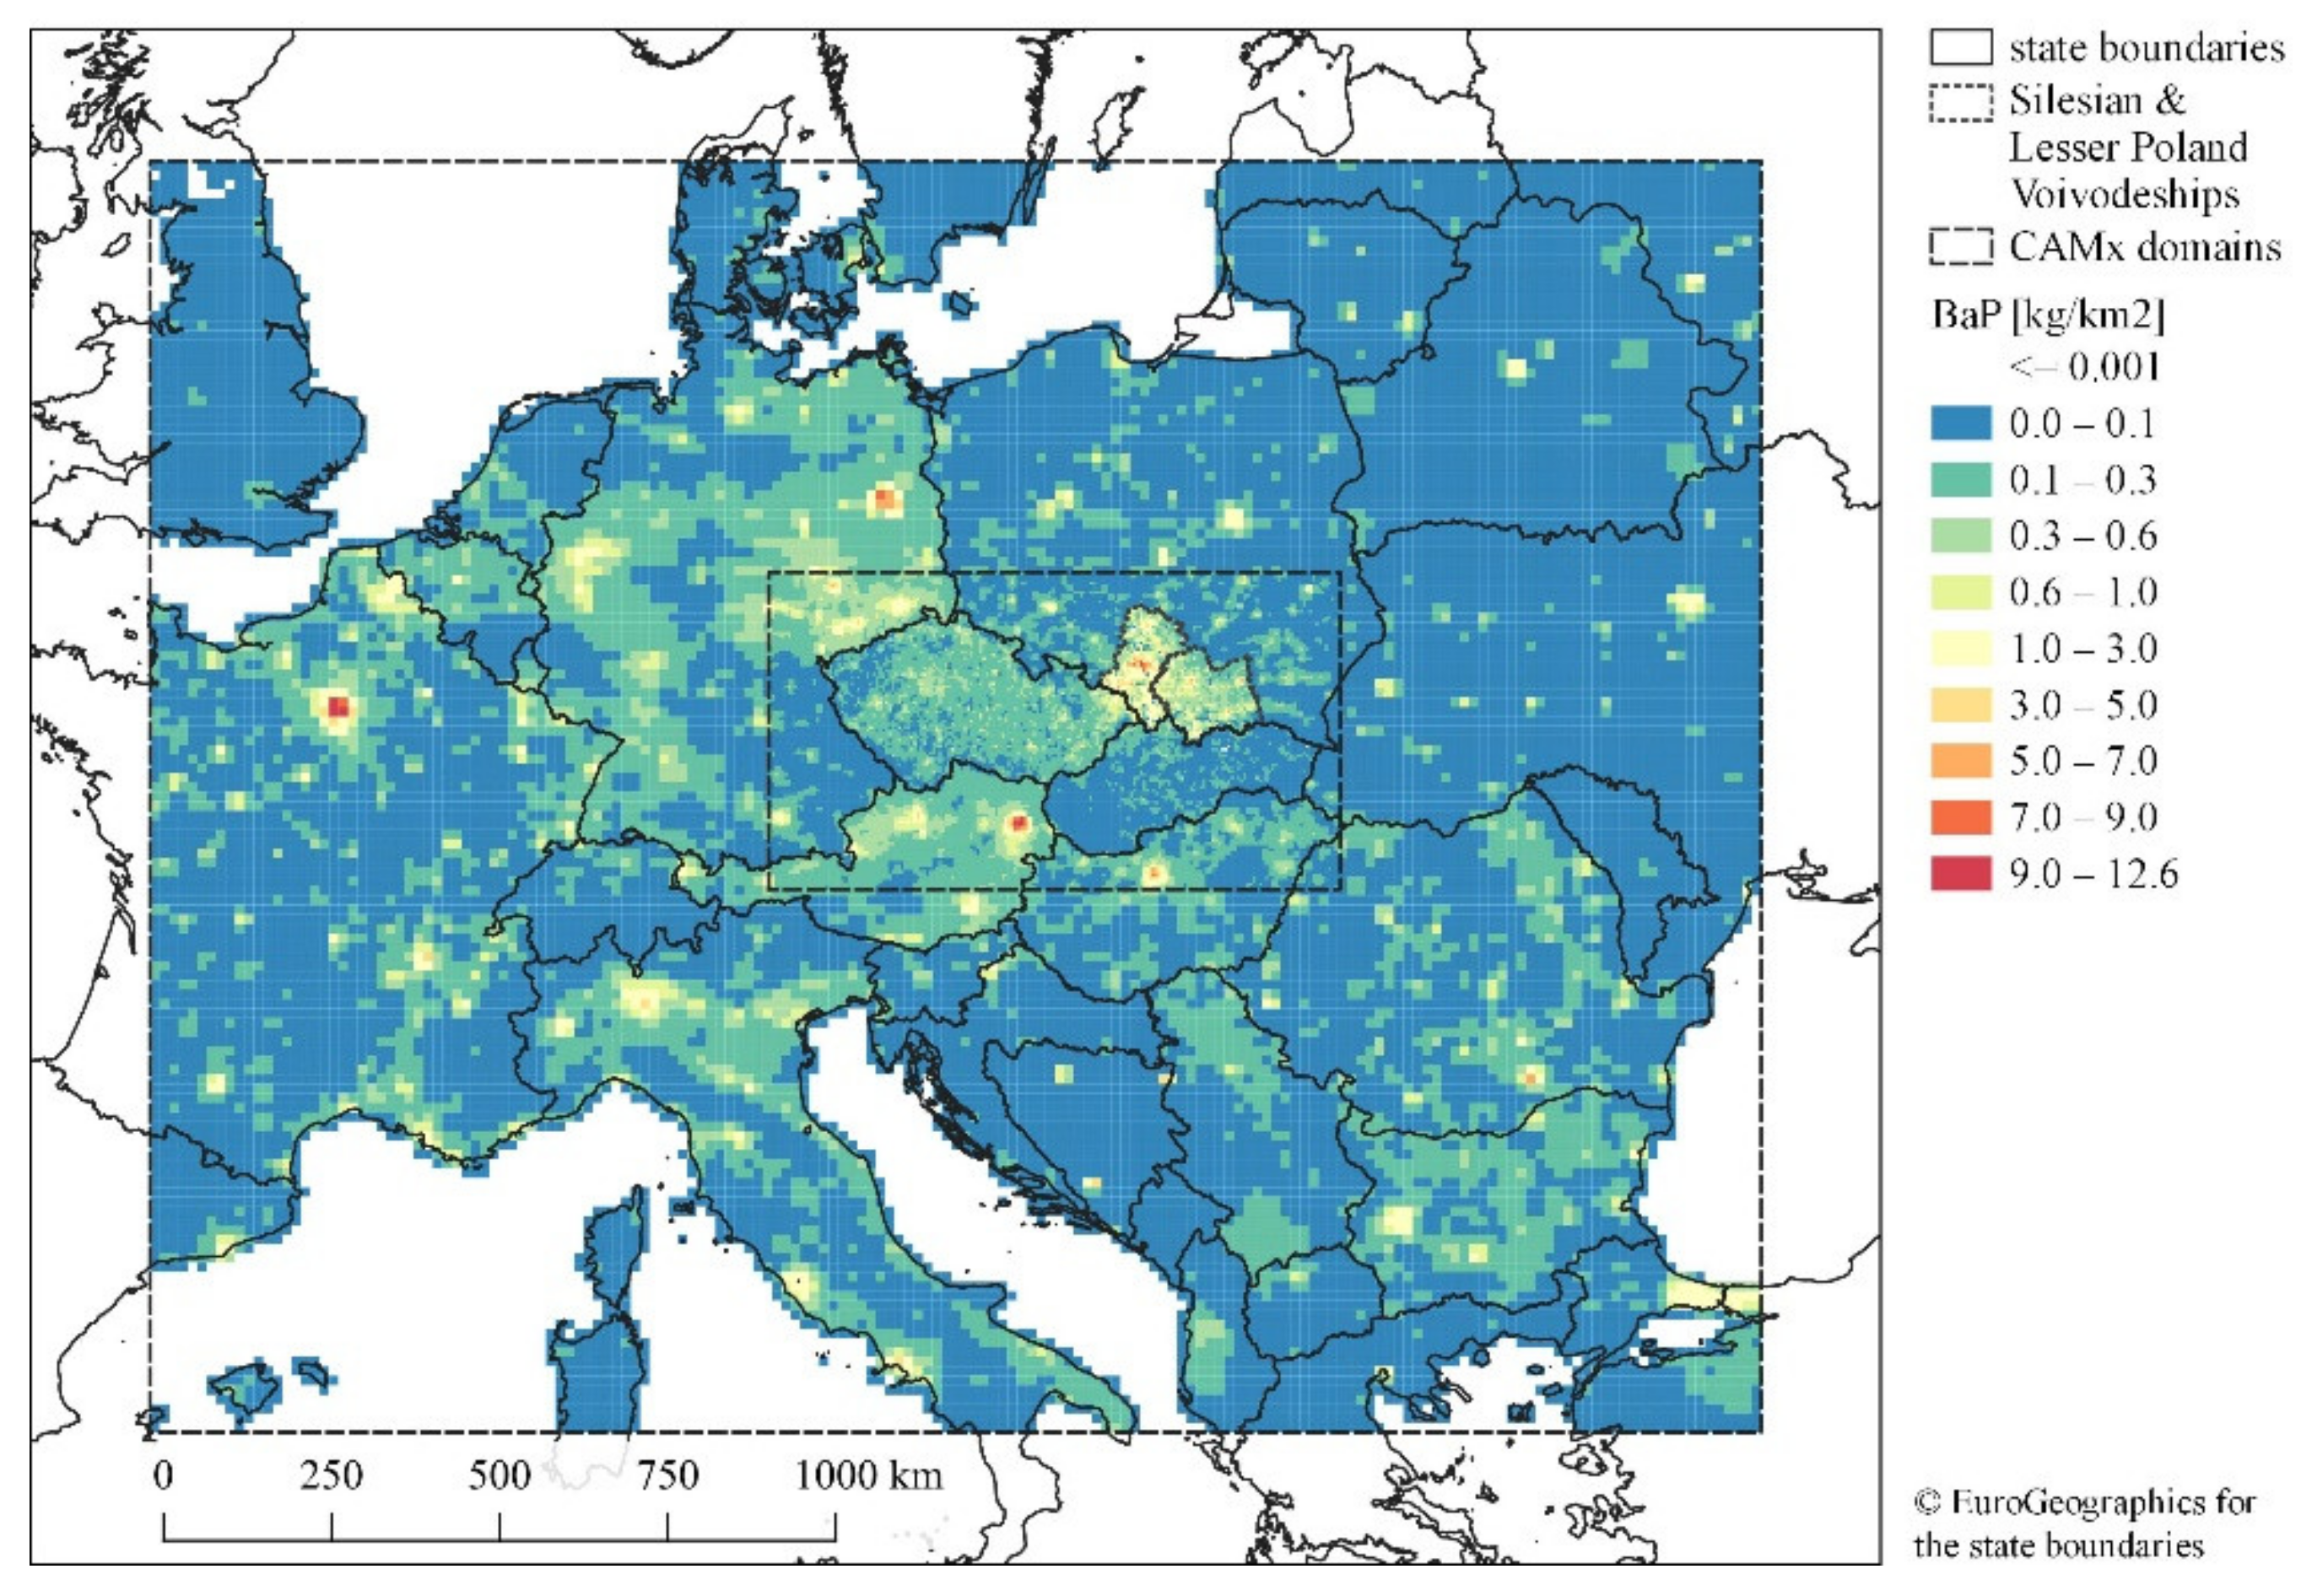
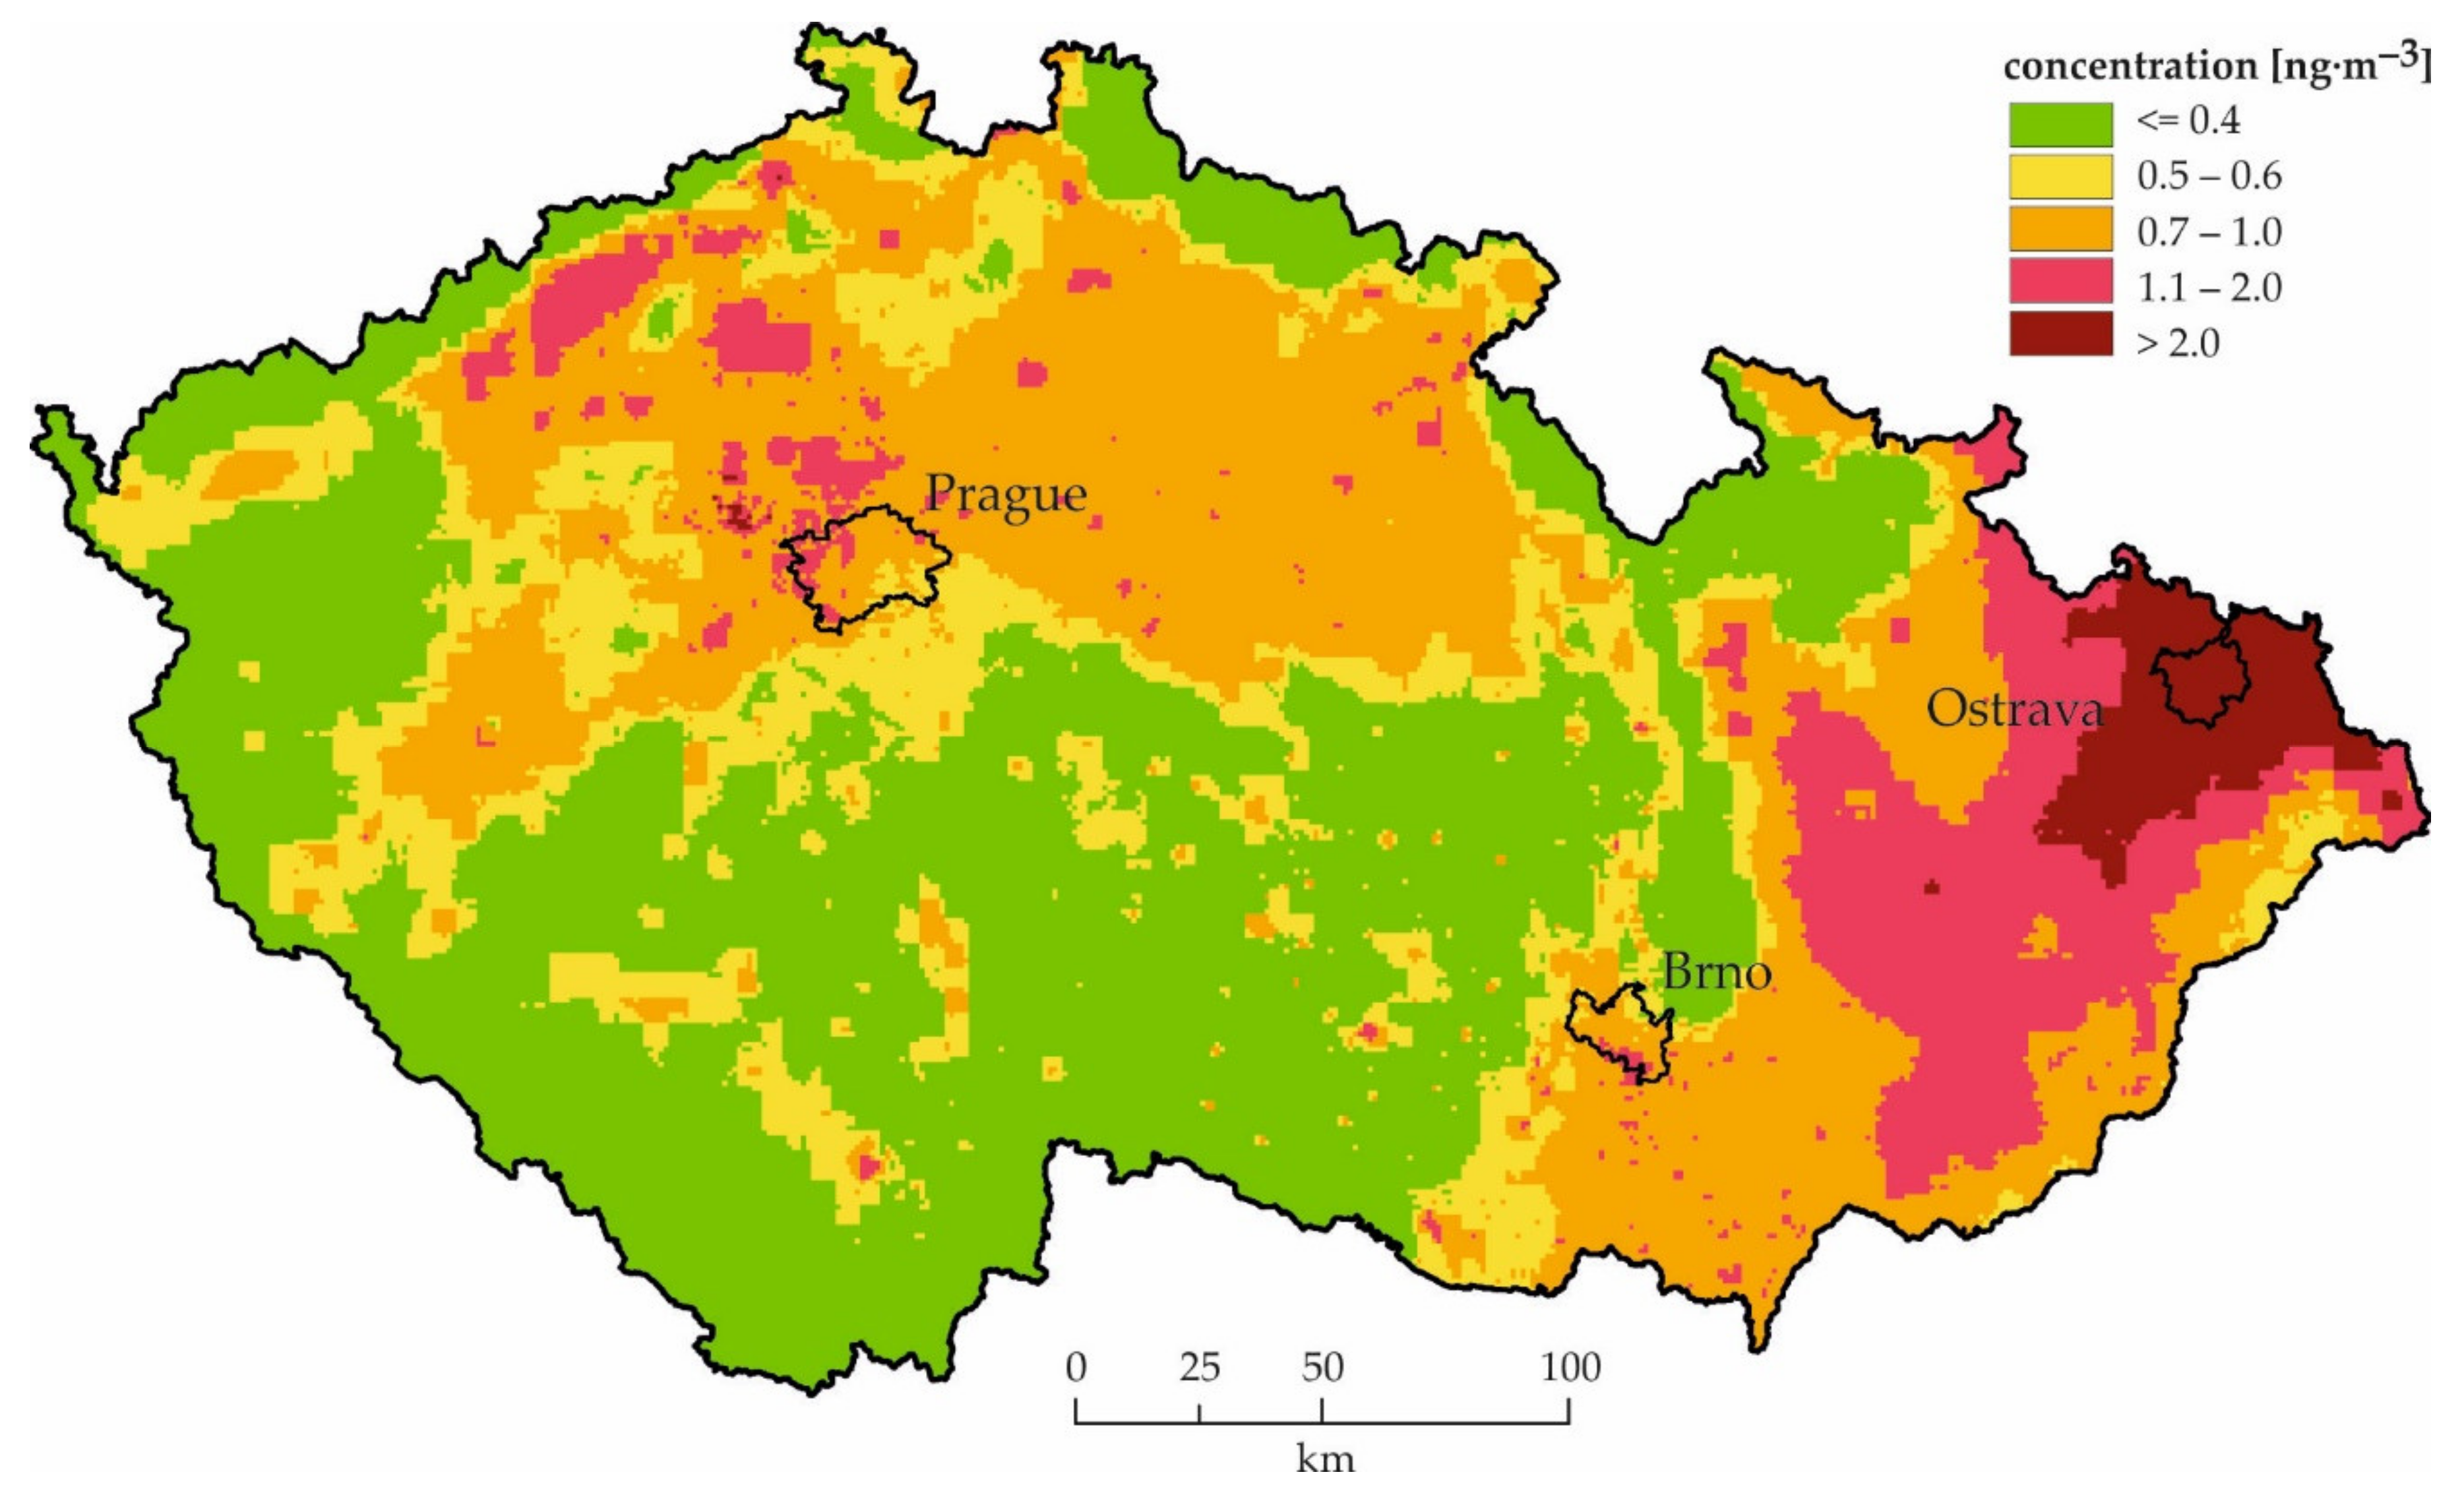
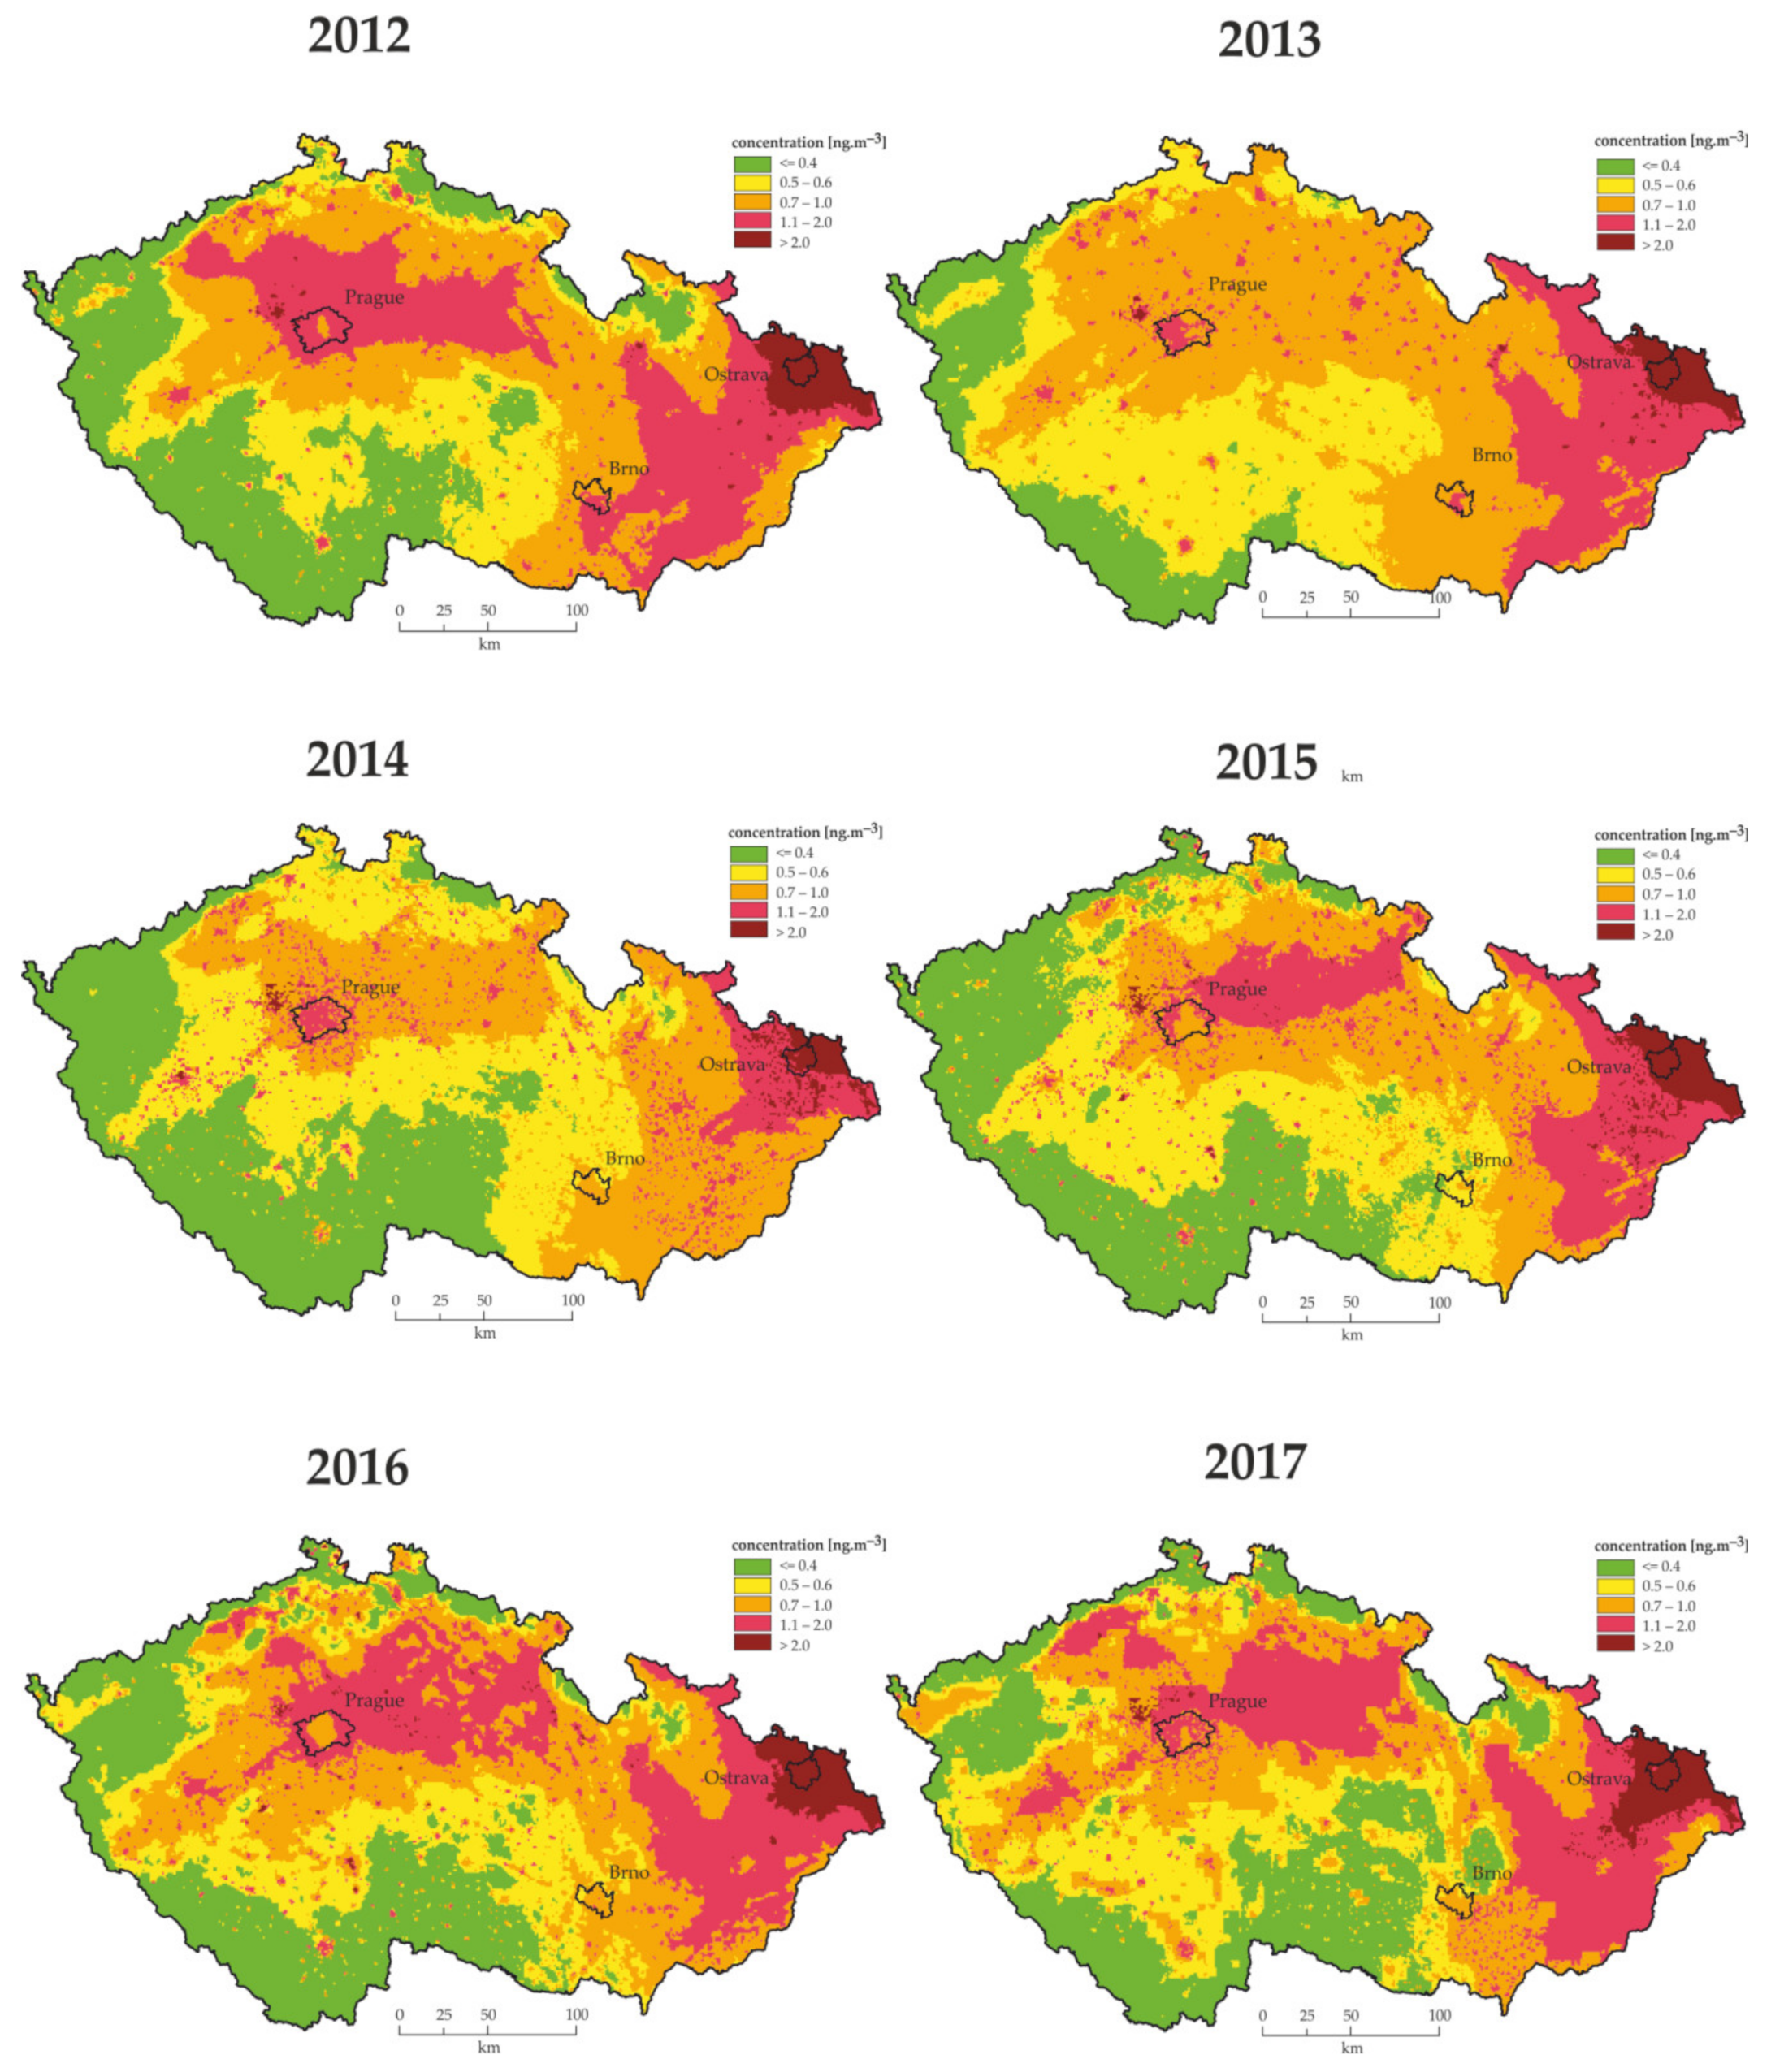
The range of measured concentration of BaP was from 0.4 ng·m3 at a rural regional station to 7.7 ng·m−3 at an industrial station in 2018. The area where BaP concentrations exceeded the target value was 12.6% in 2018 (
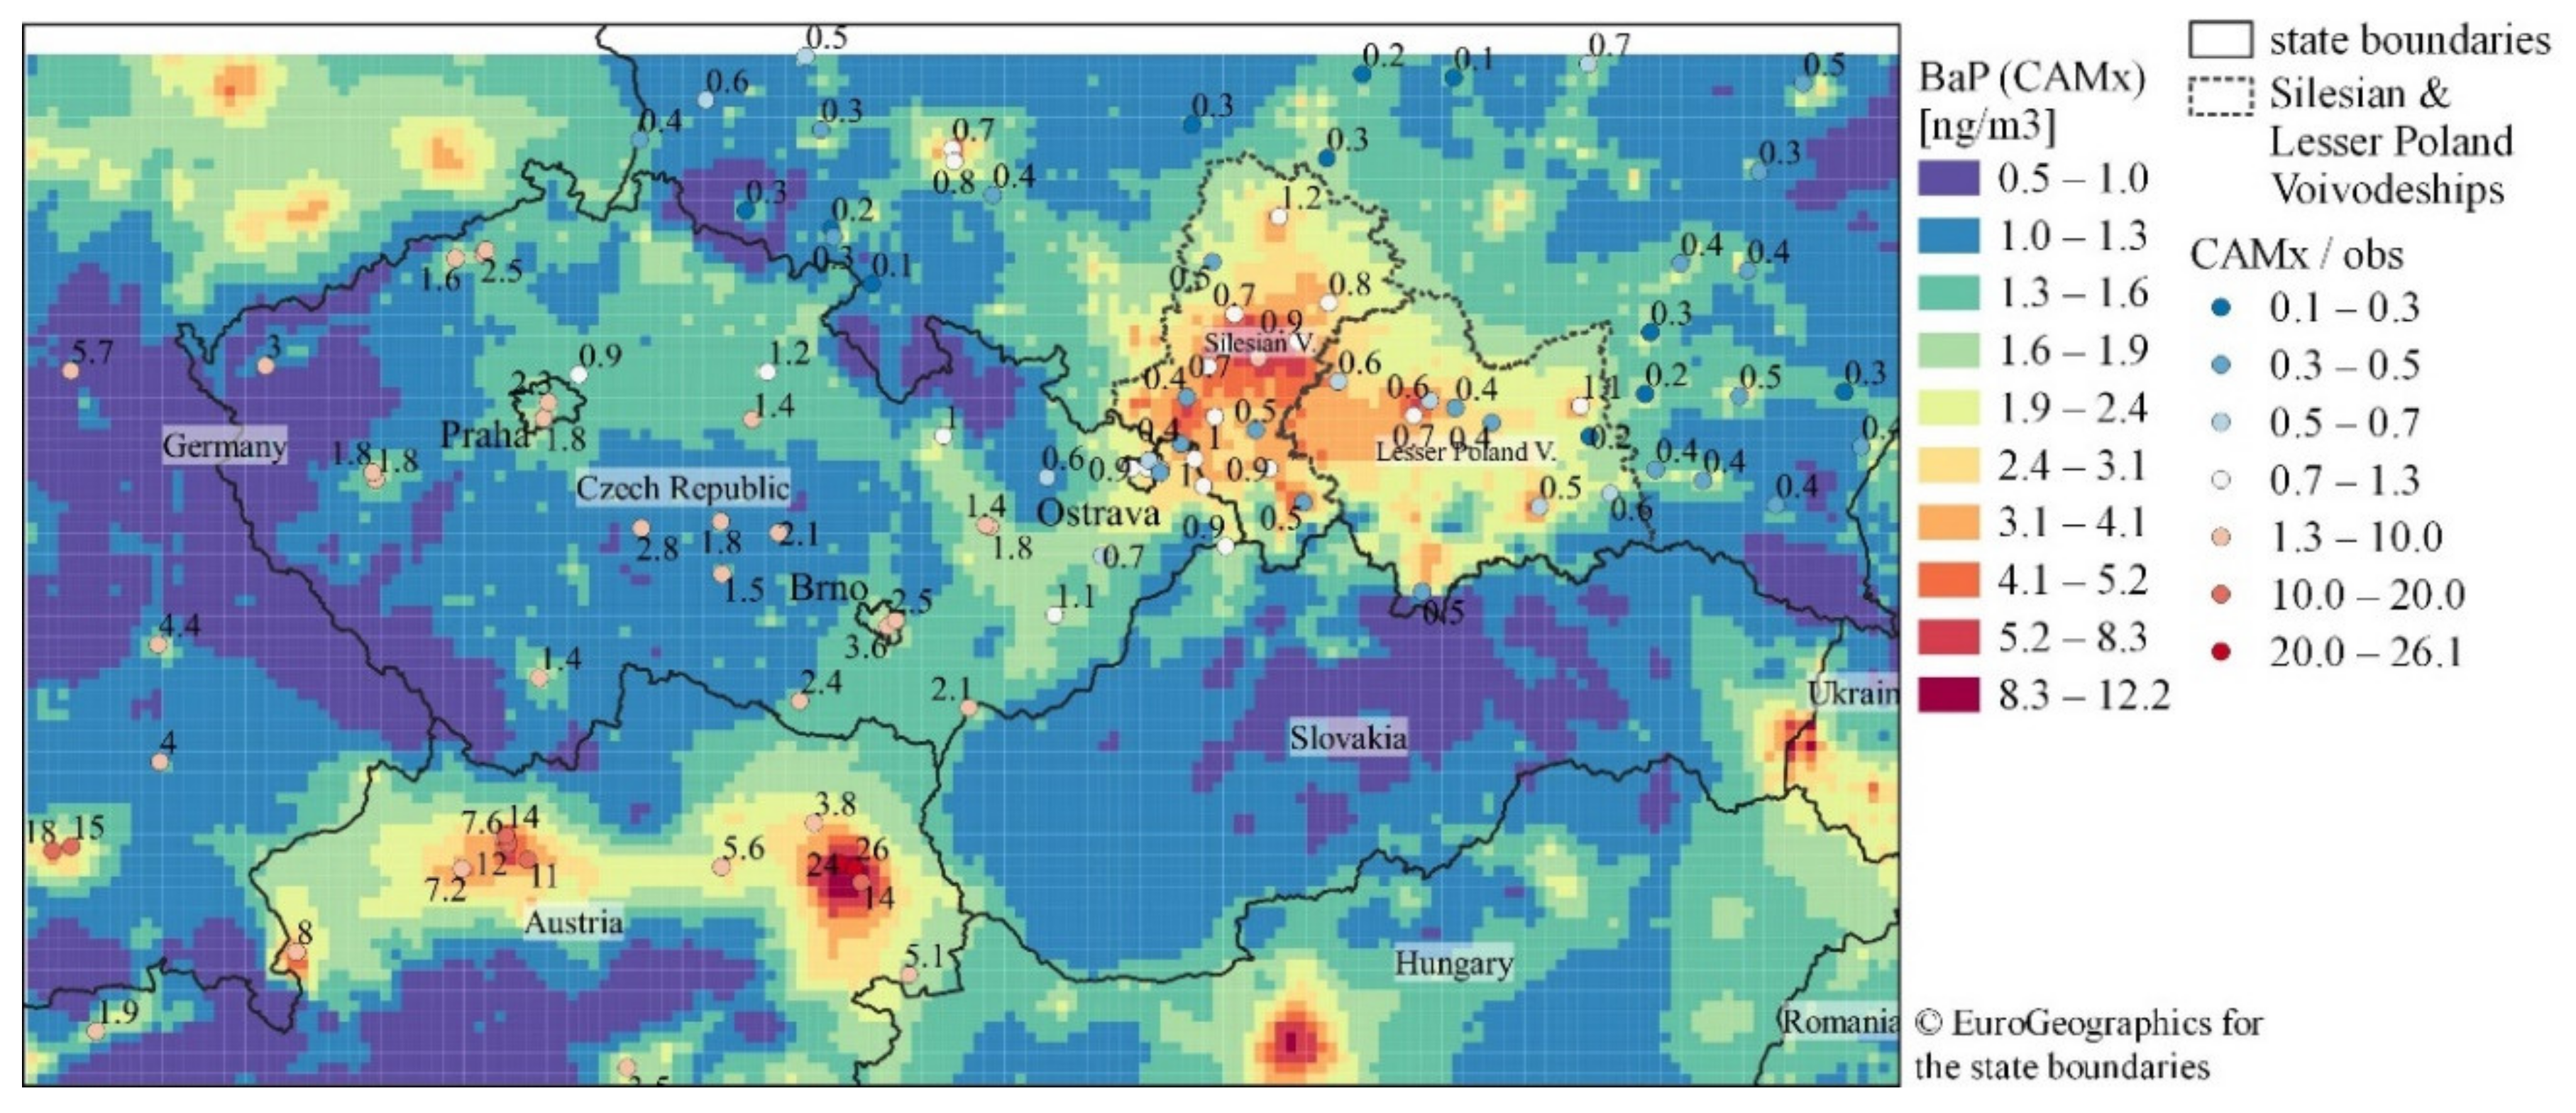
Figure 5). The highest annual average concentrations of BaP have long been recorded throughout the entire Ostrava Region. In this region, there is the highest emission load due to a combination of local heating and the largest share of heavy industry in the Czech Republic. The transboundary contribution in the Ostrava region was estimated to be 40–60% but may be in fact somewhat lower due to model limitations. High BaP concentration values due to the effect of local heating systems have also been monitored in Kladno for a long time. Concentrations exceeding the target value for BaP also occur in Central Bohemia and in a number of municipalities. The values of BaP concentration show that the ambient air concentrations of BaP are high in the Czech Republic in general, which is consistent with the model study of Europe [11], where the authors pointed out the ambient air concentrations of BaP to be substantially high in Central and Central Eastern Europe but also in some other European regions.
Relatively low levels of BaP have been recorded in large cities, like in the center of Helsinki [52] and in Porto [28]. In Porto, transport was identified as the main source of PAHs based on diagnostic ratios. In street canyons in Helsinki, the measured concentrations of BaP were at the same level as those in the urban background and clearly lower than those in suburban detached-house areas. These results indicate that local traffic has only a minor effect on BaP concentrations, compared with the corresponding effect of small-scale combustion. In the Czech Republic, transport is also a minor emission source of BaP (0.8%); nevertheless, levels of BaP concentrations in Prague were higher than in Porto and in street canyons in Helsinki. The higher BaP concentrations in Prague (Table 1) were caused by regional and long-range transport, especially in the center of the city in areas with a high proportion of remote central heating, where the main emission source of BaP is traffic. In suburban Prague, local heating was as important as it was in suburban Helsinki [52].
The lowest average annual concentrations are estimated at places distant from direct exposure to emission sources (natural mountain areas). The lowest measured BaP concentrations, ranging from 0.3 to 0.7 ng·m−3, have been recorded at the Košetice regional station. Nevertheless, these values are still relatively high (Table 1) and are above the WHO reference value (0.12 ng·m−3). These relative high values of BaP concentrations at a regional background station pointed out the important role of regional and long range transport in the Czech Republic. The importance of regional transport is related to the high contribution of coal combustion to BaP emissions (about 30–40%) and the long lifetime of BaP derived from coal combustion in the atmosphere as found in this study [35].
Moreover, no correlation between background BaP concentration at Košetice and emission was found. The same (lowest) value of background BaP concentration in 2008, 2011, 2014 and 2016−2018 supports our conclusion on the combined effects of emission, meteorological and dispersion conditions and transboundary contributions. Based on the CHMI data, the last four years 2015−2018 of the study period are also years with the highest ratio of good meteorological and dispersion conditions and with BaP emissions decreasing after their peak in 2013. The year 2014 can be characterized by a milder winter season and the shortest heating season for many years [22]. In contrast, the beginning of the study period could be characterized by the greater presence of moderately poor and poor dispersion conditions [53] and the lowest BaP emissions in the study period (Table 1).
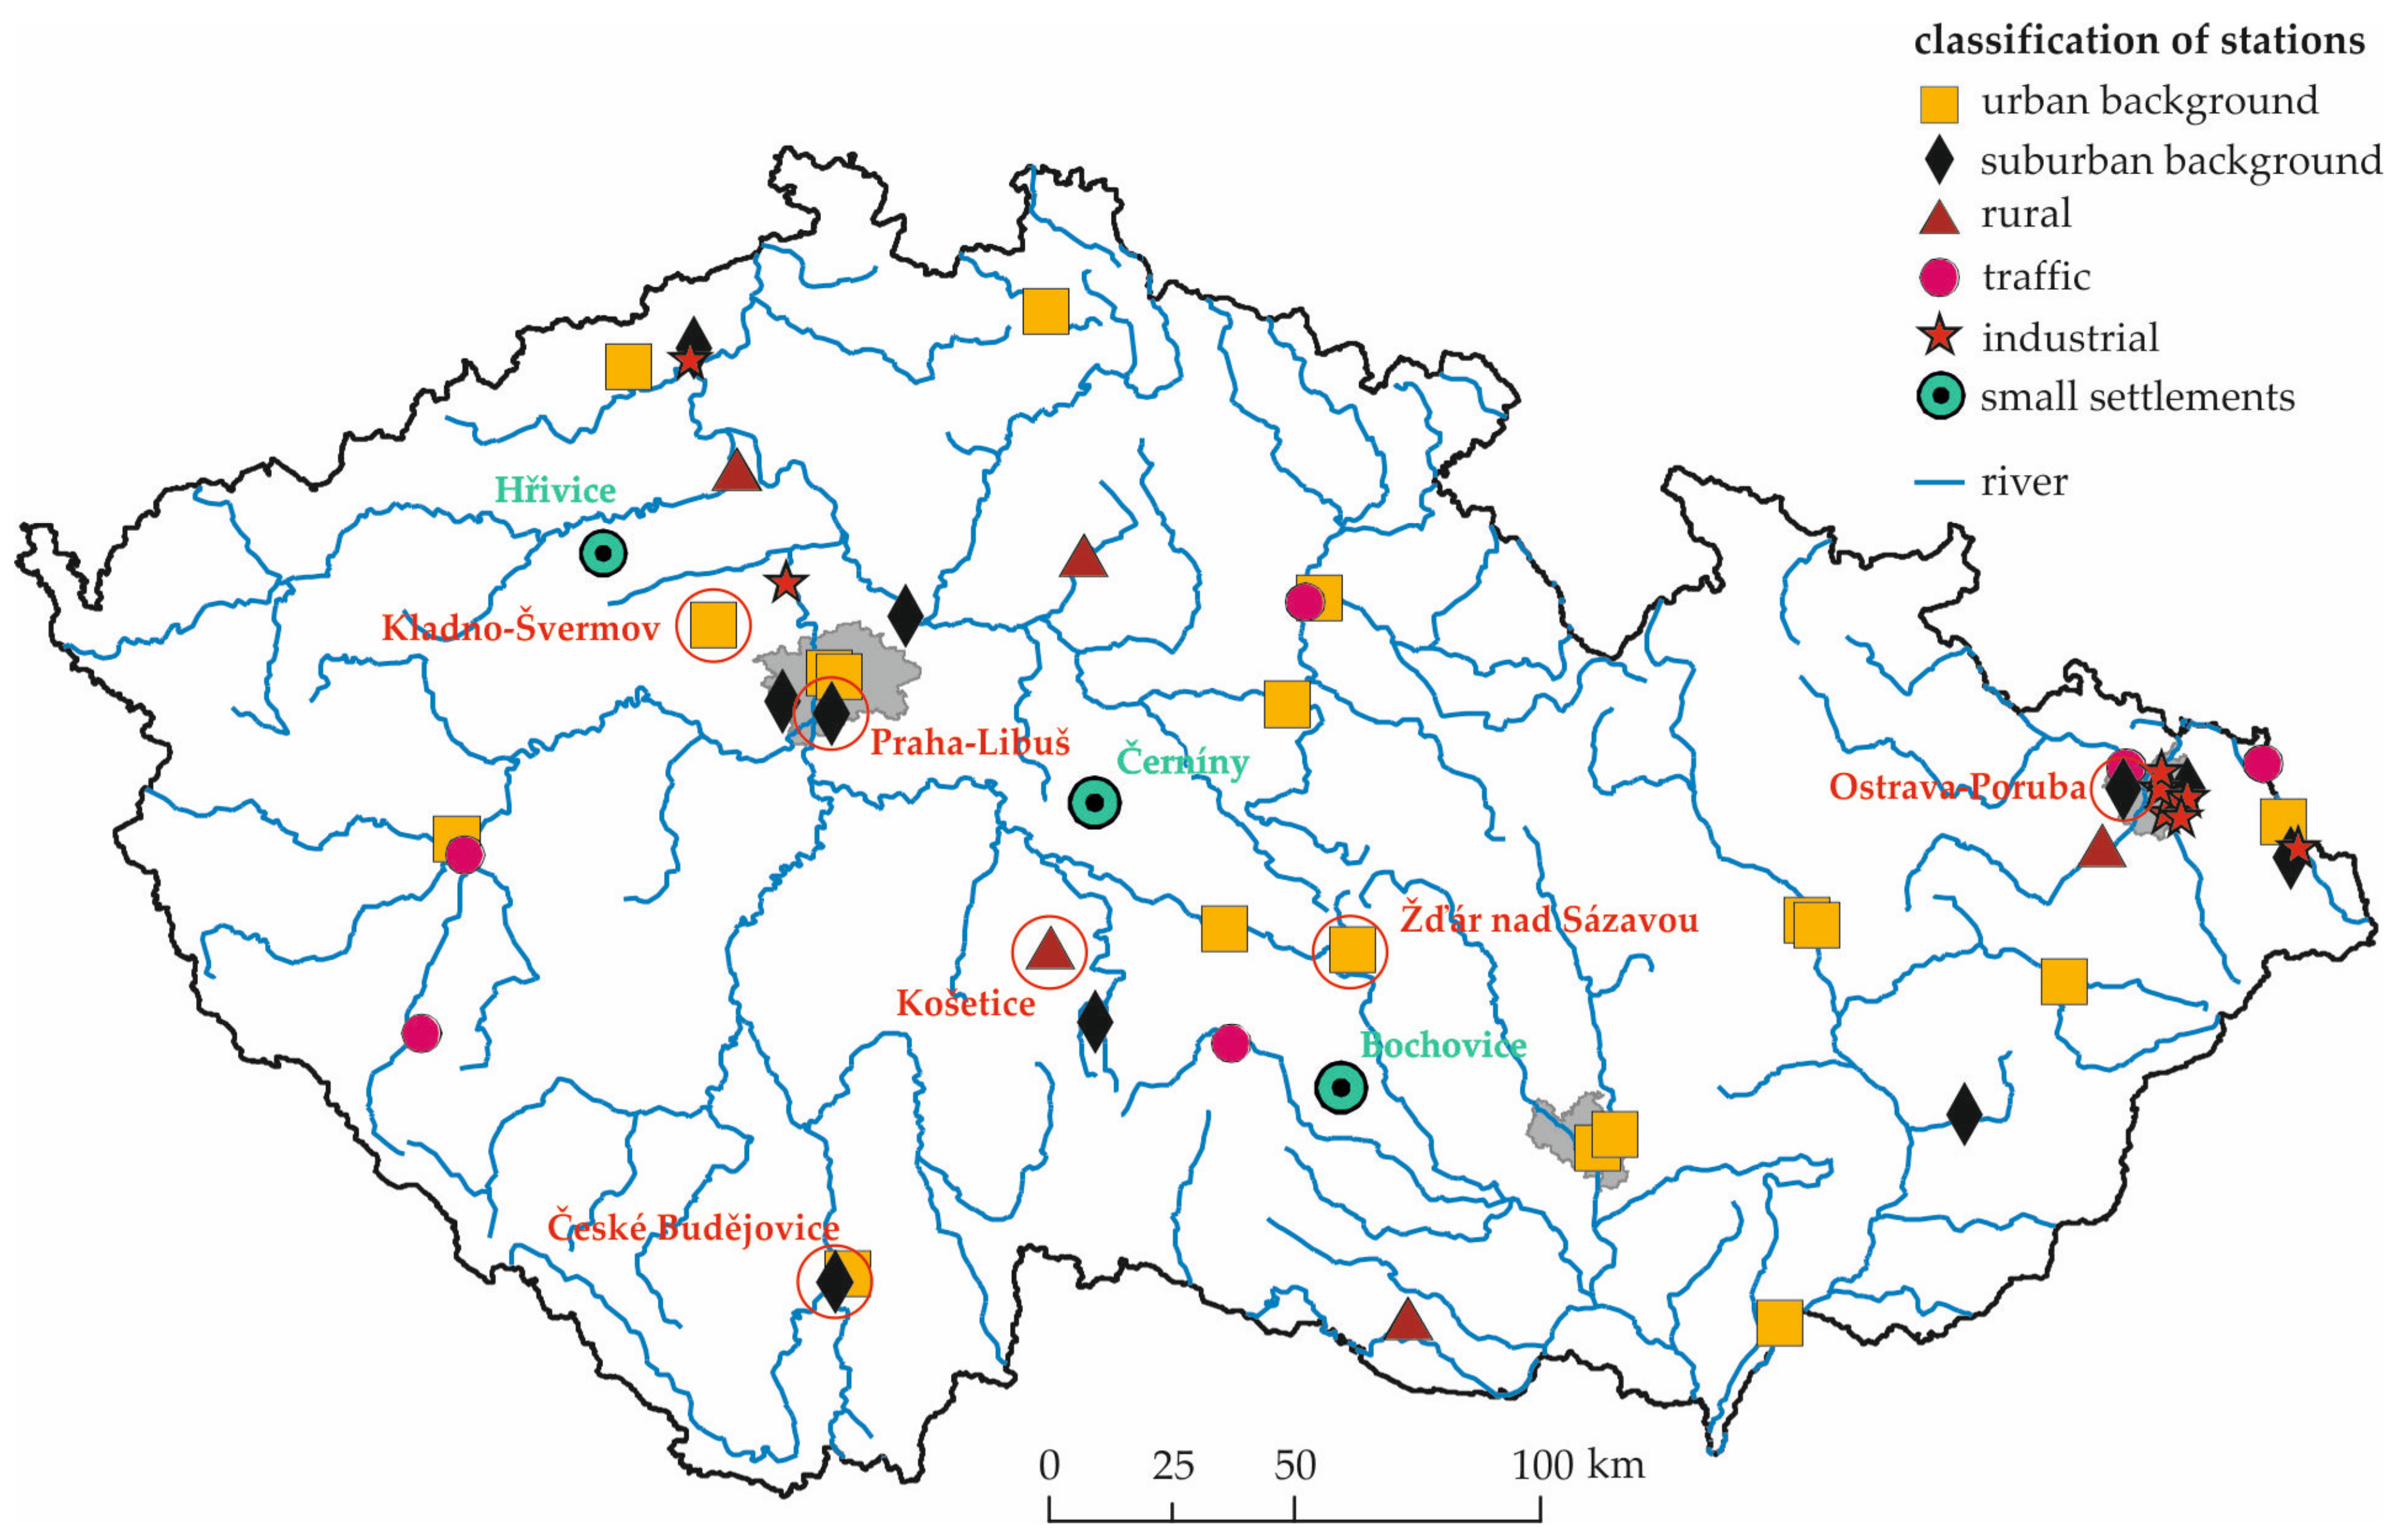
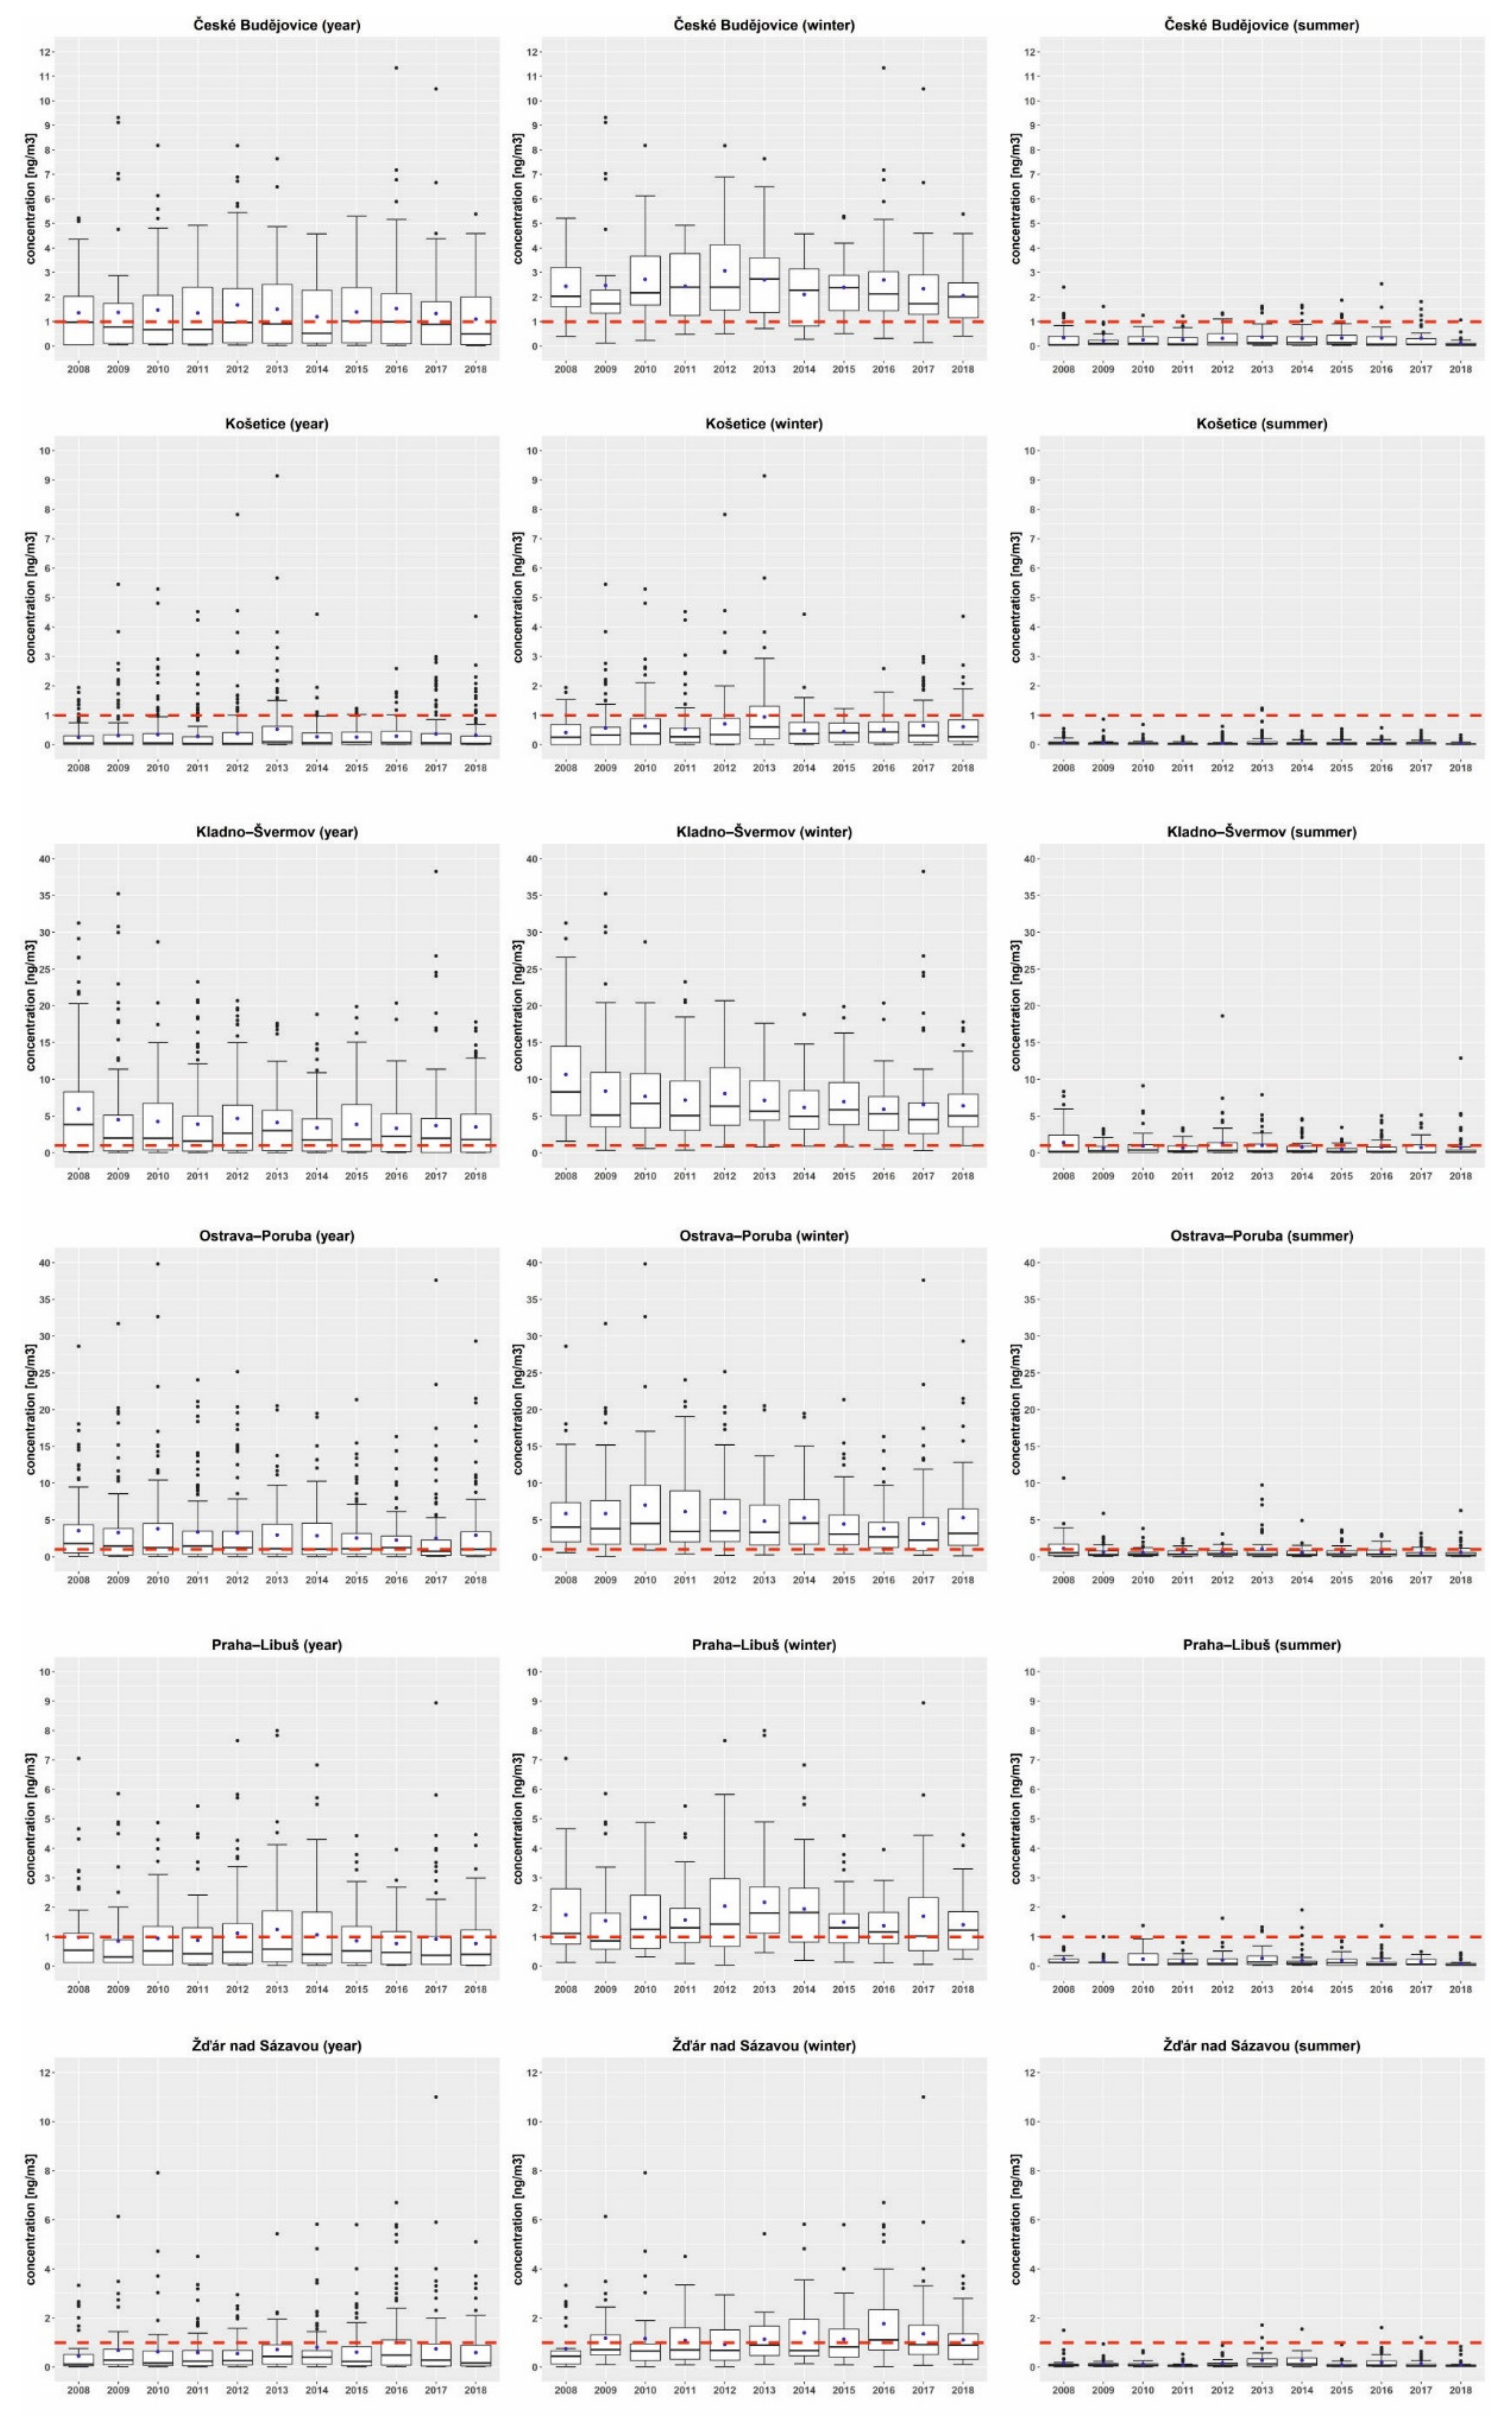
Since the higher BaP concentrations are a problem in urban and suburban areas due to local heating, we chose five urban and suburban sites in the Czech Republic for the current concentration level and trend assessment. The sixth rural regional site represents the background ambient air concentration in the Czech Republic.
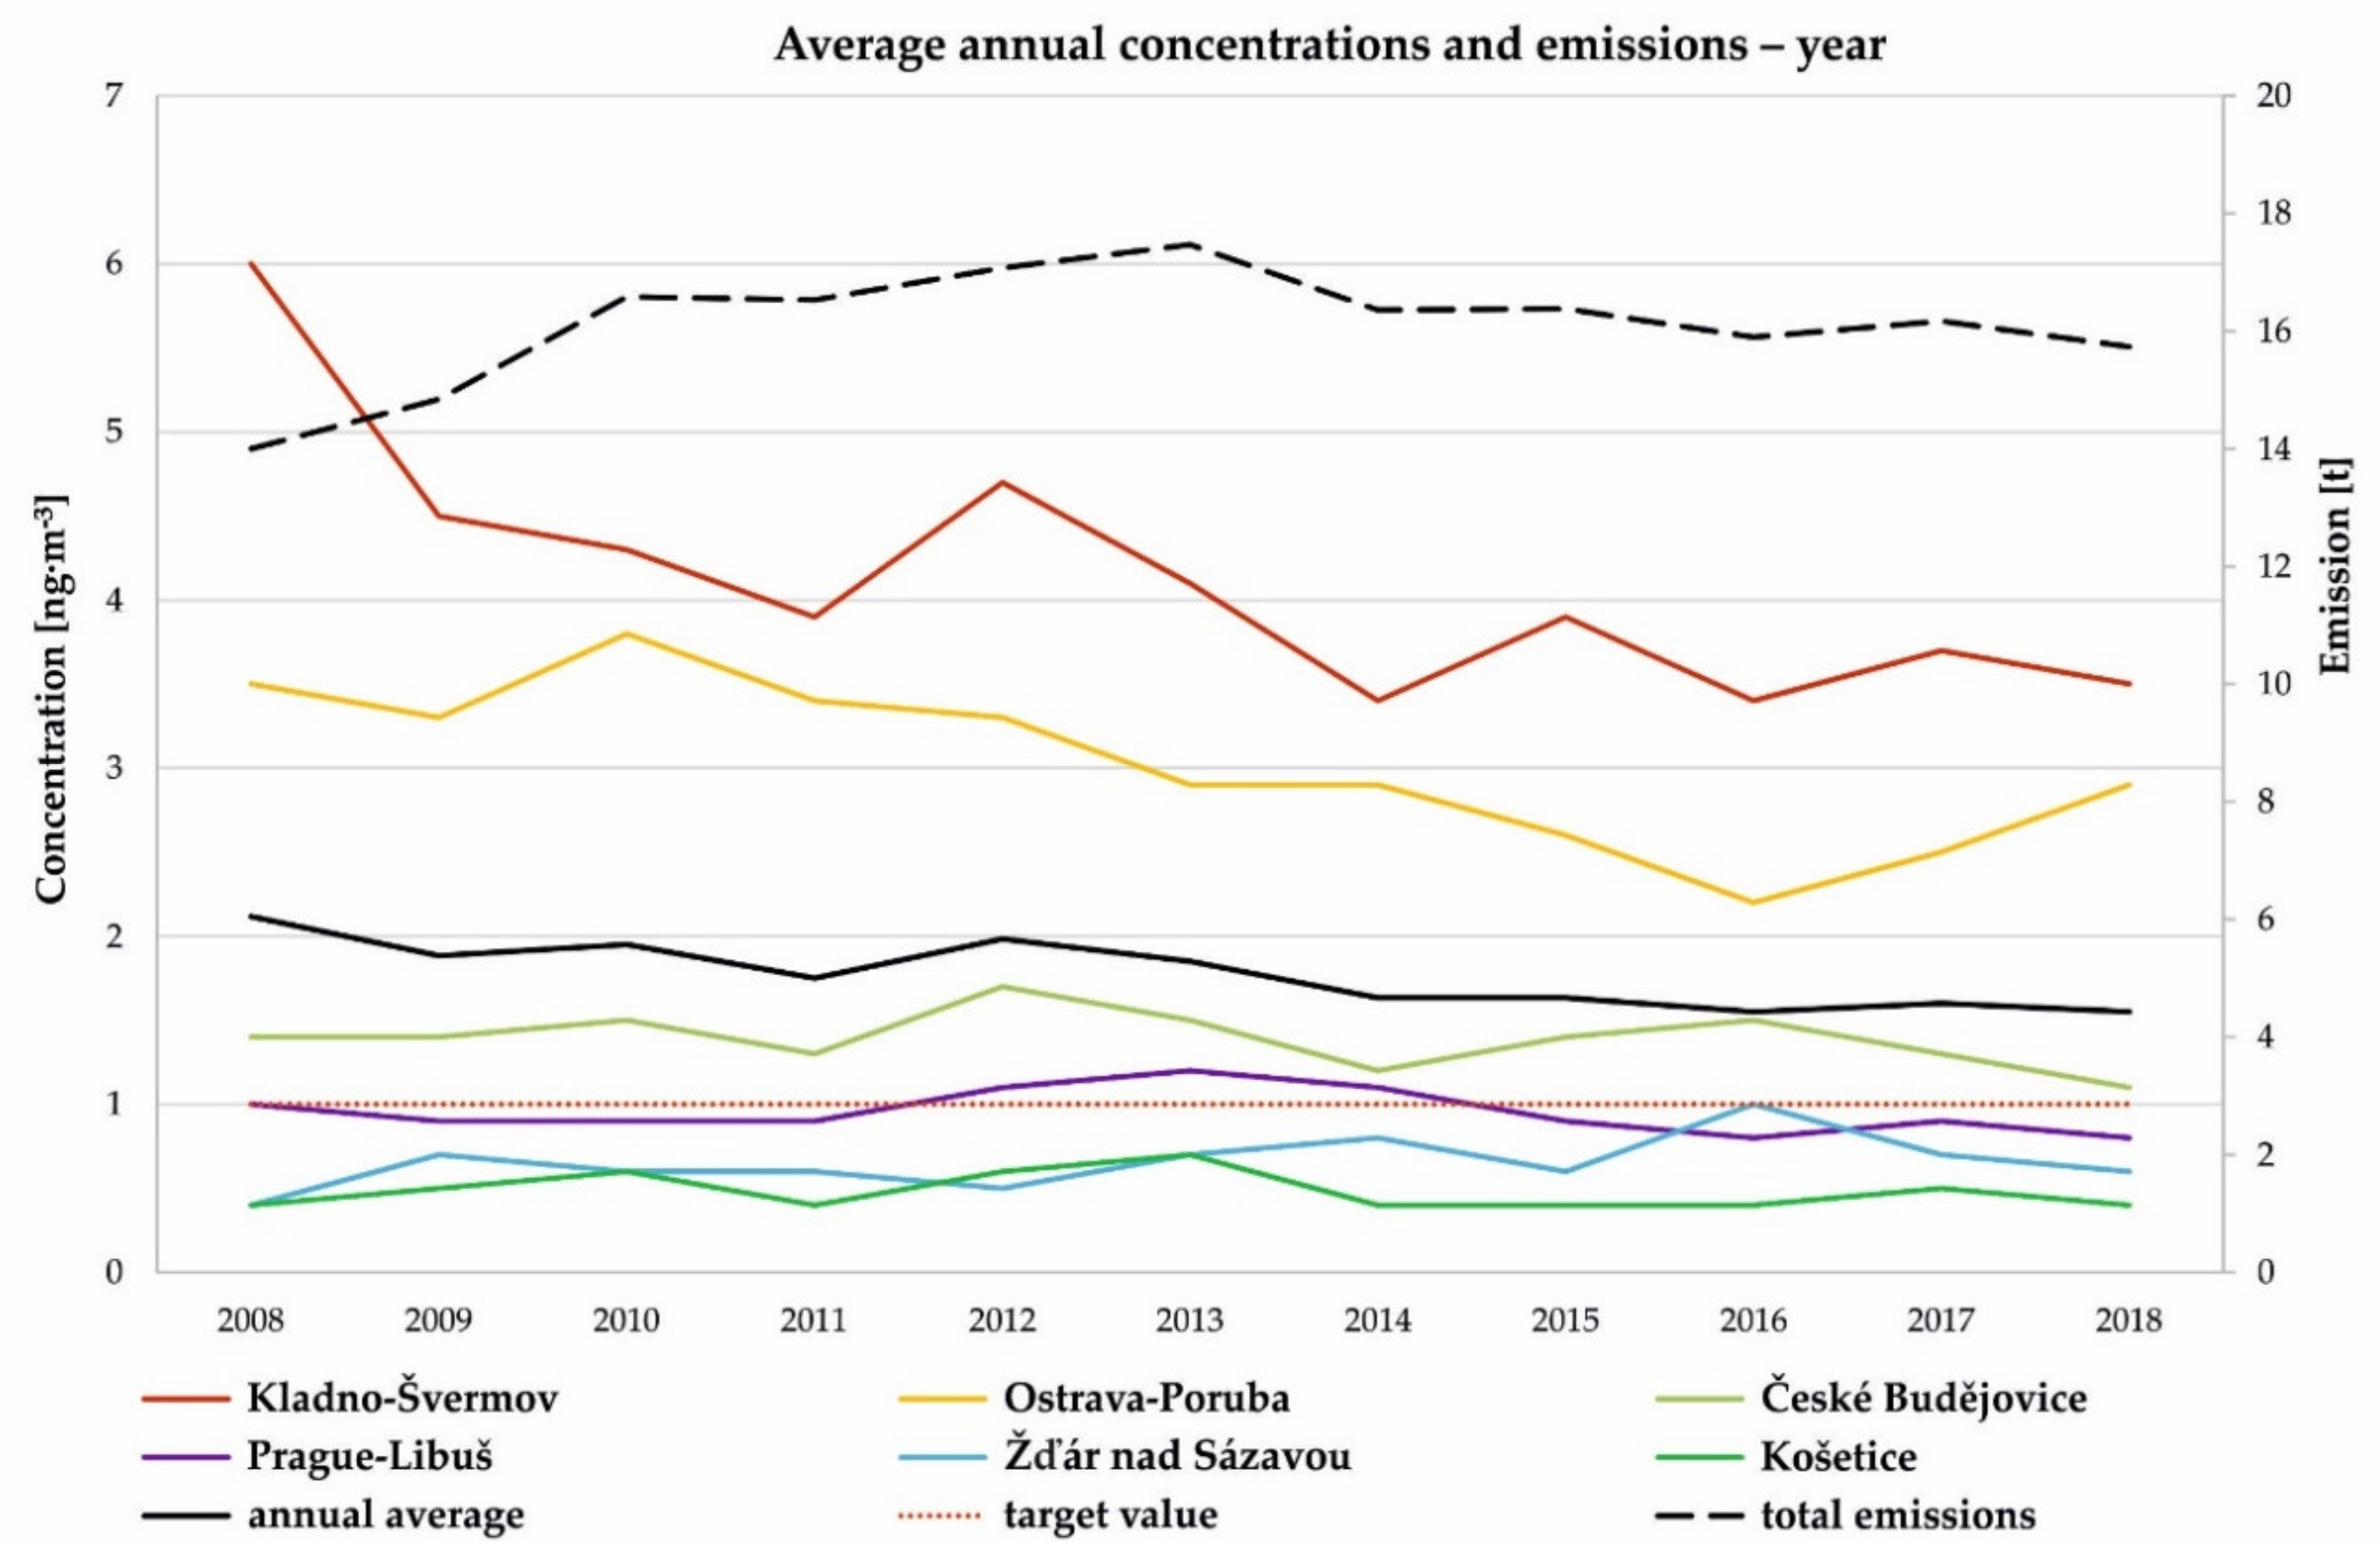
The highest annual average value in urban and suburban sites was detected in 2008, the lowest annual average value of 1.8 ng·m−3 was detected in 2016, 2017 and 2018 with the widest range, from 0.7 to 3.7 ng·m−3 in 2017. Nevertheless, the lack of correlation of BaP concentration in the five urban and suburban sites and emissions for the whole Czech Republic (mainly from local heating, Figure 8) highlights the possible domination of local influences and the influence of meteorological and dispersion conditions.
We found a significant decreasing trend for average concentrations and winter average concentrations. The development of concentrations from selected stations in the Czech Republic between 2008 and 2014 is comparable to the development of PAHs and BaP concentrations presented in the study of [28] who analyzed data from two suburban sites in Porto between 2004 and 2014. A significant decreasing trend in the framework of their study was also found. A downward trend for all types of stations and at two thirds of total stations over the period 2007−2014 was also presented by EEA [54]. A significant decreasing trend was found at 22% of European rural and urban stations [54].
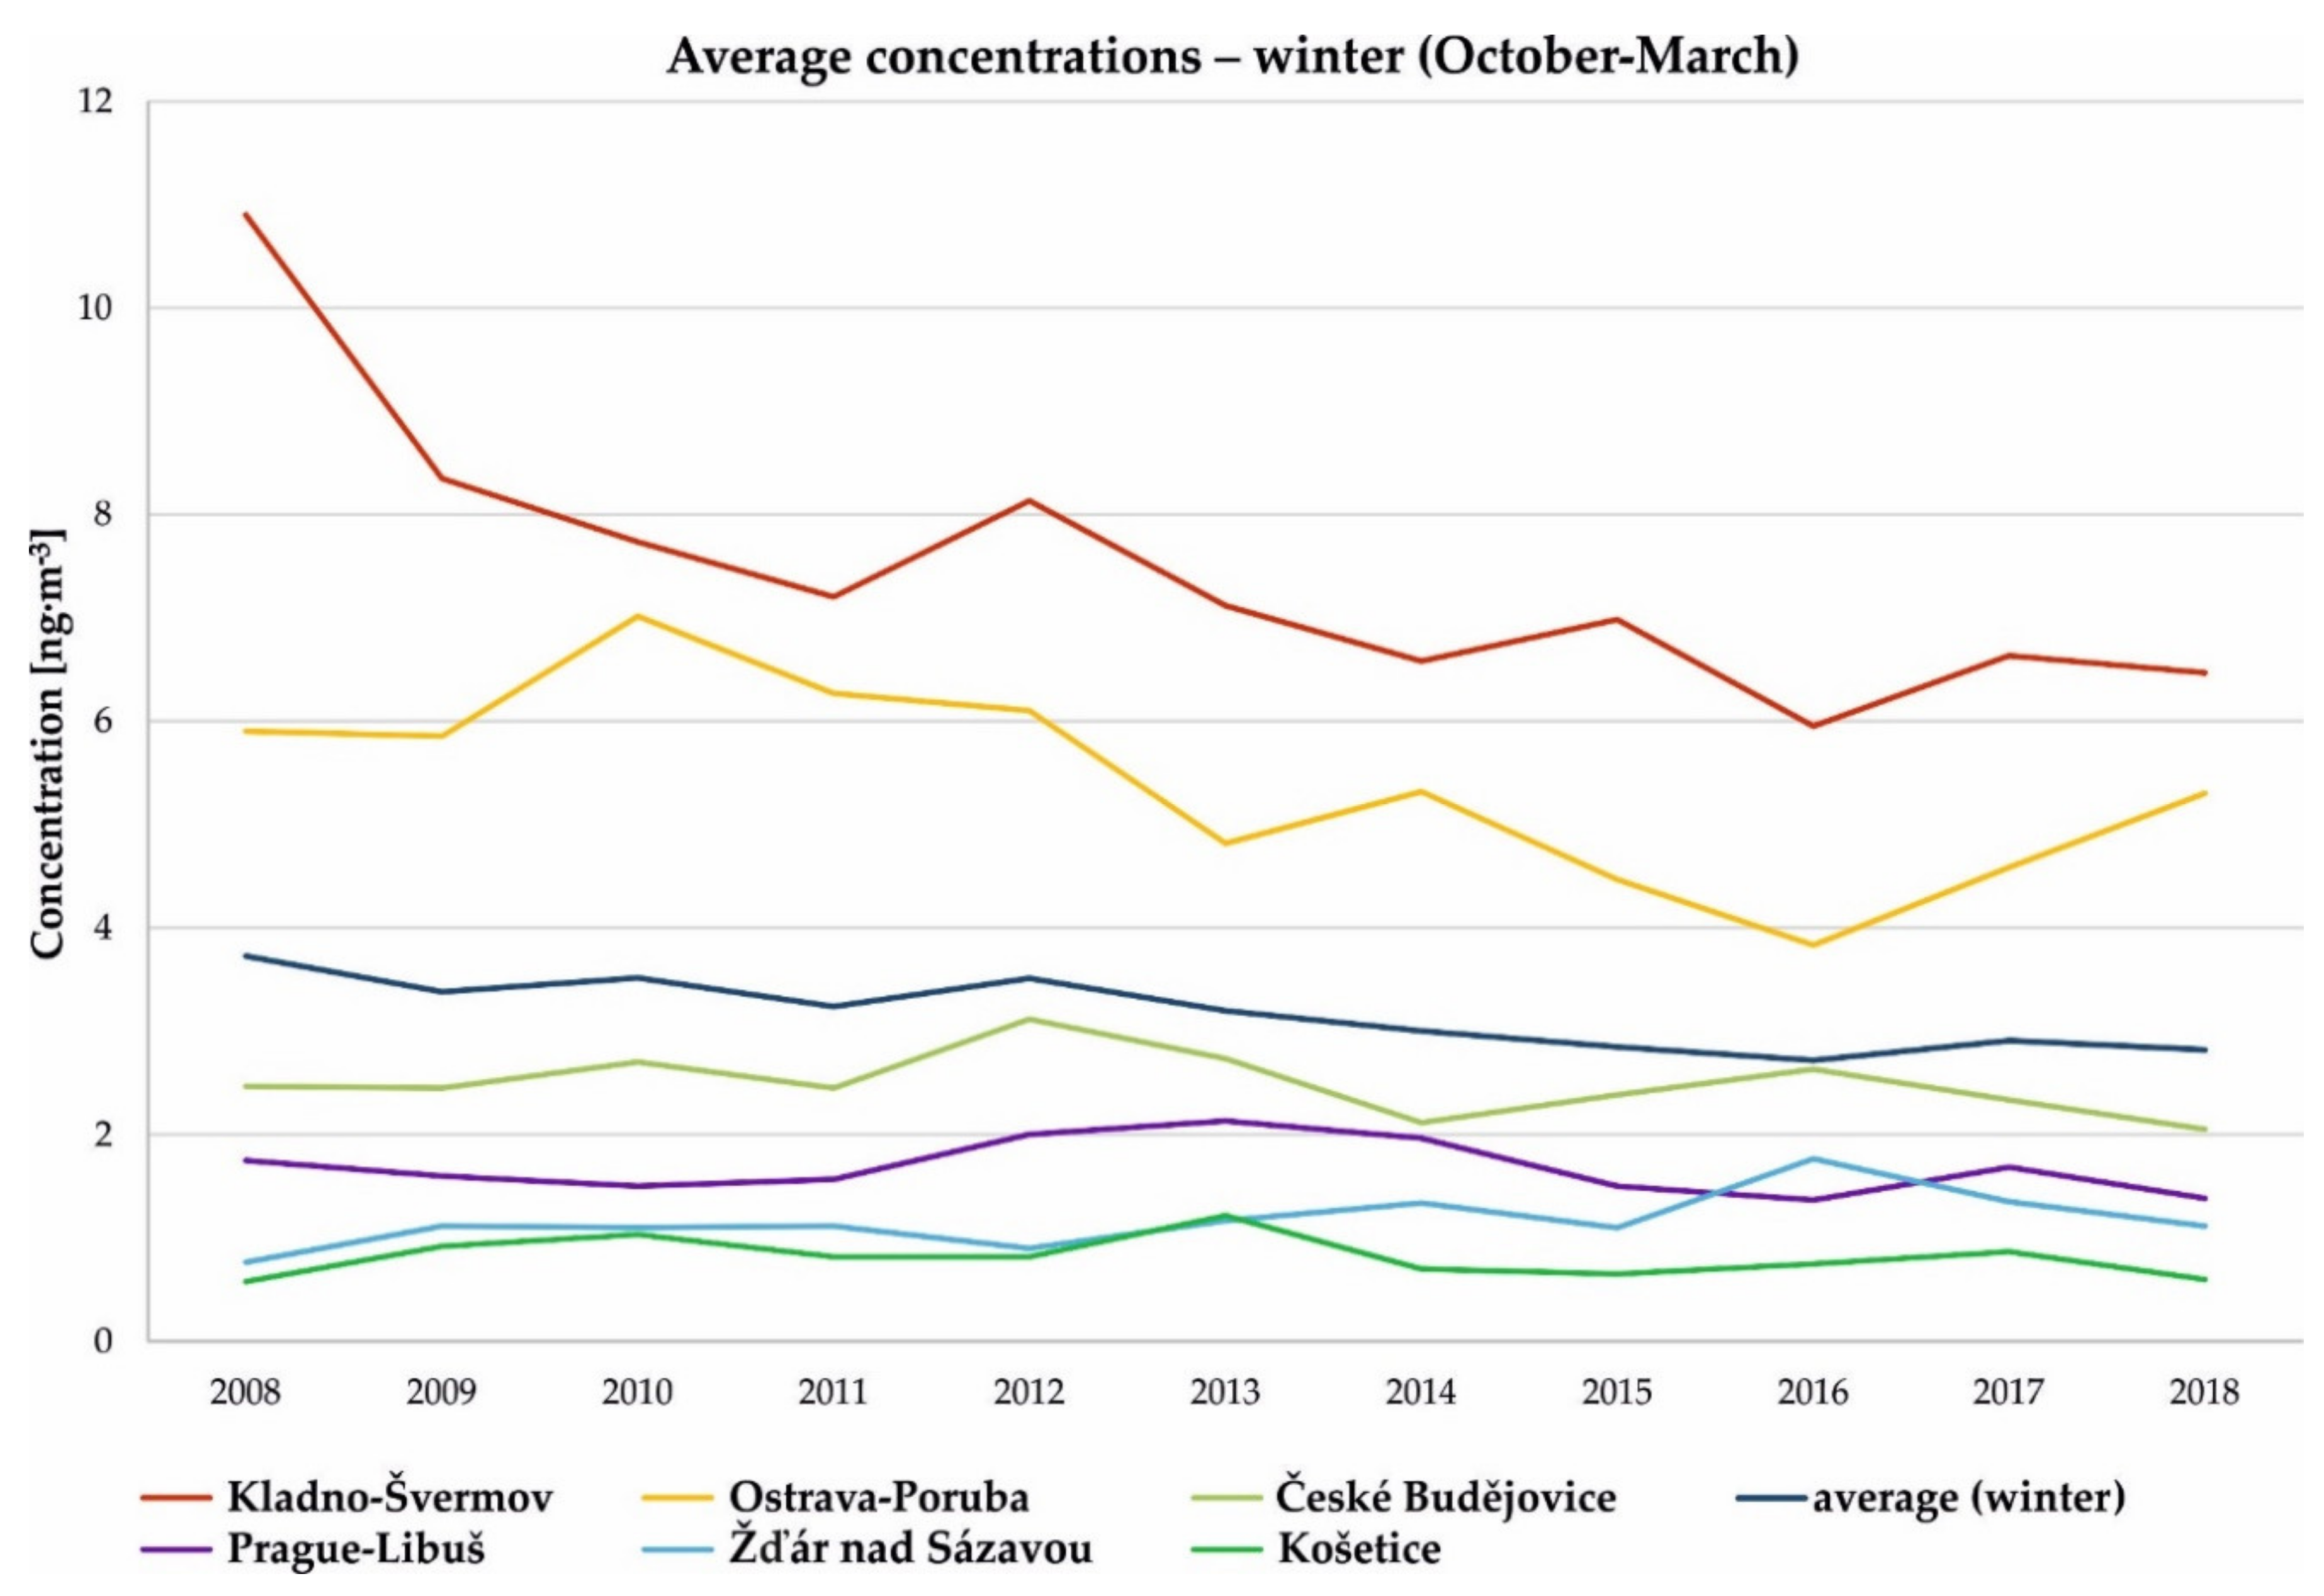
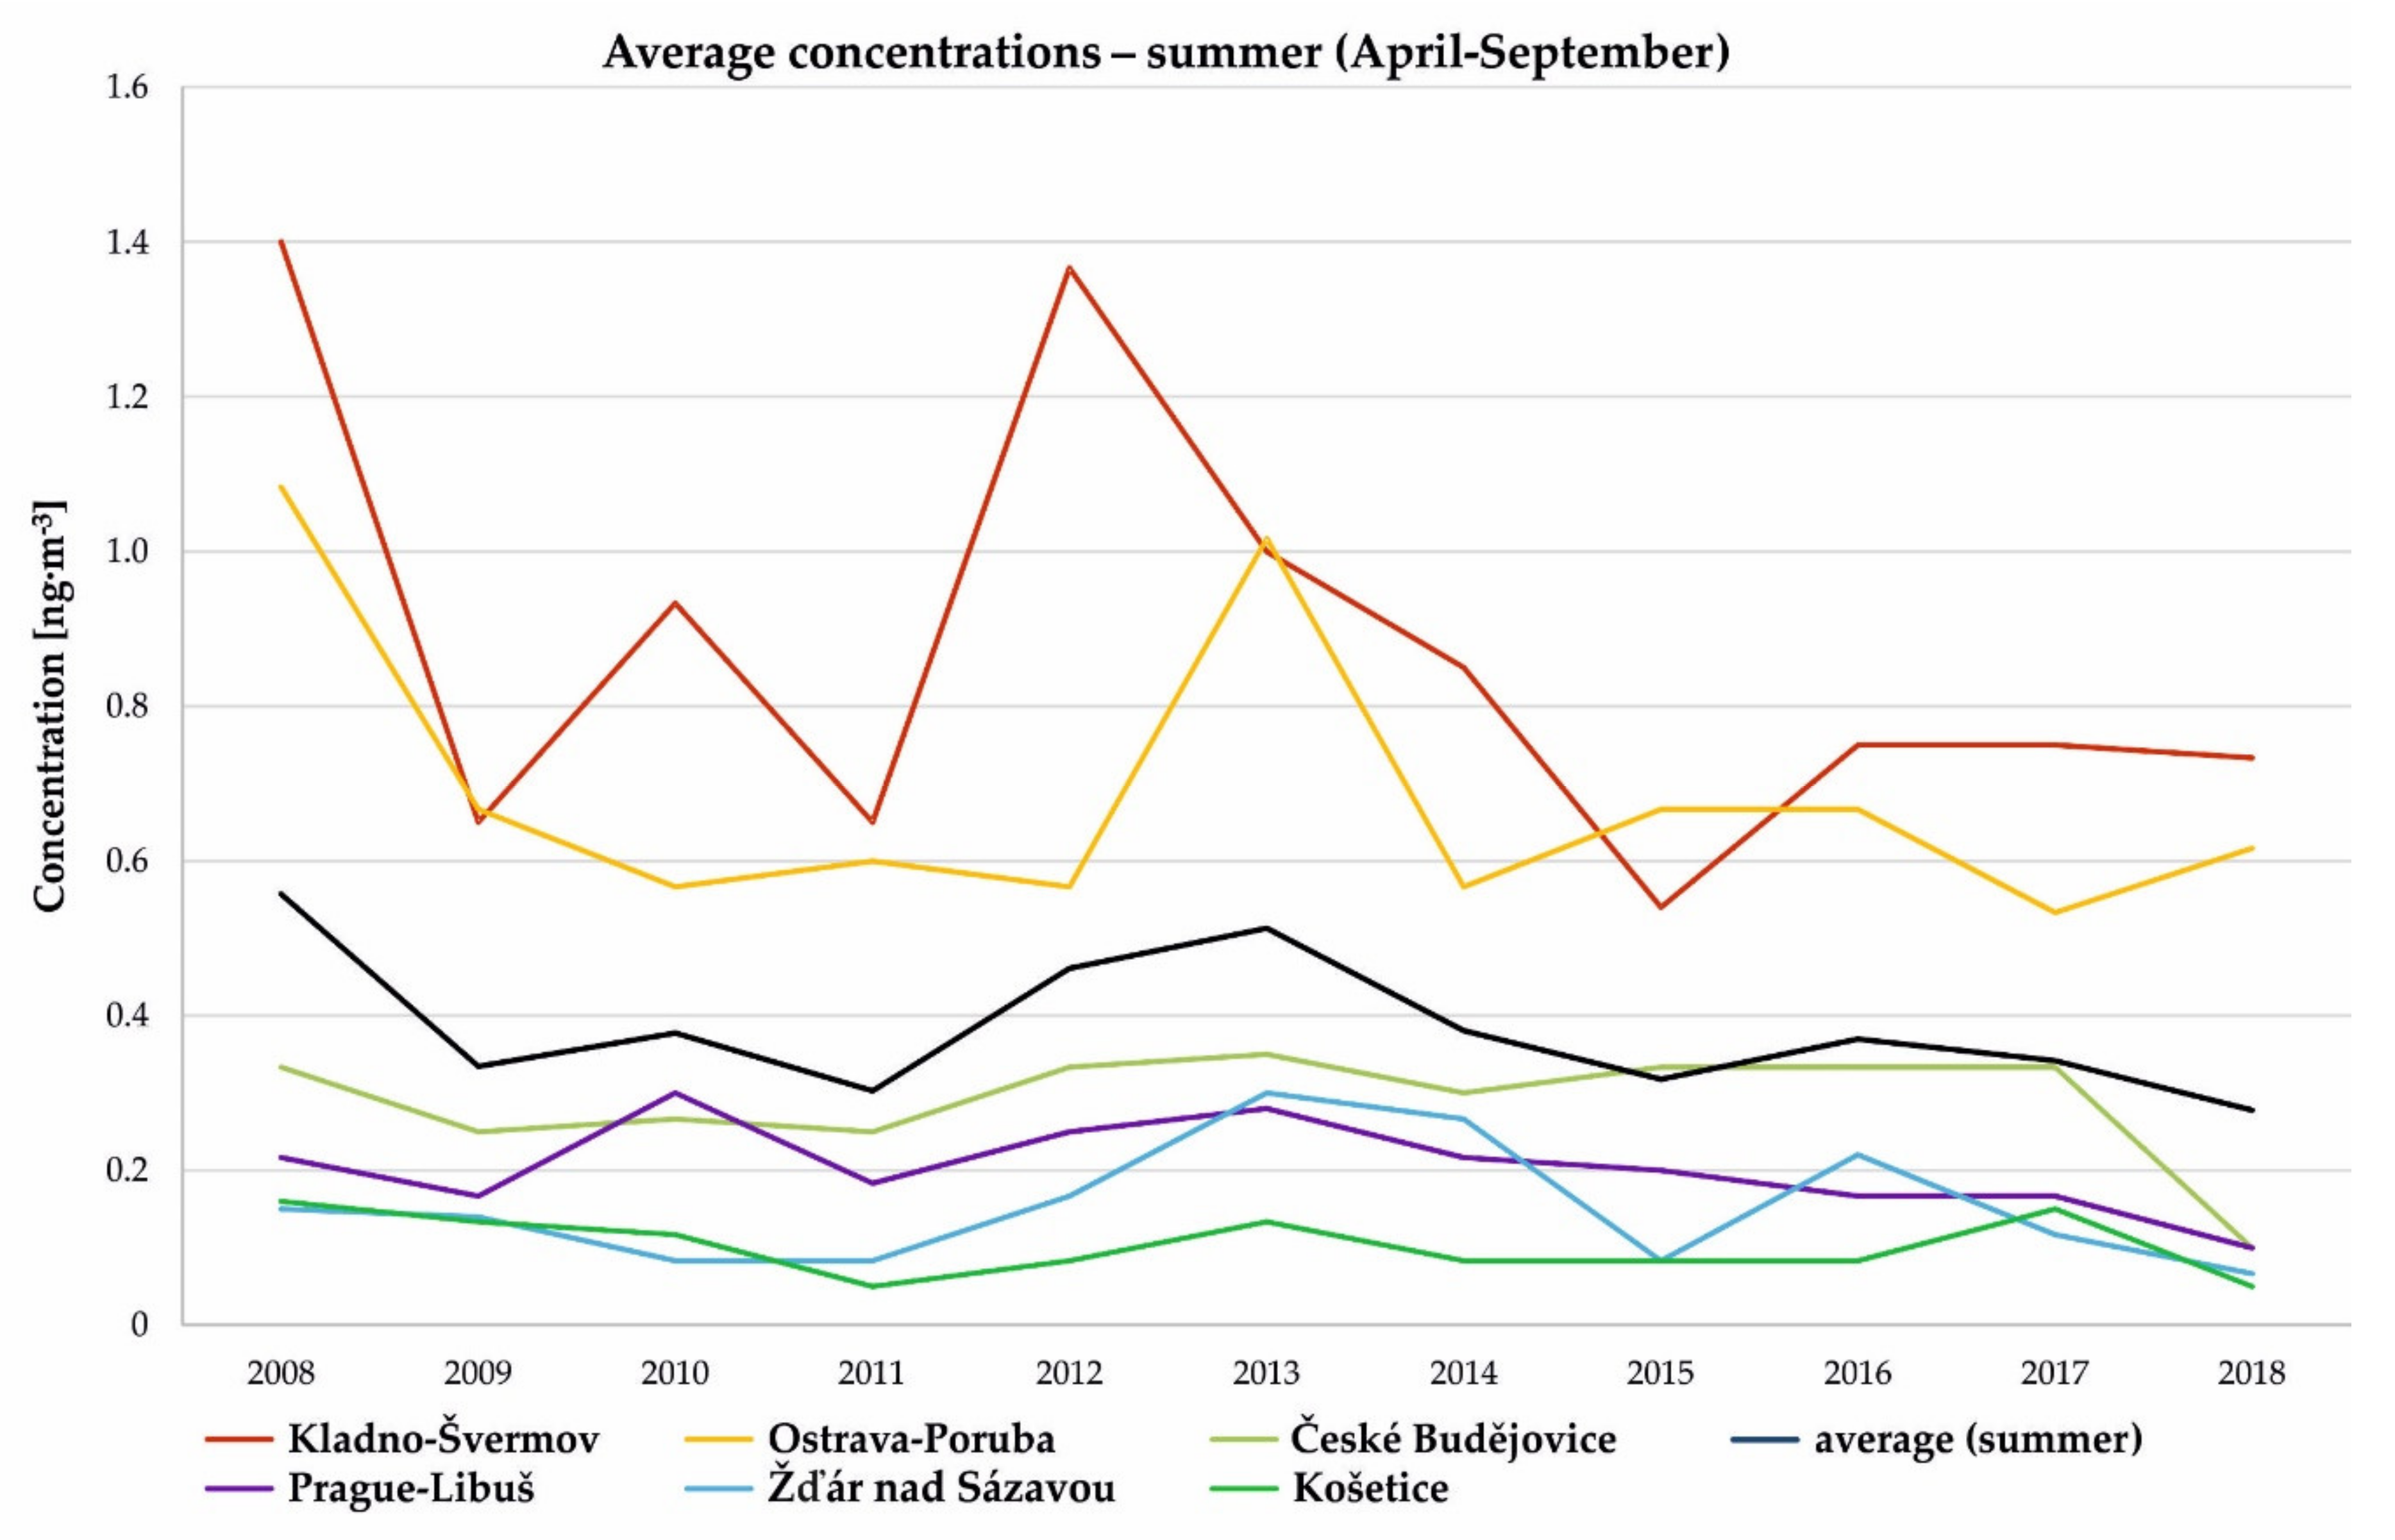
The decrease in concentrations in the Czech Republic is especially noticeable since 2014 highlighting the influence of milder winter seasons in 2014 and 2018, the prevailing good dispersion conditions in 2015−2018 and decreasing coal consumption in the last few years. The significant decrease at two particular stations (Ostrava-Poruba and Kladno-Švermov) that are among those with the highest concentrations in the Czech Republic (and of course those above target value BaP concentration for the whole study period) point also to the effect of improvements in local heating.
Similarly to other studies [26,55,56,57], the typical seasonal variation for the BaP concentration has been shown. The BaP concentrations for October–March are more than eight times higher than for April–September. For instance, Albuquerque et al. (2016) [28] found a December–January/June–August ratio of 5 for PAHs for the eleven year study in Porto. The reasons for this are generally known—i.e., seasonal sources as local heating, higher emissions from motor vehicles and less mixing in the atmosphere due to inversions [28,57,58]. During the warmer season, on the other hand, concentrations decrease due to unstable atmospheric conditions favorable towards dispersion, increased chemical and photochemical decomposition of PAHs due to higher levels of solar radiation and higher temperatures and of course also due to decreased emissions from anthropogenic sources [59,60,61].
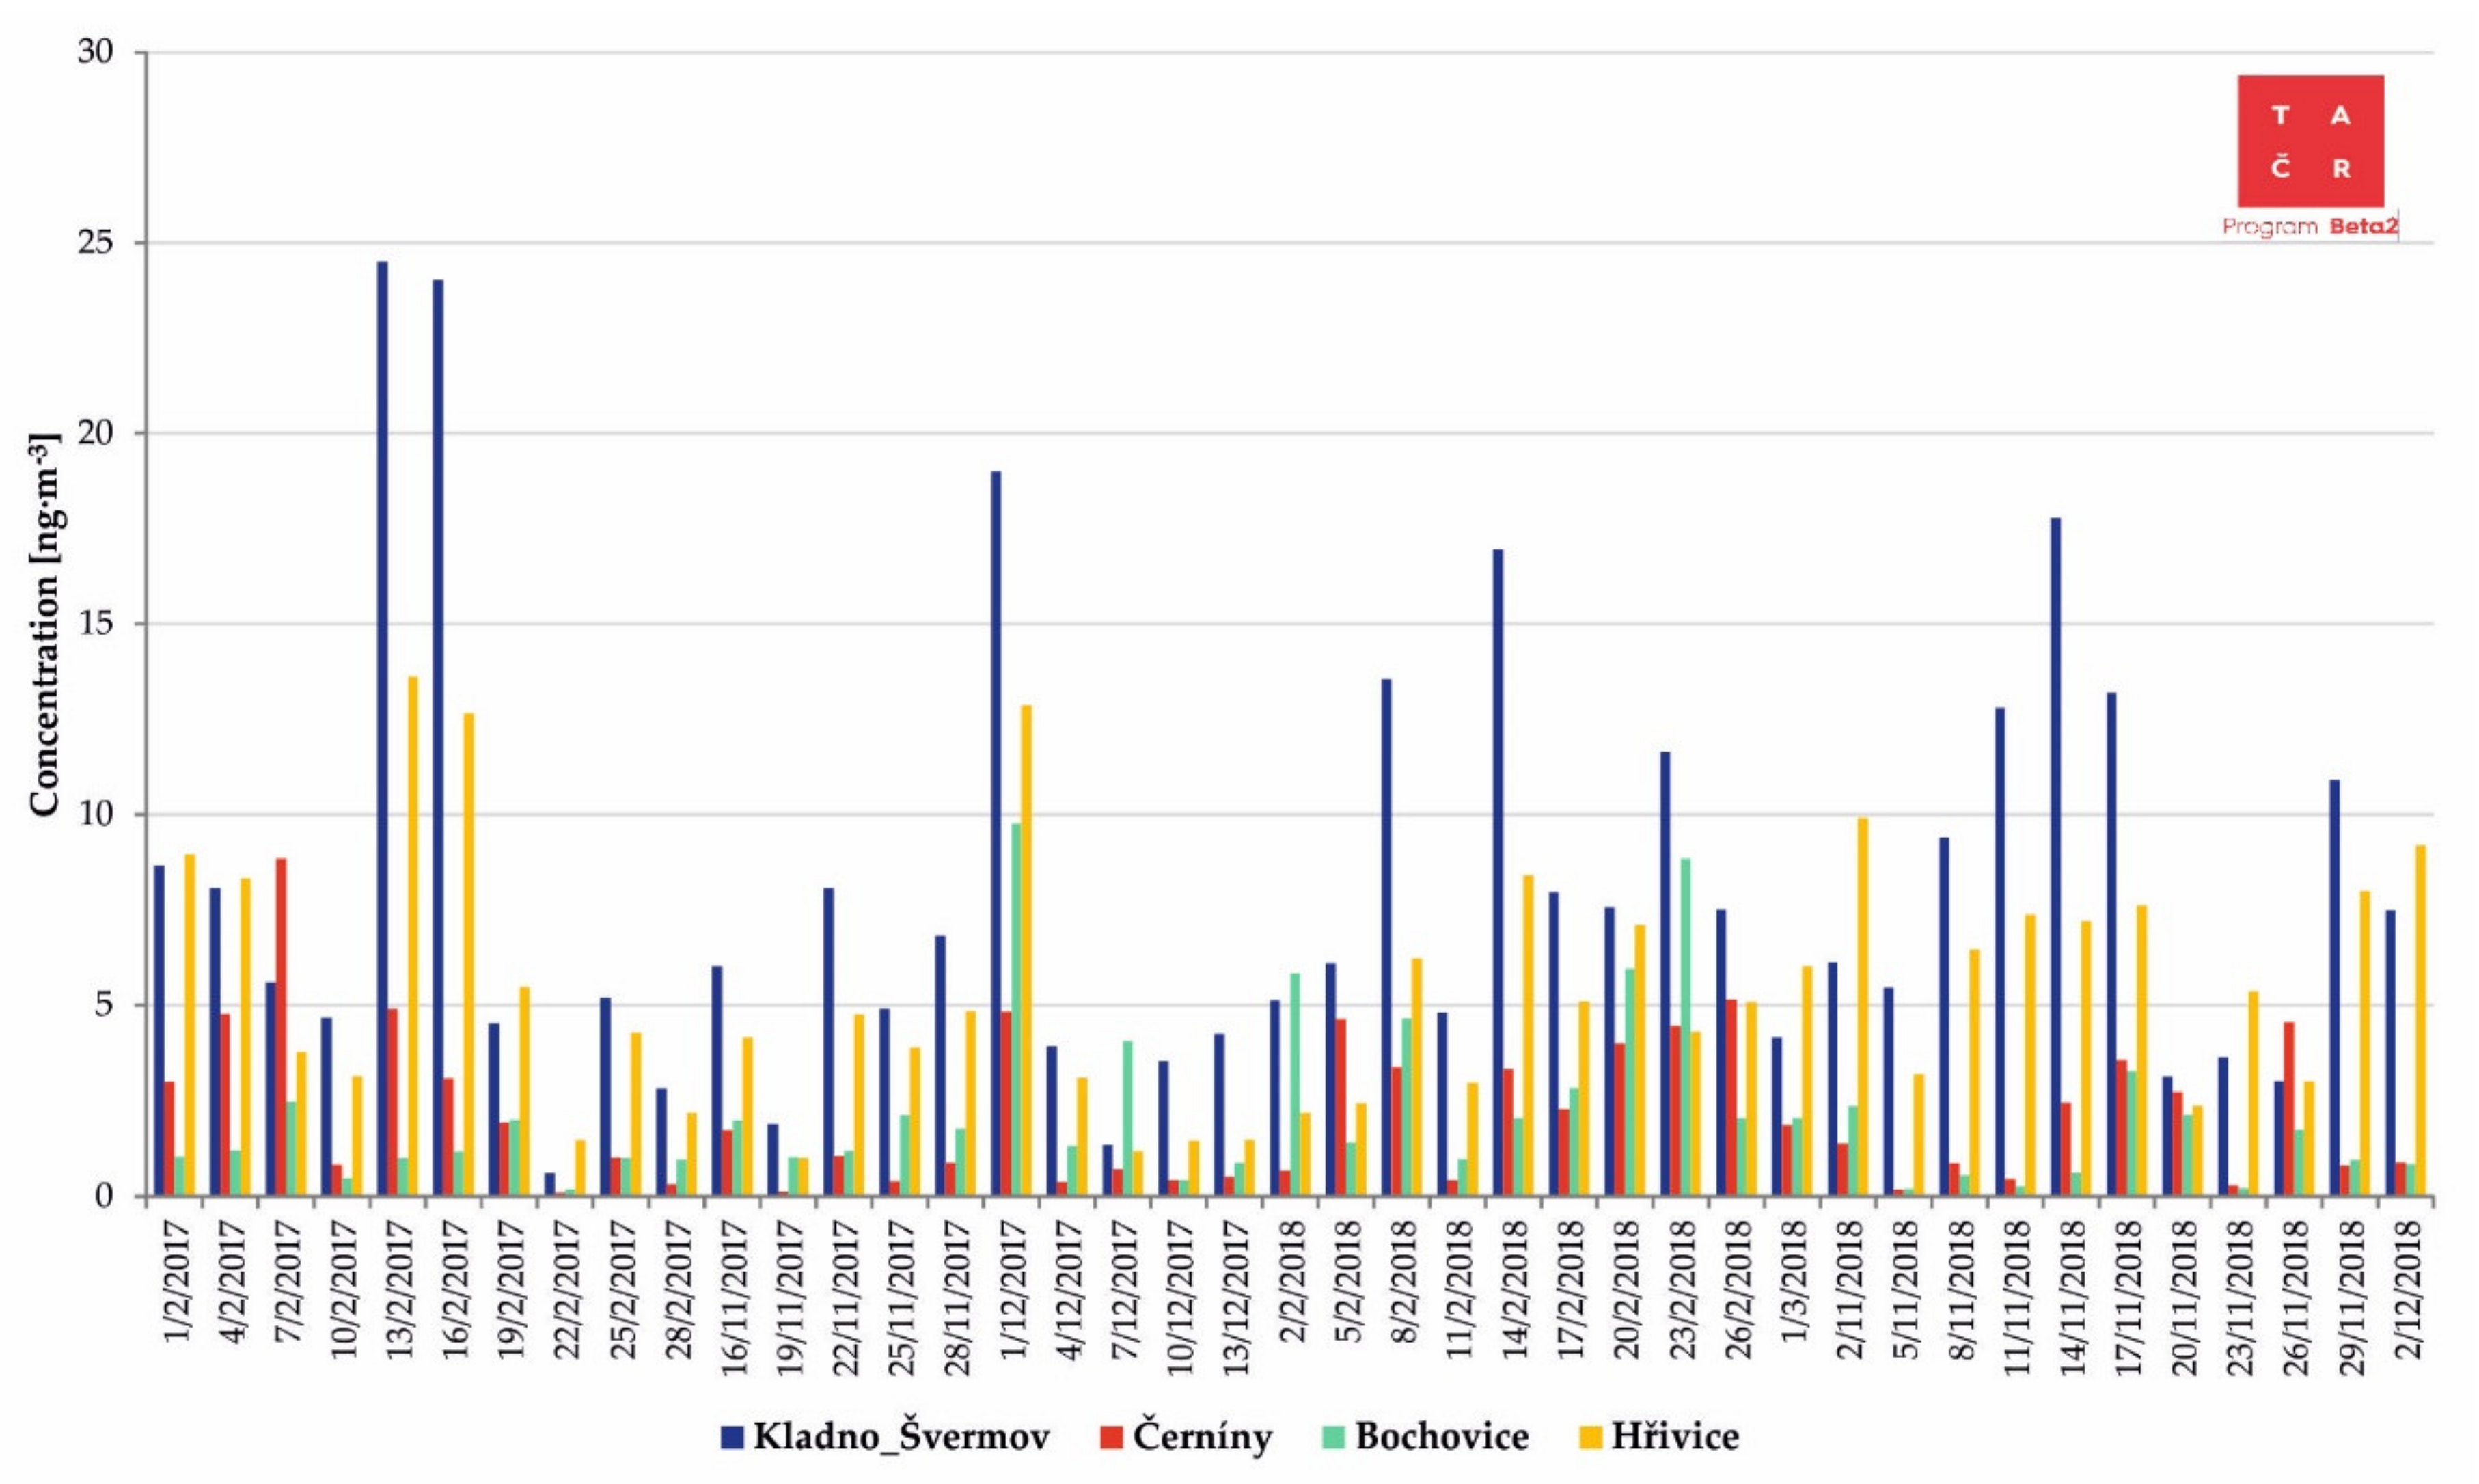
High values of daily BaP concentrations in winter months associated with local household heating were also recorded during the 2017–2018 campaign measurements in the small settlements of Bochovice, Černíny and Hřivice (Figure 7), where concentrations of BaP are not regularly monitored and where solid fuel heating predominates. The range of measured BaP concentrations was 0.1–8.0 ng·m−3 in Černíny, 0.2–9.8 ng·m−3 in Bochovice, and 1.0–13.6 ng·m−3 in Hřivice. In particular, measured BaP concentrations in the small settlement of Hřivice were as high as and on some days even higher than in Kladno–Švermov, where some of the highest concentrations of BaP in the Czech Republic were recorded. Every year, concentrations there reach high values and exceed the target value by almost four times. Such high levels of BaP concentrations are caused on the one hand by an extremely high density of buildings, which leads to a higher BaP emission density near the surface, and on the other hand by the fact that the town is located in a shallow valley, which leads to a reduction in dispersion of pollutants during cold days. The limited amount of winter season data obtained by the campaign measurements does not allow for a calculation of annual average concentrations. The target limit value of 1 ng·m−3 established by European legislation was exceeded in Bochovice, Černíny and Hřivice on 59%, 54% and almost 100% of measurement days, respectively. The measurements in these three small settlements with low–density population clearly indicates that emissions of BaP by local heating influence the short-term BaP concentration in the surroundings. Local meteorological conditions, orography of the populated area and regional and transboundary long-range transport are further factors which influence the ambient air concentration of BaP. In the Czech Republic, due to the rugged terrain, a number of settlements are located in valleys, where there may be a frequent deterioration of dispersion conditions and thus an increase in pollutant concentrations.
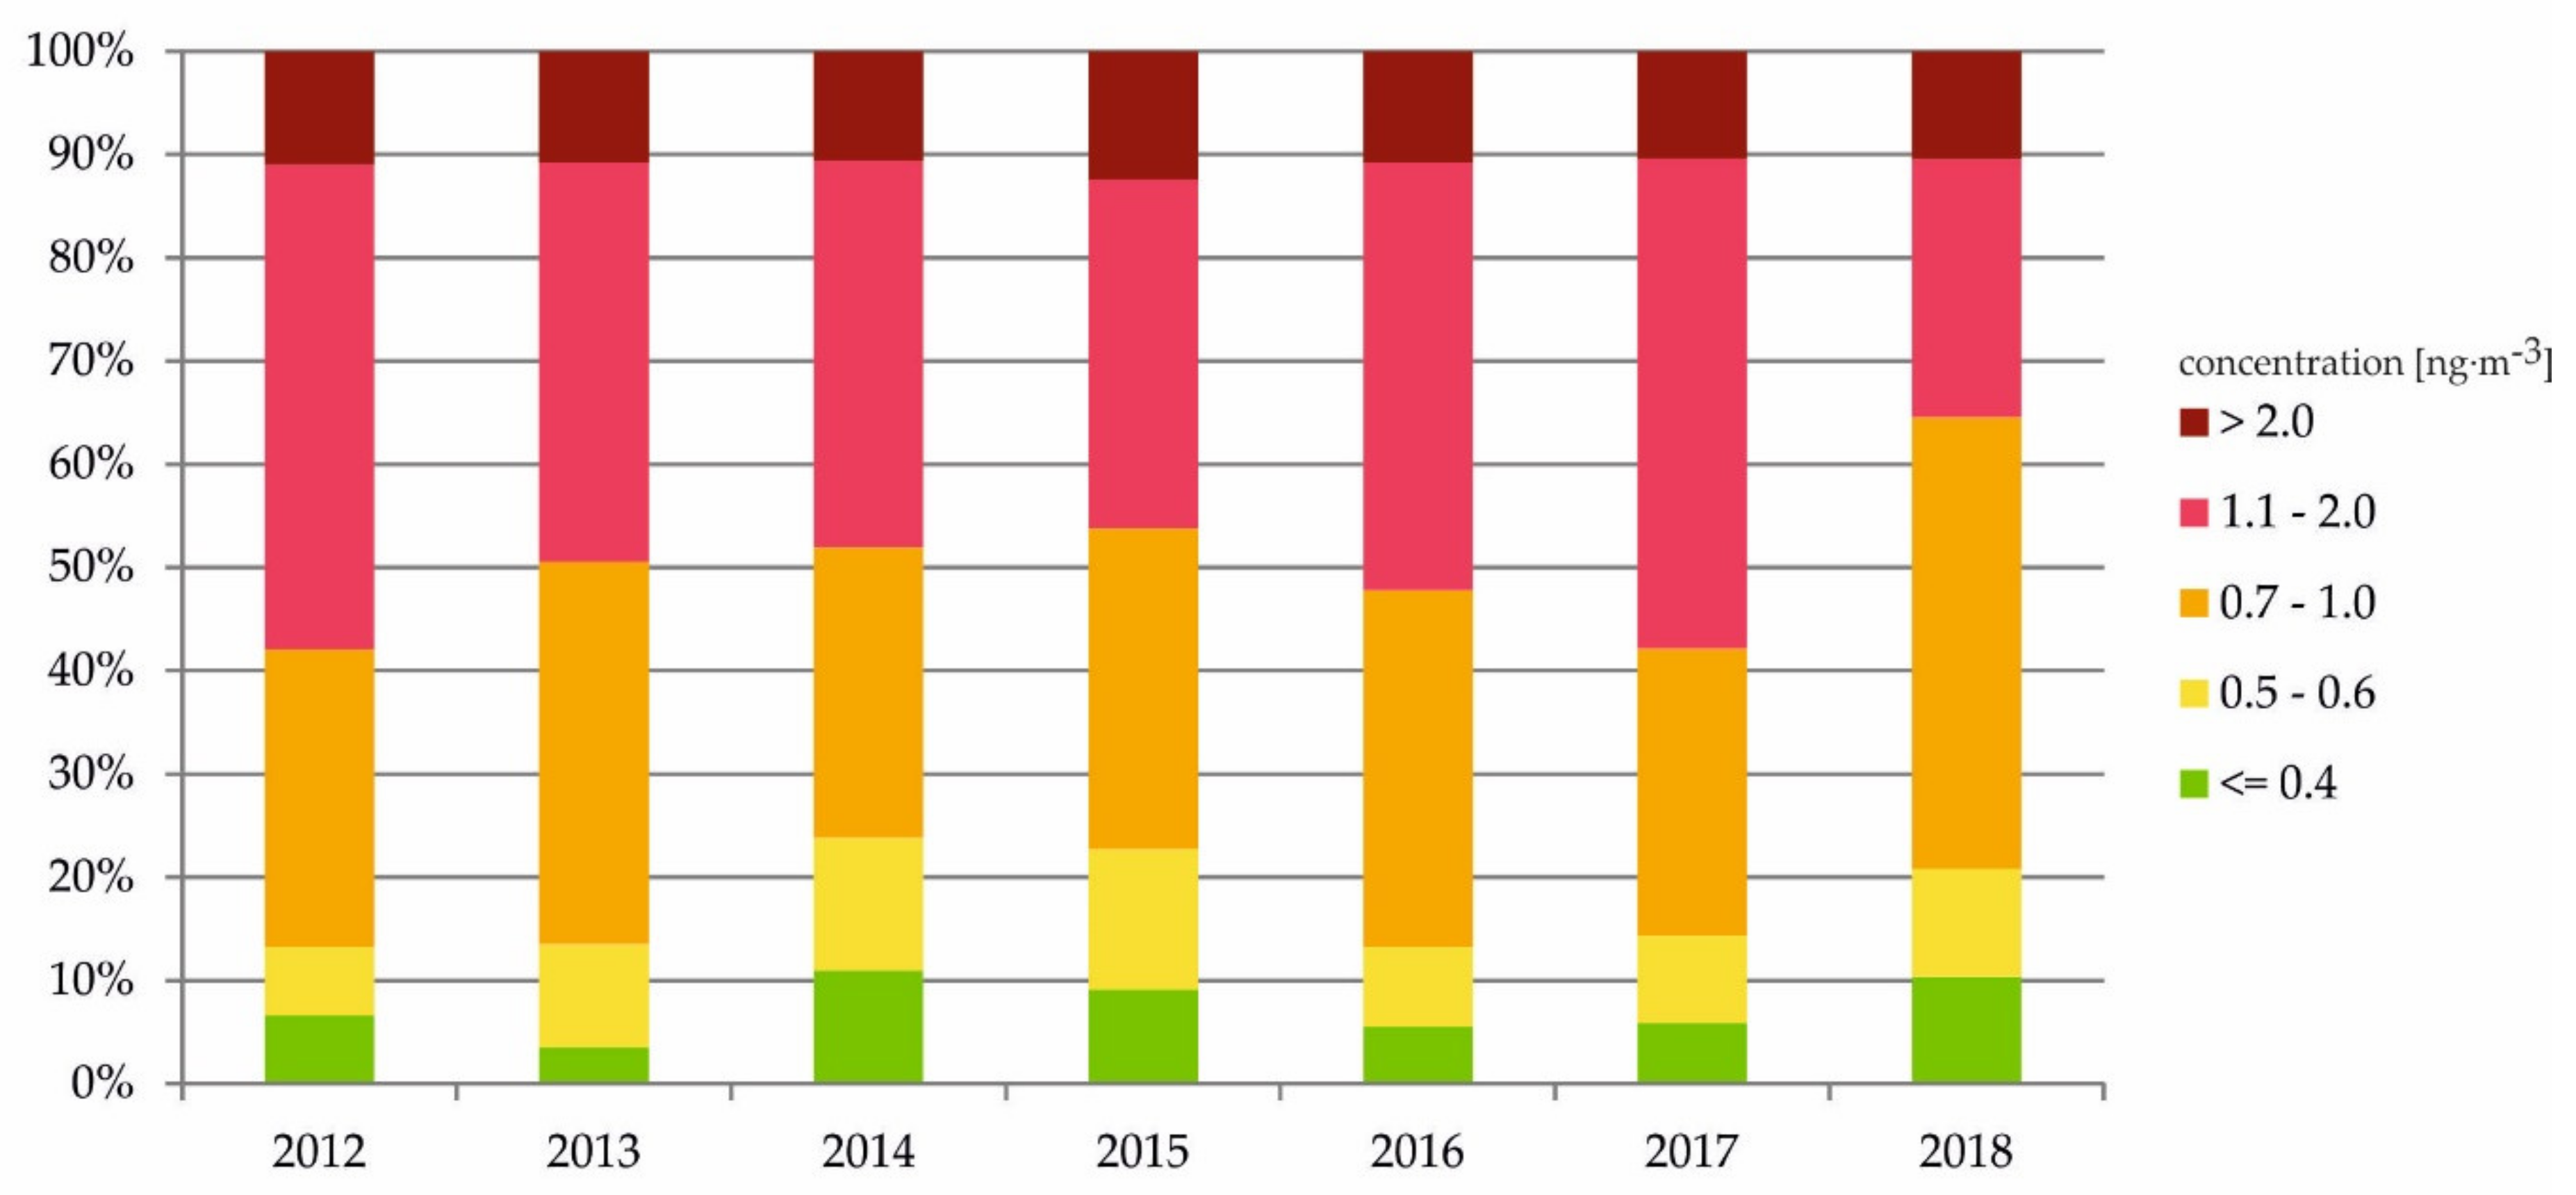
The reference level established for BaP by the WHO of 0.12 ng·m−3 was exceeded at all monitoring sites each year. The target value of 1 ng·m−3 is set by a European directive (EU, 2004) with the aim of avoiding, preventing, or reducing harmful effects on human health and/or the environment as a whole. During the period of 2012–2018, 35–58% of the urban population in the Czech Republic was found to be exposed to BaP concentrations exceeding the above mentioned target value. The lowest number of inhabitants living in the above-target areas was estimated to be in 2018. The highest number of inhabitants (58%) exposed to above-target concentrations of BaP was estimated for the years 2012 and 2017. On average, only 7% of the population lived in the areas with the lowest concentration of BaP between 2012 and 2018. BaP is carcinogenic to humans and has been considered a good indicator for the assessment of risk to human health associated with exposure from PAHs found in the environment. The individual carcinogenic potencies of PAH in relation to BaP can be expressed through the BaP equivalent concentrations (BaP eq.) and evaluation of BaP alone will probably underestimate the carcinogenic potential of the PAHs mixtures [28,62]. The uncertainty of the map is a result of the inadequate number of measurements at rural regional stations and the absence of more extensive measurements in smaller settlements in the Czech Republic, where the air pollution by BaP would demonstrate the fundamental effect of local heating units. In addition, the maps are prepared with a resolution of 1 × 1 km and therefore cannot take into account the local fragmentation of the terrain, which in the case of settlements located in valleys affects the levels of pollutants [63]. Thus, assessment of the interannual changes in the territory affected and population exposed to above-limit concentrations of BaP will also be accompanied by a greater margin of error.

5. Conclusions

A complex analysis of air pollution from BaP in the Czech Republic was carried out. Ambient air BaP concentrations and their long-term trends were studied to assess the level of BaP in the Czech Republic. The calculated emissions of BaP and modeling of the transboundary contribution to the annual mean concentrations of BaP were quantified to present the causes of BaP air pollution.
The measured concentrations of BaP are high due to high emission load from the combination of local heating and heavy industry in the Czech Republic. The residential sector is responsible for more than 98.8% of BaP emissions.
Many people (50% on average) in the Czech Republic live in the area where the BaP concentrations are above the target value set by a European directive with the aim of avoiding, preventing, or reducing harmful effects on human health and/or the environment as a whole.
On the basis of the observations in small settlements described above, where BaP concentrations are not regularly monitored and where solid fuel heating predominates, it can be assumed that in small settlements, carcinogenic BaP levels may reach high levels in the short-term. Above-target values where BaP is not routinely measured can also be expected in similar municipalities with a high proportion of local heating using solid fuels. Consequently, the fraction of people living in the above-target value areas will be higher than presented.
Due to the high number of small municipalities and particularly due to the high costs for laboratory analyses and limited capacity of the laboratories, the number of measurement locations will always be limited, and therefore it is desirable to specify in more detail data on emissions and to provide substantial support to modeling.
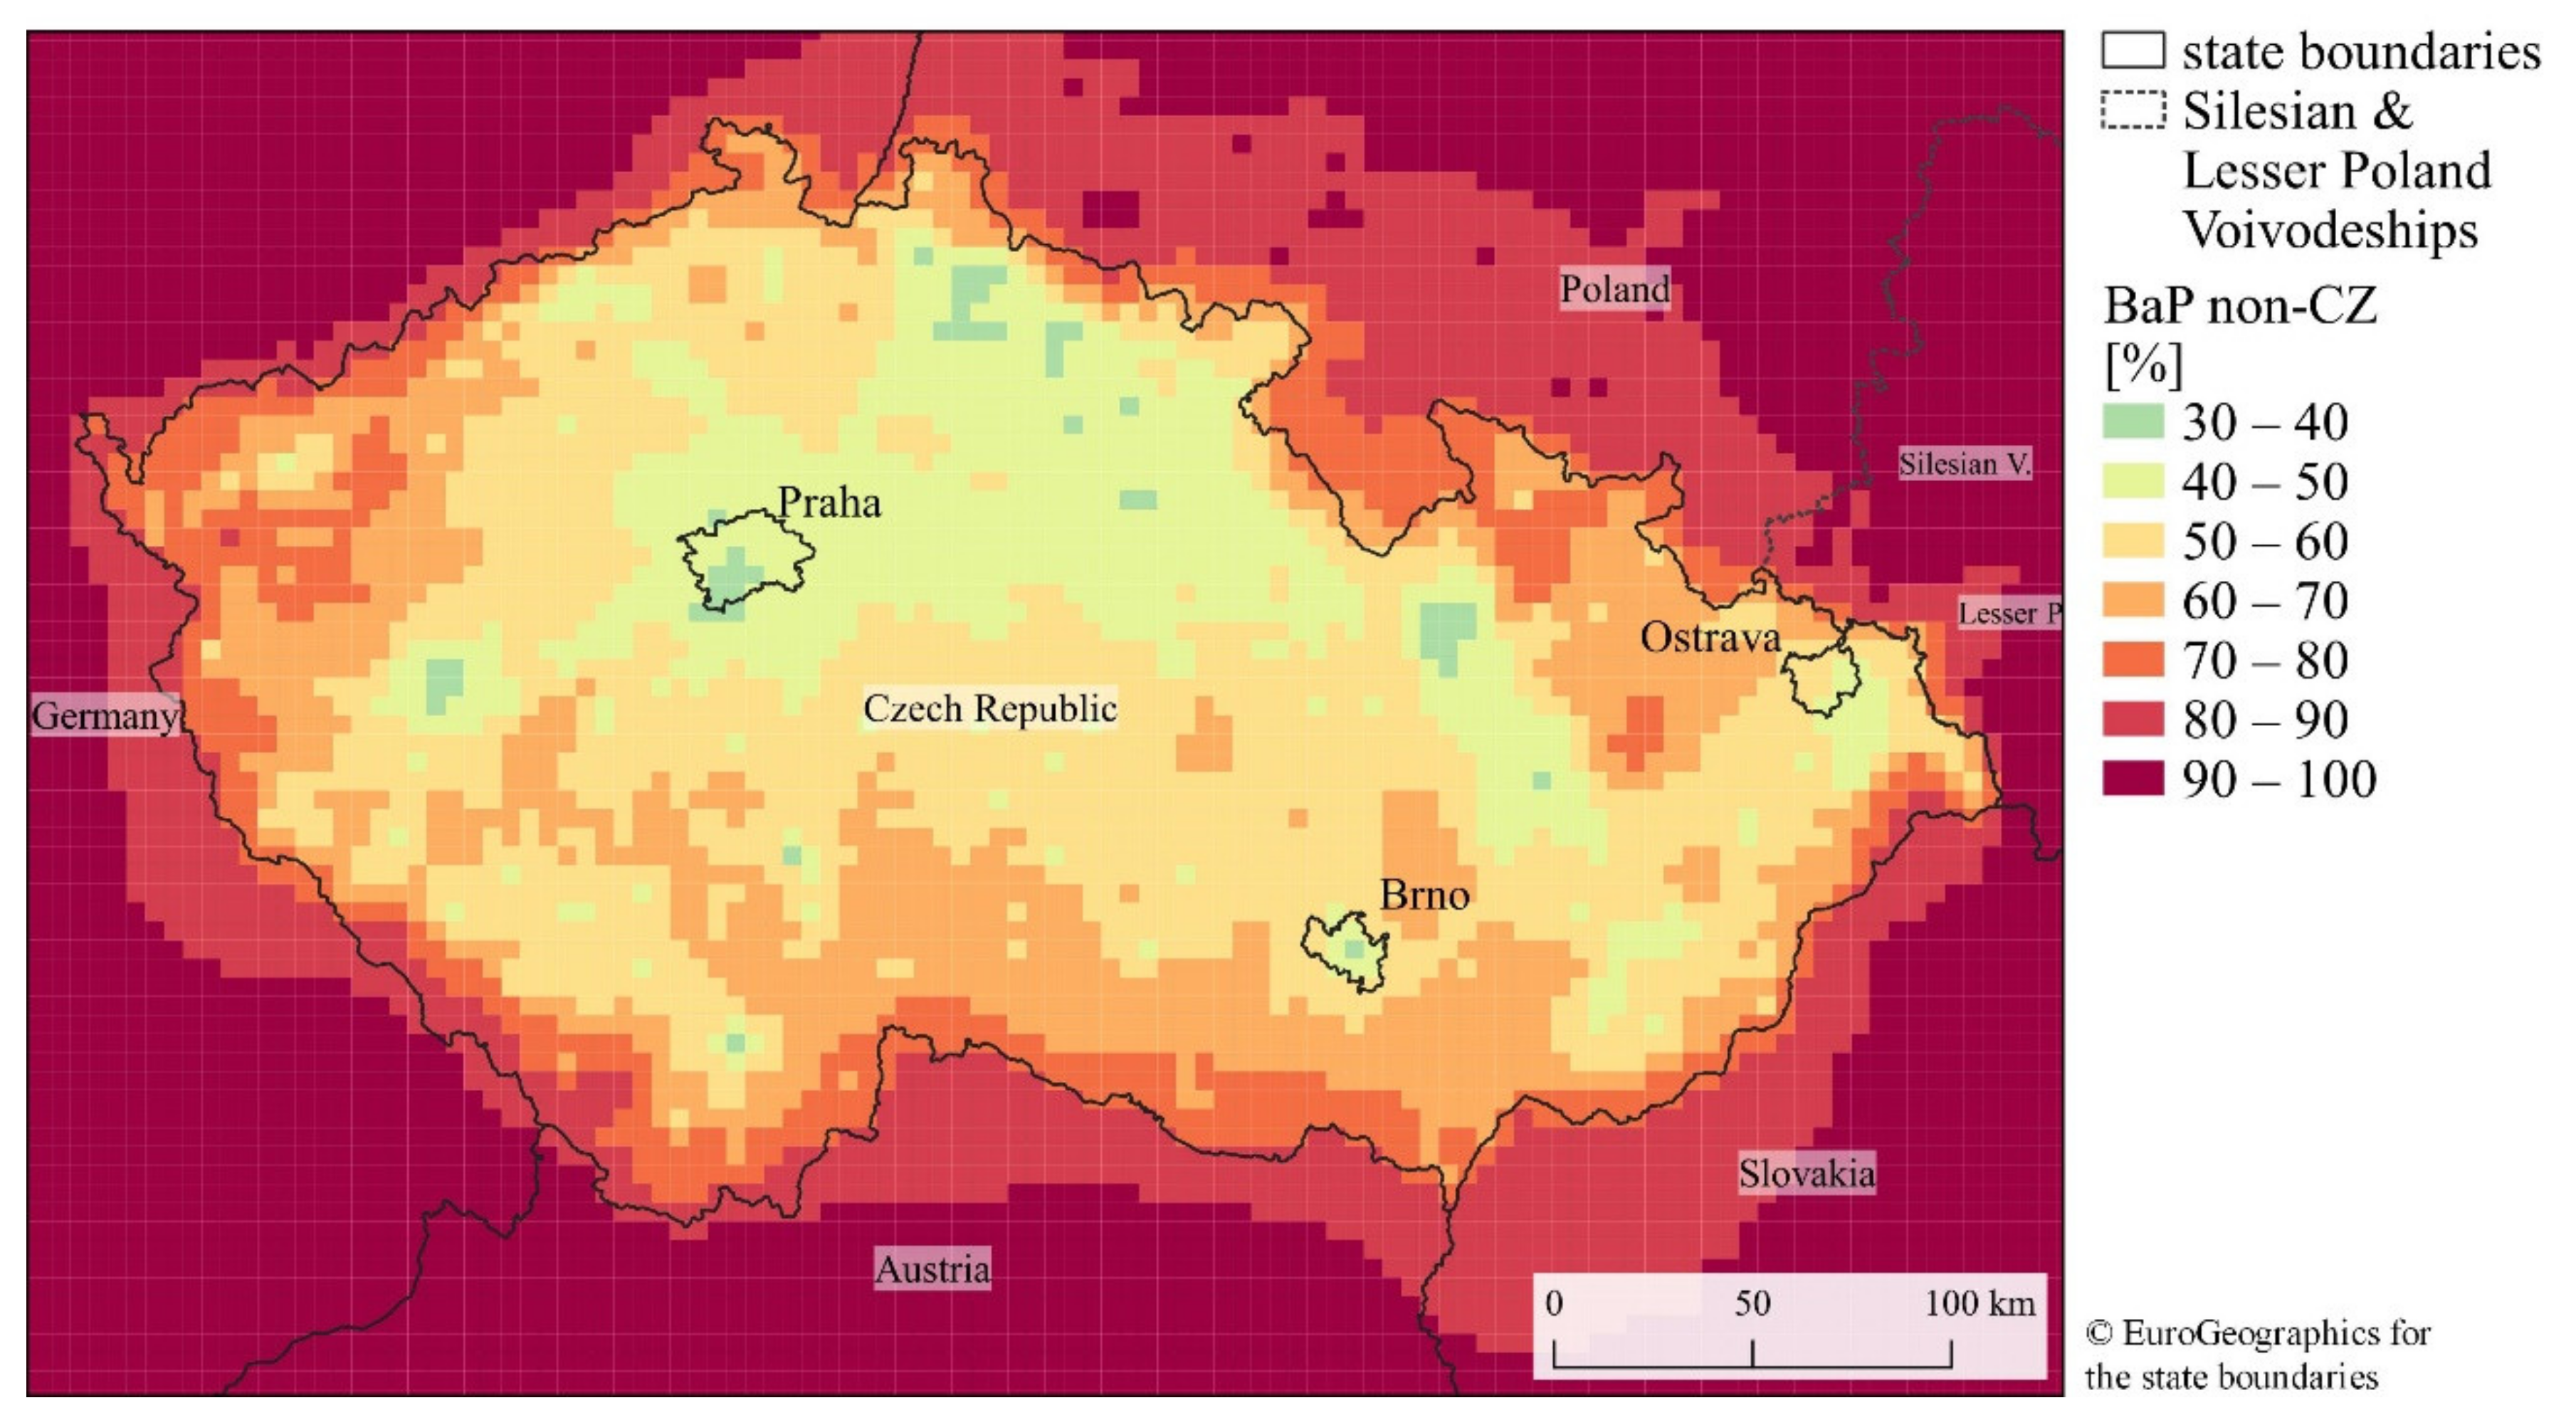
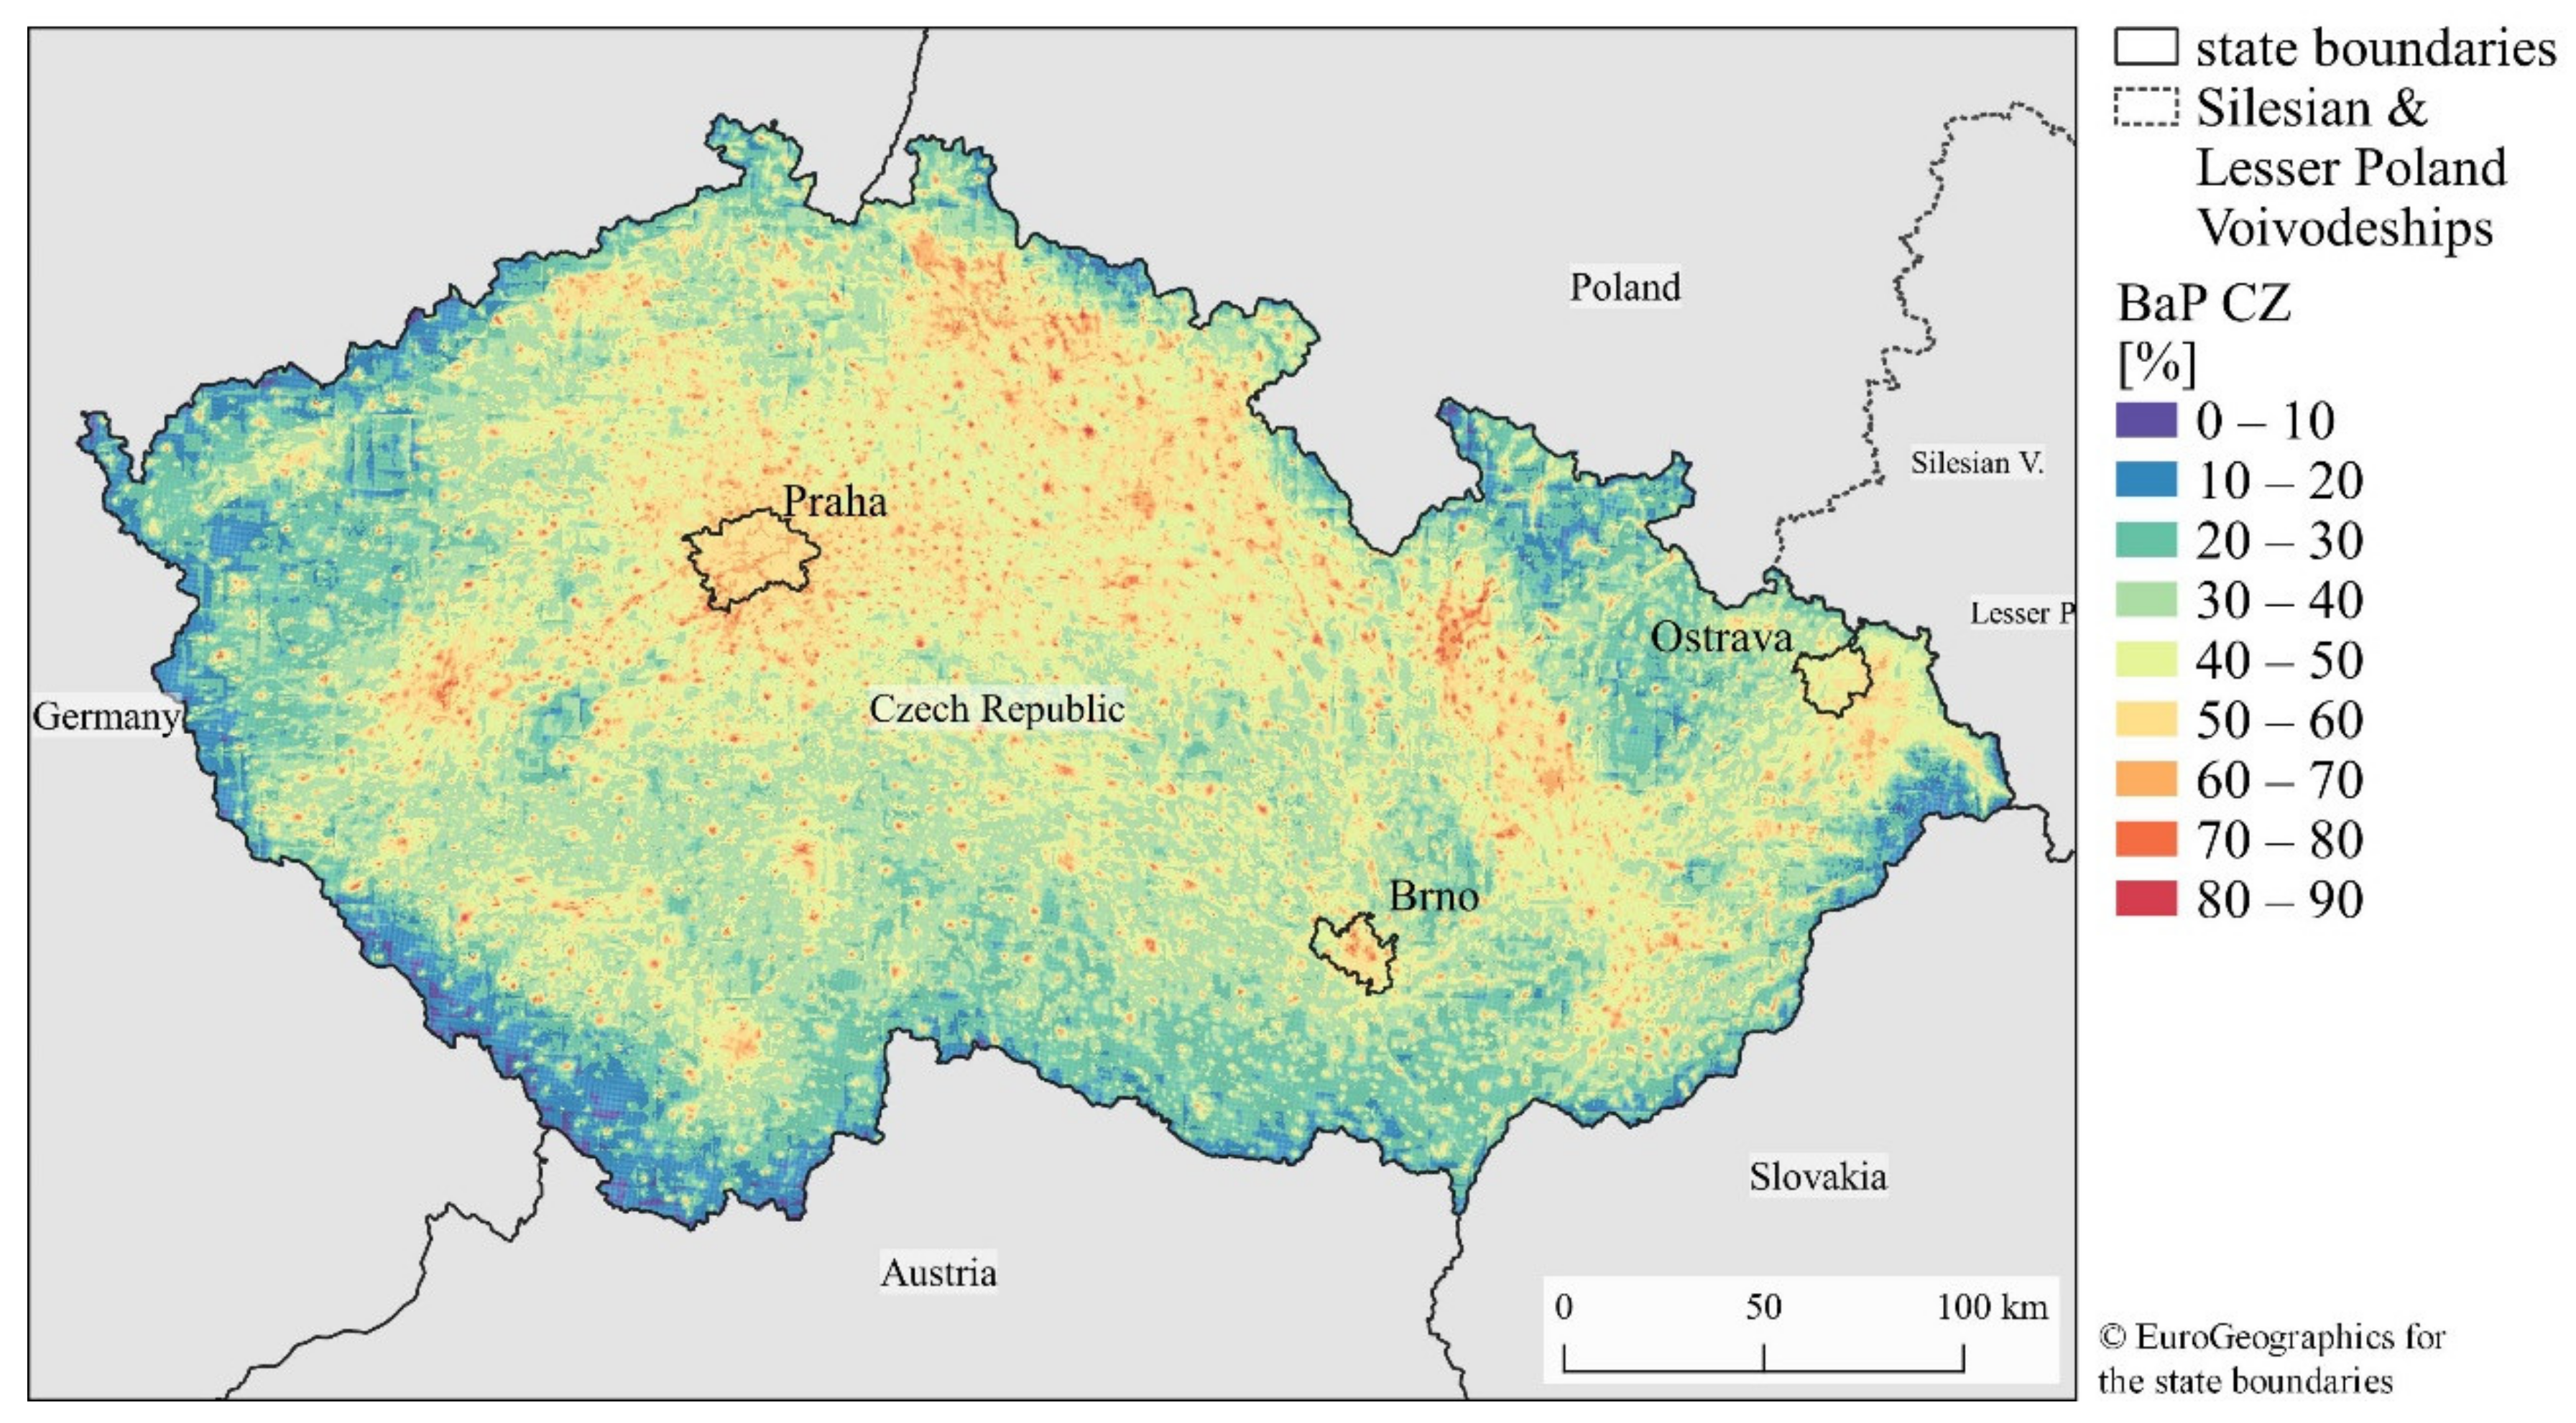
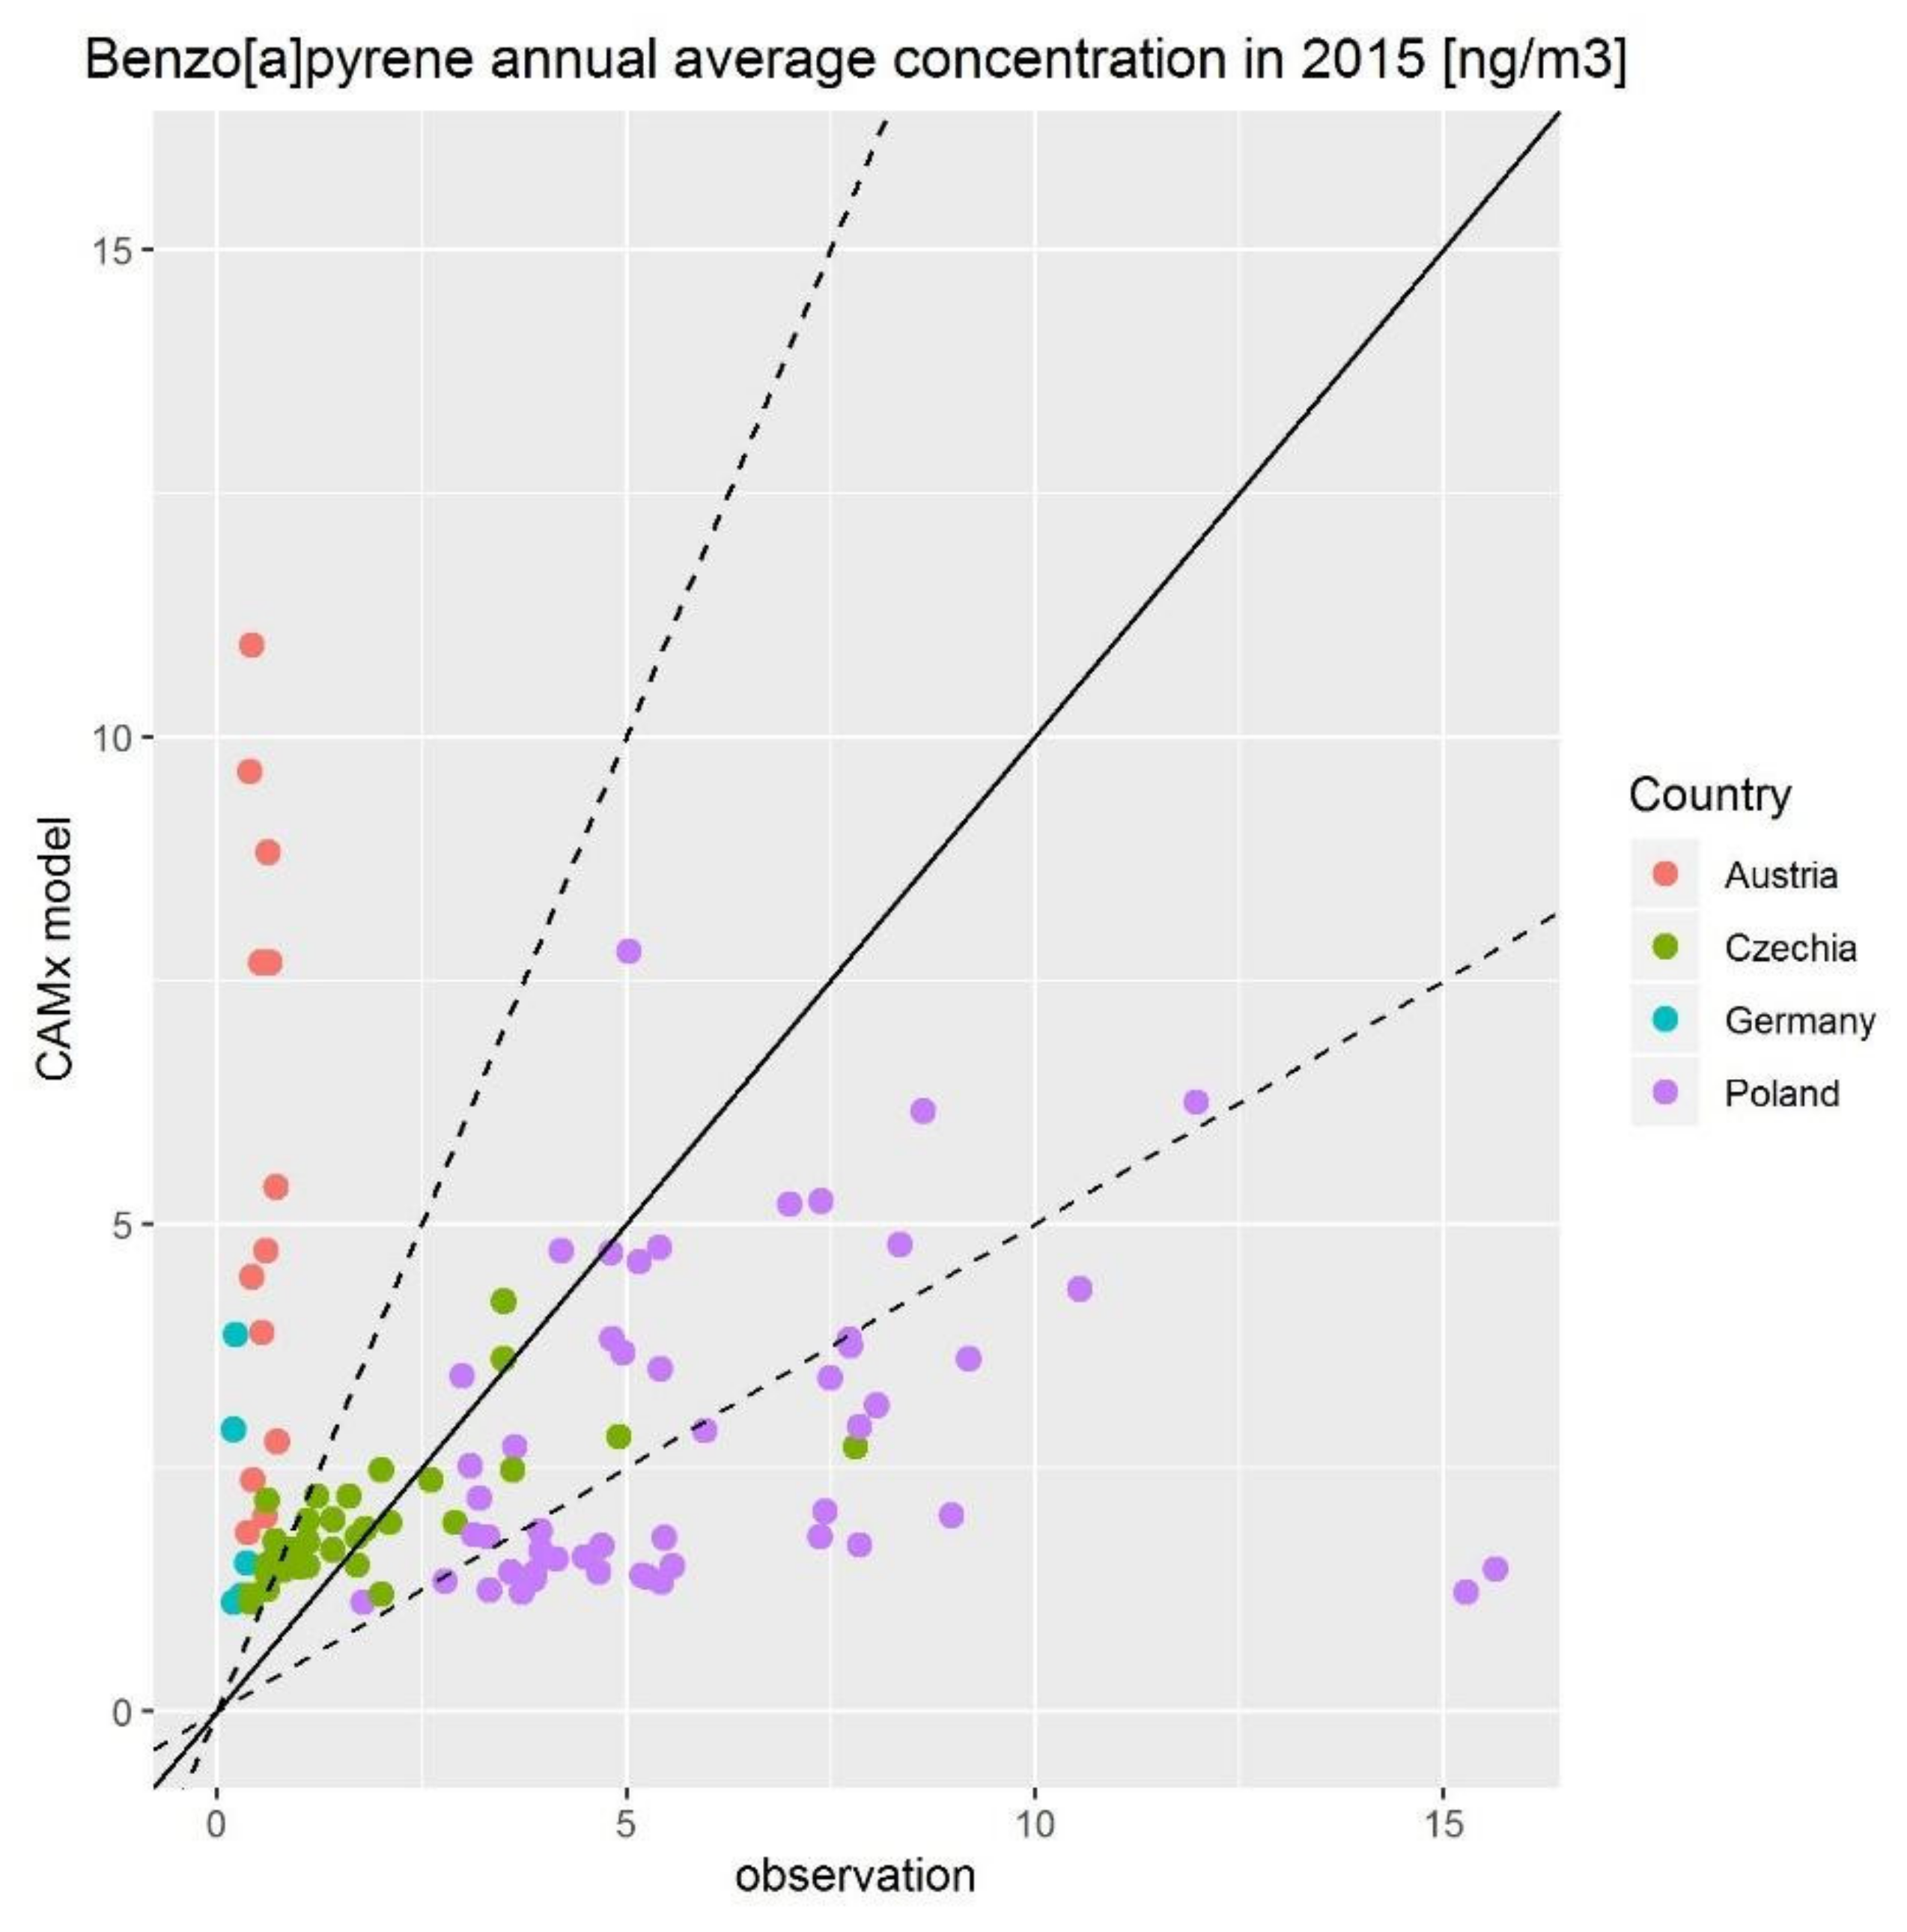
The transboundary contribution to annual average concentration was estimated to be between 46% and 70% for most (80%) of the territory of the Czech Republic. The contribution of Czech sources can exceed 80% in residential heating hot spots. Results are nevertheless subject to limitations of the modeling approach used—it is likely that the transboundary contribution to BaP concentrations in the Czech Republic was overestimated by a factor of 1.5. Apart from residential heating, two other categories of Czech sources with relative contribution to annual local average concentration exceeding 10% were identified: road transport (large cities and vicinity of major roads) and coke oven plants in the Ostrava agglomeration.
The typical seasonal variation for the BaP concentrations has been shown. The BaP concentrations for selected air quality monitoring stations for October–March were more than eight times higher than for April–September. This is in line with the composition of emission sources in the Czech Republic, with the dominance of the local heating sector and with the different influence of meteorological and dispersion conditions in the colder and warmer parts of the year connected with the atmospheric stability and chemical properties of BaP.
We found significant decreasing trends for average concentrations and winter average concentrations. No correlation between background BaP concentration and emission was found. BaP concentration development in the Czech Republic has been influenced by the combined effect of total emission, meteorological and dispersion conditions and transboundary contributions.
The significant decrease at two particular stations belonging to those with the highest concentrations in the Czech Republic also point out the effect of improvements in local heating infrastructure. To conclude, even assuming generally good dispersion conditions and milder winter seasons in future, a significant reduction of BaP emissions is needed to reach the target value for BaP in the Czech Republic.

Author Contributions

Conceptualization, M.S. and L.V.; formal analysis, M.S., L.V., O.V. and J.Š.; writing—original draft preparation, M.S., L.V., O.V. and J.Š.; writing—review and editing M.S., L.V., O.V., J.Š., J.H., J.B.; visualization, M.S., L.V., O.V. and J.Š.; supervision, M.S. All authors have read and agreed to the published version of the manuscript.

Funding

The presented BaP concentrations in small settlements Bochovice, Černíny and Hřivice were measured within the project “TITSMZP704—Measurement and Analysis of Air Pollution with Emphasis on the Evaluation of the Share of Individual Groups of Sources” funded with the state support of the Technology Agency of the Czech Republic under the BETA2 Programme. BaP emissions for regions outside the Czech Republic used for dispersion modeling were prepared within the project LIFE-IP MAŁOPOLSKA—Implementation of Air Quality Plan for Małopolska Region—Małopolska in Healthy Atmosphere (LIFE14 IPE/PL/000021).

Acknowledgments

The authors want to thank all colleagues from CHMI who participate in the measurement and processing of air quality data. We would also like to thank Alexey Gusev and Victor Shatalov from EMEP/MSC-E for providing BaP modeling results and for commenting on the text.

Conflicts of Interest

The authors declare that there is no conflict of interest regarding the publication of this paper.

Appendix A

Table A1. Specification of monitoring stations of BaP with annual average concentration in 2018.
Name StationClassificationLongitudeLatitudeAltitudeAverage [ng·m−3]
Brandýs n. LabemB/S/R14.66045550.1897991791.6
Brno-LíšeňB/U/R16.67802549.2132123400.6
Brno-MasnáB/U/CR16.62749.1888332140.5
Č.Budějovice-Antala StaškaB/S/R14.46991648.9519013861.1
Čes. Budějovice-Třešň.B/U/R14.50879248.965906410NA
Český TěšínB/U/R18.60972649.7489582853.9
DoksanyB/R/NA-NCI14.17016250.4588531581.3
Havl.Brod-Smetan.nám.B/U/R15.57738949.606417413NA
HodonínB/U/R17.13138948.8572781700.8
Hr.Král.-Sukovy sadyT/U/RCI15.81414950.211702233NA
Hradec Králové - tř. SNPB/U/R15.85700650.2185332321
Jihlava-ZnojemskáT/U/R15.59127849.3924445000.6
Karviná-ZÚT/U/R18.55777849.8588912513
Kladno-ŠvermovB/U/RI14.10604850.1674122193.5
Klatovy soudT/U/R13.28692349.400608394NA
KošeticeB/R/AN-REG15.08027849.5733945350.4
Kralupy nad Vltavou-sportovištěI/U/RCI14.31658350.251417175NA
KuchařoviceB/R/A-NCI16.08581748.8813553340.5
Liberec RochliceB/U/R15.06996750.75514221
Olomouc-HejčínB/U/R17.23807349.6014622241.3
Olomouc-ŠmeralovaB/U/R17.26616749.5929172201
Ostrava-HrabováI/S/RI18.27880649.7786112333.7
Ostrava-KunčičkyI/S/RI18.292549.8096942123.4
Ostrava-Mariánské HoryI/U/IR18.26365549.824862252
Ostrava-Poruba, DDT/U/R18.16522249.8354722822.3
Ostrava-Poruba/ČHMÚB/S/R18.15927649.8252952422.9
Ostrava-PřívozI/U/IR18.26974149.8562592074.7
Ostrava-Radvanice OZOB/S/R18.34038949.8185562584.7
Ostrava-Radvanice ZÚI/S/IR18.33913949.8070572507.7
Pardubice DuklaB/U/R15.76354950.0240382390.9
PelhřimovB/S/R15.20833349.435528NA
Plzeň-RoudnáB/U/R13.38161449.761788337NA
Plzeň-SlovanyT/U/RC13.40231349.7324433401.1
Praha 10-ŠrobárovaB/U/RC14.47266150.075152380.7
Praha 2-Riegrovy sadyB/U/NR14.44269250.0814832560.7
Praha 4-LibušB/S/R14.44593350.0073043010.8
Praha 5-ŘeporyjeB/S/RA14.30951750.030419321NA
Rožďalovice-RuskáB/R/A-NCI15.17830350.3019841981
StudénkaB/R/A-NCI18.08930649.7209362312.8
TepliceB/U/R13.8512550.6452782570.9
Třinec-KonskáI/S/IRA18.65006149.7024273183.1
Třinec-NeboryB/S/RNI18.62841549.6837143312.4
Ústí n. L.-Prokopa DivišeI/U/RCI14.03124350.662979155NA
Ústí n.L.-KočkovB/S/RN14.04119550.6835243670.5
Valašské MeziříčíB/U/R17.96697649.4720592902.2
VratimovI/S/RI18.31847249.7698062614
ZlínB/S/RN17.66717549.2329052581.2
Ždár nad SázavouB/U/RC15.94149.5645565690.6
NA—not available data for annual average calculation.

Appendix B

Table A2. Fuel consumption in residential sector 2008–2018.
Fuel TypeFuel Consumption [TJ/year]
20082009201020112012201320142015201620172018
Brown coal27,70728,96730,75633,46630,51633,20927,82227,21626,79428,72425,043
Briquettess33074245412126282924294424702411237130623241
Hard coal22752659796162129748869285159332914793188985
Coke67611021018872916870873882865889825
Wood—dry30,61432,43833,33534,32035,75637,14037,87238,42538,74639,33641,039
Wood–wet25,61527,14127,89128,71629,91831,07631,68832,15132,41932,91234,338
Bio-briquettess476857115611971333146917001700204022101918
Pellets39147679985085093510201122119013601530
Natural gas85,78986,80399,74583,83784,71384,99068,87374,91983,47183,92478,663
LPG14241195105713781930170019761976197619762205
Total178,273185,883207,837193,475198,604203,026182,809190,133199,019203,710197,787
Source: CZSO [13].
Table A3. Emission factors of BaP for local heating at nominal heat output.
Fuel TypeOver-Fire Boilers [mg/GJ]Under-Fire Boilers [mg/GJ]Automatic Boilers [mg/GJ]Gasification Boilers [mg/GJ]Stoves [mg/GJ]−[mg/GJ]Reference
Brown coal384.6124.40.10.7384.6 [64]
Briquettess106.621.80.10.7106.6 [64]
Hard coal316.2186.00.139.2316.2 [64]
Coke316.2186.00.139.2316.2 [64]
Wood—dry92.168.00.217.592.1 [64]
Wood—wet230.668.00.22.9230.6 [64]
Bio-briquettess92.168.00.217.592.1 [64]
Pellets92.168.00.217.592.1 [64]
Natural gas 0.00056[17]
Fuel oil 0.08[17]
Table A4. Emission factors of BaP for local heating at lower heat output.
Fuel TypeOver-Fire Boilers [mg/GJ]Under-Fire Boilers [mg/GJ]Automatic Boilers [mg/GJ]Gasification Boilers [mg/GJ]Stoves [mg/GJ]−[mg/GJ]Reference
Brown coal276.0134.44.87.3276.0 [64]
Briquettess106.621.84.87.3106.6 [64]
Hard coal504.829.52.739.2504.8 [64]
Coke504.829.52.739.2504.8 [64]
Wood—dry253.797.81.49.0253.7 [64]
Wood—wet191.375.01.452.5191.3 [64]
Bio-briquettess253.797.81.49.0253.7 [64]
Pellets253.797.81.49.0253.7 [64]
Natural gas 0.00056[17]
Fuel oil 0.08[17]
Table A5. Distribution of solid fuel consumption according to the type of heating equipment in 2018.
Fuel TypeOver-Fire Boilers [%]Under-Fire Boilers [%]Automatic Boilers [%]Gasification Boilers [%]Stoves [%]
Brown coal25313185
Briquettess55216414
Hard coal55142155
Coke898102
Wood—dry321741730
Wood—wet331431238
Bio-briquettess17951059
Pellets0.50.554045
Table A6. Comparison of BaP emissions from residential sector calculated in top-down and bottom-up model 2008–2018.
Reporting YearBaP Emissions [t]Emission Difference (Bottom-Up/Top-Down)Number of Heating Degree Days
Top-Down (Reporting)Bottom-Up (Modeling)[t][%]
201815.614.1−1.5−10%3684
201716.016.10.21%4138
201615.716.00.32%4053
201516.215.6−0.6−4%3892
201416.214.5−1.6−11%3611
201317.317.50.21%4310
201216.917.10.21%4208
201116.316.1−0.2−1%3970
201016.417.10.74%4567
200914.614.3−0.3−2%3952
200813.814.40.64%3973

Appendix C

Figure A1. Field of annual average concentration of benzo[a]pyrene in the Czech Republic, 2012–2017.
Atmosphere 11 00955 g0a1

Appendix D

Figure A2. Boxplots of BaP concentrations at selected monitoring sites, 2008–2018.
Atmosphere 11 00955 g0a2

Appendix E

Figure A3. Annual average benzo[a]pyrene concentration in 2015 (CAMx model) and ratio of measured and modeled concentration at station locations.
Atmosphere 11 00955 g0a3
Figure A4. Scatter plot of modeled and measured annual average benzo[a]pyrene concentrations in 2015 for CAMx domain d02. Solid line denotes ideal model equal to observation, dashed lines mark area, where model values are within a factor of two from observations.
Atmosphere 11 00955 g0a4
Table A7. Ratio of modeled and measured annual average benzo[a]pyrene concentration.
CountryNumber of StationsCAMx/Measurement
Min1st Qu.MedianMean3rd Qu.Max
Germany54.04.45.79.415.417.7
Austria141.95.27.810.413.826.1
Czech Republic340.31.01.51.62.03.6
Poland520.10.30.40.50.71.5
Figure A5. Relative contribution of transboundary sources to annual average benzo[a]pyrene concentration in 2015: (a) CAMx model averaged on EMEP grid, (b) EMEP model, and (c) difference CAMx−EMEP.
Atmosphere 11 00955 g0a5

References

  1. Abdel-Shafy, H.I.; Mansour, M.S.M. A review on polycyclic aromatic hydrocarbons: Source, environmental impact, effect on human health and remediation. Egypt. J. Pet. 2016, 25, 107–123. [Google Scholar] [CrossRef] [Green Version]
  2. Choi, H.; Jedrychowski, W.; Spengler, J.; Camann, D.E.; Whyatt, R.M.; Rauh, V.; Tsai, W.Y.; Perera, F.P. International Studies of Prenatal Exposure to Polycyclic Aromatic Hydrocarbons and Fetal Growth. Environ. Health Perspect. 2006, 114, 1744–1750. [Google Scholar] [CrossRef] [Green Version]
  3. WHO. Air Quality Guidelines for Europe, 2nd ed.; WHO Regional Office for Europe: Copenhagen, Denmark, 2000; pp. 92–97. [Google Scholar]
  4. Edwards, S.C.; Jedrychowski, W.; Butscher, M.; Camann, D.; Kieltyka, A.; Mroz, E.; Flak, E.; Li, Z.; Wang, S.; Rauh, V. Prenatal exposure to airborne polycyclic aromatic hydrocarbons and children’s intelligence at 5 years of age in a prospective cohort study in Poland. Environ. Health Perspect. 2010, 118, 1326–1331. [Google Scholar] [CrossRef] [PubMed]
  5. Daly, G.; Wania, F. Organic Contaminants in Mountains. Environ. Sci. Technol. 2005, 39, 385–398. [Google Scholar] [CrossRef] [PubMed]
  6. Sofowote, U.M.; Hung, H.; Rastogi, A.K.; Westgate, J.N.; Deluca, P.F.; Su, Y.; McCarry, B.E. Assessing the long-range transport of PAH to a sub-Arctic site using positive matrix factorization and potential source contribution function. Atmos. Environ. 2001, 45, 967–976. [Google Scholar] [CrossRef]
  7. Tamamura, S.; Sato, T.; Ota, Y.; Wang, X.; Tang, N.; Hayakawa, K. Long-range transport of polycyclic aromatic hydrocarbons (PAHs) from the eastern Asian continent to Kanazawa, Japan with Asian dust. Atmos. Environ. 2007, 41, 2580–2593. [Google Scholar] [CrossRef]
  8. EU. Directive 2004/107/EC of the European Parliament and of the Council of 15 December 2004 Relating to Arsenic, Cadmium, Mercury, Nickel and Polycyclic Aromatic Hydrocarbons in Ambient Air. OJ L 23, 26.1; European Environment Agency: Copenhagen, Denmark, 2005; pp. 3–16. [Google Scholar]
  9. WHO. WHO Guidelines for Indoor Air Quality: Selected Pollutants, 1st ed.; World Health Organization, European Centre for Environment and Health: Bonn, Germany, 2010; pp. 289–347. [Google Scholar]
  10. ETC/ACM. Evaluation of Current Limit and Target Values as Set in the EU Air Quality Directive, Technical Paper 2011/3; The European Topic Centre on Air Pollution and Climate Change Mitigation: Bilthoven, The Netherlands, 2011; pp. 25–26. [Google Scholar]
  11. Guerreiro, C.B.B.; Horálek, J.; de Leeuw, F.; Couvidat, F. Benzo(a)pyrene in Europe: Ambient air concentrations, population exposure and health effects. Environ. Pollut. 2016, 214, 657–667. [Google Scholar] [CrossRef] [PubMed]
  12. EEA. Air Quality in Europe—2019 Report; EEA Report No. 10/2019; European Environment Agency: Copenhagen, Denmark, 2019. [Google Scholar]
  13. Available online: https://www.czso.cz/csu/czso/home (accessed on 3 July 2020).
  14. Available online: http://portal.chmi.cz/ (accessed on 3 July 2020).
  15. Tyle, P. Přehled o Dodávkách a Jakosti Tuhých Paliv na Uzemí ČR v Roce 2018 Pro Učely Registrů Emisních Zdrojů. (An Overview of the Supply and Quality of Solid Fuels in the Czech Republic in 2018 for the purpose Registers Emission Sources); TEKO: Prague, Czech Republic, 2019. [Google Scholar]
  16. Available online: https://vec.vsb.cz/cs/pracoviste/zkusebna-kotlu/ (accessed on 3 July 2020).
  17. EEA. EMEP/EEA Air Pollutant Emission Inventory Guidebook 2019; European Environment Agency: Luxembourg, 2020. [Google Scholar]
  18. Available online: https://www.cdv.cz/en/ (accessed on 3 July 2020).
  19. Available online: https://www.emisia.com/utilities/copert/ (accessed on 3 July 2020).
  20. ETC/ACC. Spatial Mapping of Air Quality for European Scale Assessment. ETC/ACC Technical Paper 2006/6. 2007. Available online: https://www.eionet.europa.eu/etcs/etc-atni/products/etc-atni-reports/etcacc_technpaper_2006_6_spat_aq (accessed on 19 May 2020).
  21. ETC/ACM. European Air Quality Maps for 2015; ETC/ACM Technical Paper 2017/7; The European Topic Centre on Air Pollution and Climate Change Mitigation: Bilthoven, The Netherlands, 2018. [Google Scholar]
  22. CHMI. Air Pollution in the Czech Republic in 2018, Graphical Yearbook (Czech/English); Czech Hydrometeorological Institute: Prague, Czech Republic, 2019. [Google Scholar]
  23. EMEP/MSC-E: Database on Modelling Results of HMs and POPs (1990–2017). Available online: http://en.msceast.org/index.php/pollution-assessment/emep-domain-menu?id=119 (accessed on 3 July 2020).
  24. Cressie, N. Statistics for Spatial Data; Wiley: New York, NY, USA, 1993. [Google Scholar]
  25. Mann, H.B. Nonparametric tests against trend. Econometrica 1945, 13, 245–259. [Google Scholar] [CrossRef]
  26. Kendall, M.G. Rank Correlation Methods; Charles Graffin: London, UK, 1955. [Google Scholar]
  27. Garrido, A.; Jimenez-Guerrero, P.; Ratola, N. Levels, trends and health concerns of atmospheric PAHs in Europe. Atmos. Environ. 2014, 99, 474–484. [Google Scholar] [CrossRef]
  28. Albuquerquea, M.; Coutinho, M.; Borrego, C. Long-term monitoring and seasonal analysis of polycyclic aromatic hydrocarbons (PAHs) measured over a decade in the ambient air of Porto, Portugal. Sci. Total Environ. 2016, 543, 439–448. [Google Scholar] [CrossRef]
  29. Barzeghara, V.; Sarbakhshc, P.; Hassanvandd, M.S.; Faridie, S.; Gholampoura, A. Long-term trend of ambient air PM10, PM2.5, and O3 and their health effects in Tabriz city, Iran, during 2006–2017. Sustain. Cities Soc. 2020, 54, 1–12. [Google Scholar] [CrossRef]
  30. Hůnová, I.; Bäumelt, V.; Modlík, M. Long-term trends in nitrogen oxides at different types of monitoring stations in the Czech Republic. Sci. Total Environ. 2020, 699, 134378. [Google Scholar] [CrossRef] [PubMed]
  31. De Leeuw, F.A.A.M. Trends in ground level ozone concentrations in the European Union. Environ. Sci. Policy 2000, 3, 189–199. [Google Scholar] [CrossRef]
  32. Gilbert, R.O. Statistical Methods for Environmental Pollution Monitoring; Van Nostrand Reinhold: New York, NY, USA, 1987. [Google Scholar]
  33. R Core Team. R: A Language and Environment for Statistical Computing; R Foundation for Statistical Computing: Vienna, Austria, 2019. Available online: www.R-project.org (accessed on 5 March 2020).
  34. Available online: www.esri.com (accessed on 3 July 2020).
  35. Shimada, K.; Nohchib, M.; Yangc, X.; Sugiyamad, T.; Miurae, K.; Takamif, A.; Satof, K.; Chenc, X.; Katog, S.; Kajiih, Y.; et al. Degradation of PAHs during long range transport based on simultaneous measurements at Tuoji Island, China, and at Fukue Island and Cape Hedo, Japan. Environ. Pollut 2020, 260, 113906. [Google Scholar] [CrossRef] [PubMed]
  36. ENVIRON. User’s Guide to the Comprehensive Air Quality Model with Extensions (CAMx) Version 5.40. 2011. Available online: http://www.camx.com (accessed on 30 April 2020).
  37. CHMI. Czech Reference Dispersion Model SYMOS’97 (in Czech Only). 2020. Available online: http://portal.chmi.cz/aktualni-situace/stav-ovzdusi/modelovani-kvality-ovzdusi/model-symos (accessed on 30 April 2020).
  38. Termonia, P.; Fisher, C.; Bazile, E.; Bouyssel, F.; Brožková, R.; Bénard, P.; Bochenek, B.; Degrauwe, D.; Derková, M.; El Khatib, R.; et al. The ALADIN System and its canonical model configurations AROME CY41T1 and ALARO CY40T1. Geosci. Model Dev. 2018, 11, 257–281. [Google Scholar] [CrossRef] [Green Version]
  39. Bučánek, A.; Brožková, R.; Trojáková, A. Asimilační schéma BlendVar v ČHMÚ. Meteorol. Zprávy 2015, 68, 180–185. [Google Scholar]
  40. Giard, D.; Bazile, E. Implementation of a New Assimilation Scheme for Soil and Surface Variables in a Global NWP Model. Mon. Weather Rev. 2000, 128, 997–1015. [Google Scholar] [CrossRef]
  41. Van der Denier Gon, H.; van het Bolscher, M.; Visschedijk, A.; Zandveld, P. Emissions of persistent organic pollutants and eight candidate POPs from UNECE–Europe in 2000, 2010 and 2020 and the emission reduction resulting from the implementation of the UNECE POP protocol. Atmos. Environ. 2007, 41, 9245–9261. [Google Scholar] [CrossRef]
  42. European Commission. Guidance Document for the implementation of the European PRTR. 2006. Available online: https://ec.europa.eu/environment/industry/stationary/e-prtr/pdf/en_prtr.pdf (accessed on 30 April 2020).
  43. Copernicus. Corine Land Cover Classification Spatial Data Set. 2018. Available online: https://land.copernicus.eu/pan-european/corine-land-cover/clc2018 (accessed on 30 April 2020).
  44. Builtjes, P.J.H.; van Loon, M.; Schaap, M.; Teeuwise, S.; Visschedijk AJ, H.; Bloos, J.P. Project on the Modelling and Verification of Ozone Reduction Strategies: Contribution of TNO-MEP, TNO-Report, MEP-R2003/166; TNO: Apeldoorn, The Netherlands, 2003. [Google Scholar]
  45. Dernier van der Gon, H.; Hendriks, C.; Kuenen, J.; Segers, A.; Visschedijk, A. A Description of Current Temporal Emission Patterns and Sensitivity of Predicted AQ for Temporal Emission Patterns; EU FP7 MACC Deliverable Report D_D-EMIS_1.3; TNO: Utrecht, The Netherlands, 2011; Available online: https://atmosphere.copernicus.eu/sites/default/files/2019-07/MACC_TNO_del_1_3_v2.pdf (accessed on 30 April 2020).
  46. Berdowski, J.J.M.; Baas, J.; Bloos, J.P.J.; Visschedijk, A.J.H.; Zandveld, P.Y.J. The European Emission Inventory of Heavy Metals and Persistant Organic Pollutants for 1990; TIB: Hannover, Germany, 1997. [Google Scholar]
  47. EMEP/CEIP: Spatially Distributed Emission Data as Used in EMEP Models. 2019. Available online: https://www.ceip.at/new_emep-grid/01_grid_data (accessed on 3 July 2020).
  48. EEA. Air Quality e-Reporting—Air Quality Annual Statistics Calculated by the EEA. 2020. Available online: http://aidef.apps.eea.europa.eu/ (accessed on 20 February 2020).
  49. Inventory Files NFR. Submissions 2020 (Reporting Year 2018). ANNEX 1: National Sector Emissions: Main Pollutants, Particulate Matter, Heavy Metals and Persistent Organic Pollutants. Available online: https://ceip.at/ms/ceip_home1/ceip_home/status_reporting/2020_submissions (accessed on 18 May 2020).
  50. Act No 201/2012 Coll. On the Protection of Air. In Collection of Law; MVCR: Prague, Czech Republic, 13 June 2012; Available online: https://www.psp.cz/sqw/sbirka.sqw?cz=201&r=2012 (accessed on 18 May 2020).
  51. EN 303-5:2012. In Heating Boilers—Part 5: Heating Boilers for Solid Fuels, Manually and Automatically Stoked, Nominal Heat Output of Up to 500 kW—Terminology, Requirements, Testing and Marking; Comité Européen de Normalisation: Brussels, Belgium, 2012.
  52. Hellén, H.; Kangas, L.; Kousa, A.; Vestenius, M.; Teinilä, K.; Karppinen, A.; Kukkonen, J.; Niemi, J.V. Evaluation of the impact of wood combustion on benzo[a]pyrene (BaP) concentrations; ambient measurements and dispersion modeling in Helsinki, Finland. Atmos. Chem. Phys. 2017, 17, 3475–3487. [Google Scholar] [CrossRef] [Green Version]
  53. CHMI. Air Pollution in the Czech Republic in Current Year. Graphical Yearbook (Czech/English); Czech Hydrometeorological Institute: Prague, Czech Republic, 2009–2019; Available online: http://portal.chmi.cz/files/portal/docs/uoco/isko/grafroc/grafroc_GB.html (accessed on 30 April 2020).
  54. EEA. Air Quality in Europe—2016 Report; EEA Report No. 28/2016; European Environment Agency: Luxembourg, 2016. [Google Scholar]
  55. Tham, Y.W.F.; Takeda, K.; Sakugawa, H. Polycyclic aromatic hydrocarbons (PAHs) associated with atmospheric particles in Higashi Hiroshima, Japan: Influence of meteorological conditions and seasonal variations. Atmos. Res. Vol. 2008, 88, 224–233. [Google Scholar] [CrossRef]
  56. Masiol, M.; Hofer, A.; Squizzato, S.; Piazza, R.; Rampazzo, G.; Pavoni, B. Carcinogenic and mutagenic risk associated to airborne particle-phase polycyclic aromatic hydrocarbons: A source apportionment. Atmos. Environ. 2012, 60, 375–382. [Google Scholar] [CrossRef]
  57. Gianelle, V.; Colombi, C.; Caserini, S.; Ozgen, S.; Galante, S.; Marongiu, A.; Lanzani, G. Benzo(a)pyrene air concentrations and emission inventory in Lombardy region, Italy. Atmos. Pollut. Res. 2013, 4, 257–266. [Google Scholar] [CrossRef] [Green Version]
  58. Liu, Y.; Tao, S.; Yang, Y.; Dou, H.; Yang, Y.; Coveney, R.M. Inhalation exposure of traffic police officers to polycyclic aromatic hydrocarbons (PAHs) during the winter in Beijing, China. Sci. Total Environ. 2007, 383, 98–105. [Google Scholar] [CrossRef] [PubMed]
  59. Li, Z.; Porter, E.N.; Sjodin, A.; Larry, L.; Need-Ham, L. Characterization of PM2.5 bound polycyclic aromatic hydrocarbons in Atlanta. Seasonal vari-ations at urban, suburban, and rural ambient air monitoring sites. Atmos. Environ. 2009, 49, 4187–4193. [Google Scholar] [CrossRef]
  60. Ludykar, D.; Westerholm, R.; Almen, J. Cold start emissions at +22, −7 and −20 degrees C ambient temperatures from a three-way catalyst (TWC) car: Regulated and unregulated exhaust components. Sci. Total Environ. 1999, 235, 65–69. [Google Scholar] [CrossRef]
  61. Teixeira, E.C.; Agudelo-Castañeda, D.M.; Fachel, J.M.G.; Leal, K.A.; de Oliveira Garcia, K.; Wiegand, F. Source identification and seasonal variation of polycyclic aromatic hydrocarbons associated with atmospheric fine and coarse particles in the Metropolitan Area of Porto Alegre, RS, Brazil. Atmos. Res. 2012, 118, 390–403. [Google Scholar] [CrossRef]
  62. Ma, W.L.; Zhu, F.J.; Liu, L.Y.; Jia, H.L.; Yang, M.; Li, Y.F. PAHs in Chinese atmosphere Part II: Health risk assessment. Ecotoxicol. Environ. Saf. 2020, 200, 110774. [Google Scholar] [CrossRef]
  63. Giovannini, L.; Ferrero, E.; Karl, T.; Rotach, M.W.; Staquet, C.; Trini Castelli, S.; Zardi, D. Atmospheric Pollutant Dispersion over Complex Terrain: Challenges and Needs for Improving Air Quality Measurements and Modeling. Atmosphere 2020, 11, 646. [Google Scholar] [CrossRef]
  64. Hopan, F.; Horák, J. Výpočet Emisních Faktorů Znečišťujících Látek Pro Léta 2001 až 2012 a Tři Varianty Pro Rok 2022 na Základě Experimentálních a Statistických Dat. (Calculation of Emission Factors of Pollutants for Years 2001–2012 and Three Scenarios for 2022 Based on Experimental and Statistic Data); Energy Research Center VSB: Ostrava, Czech Republic, 2014; p. 13. [Google Scholar]
Figure 1. Monitoring stations of benzo(a)pyrene in the Czech Republic in 2018.
Atmosphere 11 00955 g001
Figure 2. Annual benzo[a]pyrene (BaP) emissions for 2015 [kg·km2] used in the CAMx model.
Atmosphere 11 00955 g002
Figure 3. The development of total BaP emissions and source share, 2010–2018.
Atmosphere 11 00955 g003
Figure 4. BaP emissions from combustion of solid fuel in residential sector in 2018 sorted by combustion installation and fuel type.
Atmosphere 11 00955 g004
Figure 5. Field of annual average concentration of benzo[a]pyrene in the Czech Republic, 2018.
Atmosphere 11 00955 g005
Figure 6. Population exposure to benzo[a]pyrene in the Czech Republic, 2012−2018.
Atmosphere 11 00955 g006
Figure 7. Daily average BaP concentration in small settlements Černíny, Bochovice and Hřivice and in the town of Kladno-Švermov in the Czech Republic, 2017–2018.
Atmosphere 11 00955 g007
Figure 8. Annual average concentrations of BaP at selected monitoring sites and emissions in the Czech Republic, 2008−2018.
Atmosphere 11 00955 g008
Figure 9. Winter average concentrations of BaP at selected monitoring sites and emissions in the Czech Republic, 2008−2018.
Atmosphere 11 00955 g009
Figure 10. Summer average concentrations of BaP at selected monitoring sites in the Czech Republic, 2008−2018.
Atmosphere 11 00955 g010
Figure 11. Relative contribution of transboundary sources to annual average BaP concentration in 2015 (CAMx model, 4.7-km grid).
Atmosphere 11 00955 g011
Figure 12. Relative contribution of Czech sources to annual average benzo[a]pyrene concentration in 2015 (CAMx model rescaled by the SYMOS model to 0.5-km grid).
Atmosphere 11 00955 g012
Table 1. Station characteristics, average concentrations of BaP (ng·m−3) and emission of BaP for 2008−2018.
StationCharacter20082009201020112012201320142015201620172018
Concentrations of BaP (ng·m−3)
Kladno-Švermovurban6.04.54.33.94.74.13.43.93.43.73.5
Ostrava-Porubasuburban3.53.33.83.43.32.92.92.62.22.52.9
České Budějovicesuburban1.41.41.51.31.71.51.21.41.51.31.1
Prague-Libušsuburban1.00.90.90.91.11.21.10.90.80.90.8
Žďár nad Sázavouurban0.40.70.60.60.50.70.80.61.00.70.6
Košeticerural reg.0.40.50.60.40.60.70.40.40.40.50.4
average 2.11.92.01.82.01.91.61.61.61.61.6
Summer (April–September)
Kladno-Švermovurban1.40.70.90.71.41.00.90.50.80.80.7
Ostrava-Porubasuburban1.10.70.60.60.61.00.60.70.70.50.6
České Budějovicesuburban0.30.30.30.30.30.40.30.30.30.30.1
Prague-Libušsuburban0.20.20.30.20.30.30.20.20.20.20.1
Žďár nad Sázavouurban0.20.10.10.10.20.30.30.10.20.10.1
Košeticerural reg.0.20.10.10.10.10.10.10.10.10.20.1
summer average 0.60.30.40.30.50.50.40.30.40.30.3
Winter (October–March)
Kladno-Švermovurban10.98.47.77.28.17.16.67.06.06.66.5
Ostrava-Porubasuburban5.95.97.06.36.14.85.34.53.84.65.3
České Budějovicesuburban2.52.52.72.53.12.72.12.42.62.32.1
Prague-Libušsuburban1.81.61.51.62.02.12.01.51.41.71.4
Žďár nad Sázavouurban0.81.11.11.10.91.21.31.11.81.41.1
Košeticerural reg.0.60.91.00.80.81.20.70.70.80.90.6
winter average 3.73.43.53.23.53.23.02.82.72.92.8
Emission of BaP (t·year−1)
Czech Republic 14.014.816.616.517.117.516.416.415.916.215.7
Table 2. The Mann–Kendall test to assess the monotonic trend and Sen’s slope assessment for BaP during 2008–2018.
StationMann-Kendall (tau)Sen’s Slope
(ng·m−3·year−1)
p-Value
YEAR
Kladno-Švermov−0.65−0.150.01 *
Ostrava-Poruba−0.70−0.12<0.005 *
České Budějovice−0.27 0.30
Prague-Libuš0.31 0.25
Ždár nad Sázavou0.32 0.22
Košetice−0.13 0.67
Average all stations−0.76−0.05<0.005 *
Average UB/SUB st.−0.76−0.06<0.005 *
WINTER
Kladno-Švermov−0.78−0.28<0.005 *
Ostrava-Poruba−0.53−0.210.03 *
České Budějovice−0.37 0.14
Prague-Libuš−0.26 0.31
Ždár nad Sázavou0.47 0.06
Košetice−0.18 0.48
Average all stations−0.78−0.09<0.005 *
Average UB/SUB st.−0.75−0.11<0.005 *
SUMMER
Kladno-Švermov−0.32 0.21
Ostrava-Poruba−0.25 0.34
České Budějovice0.08 0.80
Prague-Libuš−0.43 0.08
Ždár nad Sázavou−0.11 0.69
Košetice−0.33 0.20
Average all stations−0.35 0.16
Average UB/SUB st.−0.35 0.16
* Significant trend.

