Article

Dynamics of Mechanical Oscillator Mechanism for Stratospheric Gravity Waves Generated by Convection

College of Meteorology and Oceanography, National University of Defense Technology, Nanjing 211101, China
*
Author to whom correspondence should be addressed.
Atmosphere 2020, 11(9), 942; https://doi.org/10.3390/atmos11090942
Submission received: 29 July 2020 / Revised: 25 August 2020 / Accepted: 1 September 2020 / Published: 3 September 2020
(This article belongs to the Special Issue Gravity Waves in the Atmosphere)

Abstract

:
The mechanical oscillator mechanism (MOM) for stratospheric gravity waves generated by convection is investigated with a dynamics model using the two-dimensional, nonhydrostatic and linear governing equations based on the Boussinesq approximation. The model is solved analytically with a fixed buoyancy oscillation (BO) at the tropopause as the boundary conditions. Results show that this BO is the source of stratospheric gravity waves and the MOM is the generation mechanism. The characteristics of the stratospheric gravity waves not only depend on the BO, but also rely on the stratospheric state, such as the background wind and the buoyancy frequency. When the vertical wavenumbers of the stratospheric gravity waves are close to those of the intrinsic characteristic waves (ICWs), which are the model solution without BO forcing at the tropopause, resonance occurs. Under the resonance conditions, the amplitudes of the stratospheric gravity waves increase significantly, even for low BO intensity. The background wind in the stratosphere has a large effect on wave resonance. Finally, numerical simulation results of a low-vortex system also verify that the MOM is the generation mechanism of stratospheric gravity waves generated by convection.

1. Introduction

As an important dynamic process in the stratosphere, the gravity waves play an important role in the transfer of energy and momentum in the stratosphere, and significantly affect general atmospheric circulation [1,2,3,4,5]. The generation mechanism of stratospheric gravity waves has; thus, long been the subject of research in atmospheric dynamics. Generally, gravity waves can be initiated by topographic forcing [6] and ageostrophic motion, such as fronts, tropical vortexes, and jet shears in the troposphere [7,8,9,10], and can be generated by updrafts resulted from convergent and divergent circulation in these systems. In a moist atmosphere, these systems can produce rainstorms and thunderstorms, which can enhance deep convection by releasing latent heat. Among the many sources of gravity waves, convection in the troposphere is a notable generator of non-stationary gravity waves [11,12,13,14,15].
Currently, there are mainly three mechanisms for stratospheric gravity waves generated by convection: the pure thermal forcing mechanism [16,17,18,19], the obstacle-effect or instantaneous “terrain” effect mechanism [7,20,21], and the mechanical oscillator mechanism (MOM) [22,23,24]. The MOM was first proposed by Pierce and Coroniti [22], and then developed and verified by Fovell et al. [23], Alexander et al. [24], and Lane et al. [25,26]. This mechanism asserts that the updraft within a convective system decelerates rapidly when it reaches the neutral buoyancy layer near the tropopause, where oscillations begin to occur [15,27,28]. Subsequently, vertically propagating gravity waves are forced in the stratosphere, similar to that in stratified fluid, such that the convective cells can be regarded as transient mechanical oscillators [23,29].
Fovell et al. [23] researched the excitation and vertical propagation of stratospheric gravity waves through a two-dimensional model describing the mesoscale convective storms, and found that the waves whose periods match the primary periods of the forcing are generated by mechanical forcing from oscillatory updrafts. Because of the background wind, the spectral characteristics of waves are distributed anisotropically. Wang et al. [15] investigated the generation, structure, and characteristics of mesoscale gravity waves in the Mei-Yu front systems in Asia by performing numerical simulations using the Weather Research and Forecasting (WRF) model, and found that gravity waves are generated during the development of moist convection, and, importantly, that these waves do not directly propagate into the stratosphere from the troposphere but are initiated by the MOM near the tropopause.
Although the MOM is a well-known description of the generation of stratospheric gravity waves from convection, there is still insufficient theoretical analysis of this mechanism. In this work, the dynamics model which are two-dimensional, nonhydrostatic, and linear, are formulated and solved analytically with boundary conditions of a buoyancy oscillation (BO) forcing around the tropopause. Resonance between waves caused by the forcing at the lower boundary and intrinsic waves is also investigated. Finally, the existence of gravity waves is revealed by numerical simulation results of a low-vortex system accompanied by a rainstorm during the Mei-Yu period in southwest China.

2. Dynamics

2.1. Governing Equations and Boundary Conditions

The two-dimensional, non-hydrostatic, linear equations based on Boussinesq approximation are used in the lower stratosphere. Waves are assumed to propagate along the x direction. The background wind u ¯ is assumed to be in the same direction as the waves propagate (i.e., u ¯ = u ¯ ( z ) , v ¯ = 0 ). Thus, the governing equations in a stable stratosphere are as follows [30]:
{ ( t + u ¯ x ) v + f ψ z = 0 ( t + u ¯ x ) θ f d u ¯ d z v N 0 2 ψ x = Q ( t + u ¯ x ) 2 ψ f v z + θ x d 2 u ¯ d z 2 ψ x = 0 ,
where 2 = 2 / x 2 + 2 / z 2 , and ( u , v , w , θ ) ( ρ ¯ u , ρ ¯ v , ρ ¯ w , ρ ¯ g θ / θ 0 ) . Here, u , v , w and θ are the perturbations of velocity and potential temperature, respectively, and ρ ¯ ( z ) is the vertical distribution of the static density. The potential temperature in the stratosphere θ 0 , the acceleration by gravity g, and the Coriolis parameter f are all constant; ψ is the disturbance momentum flow function, and satisfies the condition that u =   ψ /   z , w =   ψ /   x ; N 0 2 ( z ) = ( g / θ 0 ) θ ¯ / z is the squared Brunt–Väisälä frequency.
The bottom boundary of the stratosphere (at level z = 0) is supposed to be the tropopause, where BO forced by strong convection can arise. The BO is assumed to propagate along the x direction in the form of simple harmonic waves, such that the bottom boundary conditions can be expressed as
z = 0 , w = ρ ¯ 0 W 0 cos ( k x σ t ) ,
where σ is the frequency, k is the horizontal wavenumber, ρ ¯ 0 is the static density at the tropopause, W 0 is the amplitude of w , and W 0 = ρ ¯ 0 W 0 is the amplitude of the BO.
The upper boundary can be regarded as a rigid wall described as
z = H , w = 0 ,
where H is the depth of the low stratosphere. Because we mainly focus on the waves caused by the BO in this paper, so we do not take account of the role of diabatic heating and set Q = 0. Besides, the Brunt–Väisälä frequency in the stratosphere can be approximately set as a constant.
Assuming that the solution of Equation (1) has the same frequency and wavenumber as those of the forced oscillation of Equation (2), it can be written as
( v θ ψ ) = ( V ( z ) cos ( k x σ t ) Θ ( z ) sin ( k x σ t ) Ψ ( z ) sin ( k x σ t ) ) ,
where V ( z ) , Θ ( z ) and Ψ ( z ) are the amplitudes of v , θ , and ψ , respectively, and they are all real functions of altitude z. Inserting Equation (4) into Equations (1)–(3), we can get the amplitude equations and boundary conditions:
{ ( u ¯ k σ ) V f d Ψ d z = 0 ( u ¯ k σ ) Θ f d u ¯ d z V k N 0 2 Ψ = 0 ( u ¯ k σ ) ( d 2 Ψ d z 2 k 2 Ψ ) f d V d z + k Θ k d 2 u ¯ d z 2 Ψ = 0 z = 0 ,   Ψ = W 0 / k =   Ψ 0 ; z = H , Ψ = 0 .
We can eliminate V and Θ in Equation (5), and yield the Taylor–Goldstein equation for Ψ ,
d 2 Ψ d z 2 + k 2 N 0 2 ω 2 ω 2 f 2 Ψ = 0 ,
where ω = σ u ¯ k is the intrinsic frequency of the forced gravity wave (FGW). When ( N 0 2 ω 2 ) / ( ω 2 f 2 ) < 0 , we can get the solution of external gravity waves. In this paper, we mainly discuss the solution of internal gravity waves. That is ( N 0 2 ω 2 ) / ( ω 2 f 2 ) > 0 , and ω 2 satisfy N 0 2 > ω 2 > f 2 or N 0 2 < ω 2 < f 2 . As N 0 2 > f 2 is always the case, ω 2 must satisfy f 2 < ω 2 < N 0 2 , which are necessary and sufficient conditions for the existence of internal gravity waves. Combining Equation (6) and the boundary conditions, we can get the amplitude solution of the disturbance momentum flow function
Ψ = Ψ 0 sin ( η H ) sin [ η ( H z ) ] .
Then, the solution of FGW can be calculated as follows:
ψ = Ψ 0 sin ( η H ) sin [ η ( H z ) ] sin ( k x σ t )
v = f ω d Ψ d z = f η Ψ 0 ω sin ( η H ) cos [ η ( H z ) ] cos ( k x σ t )
θ = k N 0 2 ω Ψ = k N 0 2 Ψ 0 ω sin ( η H ) sin [ η ( H z ) ] sin ( k x σ t )
u =   ψ   z = η Ψ 0 sin ( η H ) cos [ η ( H z ) ] sin ( k x σ t )
w =   ψ   x = k Ψ 0 sin ( η H ) sin [ η ( H z ) ] cos ( k x σ t ) ,
where η = k ( N 0 2 ω 2 ) / ( ω 2 f 2 ) > 0 is the vertical wavenumber of the FGW, and the vertical wavelength is L z = 2 π / η . Equation (8) indicates that the FGW generated by the BO can propagate horizontally and vertically, differently from the BO only propagating horizontally. In addition, the MOM is the generation mechanism of stratospheric gravity waves.

2.2. Wave Resonance

When the BO forcing at the tropopause is considered as zero, the bottom boundary conditions of Equation (1) are
z = 0 , Ψ = 0 .
If the eigenvalue problem of Equation (6) with the boundary condition (9) has nonzero solutions, the frequency of the intrinsic characteristic wave (ICW) can be derived as
σ ˜ = k ˜ u ¯ ± k ˜ 2 N 0 2 + ( l π H ) 2 f 2 k ˜ 2 + ( l π H ) 2 = k ˜ u ¯ ± k ˜ 2 N 0 2 H 2 + l 2 π 2 f 2 k ˜ 2 H 2 + l 2 π 2 ; l = 1 , 2 , 3 , ,
where k ˜ and l are the horizontal wavenumber and the vertical mode number of the ICW, respectively. When the vertical mode number l = 1 , the vertical structure of the characteristic wave has a half-wave form, while l = 2 , it has one wave form, and so on. The vertical structure of the wave can be written as
Ψ ( z ) = C sin ( l π H z ) = C sin ( η ˜ z ) ,
where C is the ICW amplitude, and the vertical wavenumber is
η ˜ = l π / H = k ˜ ( N 0 2 ω ˜ 2 ) / ( ω ˜ 2 f 2 ) .
The ICW frequency after Doppler shifting by the background wind u ¯ is
ω ˜ = σ ˜ u ¯ k ˜ .
When the stratospheric environmental parameters N 0 , u ¯ , H , and f are known, the frequency ω ˜ can be calculated for the given mode number l and the horizontal wavenumber k ˜ using Equations (10) and (13).
When the frequency and horizontal wavenumber of the FGW generated by the BO in the stratosphere are close to those of the ICW, i.e., σ σ ˜ and k k ˜ , the frequency after Doppler shifting by the background wind and vertical wavenumber of the FGW will be the same as those of the ICW; i.e., ω ω ˜ and η η ˜ . Subsequently, we can get sin ( η H ) sin ( η ˜ H ) = sin ( l π ) = 0 . Consequently, the denominator sin ( η H ) in Equation (8) will then be close to 0, which means that the amplitude of the FGW in the stratosphere will be infinite (i.e., the FGW resonates with the ICW). Thus, we can conclude that the necessary and sufficient condition for resonance of the FGW and the ICW is
η = η ˜ = l π / H .
When resonance occurs, the amplitude of the gravity wave will be extremely large, even though the intensity of the forcing oscillation Ψ 0 is very small.

2.3. Analytical Results

In this section, the analytical solution for the FGW described above is calculated. The parameters are supposed to be H = 9   km , f = 10 4   s 1 and N 0 2 = 4.39 × 10 4   s 2 . We use 40 vertical layers with 225 m vertical grid spacing in the calculations. The BO amplitude at the tropopause is set to be W 0 = 0.01   kg m 2 s 1 . Suppose that the BO horizontal wavelength is L = 100   km (the wavenumber is k = 2 π / L ) and the period is T = 6   h (the frequency is σ = 2 π / T ). The background flow u ¯ has values of 0, −10, and −10.44 m   s 1 as three cases (Table 1).
Figure 1 shows the results of the amplitudes of the vertical velocity of the FGW for three different background flows by Equation (8e). The vertical structure of the FGW varies with the background flow. The FGW wavelength is determined not only by the wave parameters of the BO, but also by the stratospheric environment (e.g., the background wind and the Brunt–Väisälä frequency). The horizontal wave speed, the vertical wavelength, and the largest amplitude of the FGW for three different background flow cases are listed in Table 1. The positive (negative) background wind implies the westerly (easterly) wind. The FGW propagates eastward, in contrast to the background flow, and the background flow does not change the horizontal propagation speed of the FGW. The vertical wavelength increases as the east wind increases.
As shown in Figure 1 and Table 1, when the background flows are 0 and −10 m s−1, the maximum amplitudes of the FGW vertical velocity are 0.017 and 0.03 kg m 2 s 1 , respectively, which are comparable to the amplitudes of the BO. However, when the background flow is −10.44 m s−1, the amplitude of the FGW increases to 2.4 kg m 2 s 1 , which is two orders of magnitude greater than the BO amplitude. Under these conditions, the vertical wavenumber is η = 1.397 × 10 3   m 1 , and sin ( η H ) = 0.04 , which is close to 0. If the vertical mode is l = 4 (i.e., l π / H = 4 × π / 9000 = 1.296 × 10 3   m 1 ), then η l π / H , which approximately satisfies the sufficient and necessary conditions for resonance of the FGW and ICW. When the resonance occurs, although the intensity of the BO is small, the amplitude of the FGW in the stratosphere may be very large. The background wind in the stratosphere has a large effect on wave resonance. The background wind speed in case 3 is only 0.44 m s−1 higher than that in case 2, but there is no resonance in case 2.
When the analytical solutions are recalculated with different values of the height H (the results are not shown), it is found that the height H really has an effect on the structure of gravity waves, as well as the occurrence of the resonance. However, the value of height H has no influence on the form of the analytical solutions. Moreover, for easy theoretical solution, the upper boundary condition is ideally regarded as a rigid wall. In the realistic atmosphere, the H can be set very large because the stratosphere is a consistent stable stratification. Through the analysis of the theoretical and computational results from different H, it is found that the H does not change the basic properties of gravity waves. Thus, the results can provide theoretical reference to investigate the characteristics of gravity waves.
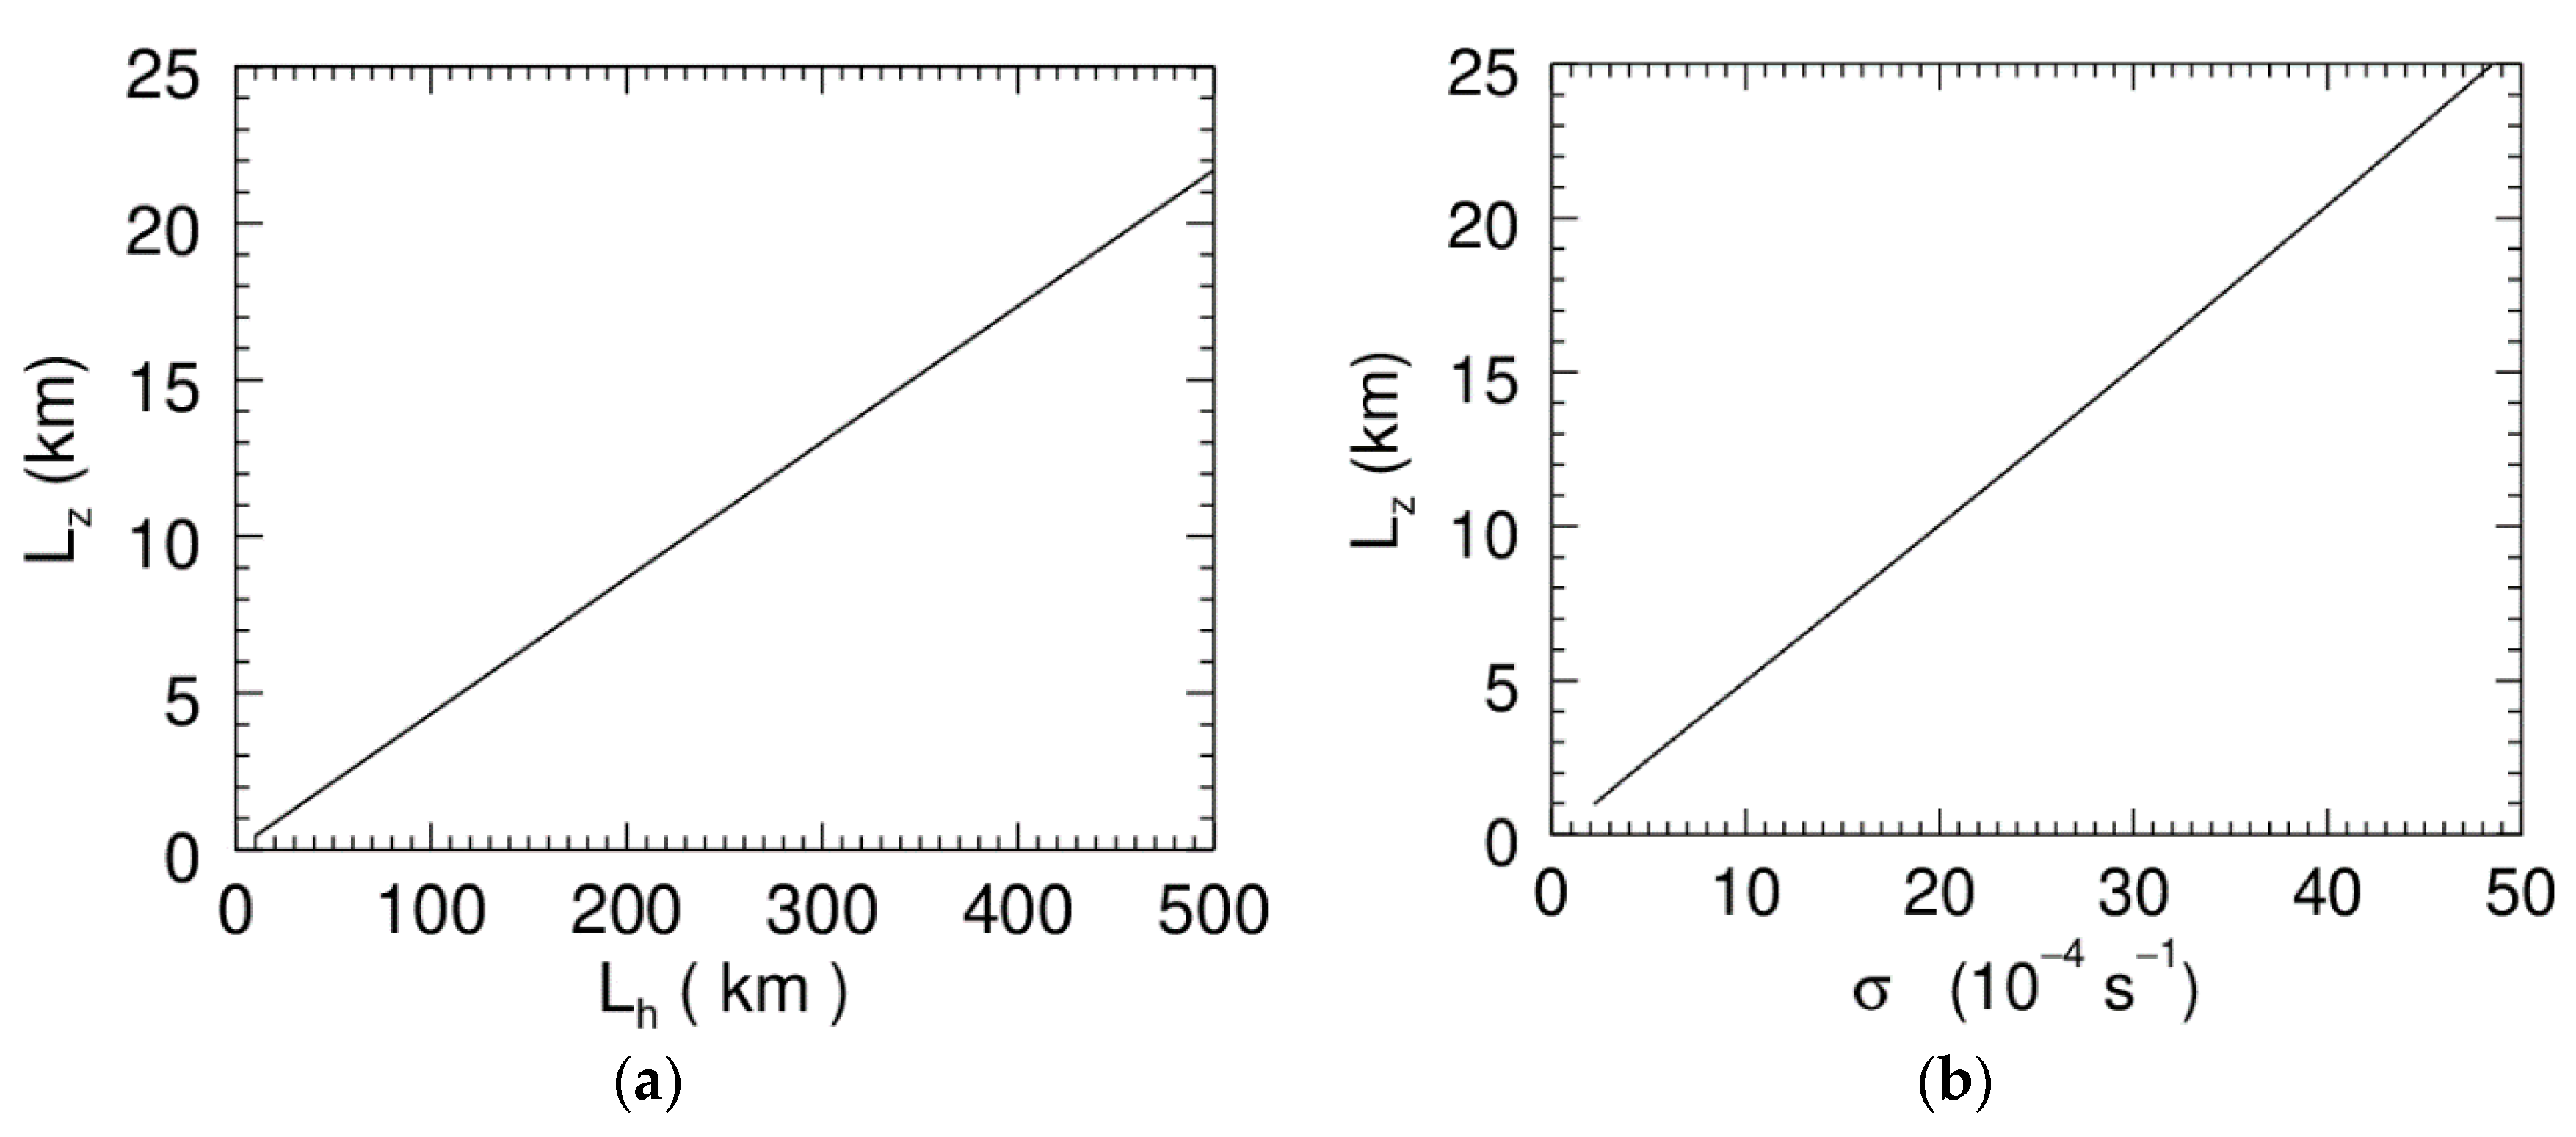
Combining ω = σ u ¯ k and η = k ( N 0 2 ω 2 ) / ( ω 2 f 2 ) , we investigate the relationship of the horizontal wavelength and the frequency with the vertical wavelength, respectively. In the calculation, the parameters are set to be f = 10 4   s 1 , u ¯ = 0   m   s 1 , T = 2   h and N 0 2 = 4 × 10 4   s 2 . The results show that the vertical wavelength is proportional to the horizontal wavelength and the former is two orders of magnitude smaller than the latter. The vertical wavelength has a value between 8.6 and 13 km when the horizontal wavelength is between 200 and 300 km (Figure 2a). In the idealized Mei-Yu front system from Wang et al. [15], the mean horizontal wavelengths of medium-scale waves upstream and downstream in the lower stratosphere could be estimated as 286 and 276 km and the vertical wavelengths as 17.2 and 11.6 km, respectively, while the mean background wind in their study is about 7 m s1. The results in this study are close to those of Wang et al. [15]. When the parameters are set to be f = 10 4   s 1 , u ¯ = 0   m   s 1 , L = 100   km and N 0 2 = 4 × 10 4   s 2 , the results show that the vertical wavelength has nonlinear positive correlation with the frequency. However, the vertical wavelength of the gravity wave in the lower stratosphere rarely exceeds 25 km. Thus, Figure 2b only shows the situation where the vertical wavelength is below 25 km.

3. Numerical Simulations

3.1. Model

Here, the results of our theoretical analysis are compared with the gravity waves from simulations of the real atmosphere. To obtain high spatial and temporal resolution data, a simulation of a heavy rainfall event that occurred in the Yangtze River Basin of China on 18 June 2011 was performed using the Weather Research and Forecasting (WRF) Model version 3.6. An analysis of this weather event indicates that the mesoscale system which triggered the precipitation was a low vortex moving eastward, which in China is known as a Southwest Vortex. This low vortex generated to the west of Chongqing developed gradually, and finally moved eastward into the East China Sea after ~48 h. The stratospheric gravity waves generated by convection were simulated and investigated. The NCEP (National Centers for Environmental Prediction) reanalysis dataset with a resolution of 1 ° × 1 ° was used for the initial and boundary conditions in the simulation, and hourly precipitation data from automated station measurements in China and CMORPH (CPC MORPHing technique) (http://data.cma.cn/data/cdcdetail/dataCode/SEVP_CLI_CHN_MERGE_CMP_PRE_HOUR_GRID_0.10.html) were used to evaluate the model results.

3.2. Results

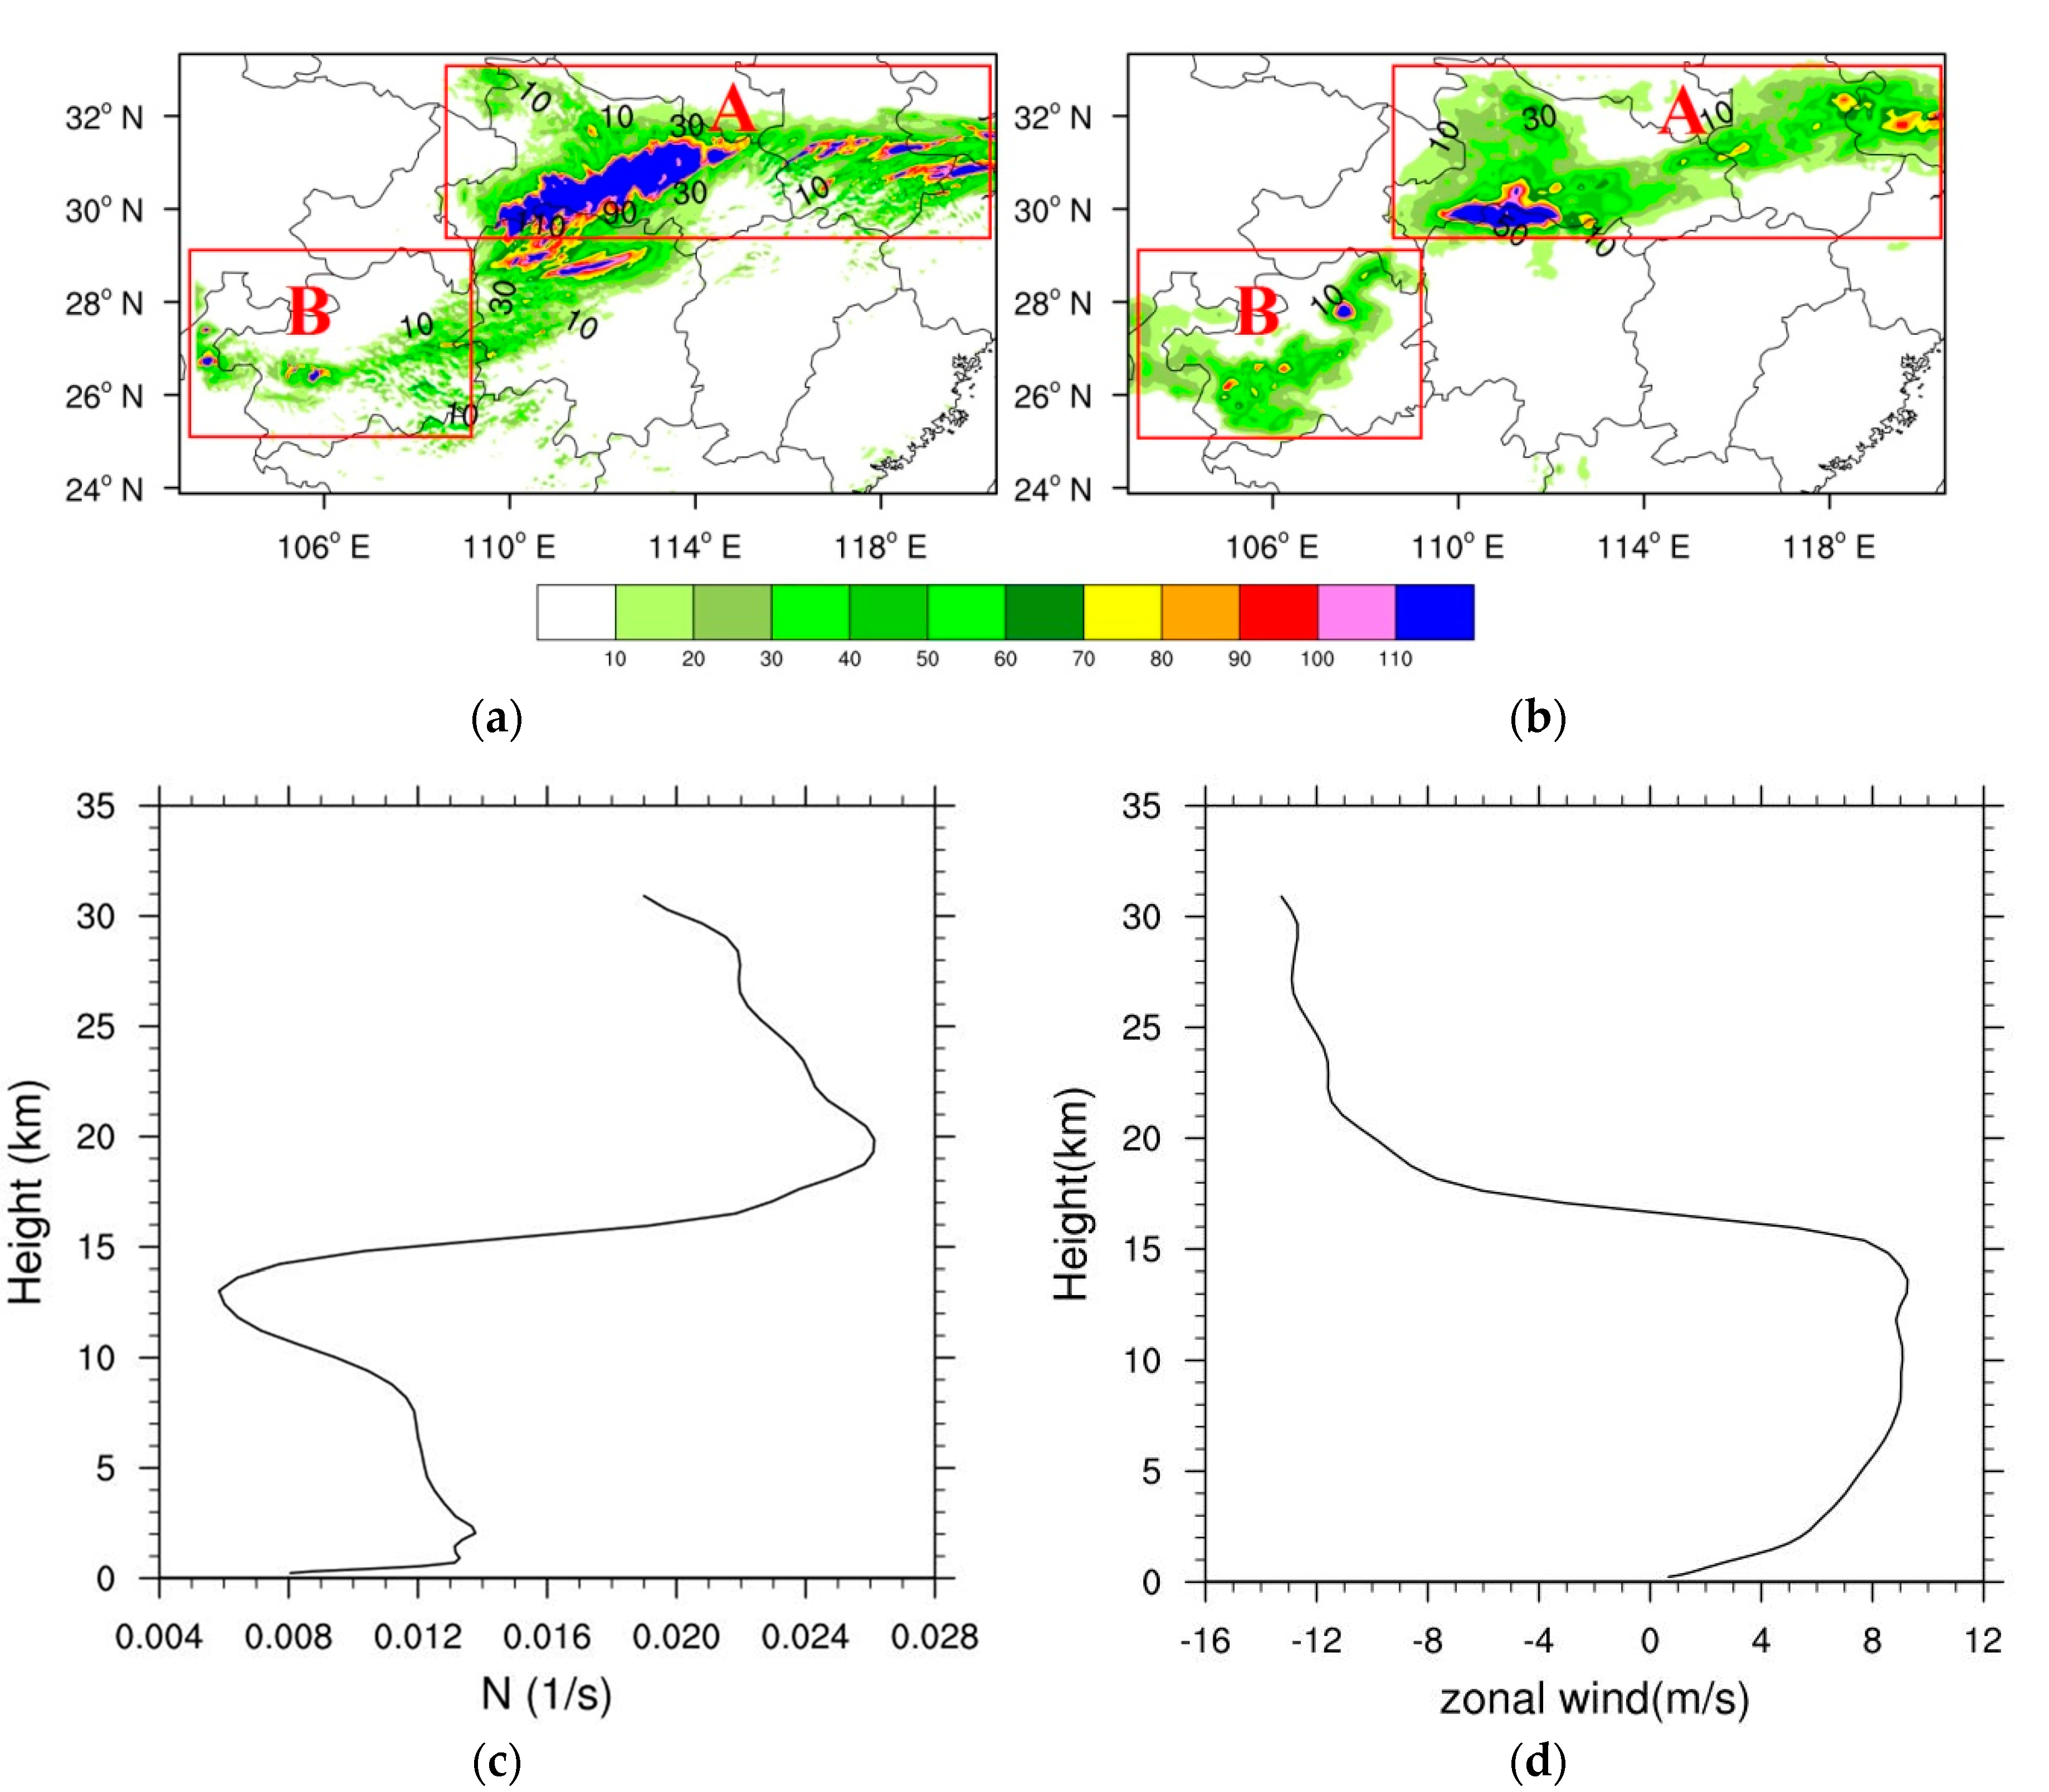
Figure 3a,b shows the 12 h accumulated precipitation from 1200 UTC 17 June to 0000 UTC 18 June based on observations and simulations. It can be found that the precipitation can be divided into two parts in the red boxes A and B, respectively (Figure 3b). The precipitation in the red box A, which is located in the middle and lower reaches of the Yangtze River, distributes as East-West belt-shaped. The precipitation in red box B is a semicircular pattern in the southwest of the box A. The simulated precipitation (Figure 3a) is slightly higher than the observed one (Figure 3b). However, the simulation nonetheless adequately reflects the patterns and locations of the rainfall. Therefore, the simulation results can be suitable for the analysis of the characteristics of gravity waves.
Figure 3c,d show the vertical distribution of the Brunt–Väisälä frequency and the zonal wind averaged over the whole domain shown in Figure 3a. In Figure 3c, the Brunt–Väisälä frequency decreases with altitude from 2 to 13 km, reaches a minimum at 13 km, increases significantly from 13 to 19 km, and is relatively constant but slowly decreases above 19 km. Figure 3d shows that the direction of wind changes near 17 km, with westerly wind below and easterly wind above. The easterly wind speed above 19 km is relatively constant at 12 m s−1. Based on the vertical distribution of wind and the Brunt–Väisälä frequency, we conclude that the tropopause of the low vortex system is near 17 km, which is consistent with analyses of the Mei-Yu front [15,31]. In the lower stratosphere, the background wind is easterly wind with a wind speed of ~12 m s−1, the Brunt–Väisälä frequency N 0 is ~0.023 s−1, the corresponding stratification parameter is N 0 2 = 5 × 10 4   s 2 , and the background wind near the tropopause is very small.
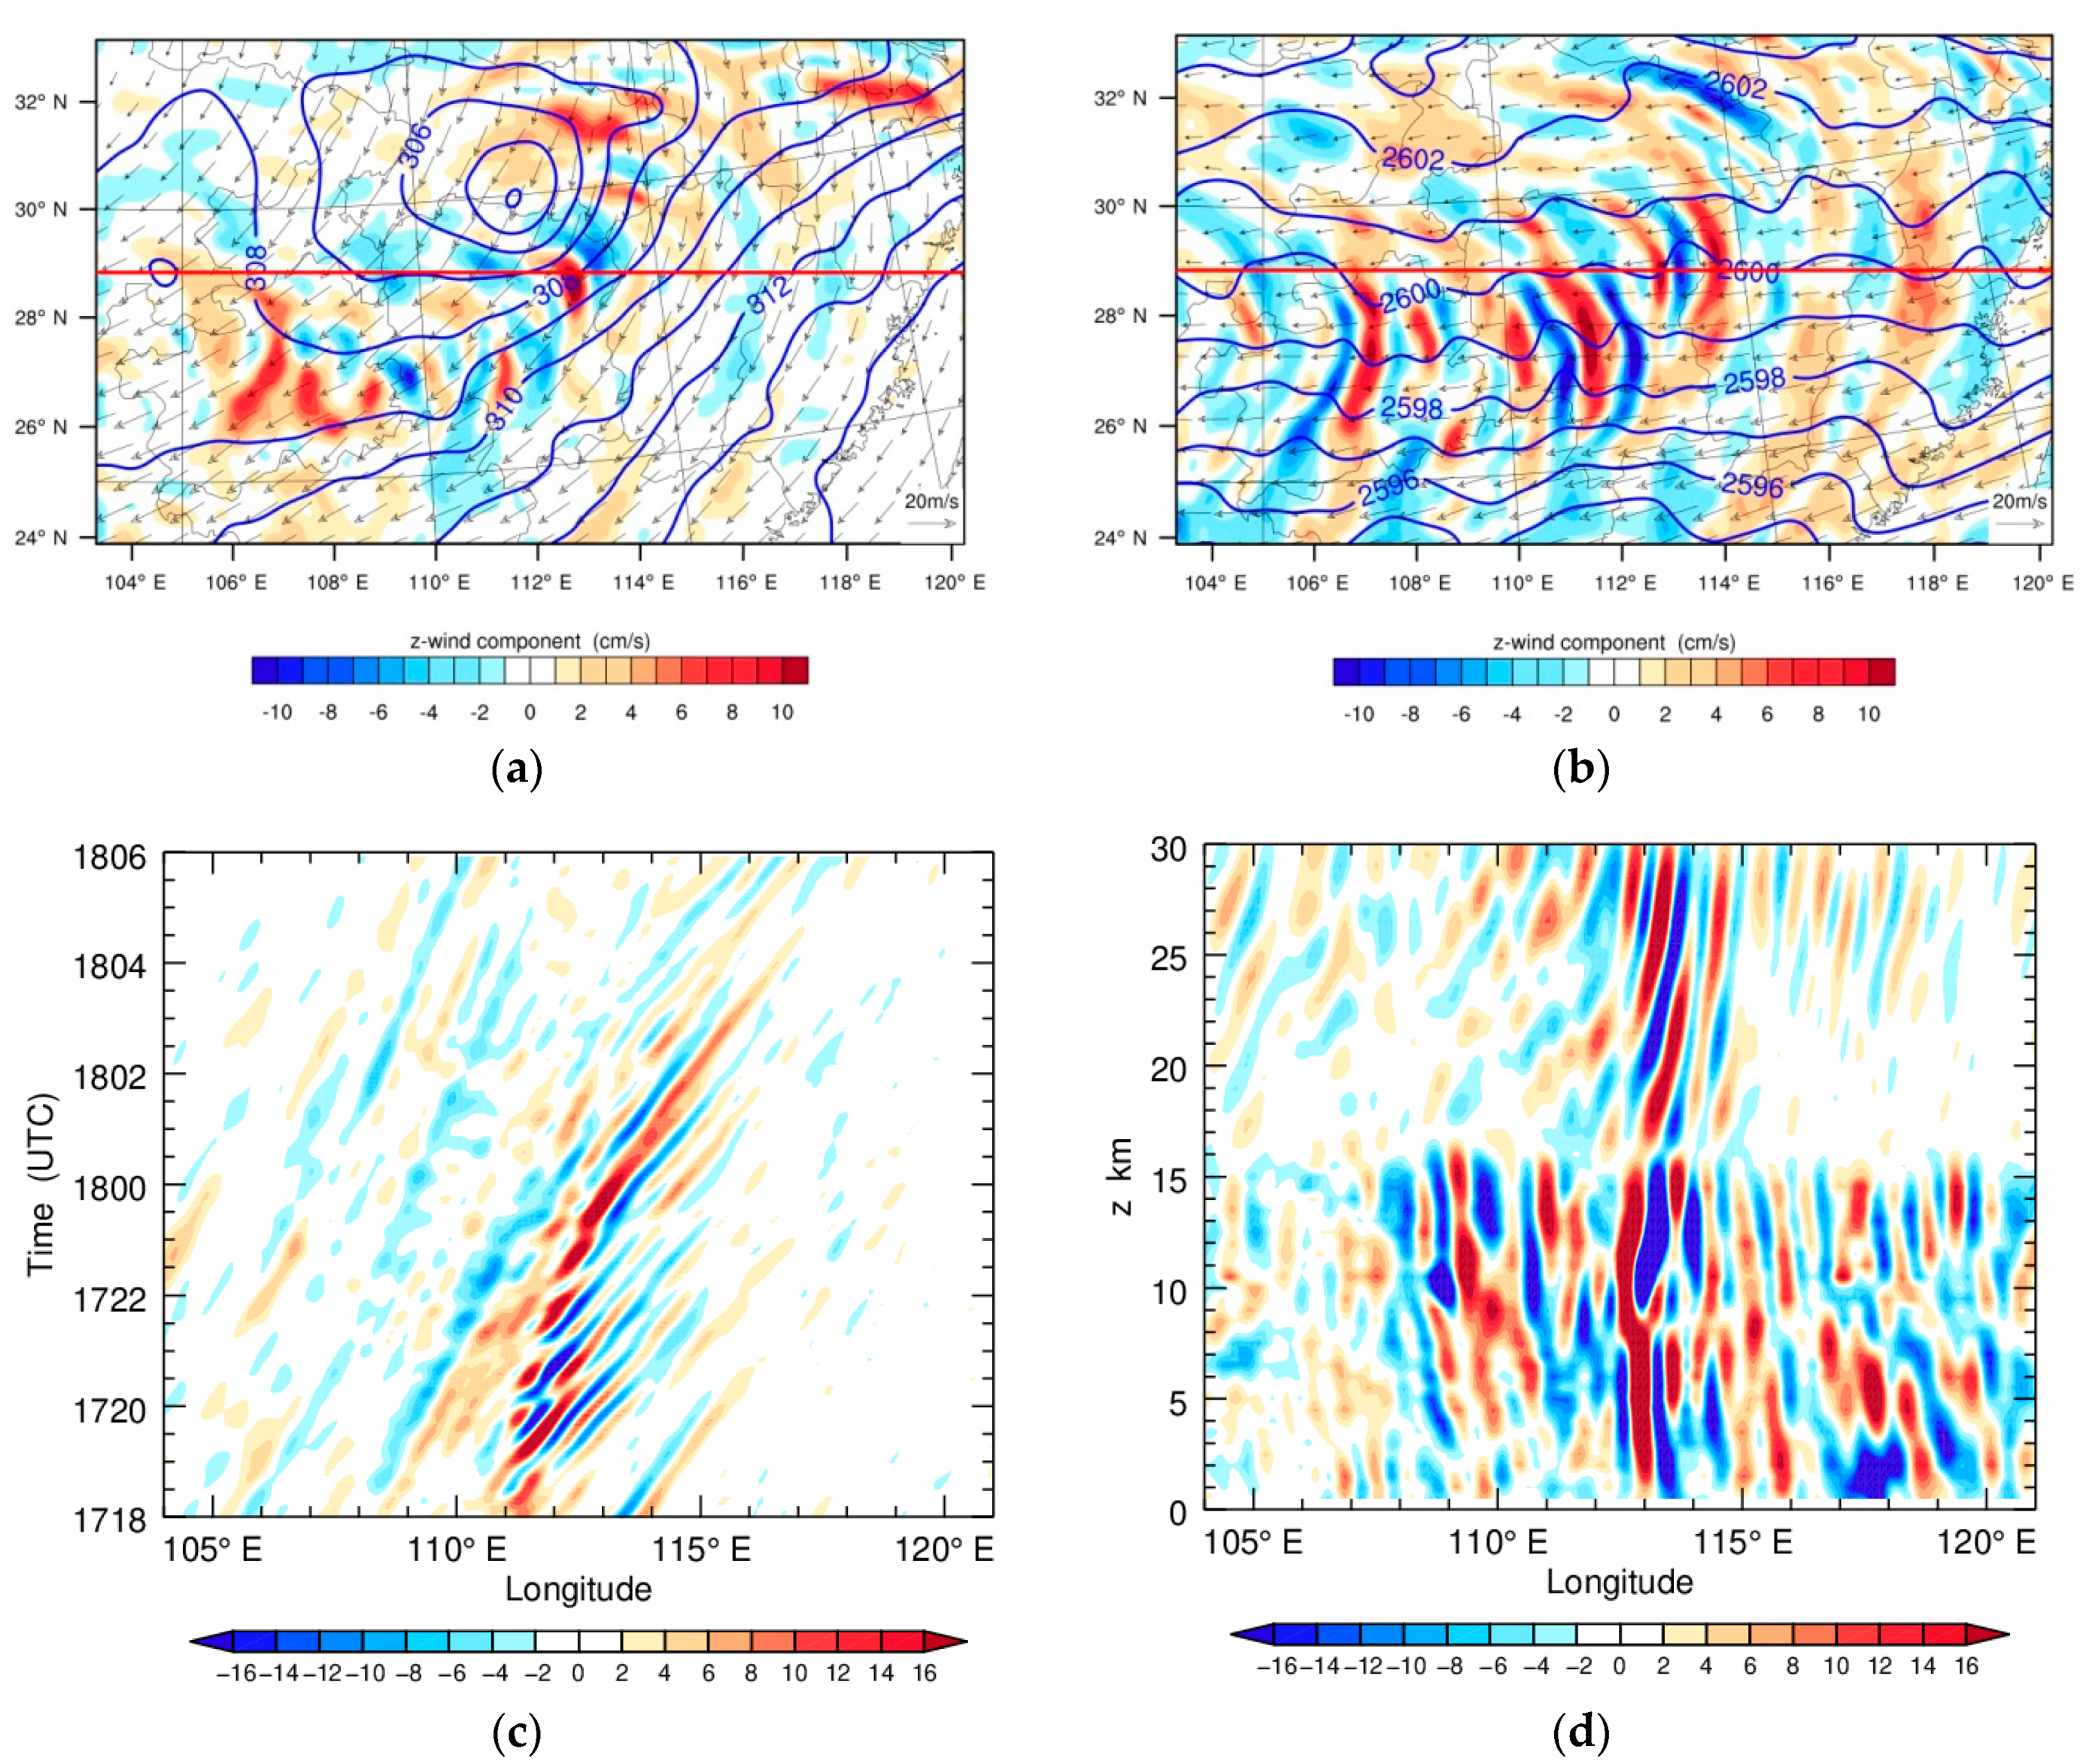
The distributions of vertical velocity and horizontal wind are shown in Figure 4a,b. In Figure 4a, the center of the low vortex is located at ( 30 N , 112.5 E ) (the junction of Hubei and Hunan Provinces, in China). There are rain belts on the east and south sides of the low vortex center, and the 12 h accumulated precipitation in the center of the rain belt reaches 110 mm (Figure 3a). The deep convection accompanying the heavy rainfall and latent heating from convection are conducive to the generation of gravity waves [32]. Near both the tropopause (z = 18 km) and in the lower stratosphere (z = 26 km), the wave patterns of vertical velocity with positive and negative phases appear south of the low vortex center. Nevertheless, the wave structure at z = 26 km in the lower stratosphere is more noticeable, and the magnitude of vertical velocity is larger than that at z = 18 km. As shown in Figure 4b, the wave phase lines at z = 26 km are generally distributed from north to south, and are nearly perpendicular to the background wind (easterly wind).
To better detect the waves, the vertical velocity in Figure 4c,d is filtered by the 50–200 km bandpass filter [10,15]. Figure 4c shows a time–longitude distribution of the 50–200 km bandpass-filtered vertical velocity at z = 18 km along the red line in Figure 4a, to illustrate the detailed propagation and evolution of the waves. It clearly shows that the waves at z = 18 km propagate eastward. However, the zonal wind at z = 18 km is easterly wind (Figure 3d), and the gravity waves propagate against the background wind direction as the same wave characteristics in Kim et al. [33]. In addition, the horizontal wavelength of the gravity wave is ~100 km.
Figure 4d shows the vertical cross-section of vertical velocity along the red line in Figure 4a. We have made many cross-sections of the vertical velocity along different latitudes near the rainfall area. Through the analyses of the cross-sections of the vertical velocity, we find similar features in different cross-sections that shows that the distribution of the vertical velocity varies greatly in the troposphere and stratosphere. Besides, the waves, which are able to propagate to the stratosphere, are mainly located in the heavy rainfall area. Therefore, in order to display the differences of waves in the troposphere and stratosphere, we only select the cross-section along the red line in Figure 4a to investigate the characteristics of the waves. The vertical motion in the troposphere is stronger than that in the stratosphere, and positive and negative regions of vertical velocity related to the strong convection are vertically distributed and propagate along the horizontal direction. The same wave structures propagating horizontally in the troposphere can also be found in a series of studies [15,32]. Those positive–negative alternate structures propagating along the horizontal direction in the upper troposphere are more likely to be wave activities generated by convection. However, in the stratosphere above the tropopause, the phase lines are tilted, which indicates that the gravity wave in the stratosphere propagates not only in the horizontal direction, but also in the vertical direction. At this time, the tropopause is the transition layer between the two distinct regions of vertical motion.
In Figure 4d, it can be found that the positive–negative alternate structures of vertical velocity in the upper troposphere strike the tropopause. Especially, this phenomenon near 113° E is extremely prominent. Thus, the fluctuation at 15–17 km is a key factor connecting tropospheric convection and stratospheric wave. This fluctuation propagating horizontally can be regarded as a BO which produces vertically propagating waves in the stratosphere, and the BO is related to convection in the troposphere. In the study of Fovell et al. [23], they used different forcing sources in the upper troposphere and the phase lines of these forcing generated gravity waves tilted from the vertical direction in the stratosphere. In addition, the structure of the waves in Figure 4 is similar to that in the study of Fovell et al. [23]. Therefore, the BO is caused by the strong convection at the tropopause, and the stratospheric gravity wave is the response to this forcing, which indicates that the mechanical oscillator mechanism is indeed an important mechanism for stratospheric gravity waves generated by strong convection.
It can also be found that not all the buoyancy oscillation in the troposphere can generate prominent stratospheric gravity waves, while the amplitude of the stratospheric gravity waves near 113° E is the largest. As the results of the analysis in Section 3.2, the background wind in the lower stratosphere is an important factor to affect resonance, and the resonance can select the specific wave and make the wave amplitude increase significantly. Thus, the resonance may occur near 113° E and the vertical wavenumbers of gravity waves in the lower stratosphere may be close to that of the ICWs. We can also regard this situation as the resonance selectivity of the stratospheric environment.

4. Conclusions

The mesoscale convection is a ubiquitous phenomenon in the troposphere, and convection is an important source of stratospheric gravity waves. To explore the mechanism of stratospheric gravity waves generated by convection is an important scientific problem.
In this paper, taking the tropopause as the bottom boundary and using the non-hydrostatic, two-dimensional, and linear equations, we investigate the generation of gravity waves in the lower stratosphere. The analytical solution of gravity waves in the stratosphere is derived under conditions of forced bottom boundary. This FGW solution can be used as a theoretical description of the MOM for stratospheric gravity waves generated by convection. This gravity wave generation mechanism is based on a response to BO forcing at the tropopause.
The theoretical solution indicates that the properties of the FGW, such as wavelength, frequency, and amplitude, are related to those of the BO at the tropopause, and are also affected by the stratospheric environment, particularly the background wind. When the vertical wavenumber of the FGW is close to that of the ICW, resonance occurs. From the analytical results, we can find that the amplitude of the gravity wave in the stratosphere is much larger than that of the BO when the vertical wavenumber is close to that of the ICW. This resonance suggests that the stratospheric environment can select the FGWs with the same vertical wavenumber, and make the waves be dominated in the stratosphere. Through the relationship between wavenumber and frequency, we can also get that the vertical wavelength has positive correlation with the horizontal wavenumber and the frequency.
The numerical simulation results of a low vortex system accompanying a rainstorm validate the mechanical oscillator mechanism for stratospheric gravity waves generated by convection. The forcing oscillation caused by strong convection exists near the tropopause, and FGWs in the stratosphere are the response to BOs, which indicates that the mechanical oscillator mechanism is indeed an important mechanism by which convection generates stratospheric gravity waves.

Author Contributions

Conceptualization, S.Y., L.Z. and M.Z.; methodology, S.Y., L.Z. and M.Z.; software, S.Y., L.Z. and M.Z.; validation, S.Y. and L.Z.; formal analysis, S.Y.; investigation, S.Y.; resources, S.Y.; data curation, S.Y.; writing—original draft preparation, S.Y., L.Z. and M.Z.; writing—review and editing, S.Y., L.Z., M.Z. and Y.W.; visualization, S.Y. and M.Z.; supervision, S.Y., L.Z. and Y.W.; project administration, S.Y., L.Z. and Y.W.; funding acquisition, S.Y., L.Z. and Y.W. All authors have read and agreed to the published version of the manuscript.

Funding

This research was funded by the National Nature Science Foundation of China, grant number 41975066; the Beijige Open Research Fund for Nanjing Joint Center of Atmospheric Research, grant number NJCAR2018ZD03.

Acknowledgments

We are grateful to the editor and the three anonymous reviewers for their careful work and valuable comments that helped to improve the manuscript. The WRF model developed by NCAR was employed.

Conflicts of Interest

The authors declare no conflict of interest.

References

  1. Holton, J.R.; Haynes, P.H.; McIntyre, M.E.; Douglass, A.R.; Road, R.B.; Pfister, L. Stratosphere–troposphere exchange. Rev. Geophys. 1995, 33, 403–439. [Google Scholar] [CrossRef]
  2. Fritts, D.C.; Alexander, M.J. Gravity wave dynamics and effects in the middle atmosphere. Rev. Geophys. 2003, 41, 1003. [Google Scholar] [CrossRef] [Green Version]
  3. Cohen, N.Y.; Boos, W.R. Modulation of subtropical stratospheric gravity waves by equatorial rainfall. Geophys. Res. Lett. 2016, 43, 466–471. [Google Scholar] [CrossRef] [Green Version]
  4. Alexander, M.J.; Grimsdell, A.W.; Stephan, C.C.; Hoffmann, L. MJO-related intraseasonal variation in the stratosphere: Gravity waves and zonal winds. J. Geophys. Res. Atmos. 2018, 123, 775–788. [Google Scholar] [CrossRef] [Green Version]
  5. Chen, L.; Bian, J.C.; Liu, Y.; Qiao, S. Statistical analysis of inertial gravity wave parameters in the lower stratosphere over Northern China. Clim. Dyn. 2019, 52, 563–575. [Google Scholar] [CrossRef]
  6. Xu, X.; Wang, Y.; Xue, M.; Zhu, K. Impacts of horizontal propagation of orographic gravity waves on the wave drag in the stratosphere and lower mesosphere. J. Geophys. Res. Atmos. 2017, 122, 11301–11312. [Google Scholar] [CrossRef]
  7. Clark, T.L.; Hauf, T.; Kuettner, J.P. Convectively forced internal gravity waves: Results from two-dimensional numerical experiments. Q. J. R. Meteorol. Soc. 1986, 112, 899–925. [Google Scholar] [CrossRef]
  8. Snyder, C.; Skamarock, W.C.; Rotunno, R. Frontal dynamics near and following frontal collapse. J. Atmos. Sci. 1993, 50, 3194–3212. [Google Scholar] [CrossRef]
  9. Zhang, F. Generation of mesoscale gravity waves in the upper-tropospheric jet–front systems. J. Atmos. Sci. 2004, 61, 440–457. [Google Scholar] [CrossRef] [Green Version]
  10. Wei, J.; Zhang, F. Mesoscale gravity waves in moist baroclinic jet–front systems. J. Atmos. Sci. 2014, 71, 929–952. [Google Scholar] [CrossRef] [Green Version]
  11. Pfister, L.; Scott, S.; Loewenstein, M. Mesoscale disturbances in the tropical stratosphere excited by convection: Observations and effects on the stratospheric momentum budget. J. Atmos. Sci. 1993, 50, 1058–1075. [Google Scholar] [CrossRef] [Green Version]
  12. Alexander, M.J.; Vincent, R.A. Gravity waves in the tropical lower stratosphere: A model study of seasonal and interannual variability. J. Geophys. Res. Atmos. 2000, 105, 17983–17993. [Google Scholar] [CrossRef]
  13. Vadas, S.L. Compressible F-plane solutions to body forces, heatings, and coolings, and application to the primary and secondary gravity waves generated by a deep convective plume. J. Geophys. Res. Space Phys. 2013, 118, 2377–2397. [Google Scholar] [CrossRef]
  14. Chen, D.; Chen, Z.Y.; Lü, D.R. Spatiotemporal spectrum and momentum flux of the stratospheric gravity waves generated by a typhoon. Sci. China Earth Sci. 2013, 56, 54–62. [Google Scholar] [CrossRef]
  15. Wang, Y.; Zhang, L.; Peng, J.; Guan, J. Mesoscale Gravity Waves in the Mei-Yu Front System. J. Atmos. Sci. 2018, 75, 587–609. [Google Scholar] [CrossRef]
  16. Lin, Y.L.; Smith, R.B. Transient dynamics of airflow near a local heat source. J. Atmos. Sci. 1986, 43, 40–49. [Google Scholar] [CrossRef] [Green Version]
  17. Bretherton, C.S. Group velocity and the linear response of stratified fluids to internal heat or mass sources. J. Atmos. Sci. 1988, 45, 81–93. [Google Scholar] [CrossRef] [Green Version]
  18. Piani, C.; Durran, D.R.; Alexander, M.J.; Holton, J.R. A numerical study of three-dimensional gravity waves triggered by deep tropical convection and their role in the dynamics of the QBO. J. Atmos. Sci. 2000, 57, 3689–3702. [Google Scholar] [CrossRef] [Green Version]
  19. Sayed, A.A.M.; Campbell, L.J. A two-layer model for steady-amplitude gravity waves and convection generated by a thermal forcing. J. Atmos. Sci. 2018, 75, 2199–2216. [Google Scholar] [CrossRef]
  20. Beres, J.H.; Alexander, M.J.; Holton, J.R. Effects of tropospheric wind shear on the spectrum of convectively generated gravity waves. J. Atmos. Sci. 2002, 59, 1805–1824. [Google Scholar] [CrossRef] [Green Version]
  21. Lai, C.; Yue, J.; Xu, J. Suomi NPP VIIRS/DNB imagery of nightglow gravity waves from various sources over China. Adv. Space Res. 2017, 59, 1951–1961. [Google Scholar] [CrossRef]
  22. Pierce, A.D.; Coroniti, S.C. A mechanism for the generation of acoustic–gravity waves during thunderstorm formation. Nature 1966, 210, 1209–1210. [Google Scholar] [CrossRef]
  23. Fovell, R.; Durran, D.; Holton, J.R. Numerical simulations of convectively generated stratospheric gravity waves. J. Atmos. Sci. 1992, 49, 1427–1442. [Google Scholar] [CrossRef] [Green Version]
  24. Alexander, M.J.; Pfister, L. Gravity wave momentum flux in the lower stratosphere over convection. Geophys. Res. Lett. 1995, 22, 2029–2032. [Google Scholar] [CrossRef] [Green Version]
  25. Lane, T.P.; Reeder, M.J.; Clark, T.L. Numerical modeling of gravity wave generation by deep tropical convection. J. Atmos. Sci. 2001, 58, 1249–1274. [Google Scholar] [CrossRef]
  26. Lane, T.P.; Reeder, M.J. Convectively generated gravity waves and their effect on the cloud environment. J. Atmos. Sci. 2001, 58, 2427–2440. [Google Scholar] [CrossRef]
  27. Chun, H.-Y.; Song, I.-S.; Horinouchi, T. Momentum flux spectrum of convectively forced gravity waves: Can diabatic forcing be a proxy for convective forcing? J. Atmos. Sci. 2005, 62, 4113–4120. [Google Scholar] [CrossRef]
  28. Choi, E.-H.; Chun, H.-Y. Generation mechanisms of convectively induced internal gravity waves in a three-dimensional framework. Asia-Pac. J. Atmos. Sci. 2014, 50, 163–177. [Google Scholar] [CrossRef]
  29. Lecoanet, D.; Quataert, E. Internal gravity wave excitation by turbulent convection. R. Astron. Soc. 2013, 430, 2363–2376. [Google Scholar] [CrossRef] [Green Version]
  30. Zhang, M.; Zhang, L. Semi-circle theorem of unstable spectrum distribution of heterotropic perturbation and the upper bound estimation of its growth rate. Adv. Atmos. Sci. 2002, 19, 35–44. [Google Scholar]
  31. Peng, J.; Zhang, L.; Luo, Y.; Zhang, Y. Mesoscale energy spectra of the Mei-Yu front system. Part I: Kinetic energy spectra. J. Atmos. Sci. 2014, 71, 37–55. [Google Scholar] [CrossRef]
  32. Du, Y.; Zhang, F. Banded convective activity associated with mesoscale gravity waves over southern China. J. Geophys. Res. Atmos. 2019, 124, 1912–1930. [Google Scholar] [CrossRef]
  33. Kim, S.-Y.; Chun, H.-Y.; Wu, D.L. A study on stratospheric gravity waves generated by Typhoon Ewiniar: Numerical simulations and observations. Geophys. Res. Lett. 2009, 114, D22104. [Google Scholar] [CrossRef] [Green Version]
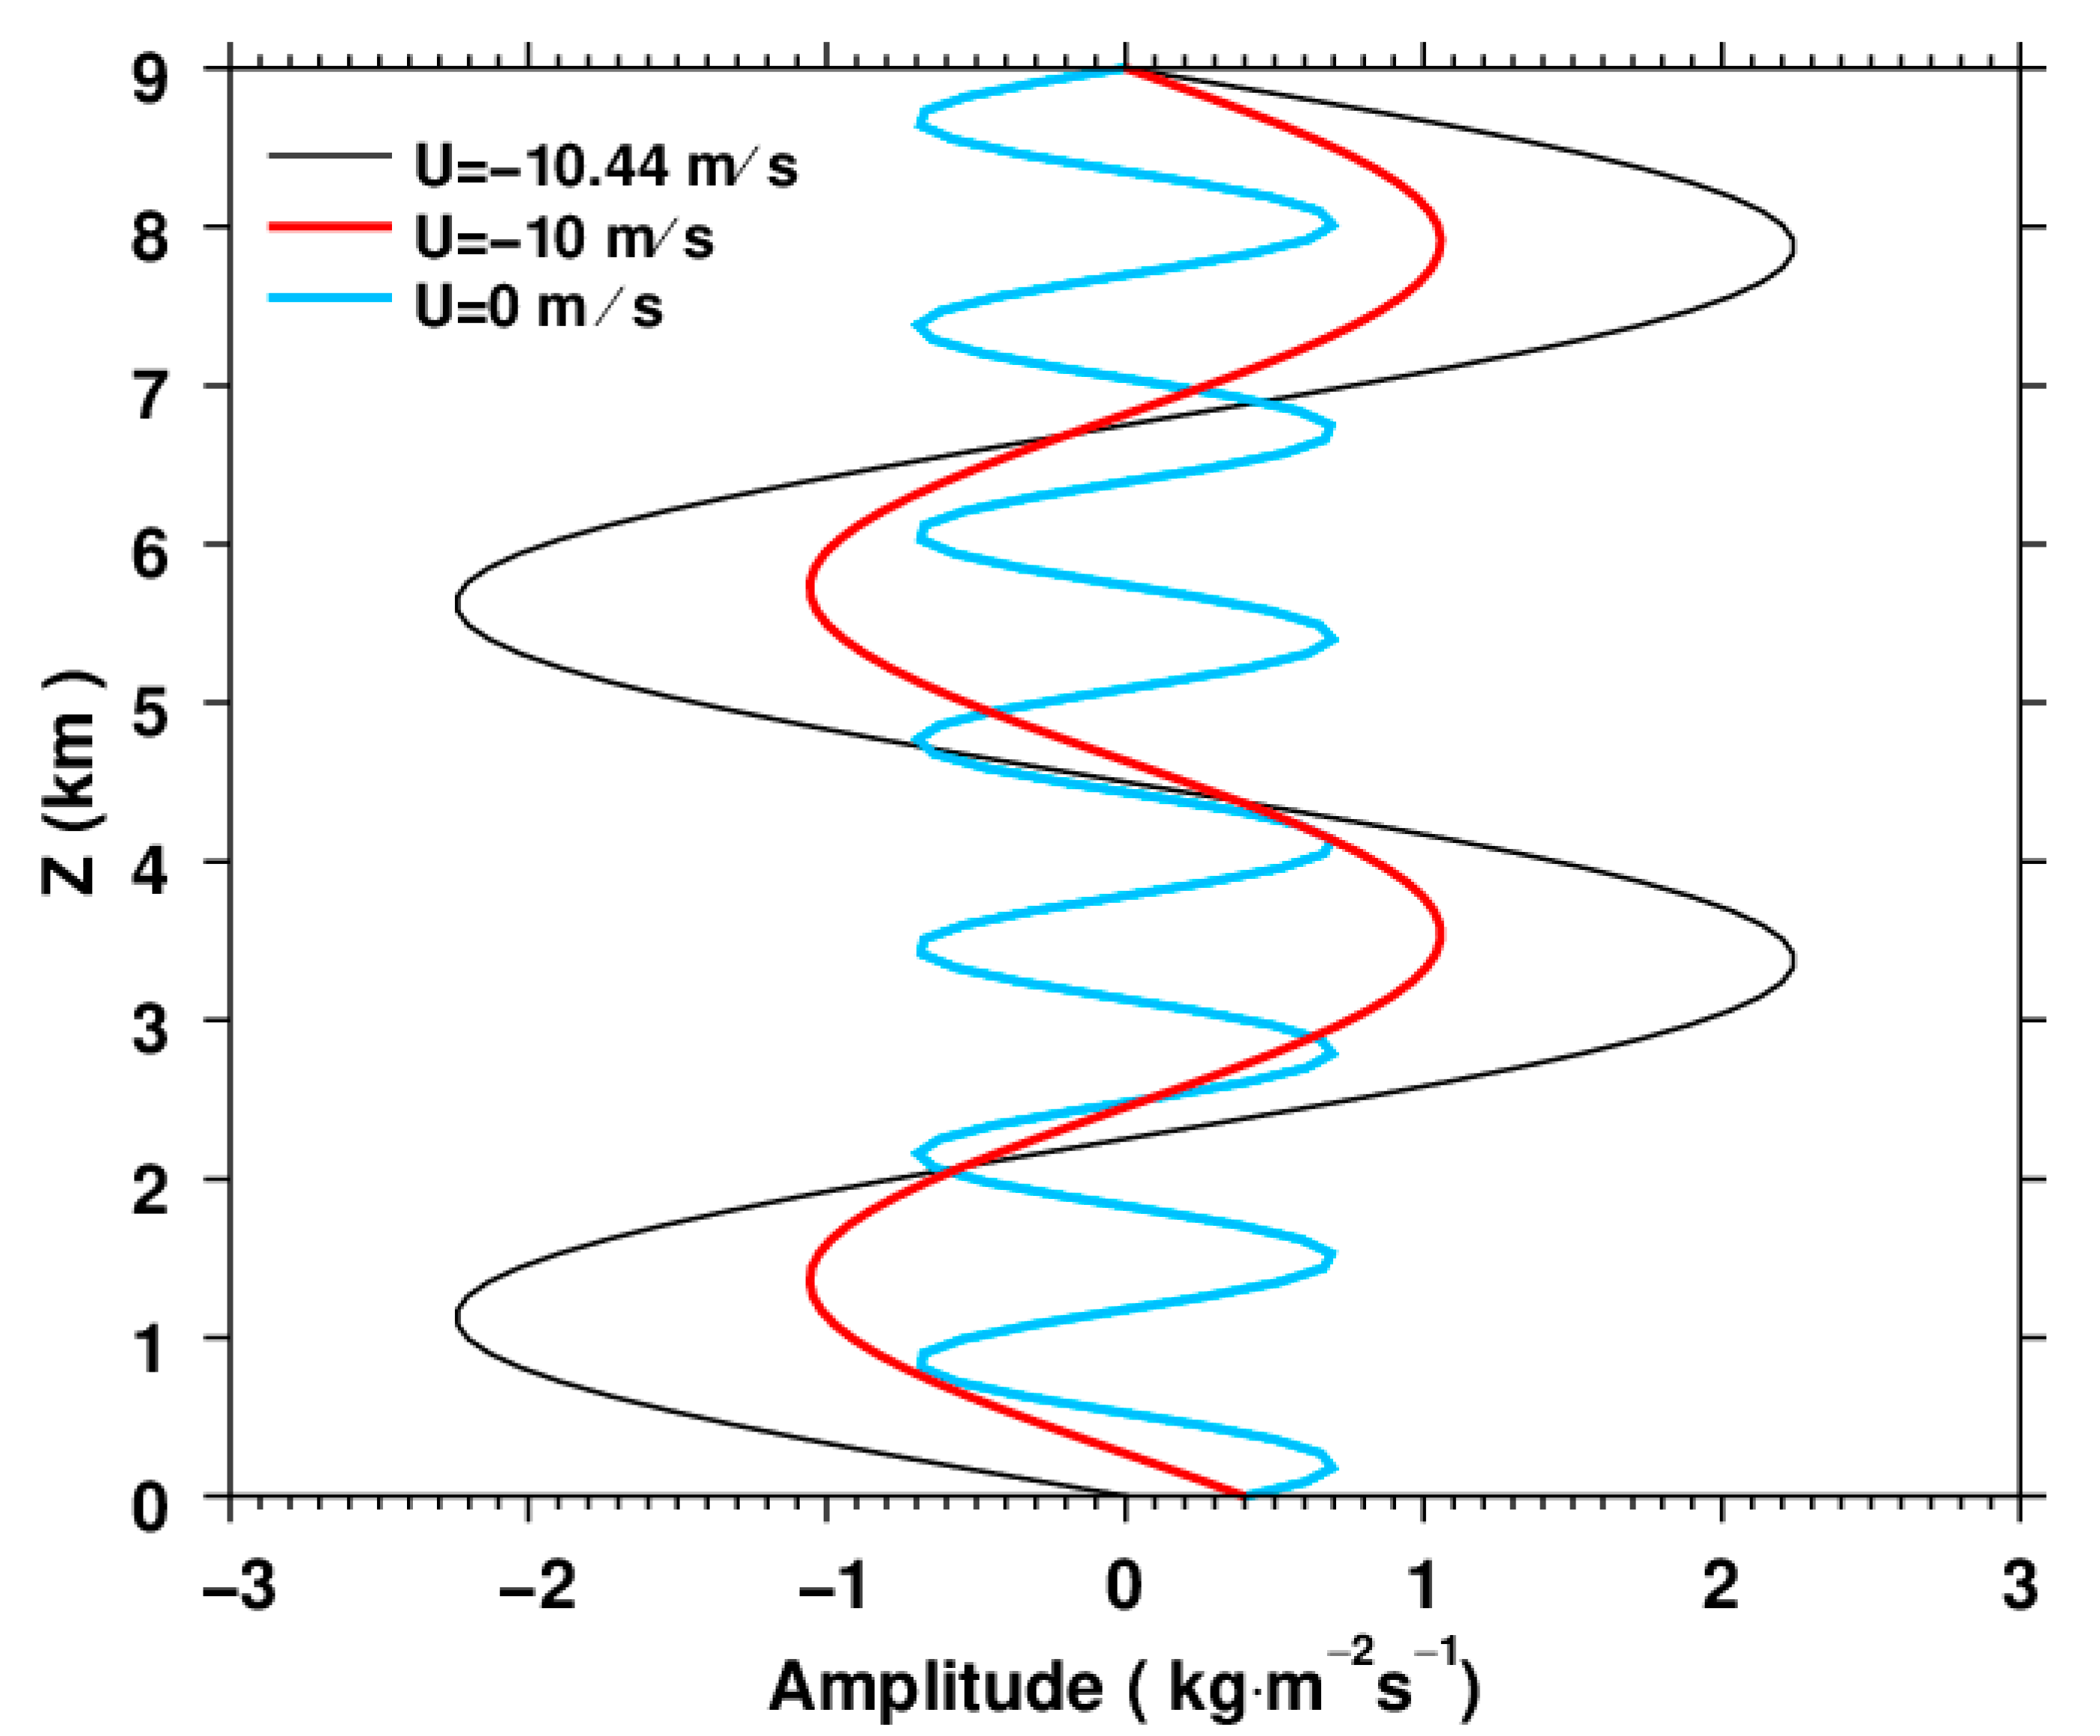
Figure 1. Vertical profiles of W ( kg m 2 s 1 ) for three different background flows: u ¯ = 0 , −10, and −10.44 m   s 1 . The horizontal coordinate is the amplitude of W and the vertical coordinate represents the vertical height in the lower stratosphere. The level z = 0 indicates the bottom of the lower stratosphere. Note that the amplitudes for u ¯ = 0   m   s 1 and u ¯ = 10   m   s 1 have been increased by a factor of 40.
Atmosphere 11 00942 g001
Figure 2. Relationship between the vertical wavelength of the forced gravity wave (FGW) and (a) the horizontal wavelength and (b) frequency.
Atmosphere 11 00942 g002
Figure 3. The 12 h accumulated precipitation (shading; mm) from 1200 UTC 17 June to 0000 UTC 18 June of the simulation (a), and the observation (b). The red boxes A and B are shown in Figure 3a,b, indicating two areas of the rainfall. The vertical profiles of the averaged Brunt–Väisälä frequency (s−1) (c,d) the averaged zonal wind (m s−1) at 0000 UTC 18 June.
Atmosphere 11 00942 g003
Figure 4. Horizontal distributions of vertical velocity (shading; cm s−1) and horizontal wind (arrows; m s−1) at 0000 UTC 18 June for (a) z = 18 km and geopotential heights at 700 hPa (blue lines; dagpm), and (b) z = 26 km and geopotential heights at 22 hPa (blue lines; dagpm). The red lines in (a) and (b) indicate the same truncated lines of cross-section. (c) Time–longitude distribution of the 50–200 km bandpass-filtered vertical velocity (units: cm s−1) at z = 18 km along the red line in (a) from 1800 UTC 17 June to 0600 UTC 18 June, and (d) the vertical cross-section of vertical velocity (shading; cm s−1) along the red line in (a).
Atmosphere 11 00942 g004
Table 1. Parameters of the forced gravity waves for three different background flows.
Background Flow (m s−1)Horizontal Wave Speed (m s−1)Vertical Wavelength (km) Largest   Amplitude   ( kg m 2 s 1 )
Case 1 u ¯ = 0 4.631.30.017
Case 2 u ¯ = 10 4.634.370.03
Case 3 u ¯ = 10.44 4.634.52.4