Article

Distribution Characteristics of Aerosol Size and CCN during the Summer on Mt. Tian and Their Influencing Factors

1
Collaborative Innovation Center on Forecast and Evaluation of Meteorological Disasters, Key Laboratory for Aerosol-Cloud-Precipitation of China Meteorological Administration, Nanjing University of Information Science &Technology, Nanjing 210044, China
2
Chinese Academy of Meteorological Science, Key Laboratory for Cloud Physics of China Meteorological Administration, Beijing 100081, China
3
Xinjiang Weather Modification Office, Urumqi 830002, China
*
Author to whom correspondence should be addressed.
Atmosphere 2020, 11(9), 912; https://doi.org/10.3390/atmos11090912
Submission received: 4 July 2020 / Revised: 21 August 2020 / Accepted: 26 August 2020 / Published: 27 August 2020
(This article belongs to the Special Issue Aerosol-Climate Interaction)

Abstract

:
The aerosol size distribution and cloud condensation nuclei (CCN) number concentration were measured using a wide-range particle spectrometer (WPS) and a cloud condensation nuclei counter (CCNC) on Mt. Tian from 31 July to 9 September, 2019. Combined with meteorological data, distribution characteristics of aerosol size and CCN and their influencing factors were analyzed. The results indicated that the mean aerosol number concentration was 5475.6 ± 5636.5 cm−3. The mean CCN concentrations were 183.7 ± 114.5 cm−3, 729.8 ± 376.1 cm−3, 1630.5 ± 980.5 cm−3, 2162.5 ± 1345.3 cm−3, and 2575.7 ± 1632.9 cm−3 at supersaturation levels of 0.1%, 0.2%, 0.4%, 0.6%, and 0.8%, respectively. The aerosol number size distribution is unimodal, and the dominant particle size is 30–60 nm. Affected by the height of the boundary layer and the valley wind, the diurnal variation in aerosol number concentration shows a unimodal distribution with a peak at 17:00, and the CCN number concentration showed a bimodal distribution with peaks at 18:00 and 21:00. The particle size distribution and supersaturation have a major impact on the activation of the aerosol into CCN. At 0.1% supersaturation (S), the 300–500 nm particles are most likely to activate to CCN. Particles of 100–300 nm are most easily activated at 0.2% (S), while particles of 60–80 nm are most likely activated at high supersaturation (≥0.4%). The concentrations of aerosol and CCN are higher in the northerly wind. Ambient relative humidity (RH) has little relationship with the aerosol activation under high supersaturation. According to N = CSk fitting the CCN spectrum, C = 3297 and k = 0.90 on Mt. Tian, characteristic of the clean continental type.

1. Introduction

Aerosols can be activated into cloud condensation nuclei (CCN) or ice nuclei at cloud supersaturation (S), participate in cloud microphysical processes, and then affect clouds and precipitation [1,2,3]. The size and chemical composition of aerosols determine whether they can be activated into CCN or ice nuclei [4,5,6]. CCN can connect aerosols and clouds directly and quantitatively, and the study of CCN is conducive to addressing some outstanding issues regarding aerosol-CCN-cloud-climate connections [7,8]. The indirect radiative forcing effect of the aerosol is the most uncertain factor in climate modeling and prediction [9], largely due to insufficient understanding of the aerosol nucleation properties. Measurement of aerosols and assessment of their ability to activate as CCN is significant, helping to further facilitate our understanding of the impacts of aerosols on regional and global climate.
The aerosol concentration directly determines the amount of CCN, and the temporal and spatial distribution of aerosols varies greatly, resulting in the differences in CCN distribution [10,11,12]. Model parameterizations for CCN prediction have been carried out in many regions by using particle size distribution, chemical composition, and hygroscopicity [13,14,15,16]. Many observations indicate that CCN originate mainly from the ground, the CCN concentration decreases with height, and the cloud has a depleting effect on CCN [17,18,19,20]. New particle formation (NPF) is a large source of CCN in the tropics [21]. After NPF were observed at Sichuan rural stations, the CCN concentration increased by approximately 20% on average [22]. CCN activated in marine boundary layer clouds were strongly influenced by entrainment from the free troposphere [23].
The analysis of atmospheric pollutants at alpine sites is more regionally representative, and the study of aerosol physical and chemical properties at the top of the boundary layer is a prerequisite for understanding which aerosols will be transported to the free troposphere [24]. Aerosol observations at the top of the boundary layer are concentrated mostly at the top of mountains. NPF in Mt. Huang tends to occur in sunny, low temperature, low humidity, high SO2, and O3 environments [25]. The dominant size of the aerosol number concentration is observed at 10–20 nm at the summit of Mt. Tai, and the NPF events were influenced mostly by foreign transport processes [26,27]. In the analysis of CCN closure at Mt. Huang and Mt. Tai, the influence of aerosol number distribution on CCN number concentration was found to be greater than the influence of chemical composition [28,29]. The mean CCN concentration of 0.5% supersaturation at Mt. Helan in the summer is 610 cm−3, and the CCN concentration did not increase significantly in the dust weather [30]. The diurnal variation of CCN at different altitudes at Mt. Hua is different, showing a unimodal type at the mountainside, while the diurnal variation of CCN at the foot of the mountain presents a bimodal type [31].
As the largest independent latitudinal mountain system in the world, Mt. Tian accounts for approximately one-third of the area of the Xinjiang Uygur Autonomous Region. This region has a typical temperate continental arid climate. Orographic clouds often appear above the mountain in the summer, and precipitation is relatively frequent. When the orographic cloud occurs, the cloud drops that flow over the hilly area often can grow into precipitation particles in a short time before reaching the leeward slope. Due to the lack of ice nuclei in the cloud, artificial influence exercised by seeding catalyst into the cloud can achieve the purpose of rainfall enhancement.
Relying on the Weather Modification Ability Construction Project of Northwest China, aerosol size distribution and CCN number concentration were measured using a wide-range particle spectrometer (WPS) and a cloud condensation nuclei counter (CCNC) on Mt. Tian from 31 July to 9 September 2019. Combined with meteorological elements, distribution characteristics of aerosol size and CCN during the summer and their influencing factors were analyzed. Deepening the understanding of aerosol nucleation properties in the northwest background area and providing the observation basis and parameterization schemes for the subsequent orographic cloud numerical model and cloud-seeding experiments in this area have proven to be beneficial.

2. Experimental Methods

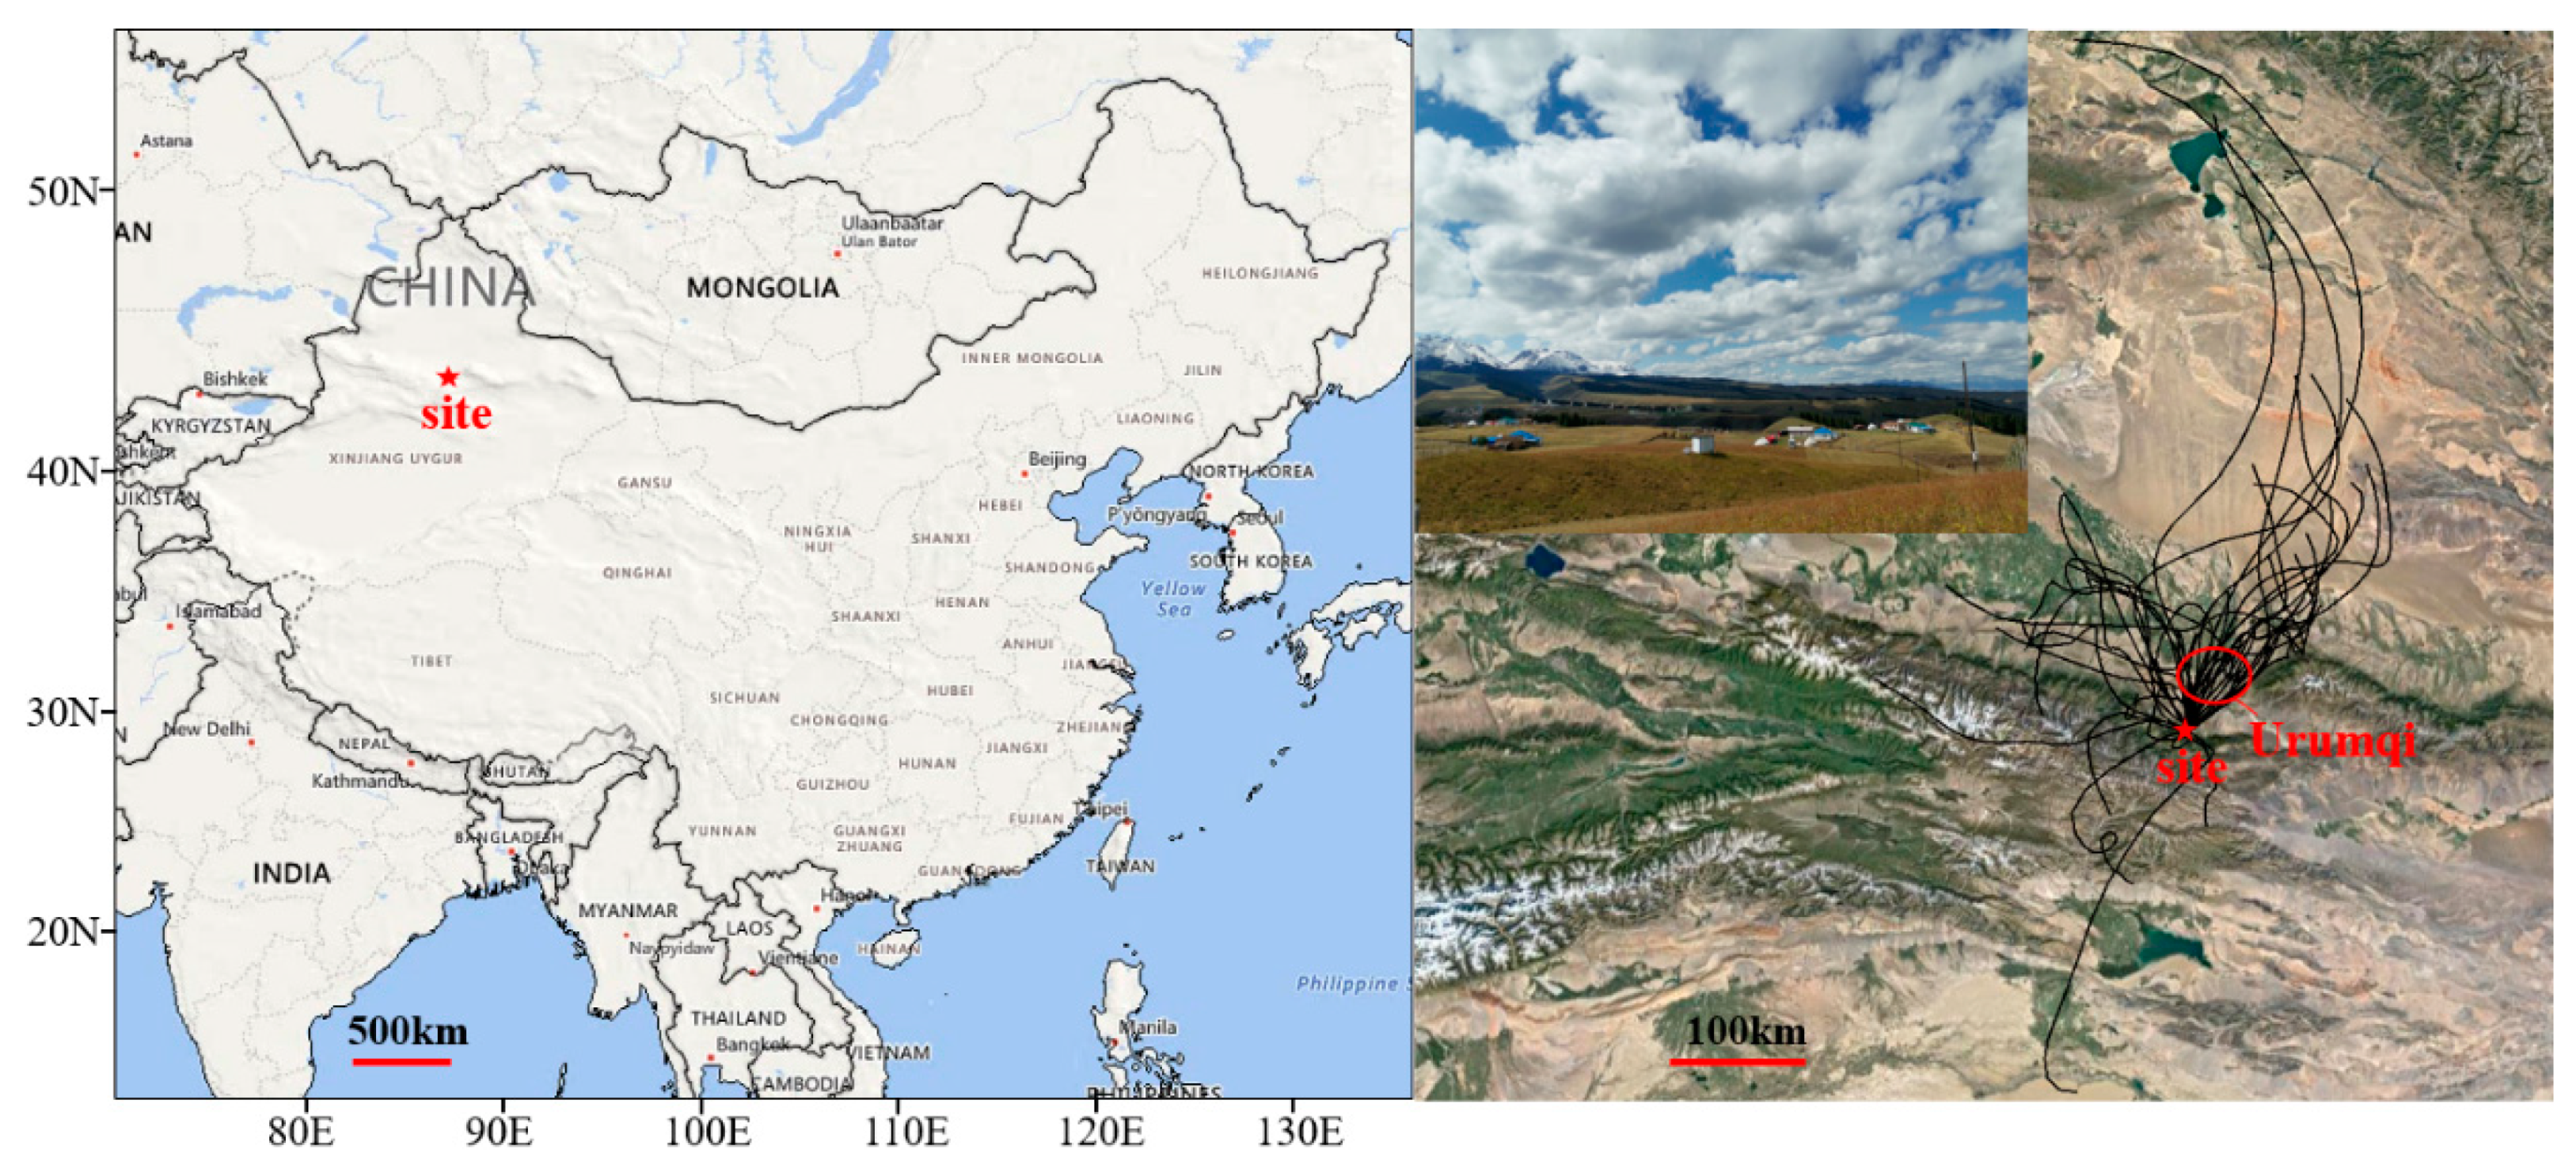
2.1. Descriptions of the Observation Site

Figure 1 shows that the observation site is located at Zhongtianshan grassland eco-meteorological monitoring station (43.47° N, 87.20° E; 2169 m above sea level) in Xibaiyangou Scenic Area, Nanshan, Urumqi, Xinjiang Uygur Autonomous Region. Mt. Tian is one peal in one of the seven major mountain series in the world. The mountain series span four countries: China, Kazakhstan, Kyrgyzstan, and Uzbekistan. The total length is approximately 2500 km. The average width between north and south is 250–530 km. The widest part is more than 800 km. With a length of 1760 km in China, Mt. Tian is part of the world’s largest independent latitudinal mountain system, the world’s farthest mountain system from the ocean, and the largest mountain system in the world’s arid regions. Zhongtianshan grassland eco-meteorological monitoring station is in Wuliangsitai, which is the highest grassland pasture in the Xibaiyanggou scenic area of Mt. Tian. The altitude is close to the top of the boundary layer, and orographic clouds often appear on the observation site in the summer (Figure 1).

2.2. Description of Observational Instruments

Aerosol number concentrations from 10 nm to 10 μm were measured using a wide-range particle spectrometer (WPS) manufactured by MSP Corporation (Shoreview, MN, USA). The instrument capabilities consist of differential mobility analysis (DMA), condensation particle counting (CPC), and laser light scattering (LPS). The measurement range of the first two processes is 10 nm–0.5 μm, and the measurement range of the LPS is 0.35–10 μm. Time resolution was set as 5 min with 48 channels for each size for the DMA and 24 channels for the LPS. The specific principles of the instrument are provided in the literature [32].
CCN number concentration was measured using a cloud condensation nuclei counter (CCNC) produced by Droplet Measurement Technologies (DMT) Incorporation (Boulder, CO, USA). The core of the CCNC is a cylindrical thermal gradient diffusion chamber. A constant temperature gradient is applied along the walls of the chamber. Since heat diffuses more slowly through the air than through water vapor, a supersaturation is produced inside the cylinder. Aerosol flow is introduced into the centerline of the filtered and humidified sheath flow. A constant ratio of 10:1 is maintained between the sheath and aerosol flow. Supersaturation is developed inside the chamber according to the chamber flow, the streamwise temperature gradient, and the absolute pressure inside the column. Those particles whose critical supersaturation is less than the instrument supersaturation will grow as cloud droplets. Five levels of supersaturations (0.1%, 0.2%, 0.4%, 0.6%, 0.8%) are set to a cycle of 30 min, where the sampling time of 0.1% is 10 min, and the others are 5 min. A detailed description of the principles of the instrument is provided in the literature [33]. WPS and CCNC use the same air inlet.
The meteorological data comes from Urumqi Husbandry Meteorological Test Station (43.45° N, 87.18° E; 1930 m above sea level), which is approximately 2.9 km horizontally from the observation site, including meteorological elements such as temperature (T), pressure (P), relative humidity (RH), wind direction and speed, precipitation, and visibility. The time resolution is 1 h. The backward trajectory was drawn by MeteoInfo1.9.0 (http://www.meteothink.org/products/index.html), using the Hybrid Single Particle Lagrangian Integrated Trajectory (HYSPLIT) model.

3. Results and Discussion

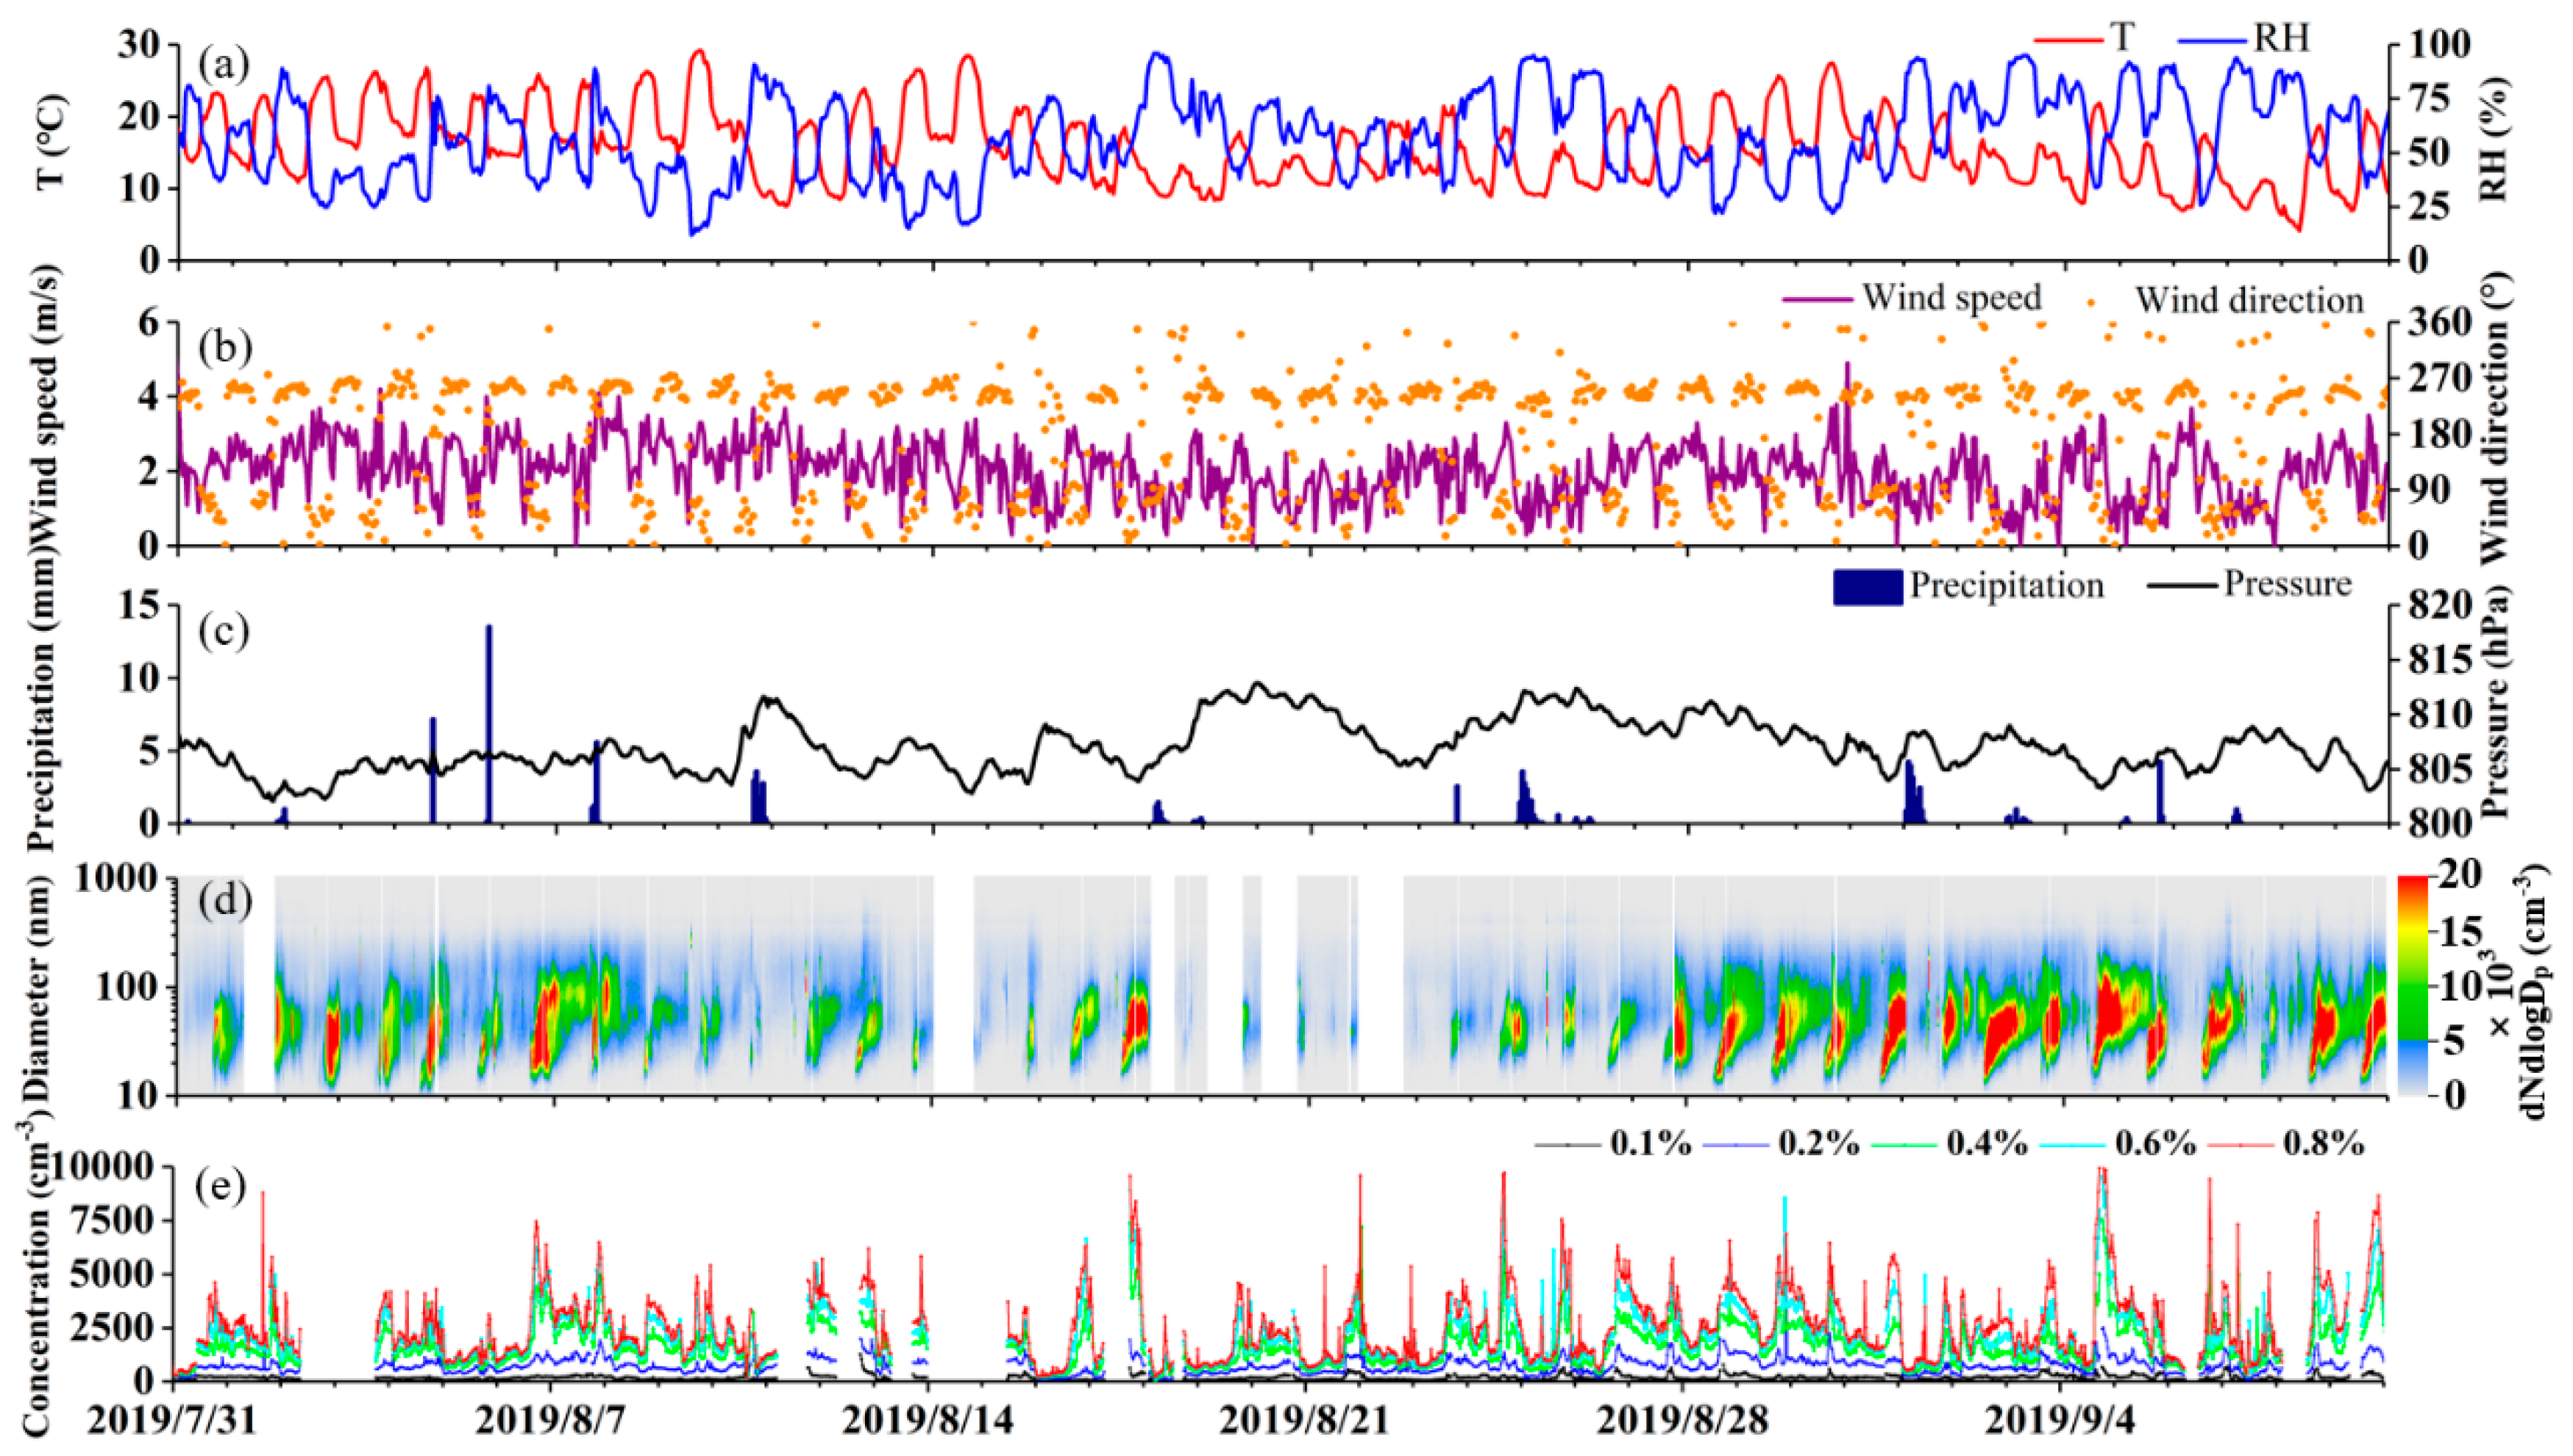
3.1. Overview of the Observations

Figure 2a shows that the temperature and RH of Mt. Tian in the summer have obvious daily variation characteristics of mountain areas, and the daily variation fluctuates greatly. The mean temperature is 15.9 °C (Table 1), the solar radiation is strong during the day, and the maximum temperature can reach 29.3 °C. After sunset, the mountain top is above the boundary layer, the temperature drops rapidly, and the lowest temperature was 4.2 °C. The trend of RH is opposite to the temperature but also violent and often with large fluctuations within a few hours mainly because the mountain area is easily affected by the orographic cloud. When the orographic cloud moves to this point, RH will rise rapidly. RH will decrease quickly after the orographic cloud leaves or dissipates [26,34]. In addition, orographic cloud precipitation will also cause the rise in the RH. Combined with Figure 2b, characteristics of the valley winds are obvious at the observation site under the influence of topography. The wind direction shows distinct diurnal variation, which is mostly southwest wind at night and mostly northeast wind during the daytime. The wind speed is relatively stable, the mean wind speed is 2.1 m·s−1 and the maximum wind speed is only 5.1 m·s−1. The air pressure is relatively stable (Figure 2c), with an average air pressure of 807.0 hPa. Many topographic cloud precipitation processes occurred during the observation period. Topographic cloud precipitation is characterized by a small impact range, short duration, and erratic precipitation. Considering the scour effect of precipitation on aerosol particles, the aerosol and CCN data of precipitation times were eliminated in the subsequent statistical studies in this paper.
Figure 2d shows that the daily variation of aerosol number concentration is obvious, and the high value areas are concentrated in the afternoon. Aerosol number concentration is basically concentrated within 500 nm. Table 1 shows that the mean aerosol number concentration is 5475.6 ± 5636.5 cm−3, and the number concentration fluctuates greatly and varies from 93.1 cm−3 to 35,309.2 cm−3 The mean surface area concentration is 138.8 μm2·cm−3. The CCN number concentration increases with the increase in supersaturation (Figure 2e) and is consistent with the trend of aerosol number concentration. The average CCN concentrations were 183.7 ± 114.5 cm−3, 729.8 ± 376.1 cm−3, 1630.5 ± 980.5 cm−3, 2162.5 ± 1345.3 cm−3, and 2575.7 ± 1632.9 cm−3 at supersaturation levels of 0.1%, 0.2%, 0.4%, 0.6%, and 0.8%, and the mean CCN activation rate was 6.41%, 26.71%, 54.55%, 70.09%, and 82.22%.

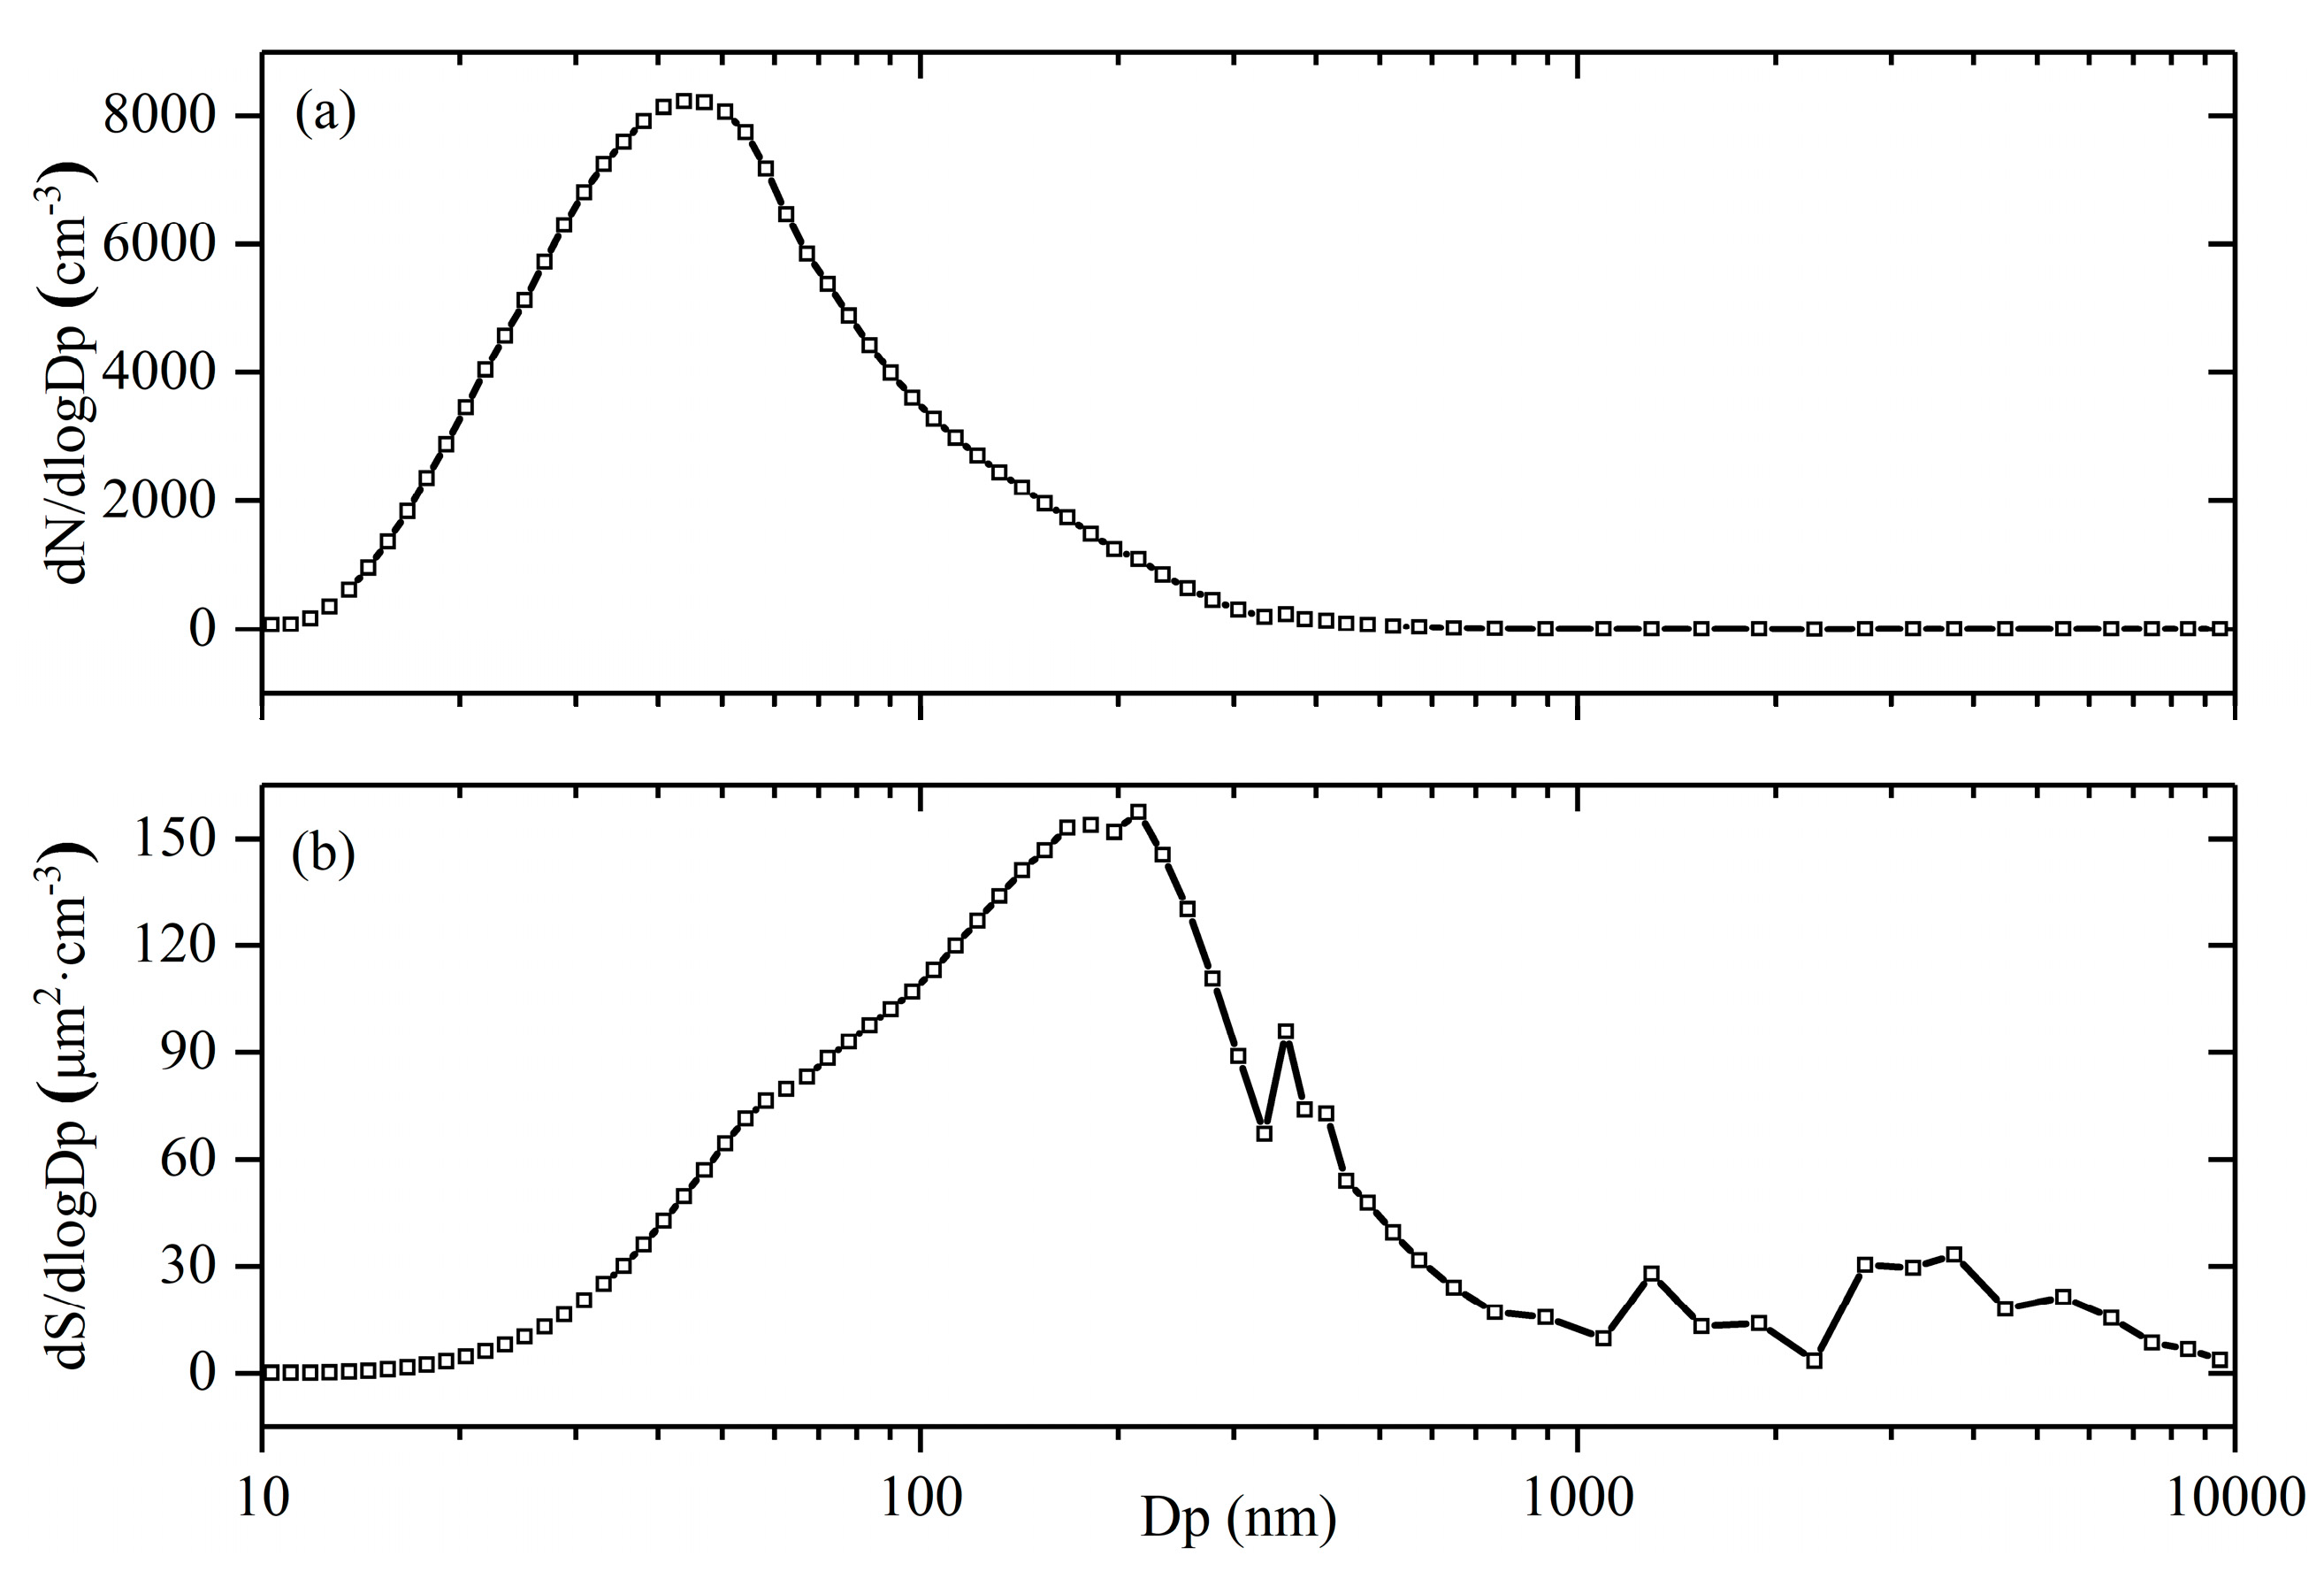
3.2. Aerosol Size Distribution in Mt. Tian

The formation, migration, transformation, and removal of atmospheric aerosols, as well as their physical and chemical properties, are directly related to their particle size [35]. Figure 3a shows that the mean aerosol number size distribution is unimodal, with the peak value of 8223 cm−3 and the peak particle diameter is 44 nm. The main mode of the aerosol number concentration is Aitken mode (20–100 nm), and the dominant particle size is 30–60 nm. The proportion of the aerosol number concentration in the Aitken mode is 78.4%.
The mean aerosol surface area size distribution is four-peak type, and the peak particle diameters are 215 nm, 360 nm, 1296 nm, and 3742 nm. The main mode of the aerosol surface area concentration is accumulation mode (100–1000 nm) and the dominant particle size is 100–300 nm. The mean surface area concentration of accumulation mode particles was 85.0 μm2·cm−3, accounting for 61.2% of the total surface area concentration.

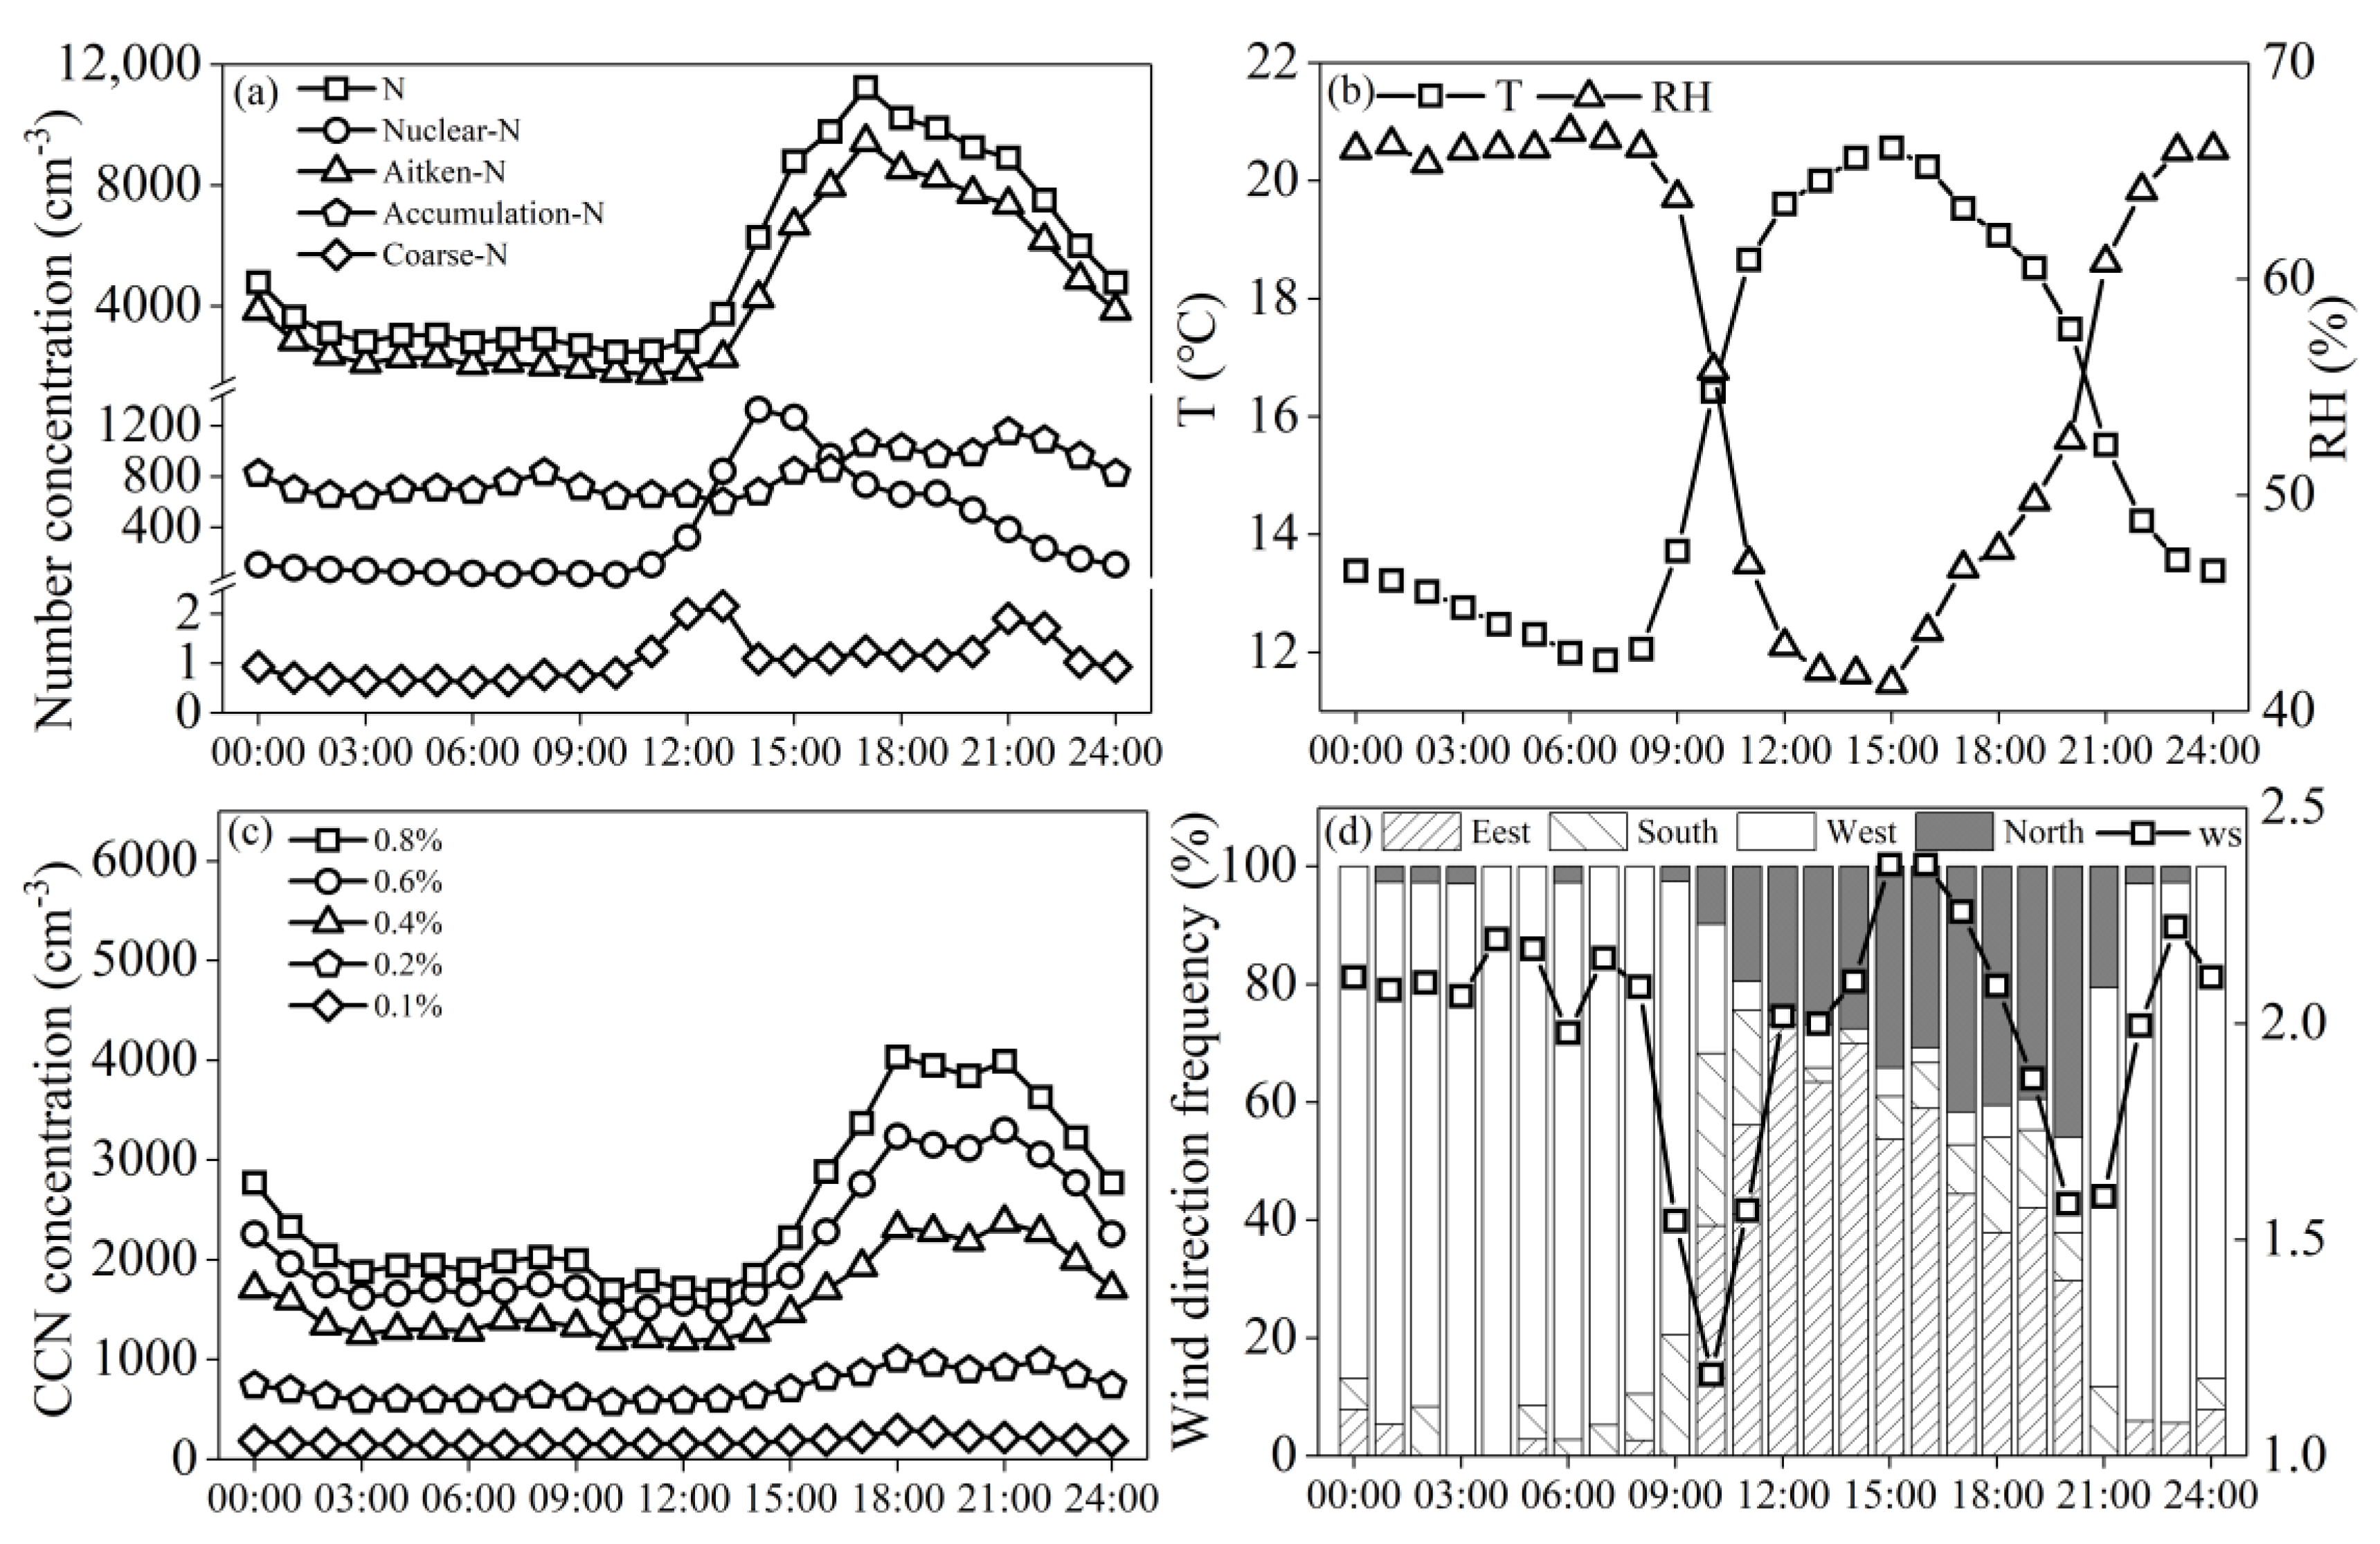
3.3. Diurnal Variation Characteristics of Aerosol and CCN

Figure 4a shows that the diurnal variation of total aerosol number concentration is basically consistent with that of Aitken mode particles, showing a unimodal distribution. The total aerosol number concentration increases significantly from 13:00, reaches the peak at 17:00, and then decreases gradually. The diurnal variation of nuclear mode (<20 nm) particles is unimodal, reaching a peak value at 14:00–15:00. Figure 4b shows that the temperature is the highest at 14:00–15:00, the solar radiation is strong, and the RH is the lowest, which is conducive to the new particle formation. The daily variation of the accumulation mode and coarse mode particles is both bimodal, with the peaks at 17:00, 21:00 and 13:00, 21:00, respectively. The diurnal variation of CCN was bimodal (Figure 4c): the first peak appeared at approximately 18:00 and the second peak at 21:00.
The diurnal variation characteristics of aerosol and CCN on Mt. Tian are higher in the daytime than at night, and the high values appear in the afternoon, which is consistent with the observation of other mountain stations [20,36]. The diurnal variation characteristics of aerosol and CCD are affected mainly by boundary layer development and valley wind. During the day, with the solar radiation increasing, the temperature rises gradually, which causes the top of the boundary layer to rise from the bottom of the mountain to the top. High-concentration particles at the bottom of the mountain are transported upward to the top of the boundary layer through turbulence in the boundary layer, and gradually accumulate to reach the peak. Figure 4d shows that the wind direction and wind speed have distinctly changed at approximately 9:00 and 21:00, which is consistent with the characteristics of the valley wind. The wind is generally westerly at night and northerly or easterly during the day. The air blows from the valley to the hillside during the daytime, which situates the aerosol particles with higher concentration in the lower layer transport upward. After sunset, the air blows from the hillside to the valley, and the aerosol concentration decreases accordingly. In addition, combined with the backward trajectory of the observation site in Figure 1 at 20:00 p.m., the air mass in the afternoon comes mostly from the north of the observation point and passes through the urban area of Urumqi, indicating that the transport of the polluted air mass may also contribute to the high concentration in the afternoon.

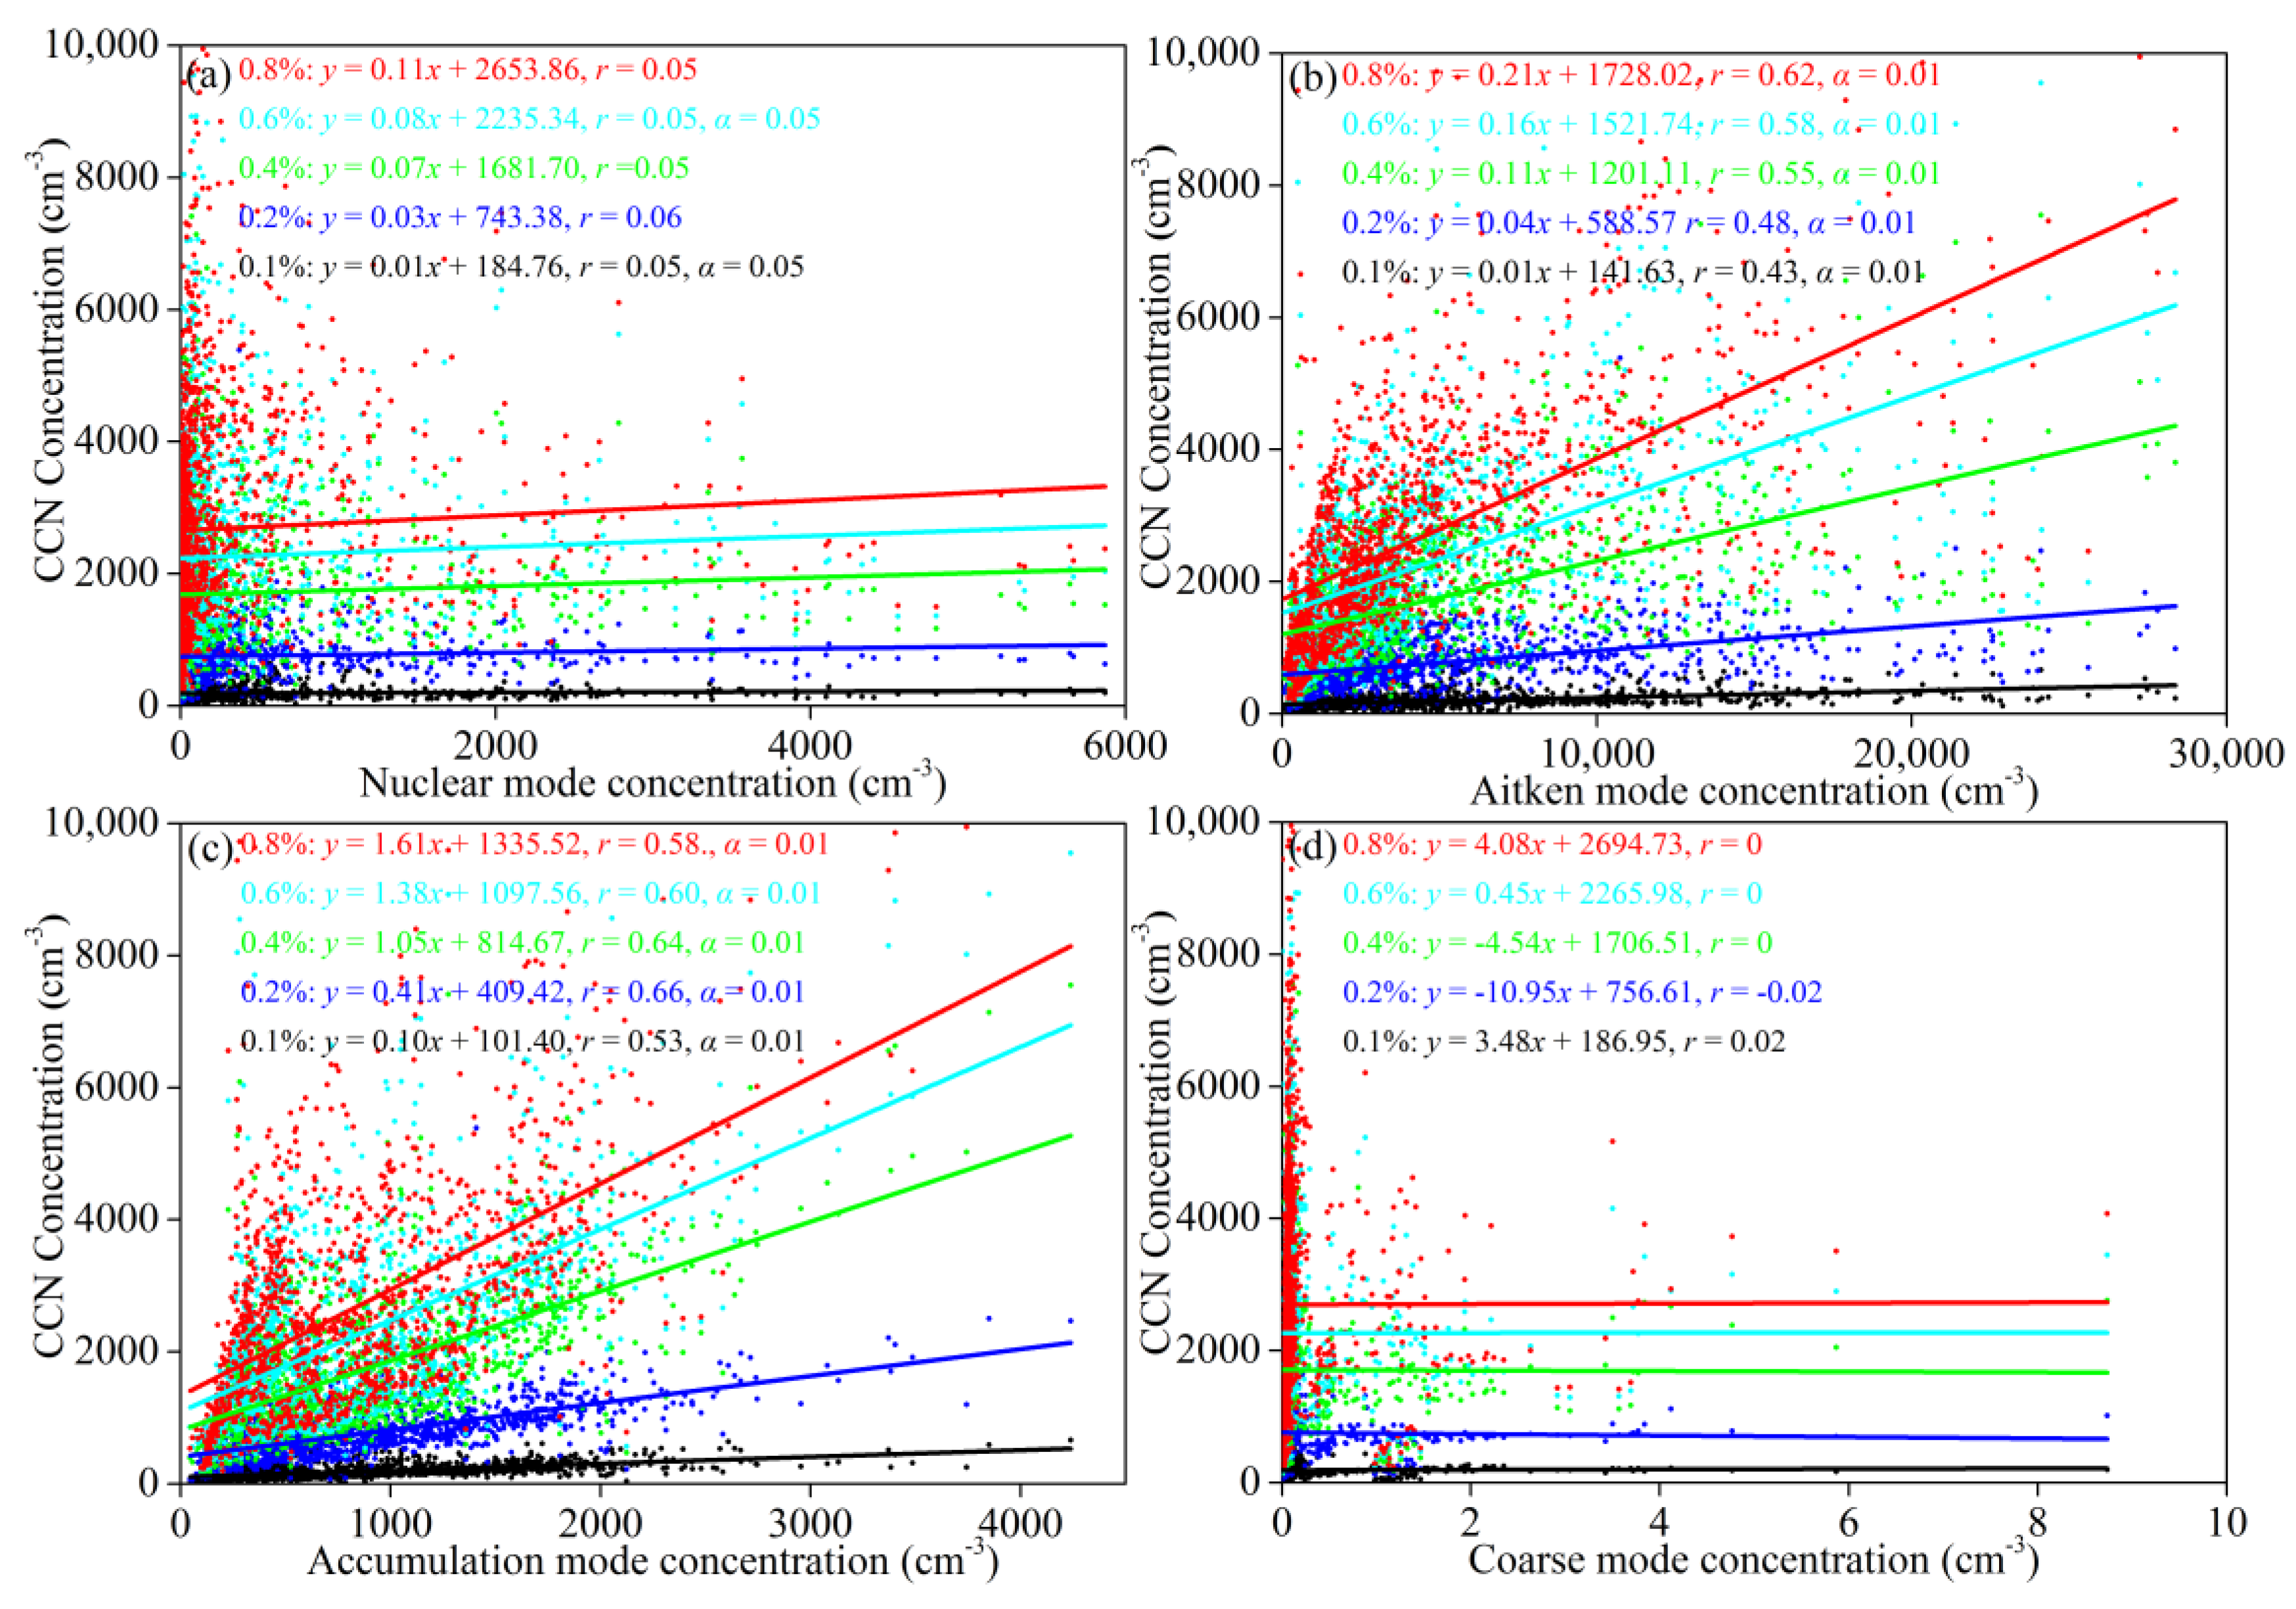
3.4. Correlation between Aerosol Number Concentration and CCN

Aerosol particle size is the major factor affecting the ability of an aerosol to activate into CCN [37,38]. Figure 5 shows that the Aitken mode and accumulation mode particles have a positive correlation with CCN at different levels of supersaturation. The correlation coefficients are all above 0.4 and pass the α = 0.01 test. The nuclear mode and coarse mode particles have little correlation with CCN. The correlation coefficient between the Aitken mode particles and CCN increases with the augmentation of supersaturation, while the trend of the accumulation mode particles is the opposite. When the supersaturation is less than 0.8%, the correlation between accumulation mode particles and CCN is better than the correlation of Aitken mode particles, indicating that the accumulation mode particles are more easily activated to CCN under low supersaturation conditions. If the supersaturation is close to 0.8% or above, the activation rate of aerosol particles can reach more than 80% [39]. Most of the aerosol particles that entered CCNC at this time can be considered to have activated to CCN. Since the Aitken mode particles dominate the aerosol number concentration, the Aitken mode particles are more likely to be activated into CCN when the supersaturation is 0.8%.
To further study the relationship between aerosol particle size and CCN activation, the Aitken mode and the accumulation mode particles are classified according to the particle size. We calculated the correlation between the particle number concentration of each particle size segment and the CCN number concentration. As Table 2 shows, there is a positive correlation between CCN and each particle size segment of the Aitken mode and the accumulation mode, which passed the α = 0.01 test. At 0.1% (S), the correlation between 300–500 nm particles and CCN is the best at 0.70. The correlation between 100–300 nm particles and CCN is best at 0.2% (S), which is 0.65. When the supersaturation is greater than or equal to 0.4%, the correlation between 60 and 80 nm particles and CCN is the best, 0.72, 0.74, and 0.74, respectively. Overall, with the increase in supersaturation, fine particles are more likely to be activated to CCN.

3.5. Influence of Meteorological Elements on Aerosol and CCN Distribution

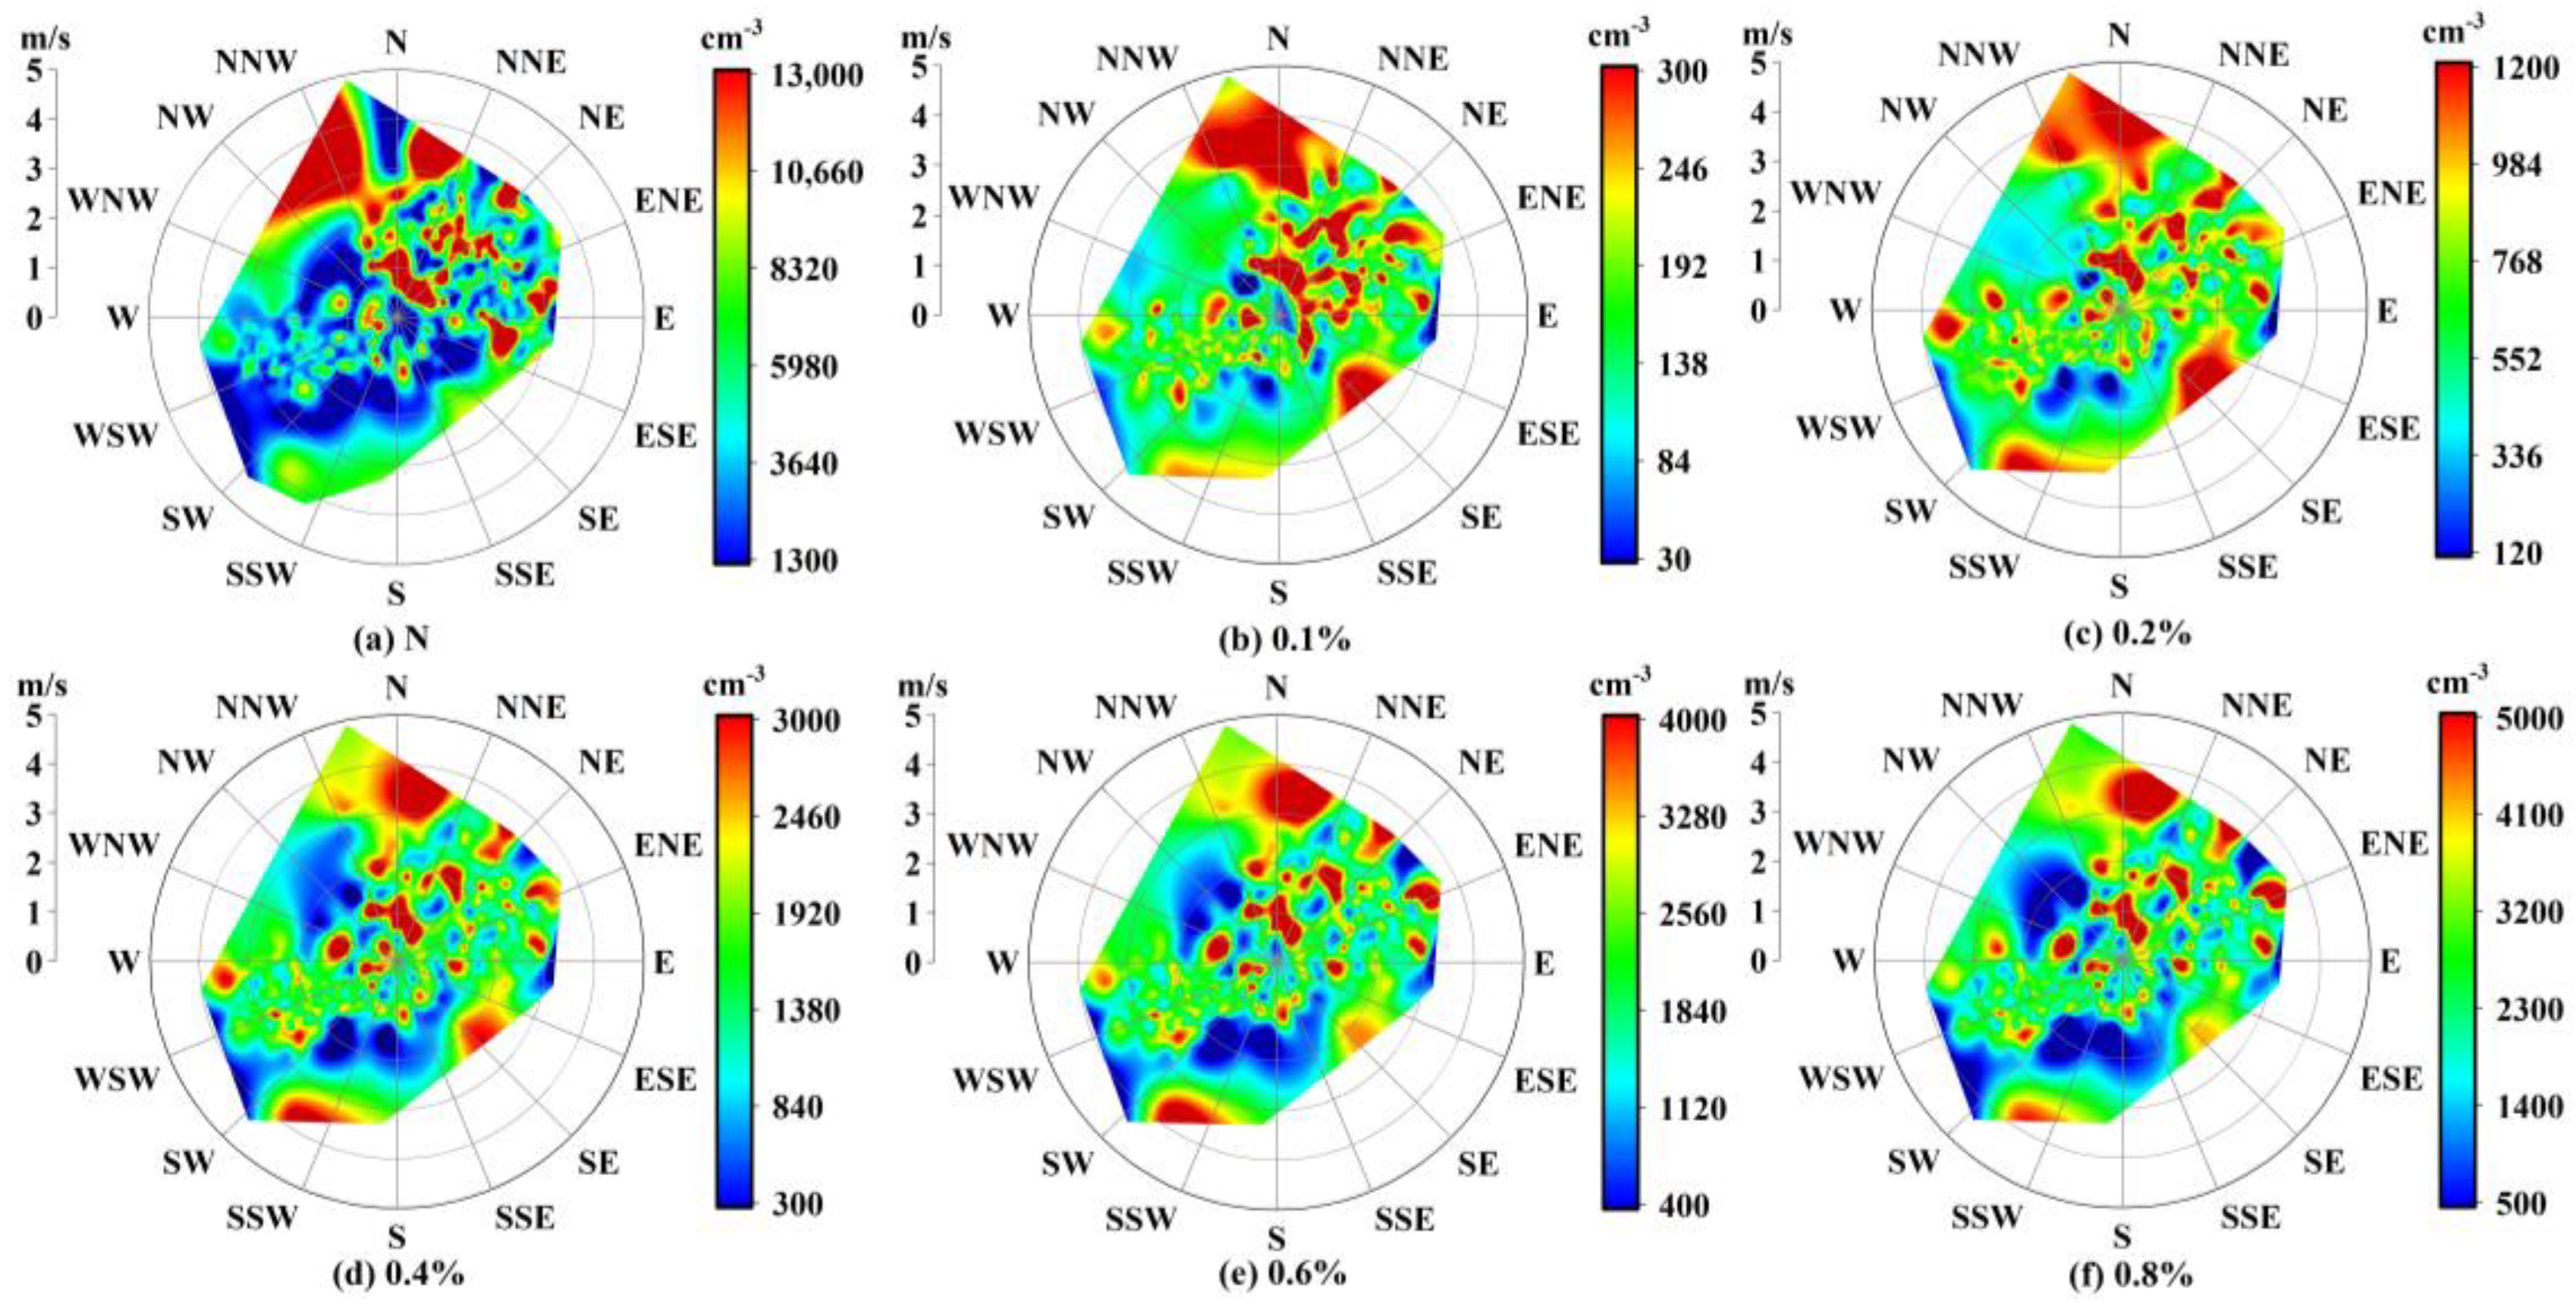
3.5.1. Impact of Wind Direction and Wind Speed

Figure 6a shows that the high value areas of aerosol number concentration are distributed mainly under northerly winds. Since the overall wind speed during the observation period is only 0–5 m·s−1, the distribution of the high value area is more obvious when the wind speed is large, indicating that most of the particles are transported to the observation site. With reference to Figure 4b, the valley winds are mostly northerly or easterly during the daytime, which transports higher concentrations of aerosol particles from the bottom of the mountain upward.
The distribution of CCN with wind direction and wind speed under different levels of supersaturations is similar to the aerosol number concentration, which is higher in the case of northerly winds. When southerly winds occur and the wind speed is relatively large, CCN will also have a high value. Because the mountains in the south of the observation site are higher, when the southerly wind is strong, orographic clouds form easily. More CCN may be brought by the movement of the orographic clouds to the observation point. In addition, increased wind speed can also increase aerosol counts from local surroundings (e.g., dust).

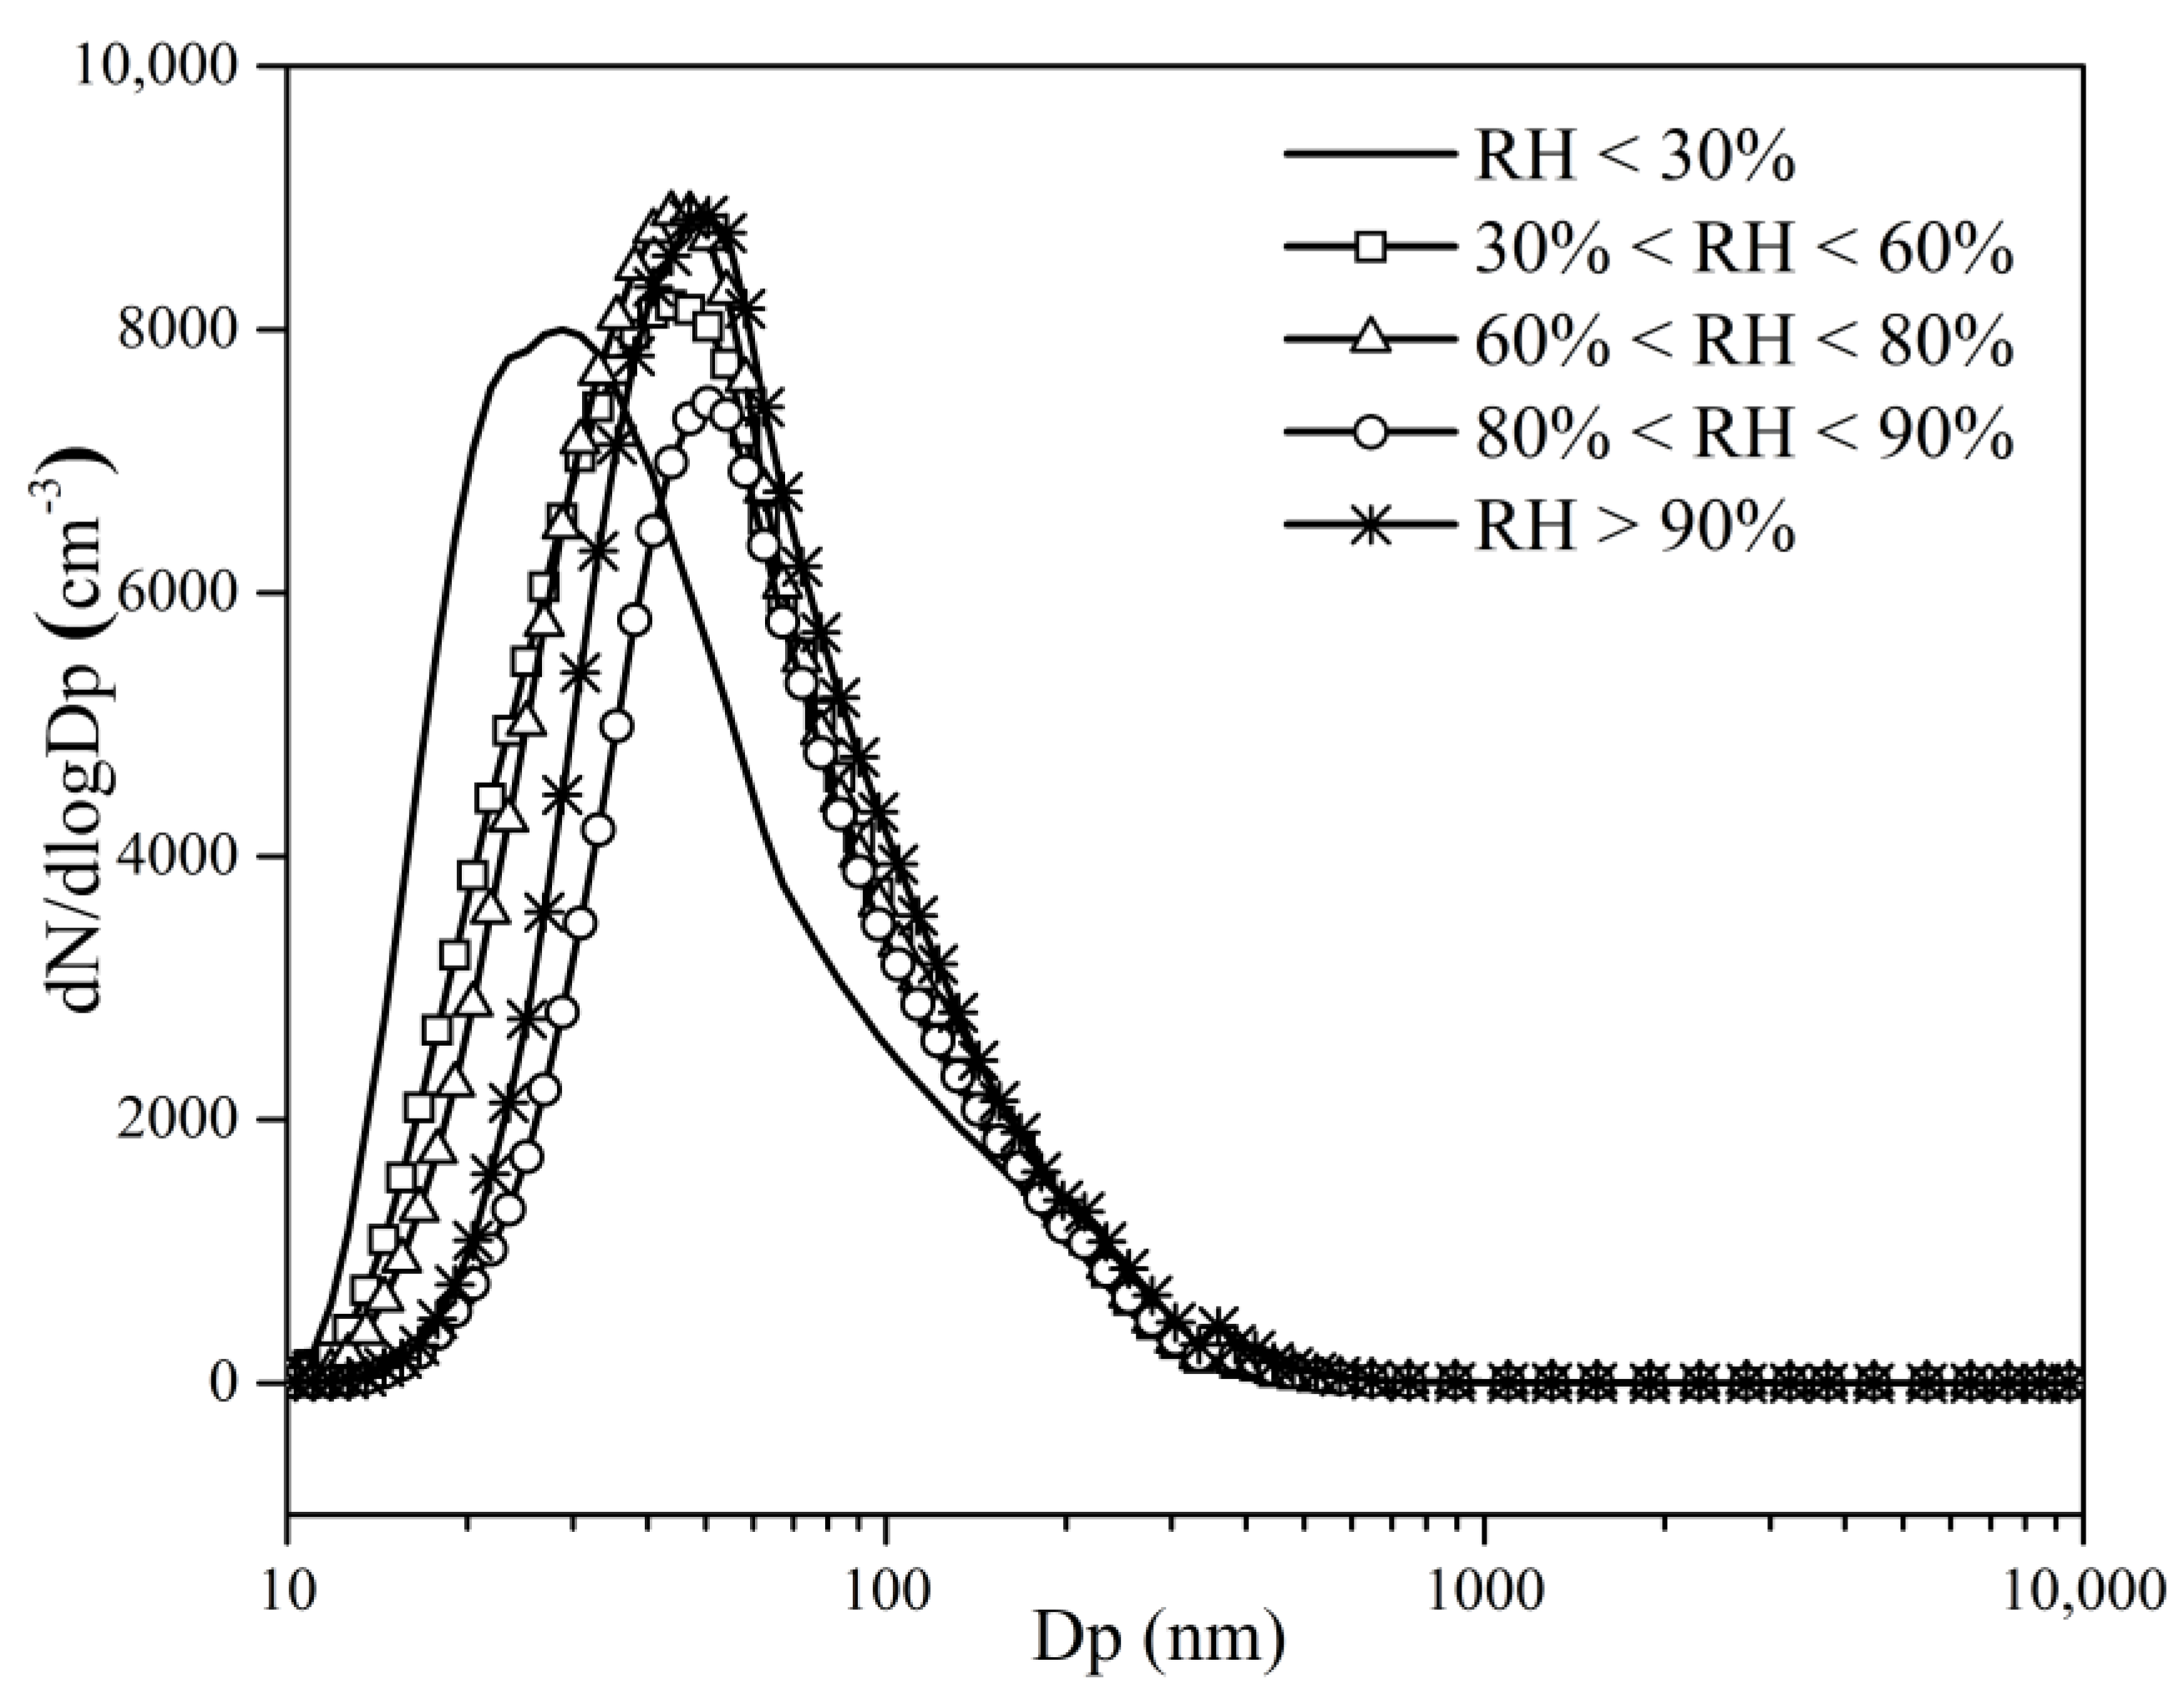
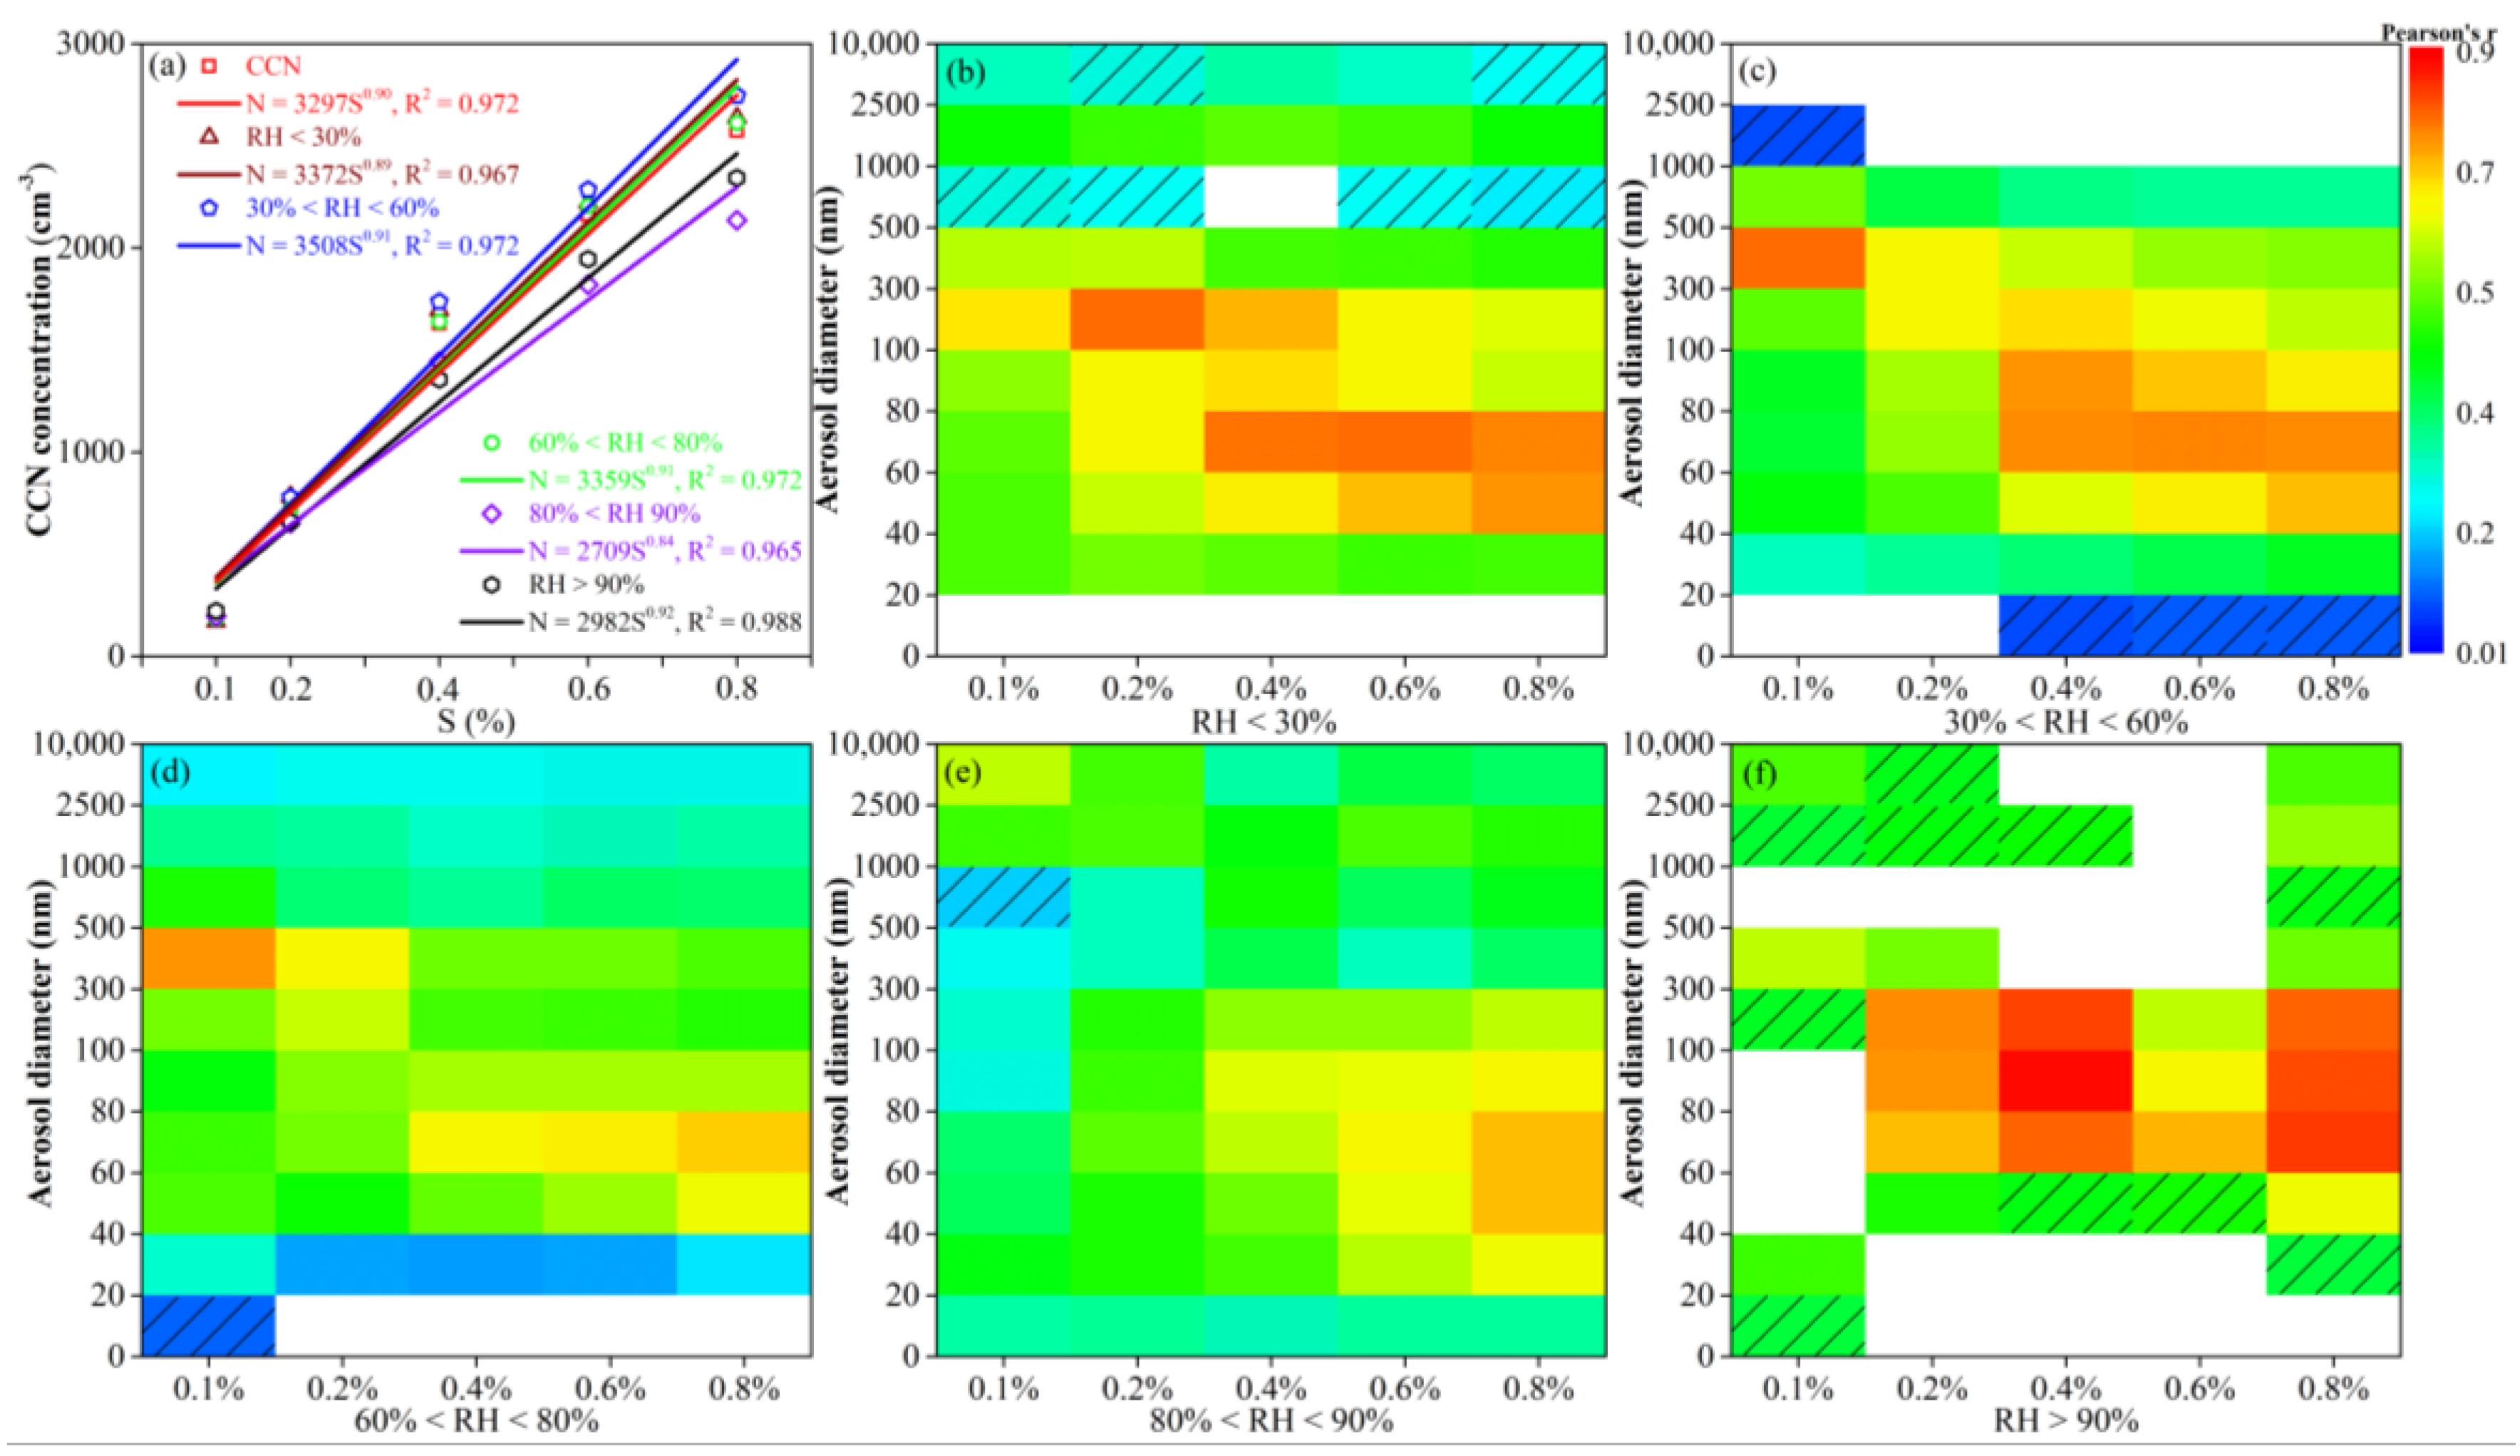
3.5.2. Impact of Relative Humidity

Figure 2 shows that the diurnal variation of RH in the summer at Mt. Tian is very dramatic due to the influence of the orographic cloud. Therefore, to study the influence of RH on aerosol size distribution and CCN distribution, RH is divided into five grades: RH < 30%, 30% < RH < 60%, 60% < RH < 80%, 80% < RH < 90%, and RH > 90%.
As shown in Figure 7, the aerosol number size distribution under different RH is unimodal. With the increase in RH, the peak particle diameters are 29, 44, 44, 50, and 50 nm, respectively. The increase in peak particle diameter is related to the increase in the aerosol hygroscopicity. When 80% < RH < 90%, the aerosol number concentration is the lowest at 4154.1 cm−3, and the aerosol number concentration under other values of RH is 1.6, 1.3, 1.3 and 1.4 times of that value. When the RH is less than 30%, the mean number concentration of the nuclear mode particles is 1211.0 cm−3, which is 3.2, 5.2, 23.8, and 20.3 times the other ranges. Nuclear mode particles come mainly from the process of gas-particle conversion, and the NPF is a major source. The residence time of nuclear mode particles in the atmosphere is very short, and the nuclear mode particles will soon grow to the Aitken mode, indicating that the low RH is beneficial to the occurrence of NPF on Mt. Tian.
The CCN spectrum is the change curve of CCN number concentration with supersaturation, which is an important application of CCN number concentration observations. In this paper, we use the classic two-parameter empirical formula N = CSk [40], where S is the supersaturation, N is the CCN number concentration under the supersaturation S. C and k are the fitting parameters, and the information of particle size or chemical composition is implicit in them. According to the value of C and k, the CCN spectrum is divided into continental type (C ≥ 2200, k < 1), transitional type (1000 < C < 2200, k > 1) and marine type (C < 1000, k < 1) [41].
Figure 8a shows that the two-parameter formula can represent the CCN spectrum during the observation period and under different values of RH, and the fitted R2 values are all above 0.96. During the observation period, C = 3297 and k = 0.90 in the overall CCN spectrum, close to previous observations on Mt. Qilian (C = 3022, k = 0.90) [18] and Mt. Huang (C = 2798, k = 0.28) [20,29], which are of the clean continental type. The C and k values of the CCN spectrum under different RH values show little change compared with the whole observation: C is 2709–3508, k is 0.84–0.92, all belonging to continental type. When RH > 80%, the CCN spectrum decreases significantly, indicating that a part of CCN can be activated into cloud droplets under high RH. It means that the cloud-fog process has a wet removal effect on CCN. Compared with the situation that the aerosol number concentration decreased significantly only under the condition of 80% < RH < 90%, the CCN number concentration was obviously removed with RH > 80%. The above indicated that the influence of different RH values on CCN number concentration may be greater than the influence of different RH values on aerosol number concentration on Mt. Tian.
Figure 8 shows that the particles of different sizes have different abilities to activate to CCN under different RH values, and are greatly affected by supersaturation. When the RH is less than 30% (Figure 7b), 100–300 nm particles at the low supersaturation level (≤0.2%) have the best correlation with CCN, and are the most likely to activate to CCN. The 60–80 nm particles are the most easily activated to CCN at high supersaturation (≥0.4%). When 30% < RH < 60%, 300–500 nm particles are most likely to activate to CCN at low supersaturation and 60–80 nm particles at high supersaturation. The case of 60% < RH < 80% is like that of 30% < RH < 60%. When 80% < RH < 90%, the correlation between the aerosol number concentration and CCN obviously increases with the increase of supersaturation. The 40–80 nm particles are most easily activated to CCN at 0.8% (S). When RH > 90%, the 300–500 nm particles have the best correlation with CCN at 0.1% (S). After supersaturation ≥ 0.2%, 60–300 nm particles show good correlation with CCN.
With the increase in RH value, the correlation between CCN and aerosols at 0.1% (S) decreased, indicating that the higher the ambient RH, the more unfavorable for the activation of aerosols to CCN at 0.1% (S). At different RH values, with the increase of supersaturation, the particle size segment that is most easily activated to CCN is becoming smaller and smaller. Under high supersaturation conditions (≥0.4%), the 40–500 nm particles show a good correlation with CCN. At 0.8% (S), the 60–80 nm particles were all most likely to activate to CCN at different RH values.

4. Conclusions

The aerosol number concentration and CCN were observed at Mt. Tian from 31 July to 9 September 2019. During the observation period, the mean aerosol number concentration and surface area concentration are 5475.6 cm−3 and 138.8 μm2·cm−3. The mean CCN concentrations are 183.7 cm−3, 729.8 cm−3, 1630.5 cm−3, 2162.5 cm−3, and 2575.7 cm−3 at supersaturation levels of 0.1%, 0.2%, 0.4%, 0.6%, and 0.8%. The aerosol number size distribution is unimodal and the dominant particle size is 30–60 nm. The aerosol surface area size distribution was the four-peak type and the dominant particle size was 100–300 nm. Affected by the height of the boundary layer and the valley wind, the daily high values of aerosol and CCN all appeared in the afternoon. The diurnal variation of aerosol number concentration shows a unimodal distribution with the peak at 17:00, and the CCN number concentration showed a bimodal distribution with peaks at 18:00 and 21:00. The particle size distribution and supersaturation have a great impact on the activation of aerosol to CCN. At 0.1% (S), 300–500 nm particles are most likely to activate to CCN. The 100–300 nm particles are most easily activated at 0.2% (S). The 60–80 nm particles are most likely activated at high supersaturation (≥0.4%). The concentrations of aerosol and CCN are higher in the northerly wind. Ambient RH has little relationship to the aerosol activation under high supersaturation. According to N = CSk fitting the CCN spectrum, C = 3297 and k = 0.90 at Mt. Tian, which is the clean continental type.

Author Contributions

Conceptualization, A.L. and H.W.; Investigation, A.L., K.C., Y.C., and C.H.; Methodology, A.L. and M.D.; Visualization, A.L. and M.D.; Writing—original draft, A.L. and H.W.; Writing—review and editing, A.L., H.W., Y.L., Y.Y., B.L., and K.C. All authors have read and agreed to the published version of the manuscript.

Funding

This study was supported by the Weather Modification Ability Construction Project of Northwest China (ZQCR18211); the Weather Modification Construction Research and Test Project in northwest China of China Meteorological Administration (RYSY201902); the National Natural Science Foundation of China (91644224, 41805096 and 41805120); the China Postdoctoral Science Foundation (2018M640169) and the Natural Science Research Project for Universities of Jiangsu Province, China (18KJB170011).

Conflicts of Interest

The authors declare no conflict of internet.

References

  1. Twomey, S.; Warner, J. Comparison of measurements of cloud droplets and cloud nuclei. J. Atmos. Sci. 1967, 24, 702–703. [Google Scholar] [CrossRef]
  2. Albrecht, B. Aerosols, cloud microphysics and fractional cloudiness. Science 1989, 245, 1227–1230. [Google Scholar] [CrossRef] [PubMed]
  3. Li, Z.; Niu, F.; Fan, J.; Liu, Y.; Rosenfeld, D.; Ding, Y. Long-term impacts of aerosols on the vertical development of clouds and precipitation. Nat. Geosci. 2011, 4, 888–894. [Google Scholar] [CrossRef]
  4. Kohler, H. The nucleus in and the growth of hygroscopic droplets. Trans. Faraday Soc. 1936, 32, 1152–1161. [Google Scholar] [CrossRef]
  5. Fitzgerald, J. Dependence of the supersaturation spectrum of CCN on aerosol size distribution and composition. J. Atmos. Sci. 1973, 30, 628–634. [Google Scholar] [CrossRef] [Green Version]
  6. Su, H.; Rose, D.; Cheng, Y.; Gunthe, S.; Massling, A.; Stock, M.; Wiedensohler, A.; Andreae, M.; Pöschl, U. Hygroscopicity distribution concept for measurement data analysis and modeling of aerosol particle mixing state with regard to hygroscopic growth and CCN activation. Atmos. Chem. Phys. 2010, 10, 7489–7503. [Google Scholar] [CrossRef] [Green Version]
  7. Pöschl, U. Atmospheric aerosols: Composition, transformation, climate and health effects. Angew. Chem. Int. Ed. 2005, 44, 7520–7540. [Google Scholar] [CrossRef]
  8. McFiggans, G.; Artaxo, P.; Baltensperger, U.; Coe, H.; Facchini, M.; Feingold, G.; Fuzzi, S.; Gysel, M.; Laaksonen, A.; Lohmann, U.; et al. The effect of physical and chemical aerosol properties on warm cloud droplet activation. Atmos. Chem. Phys. 2006, 6, 2593–2649. [Google Scholar] [CrossRef] [Green Version]
  9. IPCC (Intergovernmental Panel on Climate Change). Changes in Atmospheric Constituents and in Radiative Forcing. In Climate Change 2013; 5th Assessment Report; Cambridge University Press: Cambridge, UK; New York, NY, USA, 2013. [Google Scholar]
  10. Paramonov, M.; Kerminen, V.; Gysel, M.; Aalto, P.; Andreae, M.; Asmi, E.; Baltensperger, U.; Bougiatioti, A.; Brus, D.; Frank, G.; et al. A synthesis of cloud condensation nuclei counter (CCNC) measurements within the EUCAARI network. Atmos. Chem. Phys. 2015, 15, 12211–12229. [Google Scholar] [CrossRef] [Green Version]
  11. Schmale, J.; Henning, S.; Henzing, B.; Keskinen, H.; Sellegri, K.; Ovadnevaite, J.; Bougiatioti, A.; Kalivitis, N.; Stavroulas, I.; Jefferson, A.; et al. Collocated observations of cloud condensation nuclei, particle size distributions, and chemical composition. Sci. Data 2017, 4, 170003. [Google Scholar] [CrossRef]
  12. Roy, A.; Chatterjee, A.; Sarkar, C.; Das, S.; Ghosh, S.; Raha, S. A study on aerosol-cloud condensation nuclei (CCN) activation over eastern Himalaya in India. Atmos. Res. 2017, 189, 69–81. [Google Scholar] [CrossRef]
  13. Shinozuka, Y.; Clarke, A.; Nenes, A.; Jefferson, A.; Wood, R.; McNaughton, C.; Ström, J.; Tunved, P.; Redemann, J.; Thornhill, K.; et al. The relationship between cloud condensation nuclei (CCN) concentration and light extinction of dried particles: Indications of underlying aerosol processes and implications for satellite-based CCN estimates. Atmos. Chem. Phys. 2015, 15, 7585–7604. [Google Scholar] [CrossRef] [Green Version]
  14. Fang, S.; Han, Y.; Chen, K.; Lu, C.; Yin, Y.; Tan, H.; Wang, J. Parameterization and comparative evaluation of the CCN number concentration on Mt. Huang, China. Atmos. Res. 2016, 181, 300–311. [Google Scholar] [CrossRef]
  15. Pöhlker, M.; Pöhlker, C.; Klimach, T.; Angelis, I.; Barbosa, H.; Brito, J.; Carbone, S.; Cheng, Y.; Chi, X.; Ditas, F.; et al. Long-term observations of atmospheric aerosol, cloud condensation nuclei concentration and hygroscopicity in the Amazon rain forest—Part 1: Size-resolved characterization and new model parameterizations for CCN prediction. Atmos. Chem. Phys. 2016, 16, 15709–15740. [Google Scholar] [CrossRef] [Green Version]
  16. Cai, M.; Tan, H.; Chan, C.; Qin, Y.; Xu, H.; Li, F.; Schurman, S.; Liu, L.; Zhao, J. The size-resolved cloud condensation nuclei (CCN) activity and its prediction based on aerosol hygroscopicity and composition in the Pearl Delta River (PRD) region during wintertime 2014. Atmos. Chem. Phys. 2018, 18, 16419–16437. [Google Scholar] [CrossRef] [Green Version]
  17. Feng, Q.; Li, P.; Fan, Y.; Hou, T. Observation analysis of cloud condensation nuclei in some regions of North China. Trans. Atmos Sci. 2012, 35, 533–540. (In Chinese) [Google Scholar]
  18. Zhao, Y.; Niu, S.; Lv, J.; Xu, J.; Sang, J. Observational analyses on cloud condensation nuclei in northwestern China in summer of 2007. Plateau Meteorol. 2010, 29, 1043–1049. (In Chinese) [Google Scholar]
  19. Wang, T.; Sun, J.; Shen, X.; Deng, Z.; Zhang, Y.; An, L.; Zhang, X.; Yan, P.; Liang, W.; Chen, L. Variation characteristics of cloud condensation nuclei at Wuqing. Meteorol. Sci. Technol. 2012, 3, 466–473. (In Chinese) [Google Scholar]
  20. Li, L.; Yin, Y.; Gu, X.; Chen, K.; Tan, W.; Yang, L.; Yuan, L. Observational study of cloud condensation nuclei properties at various altitudes of Huangshan Mountains. Chin. J. Atmos. Sci. 2014, 38, 410–420. (In Chinese) [Google Scholar]
  21. Williamson, C.; Kupc, A.; Axisa, D.; Bilsback, K.; Bui, T.; Campuzano-jost, P.; Dollner, M.; Froyd, K.; Hodshire, A.; Jimenez, J.; et al. A large source of cloud condensation nuclei from new particle formation in the tropics. Nature 2019, 574, 399–403. [Google Scholar] [CrossRef]
  22. Chen, C.; Hu, M.; Wu, Z.; Wu, Y.; Guo, S.; Chen, W.; Luo, B.; Shao, M.; Zhang, Y.; XIe, S. Characterization of new particle formation event in the rural site of Sichuan Basin and its contribution to cloud condensation nuclei. China Environ. Sci. 2014, 34, 2764–2772. (In Chinese) [Google Scholar]
  23. Clarke, A.; Freitag, S.; Simpson, R.; Hudson, J.; Howell, S.; Brekhovskikh, V.; Campos, T.; Kapustin, V.; Zhou, J. Free troposphere as a major source of CCN for the equatorial pacific boundary layer: Long-range transport and teleconnections. Atmos. Chem. Phys. 2013, 13, 7511–7529. [Google Scholar] [CrossRef] [Green Version]
  24. Li, W.; Zhang, D.; Shao, L.; Zhou, S.; Wang, W. Individual particle analysis of aerosols collected under haze and non-haze conditions at a high-elevation mountain site in the North China plain. Atmos. Chem. Phys. 2011, 11, 11733–11744. [Google Scholar] [CrossRef] [Green Version]
  25. Hao, H.; Yin, Y.; Xiao, H.; Yuan, L.; Gao, J.; Chen, K. Observation of new particle formation and growth on Mount Huang. China Environ. Sci. 2015, 35, 13–22. (In Chinese) [Google Scholar]
  26. Shen, L.; Wang, H.; Yin, Y.; Chen, J.; Chen, K. Size distribution of aerosol during the summer at the summit of Mountain Taishan (1534m) in central east China. Environ. Sci. 2019, 40, 2019–2026. (In Chinese) [Google Scholar]
  27. Shen, L.; Wang, H.; Yin, Y.; Chen, J.; Chen, K. Observation of atmospheric new particle growth events at the summit of mountain Tai (1534m) in central east China. Atmos. Environ. 2019, 201, 148–157. [Google Scholar] [CrossRef]
  28. Wang, T. The Characteristic of Cloud Condensation Nuclei in North China Plain; China Academy of Meteorological Science: Beijing, China, 2011; pp. 1–59. (In Chinese) [Google Scholar]
  29. Miao, Q.; Zhang, Z.; Li, Y.; Qin, X.; Xu, B.; Yuan, Y.; Gao, Y. Measurement of cloud condensation nuclei (CCN) and CCN closure at Mt. Huang based on hygroscopic growth factors and aerosol number-size distribution. Atmos. Environ. 2015, 113, 1–58. (In Chinese) [Google Scholar] [CrossRef]
  30. Fan, S.; An, X. Measurement and analysis of the concentration of cloud condensation nuclei in MT. Helanshan area. J. Desert. Res. 2000, 20, 338–340. [Google Scholar]
  31. Cao, C. Vertical Distribution of Physical and Chemical Characteristics of PM2.5 at Mt. Hua and the New Particle Formation; Institute of Earth Environment, China Academy of Science: Xian, China, 2011; pp. 1–59. (In Chinese) [Google Scholar]
  32. Liu, A.; Wang, H.; Cui, Y.; Shen, L.; Yin, Y.; Wu, Z.; Guo, S.; Shi, S.; Chen, K.; Zhu, B.; et al. Characteristics of aerosol during a severe haze-fog episode in the Yangtze River Delta: Particle size distribution, chemical composition, and optical properties. Atmosphere 2020, 11, 56. [Google Scholar] [CrossRef] [Green Version]
  33. Jayachandran, V.; Nair, V.; Babu, S. CCN characteristics over a tropical coastal station during south-west monsoon: Observations and closure studies. Atmos. Environ. 2017, 164, 299–308. [Google Scholar] [CrossRef]
  34. Zhang, X.; Yin, Y.; Lin, Z.; Han, Y.; Hao, J.; Yuan, L.; Chen, K.; Chen, J.; Kong, S.; Shan, Y.; et al. Observation of aerosol number size distribution and new particle formation at a mountainous site in Southeast China. Sci. Total Environ. 2017, 575, 309–320. [Google Scholar] [CrossRef] [PubMed] [Green Version]
  35. Yin, Y.; Chen, C.; Chen, K.; An, J.; Wang, W.; Lin, Z.; Yan, J.; Wang, J. An observational study of the microphysical properties of atmospheric aerosol at Mt. Huang. Trans. Atmos. Sci. 2010, 33, 129–136. (In Chinese) [Google Scholar]
  36. Philippin, S.; Betterton, E. Cloud condensation nuclei concentrations in Southern Arizona: Instrumentation and early observation. Atmos. Res. 1997, 43, 263–275. [Google Scholar] [CrossRef]
  37. Dusek, U.; Frank, G.; Hildebrandt, L.; Curtius, J.; Schneider, J.; Walter, S.; Chand, D.; Drewnick, F.; Hings, S.; Jung, D.; et al. Size matters more than chemistry for cloud-nucleating ability of aerosol particles. Science 2006, 312, 1375–1378. [Google Scholar] [CrossRef] [Green Version]
  38. Ervens, B.; Cubison, M.; Andrews, S.; Feingold, G.; Ogren, J.; Jimenez, J.; Decarlo, P.; Nenes, A. Prediction of cloud condensation nucleus number concentration using measurements of aerosol size distributions and composition and light scattering enhancement due to humidity. J. Geophys. Res. 2007, 112, D10S32. [Google Scholar] [CrossRef] [Green Version]
  39. Deng, Z.; Zhao, C.; Ma, N.; Liu, P.; Ran, L.; Xu, W.; Chen, J.; Liang, Z.; Liang, S.; Huang, M.; et al. Size-resolved and bulk activation properties of aerosols in the North China. Atmos. Chem. Phys. 2011, 11, 3835–3846. [Google Scholar] [CrossRef] [Green Version]
  40. Twomey, S. The nuclei of natural cloud formation part I: The chemical diffusion method and its application to atmospheric nuclei. Geofis. Pure E Appl. 1959, 43, 227–242. [Google Scholar] [CrossRef]
  41. Hobbs, P.V.; Bowdle, D.A.; Radke, L.F. Particles in the lower troposphere over the high plains of the United States. II: Cloud condensation nuclei and deliquescent particles. J. Clim. Appl. Meteorol. 1985, 42, 1358–1369. [Google Scholar] [CrossRef] [Green Version]
Figure 1. Observation site and 24 h backward trajectory at 500 m above ground level.
Atmosphere 11 00912 g001
Figure 2. Time series during the observation. (a) Temperature and relative humidity. (b) Wind speed and wind direction. (c) Precipitation and atmospheric pressure. (d) Aerosol number concentration. (e) Cloud condensation nuclei (CCN) number concentration.
Atmosphere 11 00912 g002
Figure 3. (a) Aerosol number size distribution. (b) Aerosol surface area size distribution.
Atmosphere 11 00912 g003
Figure 4. Diurnal variation: (a) Number concentration of total and different mode aerosol. (b) Temperature and relative humidity. (c) CCN number concentration. (d) Wind speed and wind direction frequency.
Atmosphere 11 00912 g004
Figure 5. Correlation between aerosol number concentration of different modes and CCN. (a) Nuclear mode aerosol and CCN. (b) Aitken mode aerosol and CCN. (c) Accumulation mode aerosol and CCN. (d) Coarse mode aerosol and CCN.
Atmosphere 11 00912 g005
Figure 6. Relations among aerosol and CCN concentration, wind direction and wind speed. (a) Aerosol number concentration. (b) CCN at 0.1%(S). (c) CCN at 0.2%(S). (d) CCN at 0.4%(S). (e) CCN at 0.6%(S). (f) CCN at 0.8%(S).
Atmosphere 11 00912 g006
Figure 7. Aerosol number size distribution under different relative humidity (RH).
Atmosphere 11 00912 g007
Figure 8. (a) CCN spectrum under the whole observation and different RH. (b–f) Correlation between aerosols at different particle size segments and CCN under different RH, the shaded means only passing the α = 0.05 test.
Atmosphere 11 00912 g008
Table 1. Statistics of meteorological elements, aerosols, and CCN.
Type/UnitMeanStandard DeviationMaximumMinimumMedian
Temperature/°C15.95.129.34.215.6
Pressure/hPa807.02.3812.9802.1806.7
RH/%56.619.796.012.056.0
Wind speed/m·s−12.00.85.102.0
Visibility/km28.15.230.00.330.0
N/cm−35475.65636.535,309.293.13505.3
S/μm2·cm−3138.8109.31473.73.4110.4
CCN (0.1%)/cm−3183.7114.51278.40.3164.4
CCN (0.2%)/cm−3729.8376.15388.45.6668.9
CCN (0.4%)/cm−31630.5980.57548.123.11416.4
CCN (0.6%)/cm−32162.51345.39552.2110.81866.4
CCN (0.8%)/cm−32575.71632.913,347.9196.22241.2
Table 2. Correlation between Aitken mode and Accumulation mode particles at different particle size segments and CCN.
Type/Unit0.1%0.2%0.4%0.6%0.8%
20–40/nm0.29 **0.28 **0.28 **0.31 **0.35 **
40–60/nm0.46 **0.50 **0.59 **0.65 **0.70 **
60–80/nm0.44 **0.57 **0.72 **0.74 **0.74 **
80–100/nm0.42 **0.59 **0.70 **0.68 **0.66 **
100–300/nm0.52 **0.65 **0.64 **0.60 **0.58 **
300–500/nm0.70 **0.59 **0.53 **0.49 **0.49 **
500–1000/nm0.46 **0.35 **0.33 **0.33 **0.33 **
Note: ** is significantly correlated at the 0.01 level (bilateral).

