Distribution of Viable Bacteria in the Dust-Generating Natural Source Area of the Gobi Region, Mongolia

 , and
, and
Abstract
1. Introduction
2. Materials and Methods
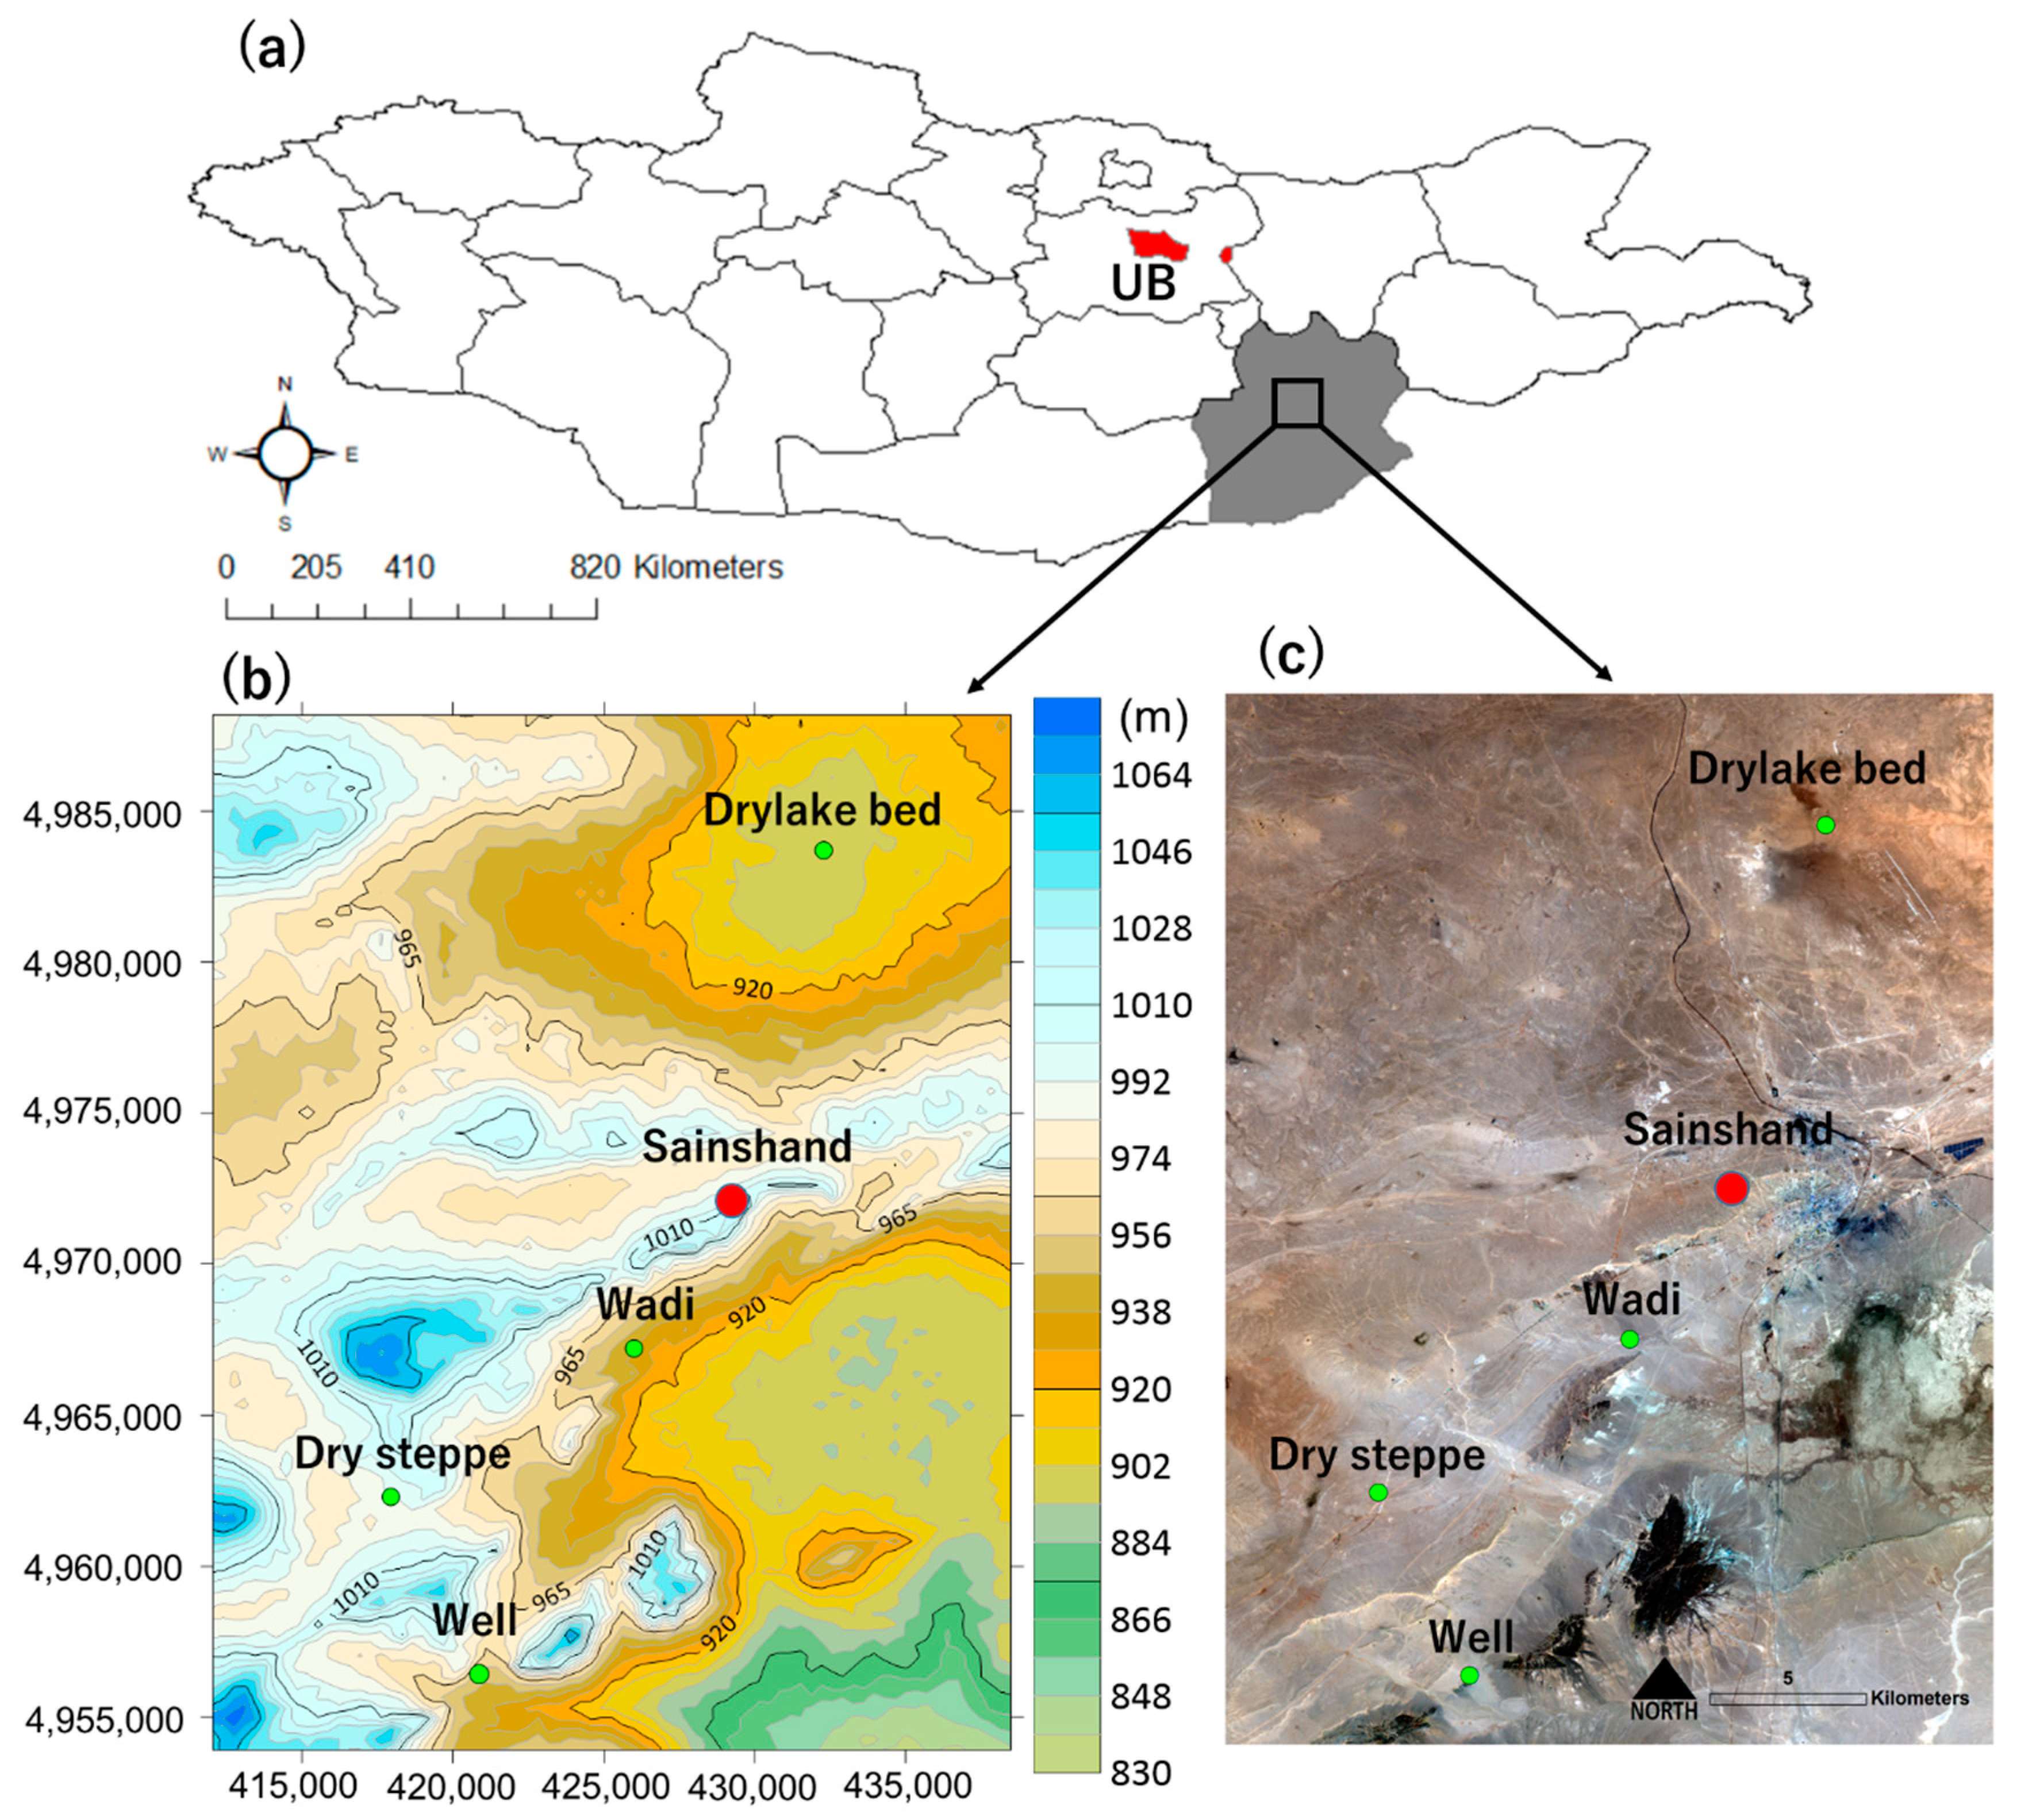
2.1. Sample Collection
2.2. Classification of Land Use
2.3. Experimental Method
2.3.1. Bacterial Isolation and Culture
2.3.2. Amplification of 16s rDNA and Determination of Gene Sequence
2.4. Sample Data Analysis
3. Results
3.1. Soil Moisture Content and Surface Temperature of Each Land Use
3.2. Total Number of Bacteria in Each Sample Point
3.3. Characteristics of Detected Bacteria
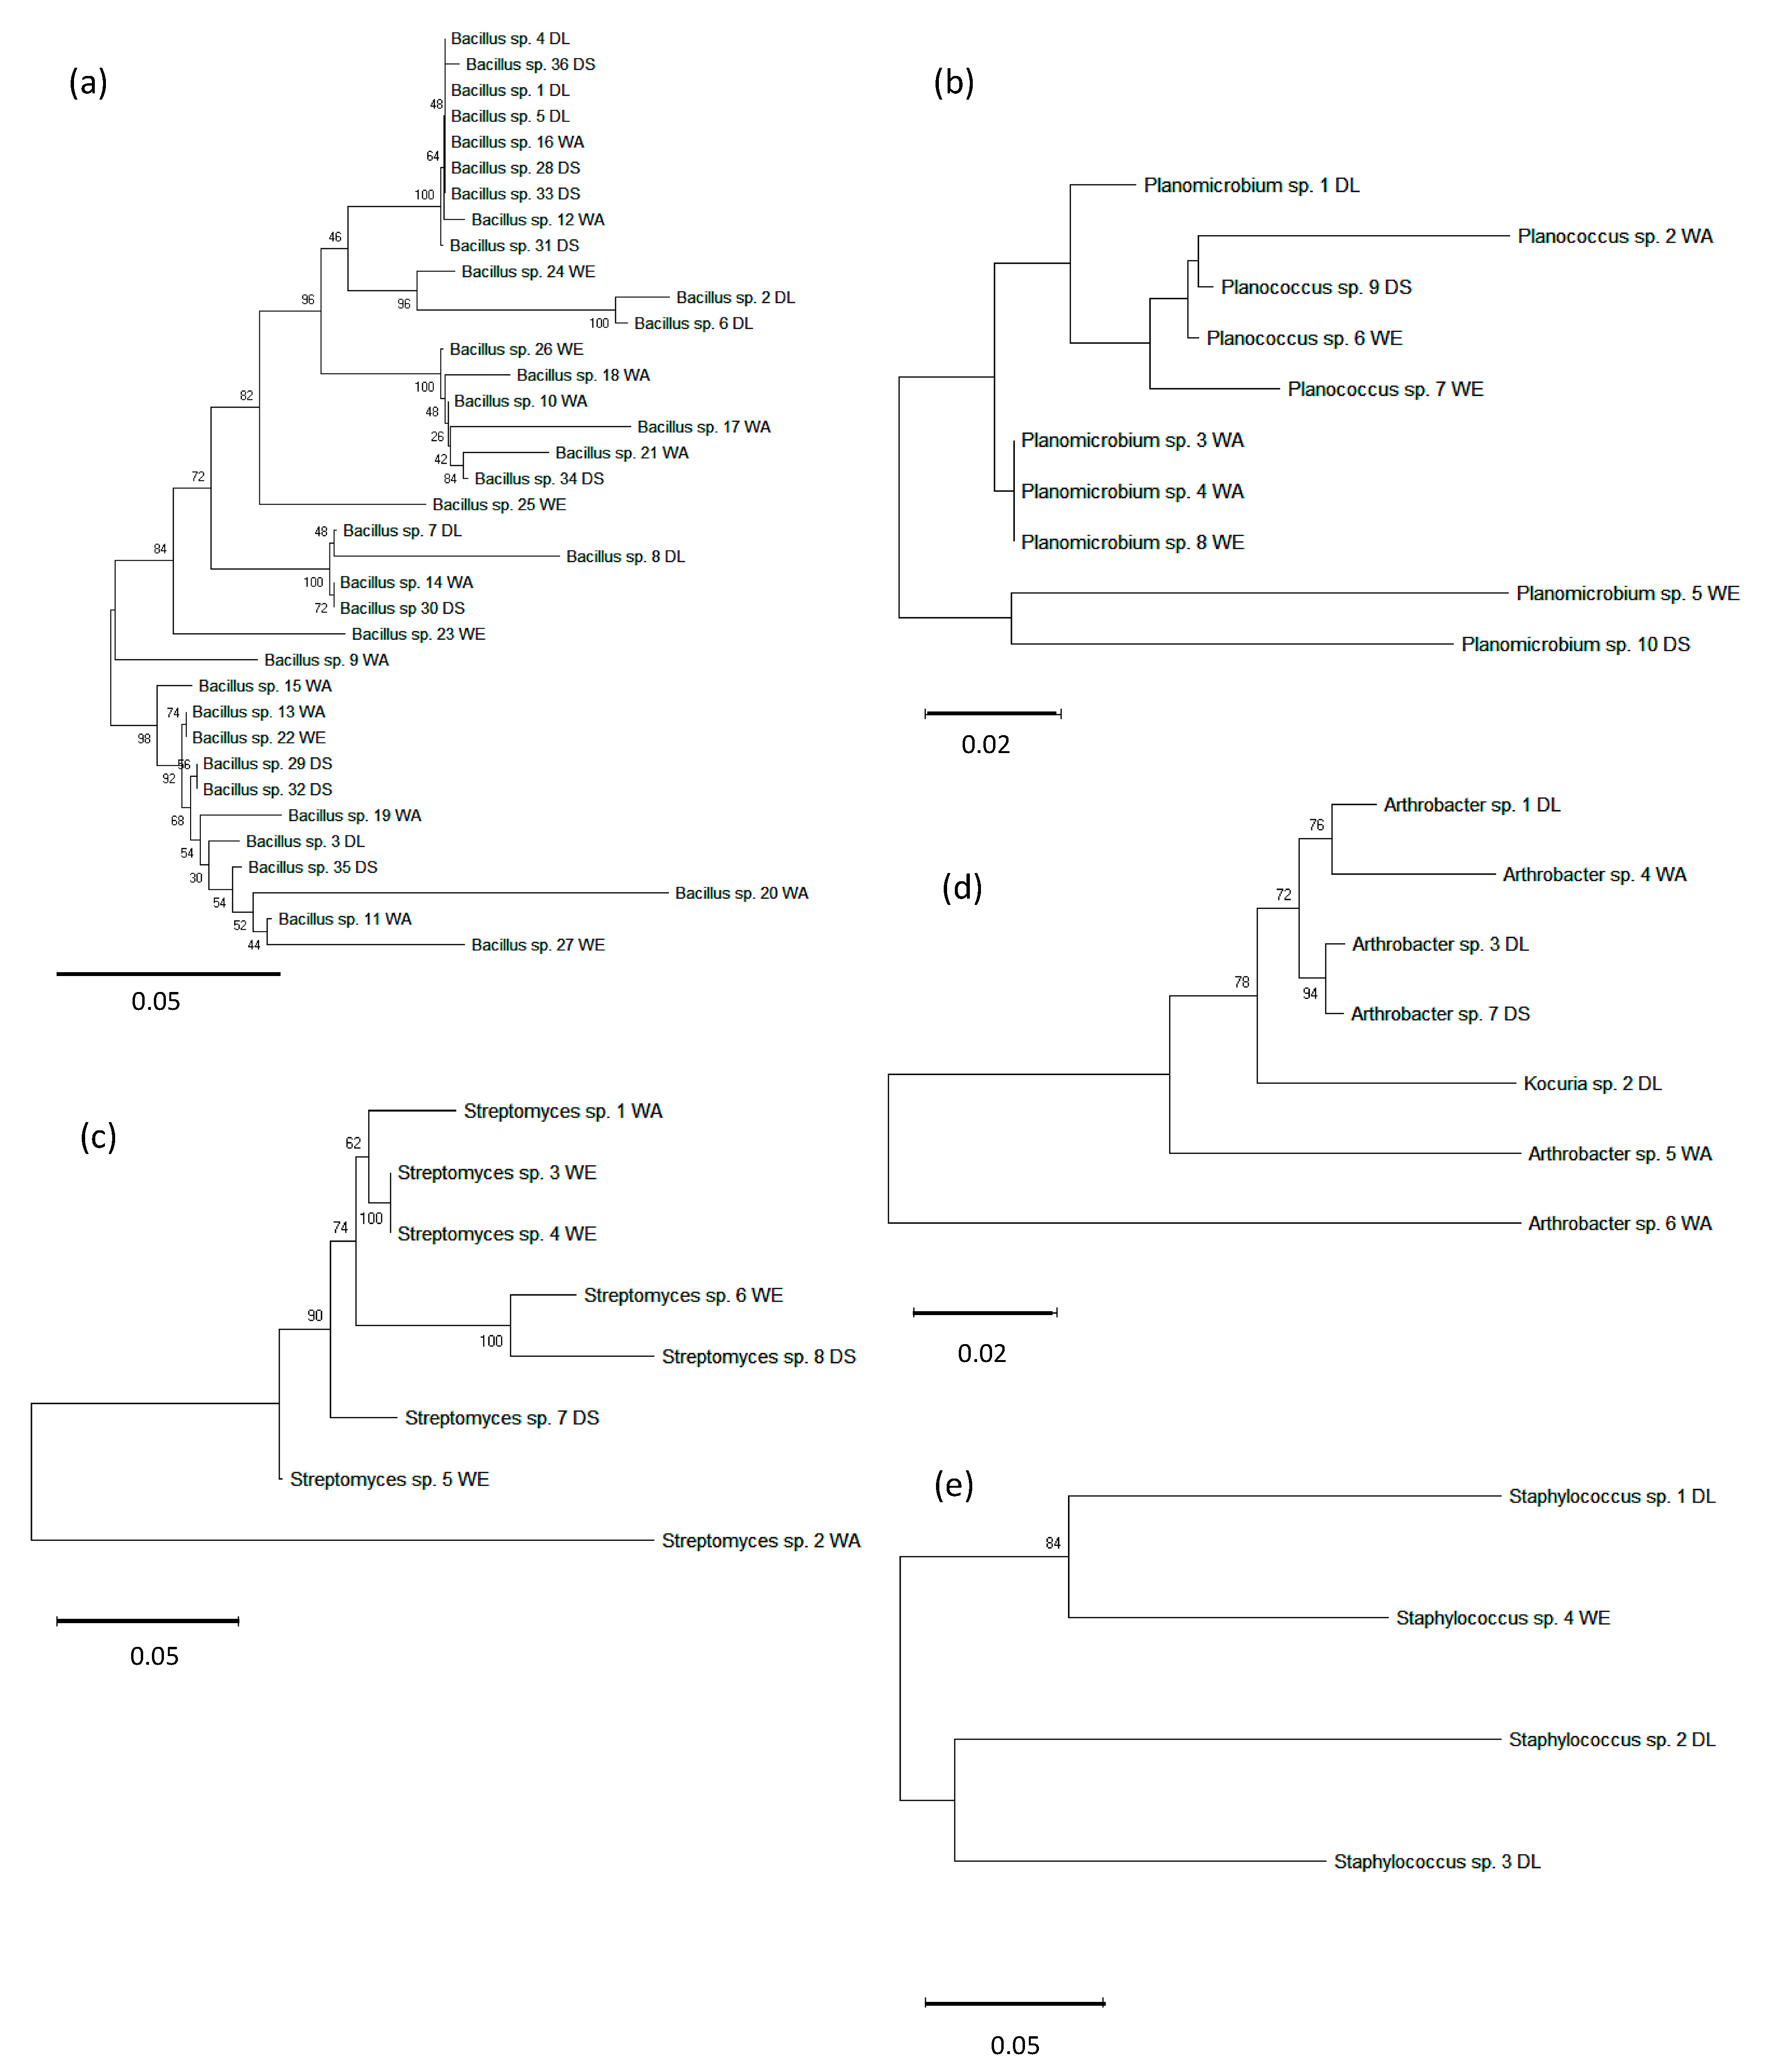
3.4. Bacterial Interrelationship by 16s rDNA Gene Phylogenetic Analysis
4. Discussion
4.1. Environment of Each Land Use and Detected Bacteria
4.2. Diversity of Detected Live Bacteria throughout Land Use
4.3. Characteristics of Detected Bacteria on the Land Environment
5. Conclusions
Supplementary Materials
Author Contributions
Funding
Acknowledgments
Conflicts of Interest
References
- Miller, R.S.; Pepin, K.M. Board Invited Review: Prospects for improving management of animal disease introductions using disease-dynamic models. J. Anim. Sci. 2019, 97, 2291–2307. [Google Scholar] [CrossRef] [PubMed]
- Yadav, M.P.; Singh, R.K.; Malik, Y.S. Emerging and transboundary animal viral diseases: Perspectives and preparedness. Emerg. Transbound. Anim. Viruses 2020, 1–25. [Google Scholar] [CrossRef]
- Torres-Velez, F.; Havas, K.A.; Spiegel, K.; Brown, C. Transboundary animal diseases as re-emerging threats —Impact on One Health. Semin. Diagn. Pathol. 2019, 36, 193–196. [Google Scholar] [CrossRef] [PubMed]
- Lelieveld, J.; Pöschl, U. Chemists can help to solve the air-pollution health crisis. Nature 2017, 551, 291–293. [Google Scholar] [CrossRef] [PubMed]
- Akhtar, R.; Palagiano, C. Climate Change and Air Pollution: The Impact on Human Health in Developed and Developing Countries; Springer International Publishing: Cham, Switzerland, 2018. [Google Scholar]
- Nakao, M.; Ishihara, Y.; Kim, C.-H.; Hyun, I.-G. The impact of air pollution, including Asian sand dust, on respiratory symptoms and health-related quality of life in outpatients with chronic respiratory disease in Korea: A panel study. J. Prev. Med. Public Health 2018, 51, 130–139. [Google Scholar] [CrossRef] [PubMed]
- Polymenakou, P.N.; Mandalakis, M.; Stephanou, E.G.; Tselepides, A. Particle size distribution of airborne microorganisms and pathogens during an intense African dust event in the Eastern Mediterranean. Environ. Health Perspect. 2008, 116, 292–296. [Google Scholar] [CrossRef]
- Shimizu, A.; Sugimoto, N.; Matsui, I.; Arao, K.; Uno, I.; Murayama, T.; Kagawa, N.; Aoki, K.; Uchiyama, A.; Yamazaki, A. Continuous observations of Asian dust and other aerosols by polarization lidars in China and Japan during ACE-Asia. J. Geophys. Res. Atmos. 2004, 109, 1–14. [Google Scholar] [CrossRef]
- Jugder, D.; Shinoda, M.; Kimura, R.; Batbold, A.; Amarjargal, D. Quantitative analysis on windblown dust concentrations of PM10 (PM2.5) during dust events in Mongolia. Aeolian Res. 2014, 14, 3–13. [Google Scholar] [CrossRef]
- Shao, Y. Physics and Modelling of Wind Erosion; Springer Science & Business Media: New York, NY, USA, 2008. [Google Scholar]
- Hoshino, B.S.R.; Sofue, Y.; Demura, Y.; Purevsuren, T.; Hai, Y. Social transition from nomad to settlement in the Mongolian Steppe and its impact on Japan. Assoc. Kyosei Stud. 2015, 9, 1–27. [Google Scholar]
- Demura, Y.; Hoshino, B.; Baba, K.; McCarthy, C.; Sofue, Y.; Kai, K.; Purevsuren, T.; Hagiwara, K.; Noda, J. Determining the frequency of dry lake bed formation in semi-arid Mongolia from satellite data. Land 2017, 6, 88. [Google Scholar] [CrossRef]
- Sofue, Y.; Hoshino, B.; Demura, Y.; Kai, K.; Baba, K.; Nduati, E.; Kondoh, A.; Sternberg, T. Satellite monitoring of vegetation response to precipitation and dust storm outbreaks in Gobi Desert regions. Land 2018, 7, 19. [Google Scholar] [CrossRef]
- Kim, H.-S.; Kim, D.-S.; Kim, H.; Yi, S.-M. Relationship between mortality and fine particles during Asian dust, smog-Asian dust, and smog days in Korea. Int. J. Environ. Health Res. 2012, 22, 518–530. [Google Scholar] [CrossRef] [PubMed]
- Maki, T.; Lee, K.C.; Kawai, K.; Onishi, K.; Hong, C.S.; Kurosaki, Y.; Shinoda, M.; Kai, K.; Iwasaka, Y.; Archer, S.D.J.; et al. Aeolian dispersal of bacteria associated with desert dust and anthropogenic particles over continental and oceanic surfaces. J. Geophys. Res. Atmos. 2019, 124, 5579–5588. [Google Scholar] [CrossRef]
- Sugimoto, N.; Uno, I.; Nishikawa, M.; Shimizu, A.; Matsui, I.; Dong, X.; Chen, Y.; Quan, H. Record heavy Asian dust in Beijing in 2002: Observations and model analysis of recent events. Geophys. Res. Lett. 2003, 30, 1640. [Google Scholar] [CrossRef]
- Jugder, D.; Shinoda, M.; Sugimoto, N.; Matsui, I.; Nishikawa, M.; Park, S.-U.; Chun, Y.-S.; Park, M.-S. Spatial and temporal variations of dust concentrations in the Gobi Desert of Mongolia. Glob. Planet. Chang. 2011, 78, 14–22. [Google Scholar] [CrossRef]
- Hoshino, B.; Sofue, Y.; Demura, Y.; Purevsuren, T.; Kuribayashi, M.; Baba, K.; Zoljargal, E.; Hagiwara, K.; Noda, J.; Kawano, K.; et al. Detection of dry lake beds formation and estimate of environmental regime shift in semi-arid region. J. Arid Land Stud. 2018, 28, 109–113. [Google Scholar]
- Okada, K.; Naruse, H.; Tanaka, T.; Nemoto, O.; Iwasaka, Y.; Wu, P.-M.; Ono, A.; Duce, R.A.; Uematsu, M.; Merrill, J.T.; et al. X-ray spectrometry of individual Asian dust-storm particles over the Japanese islands and the North Pacific Ocean. Atmos. Environ. Part A Gen. Top. 1990, 24, 1369–1378. [Google Scholar] [CrossRef]
- Park, S.H.; Song, C.B.; Kim, M.C.; Kwon, S.B.; Lee, K.W. Study on size distribution of total aerosol and water-soluble ions during an Asian dust storm event at Jeju Island, Korea. Environ. Monit. Assess. 2004, 93, 157–183. [Google Scholar] [CrossRef]
- Ichinose, T.; Nishikawa, M.; Takano, H.; Sera, N.; Sadakane, K.; Mori, I.; Yanagisawa, R.; Oda, T.; Tamura, H.; Hiyoshi, K.; et al. Pulmonary toxicity induced by intratracheal instillation of Asian yellow dust (Kosa) in mice. Environ. Toxicol. Pharmacol. 2005, 20, 48–56. [Google Scholar] [CrossRef]
- Yamaguchi, N.; Baba, T.; Ichijo, T.; Himezawa, Y.; Enoki, K.; Saraya, M.; Li, P.-F.; Nasu, M. Abundance and community structure of bacteria on Asian dust particles collected in Beijing, China, during the Asian dust season. Biol. Pharm. Bull. 2016, 39, 68–77. [Google Scholar] [CrossRef]
- Takeuchi, S.; Kojima, H.; Saito, I.; Jin, K.; Kobayashi, S.; Tanaka-Kagawa, T.; Jinno, H. Detection of 34 plasticizers and 25 flame retardants in indoor air from houses in Sapporo, Japan. Sci. Total Environ. 2014, 491–492, 28–33. [Google Scholar] [CrossRef] [PubMed]
- Tang, K.; Huang, Z.; Huang, J.; Maki, T.; Zhang, S.; Shimizu, A.; Ma, X.; Shi, J.; Bi, J.; Zhou, T.; et al. Characterization of atmospheric bioaerosols along the transport pathway of Asian dust during the Dust-Bioaerosol 2016 Campaign. Atmos. Chem. Phys. 2018, 18, 7131–7148. [Google Scholar] [CrossRef]
- Fröhlich-Nowoisky, J.; Kampf, C.J.; Weber, B.; Huffman, J.A.; Pöhlker, C.; Andreae, M.O.; Lang-Yona, N.; Burrows, S.M.; Gunthe, S.S.; Elbert, W.; et al. Bioaerosols in the Earth system: Climate, health, and ecosystem interactions. Atmos. Res. 2016, 182, 346–376. [Google Scholar] [CrossRef]
- Maki, T.; Kakikawa, M.; Kobayashi, F.; Yamada, M.; Matsuki, A.; Hasegawa, H.; Iwasaka, Y. Assessment of composition and origin of airborne bacteria in the free troposphere over Japan. Atmos. Environ. 2013, 74, 73–82. [Google Scholar] [CrossRef]
- Delfino, R.J.; Sioutas, C.; Malik, S. Potential role of ultrafine particles in associations between airborne particle mass and cardiovascular health. Environ. Health Perspect. 2005, 113, 934–946. [Google Scholar] [CrossRef]
- Martiny, J.B.; Bohannon, B.J.; Brown, J.H.; Colwell, R.K.; Fuhrman, J.A.; Green, J.L.; Horner-Devine, M.C.; Kane, M.; Krumins, J.A.; Kuske, C.R.; et al. Microbial biogeography: Putting microorganisms on the map. Nat. Rev. Microbiol. 2006, 4, 102–112. [Google Scholar] [CrossRef]
- Griffin, D.W. Atmospheric movement of microorganisms in clouds of desert dust and implications for human health. Clin. Microbiol. Rev. 2007, 20, 459–477. [Google Scholar] [CrossRef]
- Natsagdorj, L.; Jugder, D.; Chung, Y.S. Analysis of dust storms observed in Mongolia during 1937–1999. Atmos. Environ. 2003, 37, 1401–1411. [Google Scholar] [CrossRef]
- Digital Elevation-SRTM (The Shuttle Radar Topography Mission). Available online: https://www.usgs.gov/centers/eros/science/usgs-eros-archive-digital-elevation-shuttle-radar-topography-mission-srtm-1-arc?qt-science_center_objects=0#qt-science_center_objects (accessed on 20 August 2020).
- ESA Sentinel 2 Data. Available online: https://scihub.copernicus.eu/ (accessed on 20 August 2020).
- Golden Software Surfer. Available online: https://www.goldensoftware.com/products/surfer (accessed on 20 August 2020).
- Rashki, A.; Kaskaoutis, D.G.; Goudie, A.S.; Kahn, R.A. Dryness of ephemeral lakes and consequences for dust activity: The case of the Hamoun drainage basin, southeastern Iran. Sci. Total Environ. 2013, 463–464, 552–564. [Google Scholar] [CrossRef]
- Garrity, G.M.; Bell, J.A.; Lilburn, T.G. Taxonomic outline of the prokaryotes. In Bergey’s Manual of Systematic Bacteriology; Springer: New York, NY, USA; Berlin/Heidelberg, Germany, 2004. [Google Scholar]
- Bio Edit (a Biological Sequence Alignment Editor, Version 7.0.9). Available online: https://bioedit.software.informer.com/7.0/ (accessed on 20 August 2020).
- MEGA-X (Molecular Evolutionary Genetics Analysis across Computing Platforms, Verson 10). Available online: https://www.megasoftware.net (accessed on 20 August 2020).
- Yang, Y.; Dou, Y.; An, S. Testing association between soil bacterial diversity and soil carbon storage on the Loess Plateau. Sci. Total Environ. 2018, 626, 48–58. [Google Scholar] [CrossRef]
- Kenzaka, T.; Sueyoshi, A.; Baba, T.; Li, P.; Tani, K.; Yamaguchi, N.; Nasu, M. Soil microbial community structure in an Asian dust source region (Loess plateau). Microbes Environ. 2010, 25, 53–57. [Google Scholar] [CrossRef] [PubMed]
- Griffiths, B.S.; Caul, S.; Thompson, J.; Birch, A.N.E.; Scrimgeour, C.; Andersen, M.N.; Cortet, J.; Messéan, A.; Sausse, C.; Lacroix, B.; et al. A comparison of soil microbial community structure, protozoa and nematodes in field plots of conventional and genetically modified maize expressing the Bacillus thuringiensis CryIAb toxin. Plant Soil 2005, 275, 135–146. [Google Scholar] [CrossRef]
- Yadav, A.N.; Sachan, S.G.; Verma, P.; Saxena, A.K. Bioprospecting of plant growth promoting psychrotrophic Bacilli from the cold desert of north western Indian Himalayas, Indian. J. Exp. Biol. 2016, 54, 142–150. [Google Scholar]
- van Dijl, J.M.; Hecker, M. Bacillus subtilis: From soil bacterium to super-secreting cell factory. Microb. Cell Fact. 2013, 12, 3. [Google Scholar] [CrossRef] [PubMed]
- Dierick, K.; Van Coillie, E.; Swiecicka, I.; Meyfroidt, G.; Devlieger, H.; Meulemans, A.; Hoedemaekers, G.; Fourie, L.; Heyndrickx, M.; Mahillon, J. Fatal family outbreak of Bacillus cereus-associated food poisoning. J. Clin. Microbiol. 2005, 43, 4277–4279. [Google Scholar] [CrossRef] [PubMed]
- Maki, T.; Suzuki, S.; Kobayashi, F.; Kakikawa, M.; Tobo, Y.; Yamada, M.; Higashi, T.; Matsuki, A.; Hong, C.; Hasegawa, H.; et al. Phylogenetic analysis of atmospheric halotolerant bacterial communities at high altitude in an Asian dust (KOSA) arrival region, Suzu City. Sci. Total Environ. 2010, 408, 4556–4562. [Google Scholar] [CrossRef]
- Maki, T.; Hara, K.; Iwata, A.; Lee, K.C.; Kawai, K.; Kai, K.; Kobayashi, F.; Pointing, S.B.; Archer, S.; Hiroshi Hasegawa, H.; et al. Variations in airborne bacterial communities at high altitudes over the Noto Peninsula (Japan) in response to Asian dust events. Atmos. Chem. Phys. 2017, 17, 19. [Google Scholar] [CrossRef]
- Zhou, H.; Wang, X.; Li, Z.; Kuang, Y.; Mao, D.; Luo, Y. Occurrence and distribution of urban dust-associated bacterial antibiotic resistance in Northern China. Environ. Sci. Technol. Lett. 2018, 5, 50–55. [Google Scholar] [CrossRef]
- Takahashi, Y. Exploitation of new microbial resources for bioactive compounds and discovery of new Actinomycetes. Actinomycetologica 2004, 18, 54–61. [Google Scholar] [CrossRef][Green Version]
- Songara, D.; Kaur, S.; House, K. DNA based identification and characterization of thermophilic Streptomyces sp. from desert soil of Rajasthan. Int. J. Curr. Microbiol. Appl. Sci. 2013, 2, 418–427. [Google Scholar]
- Idris, H.; Labeda, D.P.; Nouioui, I.; Castro, J.F.; del Carmen Montero-Calasanz, M.; Bull, A.T.; Asenjo, J.A.; Goodfellow, M. Streptomyces aridus sp. Nov.; isolated from a high altitude Atacama Desert soil and emended description of Streptomyces noboritoensis Isono et al. 1957. Antonie Leeuwenhoek 2017, 110, 705–717. [Google Scholar] [CrossRef] [PubMed][Green Version]
- Nicholas, A.B.; Thissen, J.B.; Gardner, S.N.; McLoughlin, K.S.; Fofanov, V.Y.; Koshinsky, H.; Ellingson, S.R.; Brettin, T.S.; Jackson, P.J.; Jaing, C.J. Detection of Bacillus anthracis DNA in complex soil and air samples using next-generation sequencing. PLoS ONE 2013, 8, e73455. [Google Scholar]


| Place | Ground Surface Temperature (°C) | Volumetric Soil Water Content (%) |
|---|---|---|
| Dry lake bed | 38.4 ± 1.18 | 7.2 ± 0.37 |
| Wadi | 37.7 ± 1.18 | 3.2 ± 0.13 ⁑ |
| Well | 35.7 ± 1.50 | 3.7 ± 0.25 ⁑ |
| Desert Steppe | 30.2 ± 0.33 * | 5.0 ± 0.40 ⁑ |
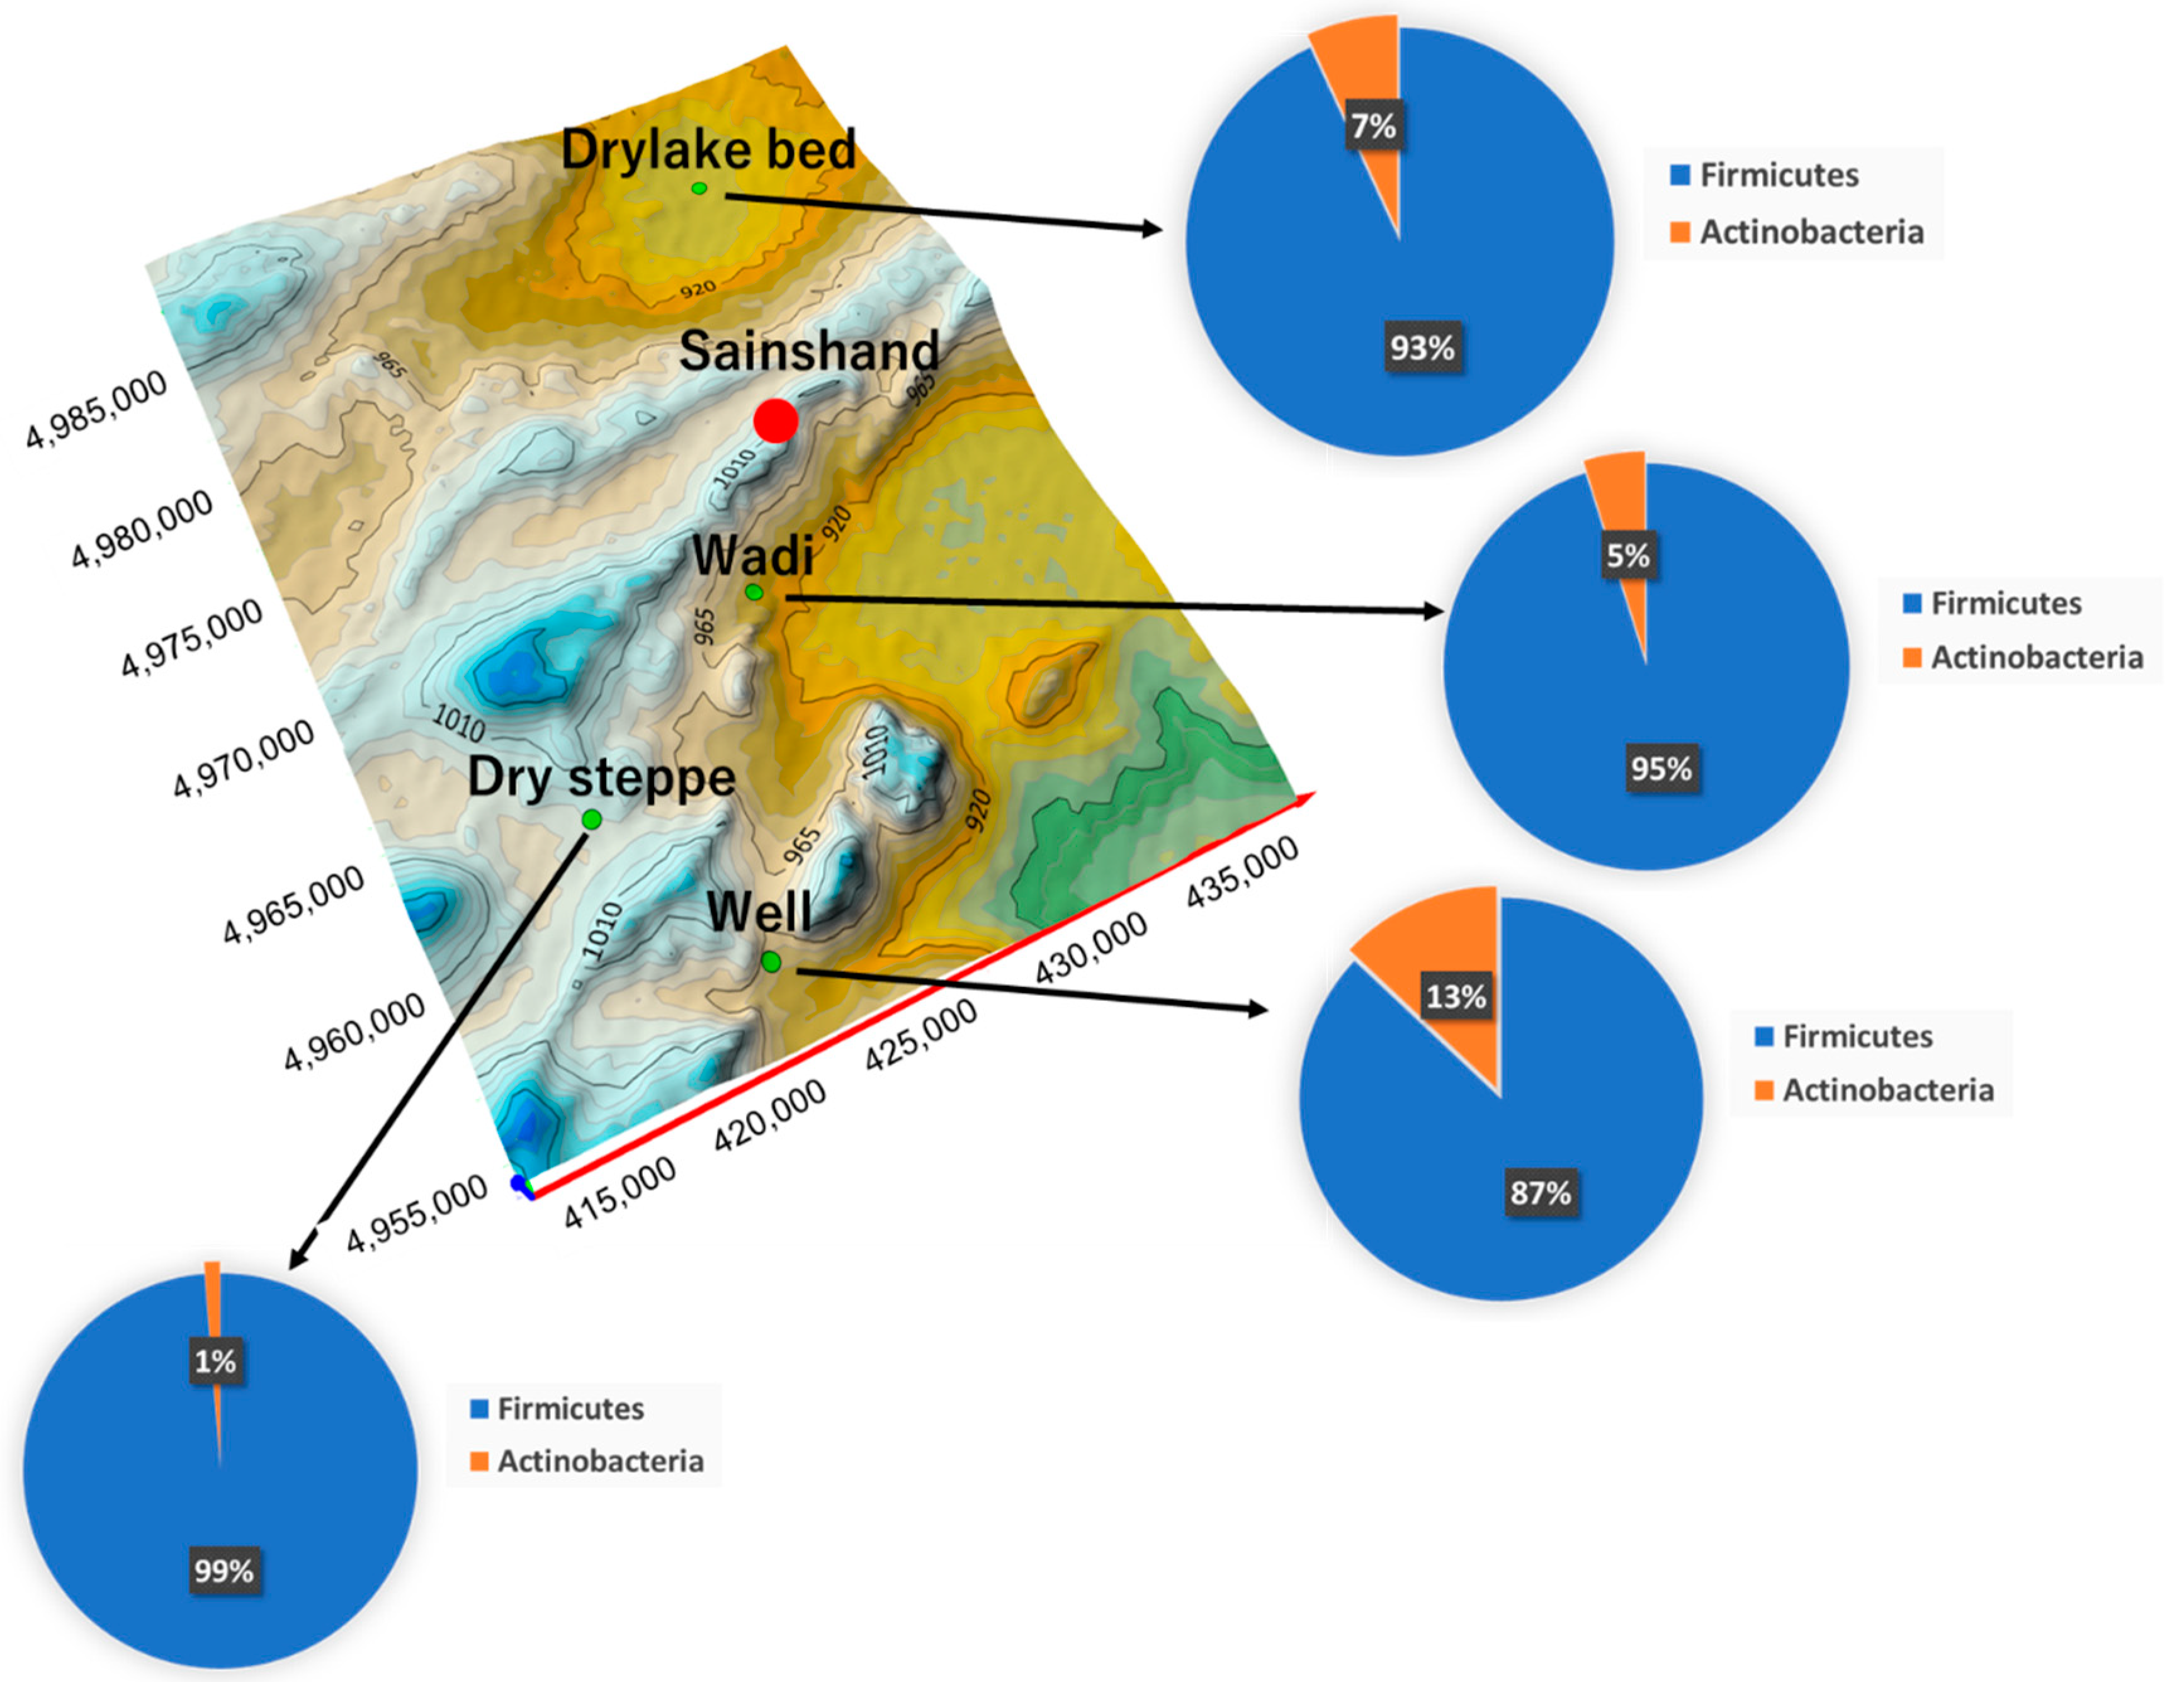
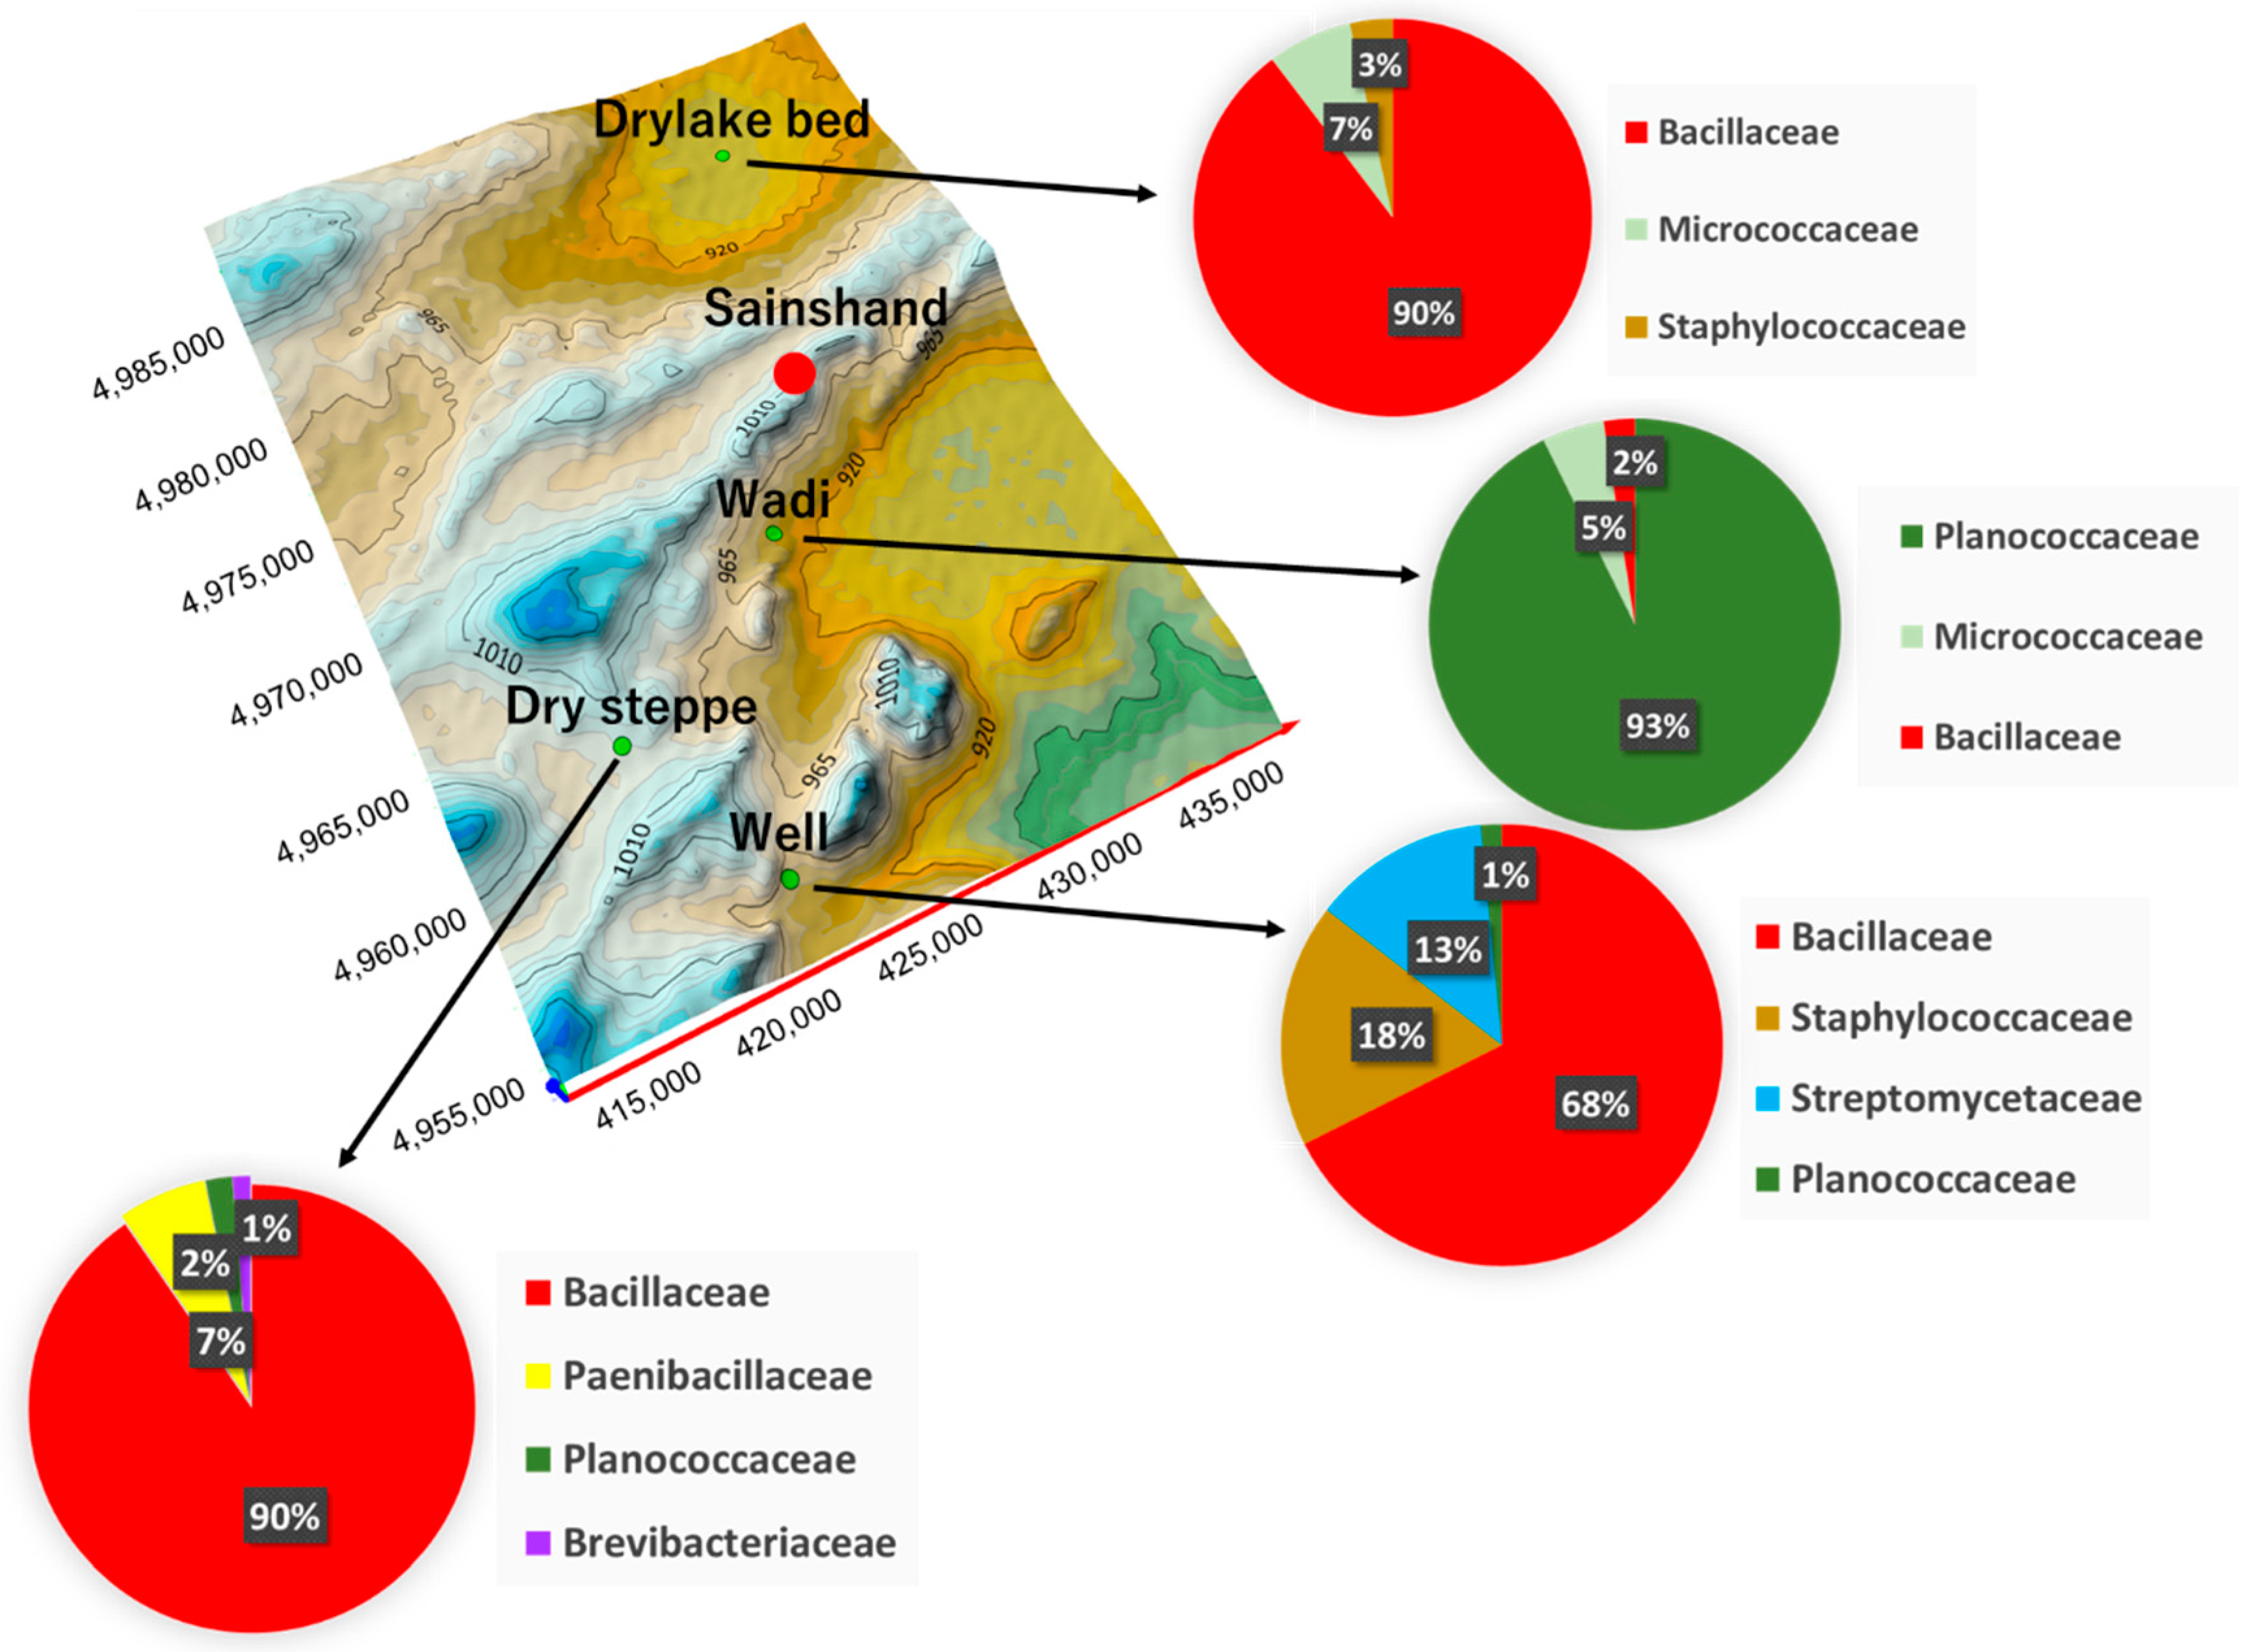
| Place | Phylum | Family | Species | CFU * (CFU g−1) |
|---|---|---|---|---|
| Dry lake bed | Firmicutes | Bacillaceae | Bacillus sp. | 6 × 10⁶ |
| Actinobacteria | Micrococcaceae | Arthrobacter sp. | 2 × 10⁵ | |
| Firmicutes | Staphylococcaceae | Staphylococcus sp. | 1 × 10⁵ | |
| Wadi | Firmicutes | Planococcaceae | Planomicrobium sp. | 2 × 10⁶ |
| Actinobacteria | Micrococcaceae | Micrococcus sp. | 105 | |
| Firmicutes | Bacillaceae | Bacillus sp. | 105 | |
| Well | Firmicutes | Bacillaceae | Bacillus sp. | 9 × 10⁶ |
| Actinobacteria | Streptomycetaceae | Streptomyces sp. | 3 × 10⁶ | |
| Firmicutes | Staphylococcaceae | Staphylococcus sp. | 2 × 10⁶ | |
| Firmicutes | Planococcaceae | Planococcus sp. | 2 × 10⁵ | |
| Desert Steppe | Firmicutes | Bacillaceae | Bacillus sp. | 7 × 10⁶ |
| Firmicutes | Paenibacillaceae | Brevibacillus sp. | 3 × 10⁵ | |
| Firmicutes | Planococcaceae | Planococcus sp. | 8 × 10⁴ | |
| Actinobacteria | Brevibacteriaceae | Brevibacterium sp. | 5 × 10⁴ |
© 2020 by the authors. Licensee MDPI, Basel, Switzerland. This article is an open access article distributed under the terms and conditions of the Creative Commons Attribution (CC BY) license (http://creativecommons.org/licenses/by/4.0/).
Share and Cite
Hagiwara, K.; Matsumoto, T.; Tsedendamba, P.; Baba, K.; Hoshino, B. Distribution of Viable Bacteria in the Dust-Generating Natural Source Area of the Gobi Region, Mongolia. Atmosphere 2020, 11, 893. https://doi.org/10.3390/atmos11090893
Hagiwara K, Matsumoto T, Tsedendamba P, Baba K, Hoshino B. Distribution of Viable Bacteria in the Dust-Generating Natural Source Area of the Gobi Region, Mongolia. Atmosphere. 2020; 11(9):893. https://doi.org/10.3390/atmos11090893
Chicago/Turabian StyleHagiwara, Katsuro, Tamaki Matsumoto, Purevsuren Tsedendamba, Kenji Baba, and Buho Hoshino. 2020. "Distribution of Viable Bacteria in the Dust-Generating Natural Source Area of the Gobi Region, Mongolia" Atmosphere 11, no. 9: 893. https://doi.org/10.3390/atmos11090893
APA StyleHagiwara, K., Matsumoto, T., Tsedendamba, P., Baba, K., & Hoshino, B. (2020). Distribution of Viable Bacteria in the Dust-Generating Natural Source Area of the Gobi Region, Mongolia. Atmosphere, 11(9), 893. https://doi.org/10.3390/atmos11090893