Article

Characterization of Spatio-Temporal Trends and Periodicity of Precipitation over Malawi during 1979–2015

1
Key Laboratory of Meteorological Disaster, Ministry of Education (KLME)/Joint International Research Laboratory of Climate and Environment Change (ILCEC)/Collaborative Innovation Center on Forecast and Evaluation of Meteorological Disasters (CIC-FEMD), Nanjing University of Information Science & Technology, Nanjing 210044, China
2
Jiangsu Key Laboratory of Atmospheric Environment Monitoring and Pollution Control, Collaborative Innovation Centre of Atmospheric Environment and Equipment Technology, School of Environmental Science and Engineering, Nanjing University of Information Science and Technology, Nanjing 210044, China
*
Authors to whom correspondence should be addressed.
Atmosphere 2020, 11(9), 891; https://doi.org/10.3390/atmos11090891
Submission received: 11 July 2020 / Revised: 14 August 2020 / Accepted: 20 August 2020 / Published: 23 August 2020
(This article belongs to the Special Issue Climate Events and Extreme Weather)

Abstract

:
Precipitation remains the key climatic parameter in sub-Saharan Africa, as it drives the economy through rain-fed agricultural production. Malawi is one of the countries most susceptible to the impacts of climate change and variability. This paper presents the characteristics of spatio-temporal trends and periodicity of precipitation in Malawi in the period from 1979 to 2015. The analysis was based on recent rain ground gauge data. In total, 31 out of 36 rainfall stations, which include some key stations from the southeast of Malawi, were selected for the study after robust homogeneity tests were applied to the datasets. Spatial distribution of annual mean precipitation showed that high amounts of rainfall are located in areas along the lake and the southeast part of Malawi. The spatial distribution of the wet season (November to April) precipitation from EOF (Empirical Orthogonal Function) analysis revealed ten wet years (1985, 1986, 1989, 1996, 1997, 1999, 2001, 2006, 2007, and 2015) and ten dry years (1981, 1983, 1987, 1990, 1992, 1994, 1995, 2005, 2011, and 2014). In general, the temporal trends analyses of seasonal (wet season) and annual precipitations both displayed slight decreasing slopes during the 37 years. The trend of precipitation per decade displayed an increase in precipitation during 1980s and 1990s, followed by a decrease in the 21st century. Furthermore, the analysis of the spatial and temporal variability and trends of rainfall showed that northern and central Malawi displayed a clearer variability than southern Malawi. Although the trends of most of the stations are not significant at 95% confidence level, the decreasing rates of rainfall in the last decade and the decreasing trends on wet season and annual scale detected by Mann–Kendall tests require closer monitoring of rainfall changes in the near future. The stations which exhibited significant trends (Naminjiwa and Dedza stations) also call for closer monitoring, since the area relies heavily on rain-fed agriculture for economic sustenance.

1. Introduction

Climate change and variability are considered to have effects on ecosystems. The impacts are particularly great in developing countries, where rain-fed agriculture plays a prominent role in food production and the economy [1,2,3]. There is a growing volume of research works on climate change and variability with insightful results across the globe. According to the Intergovernmental Panel on Climate Change (IPCC), the atmospheric global mean temperatures over land and oceans have increased by 0.85 °C over the last century [4]. This temperature variation over time affects the global water cycle, altering the amount, occurrence, and timing of precipitation [5]. Such changes in trends and frequencies of annual and seasonal precipitations are regarded as critical pointers of climate changes [6]. These changes have attracted large attention from many researchers in both global and regional scopes [7,8,9].
Previous studies, for example, Alexander [10], have documented varying patterns in precipitation distribution, with some regions reported to experience intensification while others undergo decline in rainfall amount and frequency. Climate communication [11] clarifies that over the recent past, the rainy domains have been experiencing anomalous rainfall events, while drier regions extend the prevailing conditions, following the principle of the ‘rich-get-richer’ pattern. Latitudinal comparison reveals an increase in rainfall over the Northern Hemisphere and mid-latitude as compared to the tropics and Antarctic domains. Most significantly, areas located in arid and semi-arid lands (ASALs), subtropical catchments, and the Southern Hemisphere in general have witnessed a decline in precipitation [5,7,12]. Amongst all the climatic variables, rainfall proves to be the most crucial variable, particularly in sub-Saharan Africa, as it is the main driving factor for the agriculture-based economy in these areas [13,14].
In Malawi, climate change-related issues have accelerated existing challenges with food availability, poverty, health, and development [14,15]. The poor distribution of precipitation leads to floods and droughts in Malawi and other sub-Saharan African countries. Droughts and floods are among the most damaging climatic events that are costly to the lives of people in Malawi. Flood in Malawi causes a decline of about 0.7 percent of total economic output loss on average, while drought and prolonged rainfall deficiency in Malawi impact hugely on socioeconomic infrastructures [16]. Rainfall remains to be one of the most studied variables at regional scale [17]. However, in-depth exploration of annual and seasonal characteristics of rainfall at local scale is crucial for acquiring results which are not often captured in regional studies.
A few studies on rainfall have been conducted in Malawi with various objectives and approaches. For instance, Jury and Mwafulirwa [18] investigated the spatio-temporal variability of rainfall based on statistical associations and predictability for the period from 1962 to 1995. Many similarities in regional rainfall variation and diagnostic features were revealed. To illustrate these, the study noted the influence of ocean–atmosphere feedback loops such as the El Niño Southern Oscillation (ENSO) and Quasi-Biennial Oscillation (QBO) phases. However, only 21 rainfall stations were utilized in the study and some key stations from southeast Malawi were not utilized, subsequently presenting a need of wider coverage in space and time as more data have been collected in recent years. Using the sea surface temperature (SST) and rainfall datasets from 1981 to 2011, Kumbuyo et al. [19] reported the interannual oscillation of rainfall, with geographical features contributing a key role in the annual variation of rainfall. These findings require further support and validation from recent observation data in more surface stations. Ngongondo et al. [20] also evaluated the spatio-temporal characteristics of precipitation in Malawi using monthly rainfall data from 42 rainfall stations during the period from 1960 to 2006 and additional daily rainfall data from several stations in the southern region for different periods ranging from 1971 to 2008. The results depicted non-significant decreasing rainfall trends and unstable monthly rainfall regimes. Despite the large spatial coverage, huge gaps in the datasets compelled Ngongondo et al. [20] to adopt the 10% maximum threshold for missing records. This calls for further study with a lengthy duration incorporating recent observed data. With the aid of climate change indexes, Libanda et al. [21] approached the subject of Malawi precipitation by studying the changing patterns of pluvial events over the study domain. This brings in a need to understand the overall spatio-temporal attributes of precipitation, focusing on annual and seasonal scales. More recently, Haghtalab et al. [15] utilized the CHIRPS dataset and several rainfall variability indexes during the assessment of precipitation patterns and seasonality over time and space in Malawi during the period of 1981–2018, in which it was established that approximately one-third of Malawi experienced substantive change based on the indexes employed during the study duration. The study further stressed the need for more ground gauge measurements to verify some aspects of the results.
This study, therefore, employs recent rain gauge datasets and several robust methods to study the comprehensive characteristics of spatio-temporal trends and periodicity of seasonal and annual precipitations over Malawi. This is prominent mainly because the documentation of precipitation features over the study area is an essential prior condition for agriculture forecasting and economic growth.
The remaining sections of this paper are as follows. Section 2 describes the physical and climatic features over the study domain, introducing data and methods. In Section 3, the results are captured. Summary and discussion are highlighted in Section 4.

2. Study Area, Data and Methods

2.1. Study Area

Malawi is a landlocked country with a geographical area of 118,484 square km. It is situated in southeastern Africa between latitudes of 9° S–17° S and longitudes of 32° E–36° E (Figure 1a). It is bordered by Tanzania to the north, Mozambique to the south and southwest, and Zambia to the east. Various physiographic features are distributed across the study domain. For instance, as the third largest lake in Africa and part of the Great Rift Valley, Lake Malawi forms borders with Malawi, Mozambique, and Tanzania (Figure 1b).
Malawi experiences a subtropical climate with average annual rainfall between 600 and 2500 mm. It is tropically wet and dry, also known as savanna. The climate of Malawi is regulated by the oscillation of the inter-tropical convergence zone (ITCZ). Overall, across many domains over Africa continent, the ITCZ is also known to influence precipitation patterns, thus, defining the onset and cessation of agricultural activity for farmers who depend on the oscillation of the rain band across the region. Over East Africa, Mumo et al. [13], Ongoma and Chen [17], and Ayugi et al. [22] pointed out that the vulnerability of farmers, who are reliant on rain-fed agriculture primarily, is influenced by the north–south movement of convective band [23].
The other important main rain-bearing system in Malawi is the northwest monsoon, which is made up of recurved tropical Atlantic air reaching southeastern Africa via the Congo basin. In some instances, the study domain experiences tropical cyclones from the West Indian Ocean. With reference to their positions, cyclones are known to cause anomalous patterns of below-normal or above-normal rainfall patterns over Malawi [18].

2.2. Data

This study utilized monthly surface observations provided by the Department of Climate Change and Meteorological Services (DCCMS) of Malawi. The study began with datasets from 36 stations, which was later reduced to 31 stations after quality control. Among the 31 stations, 16 are synoptic stations and the rest are active rainfall stations. In the study area, the spatial distribution of the stations in the southern part is relatively dense as compared to that in the central and northern part. For instance, northern Malawi is represented by 5 synoptic stations. Among the 8 stations representing central Malawi, 6 are synoptic and 2 are rainfall stations, while the southern part is represented by 5 synoptic stations and 14 rainfall stations. The study period is 37 years (1979–2015) and the geographical characteristics of the stations are shown in Table 1.

2.3. Methods

In order to achieve the objective of this study, the methods employed are described as follows.

2.3.1. Climate Data Quality Control and Homogenization

Prior to the application of the observed data in this study, the quality control process was performed upon the dataset. The process involves estimation of missing data and testing of data homogeneity. This process is crucial since without it, any extreme values, even the ‘outliers’, are likely to stand out as ‘extremes’ when actually, they are not. Missing data have been estimated by using the arithmetical mean method. Any dataset with more than 10% of its observations missing was discarded. The datasets were tested for homogeneity by employing two robust statistical methods of Pettitt’s test [24] and standard normal homogeneity test (SNHT) at the 95% confidence level [25]. Numerous studies have employed similar techniques in hydrometeorological studies to detect possible outliers in the distribution of time series [26,27]. After the processes of quality control and homogenization, the original 36 stations were reduced to 31 stations.

2.3.2. Empirical Orthogonal Function (EOF) Analysis

The EOF described by Lorenz [28] is one of the robust techniques employed in time series analysis in meteorological fields. The technique is mostly employed to explain the variance–covariance of the data through a few modes of variability. For instance, the mode that accounts for largest percentage of the original variability is considered to represent as dominant. These modes can be represented by orthogonal spatial patterns (eigenvectors) and corresponding time series (principal components). The first Principal Component (PC1), displays the temporal variability of the patterns observed in the spatial vectors and so the second (PC2) and third (PC3), respectively. More information and related mathematical equations explaining the approach are documented in detail by Hannachi et al. [29]. Some studies have utilized this technique to investigate dominant modes of rainfall over East Africa [3,30]. In this study, EOF analysis was used to determine the leading mode responsible for the November–April rainfall over Malawi. In order to estimate the probability of extreme events during the time period under consideration, the study adopted a plotting order rank technique of ±2 to represent wet/dry anomalies. More information can be accessed from Makkonen [31].

2.3.3. Linear Trend Test

We employed the Theil–Sen Slope (TSS) technique to appraise the long duration tendency and precipitation anomaly over the study area. This technique is utilized to evaluate the magnitude of the slope of the linear trend for the given data [32]. This method is considered to be effective due to the robust features of outliers in datasets. It is not influenced by any extreme distribution and does not entail any normal distribution of the residuals. It has been generally employed in various studies to examine the linear tendencies of hydroclimatic variables across various domains [9,13,27,33].

2.3.4. Mann–Kendall Test

The detection of abrupt changes in rainfall trends was determined by using the sequential Mann–Kendall (MK) statistical test [34,35]. This method has been applied widely, especially in climate, environmental, and hydrological studies [36,37,38] as it is a useful tool to check any trend in a given time series against the null hypothesis of no trend.
The sequential MK test applied in the present study explicitly explains the trends and significance of climate parameters, as well as the influence of these changes on water resource management and drought severity over the study area. The changes are demonstrated by using the trends of forward u ( t ) and backward u ( t ) for rainfall. The significance level (i.e., 95% confidence level) is depicted when the intersection of u ( t ) and u ( t ) occurs above (below) the upper (lower) limit point.

2.3.5. Wavelet Analysis

The wavelet transform is employed to characterize the precipitation cycle and possible periodicity. It reveals the completion of time scale representation of localized frequency information and transient phenomena occurring at different time scales. Detailed information regarding the equations and features necessary for application of this technique was discussed in Torrence and Compo [39]. The wavelet transform uses a decomposition approach during the post processing of the datasets to highlight possible frequencies and signals. In this study, the continuous wavelet transform (CWT) analysis was utilized to generate varying coefficients that signify the similarity between the signal and mother wavelets at any specific scale base. The equation of the CWT is given below:
W n ( s ) = n = 1 N ( δ t s ) 1 / 2 x n ψ * [ ( n n ) δ t s ]
where W n ( s ) is the wavelet coefficient, N indicates the number of points in the time series, and n indicates the time index describing the location of the wavelet in time. S is the wavelet scale and δ t is the sampling interval. The function ψ is called the mother wavelet and ψ is the complex conjugate.

3. Results and Discussions

3.1. Preliminary Analysis

One of the steps included in the preliminary analysis was the testing of homogeneity. The precipitation data for 36 stations were examined for normality by using the standard normal homogeneity test (SNHT) and Pettitt’s test, as described in Section 2.3.1. A station was considered to be homogenous if its value was above the threshold 0.05. Stations found to be inhomogeneous in both Pettit’s test and SNHT were dropped from further analysis as their datasets could lead to wrong results and consequently, bad interpretation and conclusion. The results of SNHT and Pettitt’s test shown in Table 1 demonstrate the homogeneity for 31 stations across the study domain. However, five stations were only tested homogenous for the Pettitt’s test or SNHT, namely Naminjiwa, Phalula, Karonga, Bolero, and Nkhotakota. Hence, the rainfall data of these five stations should be treated with caution.
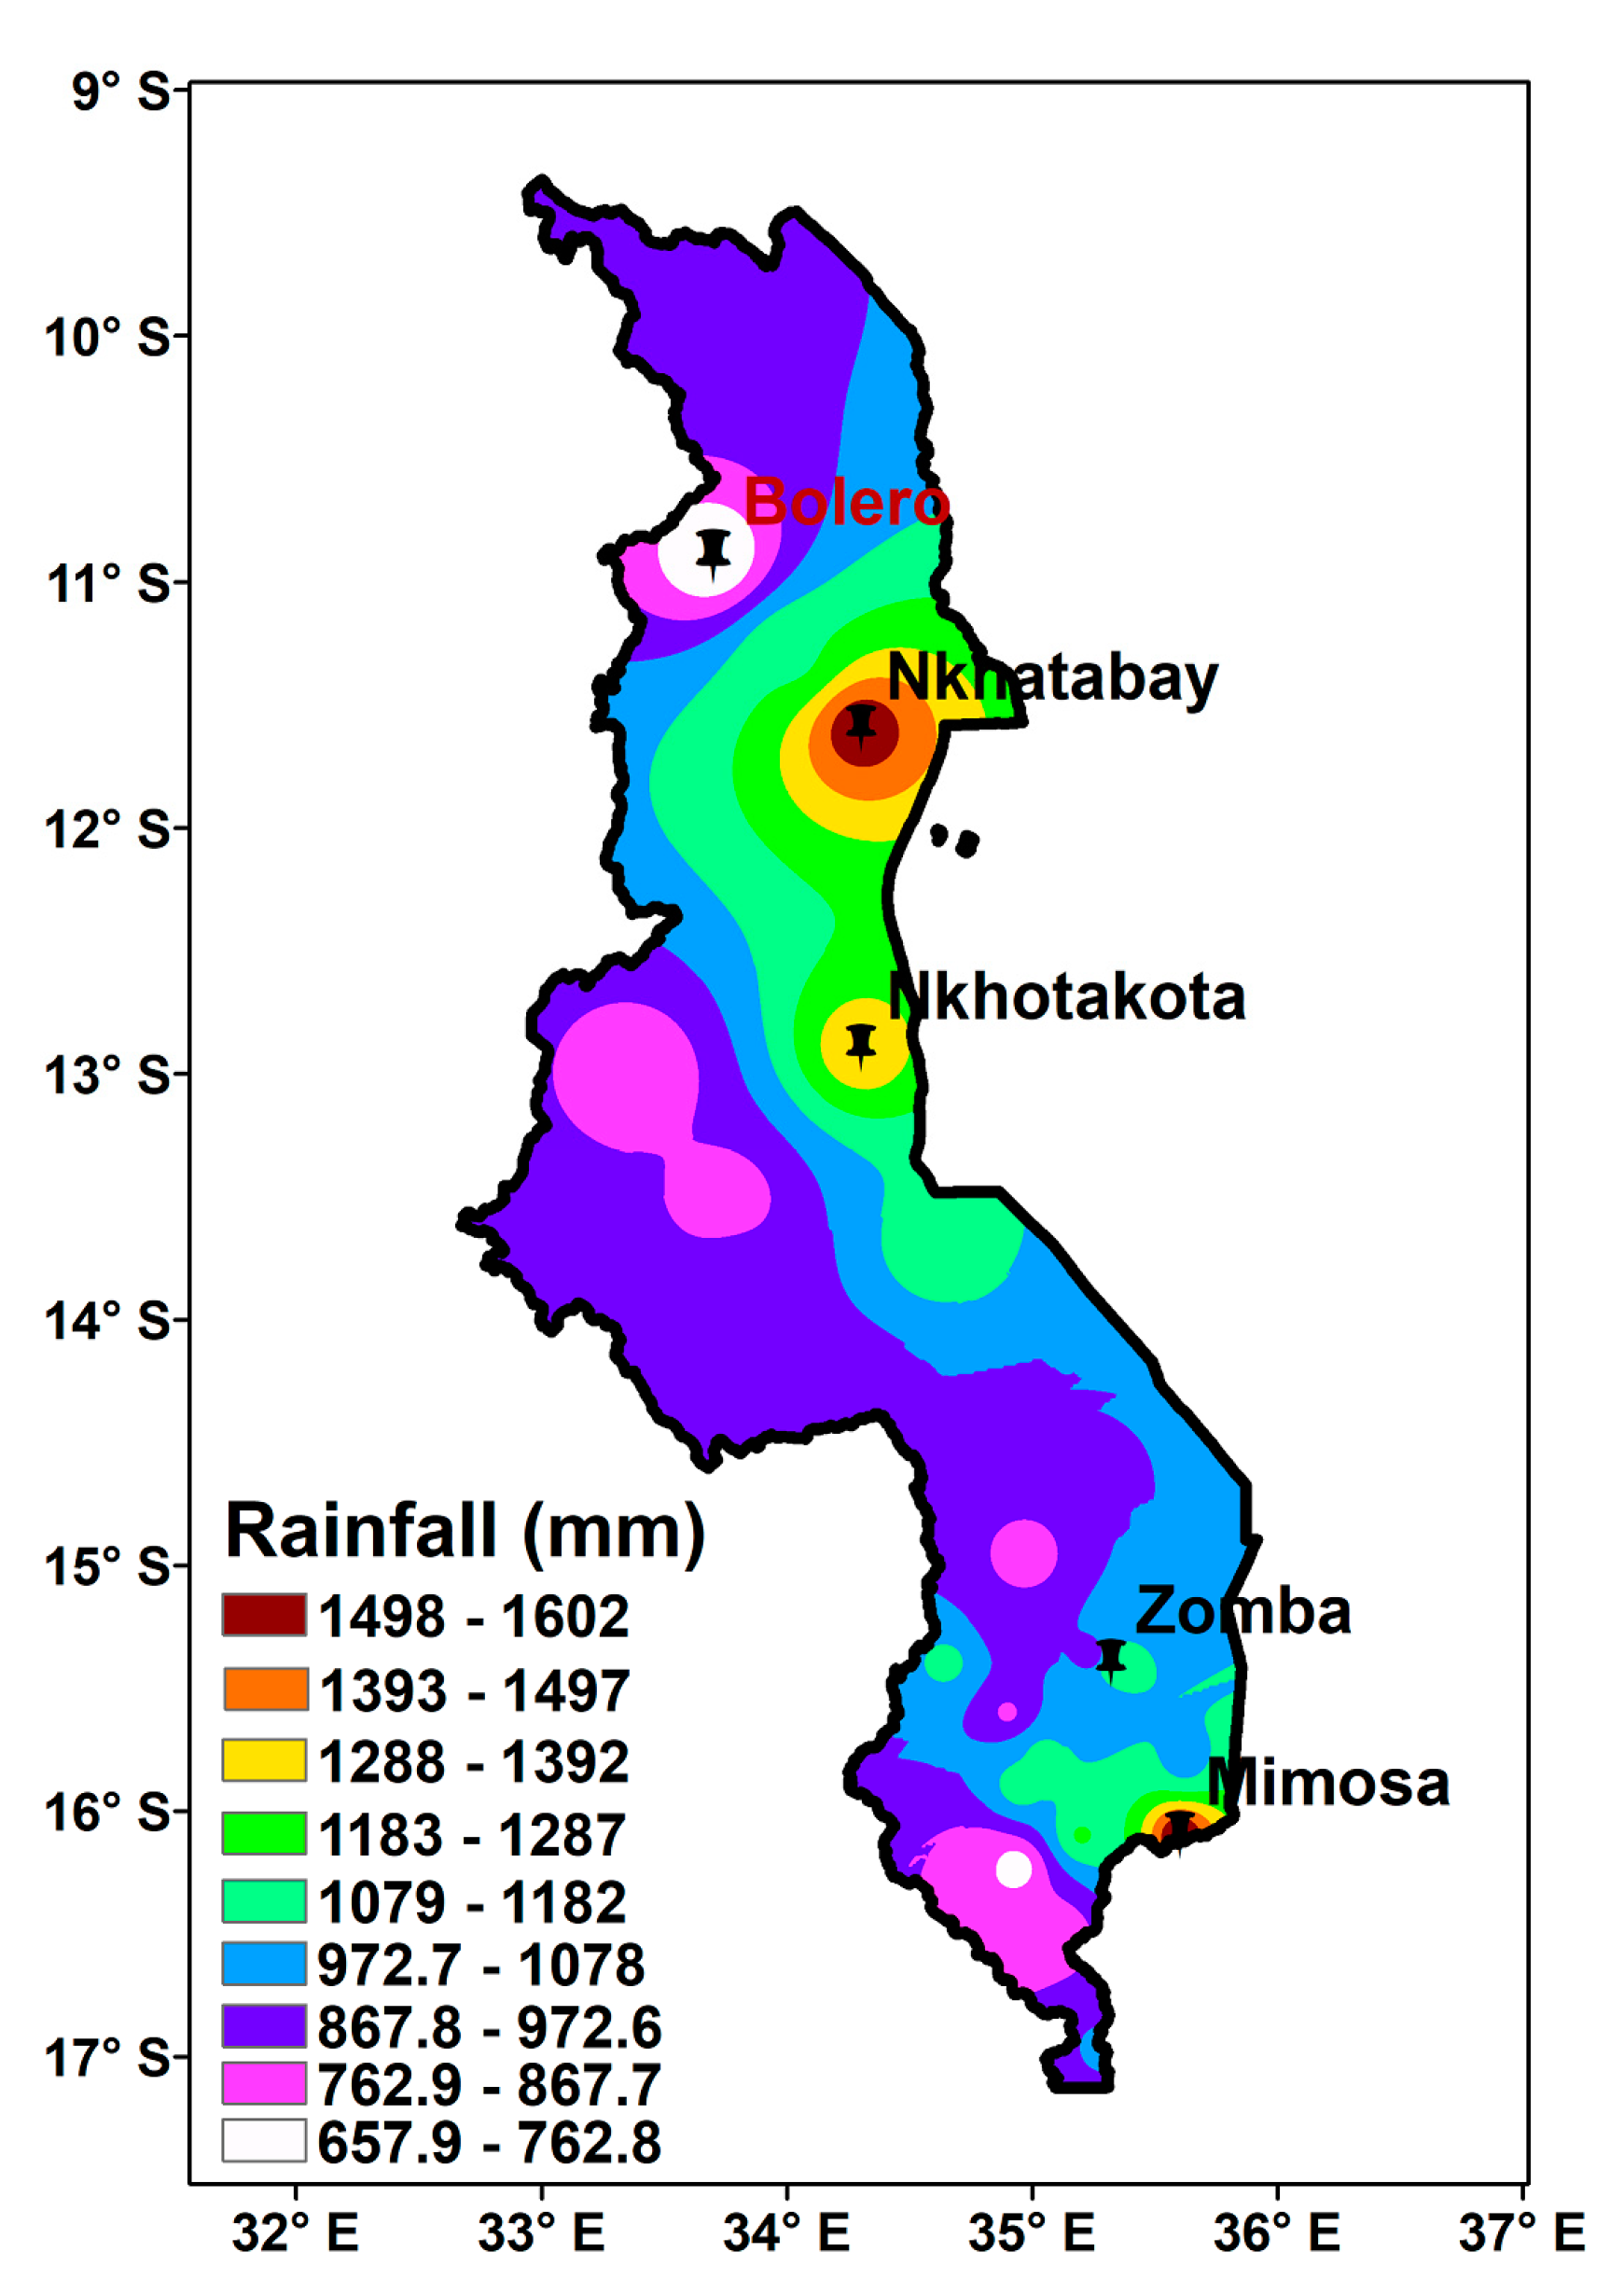
Preliminary results also include annual mean rainfall and the standard deviation for each station that gives a clear insight of the spatial distribution of precipitation over the study area (Table 1). As demonstrated in Table 1 and Figure 2, high amounts of rainfall are received in areas along the lake (e.g., Nkhatabay and Nkhotakota stations) and the southeast part of the country (e.g., Zomba and Mimosa stations). The eastern part receives a relatively high amount of rainfall compared to the western part of the country. The highlands in the southern part of the country and the lake have a strong influence on the precipitation distribution over these areas [18,40]. Bolero station in the north of the country receives the least amount of precipitation per year, with an annual mean of 657.72 mm. This spatial pattern of rainfall may be attributed to the high topographical diversity of the study area. The influences of Shire highlands, including Mulanje Mountain in the southeast of Malawi, are certain local factors which could contribute to the high rainfall amounts received at Zomba and Mimosa stations. Lake Malawi may also have a major influence on the high rainfall amounts observed along the western shores, particularly at Nkhotakota and Nkhatabay stations.

3.2. Long-Term Spatio-Temporal Distribution of Rainfall

3.2.1. Analysis of Annual Mean Rainfall Cycle

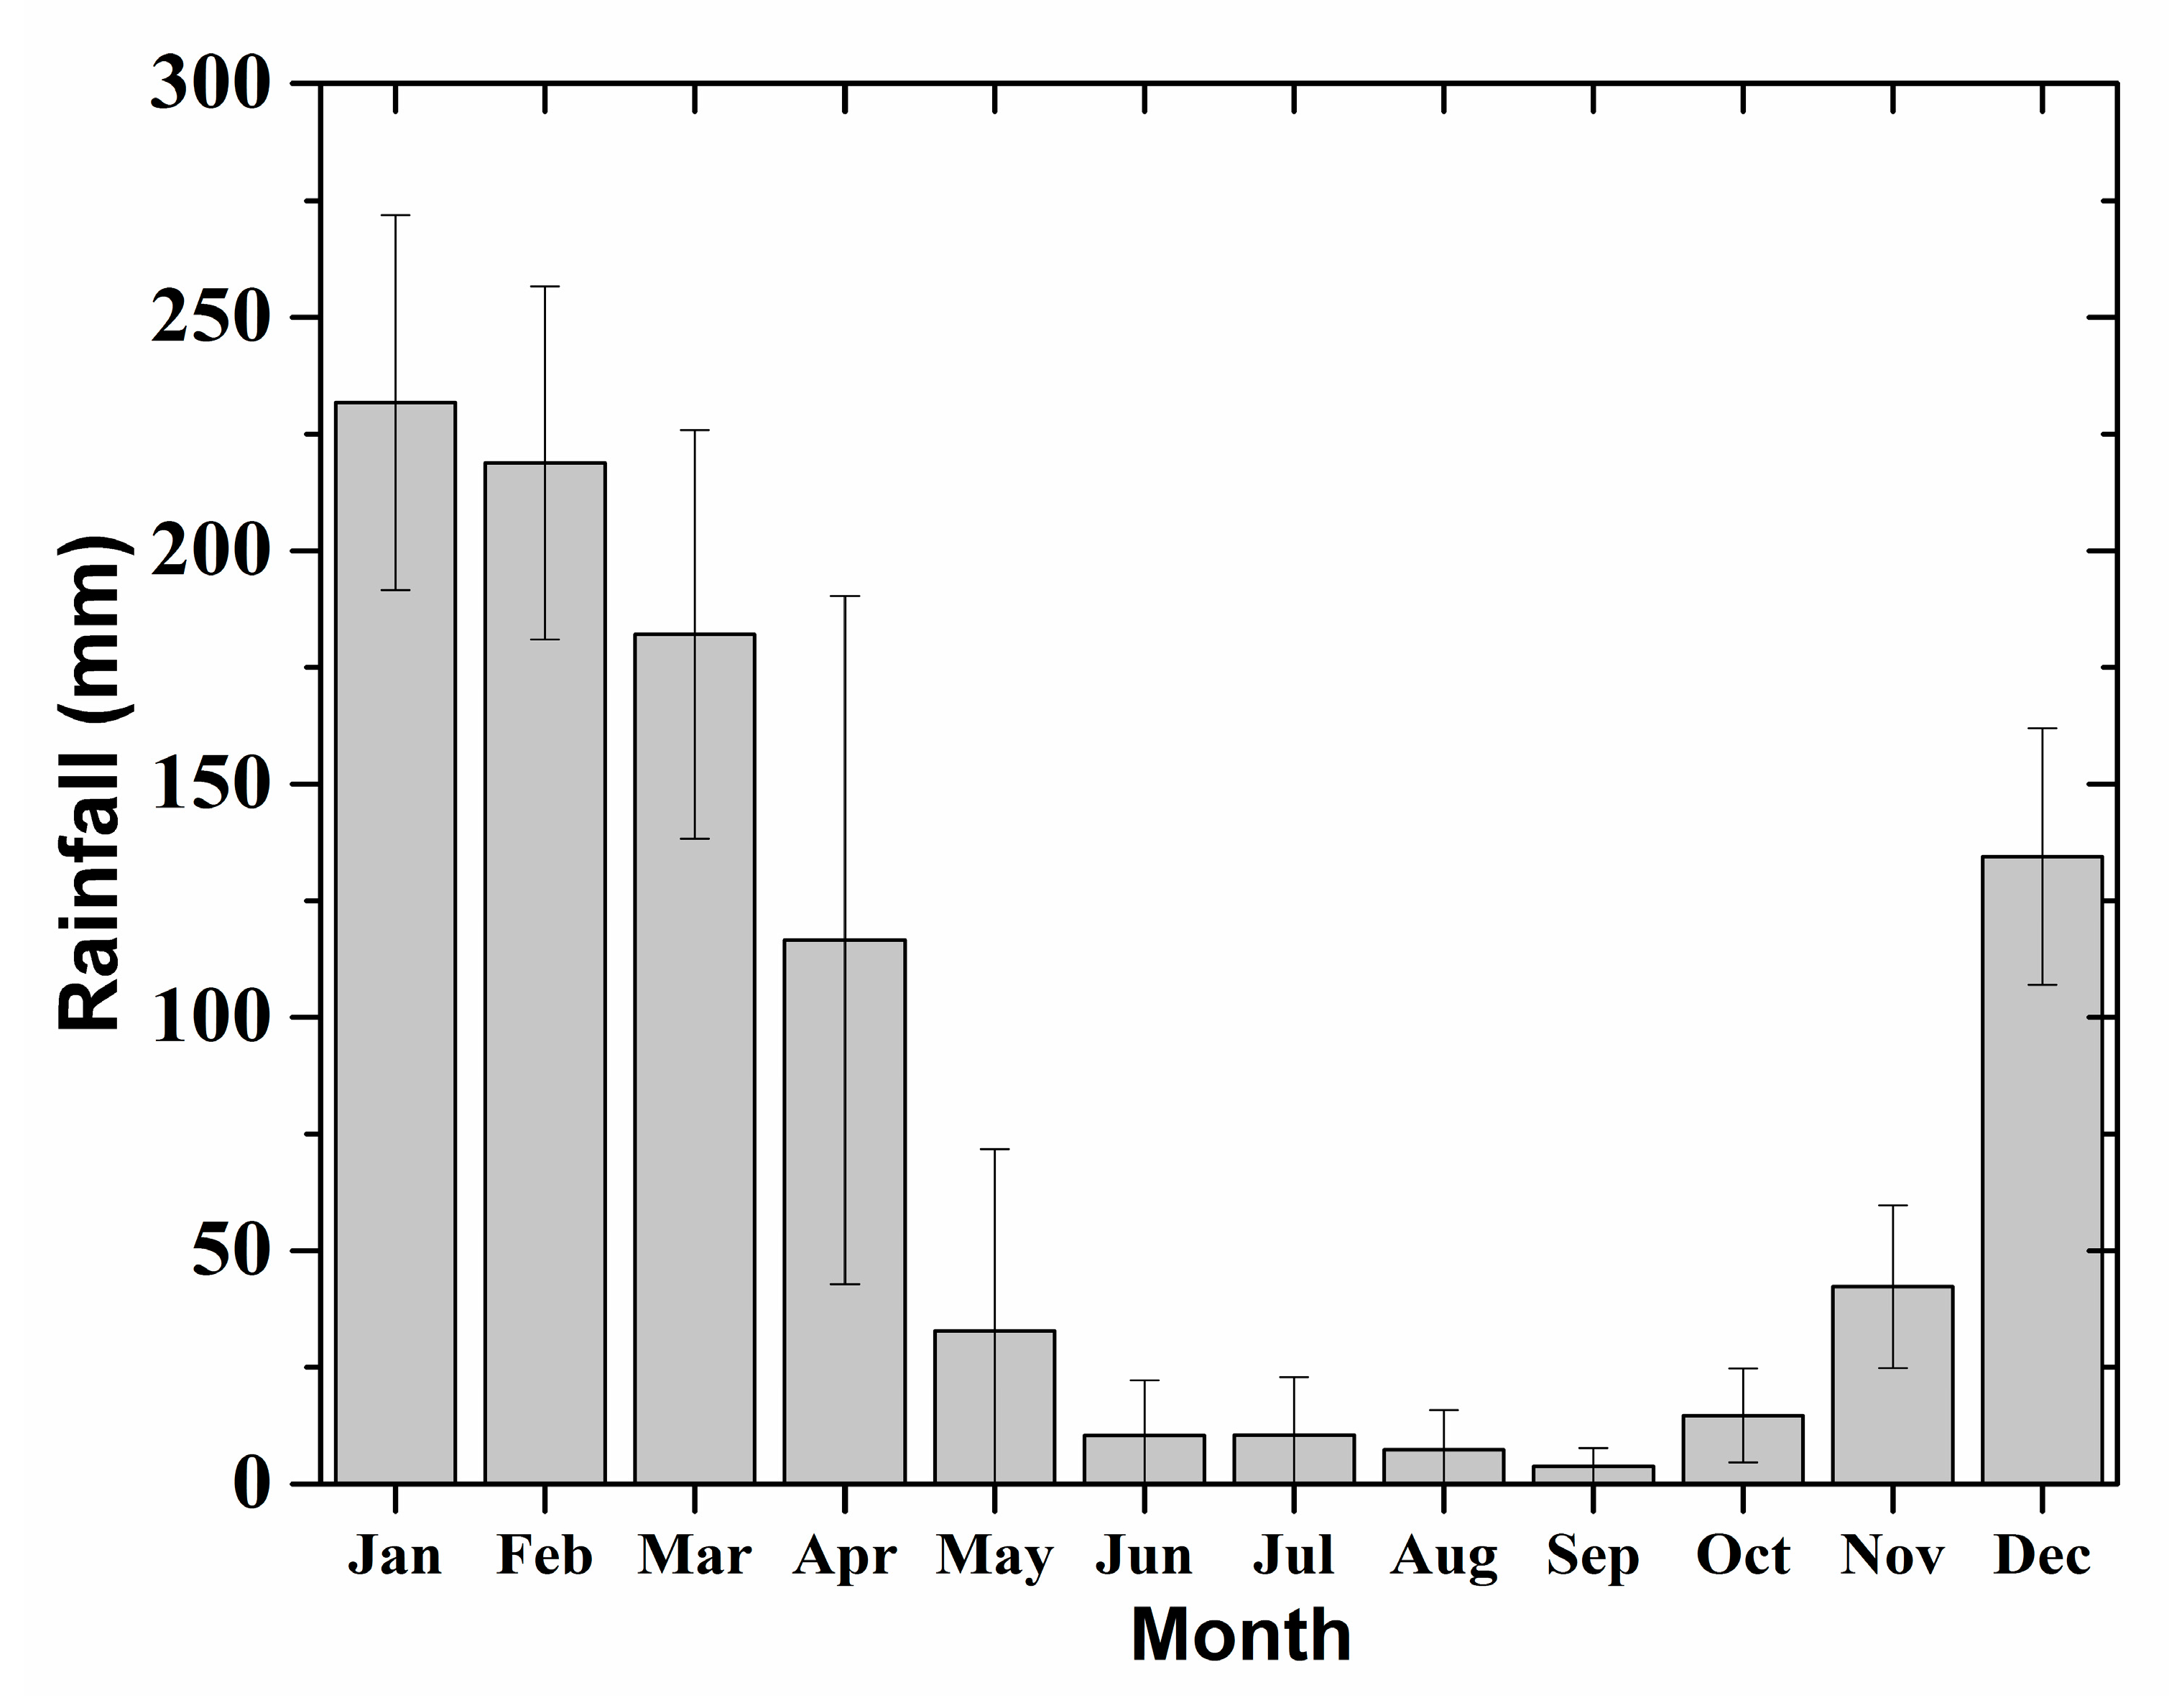
Figure 3 displays the annual mean rainfall cycle and the standard deviation over Malawi during the period of 1979–2015 based on 31 stations distributed across the study domain. The annual precipitation cycle for Malawi indicates that the wet season begins from November and ends in April with a seasonal average of 154.3 mm. The highest amount of precipitation during the study duration was observed in January, with a multiyear average of 231.7 mm equivalent to 21.27% of the total percentage contribution. The least amount of precipitation was received during the dry season (May–October) with an average of 15.3 mm per month. Particularly, the month of September records the lowest percentage contribution (0.35%) during the dry season. Furthermore, the standard deviation depicts that the amount of rainfall received during the dry season is more spread away from the mean.
These results agree with previous observations in Libanda et al. [21] and Warnatzsch and Reay [14]. Libanda et al. [21] stated that the onset and offset of the rainfall season in Malawi is triggered by the position variation of the ITCZ. The ITCZ is a zone of convergence between the moist Congo air mass originating from northeastern trade winds and southeastern trade winds. It has the tendency of oscillating over Malawi during the rainy season and often connects with the troughs in the Mozambique Channel [18]. The ITCZ dominates most areas of southern Malawi from November before retreating to northern Malawi during March and April, bringing an end to the wet season [21]. The movement defines the rainfall season and climatology of wet and dry months over the study region. From the results of Figure 3, we define the months from November to April as wet months in Malawi.
Furthermore, Taljaard [41] highlighted that during the southern summer, the ITCZ is located across northern Madagascar, the central part of the Mozambique Channel, and southern Malawi to eastern Zambia, then, it veers northwards to Lake Tanganyika. This indicates that during the wet season, vast areas of southern Africa receives a lot of precipitation associated with the ITCZ phenomenon and it often comes along with flooding activities [42]. The convergence belt is also considered as a strong influencing factor for West African precipitation during August, which is around the time of the rainy season in Sahel [43], thereby influencing the onset of agricultural activities in this region as well.

3.2.2. Spatial Analysis of Wet Season Precipitation

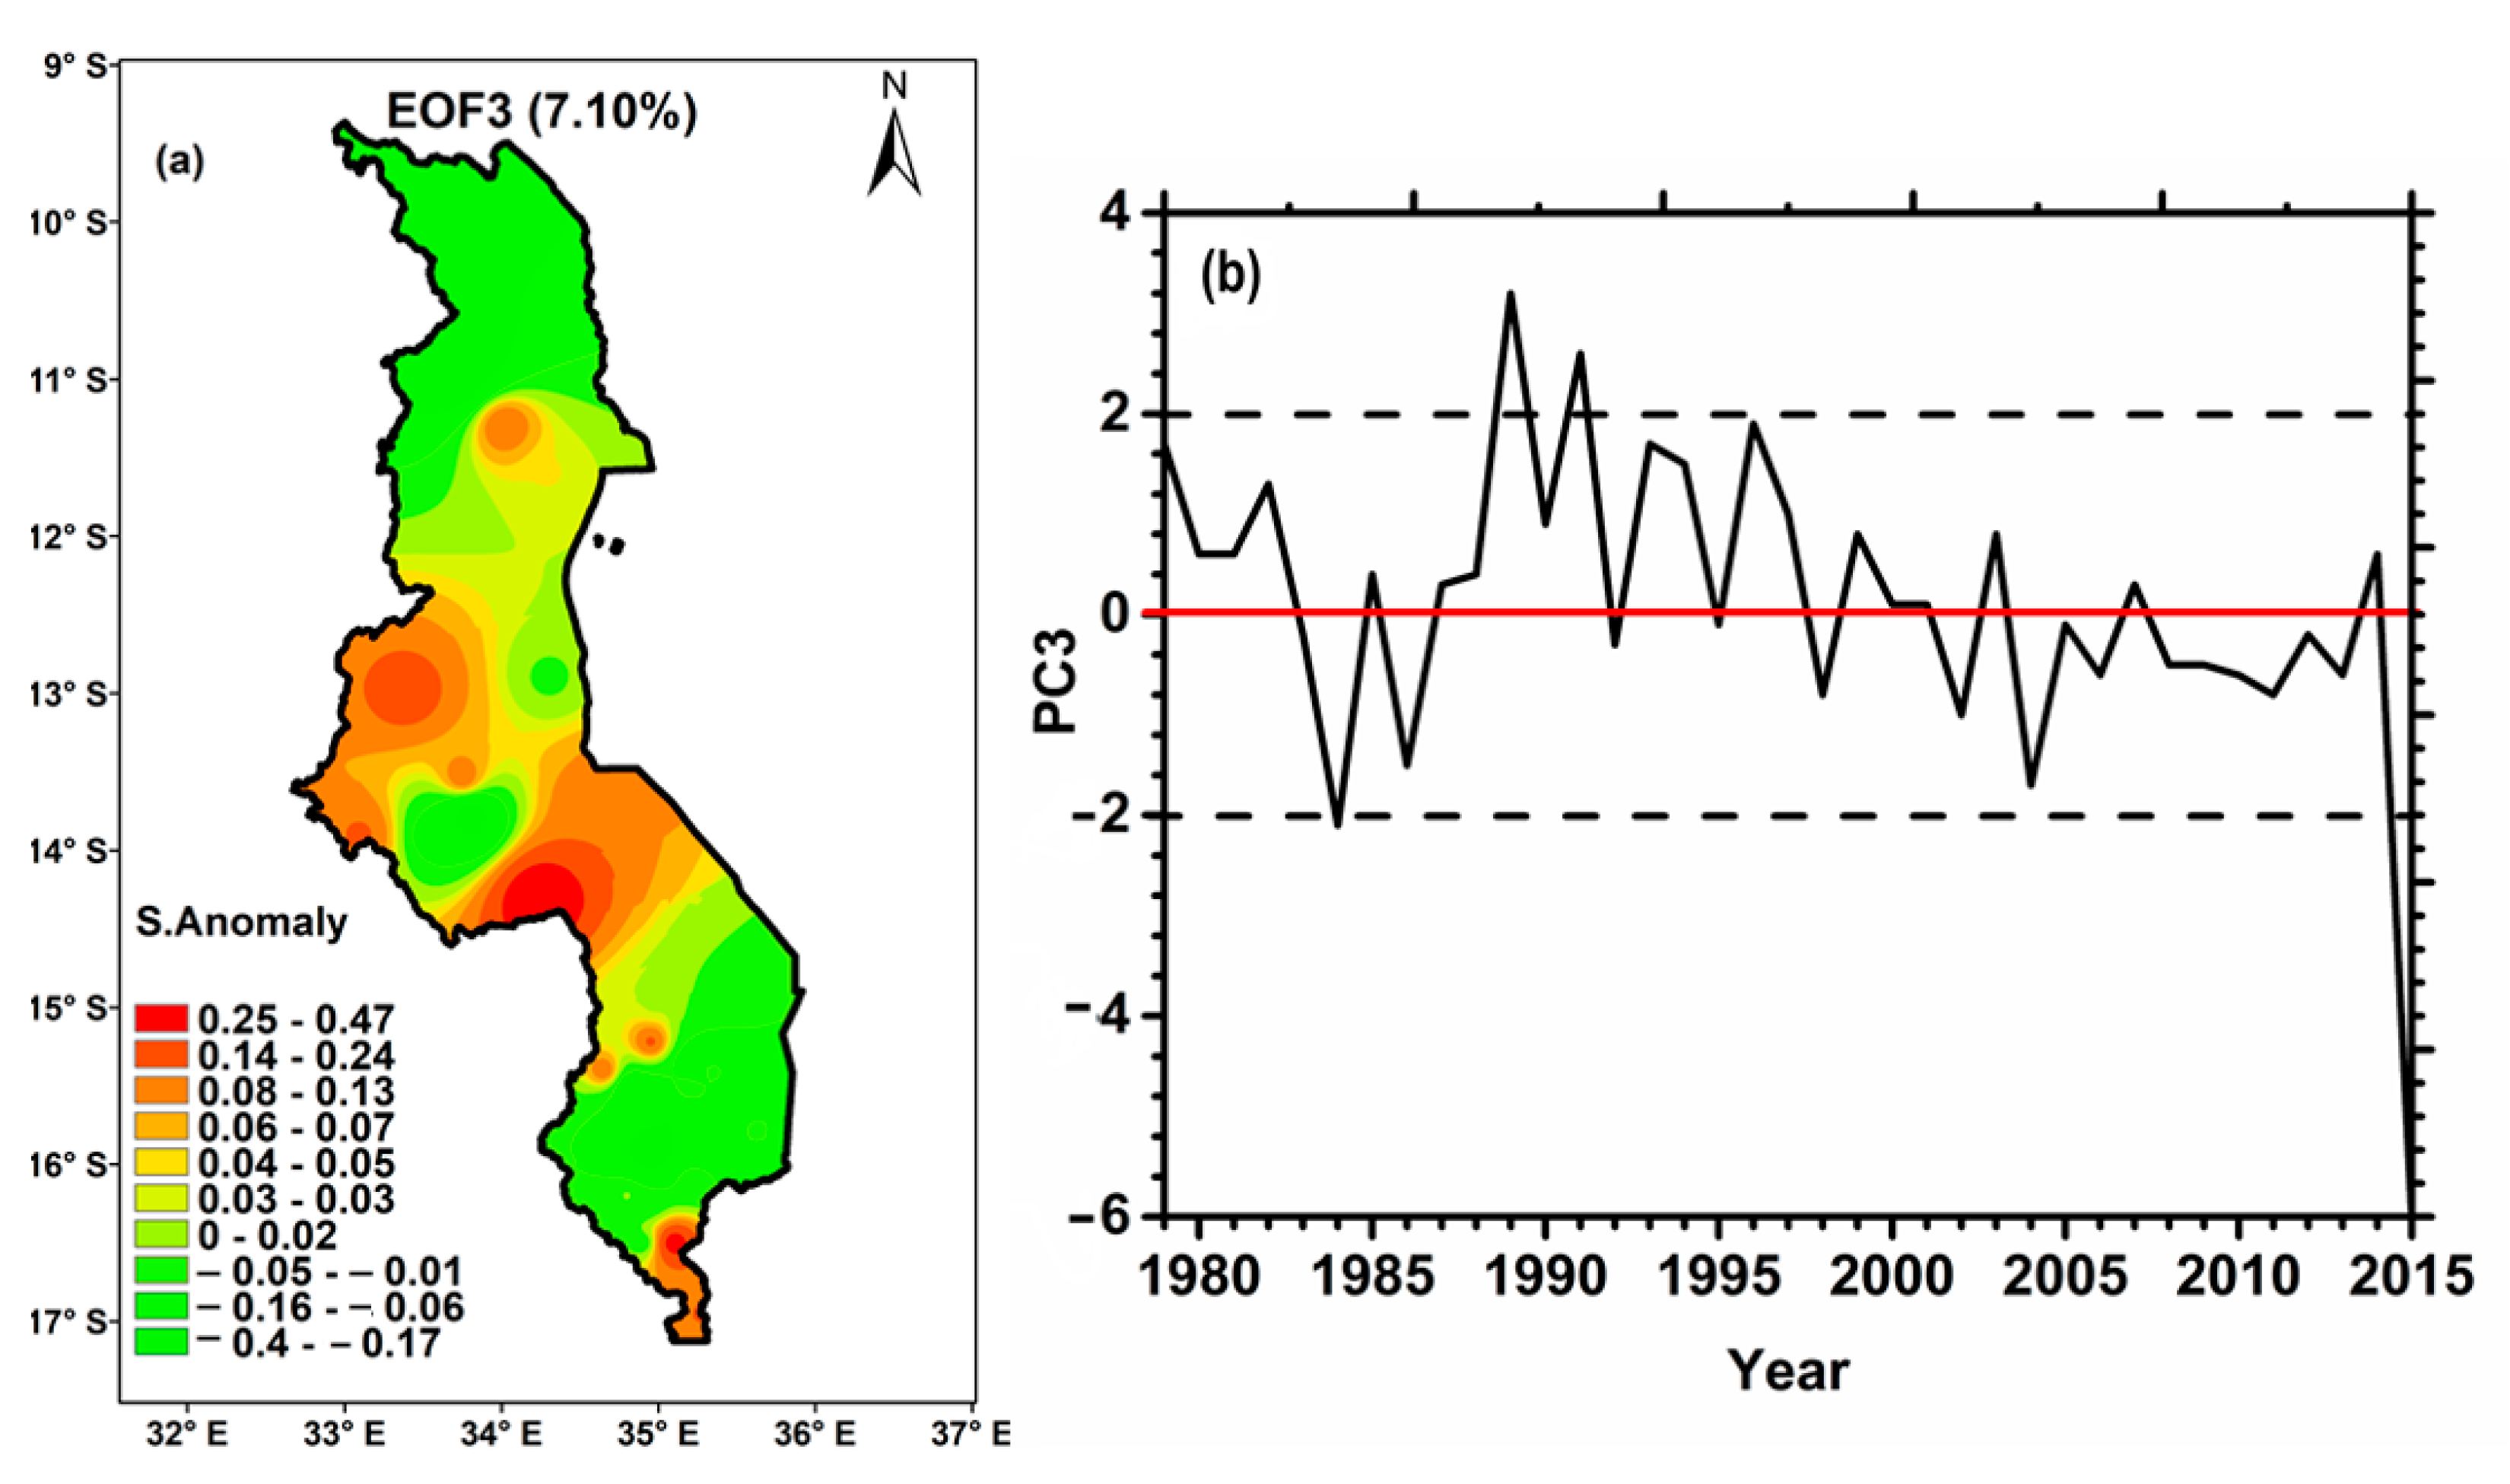
From the results in the previous sections, we can see that the period from November to April is the wet season in Malawi. Therefore, the EOF technique was utilized to examine the prevailing mode of spatial distribution of wet season (NDJFMA) precipitation over the study area in this section. The first three leading EOF modes are presented in Figure 4, Figure 5 and Figure 6 together with their related principal components (PCs). These three leading EOF modes reveal that the variances explaining the seasonal rainfall variability for the study period are 37.03%, 10.37%, and 7.10%, respectively. EOF 1 (Figure 4) displays positive anomalies over most parts of the study area, with the strongest variation over the southern region and a weaker variation over the northern region and the south of Lake Malawi. The second and third EOF modes are responsible for 17.41% of the overall variability during the wet season. Figure 5 displays generally north–south dipole of positive (negative) anomalies and EOF 3 (Figure 6) shows positive anomalies over the central areas and the most south part of the country. The PC time series from EOF 1 depicts 10 wet years with the amplitude greater than two standard deviations as 1985, 1986, 1989, 1996, 1997, 1999, 2001, 2006, 2007, and 2015. There are also 10 dry years following the amplitude of less than two standard deviations, which are 1981, 1983, 1987, 1990, 1992, 1994, 1995, 2005, 2011, and 2014.

3.3. Long-Term Monotonic Trends for Precipitation

3.3.1. Temporal Trends of Seasonal and Annual Precipitation

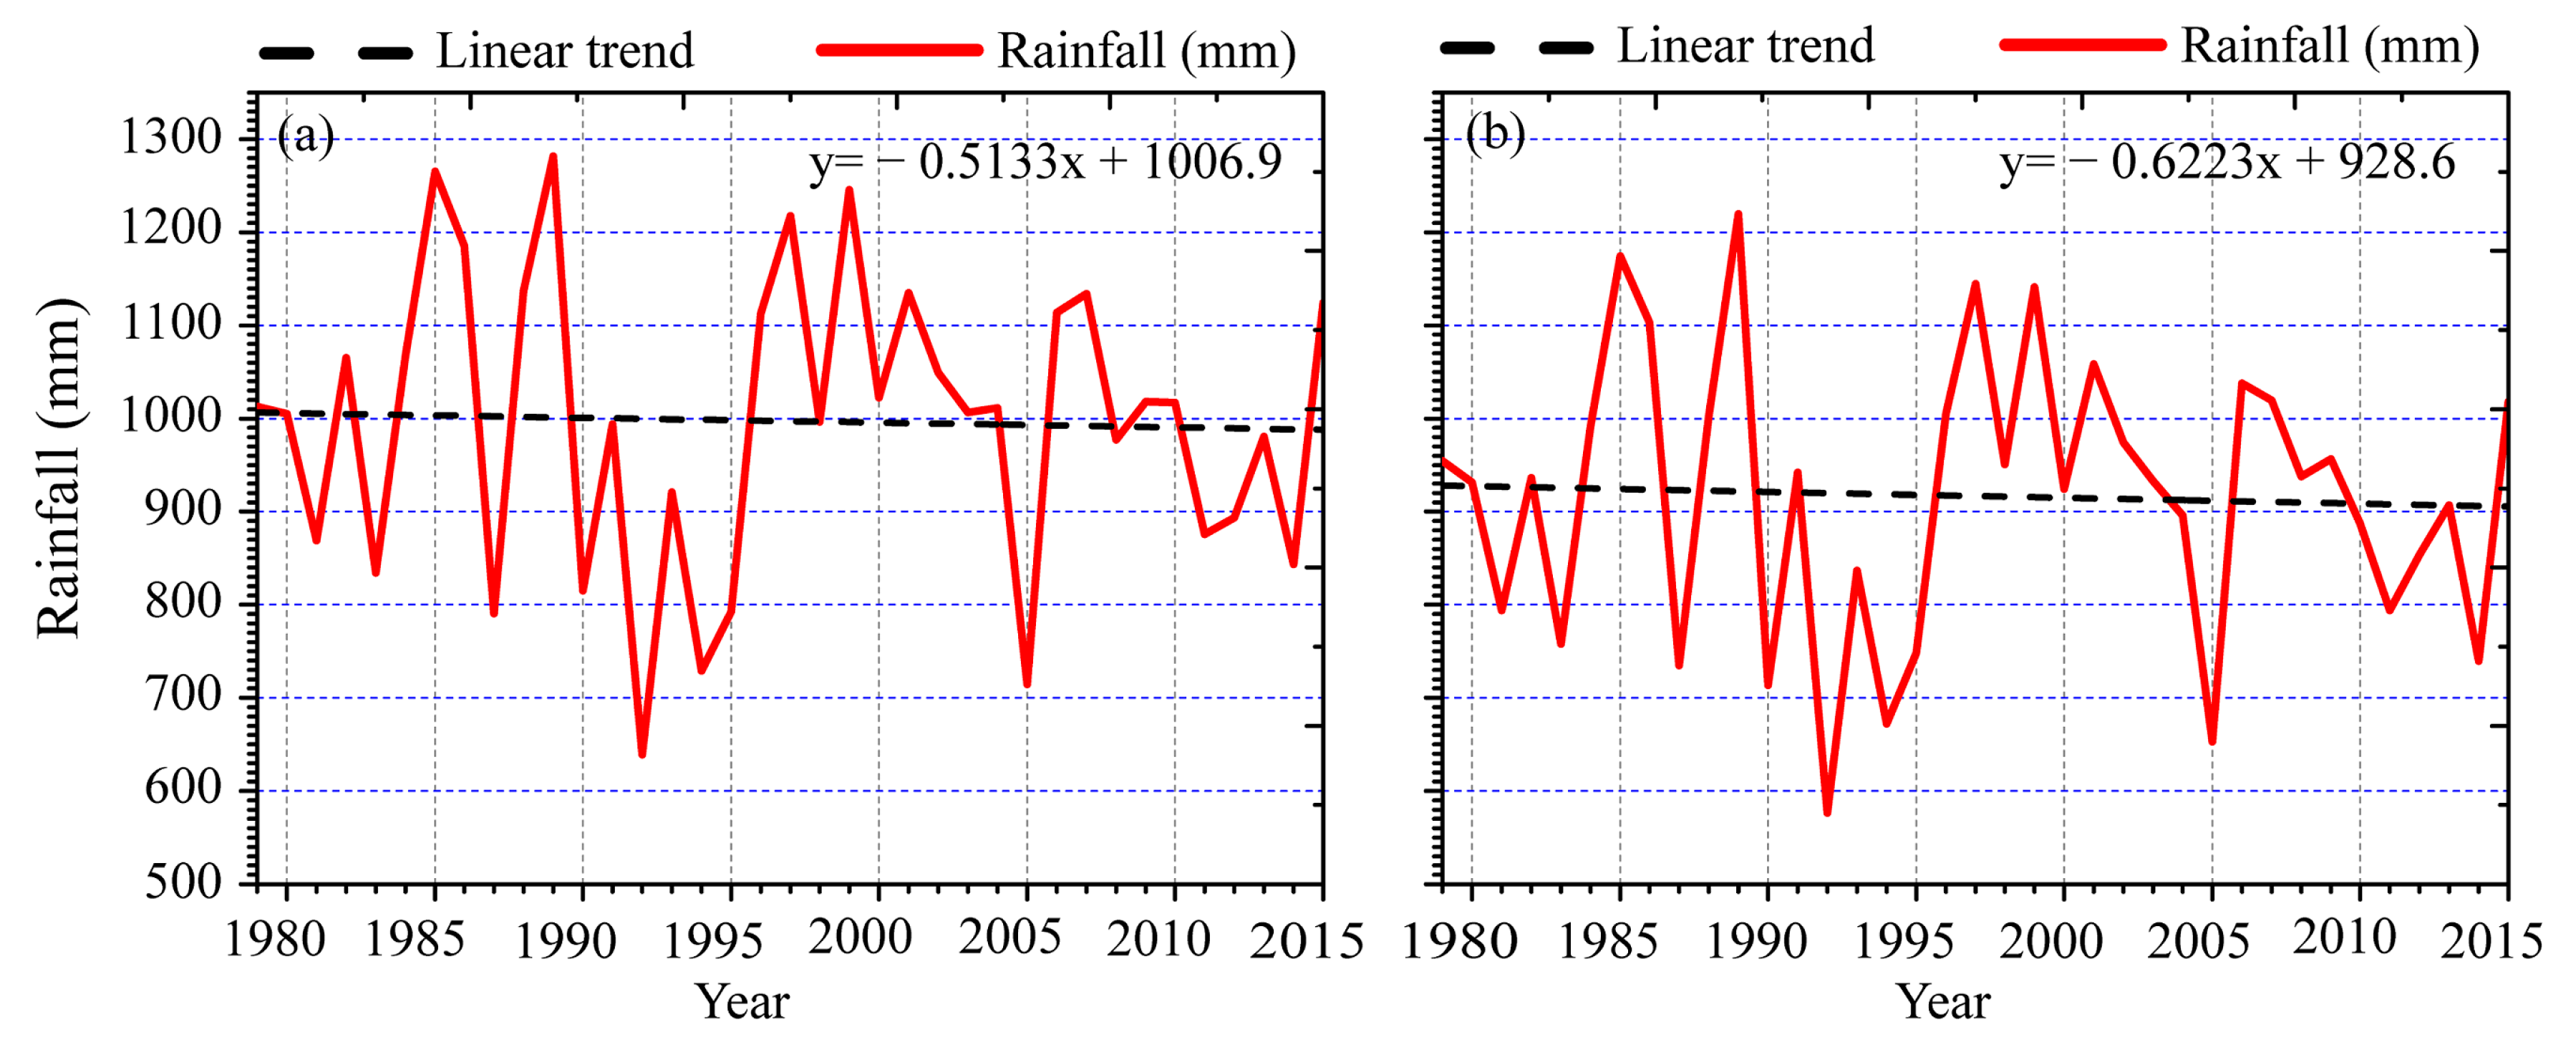
The results for temporal variations and trends of seasonal (from November to April) and annual precipitation over Malawi are presented in Figure 7. The time series of seasonal and annual results were obtained by averaging the rainfall at all 31 stations in a given year. The precipitation over Malawi is generally declining as revealed by a minor negative slope in both annual and seasonal precipitation over the 37 years. Throughout the study period, the year of 1989 recorded the maximum annual rainfall, with a mean value of about 1280 mm and the lowest amount of rainfall was received in 1992 with a mean value of only 640 mm.
Table 2 presents decadal mean annual and seasonal precipitations with trend per decade. The trends were calculated using the method of Theil–Sen Slope, which is described in Section 2.3.3. It can be clearly seen from the results that there were positive changes in the 1980s and 1990s followed by a negative change in the 2000s. During the first decade (1979–1988), the annual rainfall showed a positive tendency over the study area, with higher magnitude (155.6 mm·decade−1) as compared to the seasonal rainfall with 59.5 mm·decade−1. In contrast, a significant decline was witnessed in both annual and seasonal rainfall climatology during the decade of 1999–2008. The rates of changes during that decade for annual and seasonal rainfall were represented by −119.6 and −157.8 mm·decade−1, respectively. Furthermore, within the decade of 1999–2008, the year of 2005 witnessed the highest decline in rainfall. A study proposed by Libanda et al. [21] attributed this precipitation decline to the disappearance of the convergence of strong southeasterly and northeasterly winds at 850 hPa during dry years, which includes the year of 2005. With the absence of such wind convergence, the ascending motion is suppressed. Similarly, the decline of precipitation in 1992 was attributed to the divergences at 850 hPa in the study area and the west of the Indian Ocean. Furthermore, the dry spell in 1992 was associated with several episodes of tropical cyclones to the east of Madagascar, which resulted in moisture deficiency over the study area [44].
In previous studies, Kumbuyo et al. [19] stated that there is a robust interannual fluctuation of rainfall in Malawi, with attributions pointing to teleconnections and possible complex geomorphological features across the study location. One factor reported to account for the interannual rainfall fluctuation in Malawi and southern Africa in general is the anomalous changes of SST in the Indian Ocean [45]. For instance, an anomalous upsurge of the SST over the southwest Indian Ocean during the positive phase of the subtropical Indian Ocean Dipole is known to intensify the precipitation over southern Africa. In addition, many studies also agree that the El Niño (La Niña) phenomenon has a great effect on the interannual variability of precipitation across southern Africa, including the study area [15,42,46]. The El Niño (La Niña) basically weakens (enhances) rainfall over the southeastern region of Africa, thereby being responsible for dry (wet) conditions, while intensifying (weakening) the rainfall across the northeastern tropical region. In related studies over Kenya, Mumo et al. [27] reported a great impact of El Niño–Southern Oscillation on the interannual variability of precipitation during the boreal autumn. El Niño events are reported to have severe impacts in Malawi during some drought years. For example, during the 1992 El Niño year, Malawi only received 50% of its normal precipitation and agriculture production reduced by 50% such that food had to be imported in order to feed the starving population [18]. Recent work by Pinault [47] has detailed more information regarding ENSO phenomenology across the globe.

3.3.2. Spatial Variability of the Temporal Trends of Precipitation

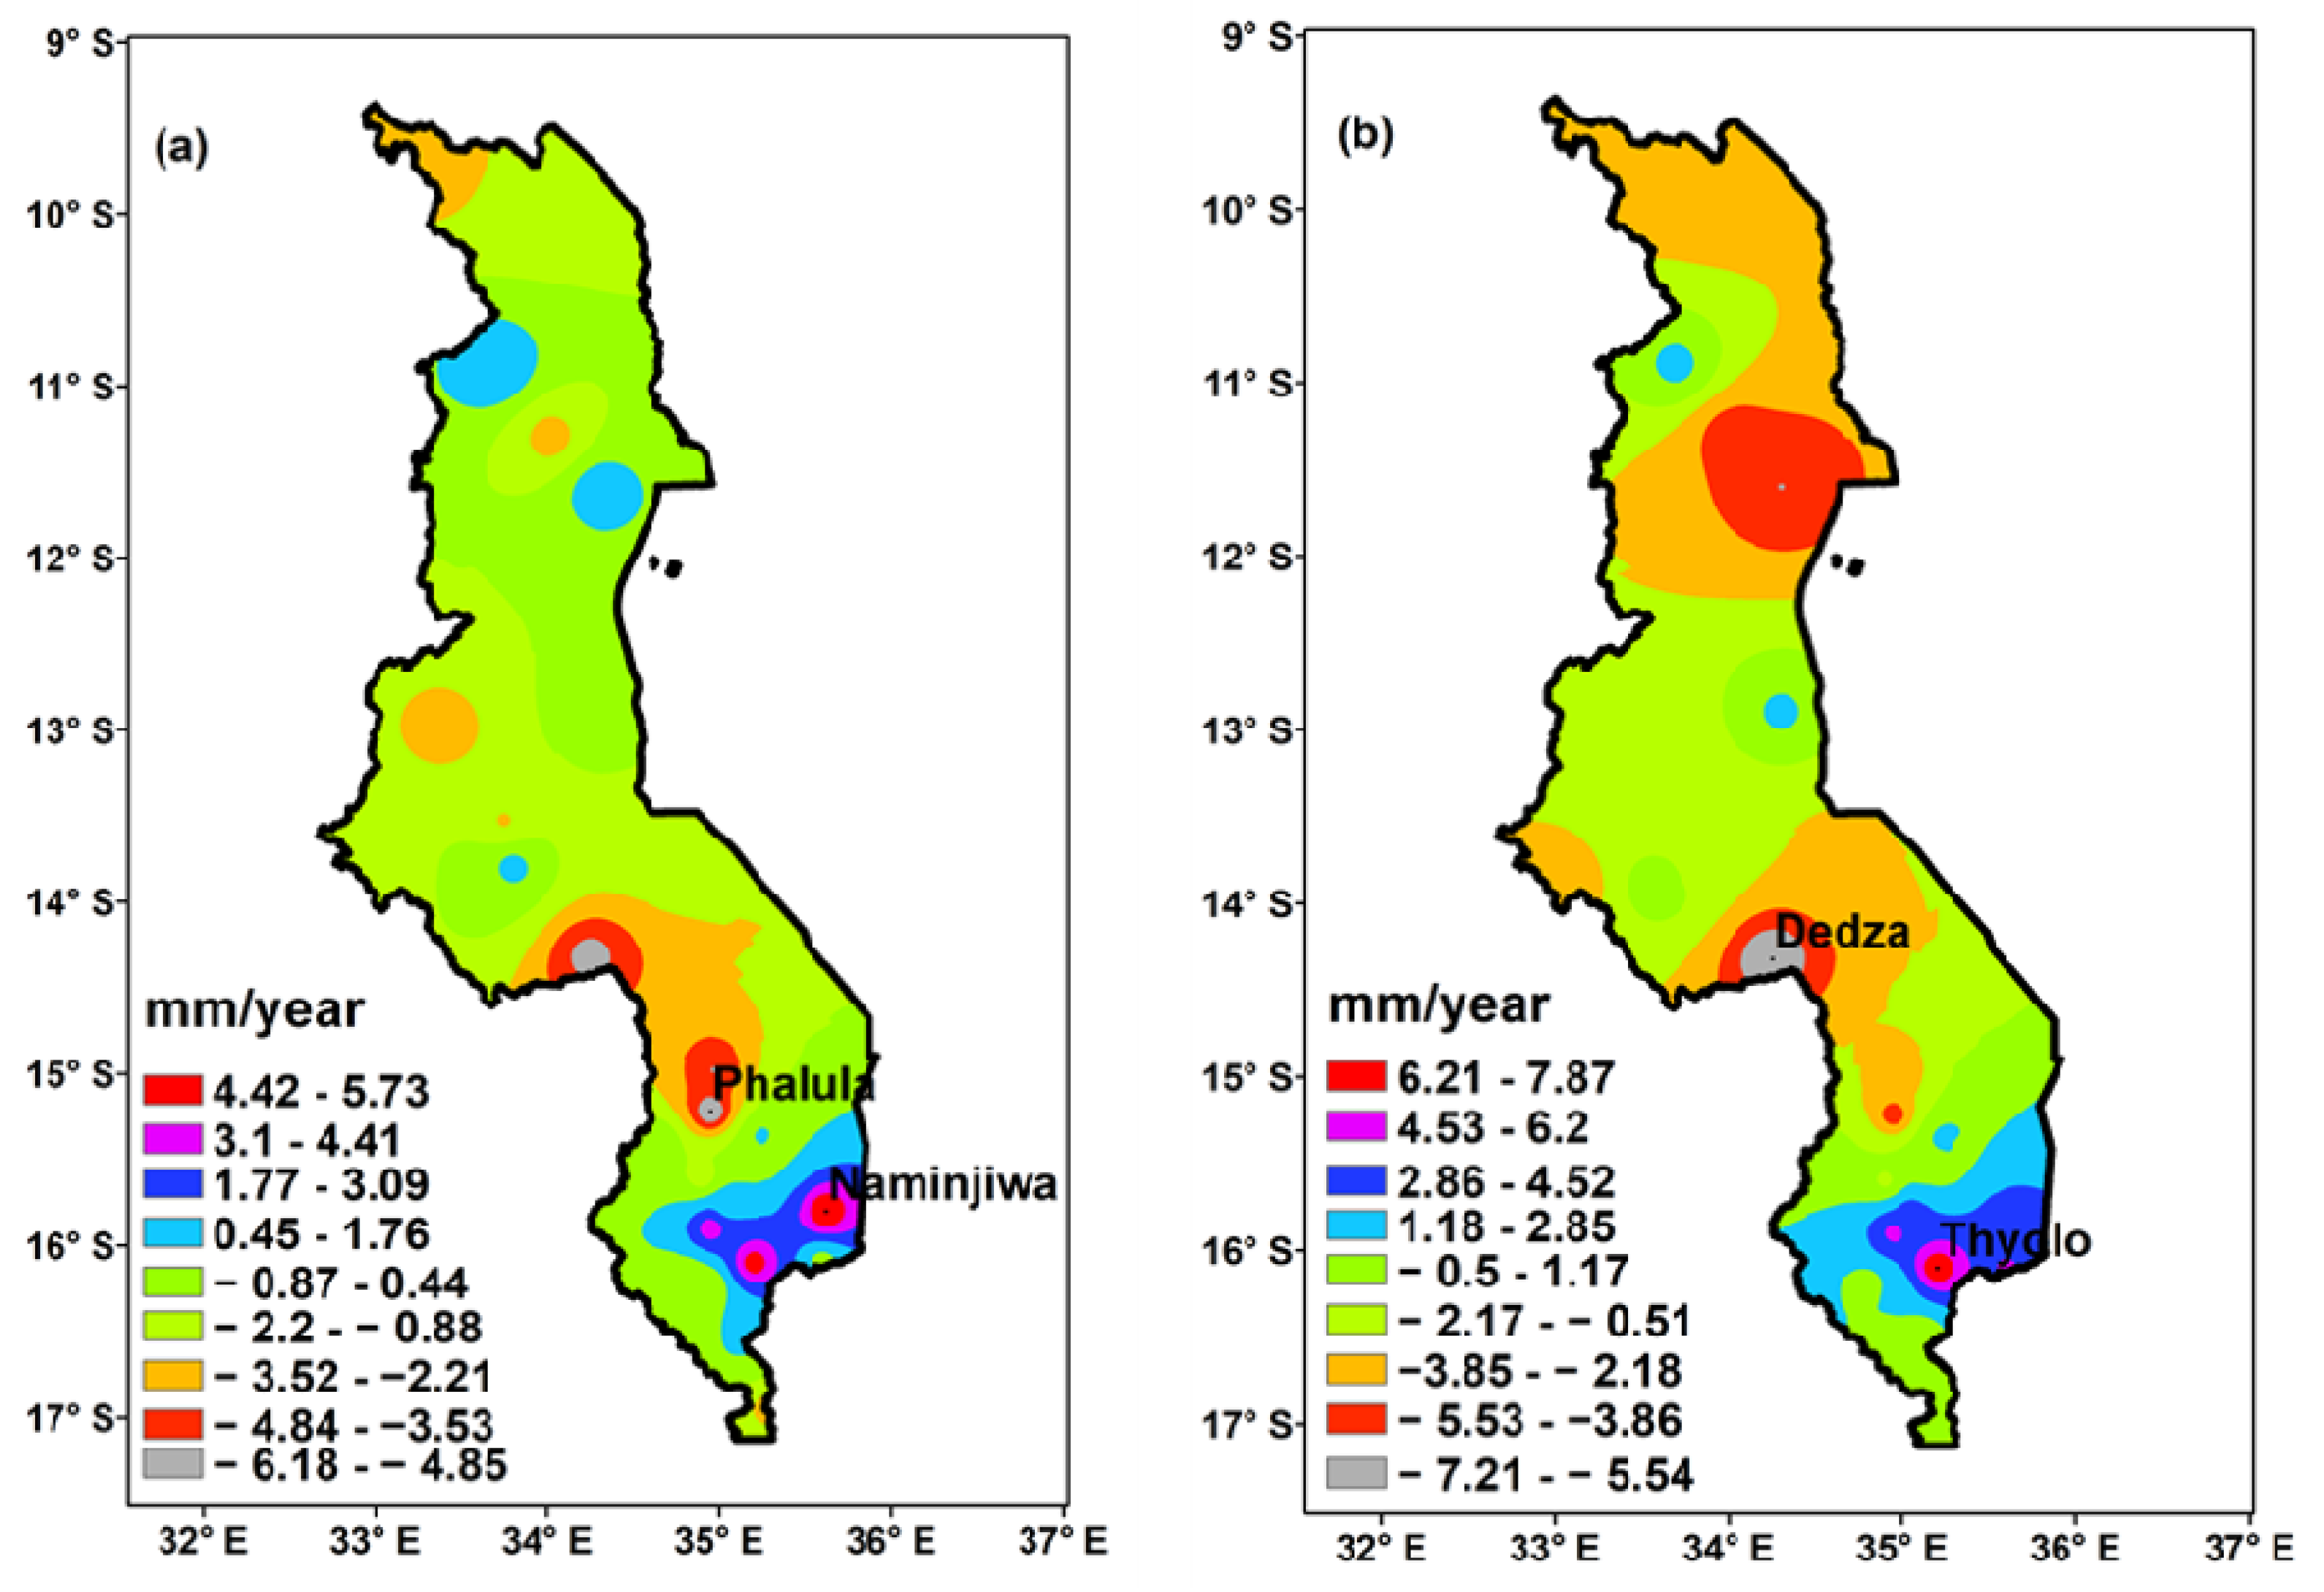
The annual and seasonal spatial distributions showing the results of the Sen Slope Estimator and MK trend tests are presented in Figure 8 and Figure 9, respectively.
From the Sen Slope Estimator, it is deduced that the magnitude of annual rainfall linear trend varies from −6.191 mm·year−1 at Phalula station to 5.736 mm·year−1 at Naminjiwa station (Figure 8a), while the magnitude of the trend for wet seasonal rainfall varies from −7.214 mm·year−1 at Dedza station to positive 7.89 mm·year−1 at Thyolo station (Figure 8b). It should be noted that on annual scale, all stations reporting the highest and lowest magnitudes in the linear trends are from the southern part of Malawi. This observation in particular agrees with findings in Ngongondo et al. [20]. It revealed that the pattern of variability is clearer in the northern and central part than that of the southern part of the country. The northern portion of Malawi is in the vicinity of the transition zone of ENSO. Hence, the difference in the variability with the southern portion could be attributed to the intersection of climate characteristics in both southern Africa and eastern Africa, and the dominance of the ITCZ over the northern part at the cessation of the rainfall season during March and April as well.
It is worth noting that the MK test results display a statistically insignificant decreasing pattern on rainfall for 17 out of the 31 stations examined on the annual scale (Figure 9). The other 13 stations indicate an insignificant positive trend, and most importantly, one station in the southern area of Malawi (Naminjiwa) indicates a substantial intensifying trend. However, the slope of the increasing rainfall trend at Naminjiwa station is generally fair as indicated by the magnitude of 5.736 mm·year−1. The results of the MK test for wet season reveal that the same amount of stations as in the annual rainfall either has an insignificant negative trend or an insignificant positive trend, but the spatial variability of the trends is not entirely the same as that of the annual rainfall. Despite that, Dedza station in the central region of Malawi displays a statistically significant trend at the 95% confidence level, with a magnitude of −7.214 mm·year−1. The significant trend test for annual and seasonal rainfall tendencies based on the non-parametric MK technique at the 95% confidence level is summarized in Table 3. The results reveal insignificant decreasing trends for both annual (S = −30.000) and wet seasonal rainfalls (S = −60.000) throughout the study period. If this pattern persists in the future, it is likely to affect farmers and the overall economic performance over the study domain that continues to depend on the climatic variables for survival. This calls for appropriate adaptive measures in a bid to organize for any future evolutions and impacts in the era of changing climate.

3.3.3. Sequential MK Test Results

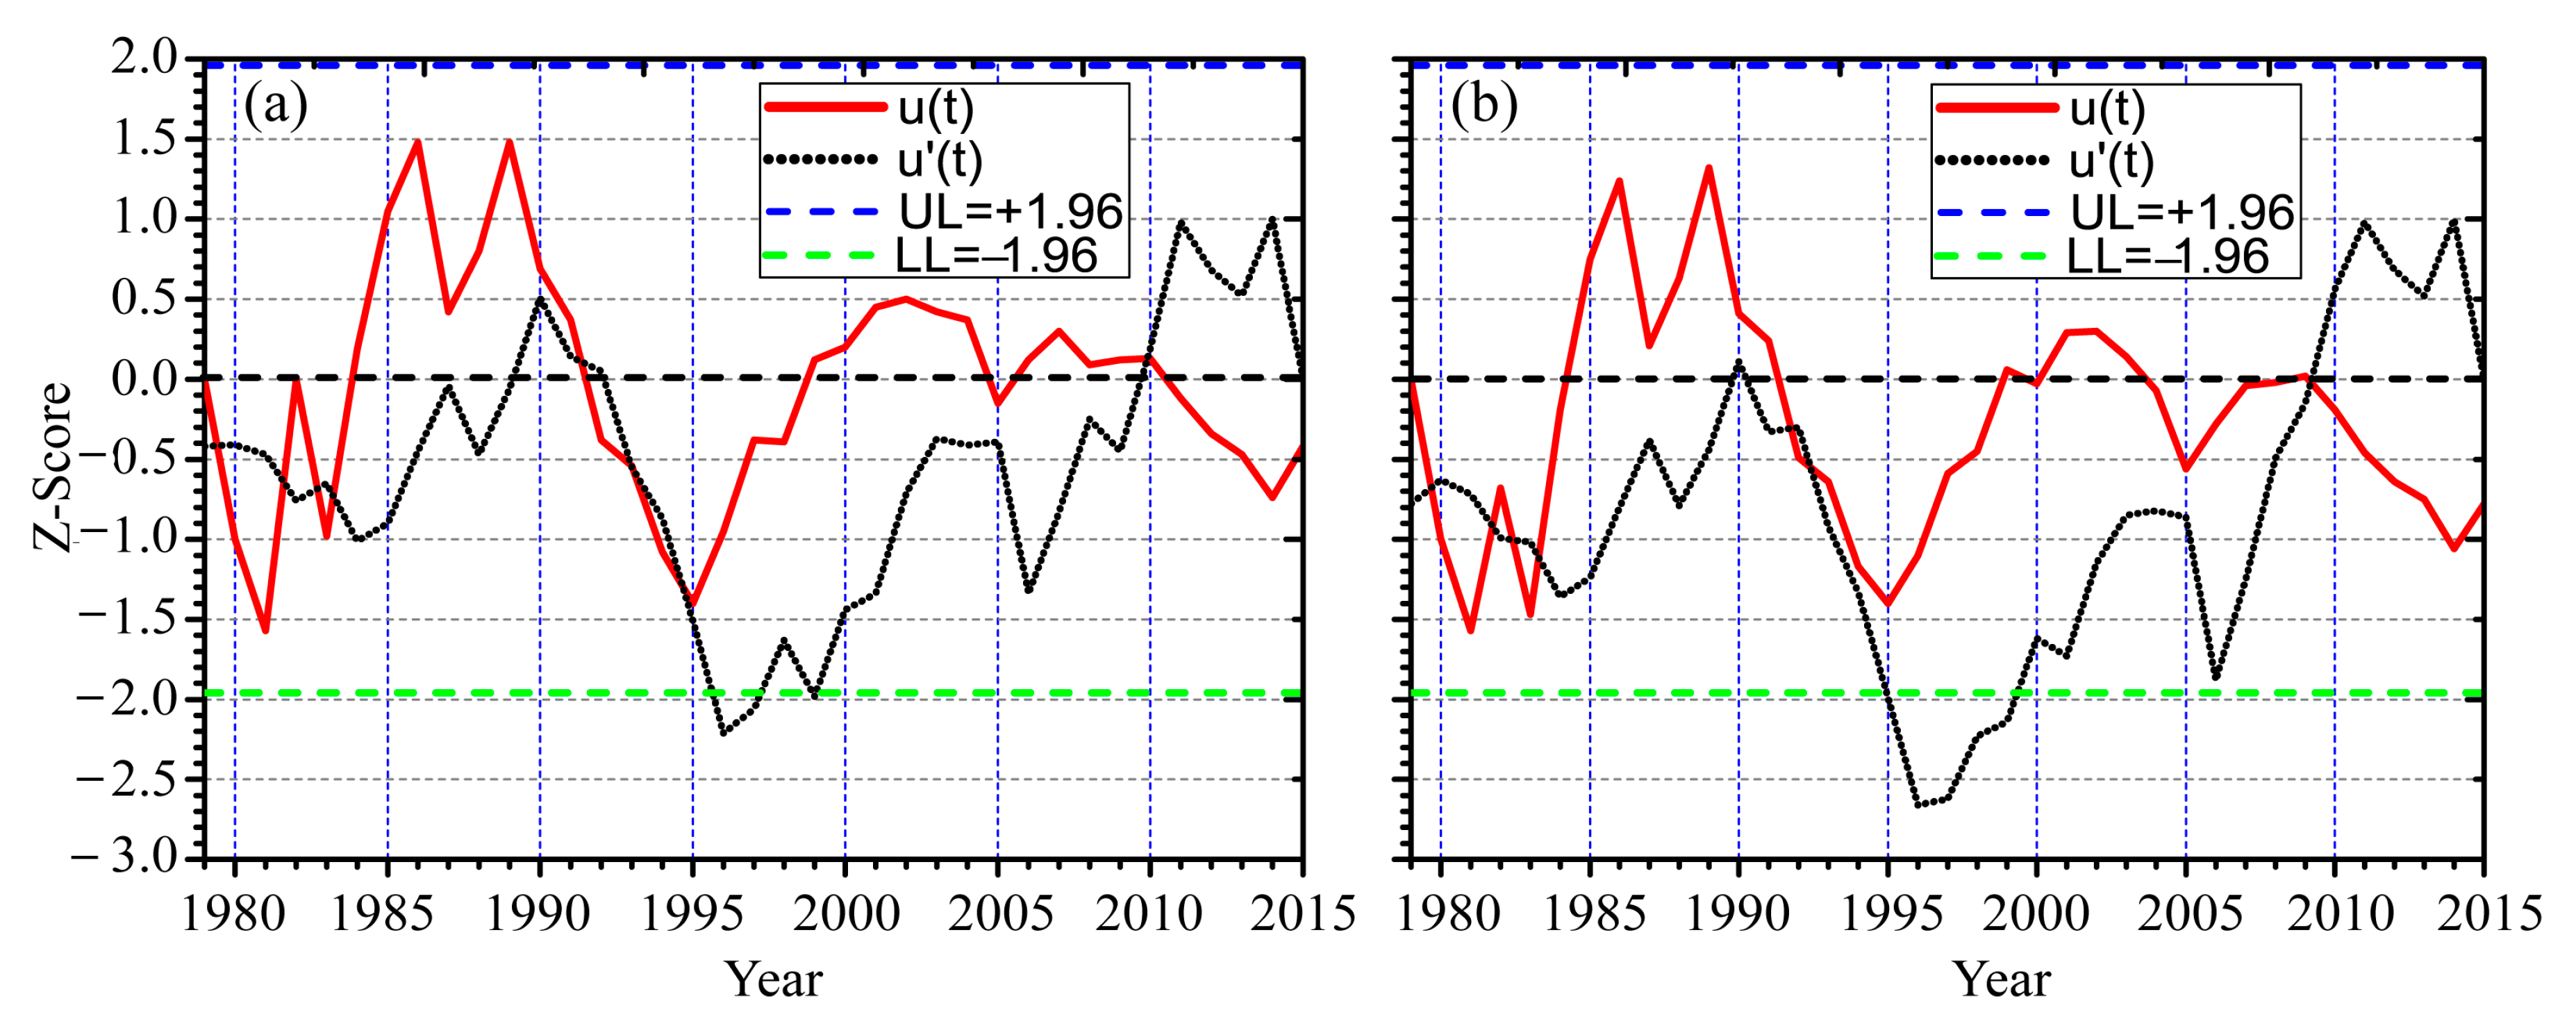
The Sequential Mann–Kendall (SQMK) test was applied in this study to detect unforeseen changes in precipitation trends over Malawi. A rapid change is said to occur when the intersection of the progressive curve u(t) and retrogressive curve u(t′) arises above the confident level, which is manifested by the dashed lines corresponding to ±1.96 at the 95% confidence level [27,38].
As highlighted in Figure 10 for both annual and wet seasonal precipitations, there was a slight decrease in rainfall at the beginning of the study period (1979) followed by a slightly erratic trend as the forward curve intersected with the backward curve four times between 1979 and 1983. A sharp increase in rainfall was observed after 1983, with the highest occurrence in 1989 followed by a period of major decay until 1995, which was agreed with the observations reported by Libanda et al. [21]. This was eventually succeeded by a period of major increase in rainfall until the year of 2002, which was followed by a moderate decrease throughout the study period, with the largest decrease occurring in 2005 and 2014 in the 21st century and a major change signified in 2009 as evidenced by the intersection of the backward and forward curves. However, there were no abrupt changes in both the annual and seasonal time series as all intersections were below the confidence level, and the intersection years include 1979, 1982, 1983, 1992, and 2009.
These findings are consistent with earlier findings proposed by different research works in the region. For instance, Jury and Mwafulirwa [18] reported that the wet seasons in 1983, 1992, and 1995 were among the driest seasons in the study area. On a regional level, Washington et al. [48] reported major flooding episodes in southern Africa in 2000 and 2001, citing the devastation in Mozambique as the evidence of increase in precipitation during the period.

3.4. Wavelet Analysis of Rainfall Changes

As a cross-validation, characteristics of rainfall cycle and possible periodicity over the study area are further analyzed by using the continuous Morlet wavelet analysis. The Morlet wavelet has been utilized due to its localization in time and frequency, which makes it a convenient tool in extracting features [49,50].
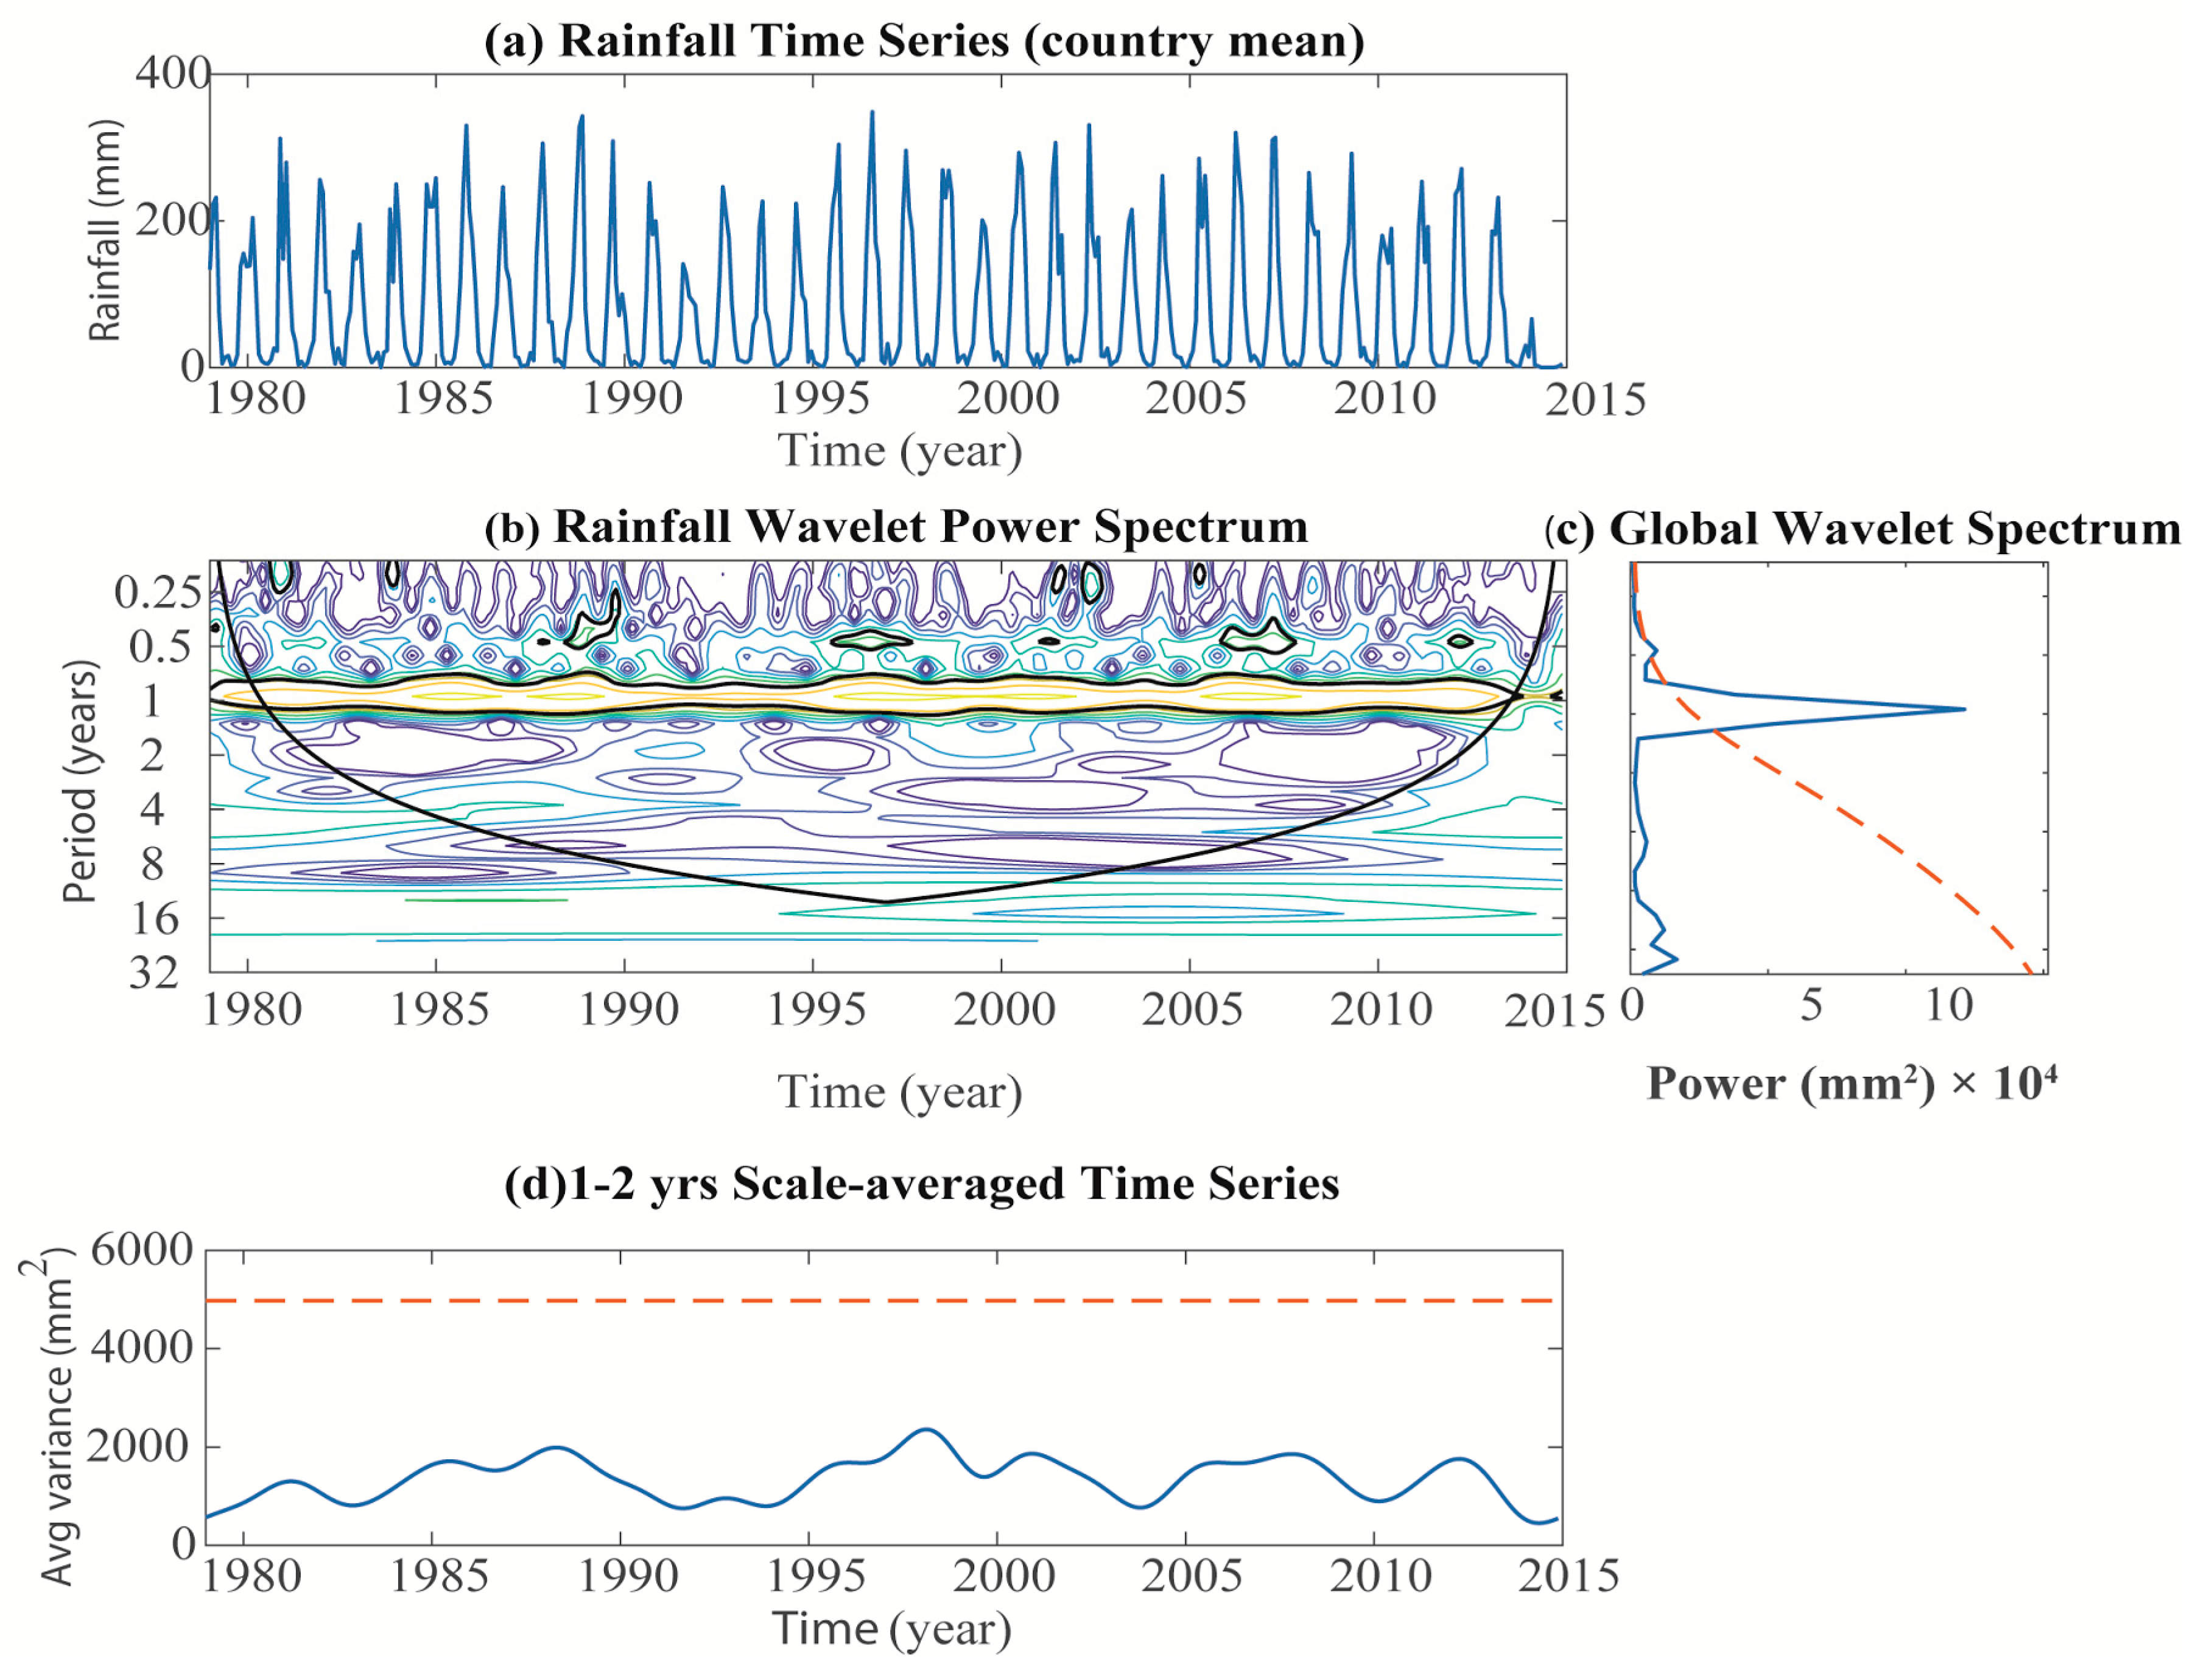
Time series of monthly rainfall is shown in Figure 11a, and the corresponding wavelet power spectrum (WPS) of monthly rainfall is also depicted in Figure 11b. The black contour lines in the WPS denote regions greater than the 95% confidence level with respect to the red noise background spectrum. The solid curve demarcates the “cone of influence” where edge effects are accounted for. Hence, the results in this region should be treated with caution as they may be less accurate. It is of particular interest to note that Figure 11b reveals a 1-year band as a dominant period of variability typical with annual mean precipitation. This is consistent with the results of Section 3.2.1. The 1-year band runs from the beginning of the time series to approximately 2014, which is near the end of the time series (1979–2015). It is also worth noting that the power spectrum near a 0.25–0.5-year cycle exhibits several instances of major periodicity enclosed by the contours greater than the 95% confidence level. The years when the signals are evidently localized are primarily known to be wet years in Malawi which include 1982, 1985, 1989, 1996–1997, 2001–2002, 2006–2007, and 2013. To some extent, the result of wet years agrees with that of EOF analysis showed in Section 3.2.2. The EOF analysis revealed ten wet years are the year of 1985, 1986, 1989, 1996, 1997, 1999, 2001, 2006, 2007, and 2015. The annual periodicity on the global wavelet spectrum is shown in Figure 11c, which reveals one significant peak above the 95% confidence level. The highlighted part in Figure 11d is the average of the wavelet power over the scales between 1- and 2-year bands. This gives a measure of the average variance versus time, which shows distinct periods when the monthly variance is high or low in the study area.

4. Discussion and Conclusions

After robust homogeneity tests, this study, for the first time, utilized recent rain ground gauge measurements from 31 stations, which included some key stations from southeast of Malawi, to characterize the spatio-temporal variability and periodicity of precipitation over Malawi during 1979–2015.
Spatial distribution of annual mean precipitation showed that high amounts of rainfall are located in areas along the lake and the southeast part of Malawi. In general, the eastern part receives more rainfall than the western part of the country. This spatial pattern of rainfall may be attributed to the high topographical diversity of the study area.
Following the analysis of annual mean rainfall cycle, the results demonstrated that the highest and the lowest amount of rainfall was observed in January and September, respectively. We adopted November–April as the wet (rainfall) season for Malawi when most crop cultivation occurs and May–October as the dry season.
The spatial distribution of wet season precipitation from EOF analysis revealed ten wet years (1985, 1986, 1989, 1996, 1997, 1999, 2001, 2006, 2007, and 2015) and ten dry years (1981, 1983, 1987, 1990, 1992, 1994, 1995, 2005, 2011, and 2014). Most of the wet years, such as the years 1985, 1989, 1996, 1997, 2001, 2006, and 2007 were also validated in the wavelet analysis in the power spectrum near 0.25–0.5-year cycles.
The temporal trends of rainfall displayed a slight negative slope in both the wet season and annual scale during the 37 years. Trends of precipitation per decade revealed an increase in rainfall during the 1980s and 1990s, followed by a general decline during the 21st century. From the results of spatial variability of the temporal trends of rainfall, northern and central Malawi displayed a clearer variability than southern Malawi, since stations reported that the highest and lowest magnitudes of linear trends on annual scale were all from the southern region of the study area. Through non-parametric MK trend analysis, statistically insignificant decreasing trends were detected on both the annual (S = −30.000) and wet season (S = −60.000) scale at 95% confidence level. It is apparent that the decrease in rainfall in Malawi during this study period is not at an alarming rate but requires closer monitoring to verify if the trends will be subjected to significant variations in the near future.
The results in this study are contributory to the in-depth understanding of the spatio-temporal characteristics and periodicity of precipitation in a data scarce region. We recommend and are trying further investigations of the mechanisms that influence the spatio-temporal trends and periodicity of rainfall in Malawi. This information may be helpful in policy making for agriculture sectors and also monitoring of climate change impacts in the study area.
In light of the results and observations of this study, we suggest the government and stakeholders should formulate and adopt policies that can ensure sustainability of agriculture activities in a region where rainfall is decreasing. The meteorological department should ensure to make timely forecasts of rainy season precipitation. From onset to the cessation of wet season, timely short-term weather forecasts should be well disseminated to local users, especially farmers, so that they can plan well in choice of variety of crops and best farming methods. The meteorological services may also cooperate with the agricultural department for effective early warning services.

Author Contributions

Conceptualization, E.T. and D.C. Investigation and methodology, E.T. and B.A. Formal analysis, software, and visualization, E.T. Writing—original draft preparation, E.T. Writing—review and editing, D.C. and C.Y. Supervision, D.C. All authors discussed the results and commented on the paper and figures. All authors have read and agreed to the published version of the manuscript.

Funding

This work was jointly supported by grants from the National Key Research and Development Program of China (2019YFC1510004).

Acknowledgments

The first author expresses appreciation to the World Meteorological Organization (WMO) for financial support during the study at Nanjing University of Information Science and Technology (NUIST). Special thanks to Malawi Department of Climate Change and Meteorological Services for providing the station data utilized in this research. Finally, the authors are grateful to NUIST College of International students (CIS) for setting up excellent atmosphere and resources to conduct the study.

Conflicts of Interest

The authors declare no conflict of interest.

References

  1. FAO. Malawi: Country Indicators. 2017. Available online: http://www.fao.org/faostat/en/#country/130 (accessed on 3 September 2019).
  2. Alemu, M.M.; Bawoke, G.T. Analysis of spatial variability and temporal trends of rainfall in Amhara region, Ethiopia. J. Water Clim. Chang. 2019, 10. [Google Scholar] [CrossRef]
  3. Ayugi, B.O.; Tan, G.; Ongoma, V.; Mafuru, K.B. Circulations Associated with Variations in BorealSpring Rainfall over Kenya. Earth Syst. Environ. 2018, 2, 421–434. [Google Scholar] [CrossRef]
  4. IPCC. 2014: Climate Change 2014: Synthesis Report. Contribution of Working Groups I, II and III to the Fifth Assessment Report of the Intergovernmental Panel on Climate Change; Core Writing Team, Pachauri, R.K., Meyer, L.A., Eds.; IPCC: Geneva, Switzerland, 2015; p. 151. [Google Scholar]
  5. IPCC. Climate Change 2007: The Physical Science Basis. In Contribution of Working Group I to the Fourth Assessment Report of the Intergovernmental Panel on Climate Change; Solomon, S., Qin, D., Manning, M., Chen, Z., Marquis, M., Averyt, K.B., Tignor, M., Miller, H.L., Eds.; Cambridge University Press: Cambridge, UK; New York, NY, USA, 2007; p. 1007. [Google Scholar]
  6. Ullah, S.; You, Q.; Ullah, W.; Ali, A. Observed changes in precipitation in China- Pakistan economic corridor during 1980–2016. Atmos. Res. 2018, 210, 1–14. [Google Scholar] [CrossRef]
  7. Alexander, L.V.; Zhang, X.; Peterson, T.C.; Caesar, J.; Gleason, B.; Klein Tank, A.M.G.; Haylock, M.; Collins, D.; Trewin, B.; Rahimzadeh, F.; et al. Global observed changes in daily climate extremes of temperature and precipitation. J. Geophys. Res. Atmos. 2006, 111, 1–22. [Google Scholar] [CrossRef] [Green Version]
  8. IPCC. 2012: Managing the Risks of Extreme Events and Disasters to Advance Climate Change Adaptation; A Special Report of Working Groups I and II of the Intergovernmental Panel on Climate Change; Field, C.B., Barros, V., Stocker, T.F., Qin, D., Dokken, D.J., Ebi, K.L., Mastrandrea, M.D., Mach, K.J., Plattner, G.-K., Allen, S.K., et al., Eds.; Cambridge University Press: Cambridge, UK; New York, NY, USA, 2012; p. 582. [Google Scholar]
  9. Ongoma, V.; Chen, H.; Omony, G.W. Variability of extreme weather events over the equatorial East Africa, a case study of rainfall in Kenya and Uganda. Theor. Appl. Climatol. 2018, 131, 295–308. [Google Scholar] [CrossRef]
  10. Alexander, L.V. Global observed long-term changes in temperature and precipitation extremes: A review of progress and limitations in IPCC assessments and beyond. Weather Clim. Extrem. 2016, 11, 4–16. [Google Scholar] [CrossRef] [Green Version]
  11. Climate Communication. Current Extreme Weather and Climate Change. 2011, pp. 1–28. Available online: https://www.climatecommunication.org/new/features/extreme-weather/download-full-pdf/ (accessed on 21 August 2020).
  12. Trenberth, K.E. Changes in precipitation with climate change. Clim. Res. 2011, 47, 123–138. [Google Scholar] [CrossRef] [Green Version]
  13. Mumo, L.; Yu, J.; Ayugi, B. Evaluation of spatiotemporal variability of rainfall over Kenya from 1979 to 2017. J. Atmos. Sol. Terr. Phys. 2019, 194, 105097. [Google Scholar] [CrossRef]
  14. Warnatzsch, E.A.; Reay, D.S. Temperature and precipitation change in Malawi: Evaluation of CORDEX-Africa climate simulations for climate change impact assessments and adaptation planning. Sci. Total Environ. 2019, 654, 378–392. [Google Scholar] [CrossRef]
  15. Haghtalab, N.; Moore, N.; Ngongondo, C. Spatio-temporal analysis of rainfall variability and seasonality in Malawi. Reg. Environ. Chang. 2019, 19, 2041–2054. [Google Scholar] [CrossRef]
  16. Pauw, K.; Thurlow, J.; van Seventer, D. Droughts and Floods in Malawi: Assessing the Economywide Effects. IFPRI Discuss. 2010, 00962. Available online: http://www.ifpri.org/publication/droughts-and-floods-malawi (accessed on 21 August 2020).
  17. Ongoma, V.; Chen, H. Temporal and spatial variability of temperature and precipitation over East Africa from 1951 to 2010. Meteor. Atmos. Phys. 2017, 129, 131–144. [Google Scholar] [CrossRef]
  18. Jury, M.R.; Mwafulirwa, N.D. Climate variability in Malawi part 1: Dry summers, statistical associations and predictability. Int. J. Climatol. 2002, 22, 1289–1302. [Google Scholar] [CrossRef]
  19. Kumbuyo, C.P.; Shimizu, K.; Yasuda, H.; Kitamura, Y. Linkage between Malawi Rainfall and Global Sea Surface Temperature. J. Rainwater Catchment Syst. 2015, 20, 7–13. [Google Scholar] [CrossRef] [Green Version]
  20. Ngongondo, C.; Xu, C.-Y.; Gottschalk, L.; Alemaw, B. Evaluation of spatial and temporal characteristics of rainfall in Malawi: A case of data scarce region. Theor. Appl. Climatol. 2011, 106, 79–93. [Google Scholar] [CrossRef] [Green Version]
  21. Libanda, B.; Zheng, M.; Banda, N. Variability of extreme wet events over Malawi. Geogr. Pannonica. 2017, 214, 21–223. [Google Scholar] [CrossRef]
  22. Ayugi, B.O.; Wang, W.; Chepkemoi, D. Analysis of Spatial and Temporal Patterns of Rainfall Variations over Kenya. Environ. Earth Sci. 2016, 6, 69–83. [Google Scholar]
  23. Camberlin, P.; Okoola, R.E. The onset and cessation of the ‘long rains’ in eastern Africa and their interannual variability. Theor. Appl. Climatol. 2003, 75, 43–54. [Google Scholar] [CrossRef]
  24. Pettitt, A.N. A Non-Parametric Approach to the Change-Point Problem. Appl. Stat. 1979, 28, 126. [Google Scholar] [CrossRef]
  25. Alexandersson, H. A homogeneity test applied to precipitation data. J. Climatol. 1986, 6, 661–675. [Google Scholar] [CrossRef]
  26. Mallakpour, I.; Villarini, G. A simulation study to examine the sensitivity of the Pettitt test to detect abrupt changes in mean. Hydrol. Sci. J. 2016, 61, 245–254. [Google Scholar] [CrossRef] [Green Version]
  27. Mumo, L.; Yu, J.; Fang, K. Assessing Impacts of Seasonal Climate Variability on Maize Yield in Kenya. Int. J. Plant Prod. 2018, 12, 1–11. [Google Scholar] [CrossRef]
  28. Lorenz, E.N. Empirical Orthogonal Functions and Statistical Weather Prediction. Tech. Rep. Stat. Forecast Proj. Rep. 1 Dep. Meteorol. MIT 1956, 49, 52. [Google Scholar]
  29. Hannachi, A.; Jolliffe, I.T.; Stephenson, D.B. Empirical orthogonal functions and related techniques in atmospheric science: A review. Int. J. Climatol. 2007, 27, 1119–1152. [Google Scholar] [CrossRef]
  30. Smith, K.A.; Semazzi, F.H.M. The Role of the Dominant Modes of Precipitation Variability over Eastern Africa in Modulating the Hydrology of Lake Victoria. Adv. Meteorol. 2014, 2014. [Google Scholar] [CrossRef] [Green Version]
  31. Makkonen, L. Plotting positions in extreme value analysis. J. Clim. Appl. Meteorol. 2006, 45, 334–340. [Google Scholar] [CrossRef]
  32. Sen, P.K. Estimates of the Regression Coefficient Based on Kendall’s Tau. J. Am. Stat. Assoc. 1968, 324, 1379–1389. [Google Scholar] [CrossRef]
  33. Wang, G.; Gong, T.; Lu, J.; Lou, D.; Hagan, D.F.T.; Chen, T. On the long-term changes of drought over China (1948-2012) from different methods of potential evapotranspiration estimations. Int. J. Climatol. 2018, 38, 2954–2966. [Google Scholar] [CrossRef]
  34. Mann, H.B. Nonparametric tests against trend. Econometrica 1945, 13, 245–259. [Google Scholar] [CrossRef]
  35. Kendall, M.G. Rank Correlation Methods, 4th ed.; Charles Griffin: London, UK, 1975; p. 202. [Google Scholar]
  36. Araghi, A.; Mousavi-Baygi, M.; Adamowski, J. Detection of trends in days with extreme temperatures in Iran from 1961 to 2010. Theor. Appl. Climatol. 2016, 125, 213–225. [Google Scholar] [CrossRef]
  37. Ongoma, V.; Chen, H.; Gao, C.; Nyongesa, A.M.; Polong, F. Future changes in climate extremes over Equatorial East Africa based on CMIP5 multimodel ensemble. Nat. Hazards. 2018, 90, 901–920. [Google Scholar] [CrossRef]
  38. Ayugi, B.; Tan, G.; Gnitou, G.T.; Ojara, M.; Ongoma, V. Historical evaluations and simulations of precipitation over East Africa from Rossby centre regional climate model. Atmos. Res. 2020, 232, 104705. [Google Scholar] [CrossRef]
  39. Torrence, C.; Compo, G.P. A Practical Guide to Wavelet Analysis. Bull. Am. Meteorol. Soc. 1998, 79, 61–78. [Google Scholar] [CrossRef] [Green Version]
  40. Nicholson, S.E.; Klotter, D.; Chavula, G. A detailed rainfall climatology for Malawi, Southern Africa. Int. J. Climatol. 2014, 34, 315–325. [Google Scholar] [CrossRef]
  41. Taljaard, J.J. Change of rainfall distribution and circulation patterns over Southern Africa in summer. J. Climatol. 1986, 6, 579–592. [Google Scholar] [CrossRef]
  42. Jury, M.R. Climate prediction experiences in southern Africa 1990–2005 and key outcomes. Nat. Hazards. 2013, 65, 1883–1894. [Google Scholar] [CrossRef]
  43. Sultan, B.; Janicot, S. Abrupt shift of the ITCZ over West Africa and intra-seasonal variability. Geophys. Res. Lett. 2000, 27, 3353–3356. [Google Scholar] [CrossRef]
  44. Mwafulirwa, N.D. Climate variability and predictability in tropical southern africa with a focus on dry spells over Malawi. Master’s Thesis, University of Zululandno, Richards Bay, South Africa, 1999. [Google Scholar]
  45. Ratnam, J.V.; Behera, S.K.; Masumoto, Y.; Yamagata, T. Remote Effects of El Niño and Modoki Events on the Austral Summer Precipitation of Southern Africa. J. Clim. 2014, 27, 3802–3815. [Google Scholar] [CrossRef]
  46. Gore, M.; Abiodun, B.J.; Kucharski, F. Understanding the influence of ENSO patterns on drought over southern Africa using SPEEDY. Clim. Dyn. 2020, 54, 307–327. [Google Scholar] [CrossRef]
  47. Pinault, J.L. The Anticipation of the ENSO: What Resonantly Forced Baroclinic Waves Can Teach Us (Part II). J. Mar. Sci. Eng. 2018, 6, 63. [Google Scholar] [CrossRef] [Green Version]
  48. Washington, R.; Preston, A. Extreme wet years over southern Africa: Role of Indian Ocean sea surface temperatures. J. Geophys. Res. 2006, 111, D15104. [Google Scholar] [CrossRef] [Green Version]
  49. Grinsted, A.; Moore, J.C.; Jevrejeva, S. Application of the cross wavelet transform and wavelet coherence to geophysical time series. Nonlinear Process. Geophys. 2004, 11, 561–566. [Google Scholar] [CrossRef]
  50. Okonkwo, C. An Advanced Review of the Relationships between Sahel Precipitation and Climate Indices: A Wavelet Approach. Int. J. Atmos. Sci. 2014, 1–11. [Google Scholar] [CrossRef] [Green Version]
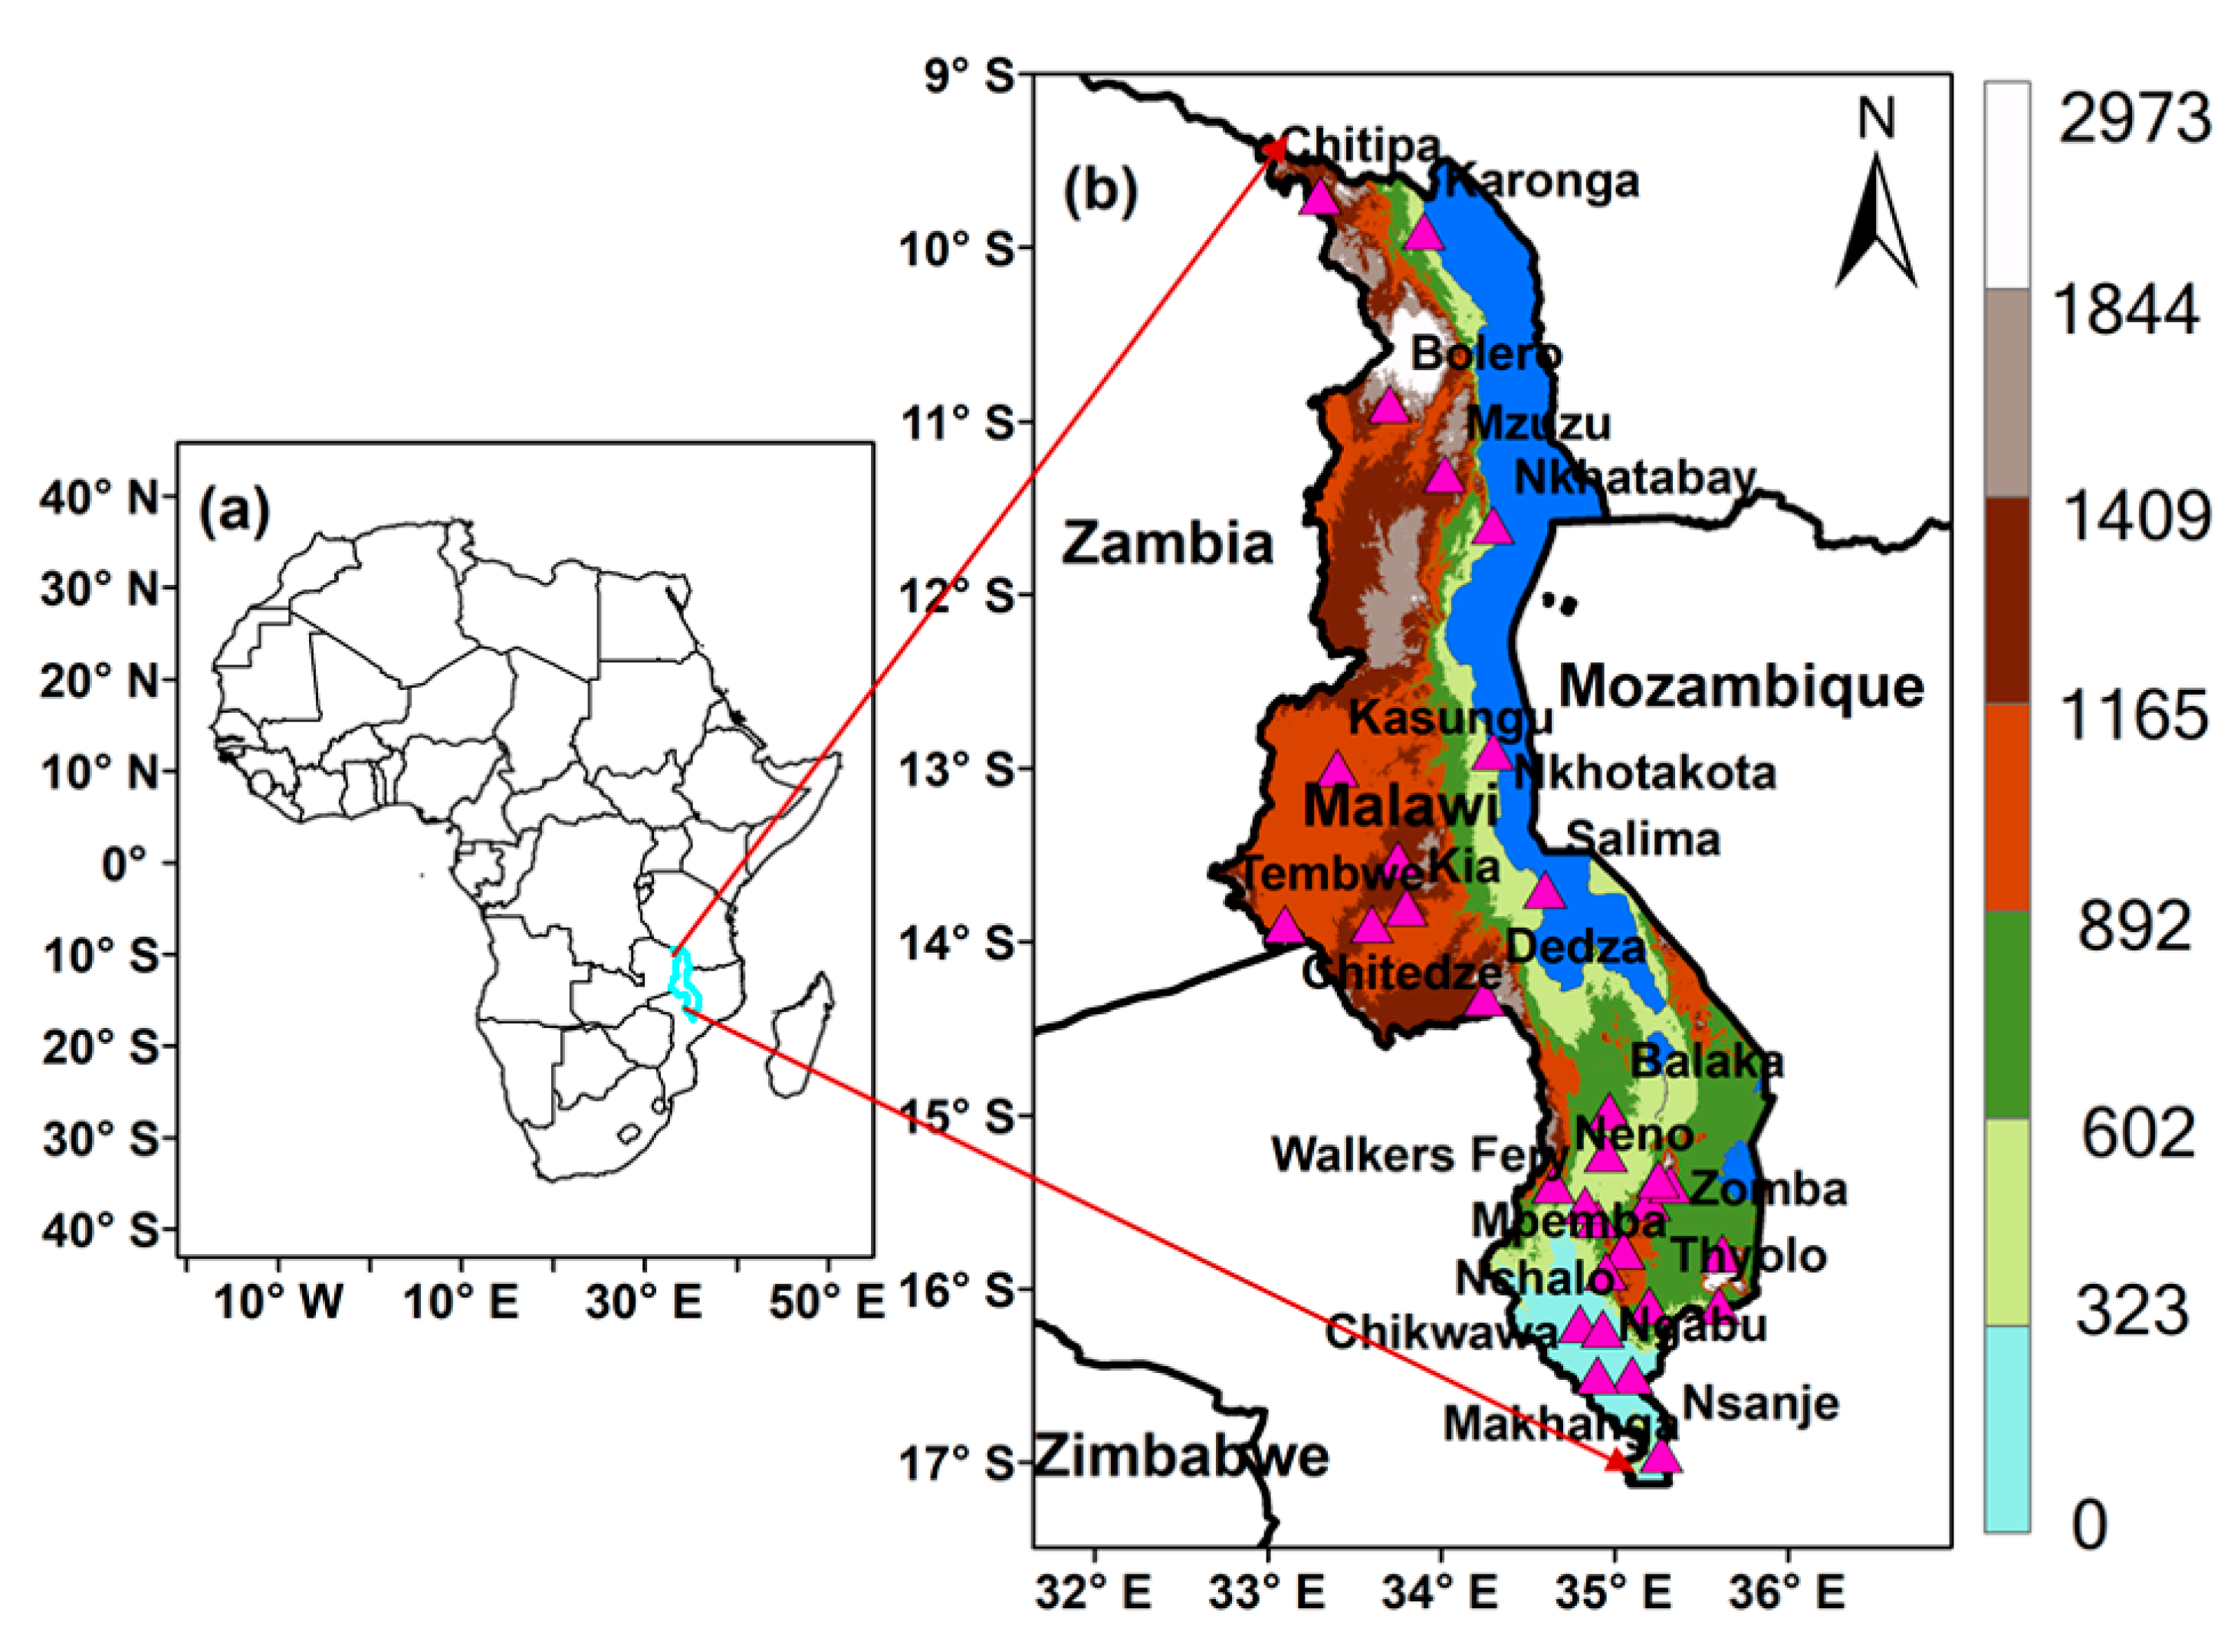
Figure 1. (a) Study area depicting location of Malawi in Africa. (b) Topography (unit: m) of the study area and the rainfall stations used in the study. The blue color stands for the lakes.
Atmosphere 11 00891 g001
Figure 2. Distribution of annual mean rainfall over Malawi for the period 1979–2015. Stations in black font received high amounts of rainfall and a station in red font received the least amount of rainfall.
Atmosphere 11 00891 g002
Figure 3. Annual mean rainfall cycle and the standard deviation over Malawi during the period of 1979–2015 based on data from 31 rainfall stations distributed across the study domain.
Atmosphere 11 00891 g003
Figure 4. EOF 1 of the wet season precipitation. (a) Spatial variability and (b) its corresponding PC over Malawi based on data from 31 rainfall stations during 1979–2015.
Atmosphere 11 00891 g004
Figure 5. EOF 2 of the wet season precipitation. (a) Spatial variability and (b) its corresponding PC over Malawi based on data from 31 rainfall stations during 1979–2015.
Atmosphere 11 00891 g005
Figure 6. EOF 3 of the wet season precipitation. (a) Spatial variability and (b) its corresponding PC over Malawi based on data from 31 rainfall stations during 1979–2015.
Atmosphere 11 00891 g006
Figure 7. Time series of (a) annual and (b) seasonal rainfall over Malawi from 1979 to 2015.
Atmosphere 11 00891 g007
Figure 8. Sen’s slope for (a) annual precipitation and (b) seasonal precipitation through the period of 1979–2015 over Malawi.
Atmosphere 11 00891 g008
Figure 9. Spatial distributions of trends in (a) annual and (b) seasonal rainfall during 1979–2015 over Malawi. The red (blue) triangle shows the decreasing (increasing) trend. The triangles with black dots inside represent significant trends at the 95% confidence level.
Atmosphere 11 00891 g009
Figure 10. Abrupt changes of (a) annual and (b) seasonal precipitations over Malawi as derived from the SQMK test. u(t) is progressive sequential while u(t′) is retrogressive sequential statistics. The higher and lower dashed lines exhibit the corresponding value of ±1.96 at the 95% confidence level.
Atmosphere 11 00891 g010
Figure 11. (a) Time series of the precipitation over Malawi which is used for the wavelet analysis; (b) WPS using the Morlet mother wavelet, the solid curve outlines the ‘cone of influence’ region where edge effects become essential; (c) the global wavelet spectrum, and the red dashed line is at the 5% significance level for the global wavelet spectrum; (d) scale-averaged wavelet power over the 1–2-year band, and the dashed line indicates passing the 95% confidence level.
Atmosphere 11 00891 g011
Table 1. Geographical features, annual mean rainfall, standard deviation (SD), Pettit’s test, and SNHT for the rainfall stations during the period 1979–2015.
No.Station NameLonLatAltitude (m)Annual Mean Rainfall (mm)SDPettitt’s TestSNHT
1Balaka34.97−14.98625801299.40.070.10
2Bolero33.7−10.91100657.72164.30.150.03
3Chichiri35.02−15.7811321122.96283.00.540.95
4Chikwawa34.8−16.2107770.76224.20.820.15
5Chileka34.9−16.6767847.8183.20.450.59
6Chitedze33.6−13.91149867.72191.50.890.26
7Chitipa33.3−9.71285920.64160.20.260.20
8Dedza 34.25−14.321632899.4198.50.050.20
9Kia33.8−13.81229944.52211.80.330.59
10Karonga33.9−9.9529964.68256.80.590.02
11Kasungu33.4−131058776.76192.70.620.63
12Makhanga35.1−16.576782.76280.30.880.45
13Makoka35.2−15.51029984.48245.80.520.95
14Mimosa35.6−16.16521602.6367.90.890.59
15Mpemba34.95−15.98661142.52318.80.090.14
16Mponela33.75−13.531220780.48203.90.460.42
17Mwanza34.5215.6212601033.32326.60.350.67
18Mzuzu34.02−11.312541165.8260.40.470.83
19Naminjiwa35.62−15.87731040.16293.70.010.11
20Nchalo34.93−16.2352684.24203.10.520.89
21Neno34.65−15.48991111.68358.40.860.73
22Ngabu34.9−16.5105780.96215.80.940.96
23Nkhatabay34.3−11.65001572.6321.10.480.78
24Nkhotakota34.3−12.95001370.52318.80.690.02
25Nsanje35.27−16.95200978.72330.70.440.59
26Phalula34.95−15.22585876.84303.80.010.10
27Salima34.6−13.75121165.2314.50.420.23
28Tembwe33.1−13.91097941.16204.70.490.56
29Thyolo35.2−16.28201196.88272.80.140.16
30Zomba 35.32−15.49151223.28336.10.990.99
31Chingale35.25−15.37610879.12261.00.770.68
Table 2. Decadal mean annual and seasonal precipitation with trend of per decade.
DecadesAnnualSeasonal
Mean (mm)Trend (mm/decade)Mean (mm)Trend (mm/decade)
1979–19881023.284155.6925.2659.5
1989–1998949.98226.8857.9233.5
1999–20081040.92−119.6928.8−157.8
2009–2015964.64−94.25850.33−121.7
Table 3. Summary of MK results for annual and seasonal rainfalls over Malawi during 1979–2015.
Trend AnalysisMK Rainfall (mm)
Annual RainfallSeasonal Rainfall
S Trend−30.000−60.000
Z0.379290.77165
Kendall’s tau−0.045−0.090
P0.704470.4403
α0.050.05
SignificanceInsignificant decreasing trendInsignificant decreasing trend