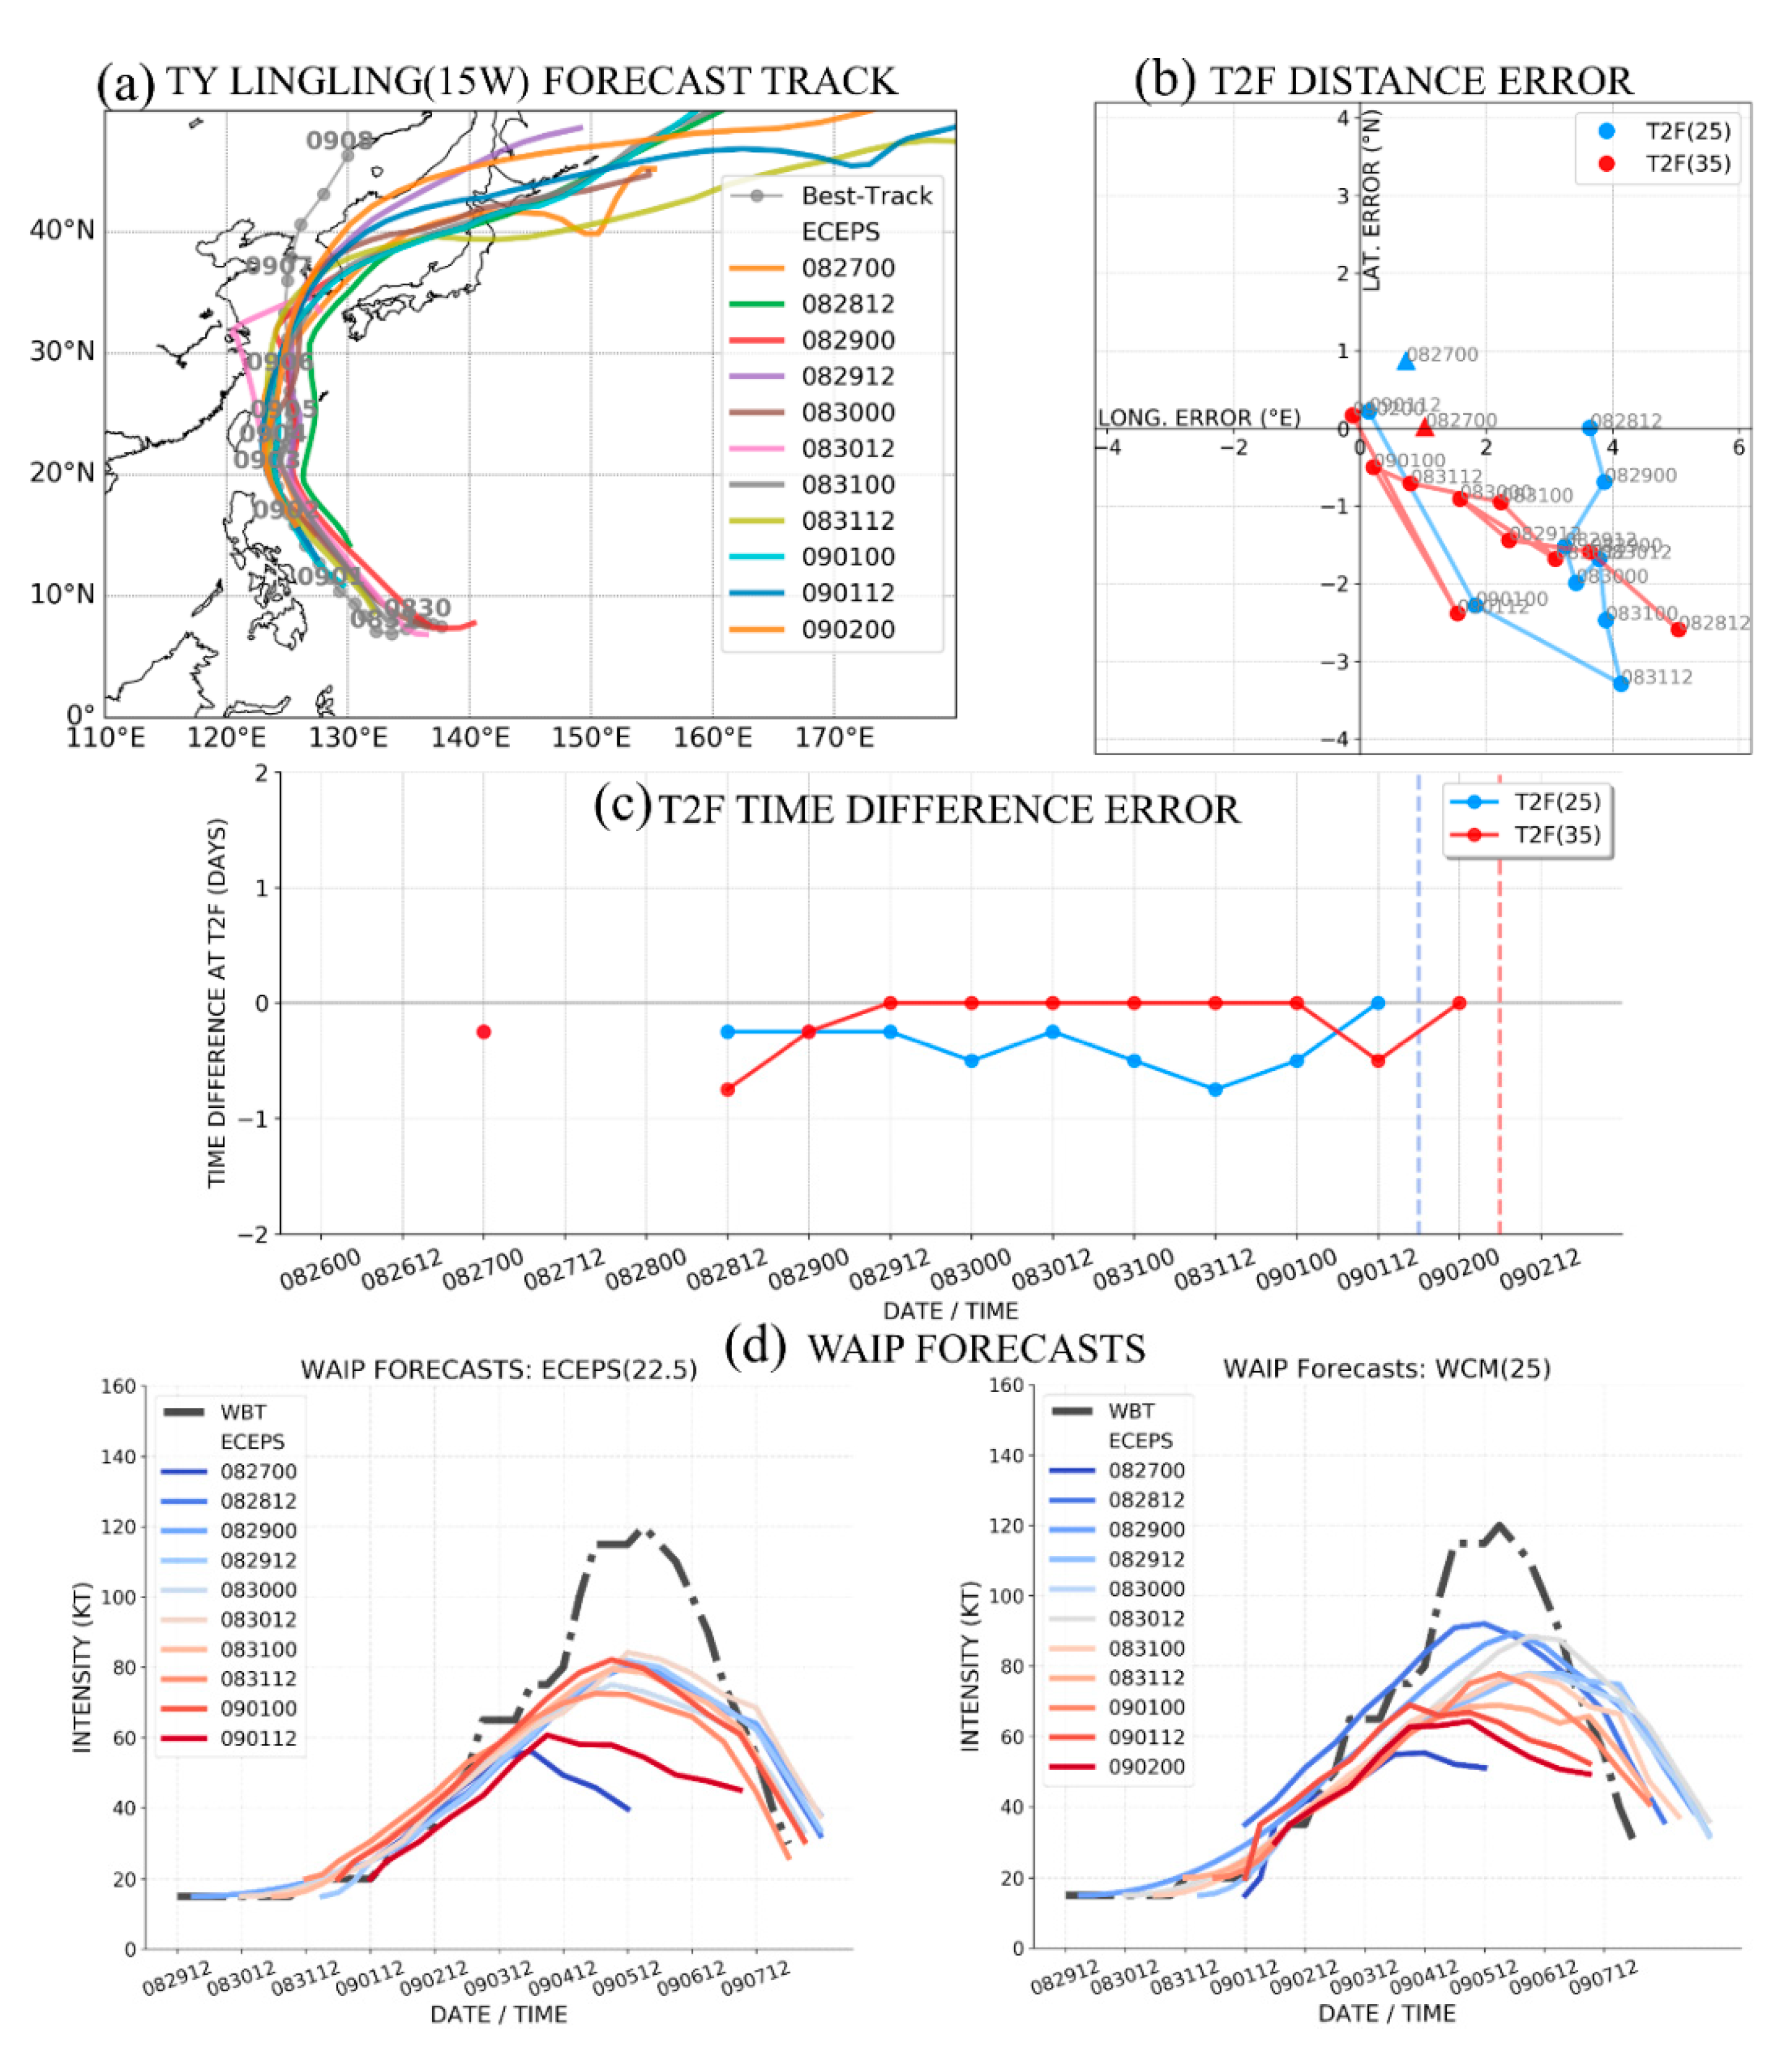
3.1.1. ECEPS and GEFS Forecasts of T2F and Intensity of TY Lingling (15W)
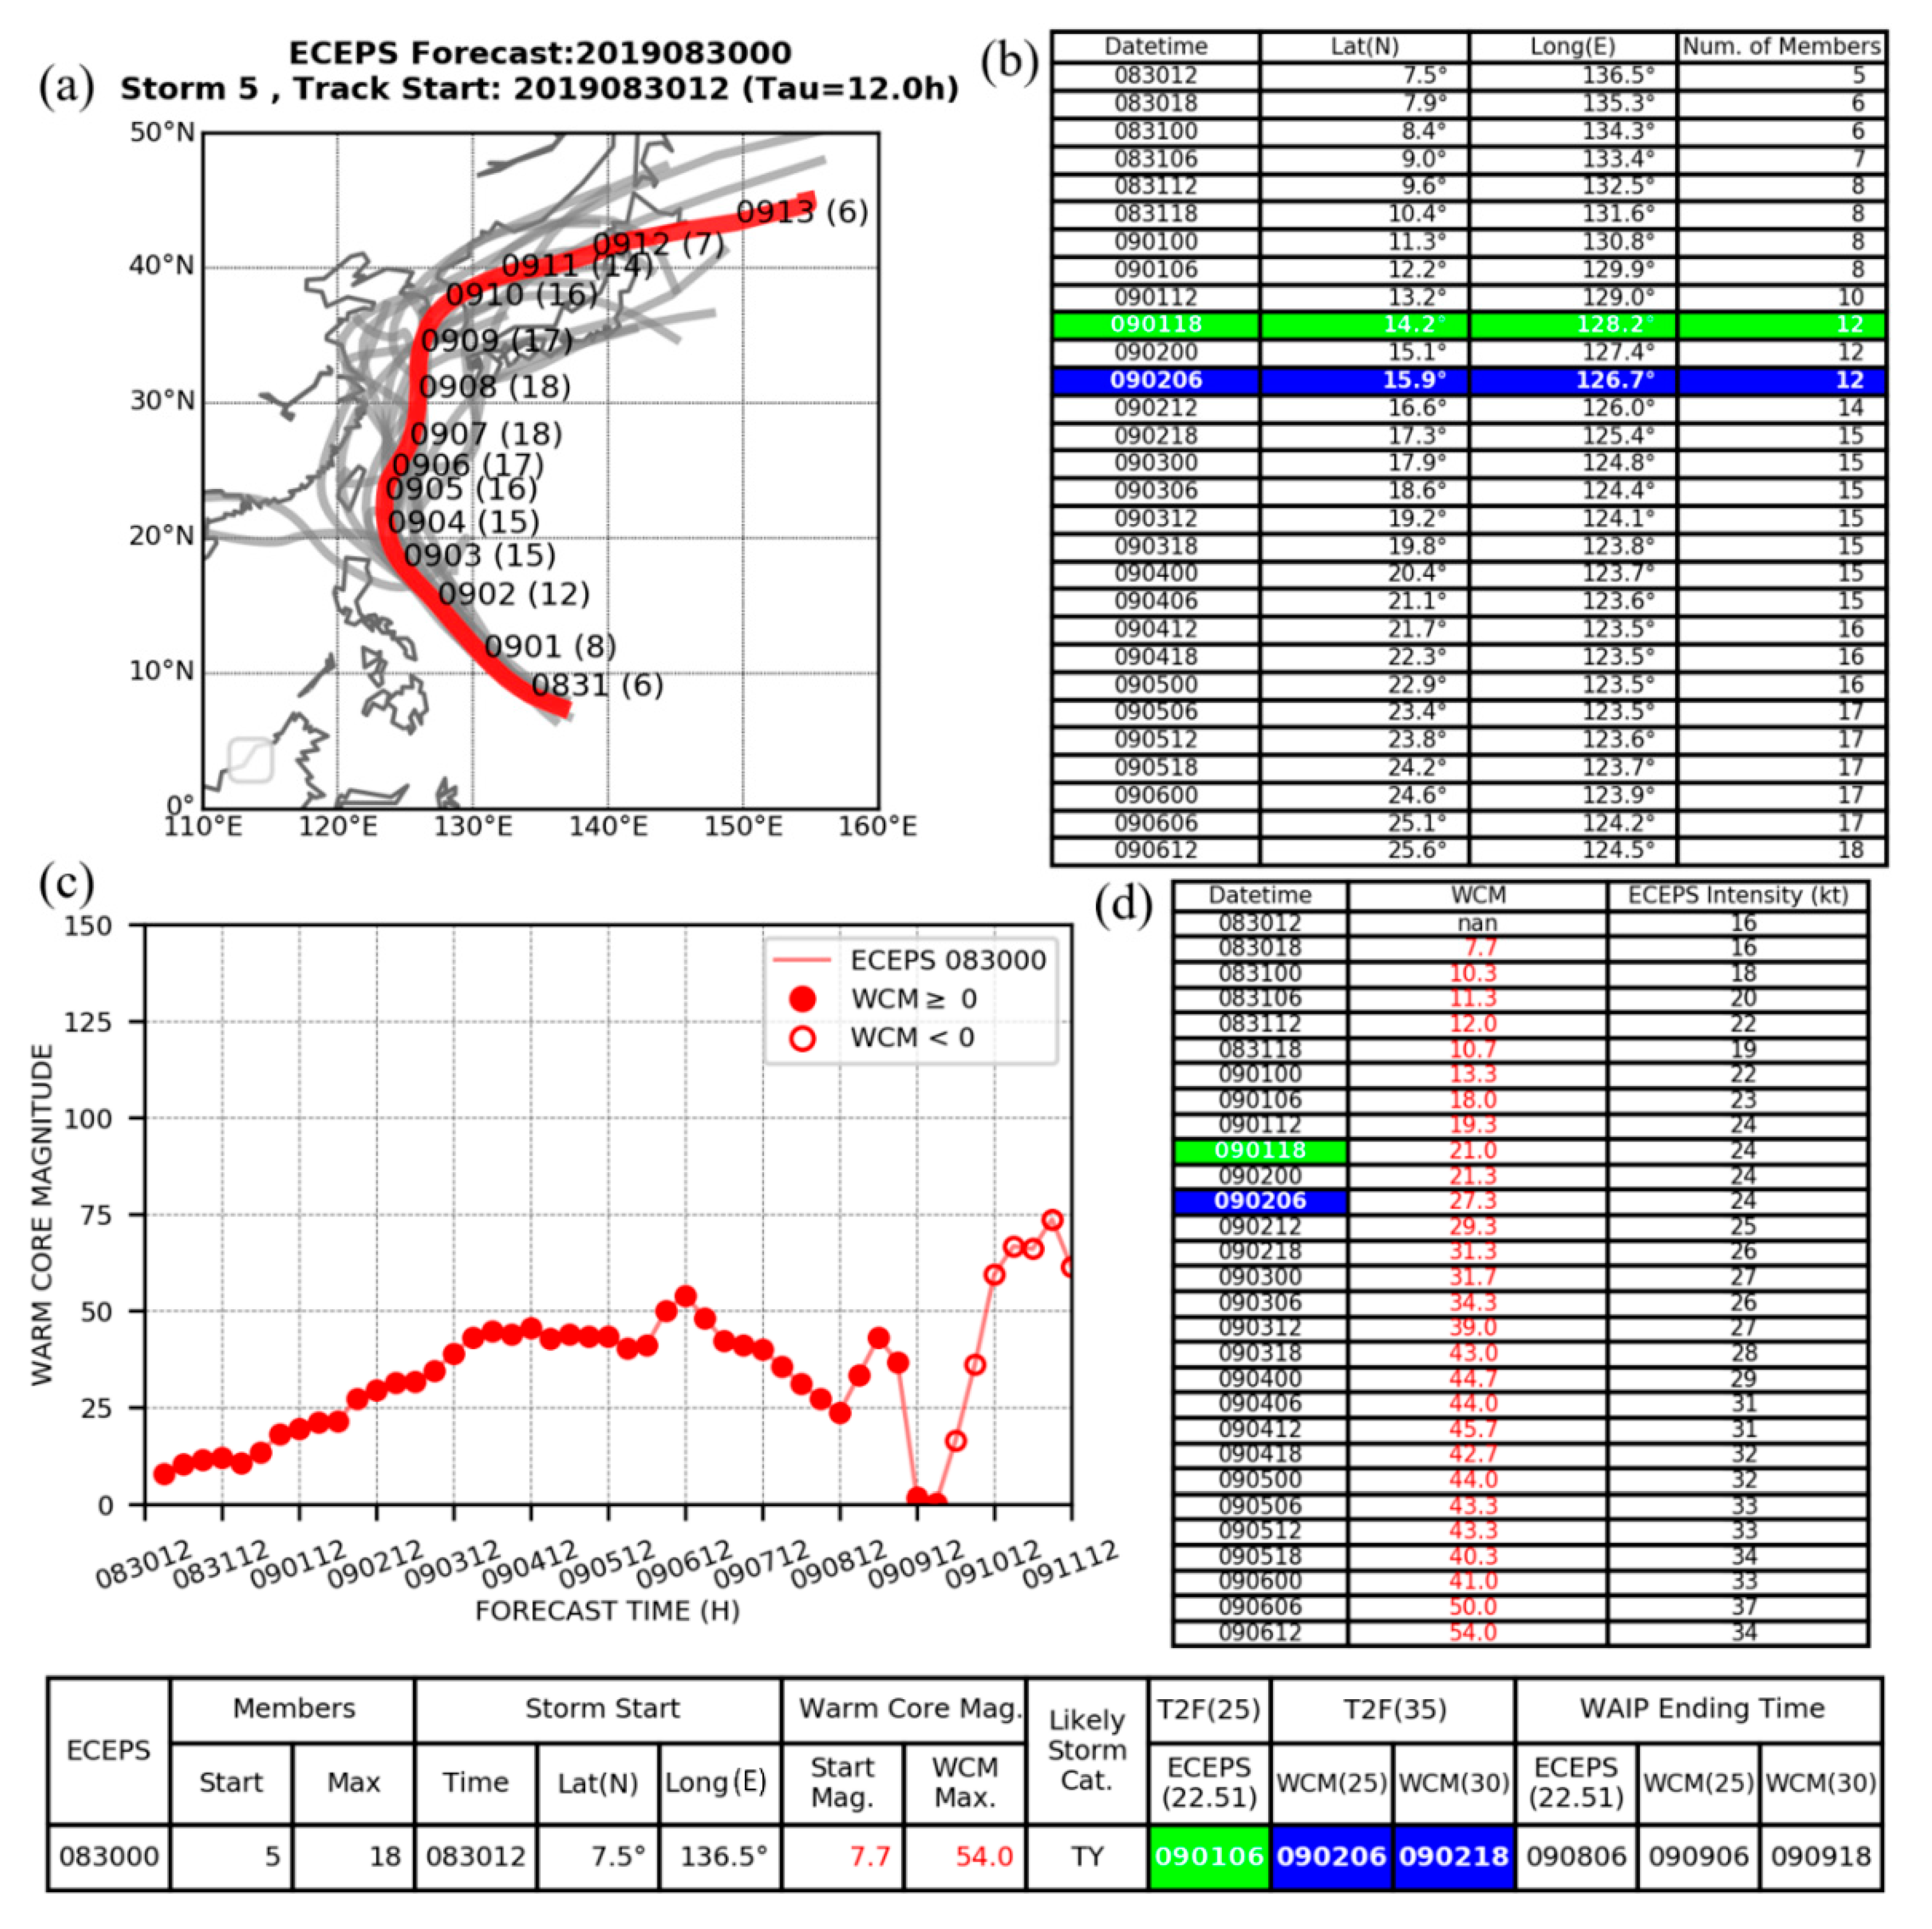
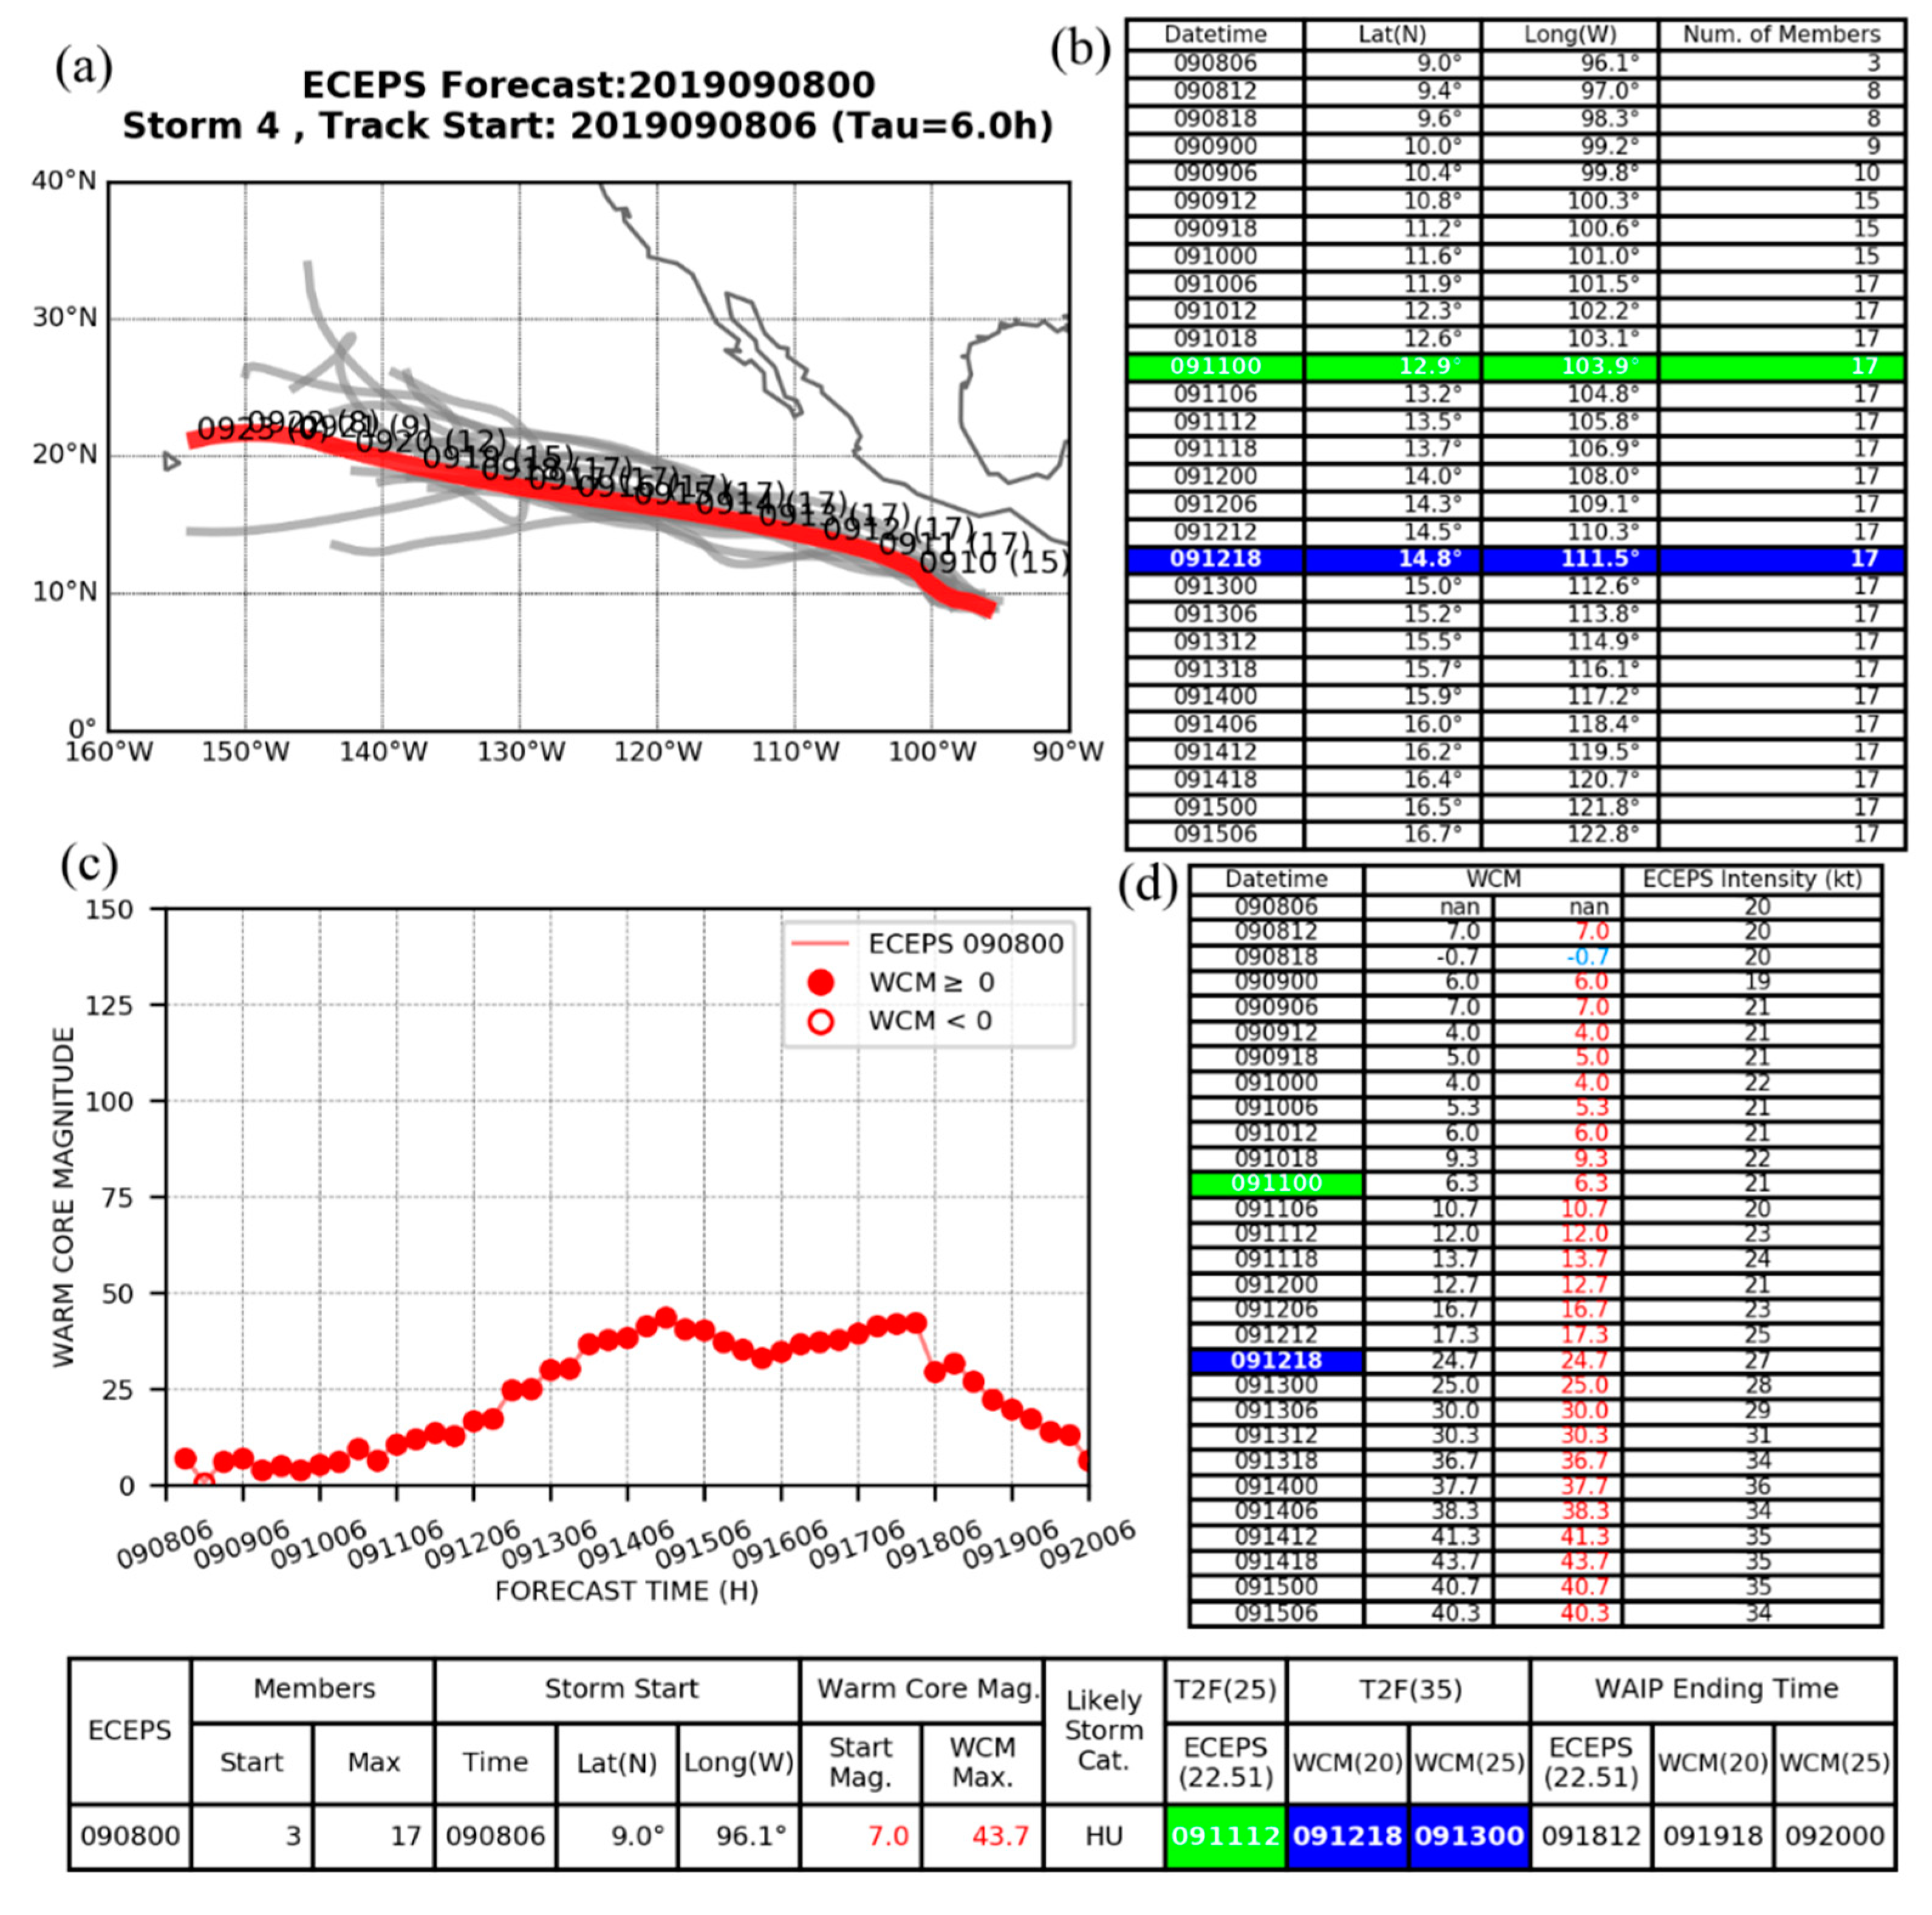
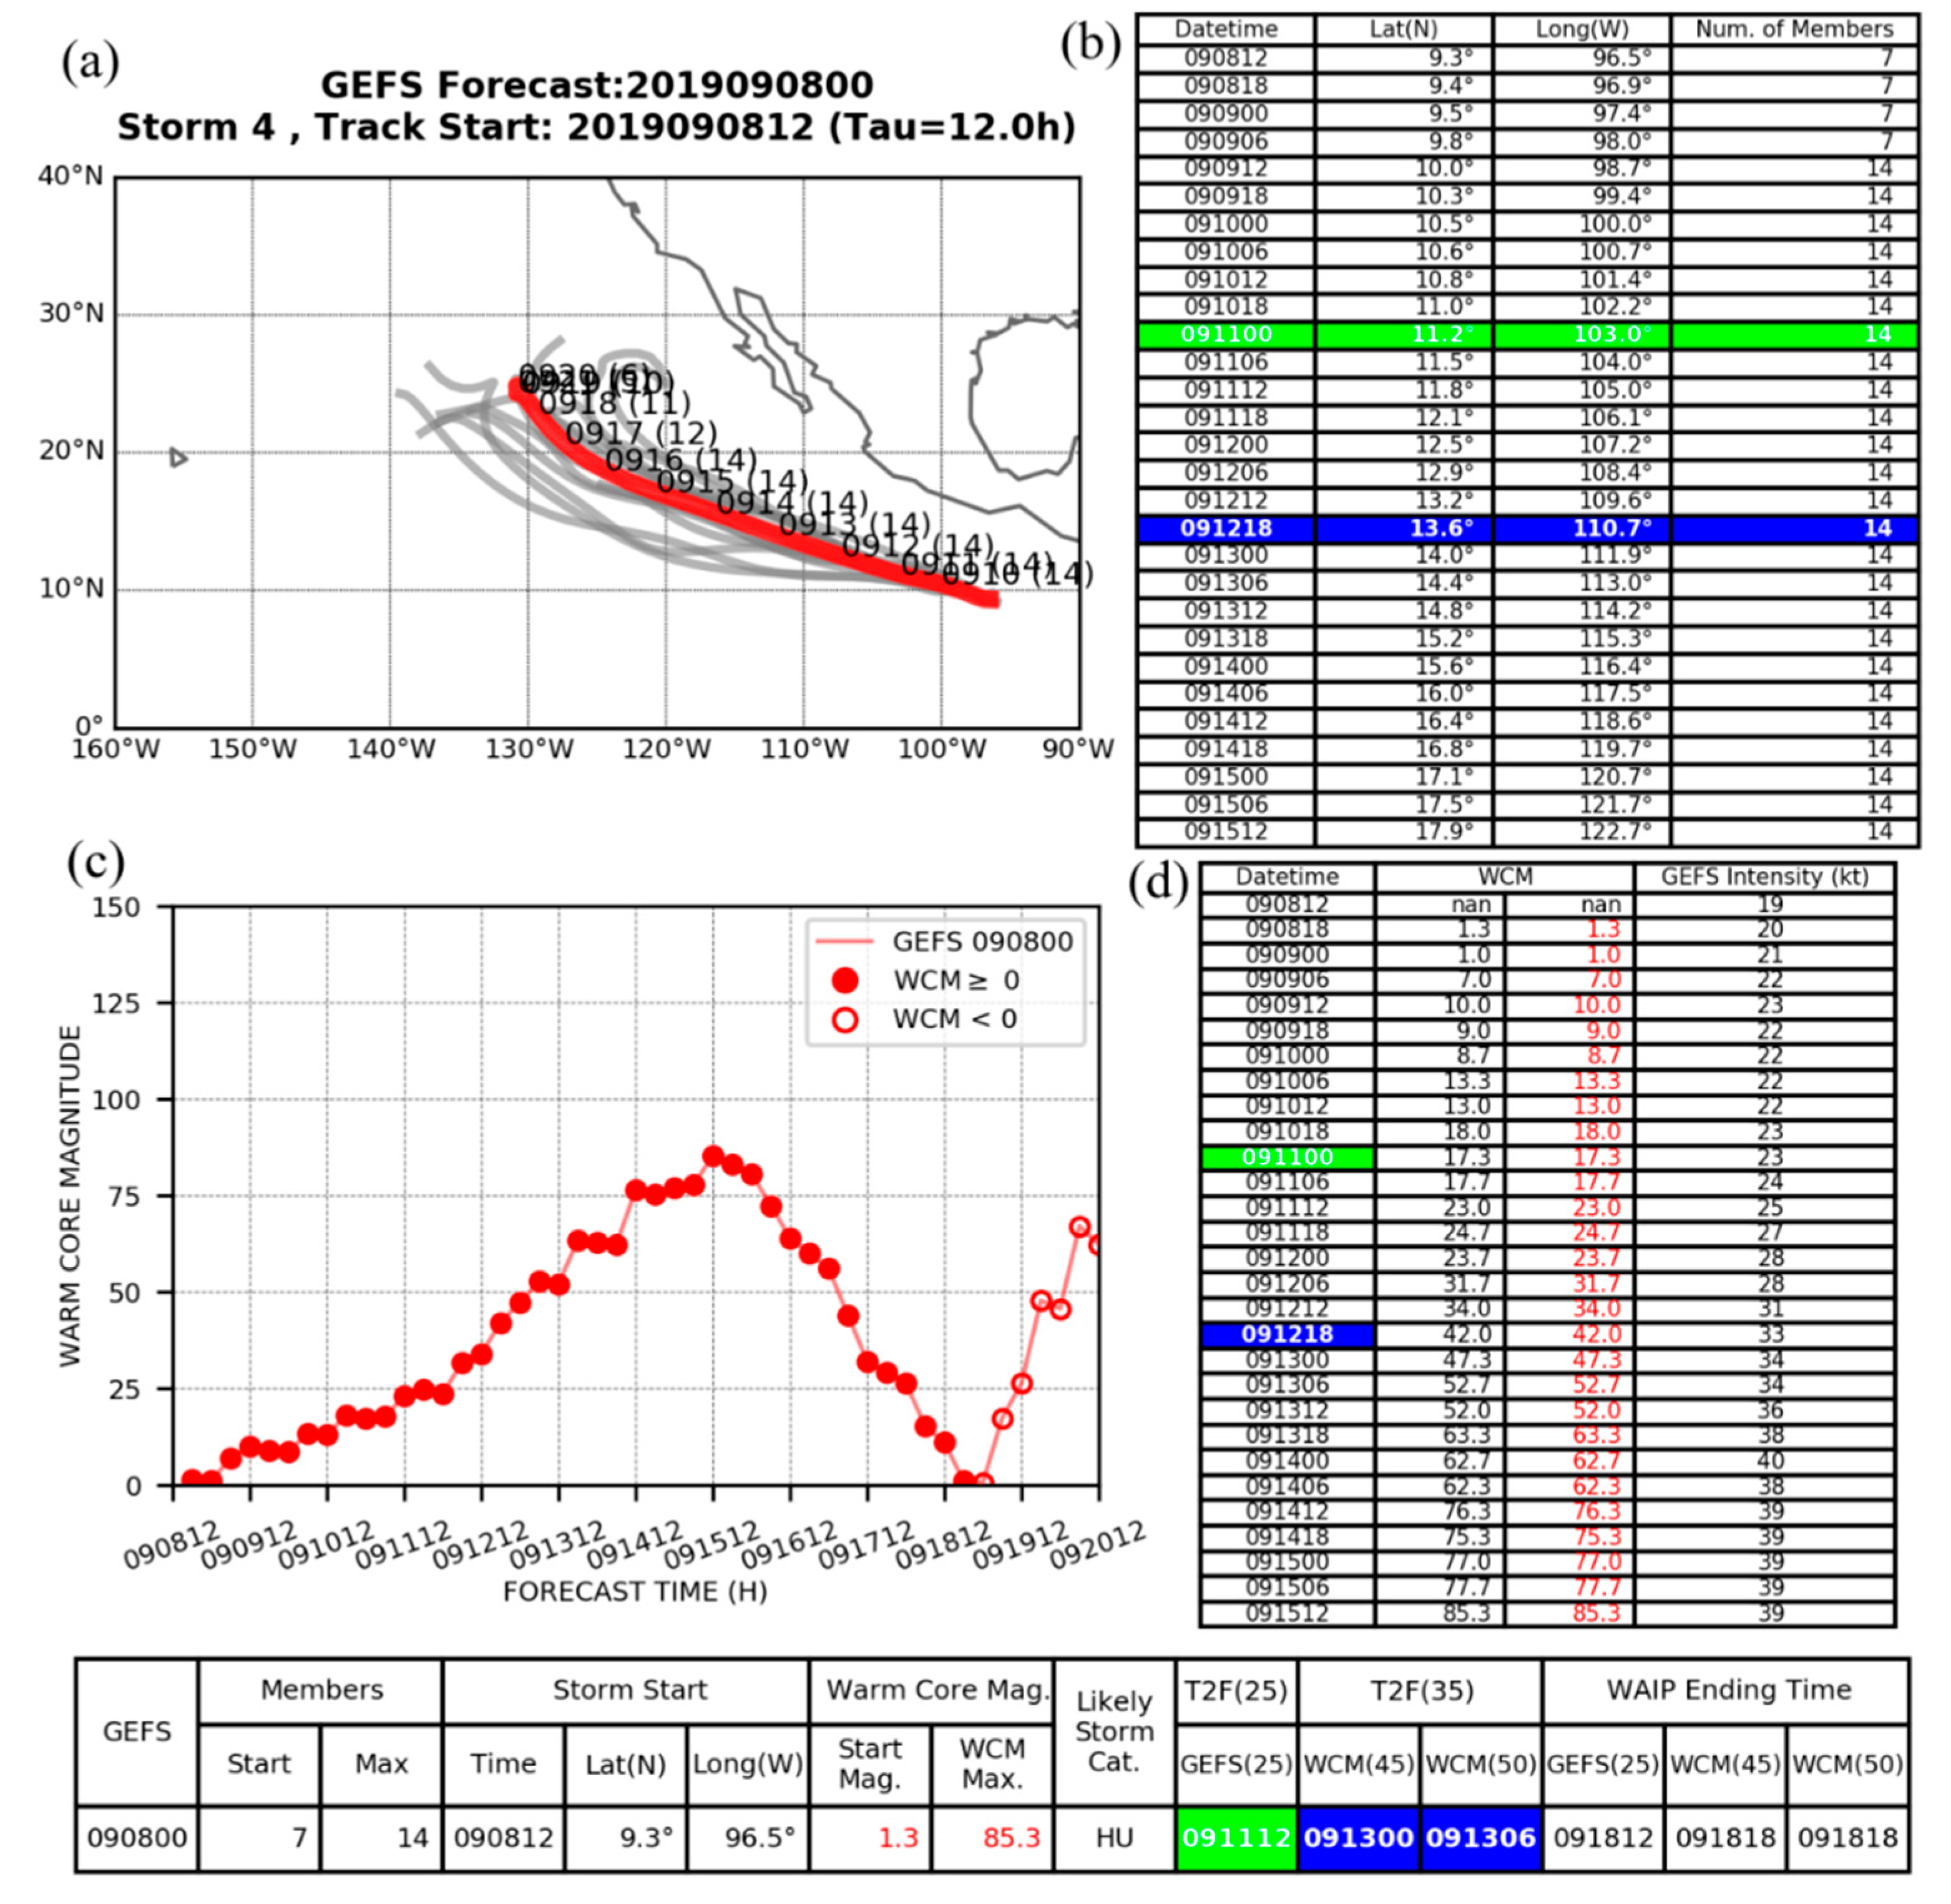
In the ECEPS forecast from 083000 (00 UTC 30 August 2019), the WMVM forecast track (
Figure 1a, red line) for pre-TY Lingling (2019) starts at 083012 (Tau = 12 h) at 7.5° N, 136.5° E with 5 members (
Figure 1b, first line). Whereas the labels in
Figure 1a are the Month–Date at 00 UTC, the table in
Figure 1b provides the forecaster for the digital positions each 6 h during the first 7 days of the WMVM track forecast. For the convenience of the reader, the verifying WBT positions at the T2F(25) and at the T2F(35) are indicated by the green and the blue colors in
Figure 1b. Note that the pre-Lingling circulation in this ECEPS forecast began 2.25 (2.75) days prior to the time Lingling became a Tropical Depression (Tropical Storm) according to the JTWC. This capability of the ECEPS to predict the pre-TC circulation track will allow earlier guidance as to the formation time than the 24–36 h that JTWC has typically provided [
13].
There is typically some uncertainty in the initial positions as the pre-TY Lingling circulation track here begins with only five members in the ECEPS. When just one more ensemble member track is added at 6 h (083018), there is a large WMVM position adjustment of 0.4° latitude and 1.2° longitude. But when one more member joins at 18 h (083106), the WMVM track becomes more stable (
Figure 1b), and the pre-Lingling circulation is predicted to move rapidly to the northwest within a compact track spread (
Figure 1a). The advantage of the WMVM calculation with weighting factors for each member becomes more important as the track spread increases, and at the end of the 15-day ECEPS forecast, the WMVM track comes smoothly to an end even though the ensemble member tracks have a wide variety of translation speeds and directions generally toward the northeast.
As indicated in the Introduction Section, the T2F(25) estimate is defined as the time the weighted-mean (same weighting factors as for the WMVM calculation) of the intensities of the ensemble members included in the pre-TC circulation first exceed 25 kt. For the ECEPS forecasts that tend to have weaker intensities than for the GEFS, the ECEPS intensity (column 3 in
Figure 1d) threshold is actually defined as 22.51 kt, which would be considered to be an intensity of 25 kt if digitized to the nearest 5 kt value. For this ECEPS intensity forecast (column 3,
Figure 1d), the T2F(25) is therefore 090106, and this T2F(25) is entered in green box in the summary table at the bottom of
Figure 1. Note that this T2F(25) forecast is 12 h early compared to the verifying T2F(25) time of 090118 in green box in column 1 of
Figure 1d.
The ECEPS-predicted WCM evolution along the WMVM track forecast is plotted in
Figure 1c and the digital values are in the table in
Figure 1d (column 2), where the WCMs in red indicate positive values. Note that the initial WCM is 7.7 and then the WCMs increase steadily as the ECEPS intensity (
Figure 1d, column 3) increases. After examining many ECEPS forecasts, the WCM threshold for an early (later) T2F(35) time was set at 25 (30). In this ECEPS forecast of pre-TY Lingling, the WCM > 25 threshold (WCM > 30 threshold) was achieved at 090206 (at 090218), and these key results from the ECEPS are highlighted in the blue T2F(35) boxes in the summary table at the bottom of
Figure 1. Compared to the verifying T2F(35) time of 090206 (blue box in column 1 of
Figure 1d), the T2F(35) prediction with WCM > 25 is perfect and the T2F(35) with WCM > 30 is only 12 h late. Note that these are times along the WMVM track forecast and thus the positions of these two ECEPS-predicted T2F(35) times can be found in
Figure 1b. It is emphasized that the weighted-mean WCM values have the same weighting factors for each ensemble member as for the WMVM track forecast, so that a WCM for an ensemble member track that greatly deviates from the WMVM track would be given a very small weight.
Whereas the WCM continues to steadily increase beyond these WCM threshold values for T2F(35), the weighted-mean ECEPS intensity (
Figure 1d, column 3) only slowly increases beyond 25 kt. Therefore, the ECEPS intensity is utilized for detecting the Tropical Depression (TD) stage, but not for the TS stage. It was discovered that the maximum positive WCM for ECEPS forecasts could also be used to distinguish the Likely Storm Category (
Figure 1, summary table at bottom): Maximum WCM < 25.0 for TD, 25.0 ≤ WCM < 46.0 for TS, and WCM ≥ 46.0 for TY. For this ECEPS forecast of the pre-Lingling circulation, the maximum WCM = 54.0 implies that this circulation will likely become at least a weak TY. Another future application of the maximum WCM value will be to detect False Alarms (FAs) in the ECEPS (and GEFS) predictions (e.g., four FA types in the Atlantic [
7]). Other predictors of FAs might be maximum number of ensemble members (column 3 in the summary table at bottom), length of track, and storm start positions (columns 4–6 in the summary table at bottom) that might indicate an equatorial wave rather than a TC.
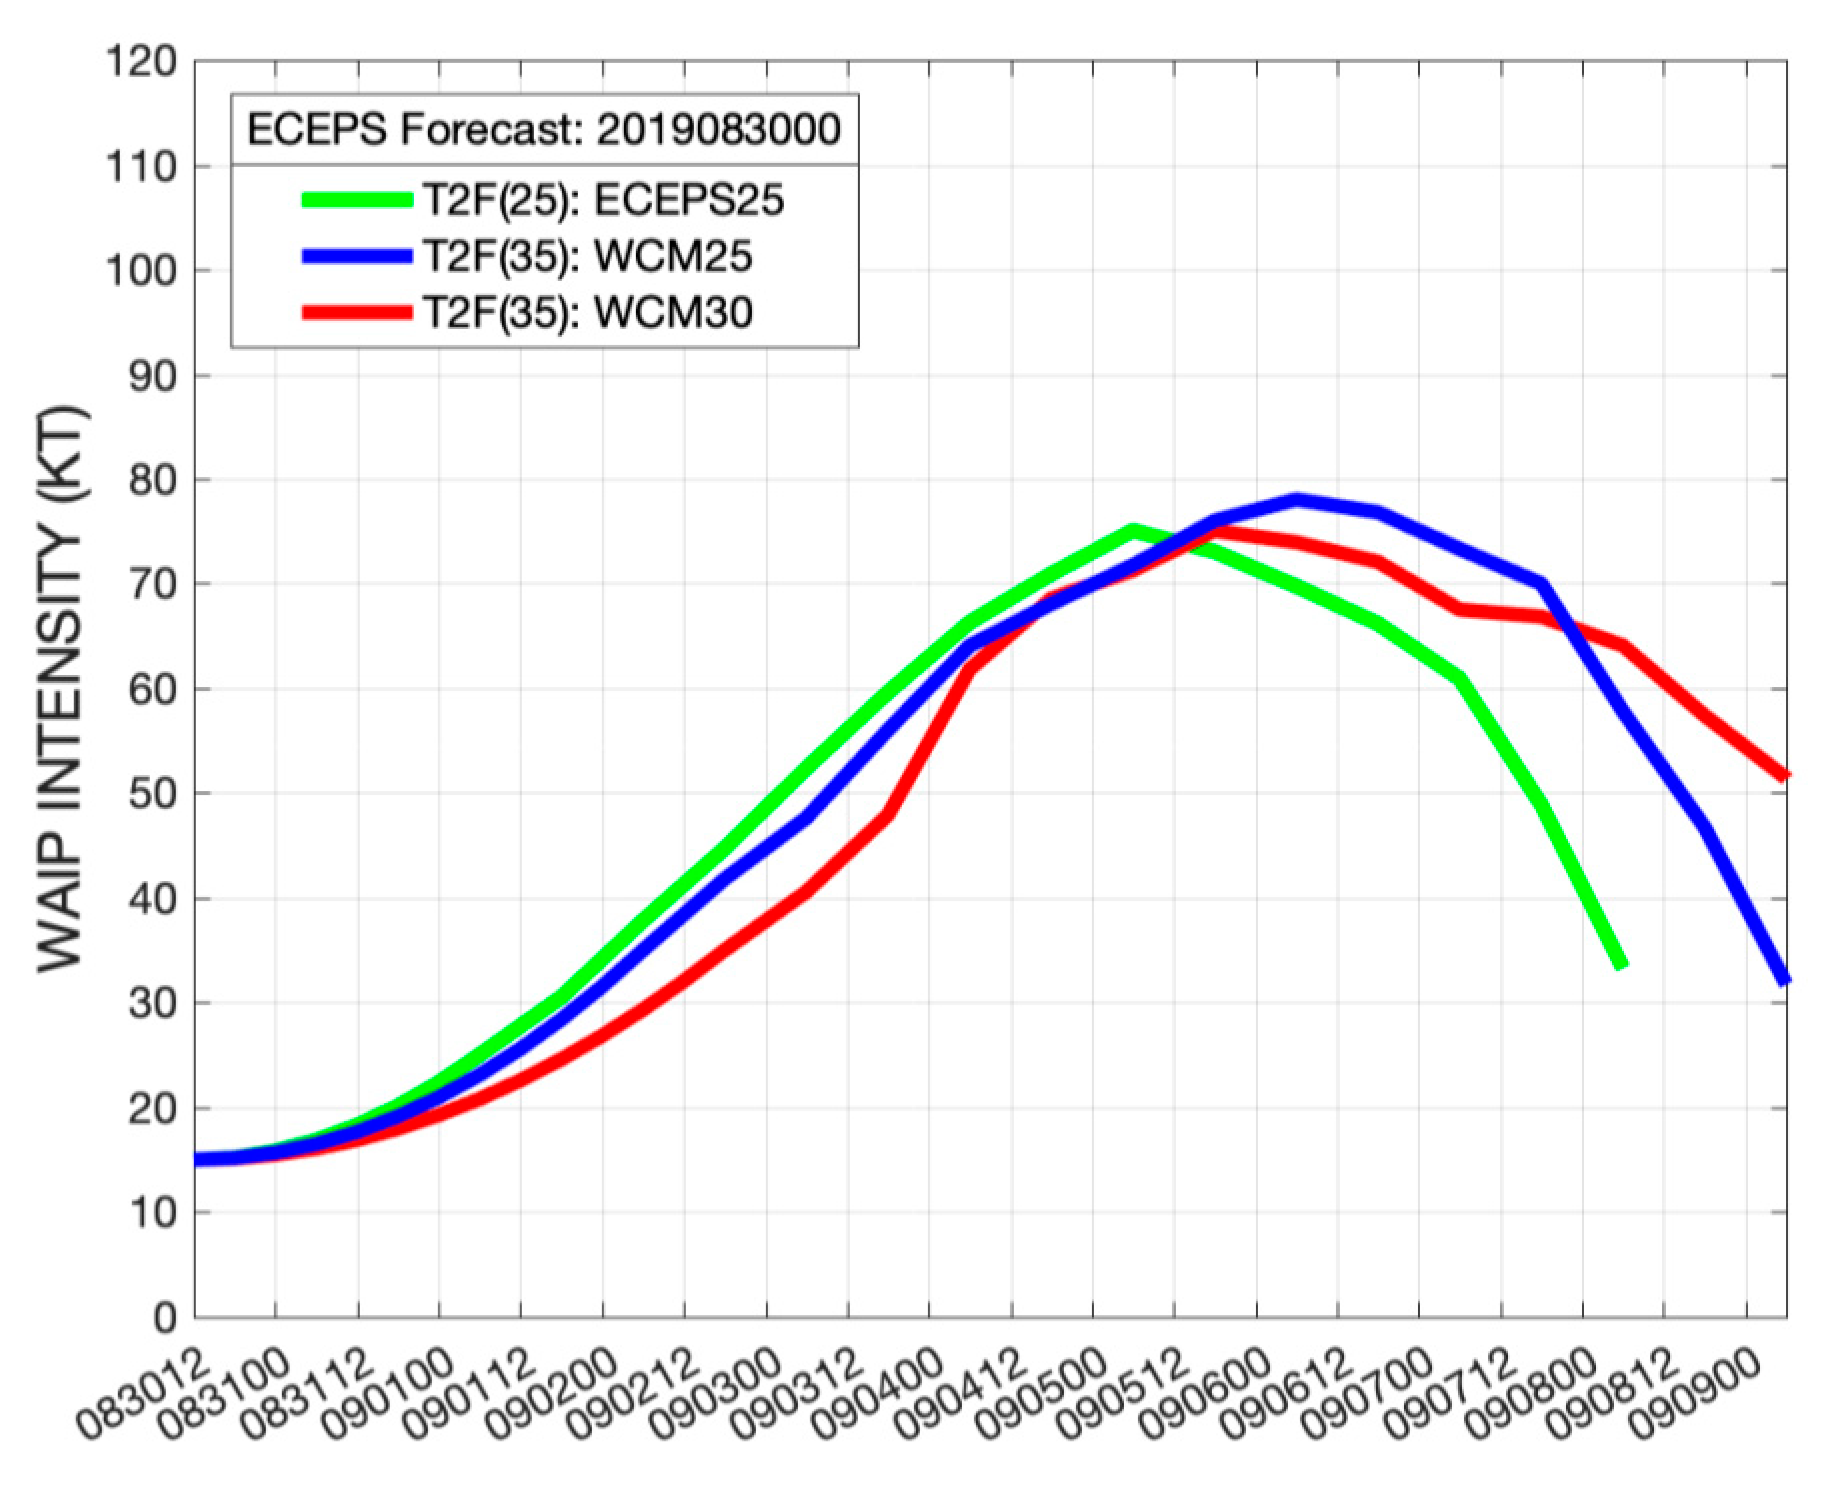
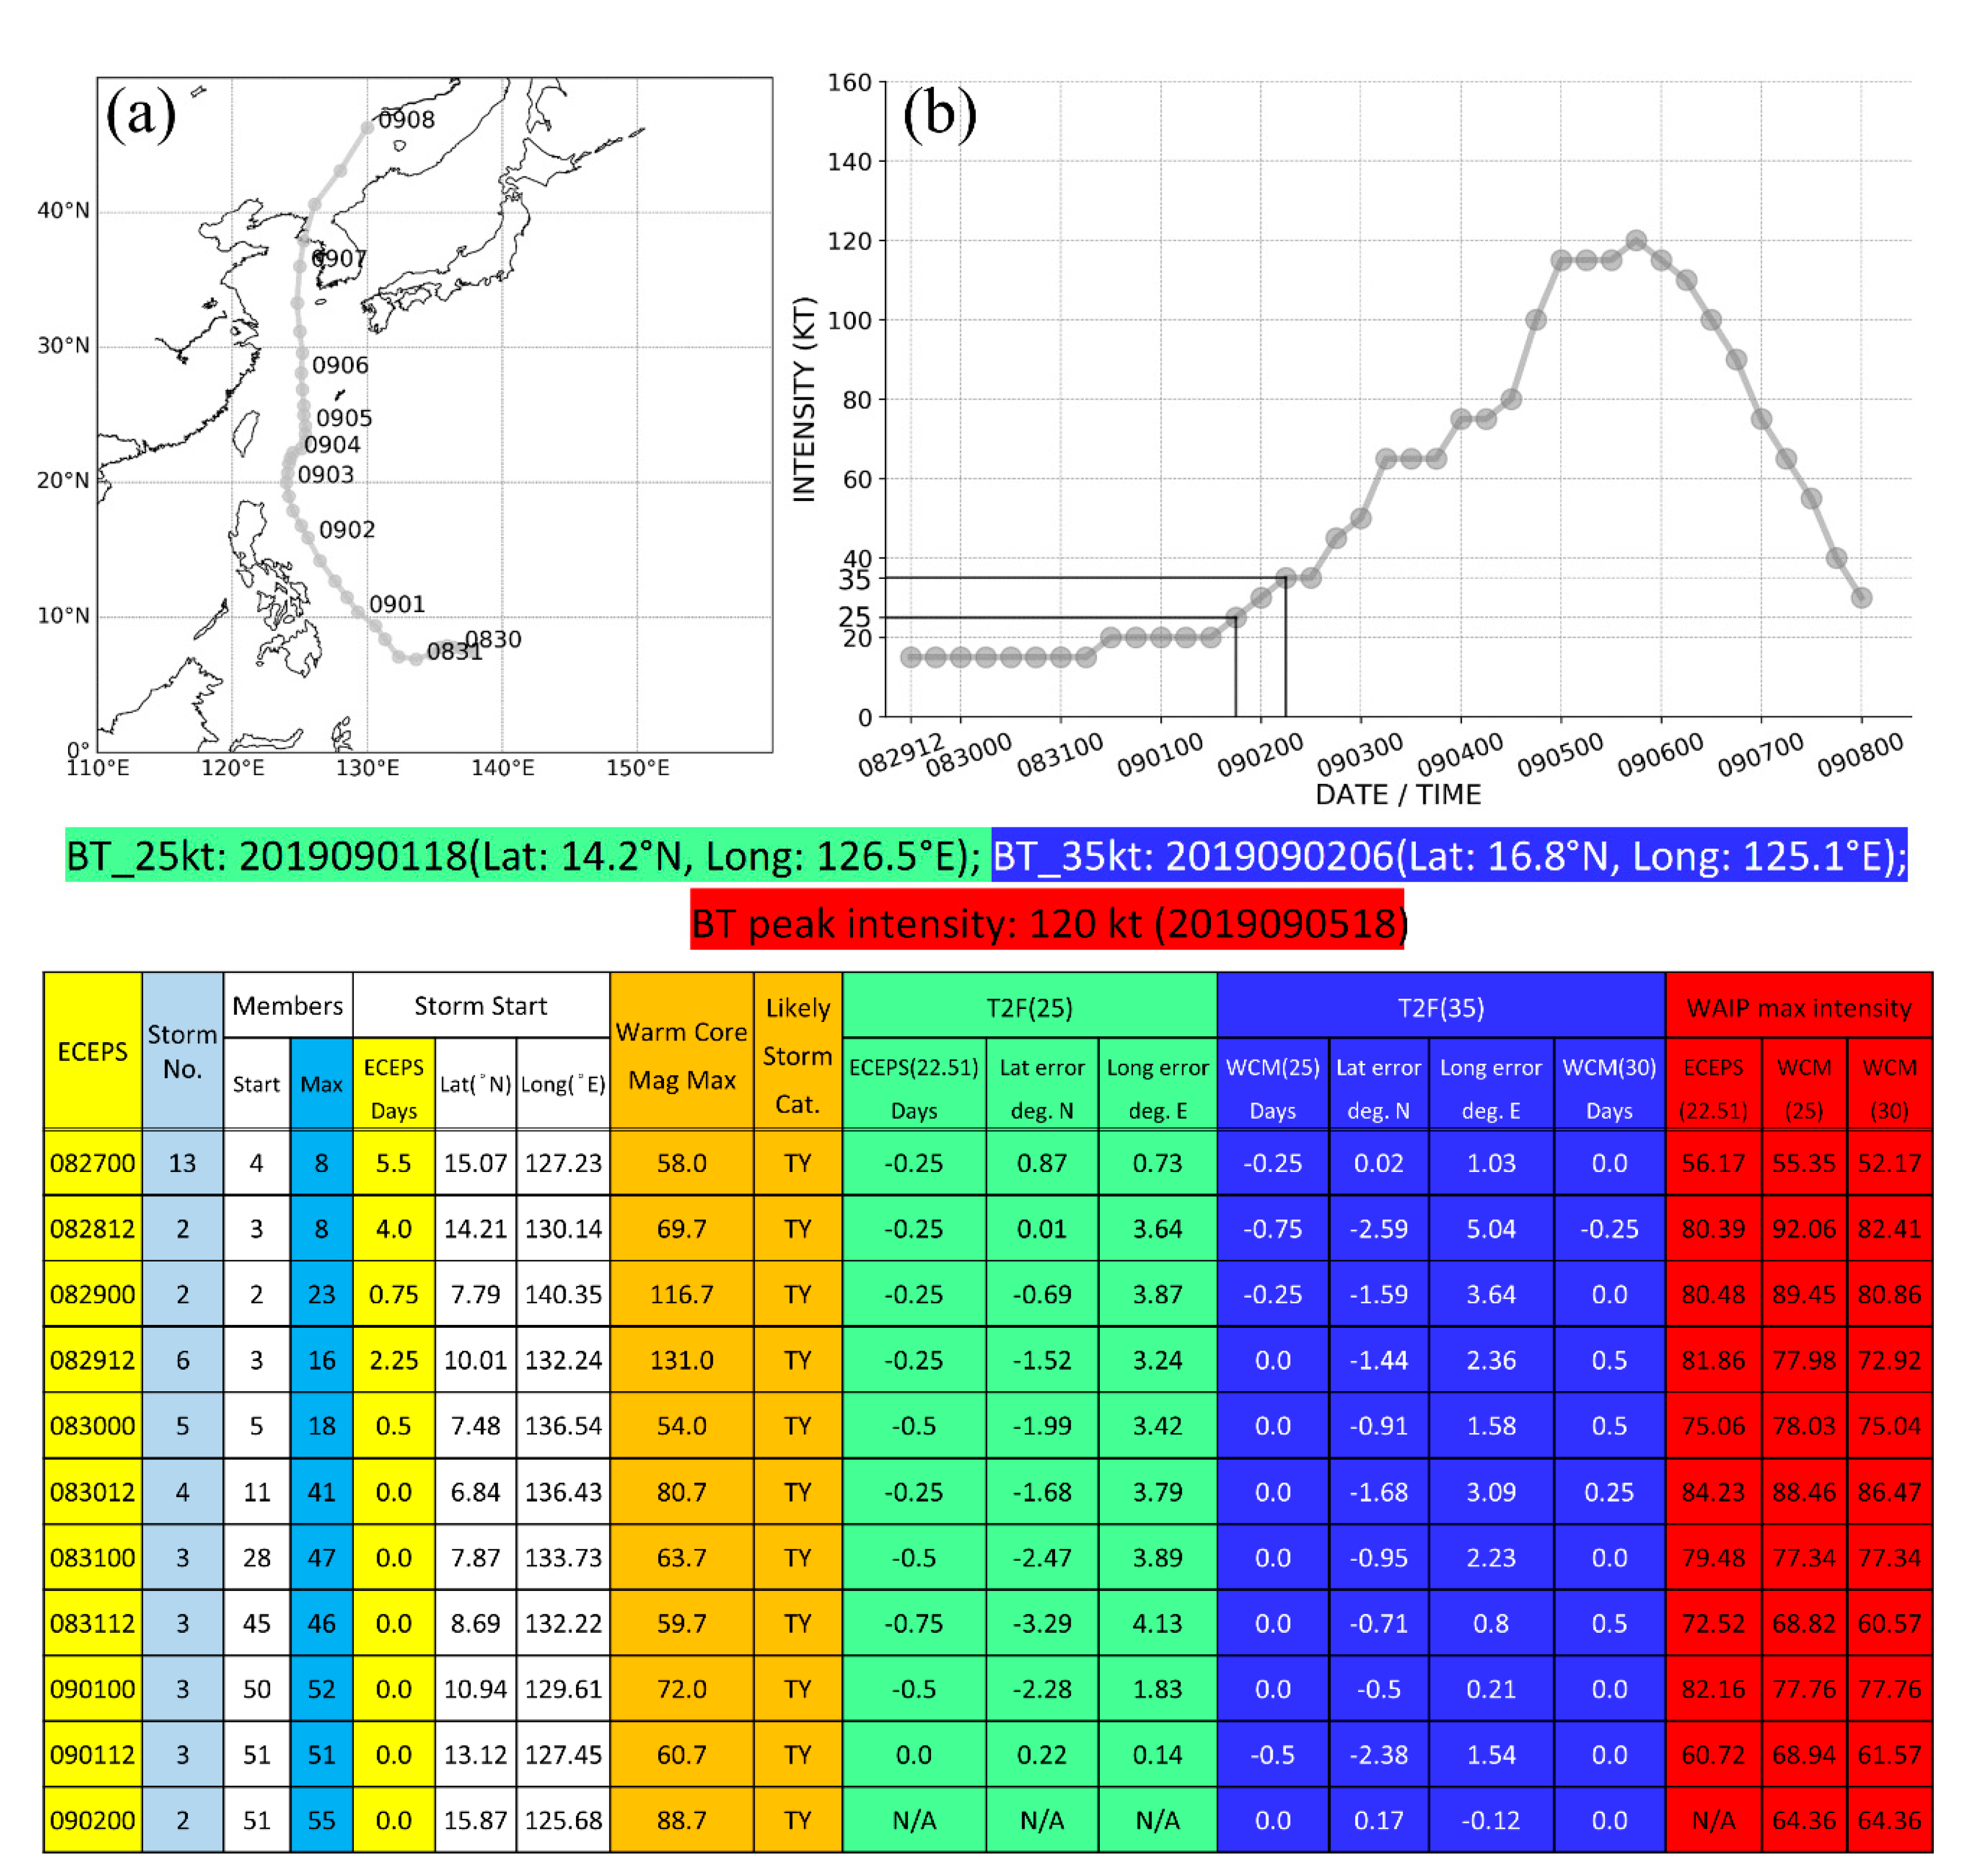
The three combined WAIP intensity forecasts based on the three ECEPS-predicted T2Fs, the WMVM track forecast in
Figure 1a, and the three WAIP Ending Times at bottom of
Figure 1, are displayed in
Figure 2. Each intensity forecast begins at 15 kt since a WBT intensity is not yet available, and is a square function to the corresponding T2F at which the intensity is either 25 or 35 kt. After the T2F, the combined 7-day WAIP intensity forecasts are based on the intensity evolutions of 16 analogs that have tracks that closely match the WMVM track and have initial intensities close to either 25 or 35 kt, as appropriate. With these constraints on analog selection, most of the same analogs will be selected, and thus the WAIP intensity forecasts after the T2F have a similar variation with slightly different peak intensities (±5 kt in this case). Note that the decay stages of these intensity forecasts are constrained by the different WAIP Ending Times. As expected for an analog statistical TC intensity prediction technique, these peak intensities will be much smaller than the verifying 130 kt peak intensity of TY Lingling. It is noteworthy that each of these peak intensities are of Typhoon strength, which confirms/supports the Likely Storm Category of Typhoon based on the maximum WCM value (see the summary table at bottom of
Figure 1).
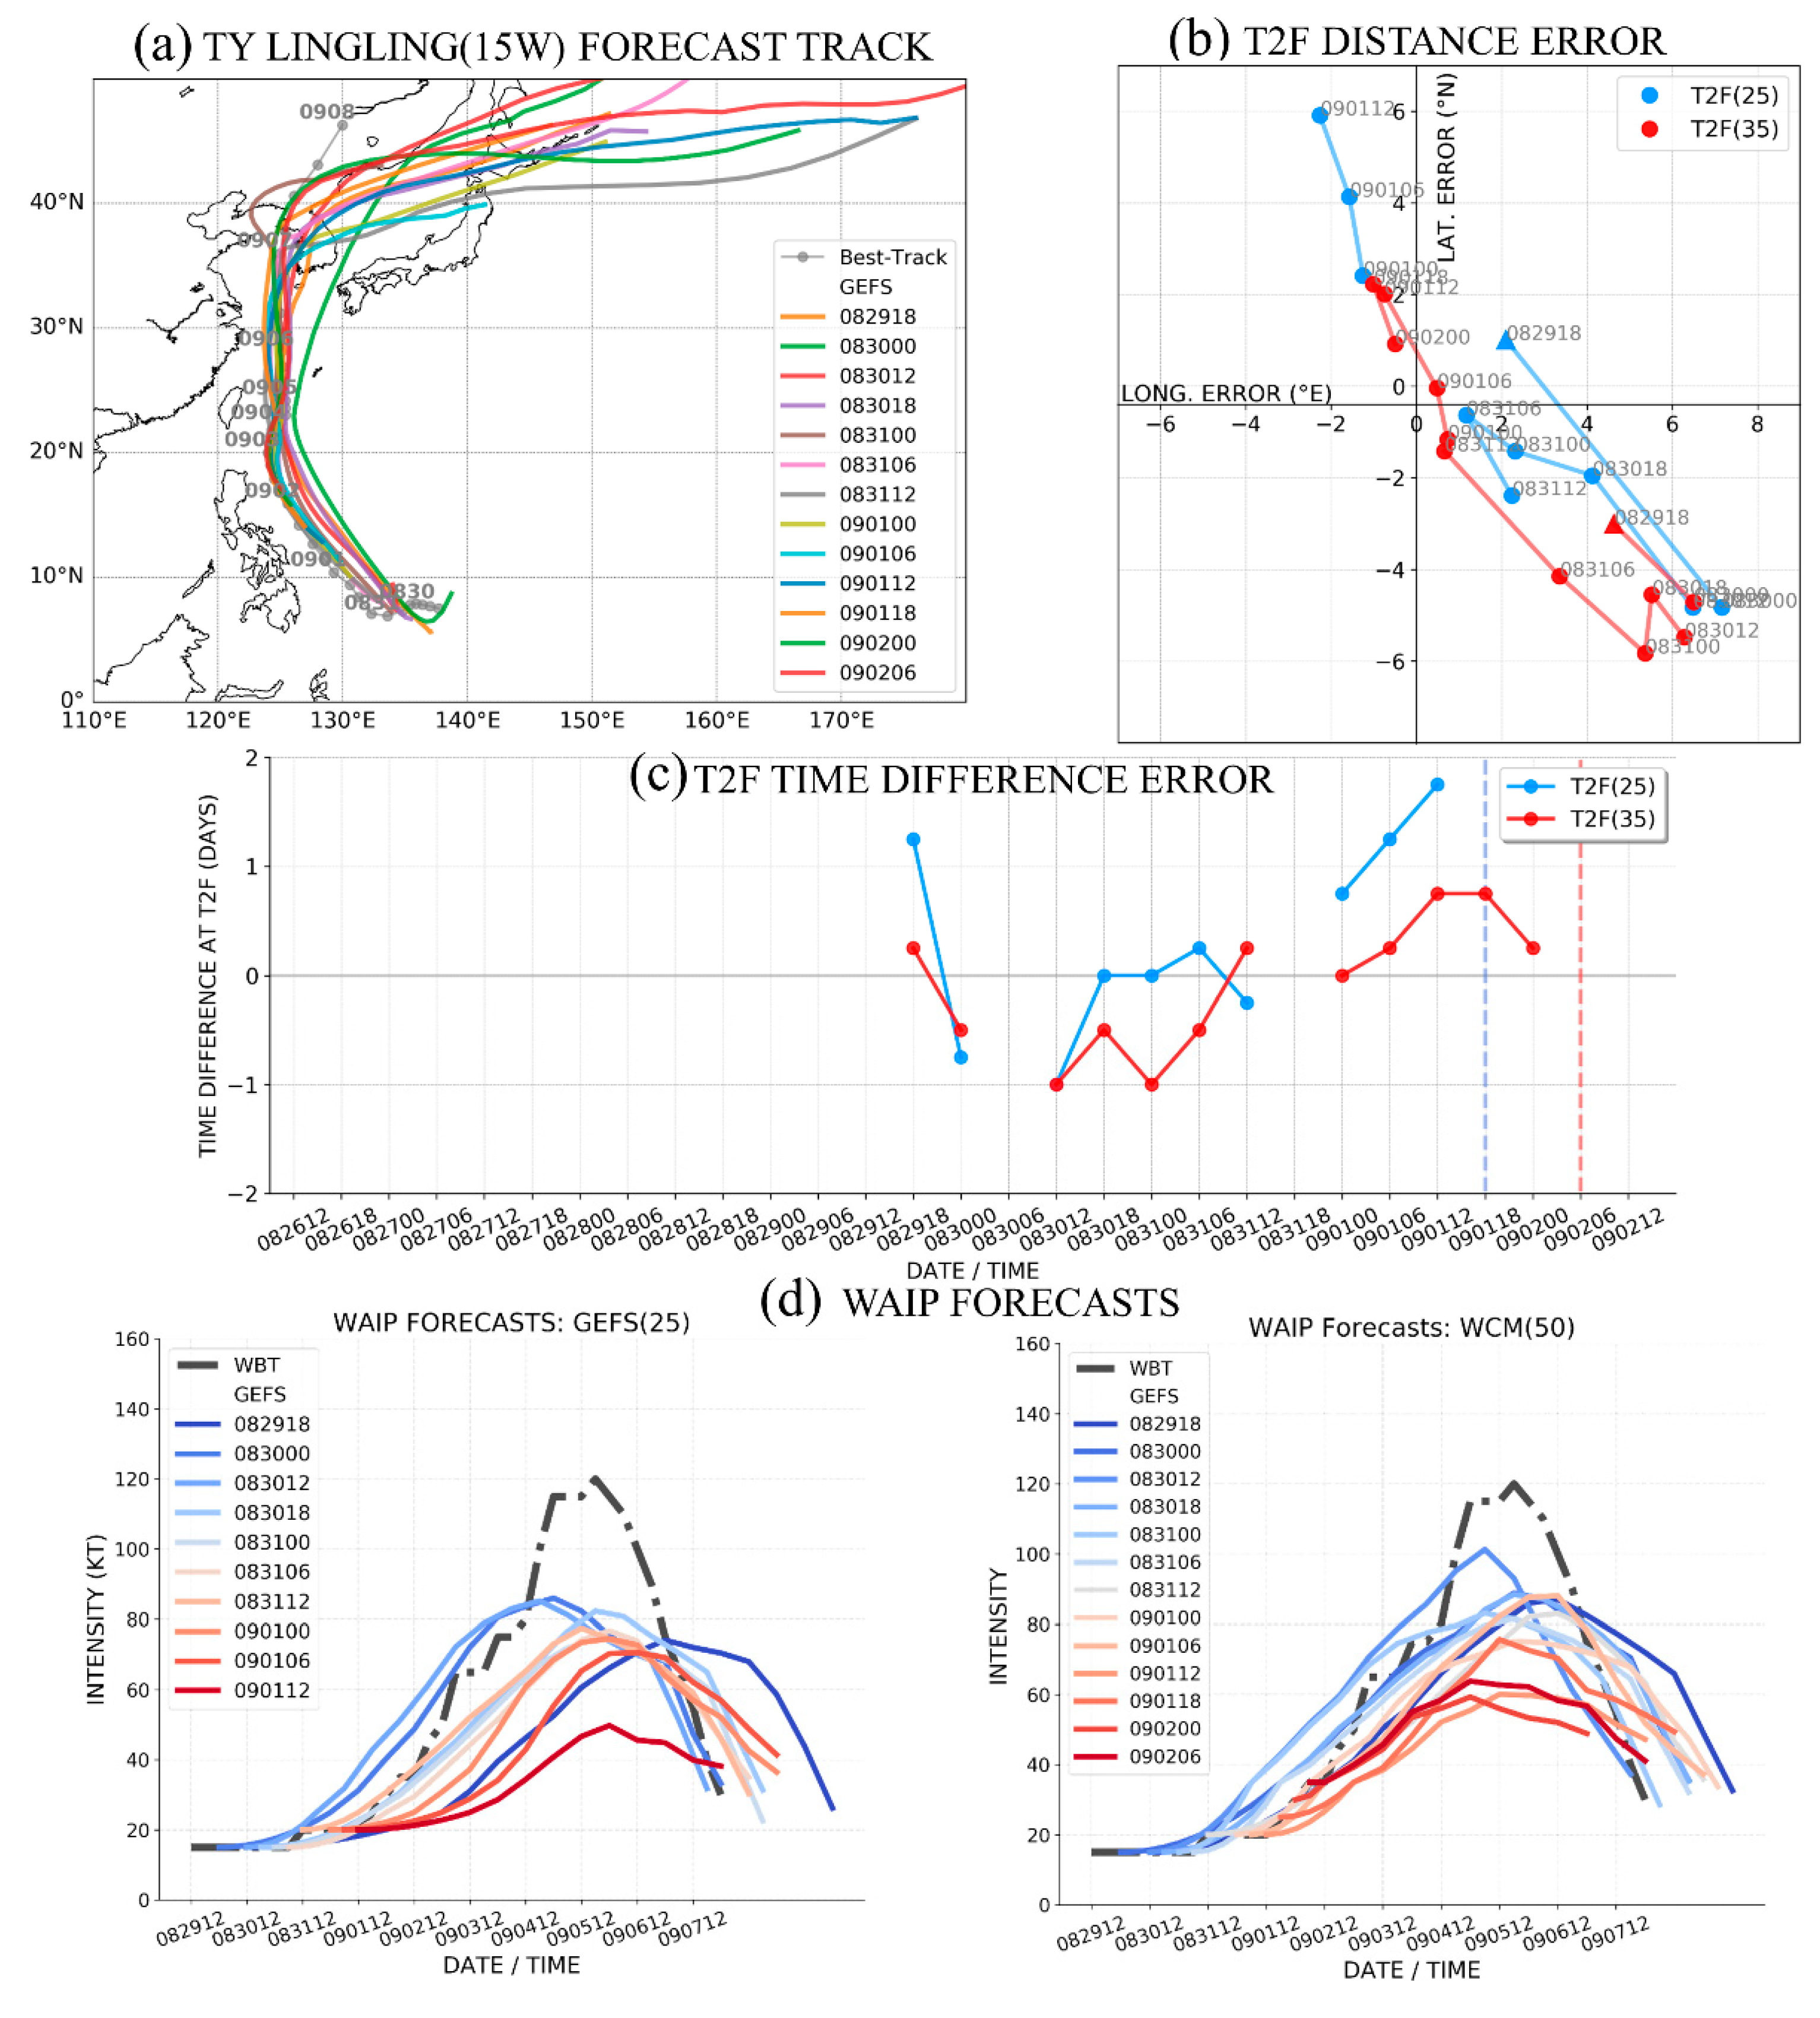
The WCM-T2F prediction from the GEFS forecast from 00 UTC 30 August is provided in
Figure 3. The track forecast has the pre-Lingling circulation in the initial conditions at 8.7° N, 138.7° E with 3 members, but after 12 h, another 10 members have joined and the position has been re-located to 6.5° N, 137.3° E (
Figure 3b). The subsequent track is to the northwest with quite small track spread among the 18 members (of a possible 21), and by 00 UTC 9 September (Day 10), the Lingling position in the GEFS (
Figure 3a) is far to the south of the ECEPS track forecast (
Figure 1a).
A general feature of the GEFS forecasts in the western North Pacific is that the initial GEFS intensity (
Figure 3d, column 4) is too high (at least compared to the initial WCM in column 2), and the intensity changes are larger than for the ECEPS (
Figure 1d). In this example, the GEFS intensity is 17 kt at 083006 when the initial WCM is only 4.7. Furthermore, the intensity change in the next six hours is +5 kt. Consequently, an adjustment is made to the GEFS intensity at the initial WCM time that the initial GEFS intensity of a pre-TC circulation will not be larger than 15 kt, or the Working Best Track (WBT) intensity, if available. These adjusted GEFS intensities are shown in red in column 5 of
Figure 3d, and for this pre-TY Lingling forecast, the T2F(25) is then delayed to 090100 (green box in the summary table at the bottom of
Figure 3), rather than 083106 in the original GEFS intensity prediction (column 4). However, that adjusted T2F(25) time is still 18 h prior to the verifying T2F(25) time of 090118 (green box in column 1 of
Figure 3d).
Another general feature of the GEFS forecasts of the WCM evolution (
Figure 3c,d) is more rapid increases, and therefore a larger WCM threshold must be used to estimate the T2F(35) than in the ECEPS forecast (
Figure 1c). Thus, the two T2F(35) times based on the WCM thresholds are adjusted to be 50 and 55 rather than 25 and 30 for the ECEPS. Although not applicable in this case, the initial GEFS WCM values are occasionally large negative (cold core) values, and therefore, in these cases, an adjustment is made to begin the WCM values at 0.0. If an adjustment had been made, the negative value would have been in blue in column 3 of
Figure 3d to go with the positive WCM values in red. For this GEFS forecast, the two T2F(35) times based on WCMs exceeding 50 and 55 are both 090118 (blue boxes in the summary table at the bottom of
Figure 3) because of the rapidly increasing WCM values (see
Figure 3c). Thus, the T2F(35) errors relative to the verifying time of 090206 (blue box in column 1 of
Figure 3d) are both 12 h early. The larger WCM thresholds for a T2F(35) in the GEFS also then required a larger WCM threshold (83.0) for the Likely Storm Category of Typhoon, which is surpassed in this GEFS forecast with a maximum WCM of 136.0 (summary table at the bottom of
Figure 3).
The WAIP Ending Times (last three entries in the summary table at the bottom of
Figure 3) for the T2F(25) is +7 days (090800) since that is the time along the WMVM track forecast for matching the historical analog tracks. However, for the T2F(35)-related WAIP intensity forecasts, the WAIP Ending Time is determined by the extratropical transition time, which is diagnosed as the time of the last positive WCM value in
Figure 3c. Since both T2F Ending Times are the same, the WAIP Ending Times of 090818 are the same.
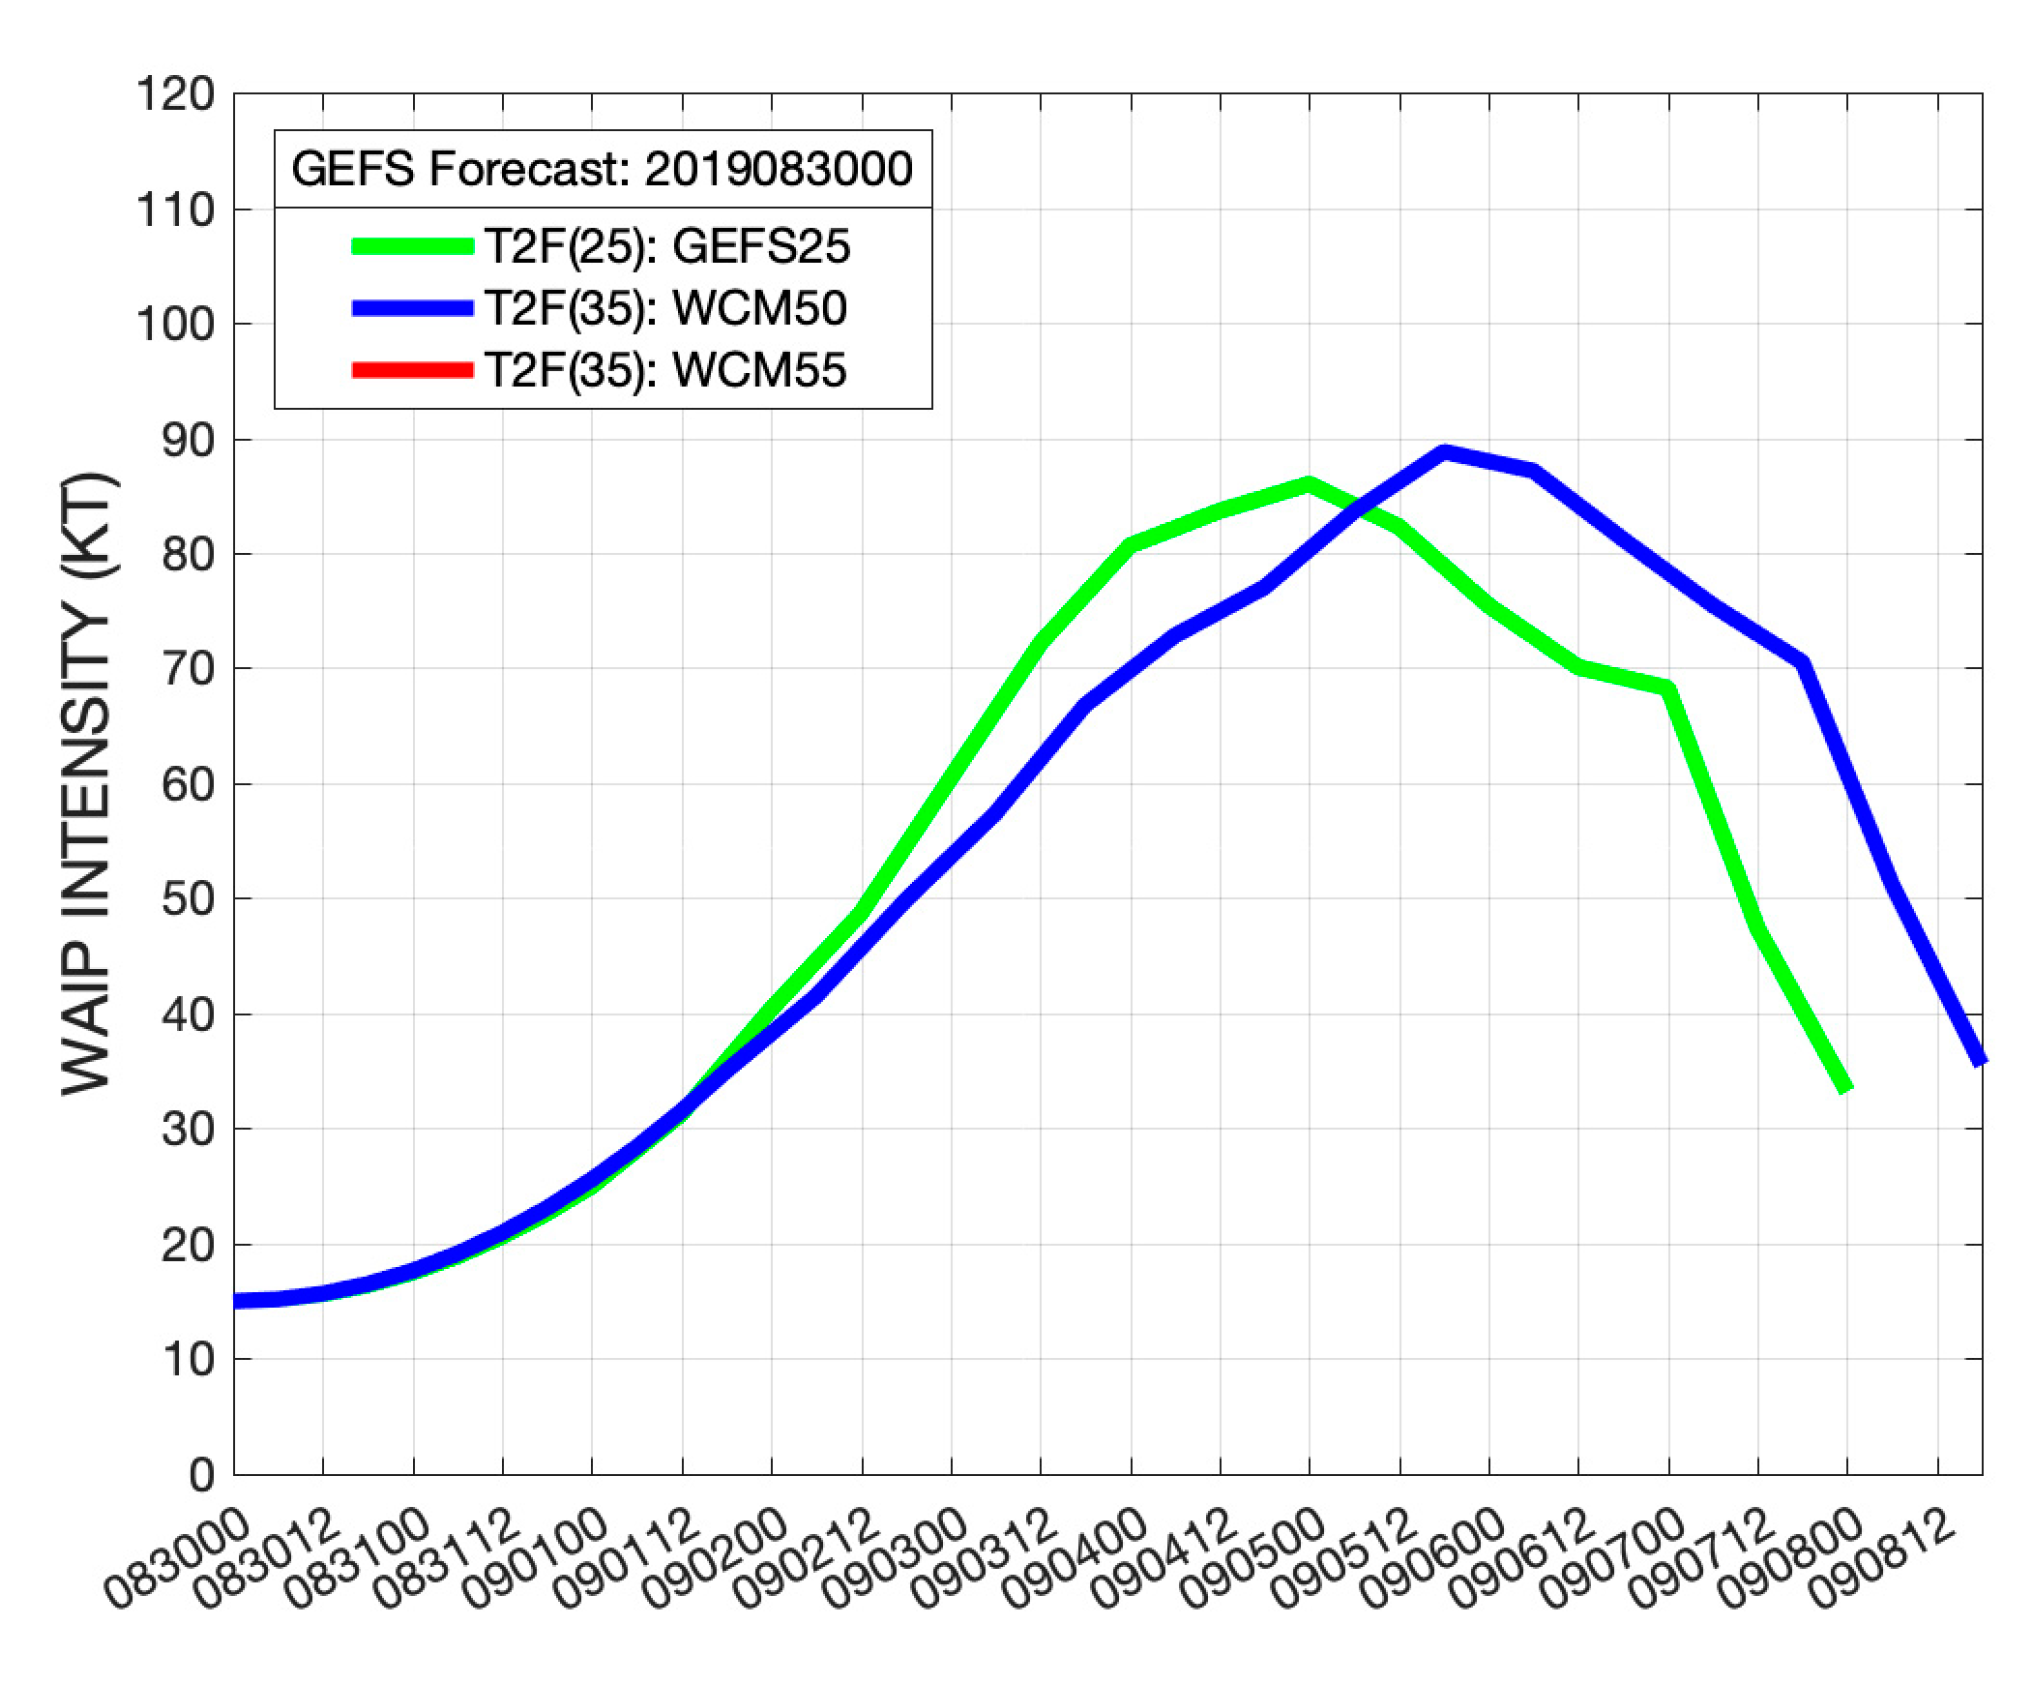
The three combined WAIP intensity forecasts based on the three GEFS-predicted T2Fs and the WMVM track forecast in
Figure 3a are shown in
Figure 4, except that the normally later T2F(35) based on the WCM > 55 is not shown as it is identical to the T2F(35) based on the WCM > 50. Both of these intensity forecasts begin at 15 kt since a WBT intensity is not available. Because the WAIP analogs selected for the T2F(25) have intensity changes from 25 to 35 kt that are similar to the square function between the initial 15 and 35 kt, these two intensity forecasts are identical between 15 and 35 kt. Even though the T2F(25) intensity forecast then has an earlier peak intensity than the T2F(35) intensity forecast, the peak intensities are within 5 at 85 kt, and 90 kt. As for the ECEPS-based WAIP peak intensities in
Figure 2, it is noteworthy that these GEFS-based WAIP peak intensities are clearly of typhoon strength, which confirms/supports the Likely Storm Category of Typhoon (see the summary table at the bottom of
Figure 3).
3.1.2. ECEPS and GEFS Forecasts of T2F and Intensity of TS Peipah (17W)
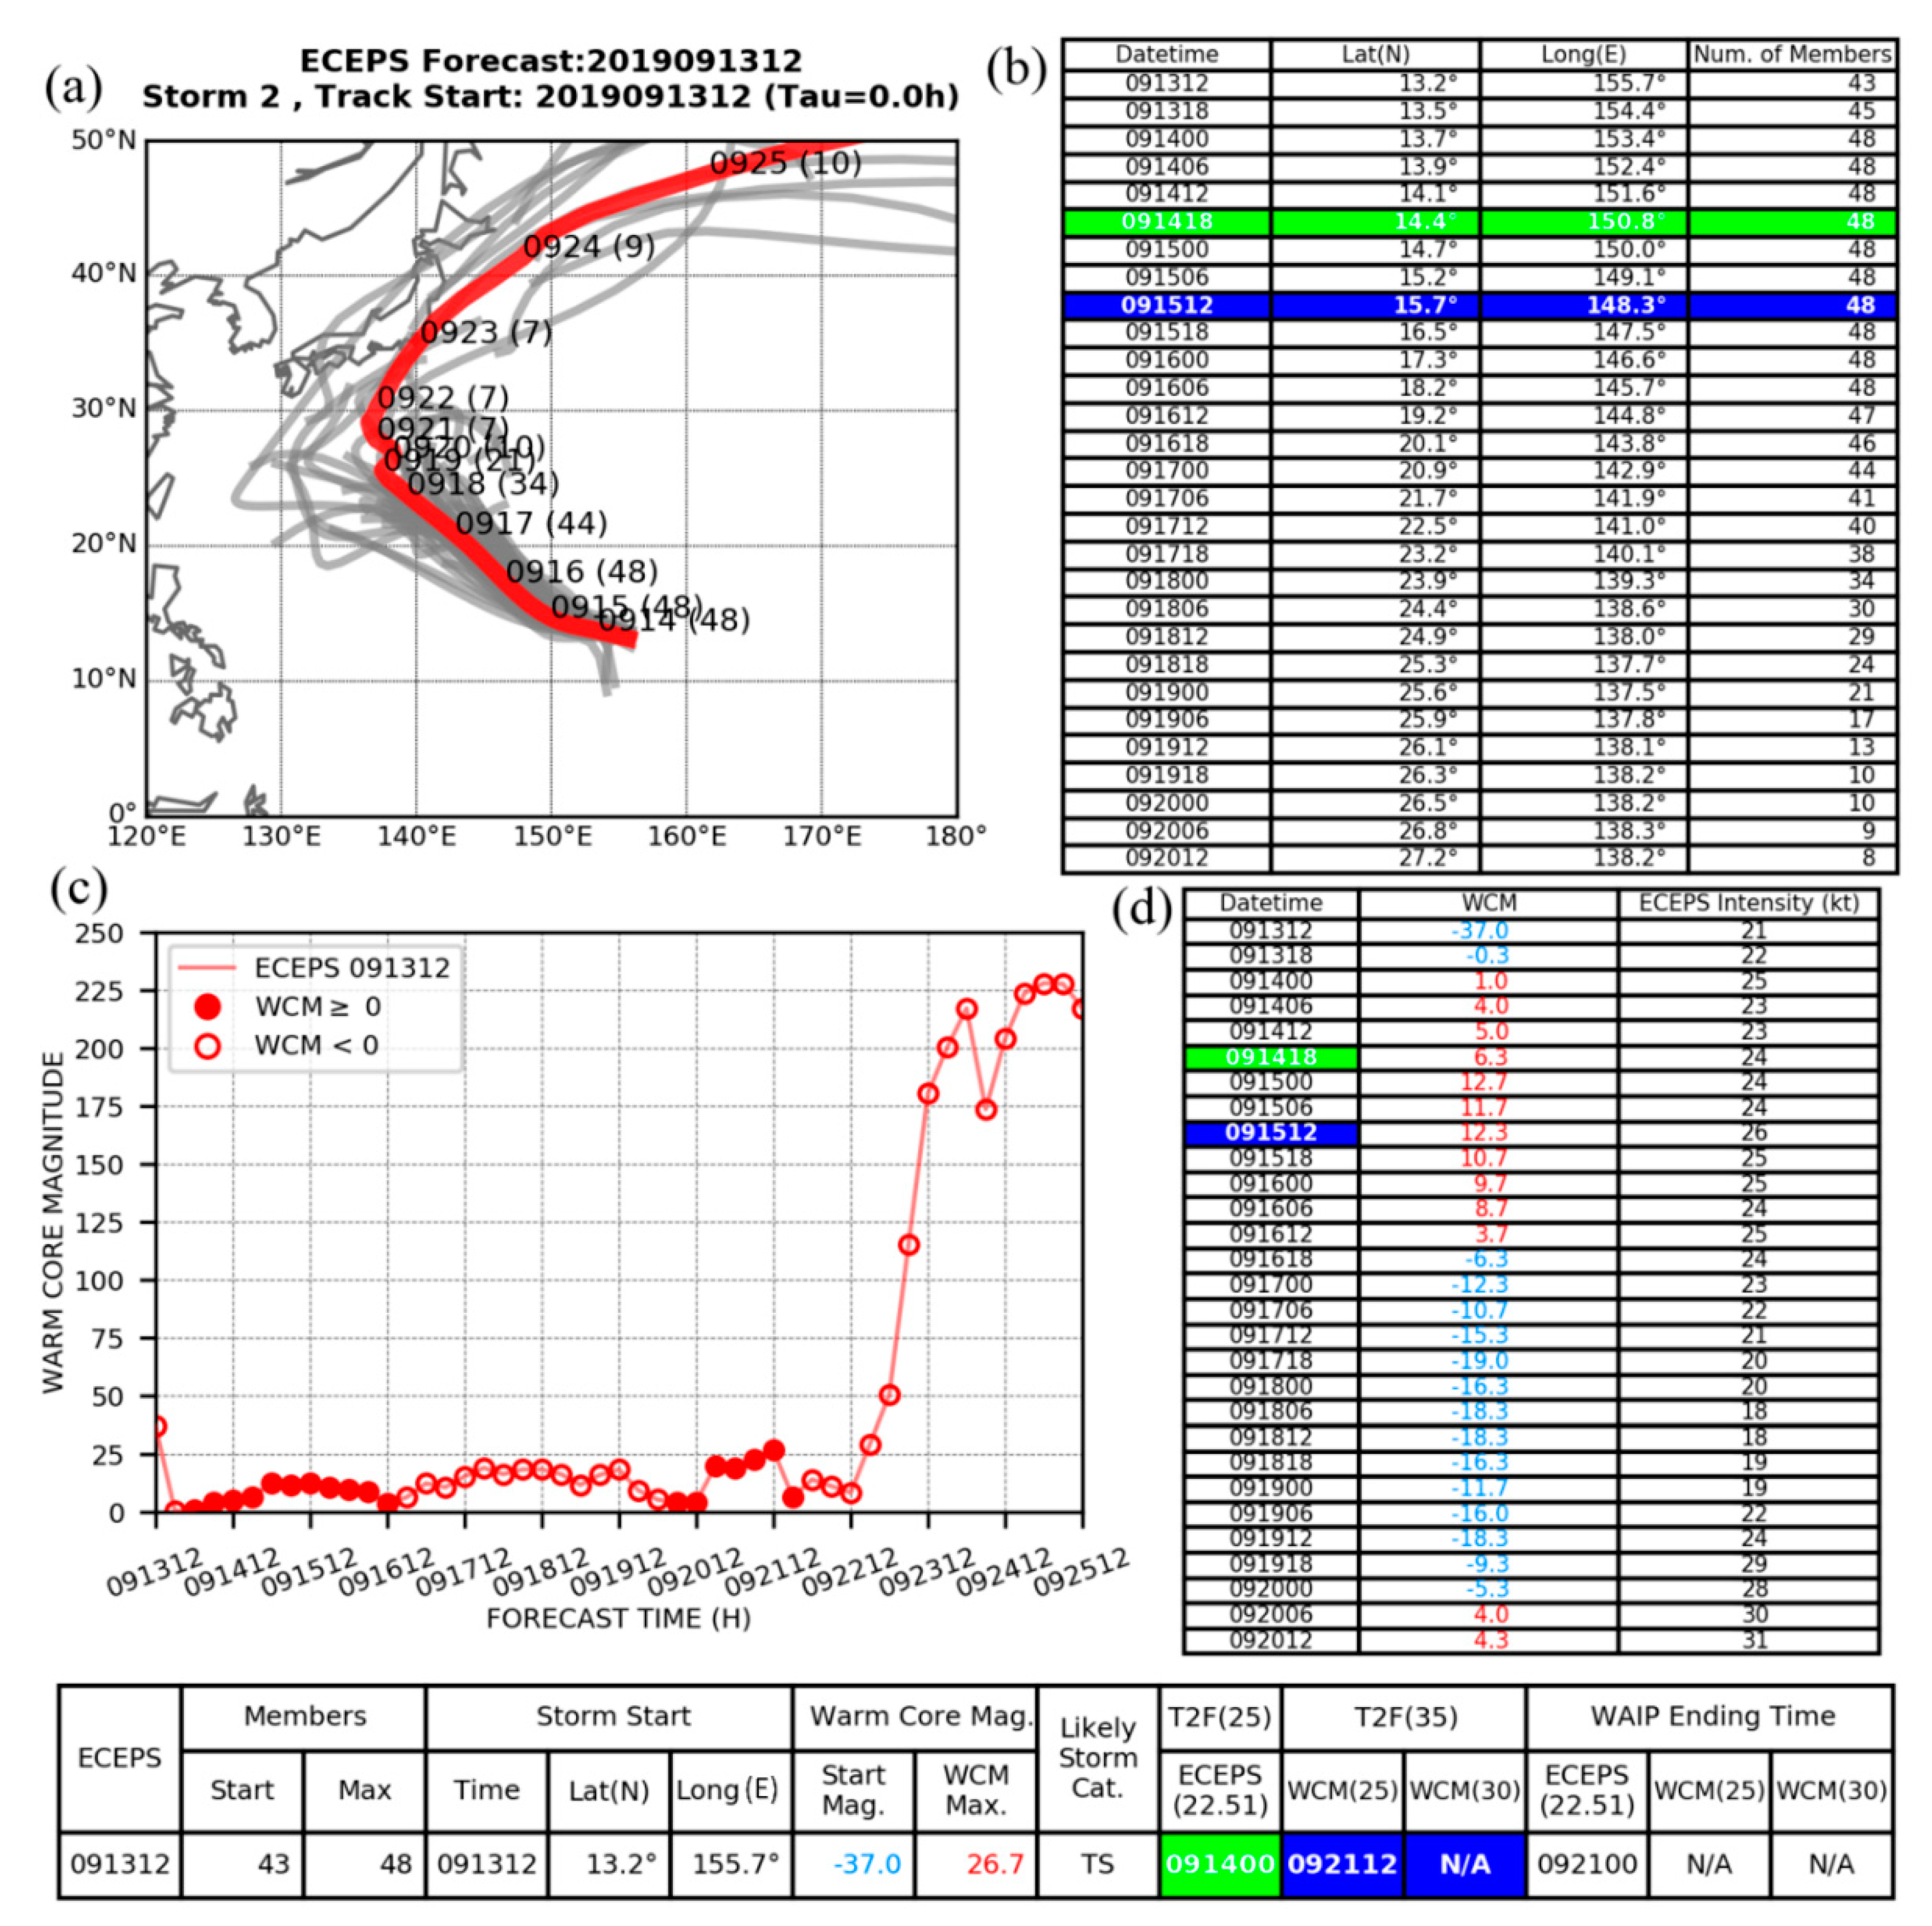
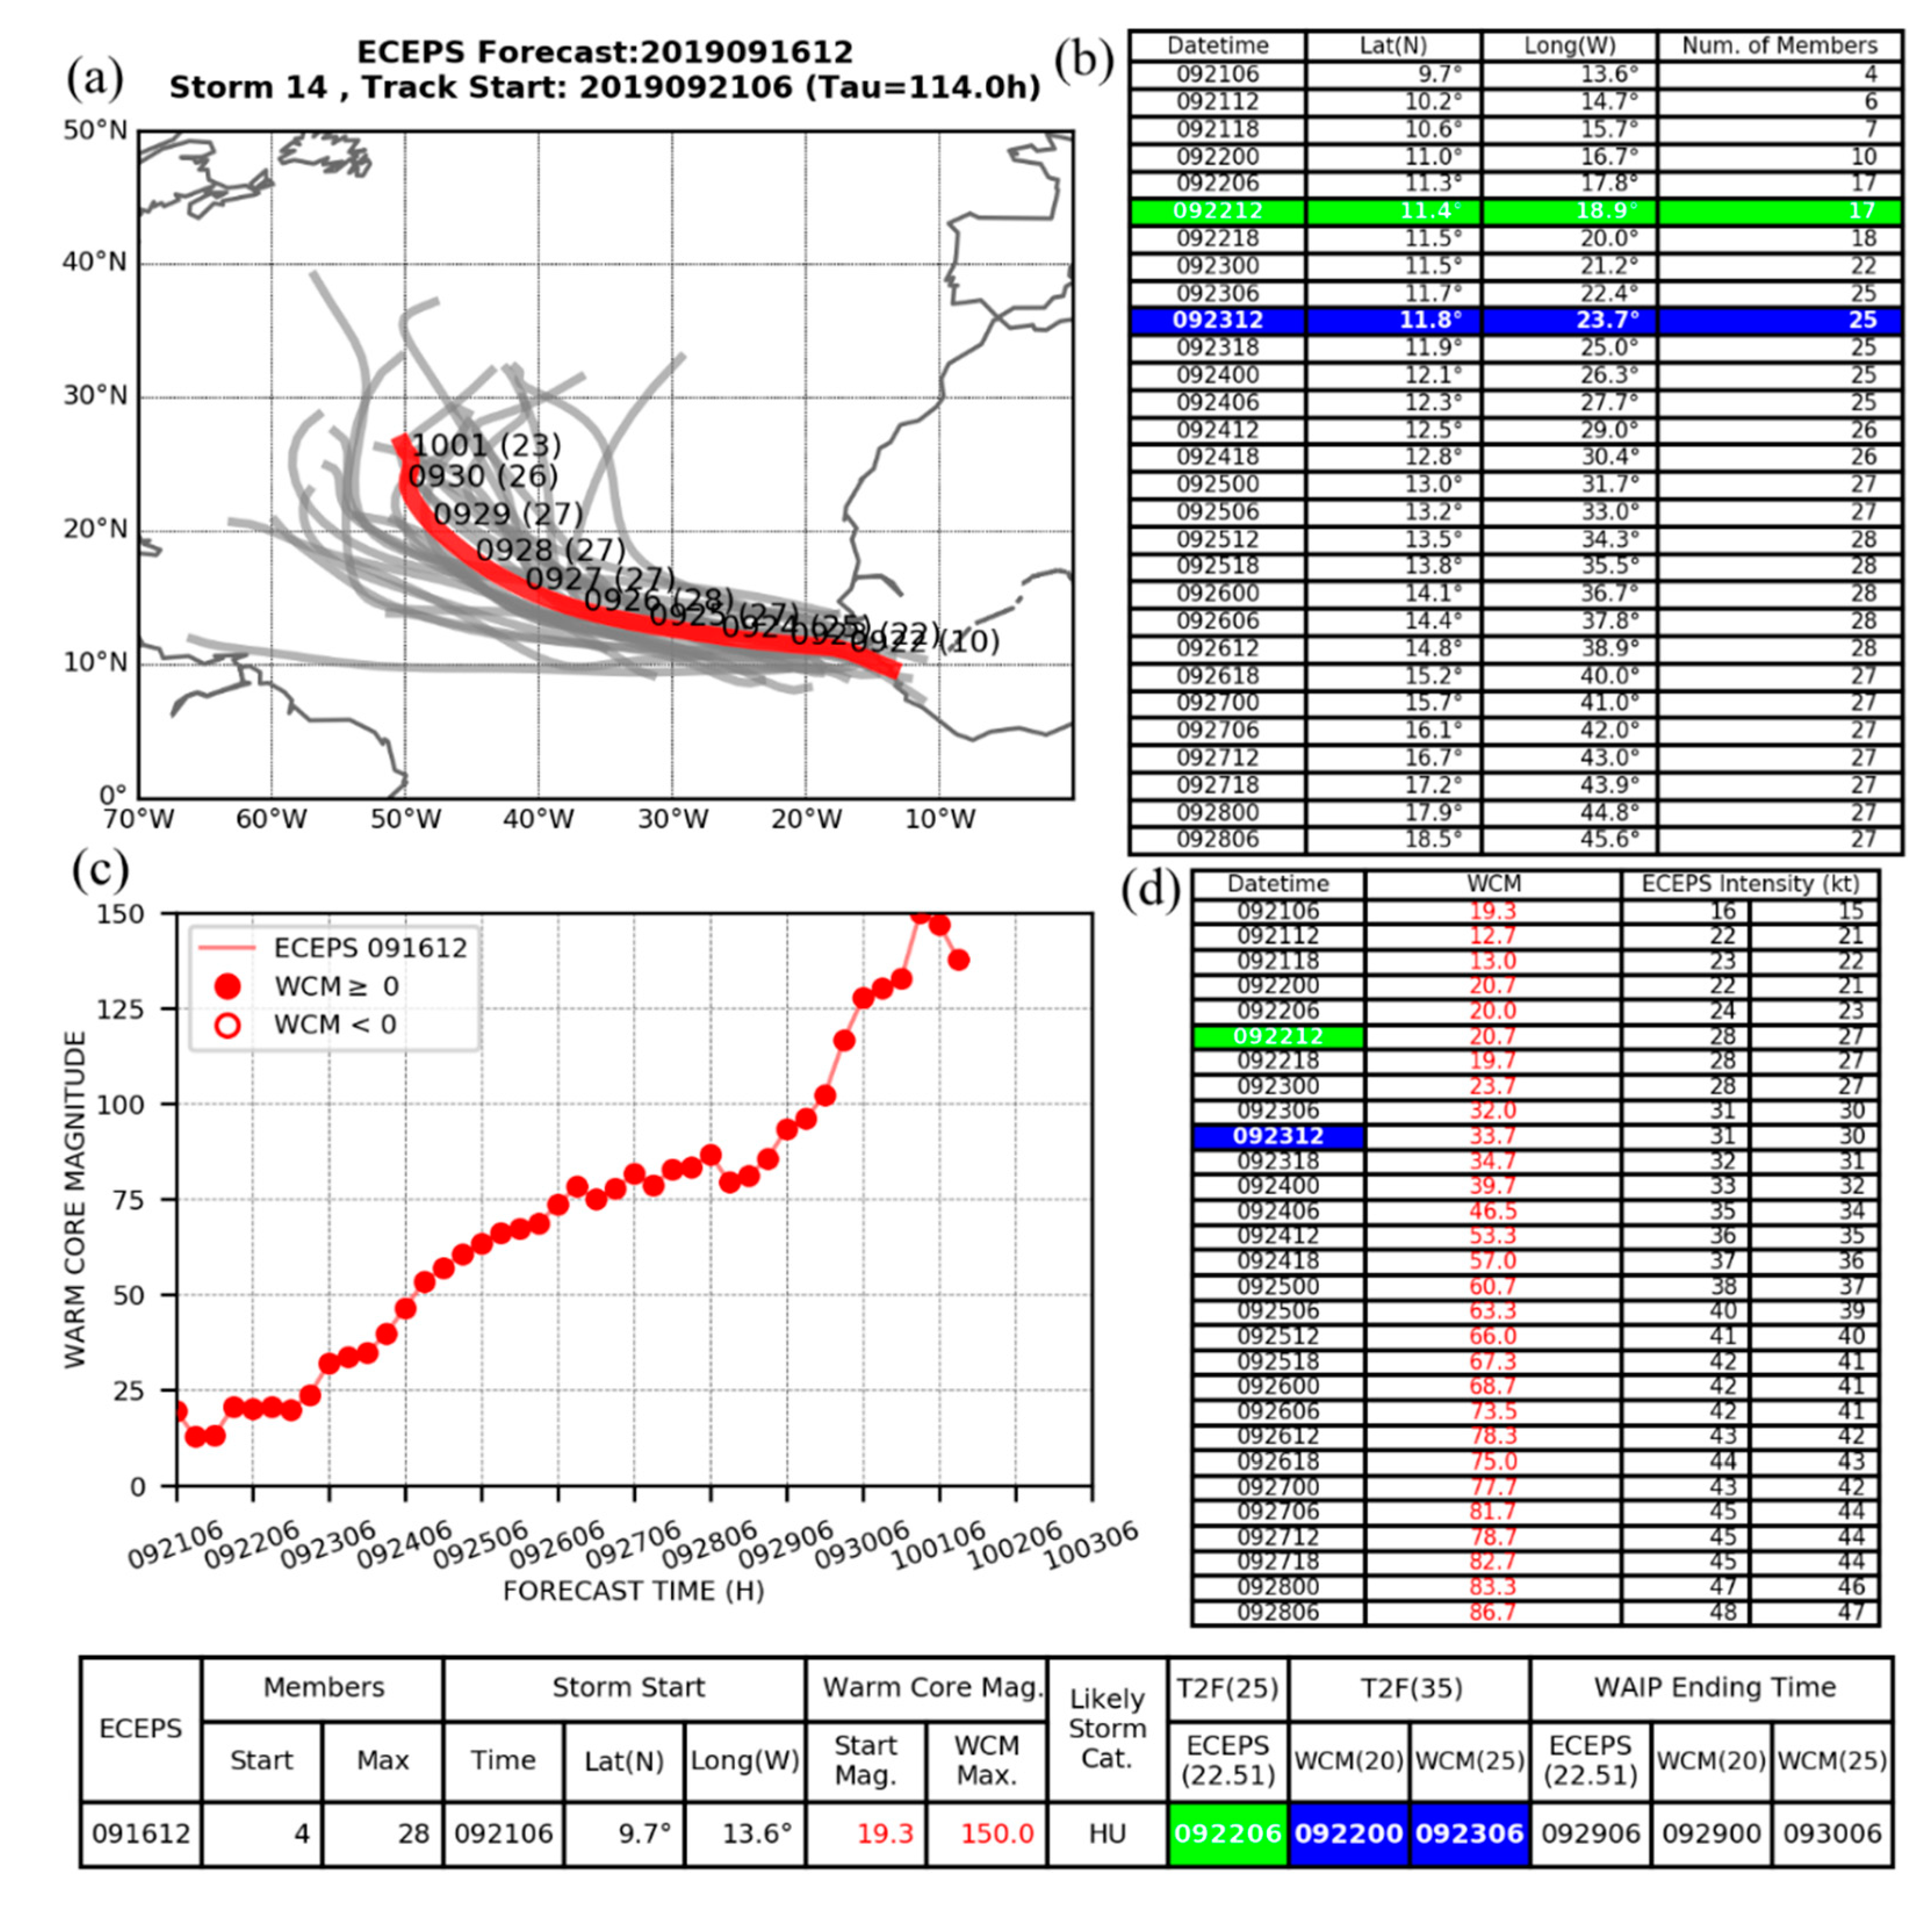
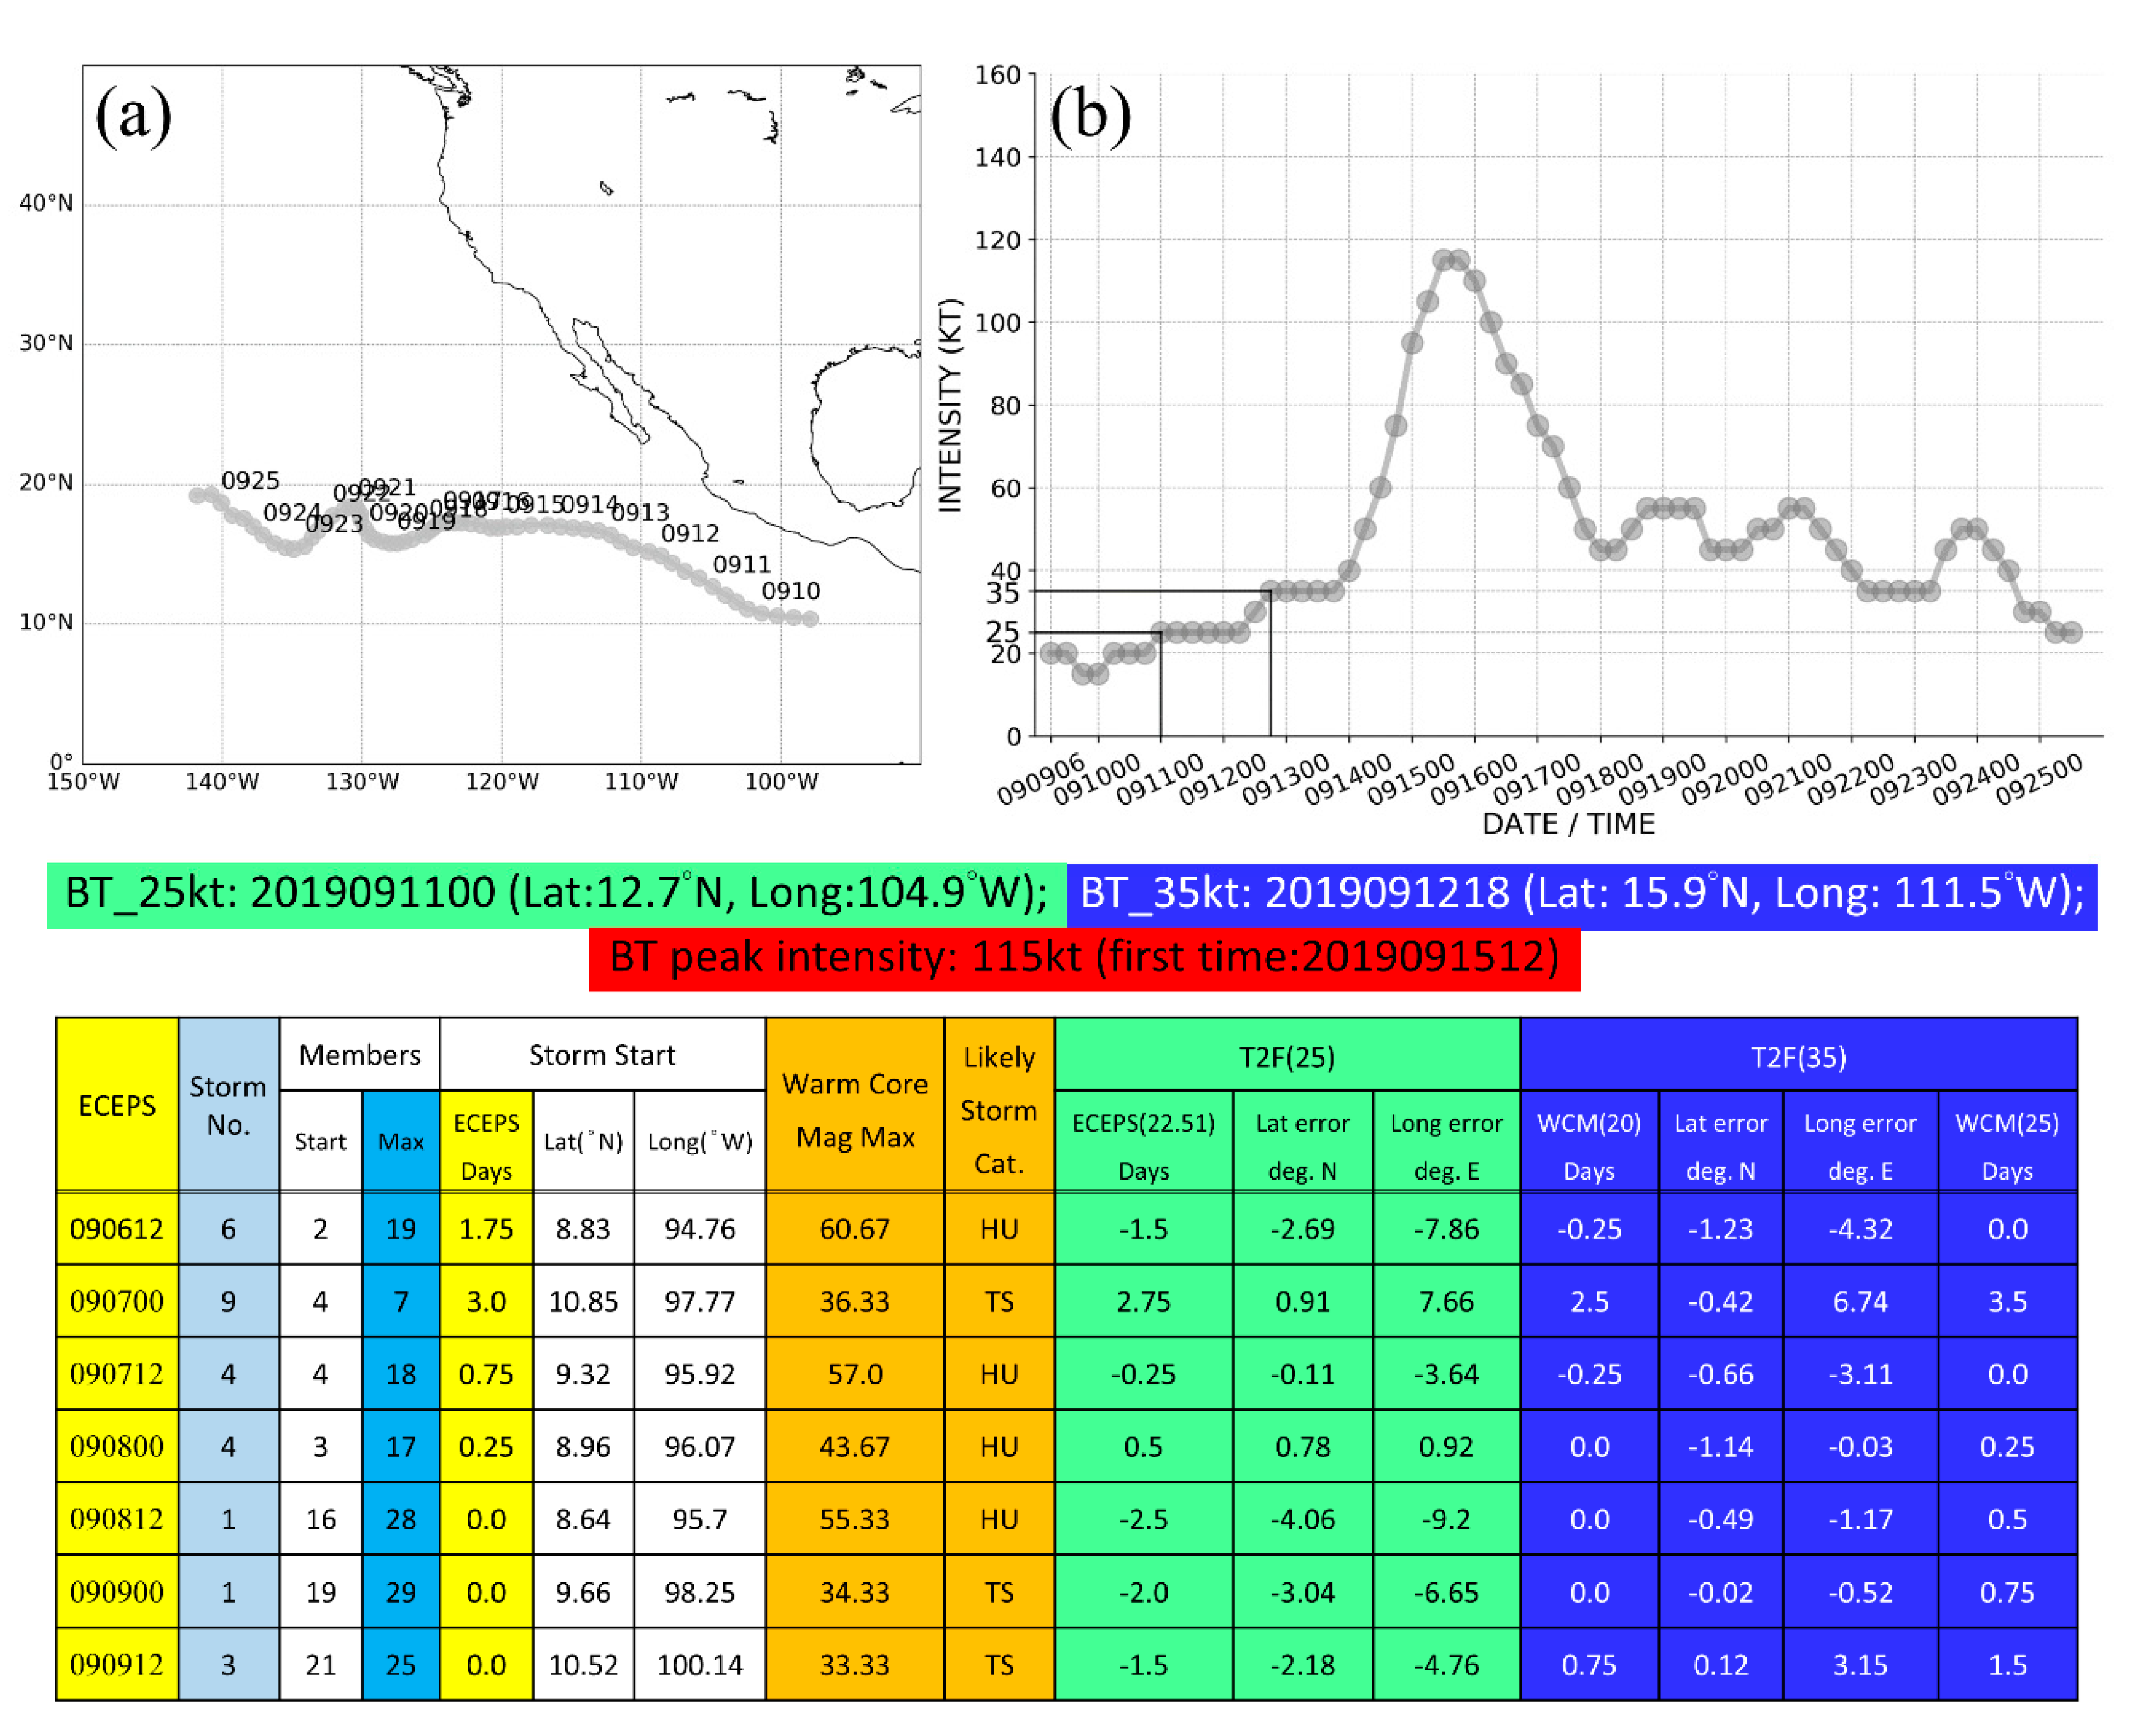
In the ECEPS forecast from 12 UTC 13 September 2015, the WMVM track forecast (
Figure 5a, red line) has the pre-TS Peipah (note that the peak intensity was 35 kt) circulation in its initial conditions at 13.2° N,155.7° E, and 45 of a possible 51 members are initially included in the WMVM track (
Figure 5b, line 1). The number of members increases to 48 by the verifying T2F (25) time of 091418 (
Figure 5b, green boxes) and verifying T2F(35) time of 091512 (blue boxes). However, the number of members subsequently decrease rapidly such that by 092012, there are only 8 members included in the WMVM track forecast (
Figure 5b, last line). While this ECEPS track forecast in the middle of September might, from climatology, seem to represent a potential typhoon, the rapid loss of members should alert the forecaster to examine inhibiting physical processes.
Note that the initial ECEPS intensity was 21 kt (
Figure 5d, column 3), and the T2F(25) was achieved in 12 h (green box in summary table at bottom), which is actually early by 18 h. Although the weighted-mean intensity did increase to 26 kt at 091512, the ECEPS intensity then decreased to 18 kt at 091806, which again should alert the forecaster to examine inhibiting physical processes.
However, the weighted-mean WCM evolution in
Figure 5c, and the digital values in column 2 of
Figure 5d, indicate that the initial circulation in this ECEPS forecast has a cold core (negative WCM). Even though the circulation becomes a warm core within 12 h and has a maximum positive WCM value of 12.7 at 091500 (12 h before the verifying T2F(35), blue box), this magnitude does not meet even the smaller WCM = 25 threshold for a T2F(35). Although a maximum positive WCM = 26.7, which corresponds to a Likely Storm Category of TS (see columns 8 and 9 in the summary table at the bottom of
Figure 5), is predicted much later (092112, blue box at bottom), this is not within the 7-day window to make a WAIP intensity forecast.
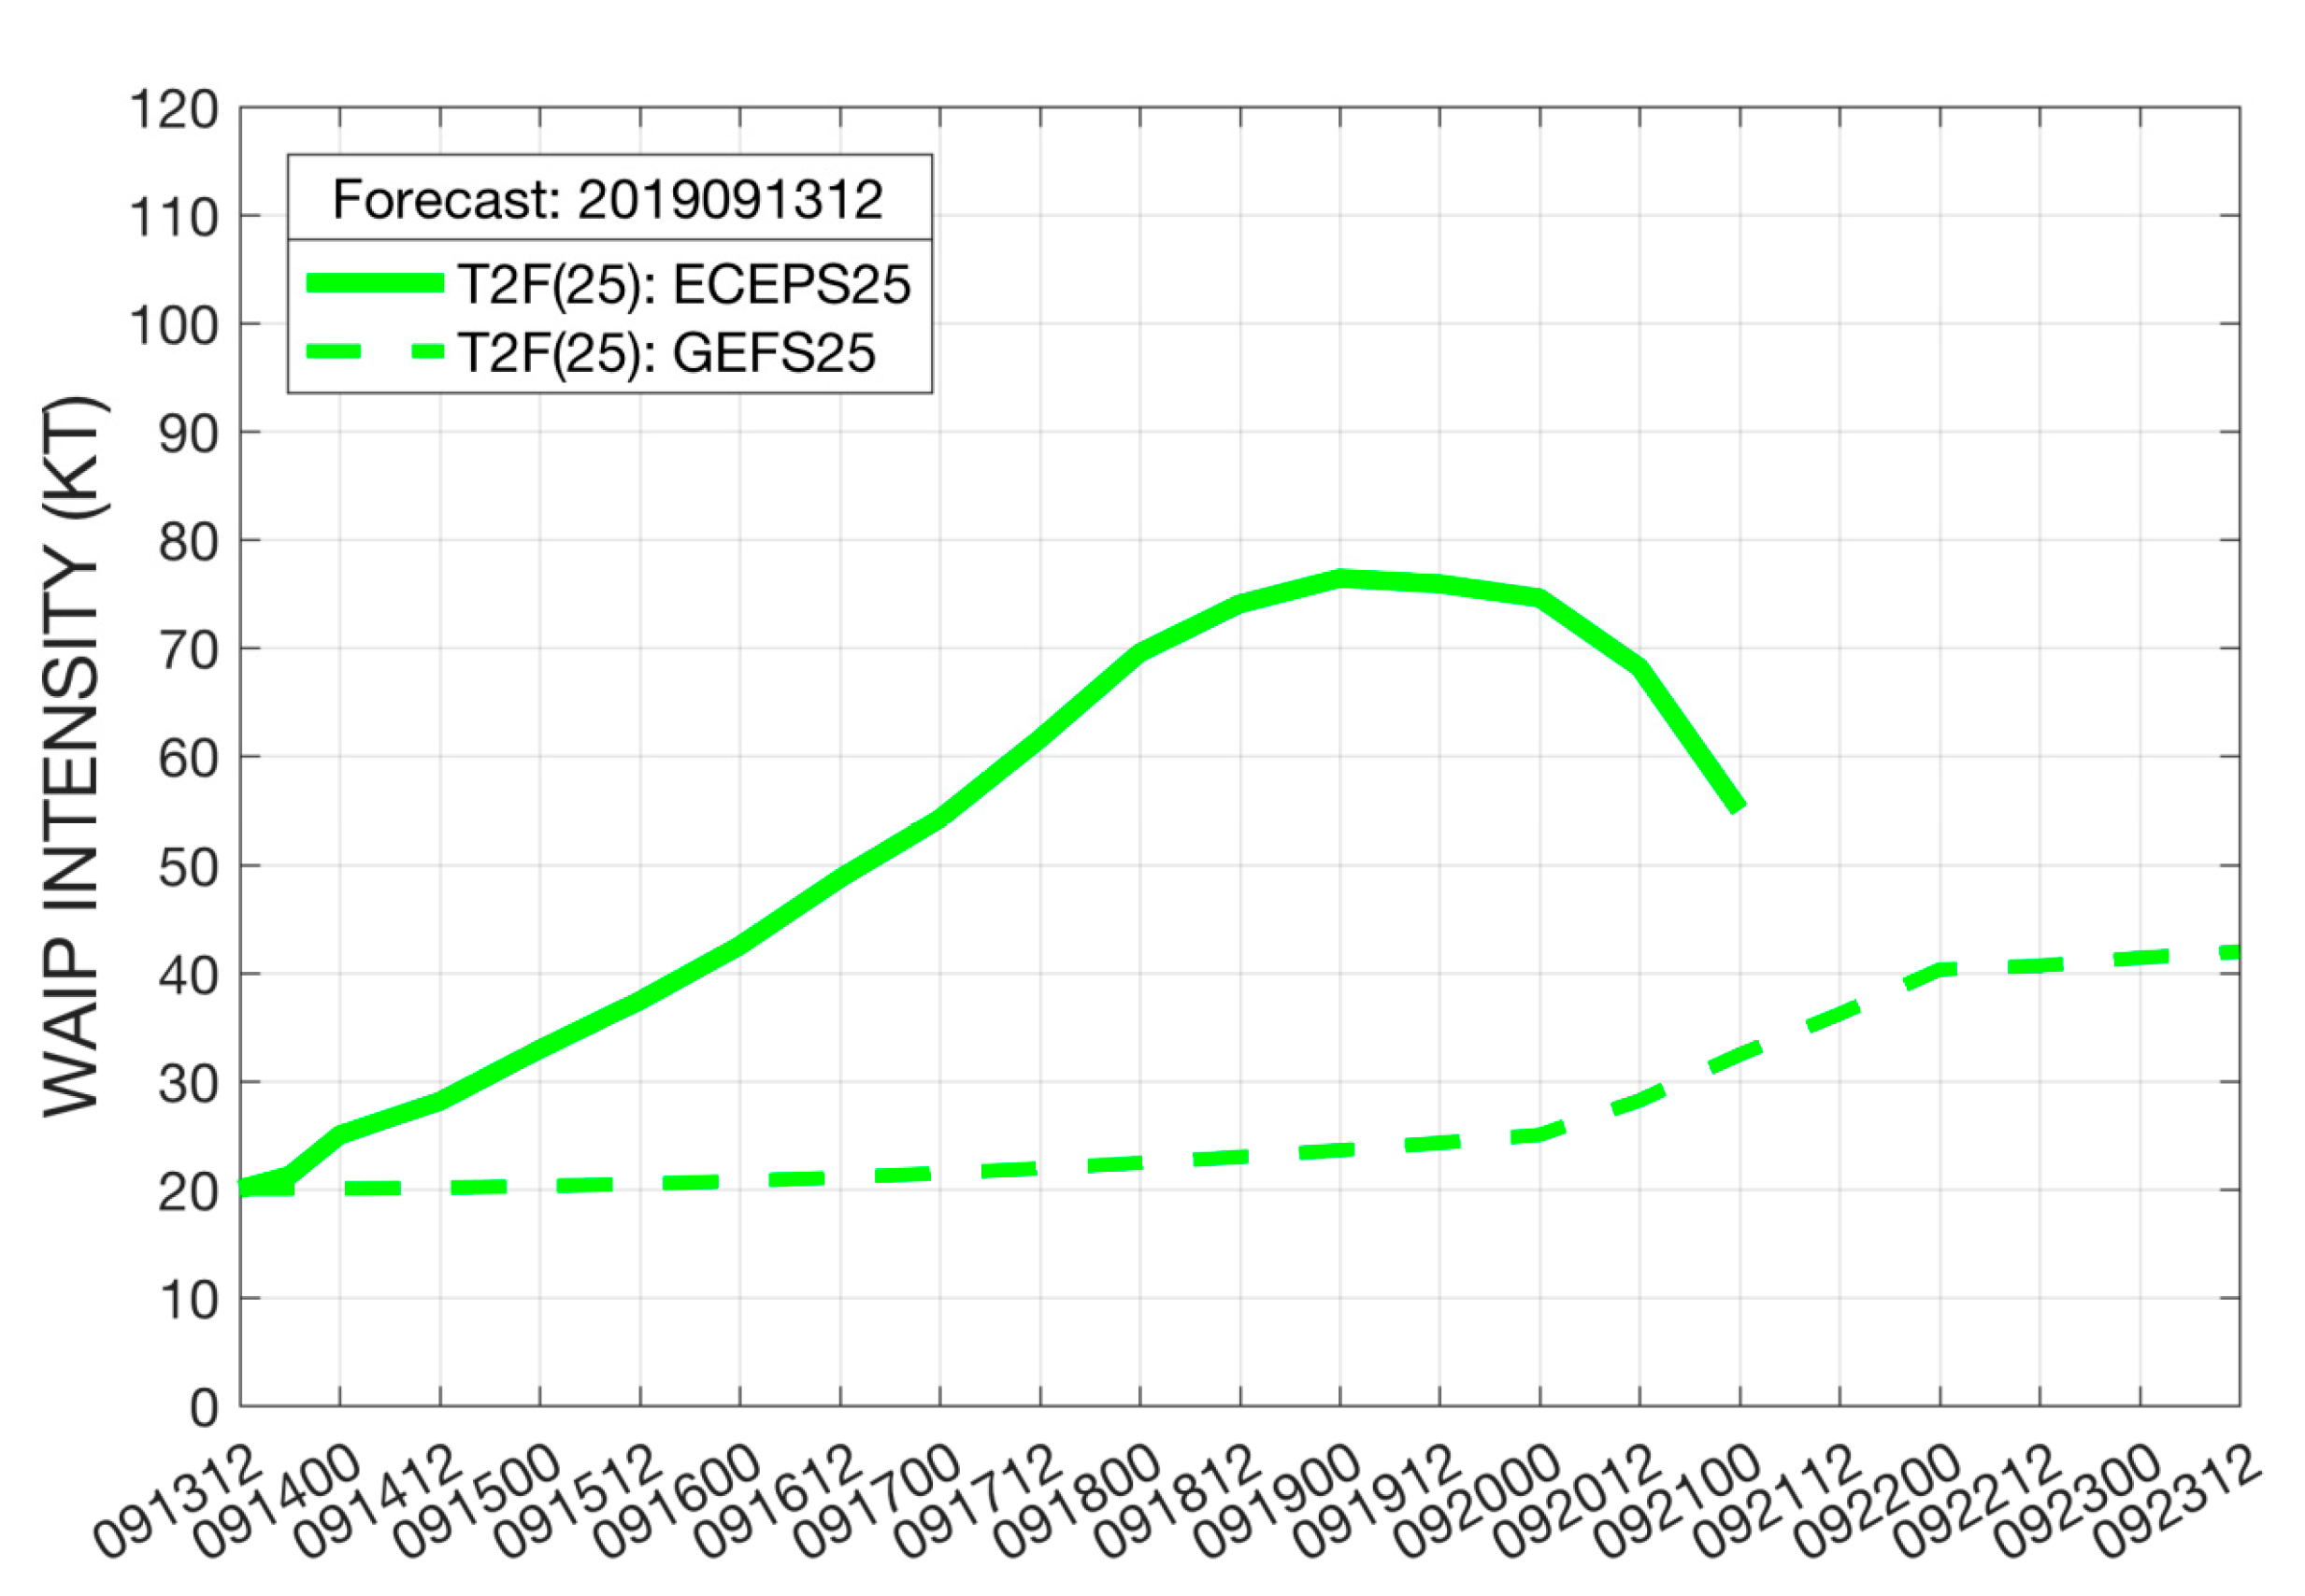
Consequently, the only WAIP intensity forecast is for the T2F(25) time, and then the WAIP Ending Time is 092100, which is 7 days after the T2F(25) time. The initial intensity of 20 kt is from the WBT, and the 16 analogs are selected to match that initial intensity and match the WMVM track in
Figure 5a between 00 UTC 14 September and 00 UTC 21 September (at which time the circulation would be near the Kuroshio ocean current). Since all storms in the JTWC historical files from which the WAIP analogs are drawn have an intensity of at least 34 kt, the WAIP intensity prediction for this ECEPS forecast increases to a maximum of 75 kt (
Figure 6, solid green line). In this case, it would be advisable that the forecaster disregard this WAIP prediction in view of more reliable guidance of a maximum intensity of TD based on the WCM evolution in
Figure 5c.
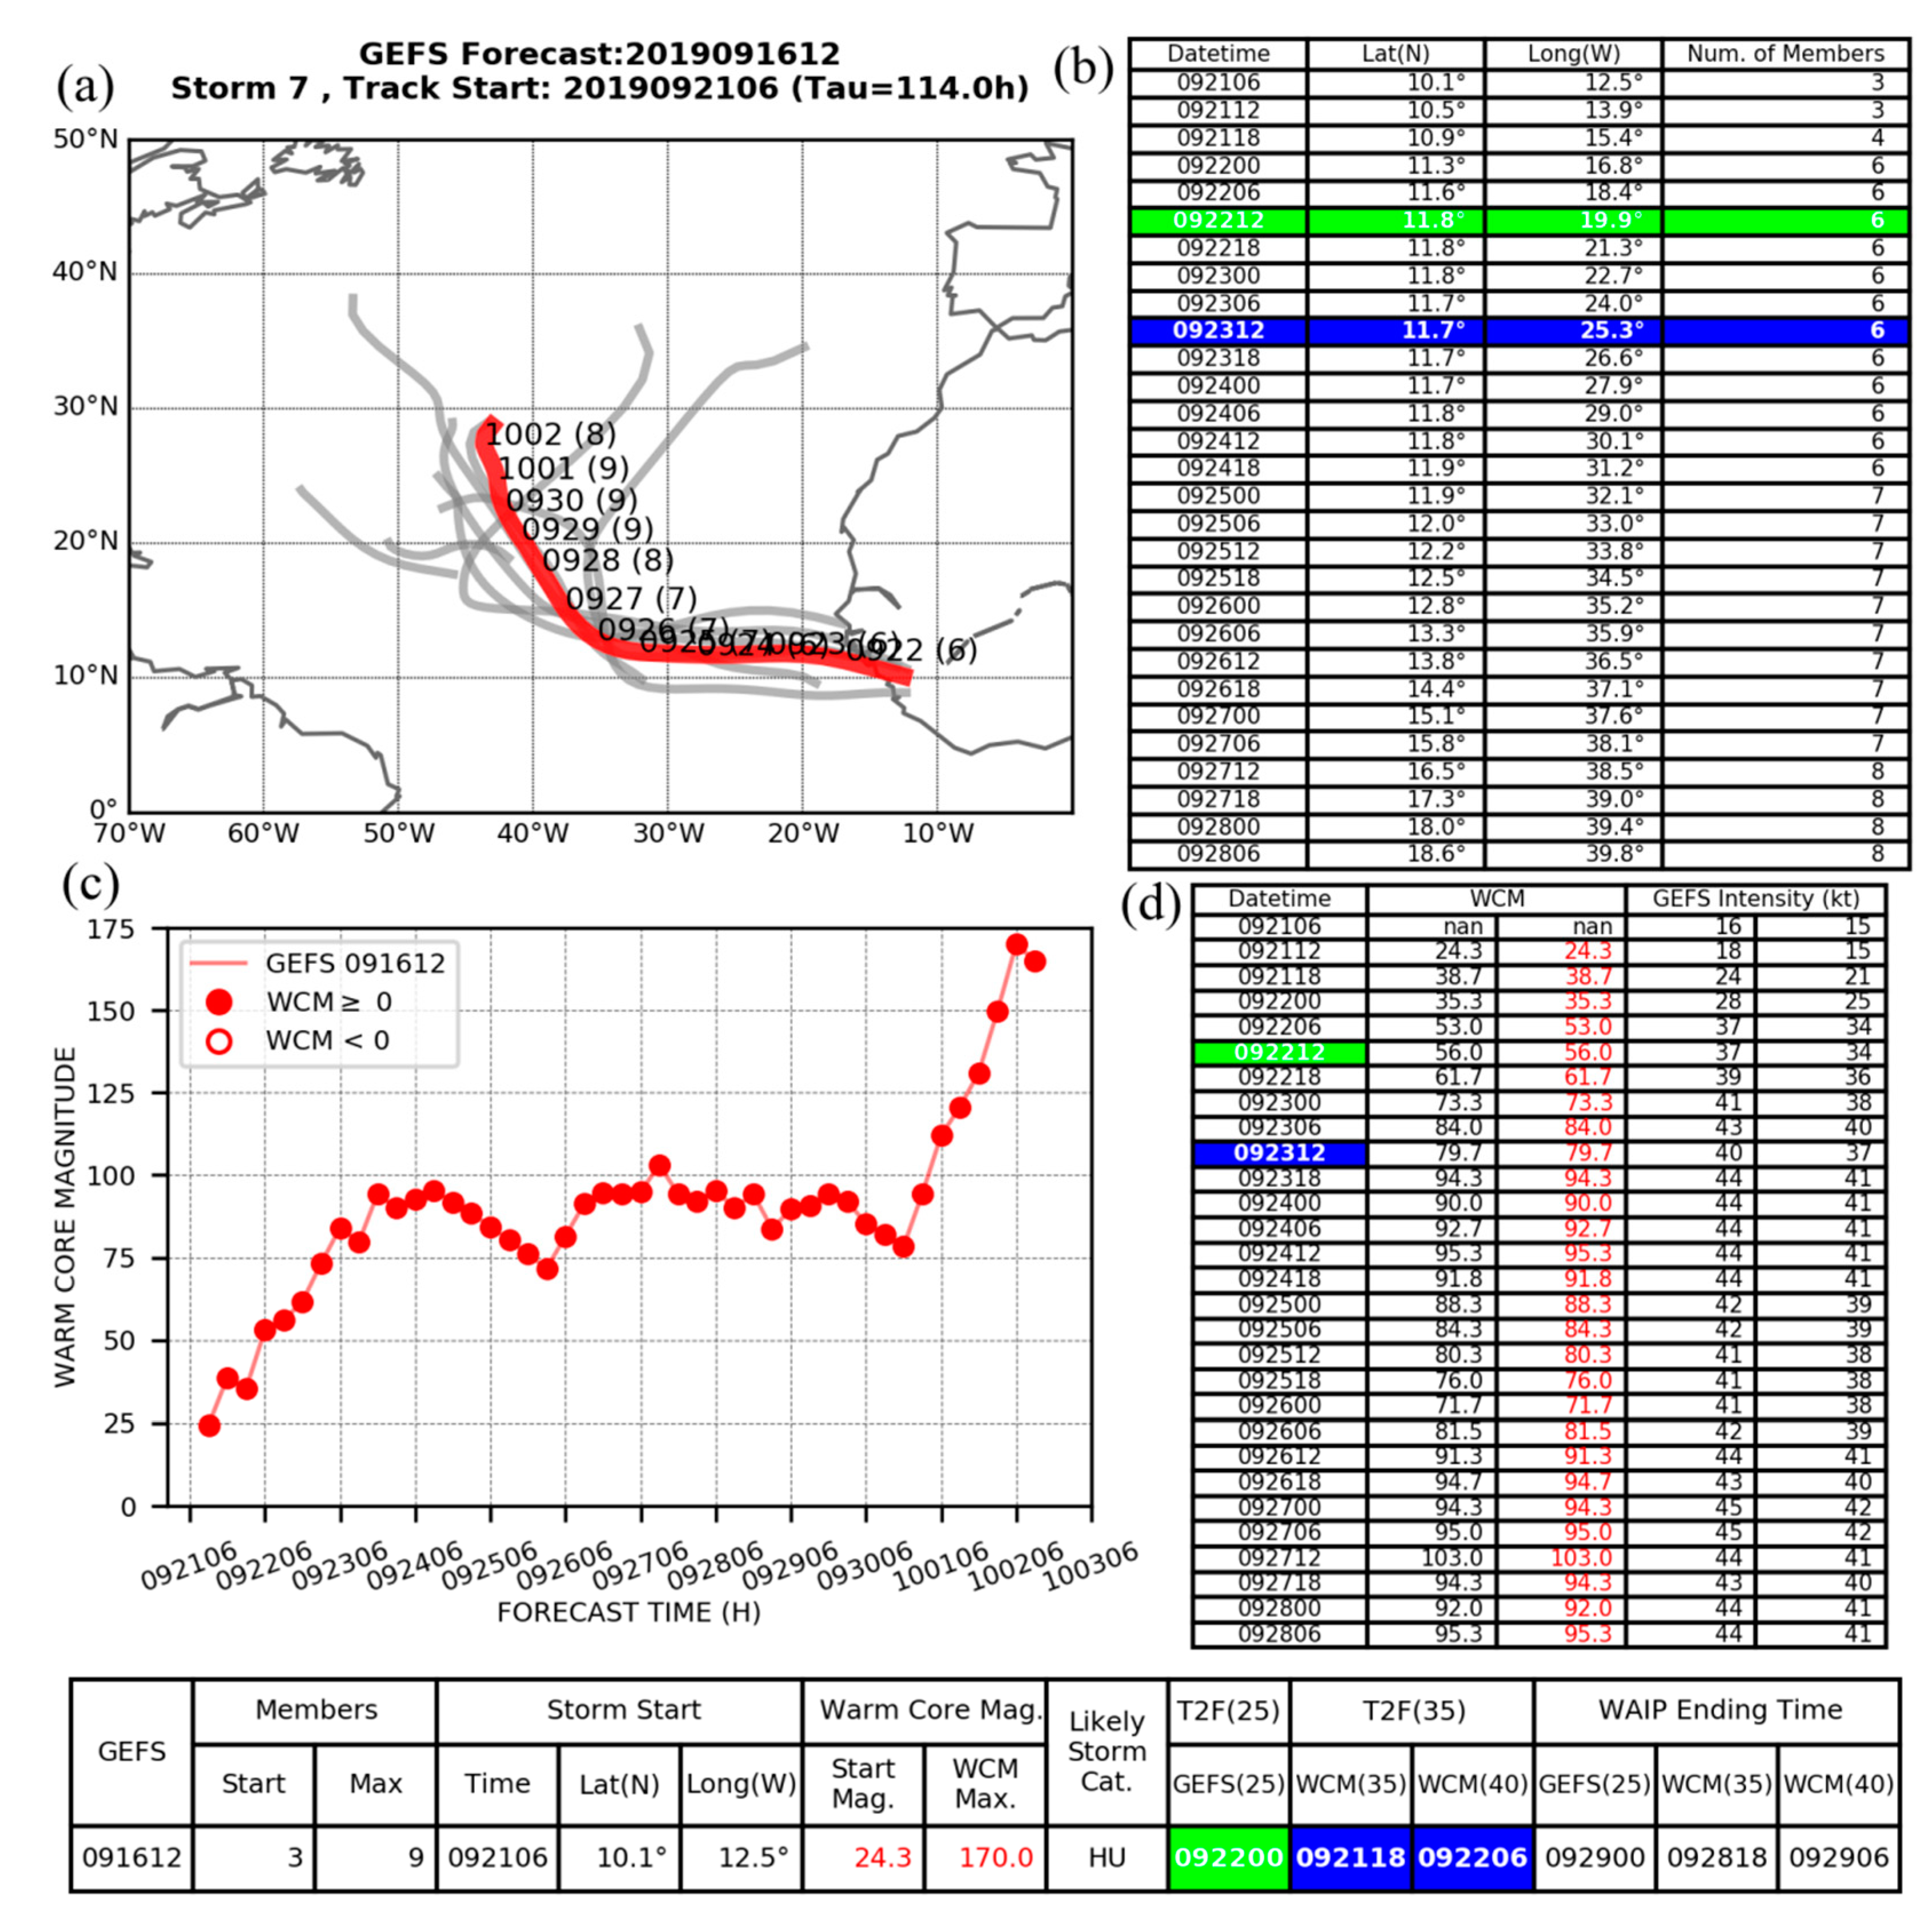
The GEFS WMVM track forecast (
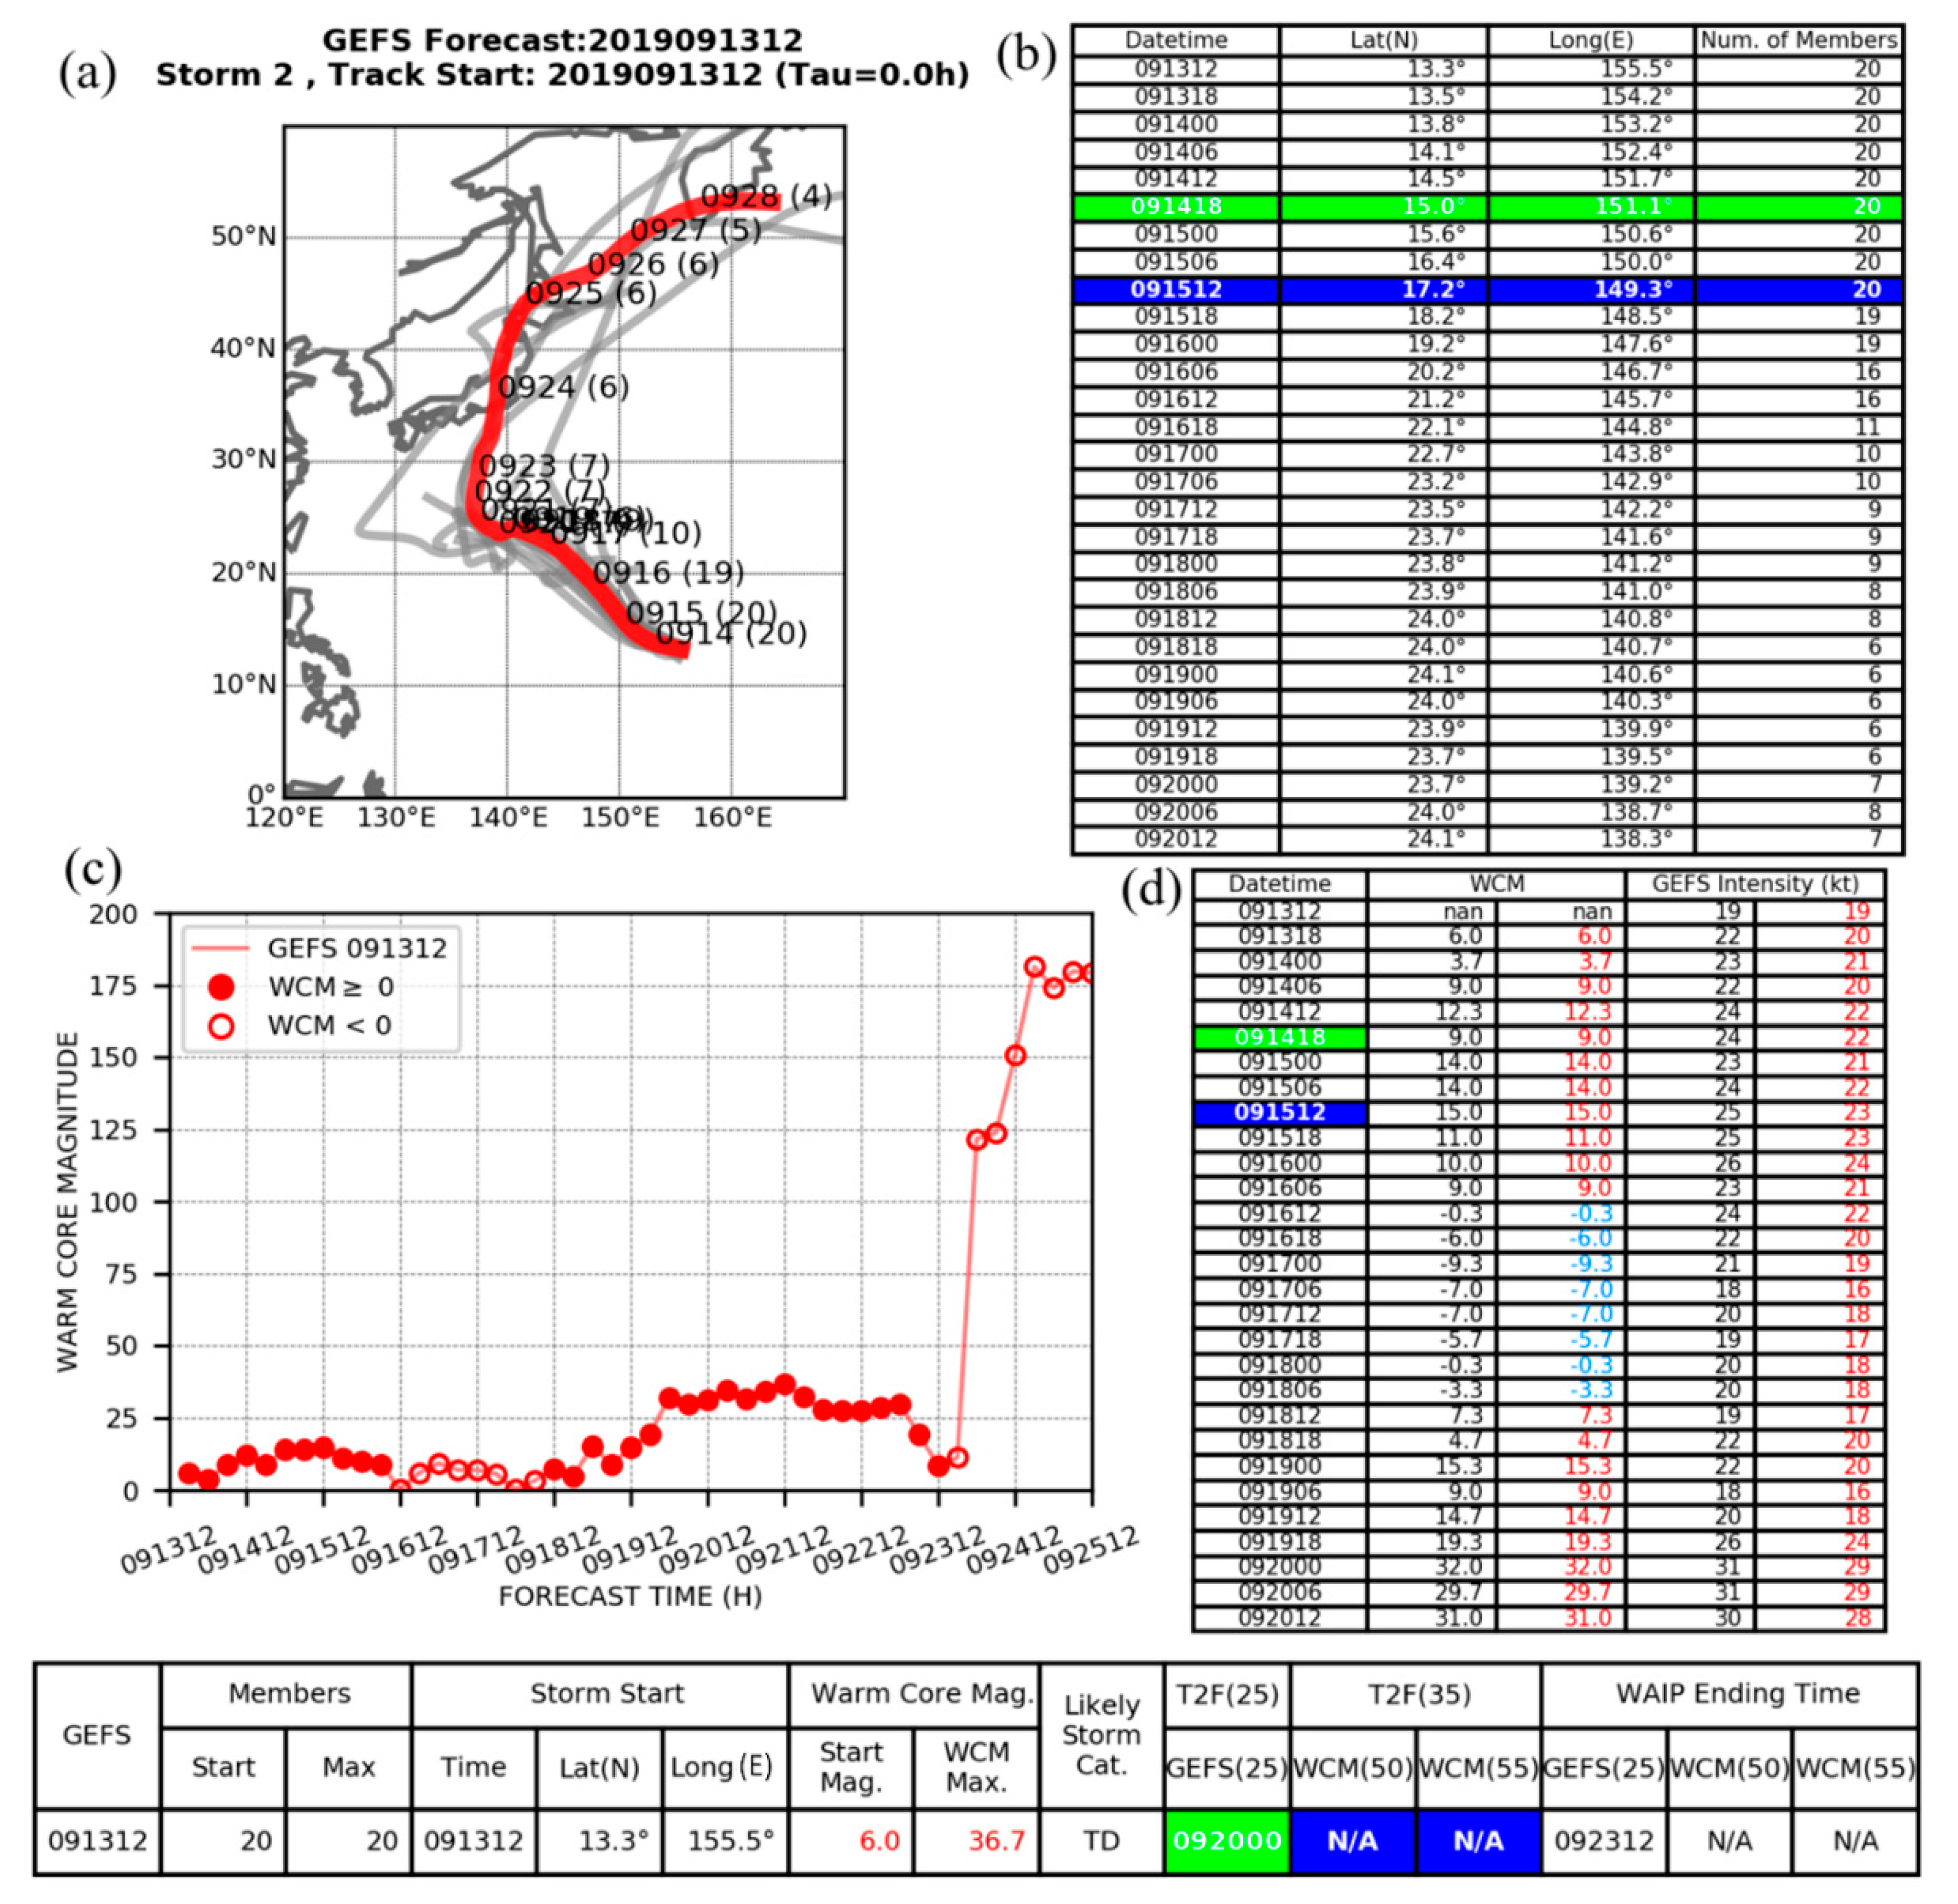
Figure 7a) from the same time with 20 of a possible 21 ensemble members and starts at 13.3° N, 155.5° E (
Figure 7b, first line). As was the case with the ECEPS forecast, the number of ensemble members decreases, and by Day 4 (091712), is down to nine members, and the post-recurvature stage has only six widely dispersed member tracks.
The GEFS intensity at 091318 is already 22 kt (column 4,
Figure 7d), which exceeds the WBT intensity of 20 kt. As explained in
Section 3.1.1, the GEFS intensity evolution is then adjusted to begin with that WBT intensity (
Figure 7d, column 5 in red). With that adjustment, the GEFS intensity does not meet the 25 kt threshold until 092000 (green box in the summary table at the bottom of
Figure 7). This GEFS (25 kt) time coincidentally is similar to the ECEPS Ending Time, but the location is not near the Kuroshio. Rather, the GEFS achieved the 25 kt intensity at 23.7° N, 139.2° E (Line 3 from the bottom in
Figure 7b), which is shortly before the pre-TS Peipah circulation track turned poleward (
Figure 7a).
As explained in
Section 2, the combined WAIP Ending Time for a recurving TC is the time of the last positive WCM, which is at 092312 (
Figure 7c). With an initial time and position determined from the T2F(25) and an initial intensity of 25 kt, the WAIP intensity technique searches for analogs that have tracks that match the WMVM track forecast from the T2F(25) position to the last positive WCM position (a total of 3.5 days), and also have initial intensities that closely match the initial intensity (25 kt). This combined WAIP intensity prediction for this GEFS forecast of pre-TS Peipah from 12 UTC 13 September is given in
Figure 6 (dashed line). The WAIP intensity begins at the WBT intensity of 20 kt and is equal to 25 kt at the T2F(25) time, and then the TS intensity of 35 kt is predicted to be at 092112. This GEFS-based WAIP intensity evolution is very different from the ECEPS-based intensities because the WAIP analog selection depends so strongly on the track forecast following the T2F.
Even the early T2F(35) based on the WCM 50 threshold is not achieved for this GEFS forecast (see
Figure 7c). The initial WCM at 091318 is +6.0 and the maximum positive WCM is only 15.0 at the verifying T2F(35) time of 091512 (
Figure 7d, column 3, red values). The pre-TS Peipah circulation in this GEFS forecast actually becomes cold core (blue values) before becoming warm core again. A later maximum WCM value of 36.7 still corresponds to a Likely Storm Category of TD.
In summary, the WCM evolutions predicted by the ECEPS and the GEFS both indicate that the pre-TS Peipah circulation would likely not become a Tropical Storm, and there were actually only two times in the JTWC WBT that the intensity reached 35 kt (not shown). Given the track forecasts, and that Peipah occurred in the middle of September, it is a noteworthy achievement that the WCM-T2F technique can predict the limited development of this pre-TC circulation.
3.1.3. ECEPS and GEFS Forecasts of T2F and Intensity of Typhoon Bualoi (22W)
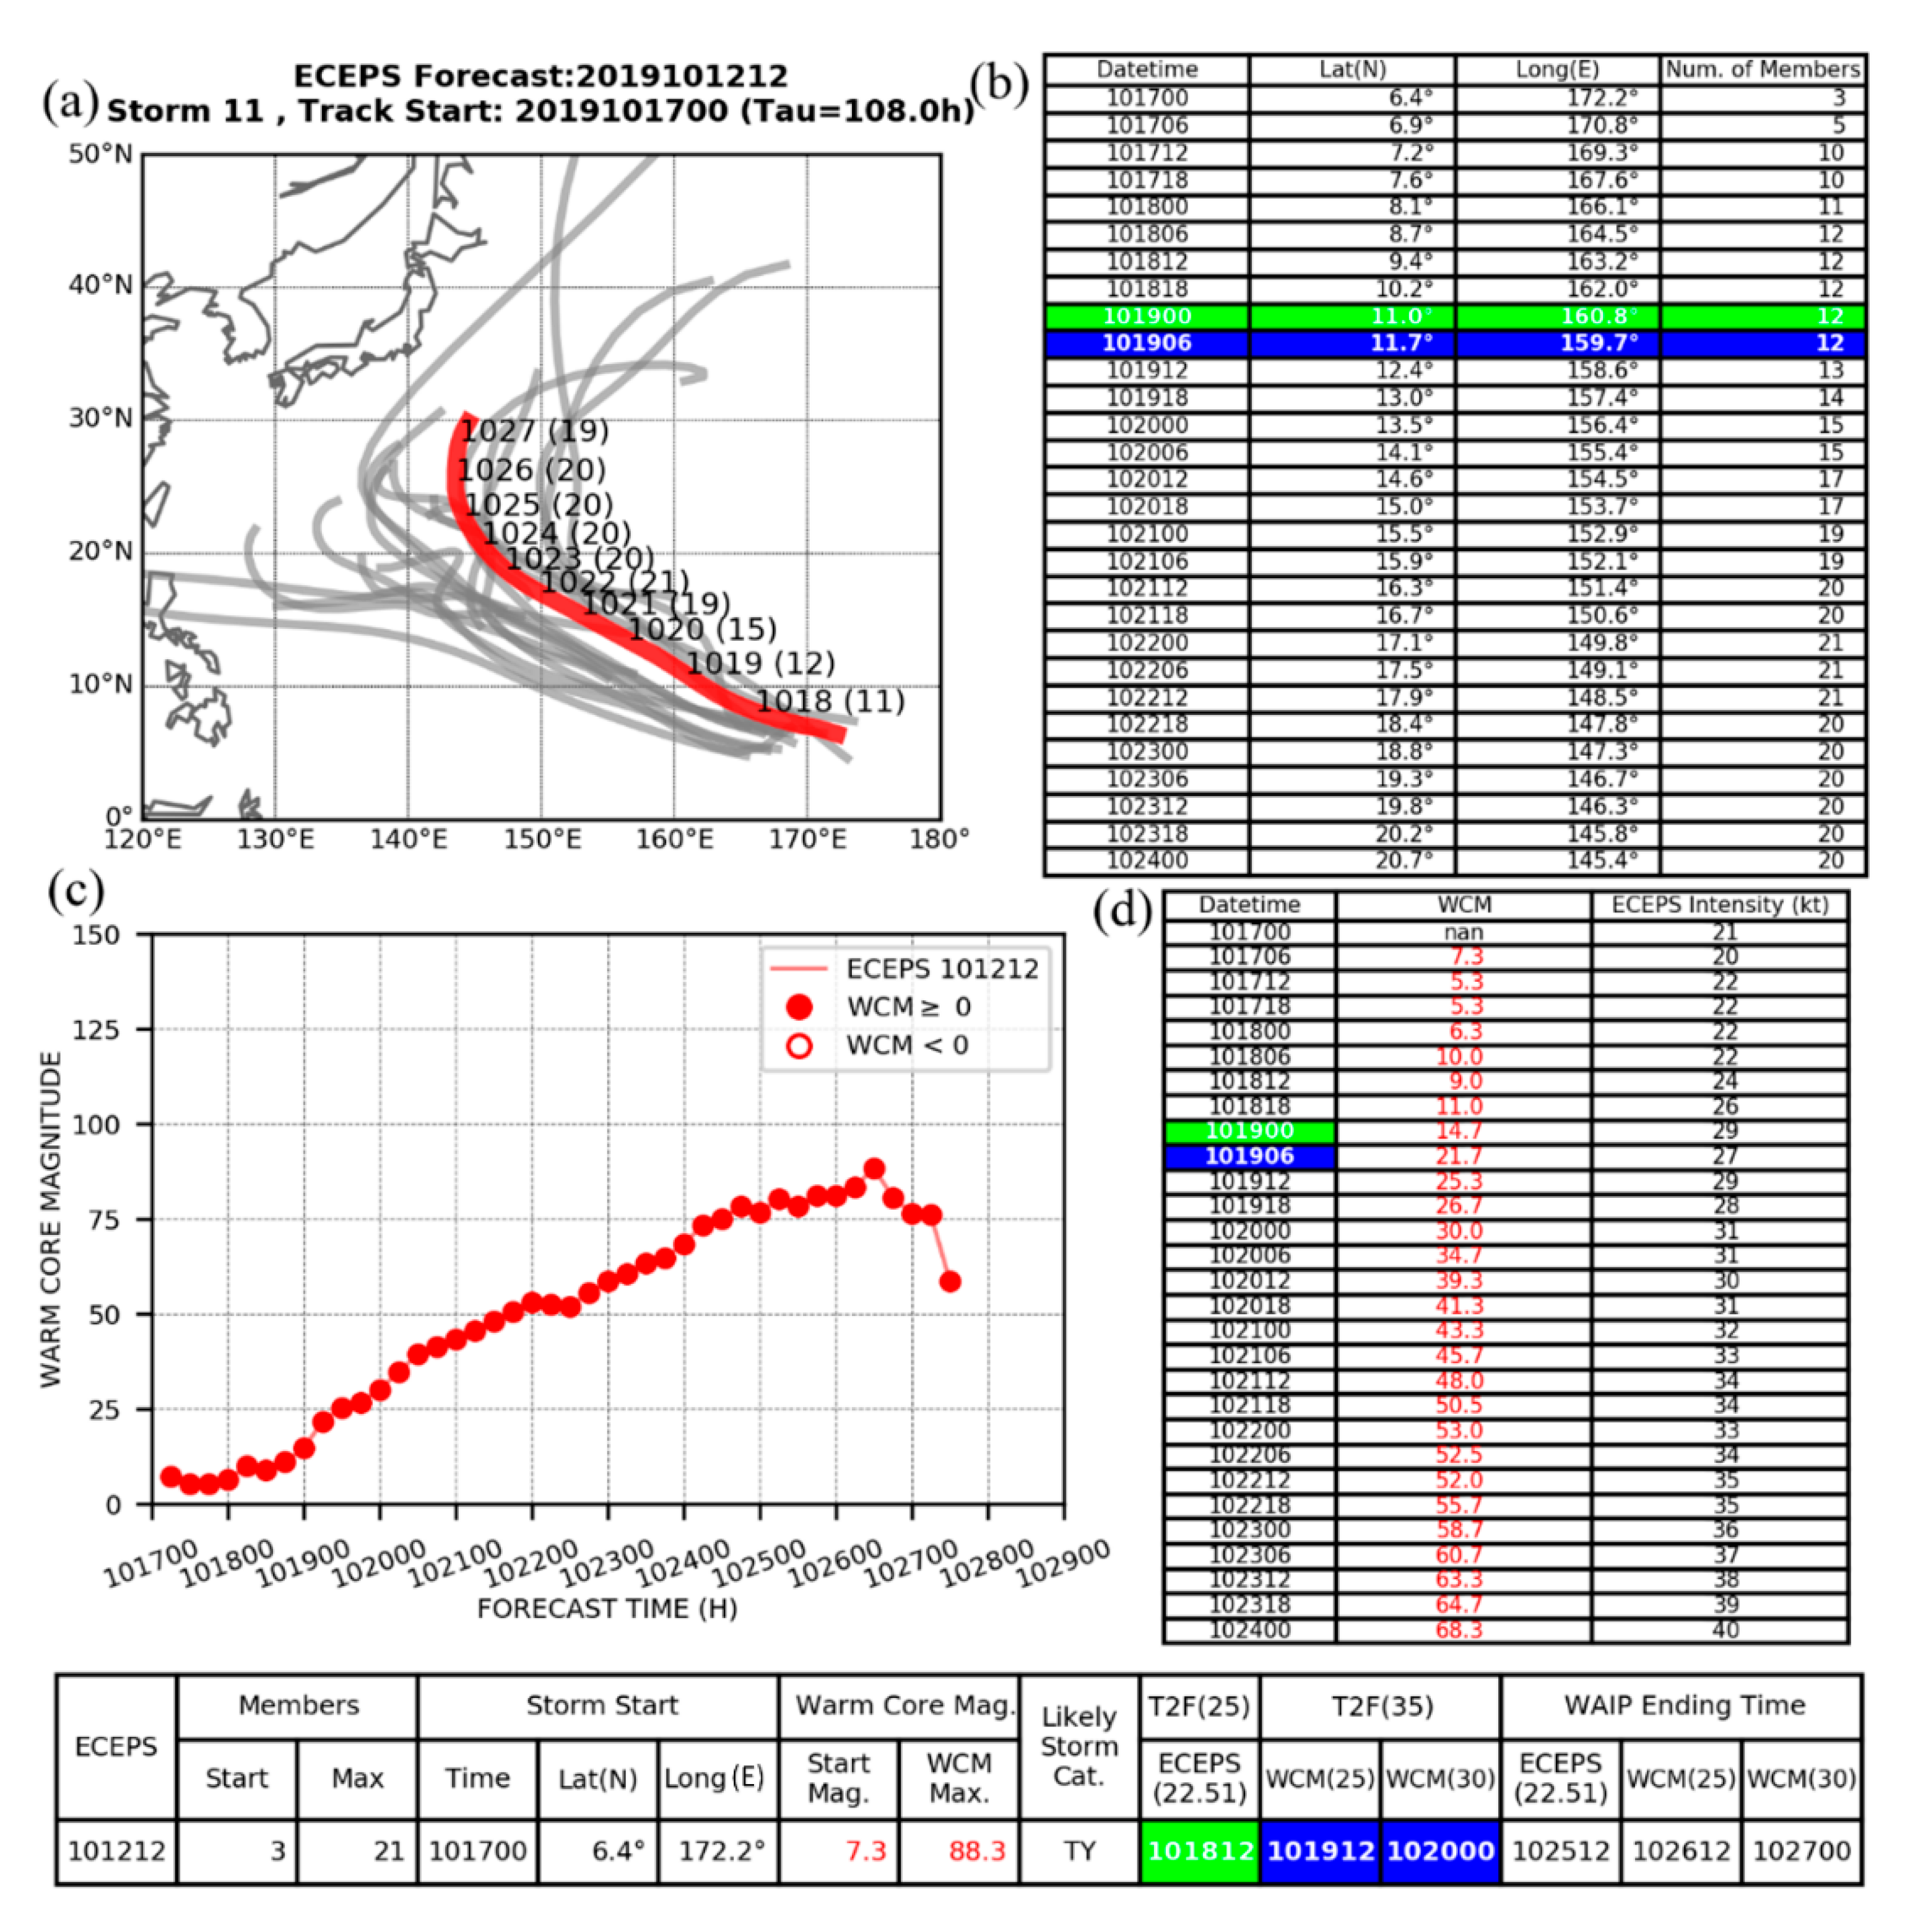
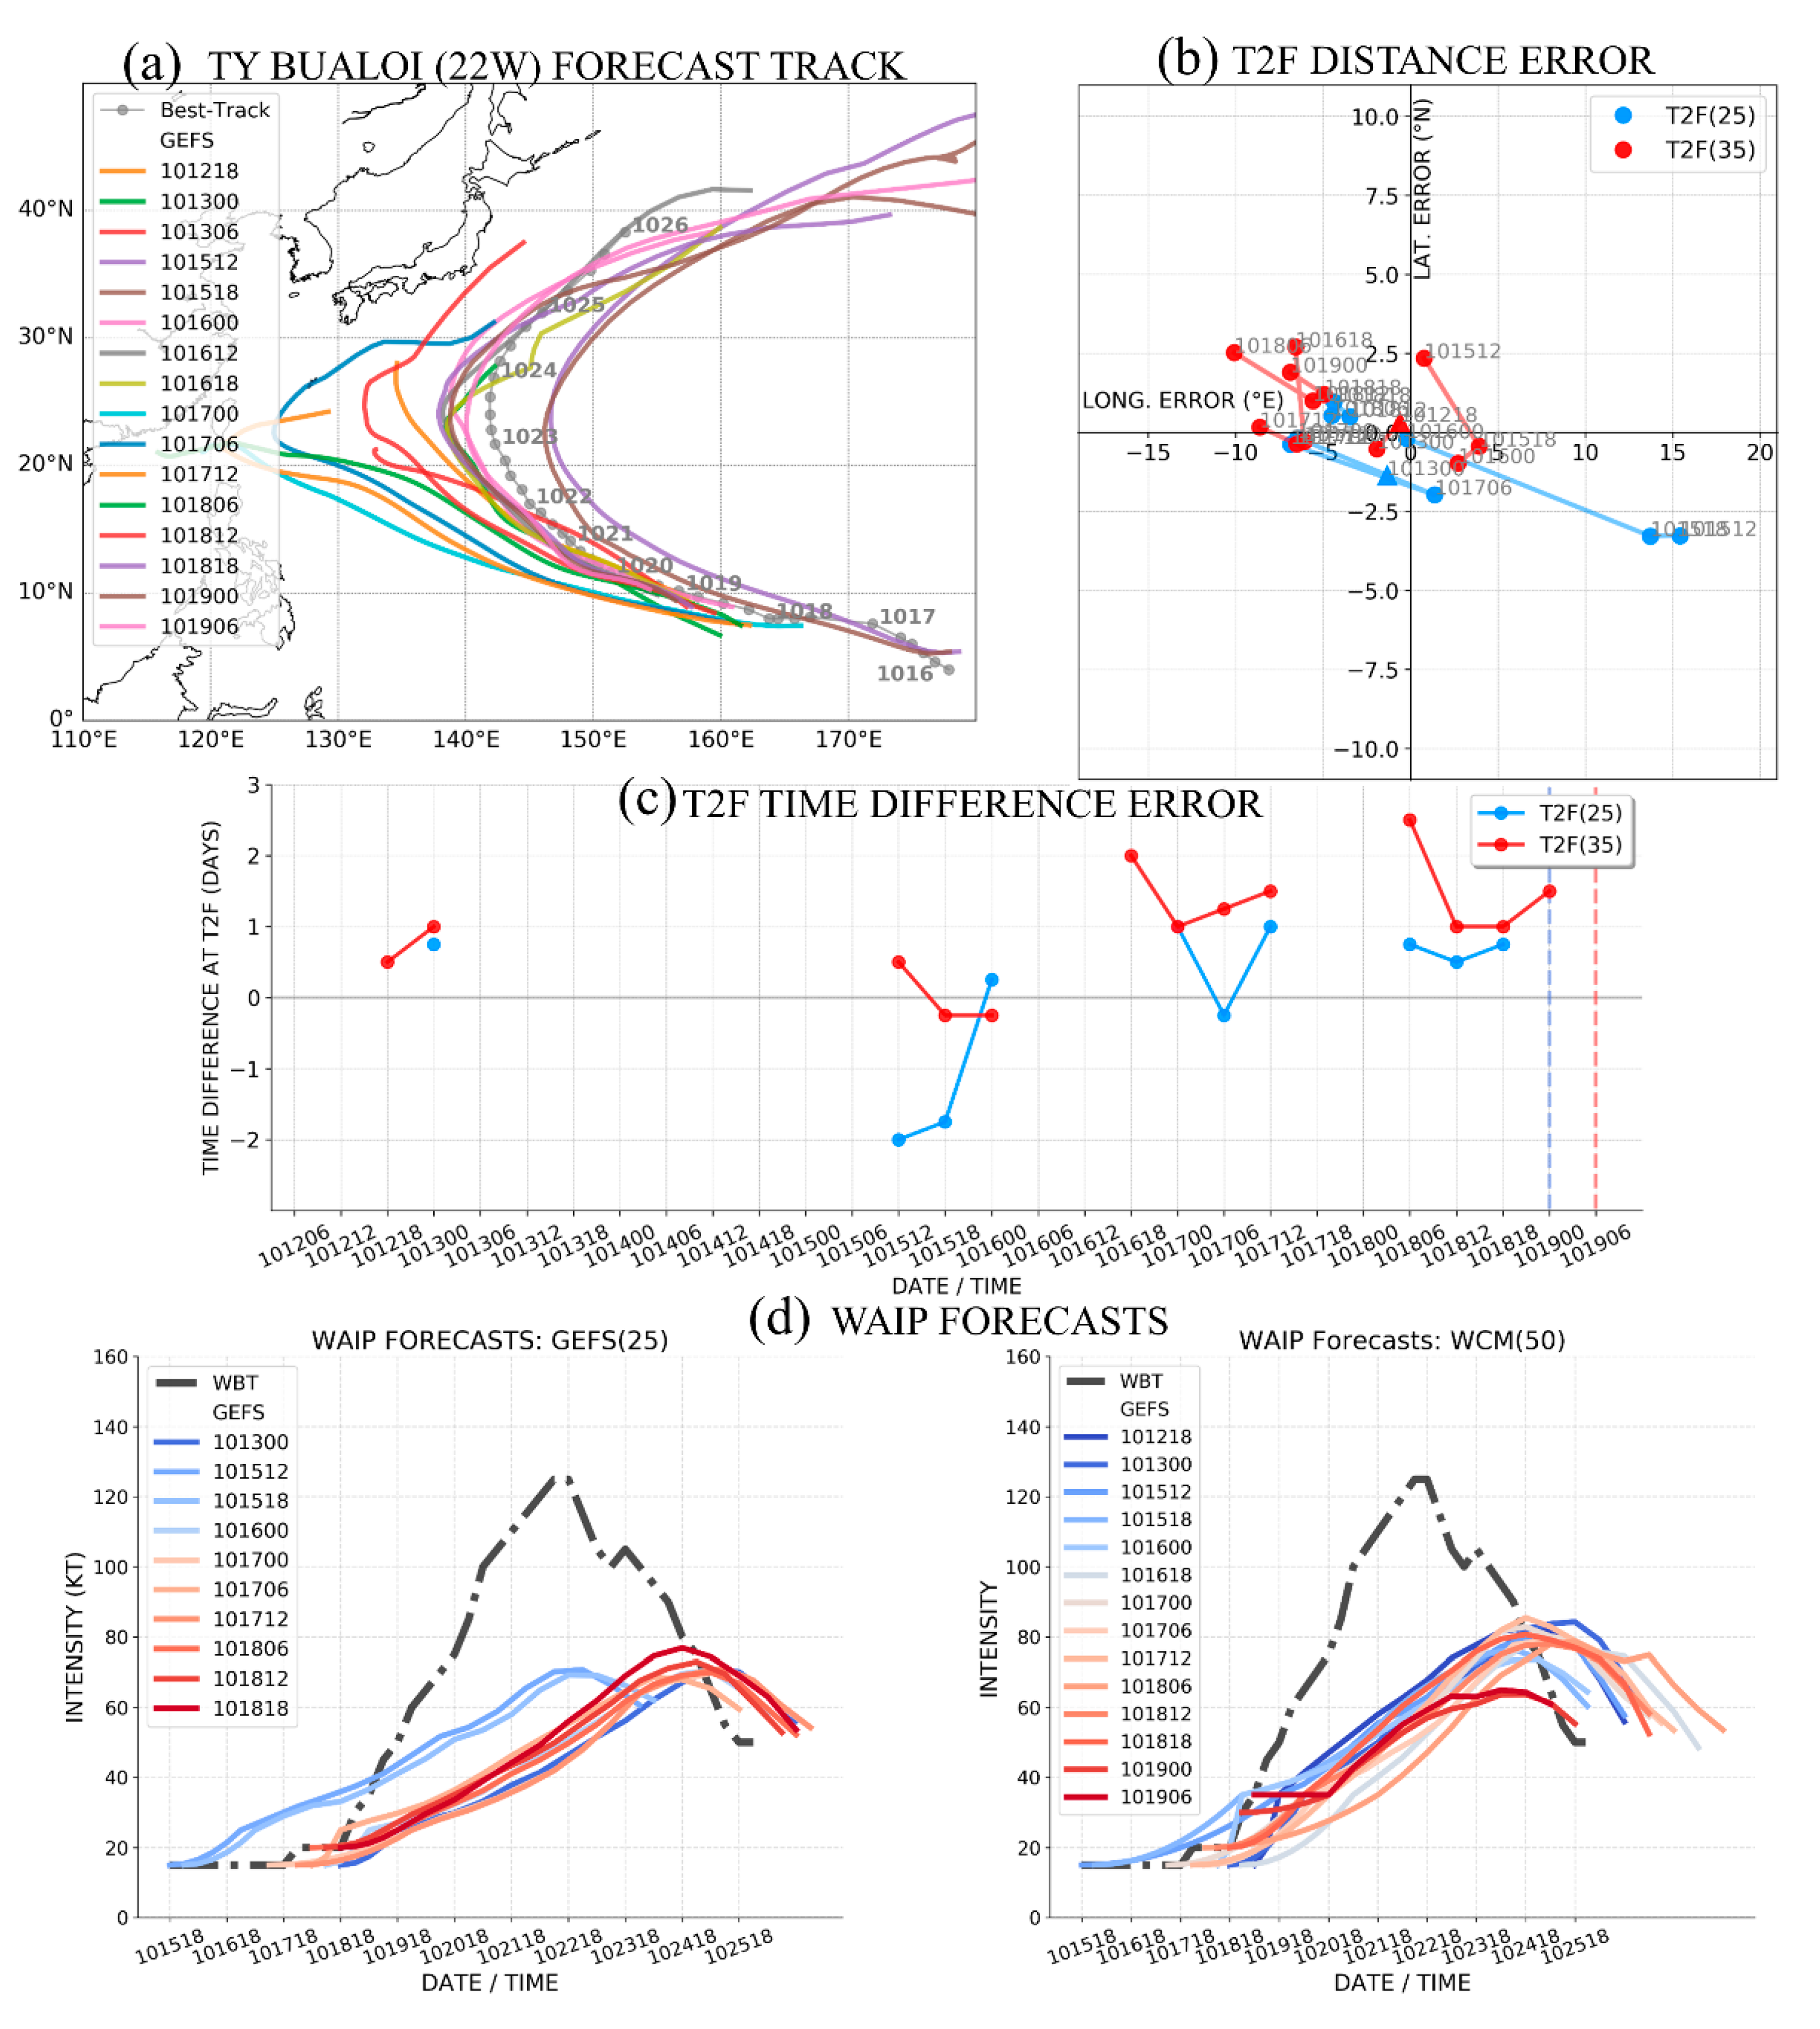
The pre-Bualoi circulation in the ECEPS forecast from 12 UTC 12 October starts at 00 UTC 17 October (Day 4.5) at 6.4° N, 172.2° E, with only 3 ensemble members (
Figure 8b, first line). Just 12 h later, 7 more members have joined, and the position is about 3° latitude to the west. Because this cluster of new members begins even farther to the west between 165° E and 168° E (
Figure 8a), this is a track bifurcation situation with a large track spread about the WMVM solution (red line), which is predicting a recurvature near 26° N, 144° E on 27 October (Day 15 of the ECEPS) (as described in
Section 4.2, TY Bualoi did recurve near 25° N, 142° E, but ~2.5 days earlier). Note that the cluster of tracks farther to the south would later have tracks ranging from a westward passage over the Philippines to a recurvature well to the southwest of the actual recurvature location. Thus, the T2F time and position along the WMVM is a challenge with a large impact. The verifying T2F(25) and T2F(35) times are 101900 (Day 6.5) and 101906 (Day 6.75), as indicated by the green box and the blue box in column 1 of
Figure 8b, and the associated WMVM positions are 11.0° N, 160.8° E and 11.7° N, 159.7° E.
Even though the initial WCM at 101706 was only 7.3, the ECEPS weighted-mean intensity of 5 ensemble members was already 20 kt (column 3,
Figure 8d). Nevertheless, it was another 30 h (101812) before the T2F(25) threshold intensity was achieved (green box in the summary table at the bottom of
Figure 8), which was just 12 h early. The ECEPS-predicted WCM evolution in
Figure 8c also indicates an early amplification of the warm core in this pre-Bualoi circulation that is starting at a low latitude. The two WCM thresholds of 25 and 30 for the T2F(35) are surpassed at 101912 and 102000, respectively (blue boxes in the summary table at the bottom of
Figure 8). The continued WCM increase to a maximum WCM of 88.3 indicates that the Likely Storm Category will be a typhoon (bottom table). Thus, the ECEPS forecast is predicting that a TS will exist on Day 7–Day 7.5 near 13° N, 157° E and become a typhoon that will recurve near 26° N, 144° E on Day 14, which was a very accurate track prediction.
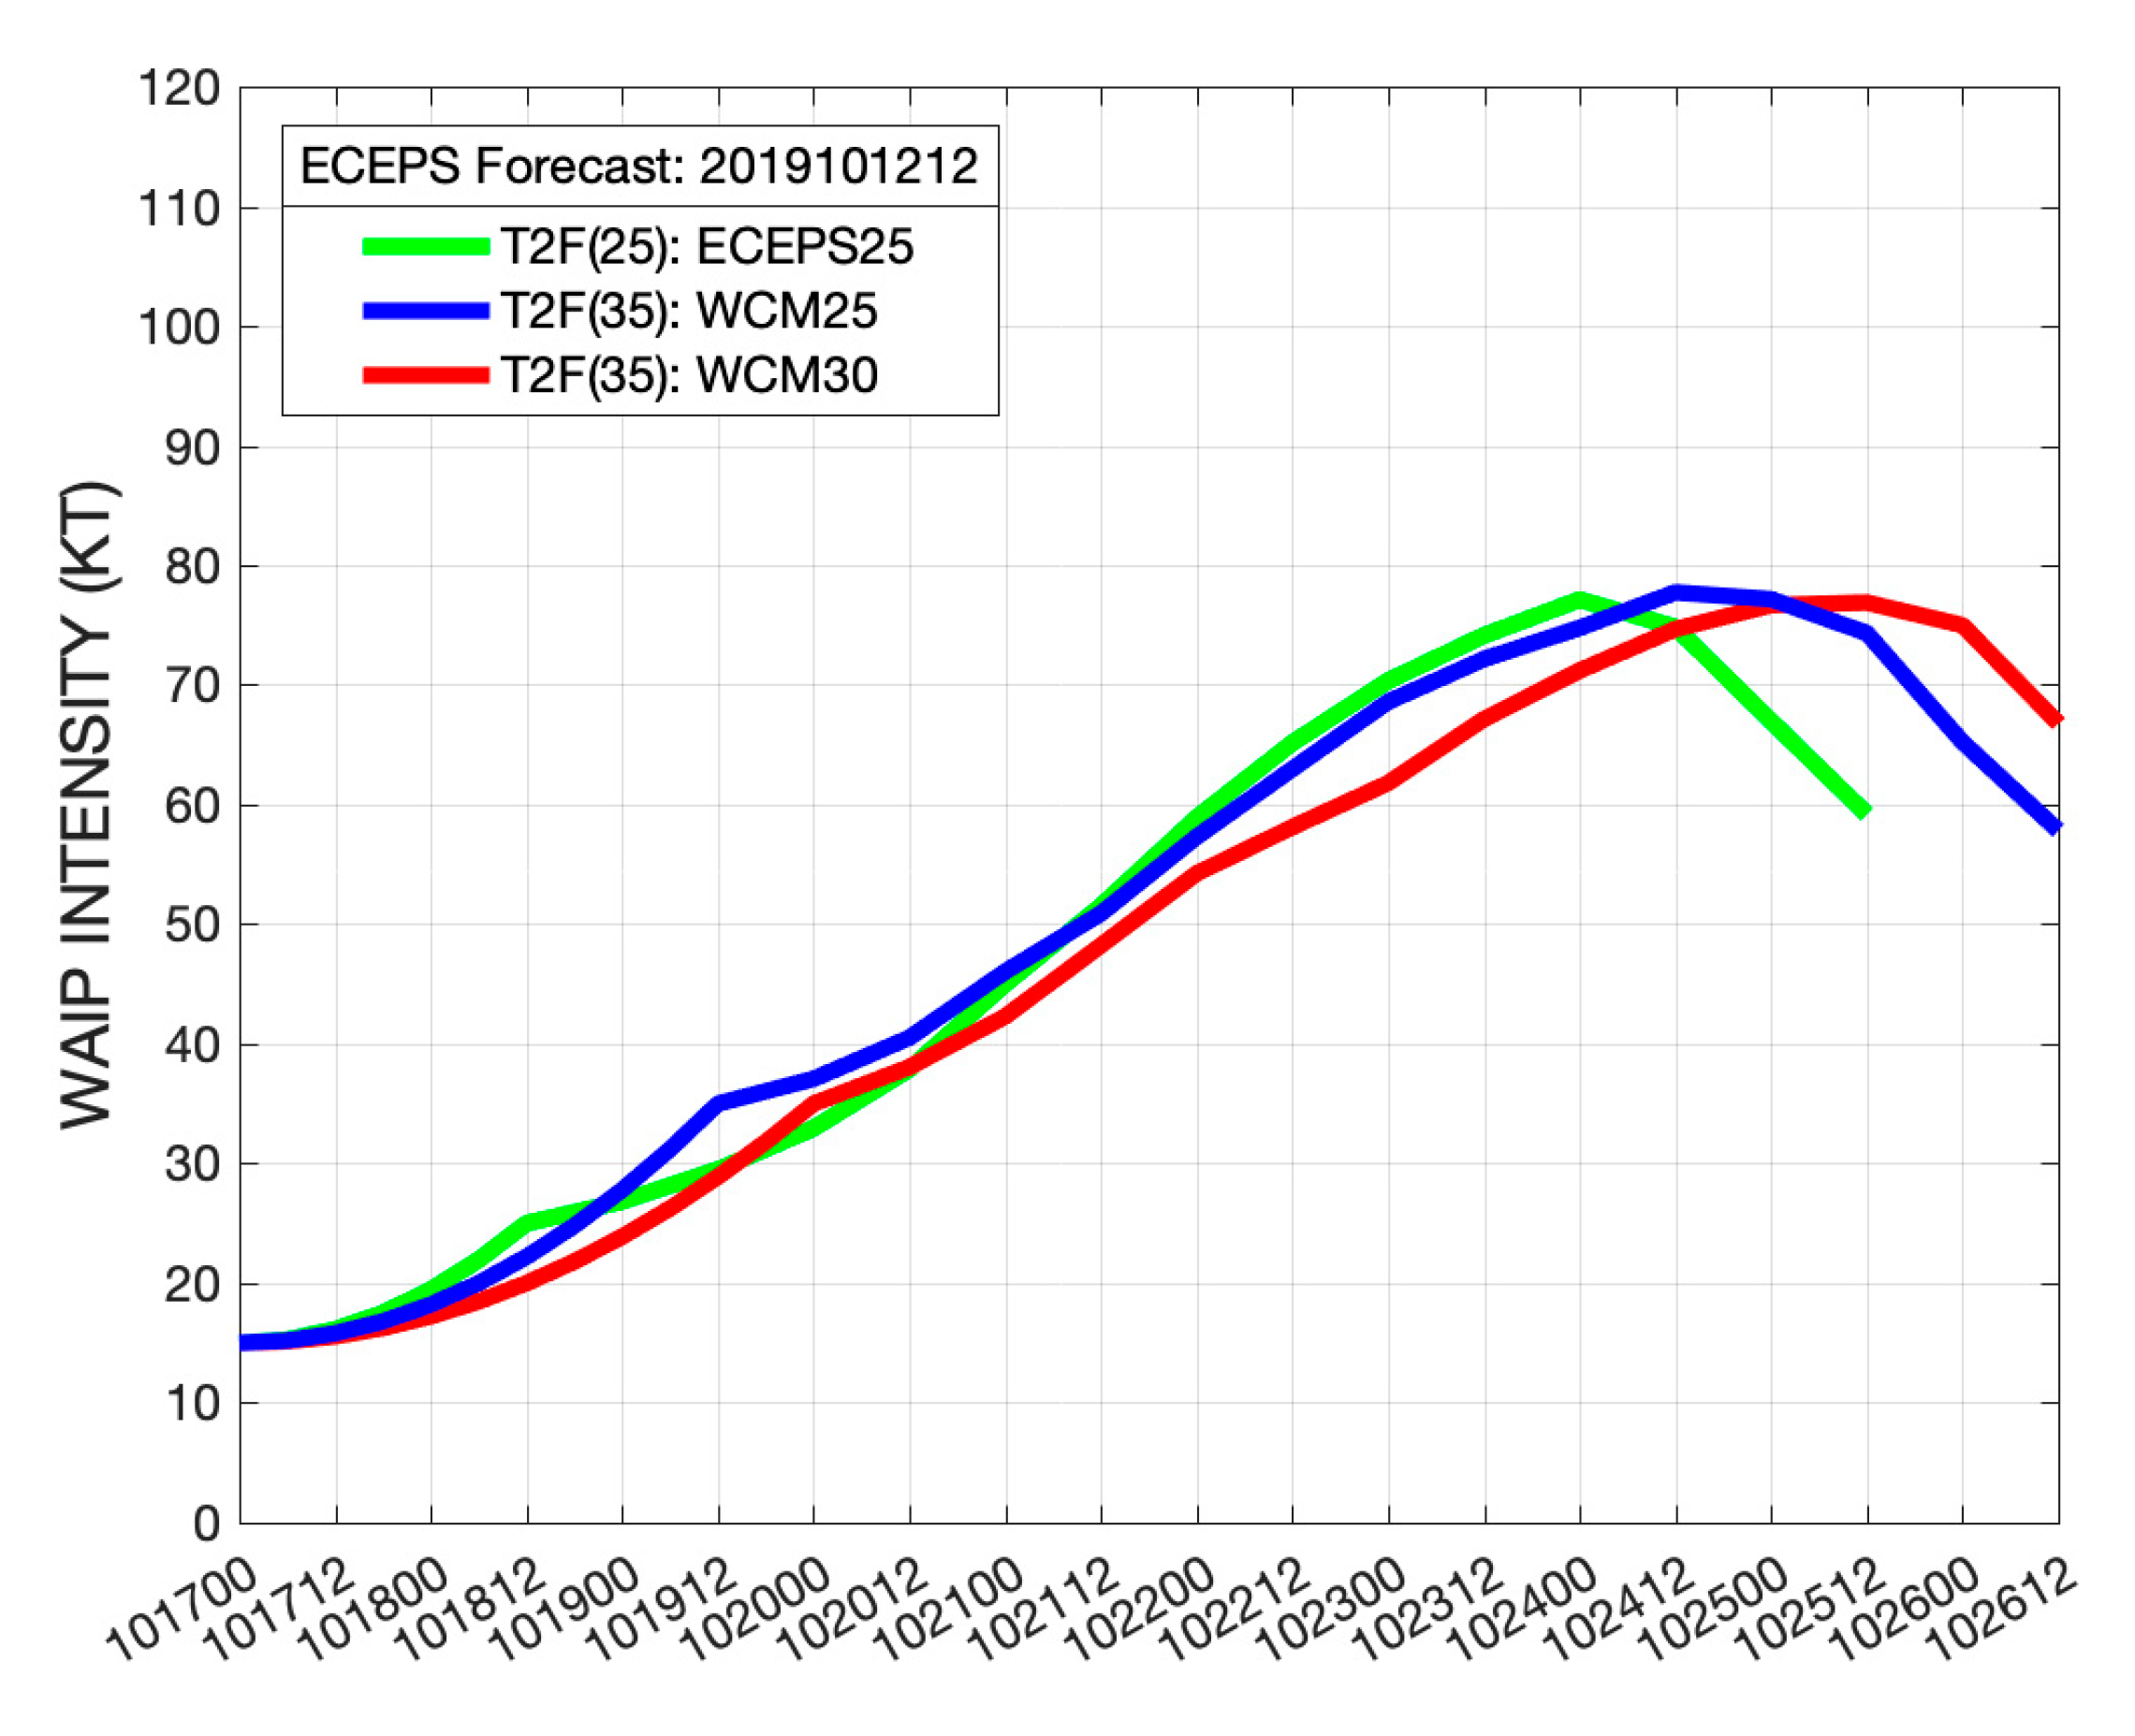
With no Ending Storm constraint within the 7 days after the three T2Fs, the WMVM track forecast for 7 days after each T2F, and assuming an initial intensity of 15 kt, the WAIP intensity forecasts are shown in
Figure 9. Because the WAIP forecast based on T2F(25, green curve) reaches 35 kt at the same time as the later T2F(35, red curve), which is only 12 h after the early T2F(35, blue curve), these three WAIP intensity forecasts are almost identical between 35 kt and the peak intensities of 75–78 kt. Because the WBT peak intensity of TY Bualoi actually was 130 kt (not shown), it is not expected that the weighted average of 16 analog intensities as in the WAIP would be able to predict such an intense typhoon. Rather, the objective of the WAIP is to confirm/support the WCM-based Likely Storm Category of typhoon (bottom,
Figure 8), which in this ECEPS forecast is occurring on ~Day 12 (recall that the pre-Bualoi circulation started on Day 4.5).
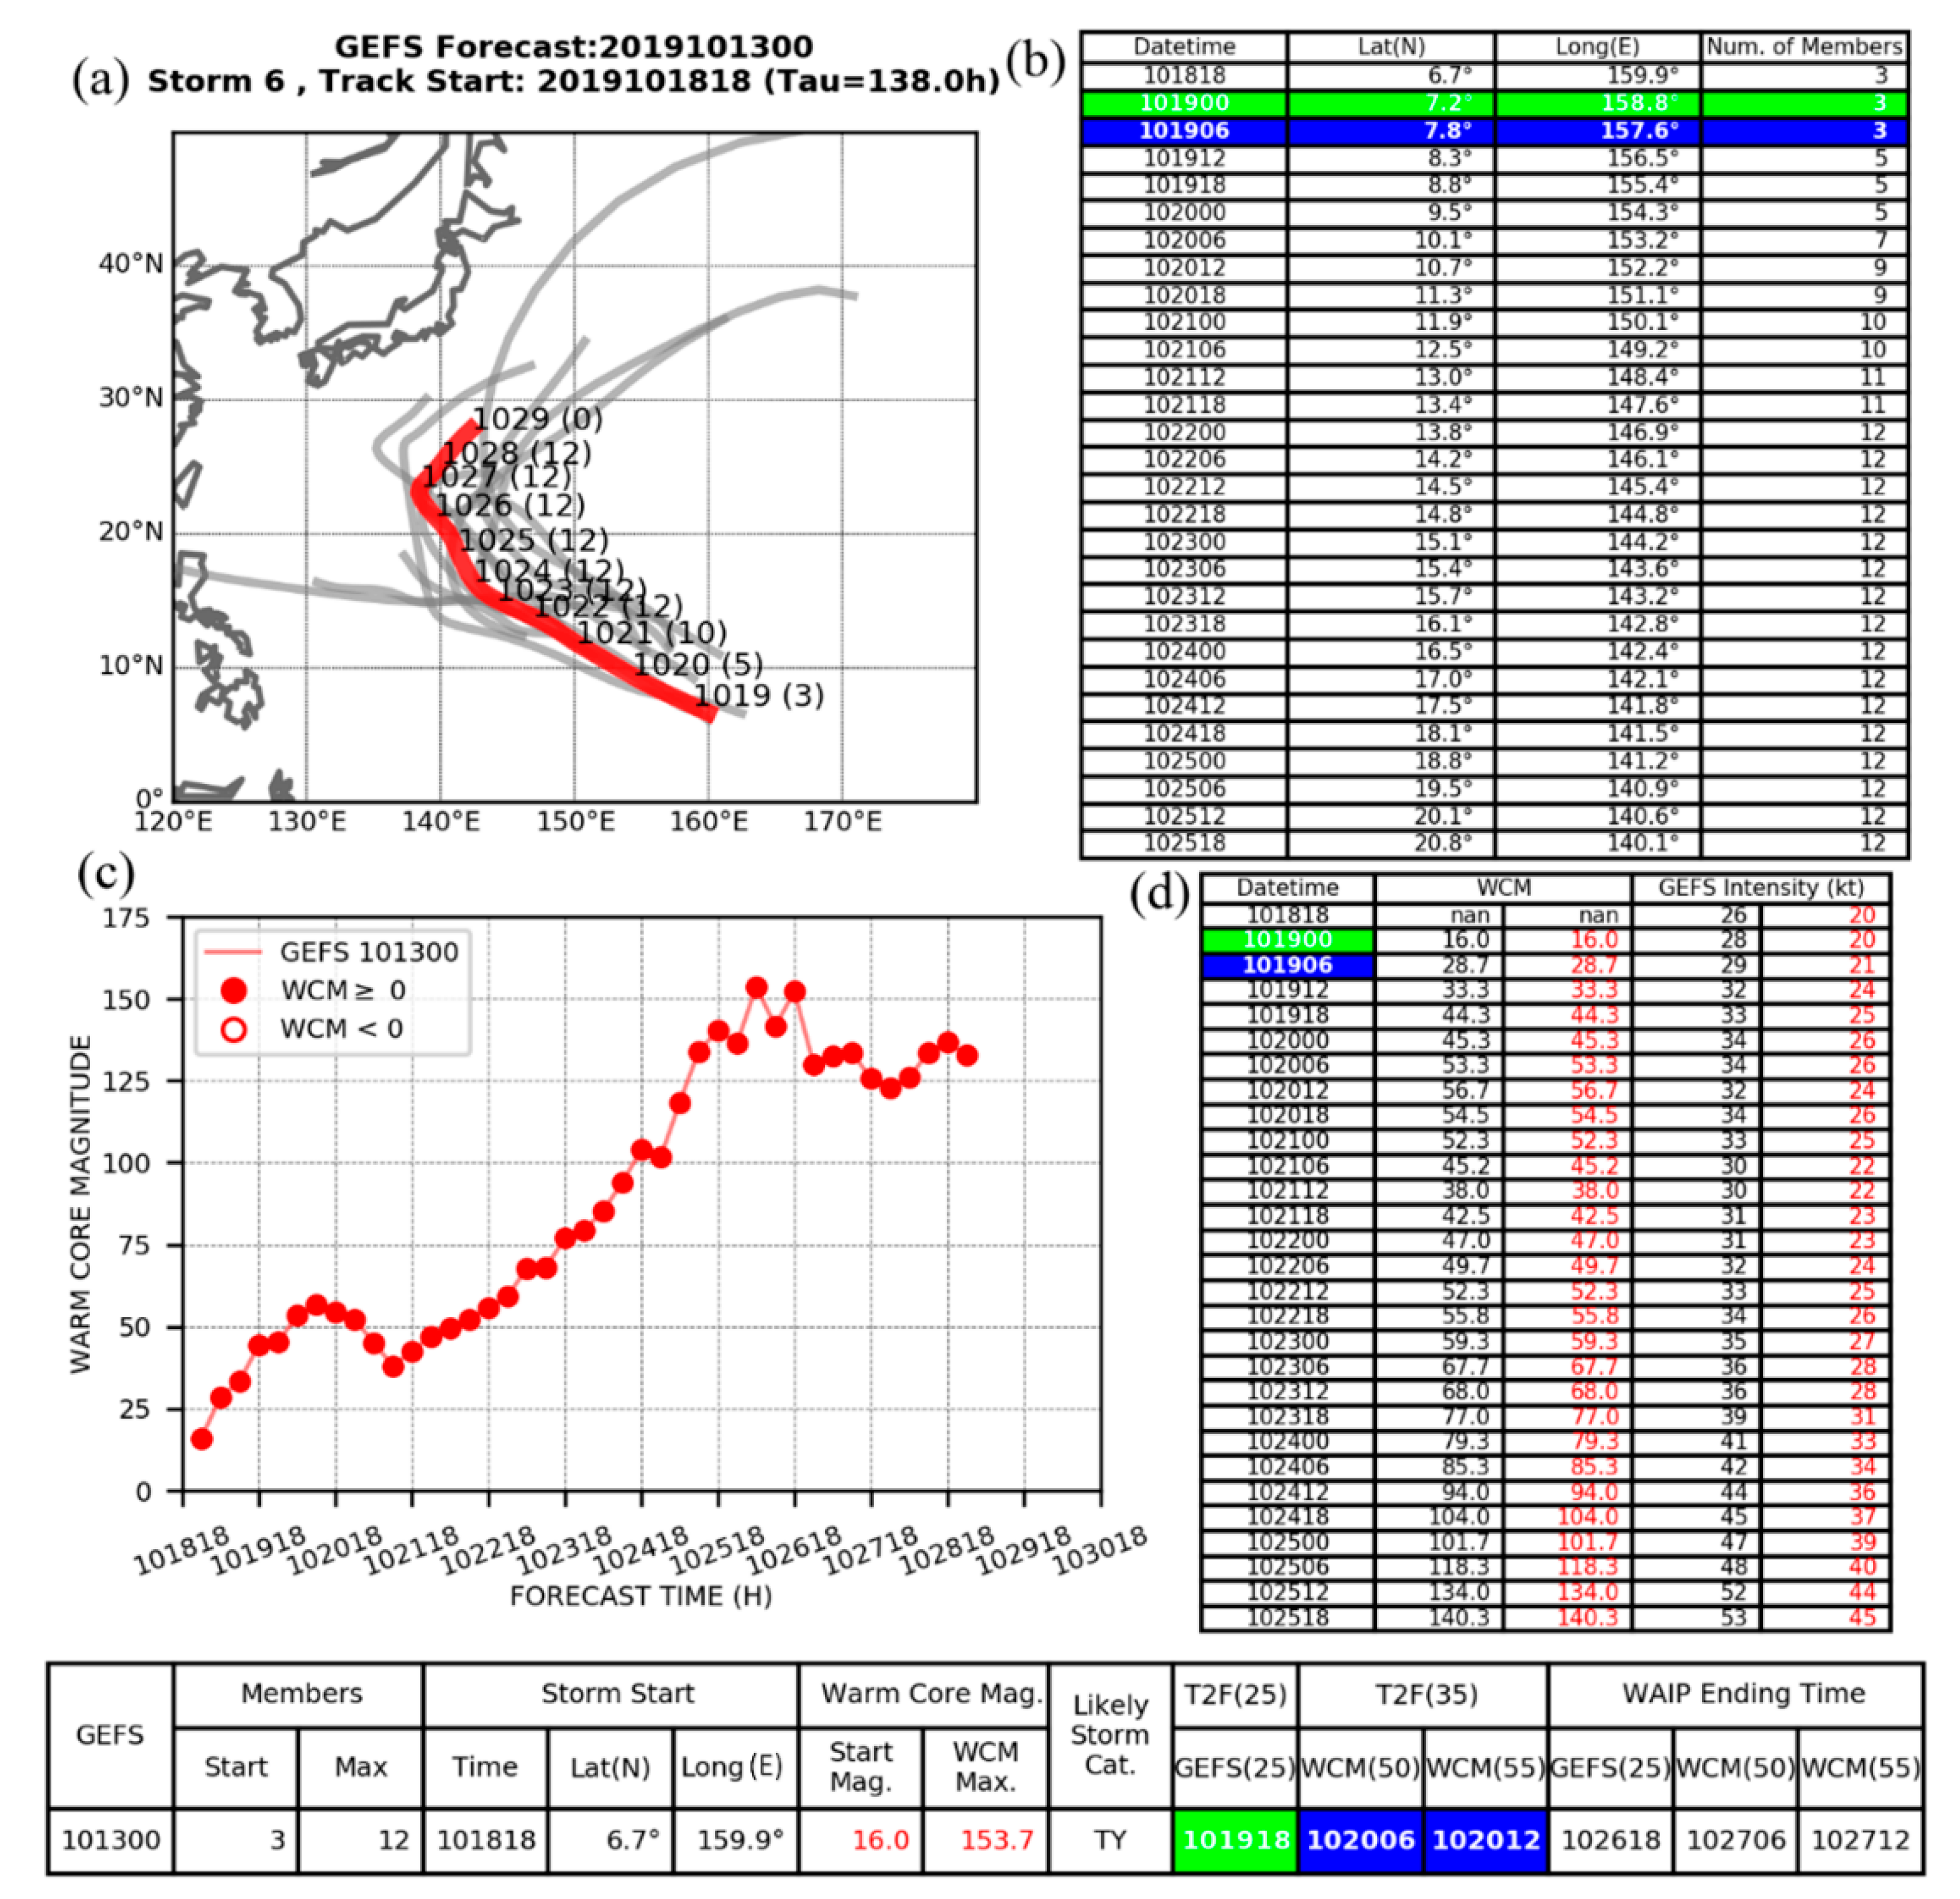
A GEFS forecast from 00 UTC 13 October (12 h after the ECEPS forecast discussed above) has the pre-Bualoi circulation starting at 18 UTC 18 October (
Figure 10b), which is just 6 h (12 h) prior to the verifying T2F(25) (T2F(35)). Whereas the GEFS forecast has the circulation starting at 6.7° N, 159.9° E, the ECEPS forecast position at the same time has the circulation at 10.2° N, 162.0° E, which is about 390 km to the north and 200 km to the east of the GEFS forecast position. Essentially, the GEFS track solution in
Figure 10a corresponds to the southern track cluster in the ECEPS bifurcation track in
Figure 8a, with a rapid west–northwest track to a recurvature near 25° N, 138° E. Even though the GEFS track spread is huge, this WMVM track forecast (
Figure 10a, red line) comes to a smooth ending at Day 16 of this GEFS forecast.
The GEFS intensity at 101900, which is the verifying T2F(25), is already 28 kt (column 4,
Figure 10d). Since the JTWC WBT intensity is 20 kt, the GEFS intensity evolution is adjusted to start at that 20 kt intensity (column 5, in red,
Figure 10d). Consequently, the T2F(25) becomes 101918 (green box in the summary table at the bottom of
Figure 10), which is 18 h late.
No adjustment is necessary for the initial WCM, which is a positive 16.0. As indicated in
Figure 10c and the digital values in columns 2 and 3 in
Figure 10d, the two T2F(35) times tied to the WCM > 50 and WCM > 55 are 102006 and 102012 respectively, and it is noted that they are 1.0 and 1.25 days late relative to the verifying T2F(35) time in the blue box in column 1 of
Figure 10d. These T2F(35) times are entered in the blue boxes at the bottom, where it is also recorded that the maximum WCM of 153.7 corresponds to a Likely Storm Category of typhoon. Coincidentally, the GEFS-predicted time of maximum WCM (102606, in
Figure 10c) is within 6 h of the ECEPS-predicted time (
Figure 8c), but the GEFS has a much larger maximum WCM with a more rapid WCM increase that might be related to a Rapid Intensification (RI).
Note also from
Figure 10b the GEFS-predicted average WMVM track position for these T2F(35)s is about 10.5° N, 152.7° E, versus the average ECEPS position that is ~13.0° N, 157.4° E, which is of course related to the different GEFS WMVM track in
Figure 10a versus the ECEPS WMVM track in
Figure 8a. Because of the delay in the GEFS picking up the pre-Bualoi circulation until just before the T2F(35), the predicted latitude is quite good, but the longitudinal position is too far to the west.
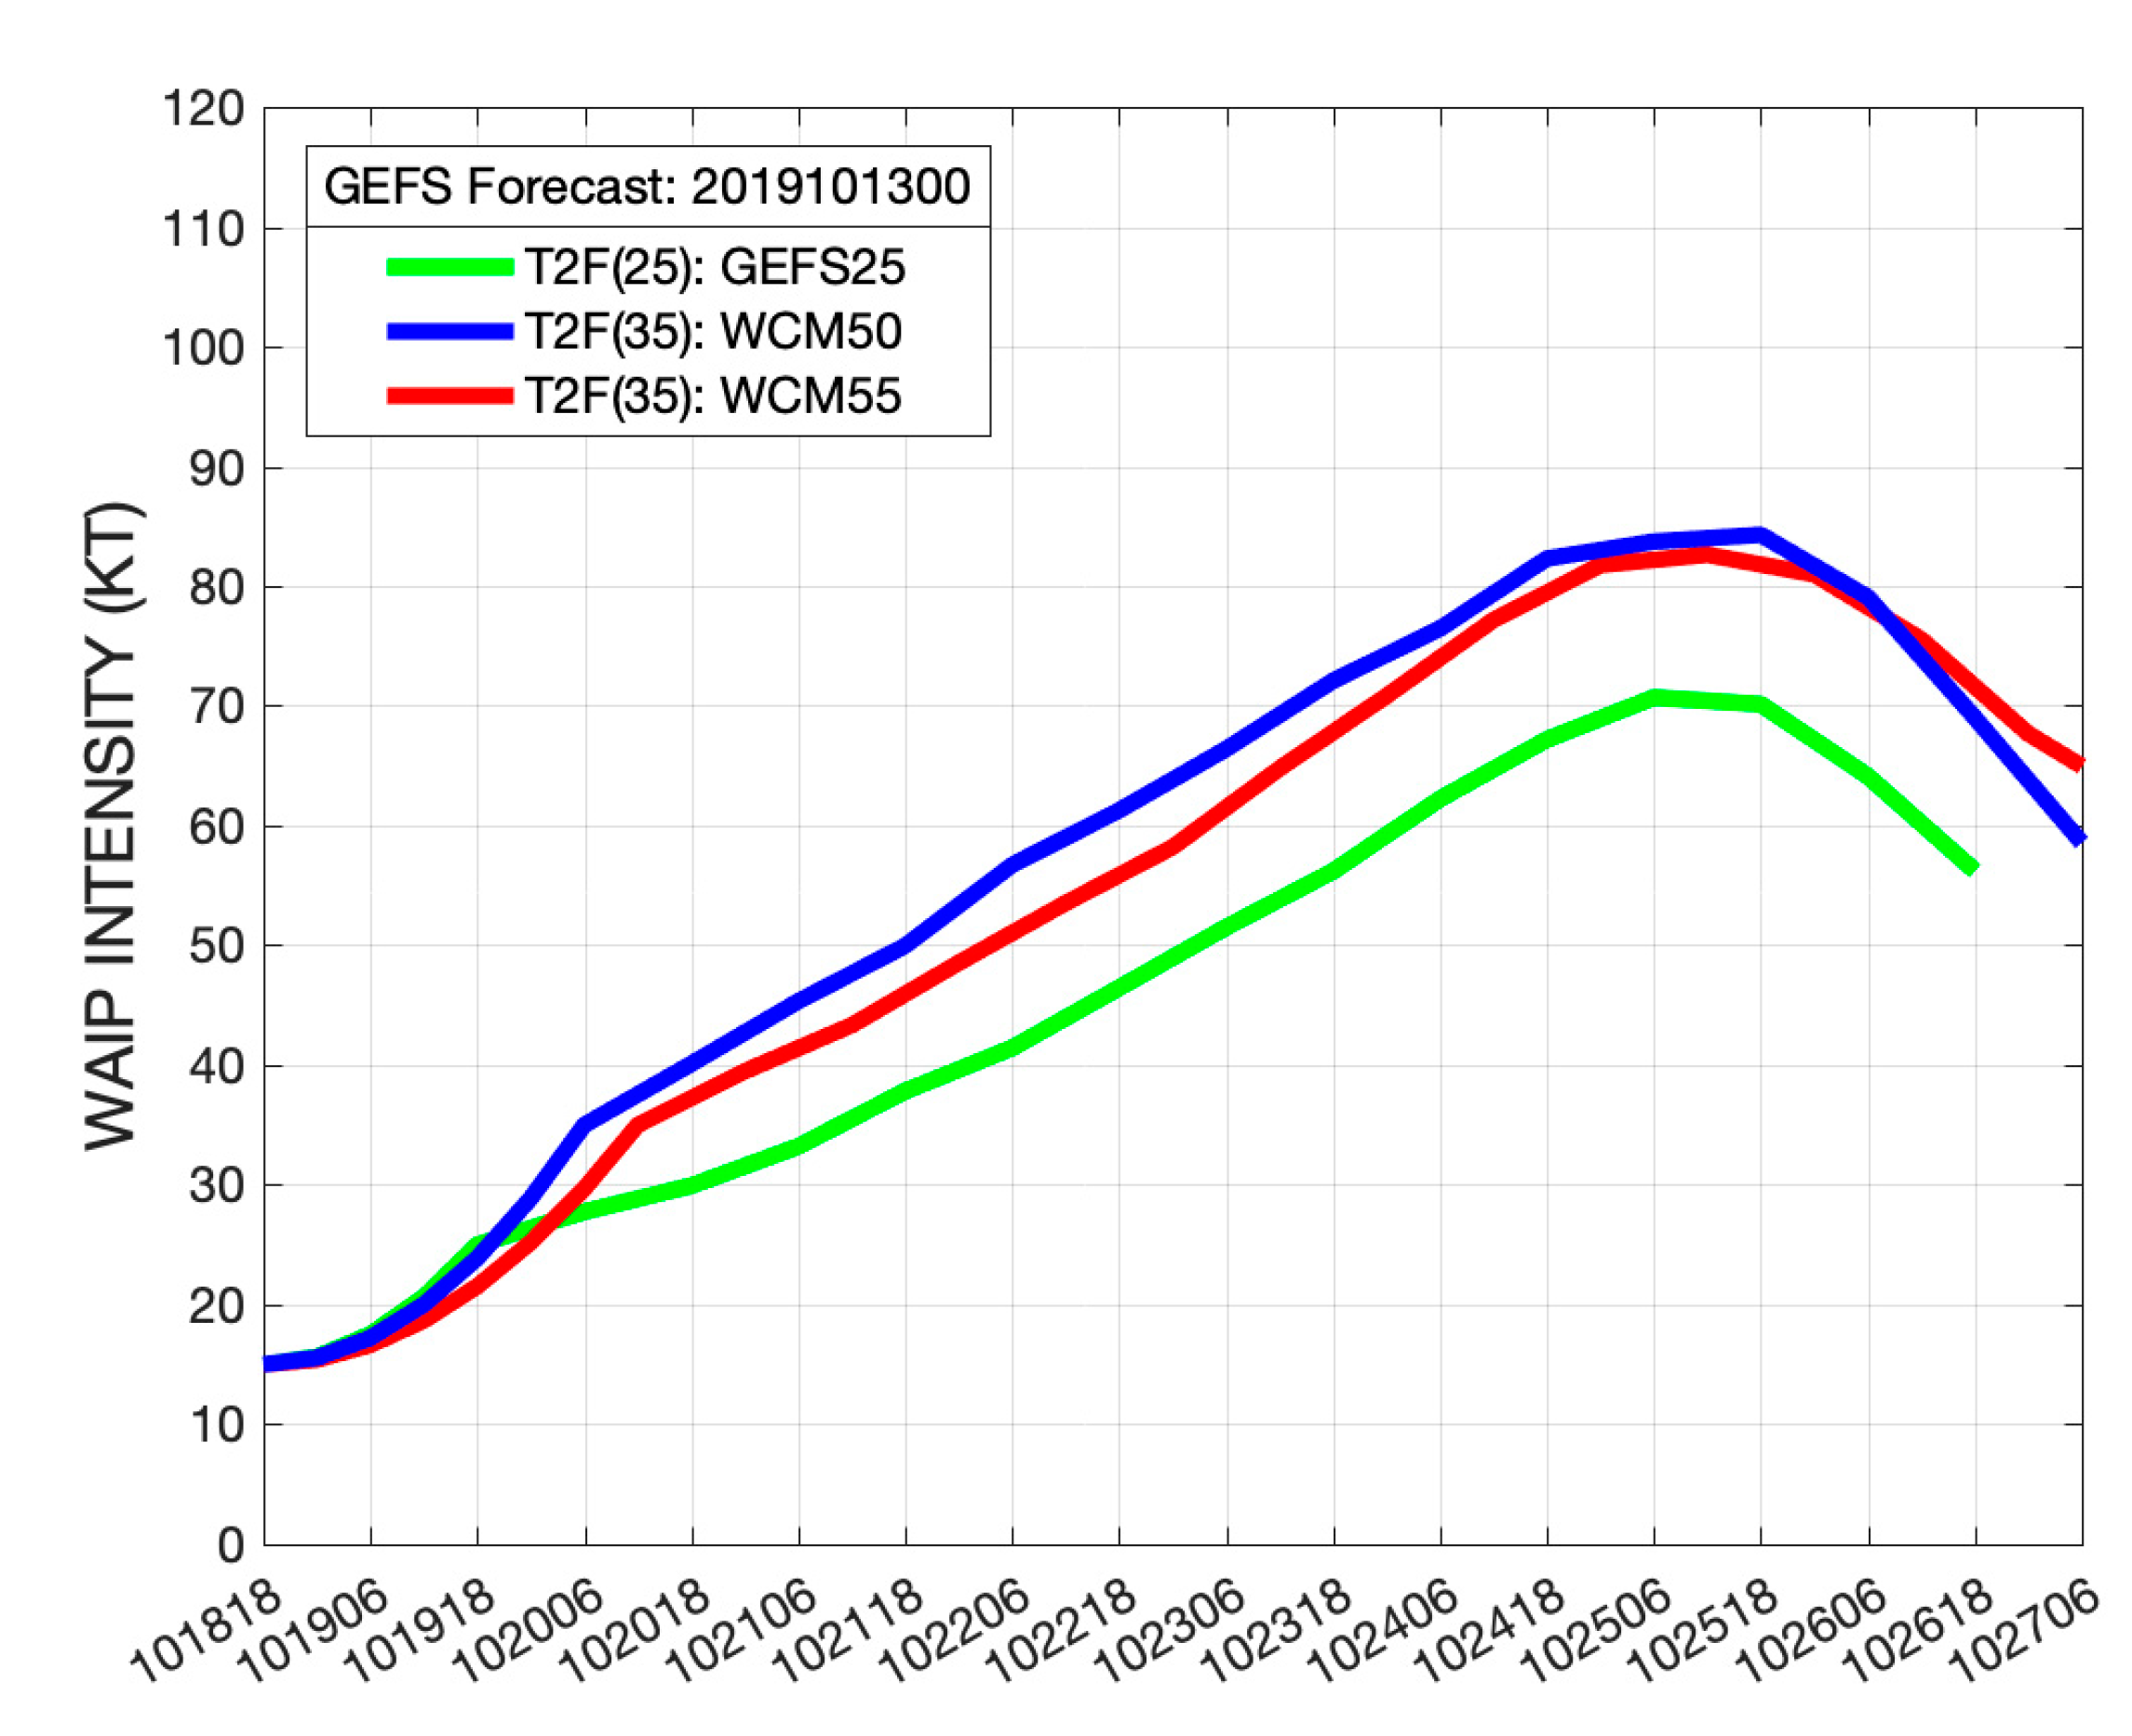
With no WAIP Ending Storm constraint within 7 days after the three T2Fs, given the WMVM track forecast for 7 days after each T2F, and assuming an initial intensity of 15 kt, the WAIP intensity forecasts are given in
Figure 11. Note that the WAIP intensity forecasts based on the two T2F(35) times (only 6 h apart) are very similar and reach the same maximum (82 kt). By contrast, the WAIP intensity forecast for the T2F(25) time (12–18 h earlier) has a slower intensification rate and achieves only a 70 kt maximum intensity. Since almost the same segment of the WMVM track forecast is being utilized for the analog selection, it must be that the initial intensity matching of the 25 kt (instead of 35 kt) in the analog selection has resulted in more lower-intensity analogs. Again, it is not expected that an analog method could predict the peak 130 kt intensity of Bualoi, but it is noteworthy that a typhoon-intensity storm is to be anticipated around Day 12 in this GEFS forecast.
In summary, forecasting the T2F of the pre-Bualoi circulation in the ECEPS and the GEFS is difficult because the initial disturbance is at a low latitude, and the ECEPS WMVM track forecast indicates a track bifurcation situation. The ECEPS track forecast picks up the disturbance earlier than does the GEFS and provides a quite accurate track. By contrast, the GEFS misses the early track and instead focuses on the southern track cluster in this bifurcation situation, which is a much less accurate track forecast at later times than the ECEPS track forecast. Although the latitude of the verifying T2F(35) position is better predicted by the GEFS, the longitude is better predicted by the ECEPS. While both ensemble peak WCMs correspond to a likely typhoon, in general, the GEFS has more rapid WCM increases that seem to be related to more rapid intensification periods, and this tendency will be examined in future studies.
3.1.4. Summary of the Western North Pacific Examples
Only one ECEPS and one GEFS forecast for each of the three TCs have been described because of space limitations. In
Section 4.1 and
Section 4.2, validation summary tables will be presented that include the other forecasts for the pre-Lingling and the pre-Bualoi cases with a focus on the T2F timing and position errors and the corresponding WAIP forecasts versus the WBT intensities during Lingling and Bualoi from the ECEPS and the GEFS.
One issue with these ensemble models during the TC pre-formation stage is the uncertainty in the initial and the subsequent early storm positions that are based on only a few ensemble member track positions. In the WMVM procedure, the minimum number of ensemble members to form an ensemble storm track is normally set at three, but even a weighted-mean of this small number of member track positions can lead to erratic ensemble storm positions and storm motion vectors. Furthermore, the weighted-mean storm intensities and weighted-mean Warm Core Magnitudes (WCMs) calculated from the Marchok vortex tracker at scattered initial ensemble member positions can lead to large variability. Especially for the GEFS, adjustments in the initial too-large ensemble storm intensities were necessary to agree with the JTWC WBT intensities (when available), and adjustments in some large, negative WCM values were necessary to start from 0.0 when the initial intensities were small.
In this small sample of GEFS forecasts during the last half of the 2019 western North Pacific season, JTWC WBT intensities were available for about 60% of the Storm Start times. The JTWC WBT file also contains storm position estimates (based almost exclusively on satellite imagery) that in principle can be compared with the Storm Start positions from the ensemble models. Note that these satellite position estimates during the pre-formation stage have much larger uncertainty than during the mature stage when an eye is available. As mentioned in
Section 2, one future approach will be to translate the ensemble storm WMVM track forecasts to be consistent with the initial positions according to the satellite imagery, which is expected to lead to improved positions of the T2F(25) and T2F(35) along those WMVM tracks.
In these three examples for the western North Pacific, the Likely Storm Category based on the maximum positive WCM correctly indicated a typhoon for Lingling and Bualoi, and either a weak tropical storm (ECEPS) or a tropical depression (GEFS) for TS Peipah. For disaster preparedness activities, it is more important to correctly indicate whether a typhoon should be expected. However, a correct prediction that an approaching pre-TC circulation will not become a damaging tropical storm, or a typhoon, will avoid the need to begin such disaster preparedness activities.
The combined WAIP intensity prediction technique [
13] provides guidance that is expected to be highly accurate (<5 kt) if the T2F forecast is accurate, which will be the focus of the validation summary tables to be presented in
Section 4. As mentioned above, verification intensity estimates are not available when the pre-TC circulation starts in the ensemble models before a JTWC WBT file has been initiated. In the examples in
Figure 2,
Figure 4,
Figure 9 and
Figure 11, when the T2F was accurate, the intensification stage of the combined WAIP technique performed rather well during the period immediately after the T2F(35). However, the peak intensities based on a weighted-mean of 16 analog intensities were too small when Lingling and Bualoi had an extended period of rapid intensification (defined here as 30 kt/24 h). A common too-early T2F(25) error in these examples leads to a too-early start of the intensification stage of the combined WAIP, and then the WAIP-predicted peak intensity was too early as well as being too small. Whereas the GEFS-predicted T2F(25) and WMVM track forecast inputs to the combined WAIP technique for the pre-Peipah case correctly indicated a likely TD stage, the ECEPS inputs led to a large WAIP over-prediction of the weak TS Peipah that may be attributed to selection of analogs that were already intensifying tropical storms at the initial time.
One shortcoming of this post-season validation of the ECEPS and GEFS performance in providing the WCM-based estimates of the T2F(35) is that the benefits of JTWC forecaster-satellite analyst collaboration cannot be reproduced. As described above, there are uncertainties in the track forecasts, uncertainties in the Storm Start times and positions, and uncertainties in the satellite and other observations in assessing the pre-TC circulation position, intensity, and structure. Furthermore, there are uncertainties in the capability of the ensemble model physics to predict the environmental versus the internal factors during the TC pre-formation stage. One of the factors in the decision to first focus the JHT project on the western North Pacific TCs in cooperation with the JTWC is that they have a forecaster/analyst dedicated to analyzing the TC formations each 12 h in their Area of Responsibility over the next 14 days. Using the case of pre-TY Bualoi as an example, the first WBT file entry was at 18 UTC 15 October, which is 30 h (84 h) before the Storm Start time for the ECEPS (GEFS). The means the JTWC satellite analysts and forecasters over the previous three (seven) 12 h shifts had been following the feature(s) in the satellite imagery that became the pre-Bualoi circulation in the ECEPS (GEFS). The benefits of this human forecaster-satellite analyst collaboration in assessing the ensemble model outputs cannot be measured in this study, but the expectation is that the earlier a satellite feature of a pre-TC circulation has been consistently monitored, the more accurate the current analysis of that feature will be.
