Comparison of Respiratory and Ischemic Heart Mortalities and their Relationship to the Thermal Environment


Abstract
1. Introduction
2. Materials and Methods
2.1. Data
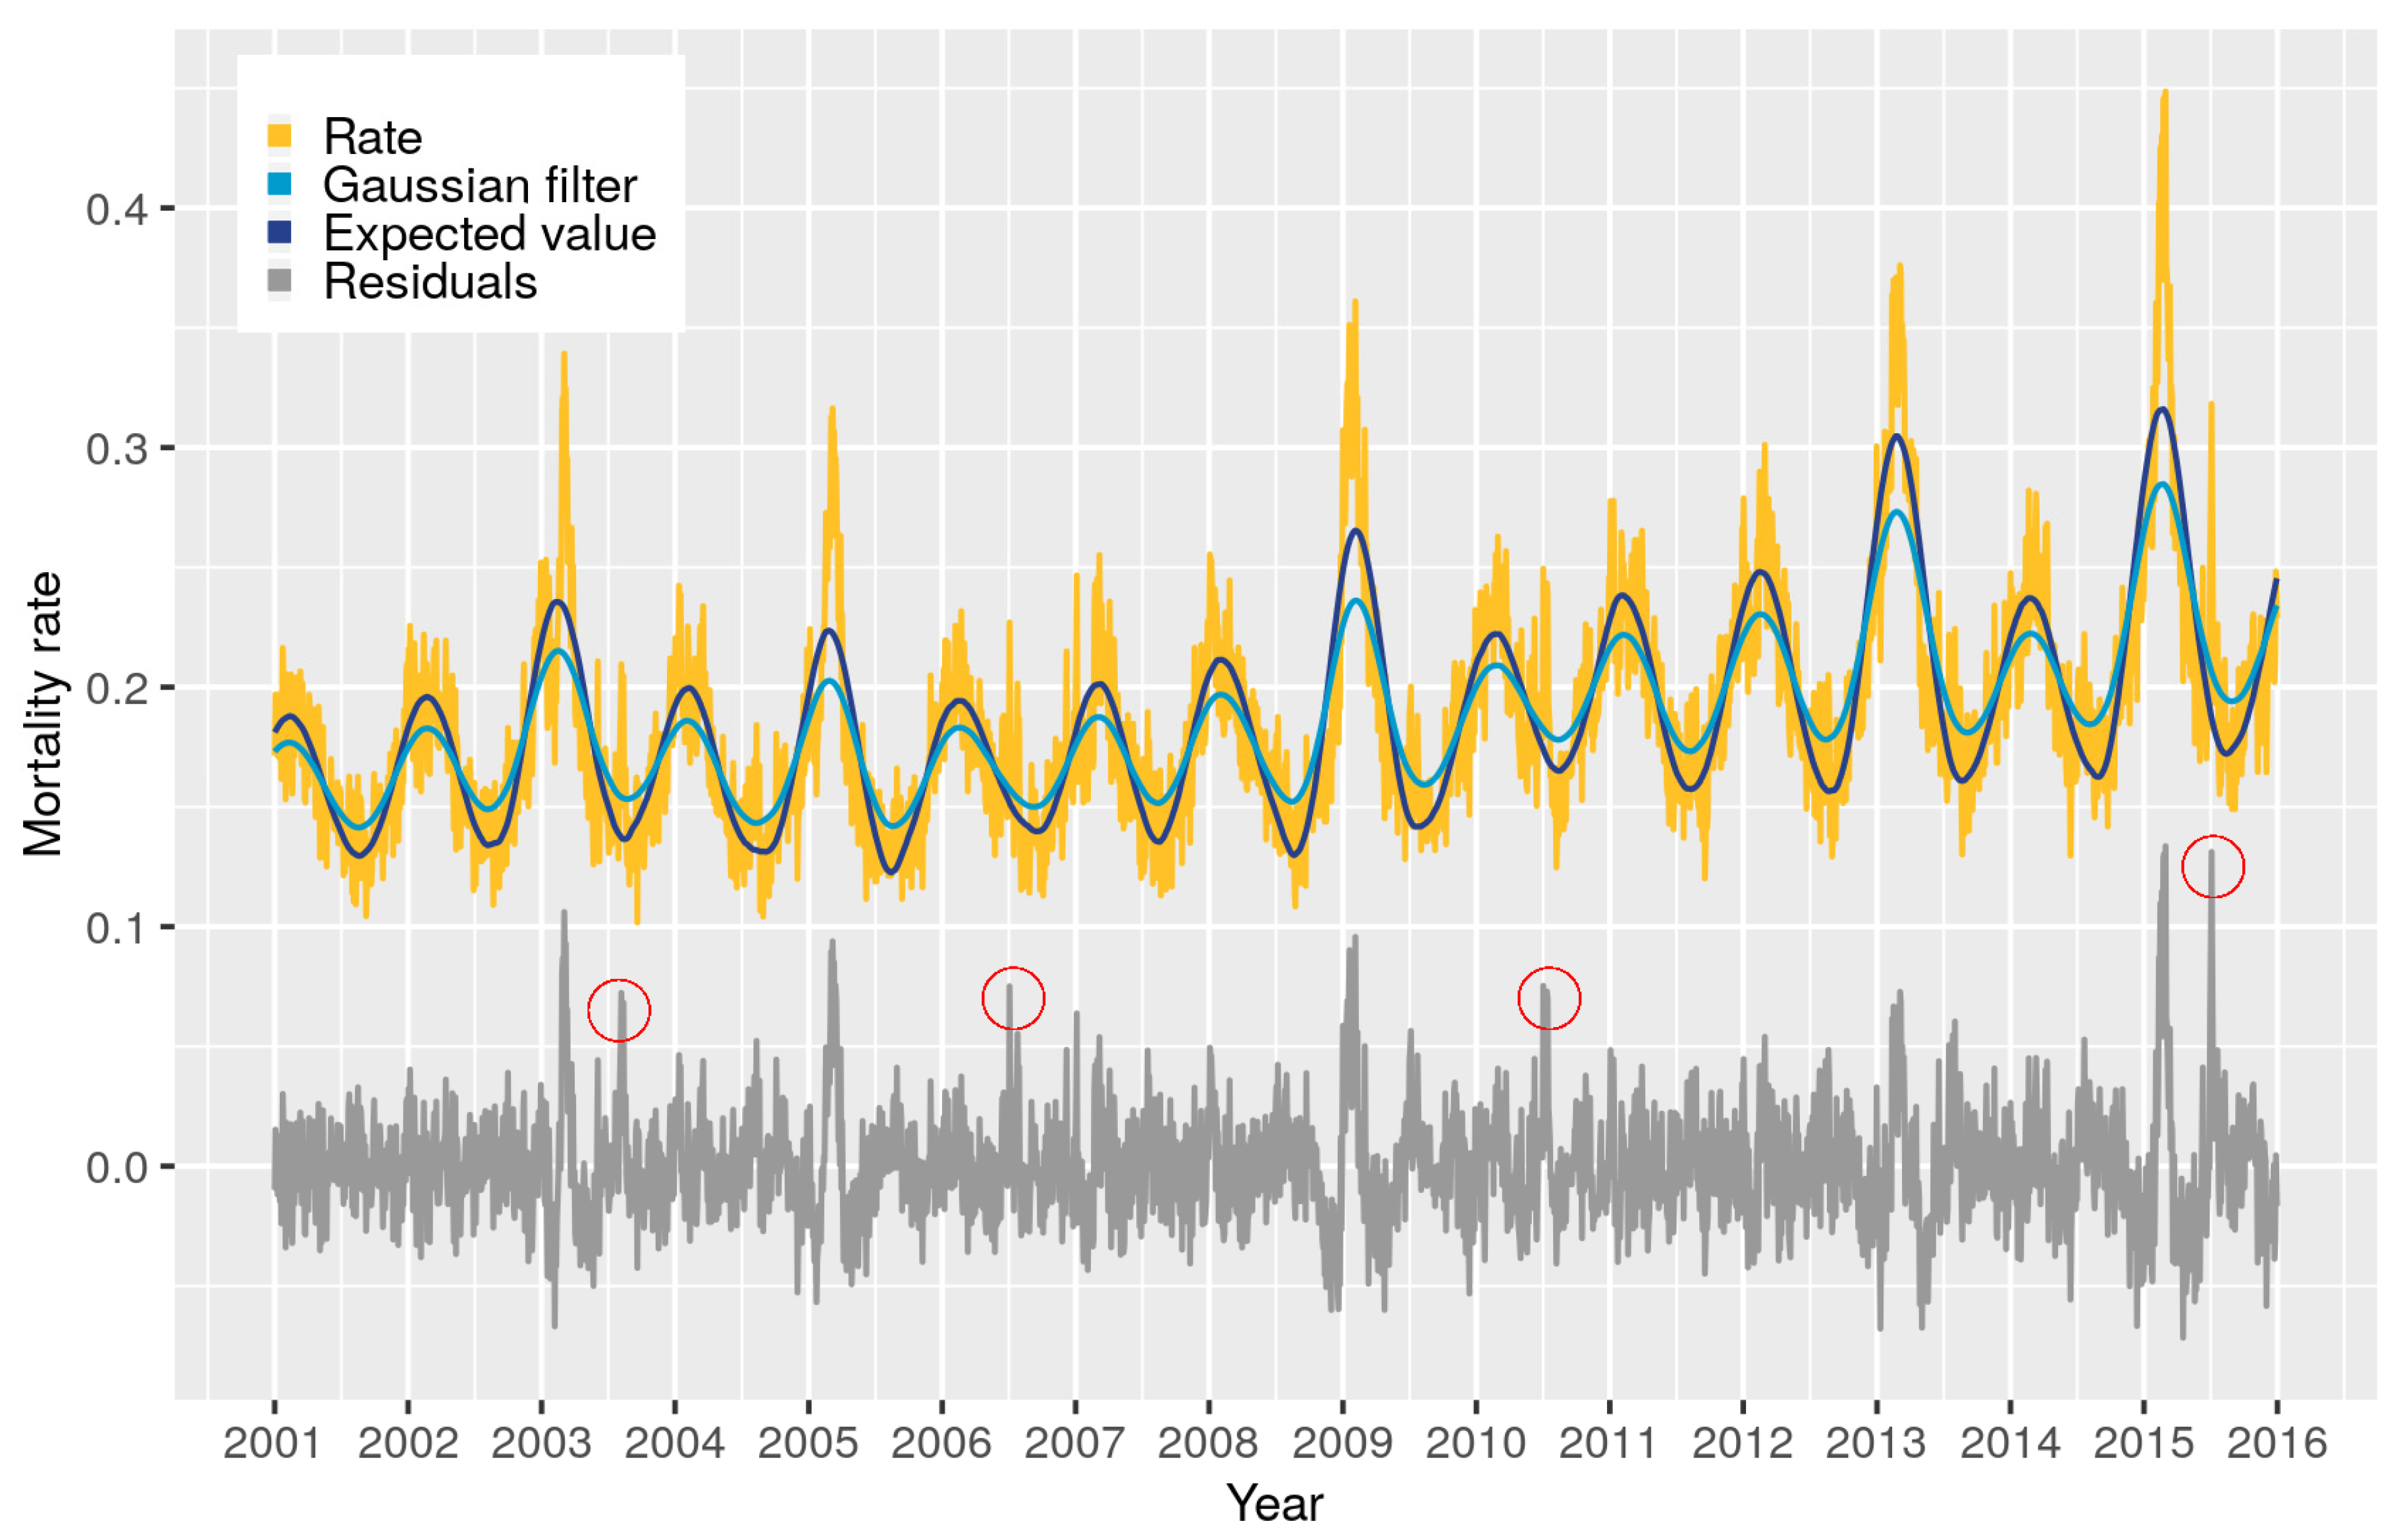
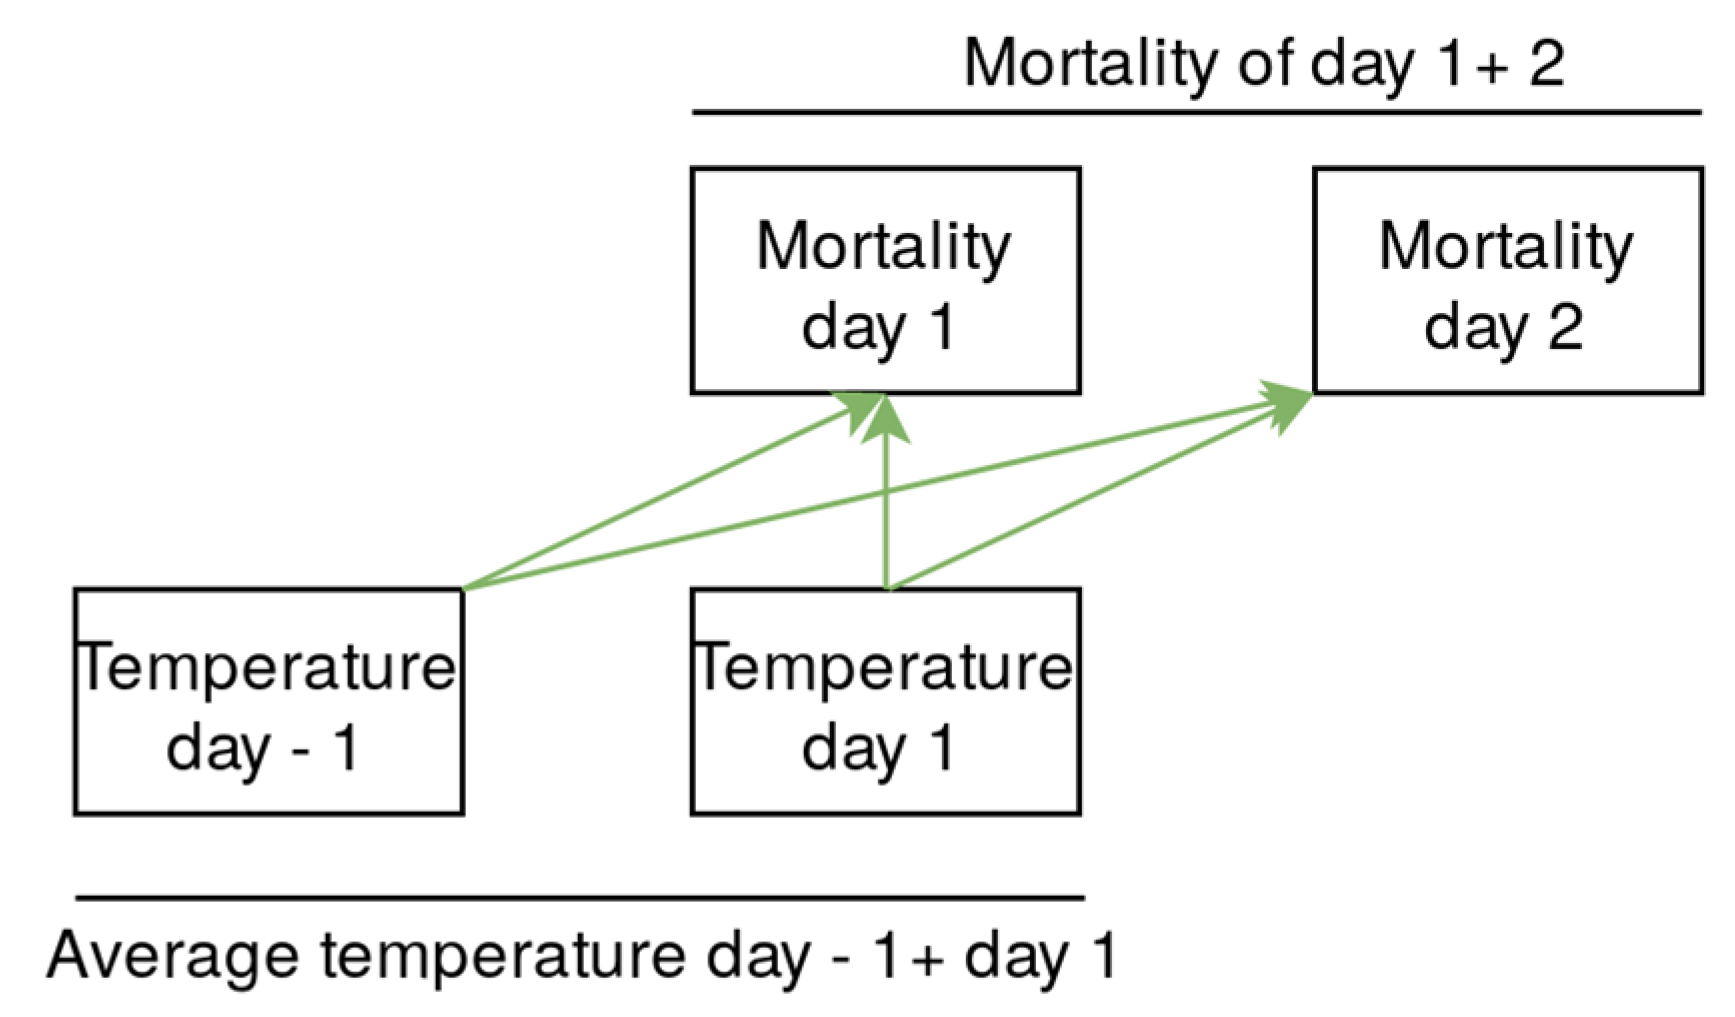
2.2. Definition of Expected Value/Relative Risk
2.3. Relationship between RR and Thermal Environment
2.4. Definition of Heat and Cold Waves
3. Results
3.1. Relationship between Mortality and Thermal Environment
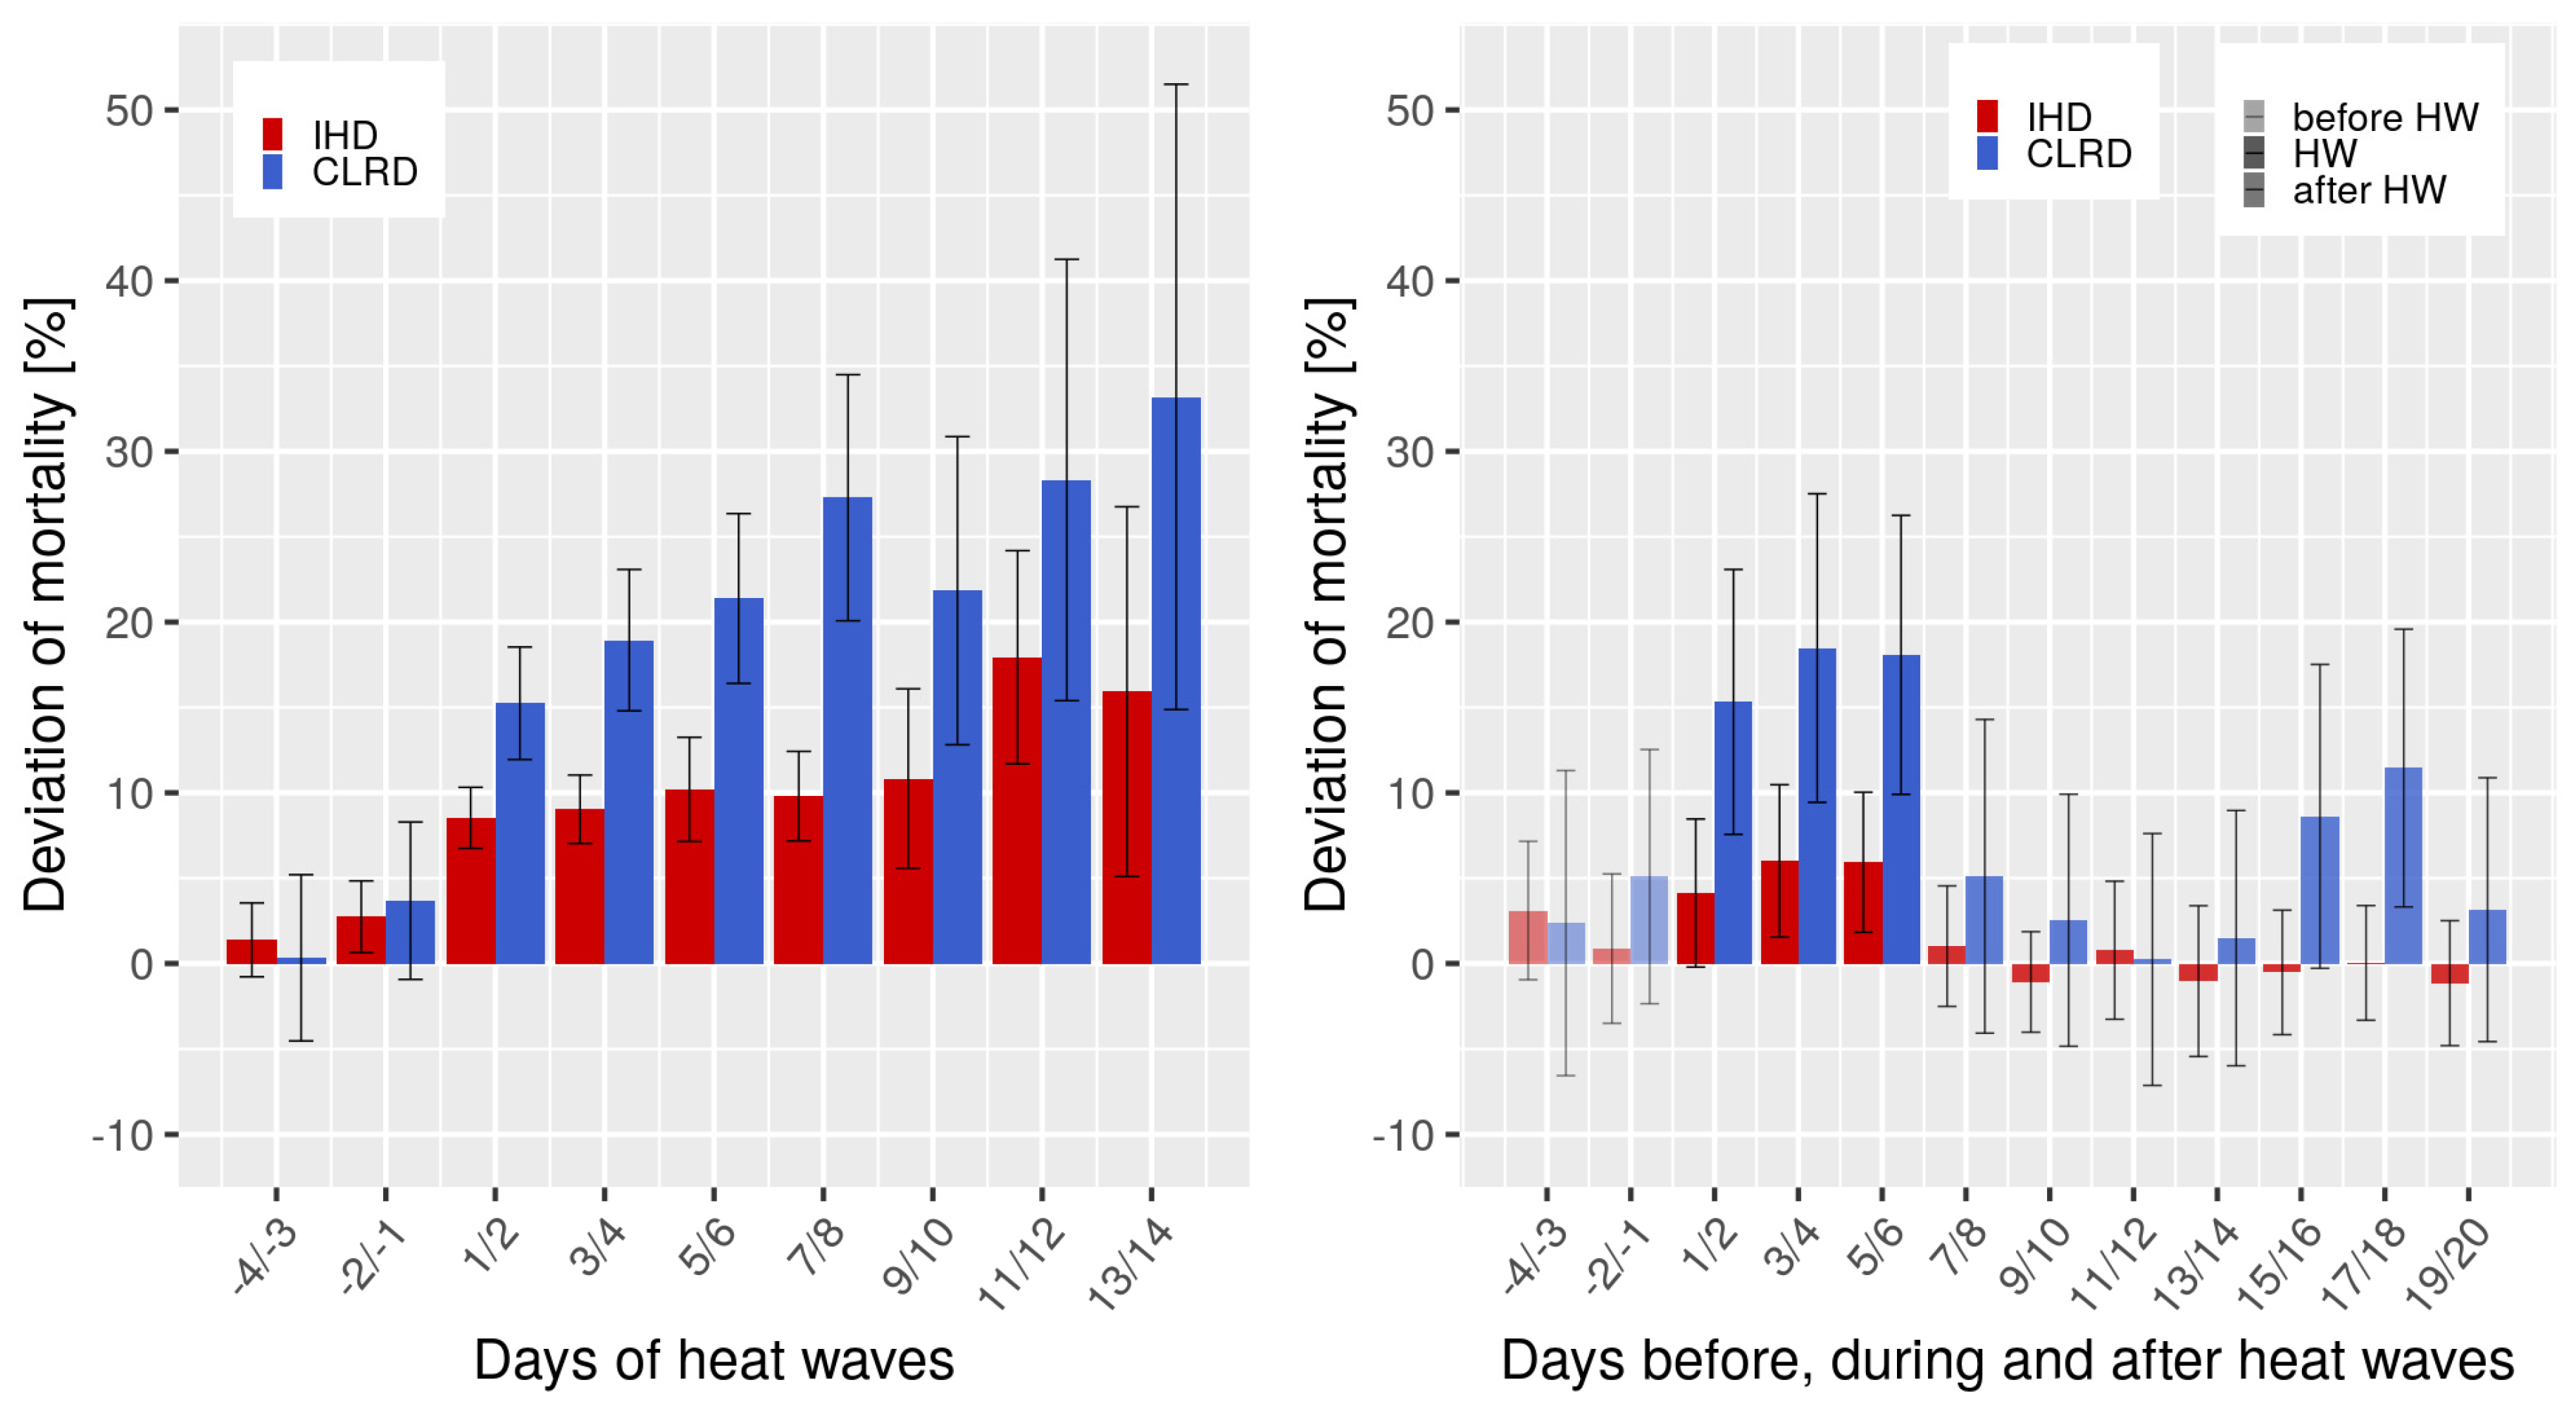
3.2. Heat Waves
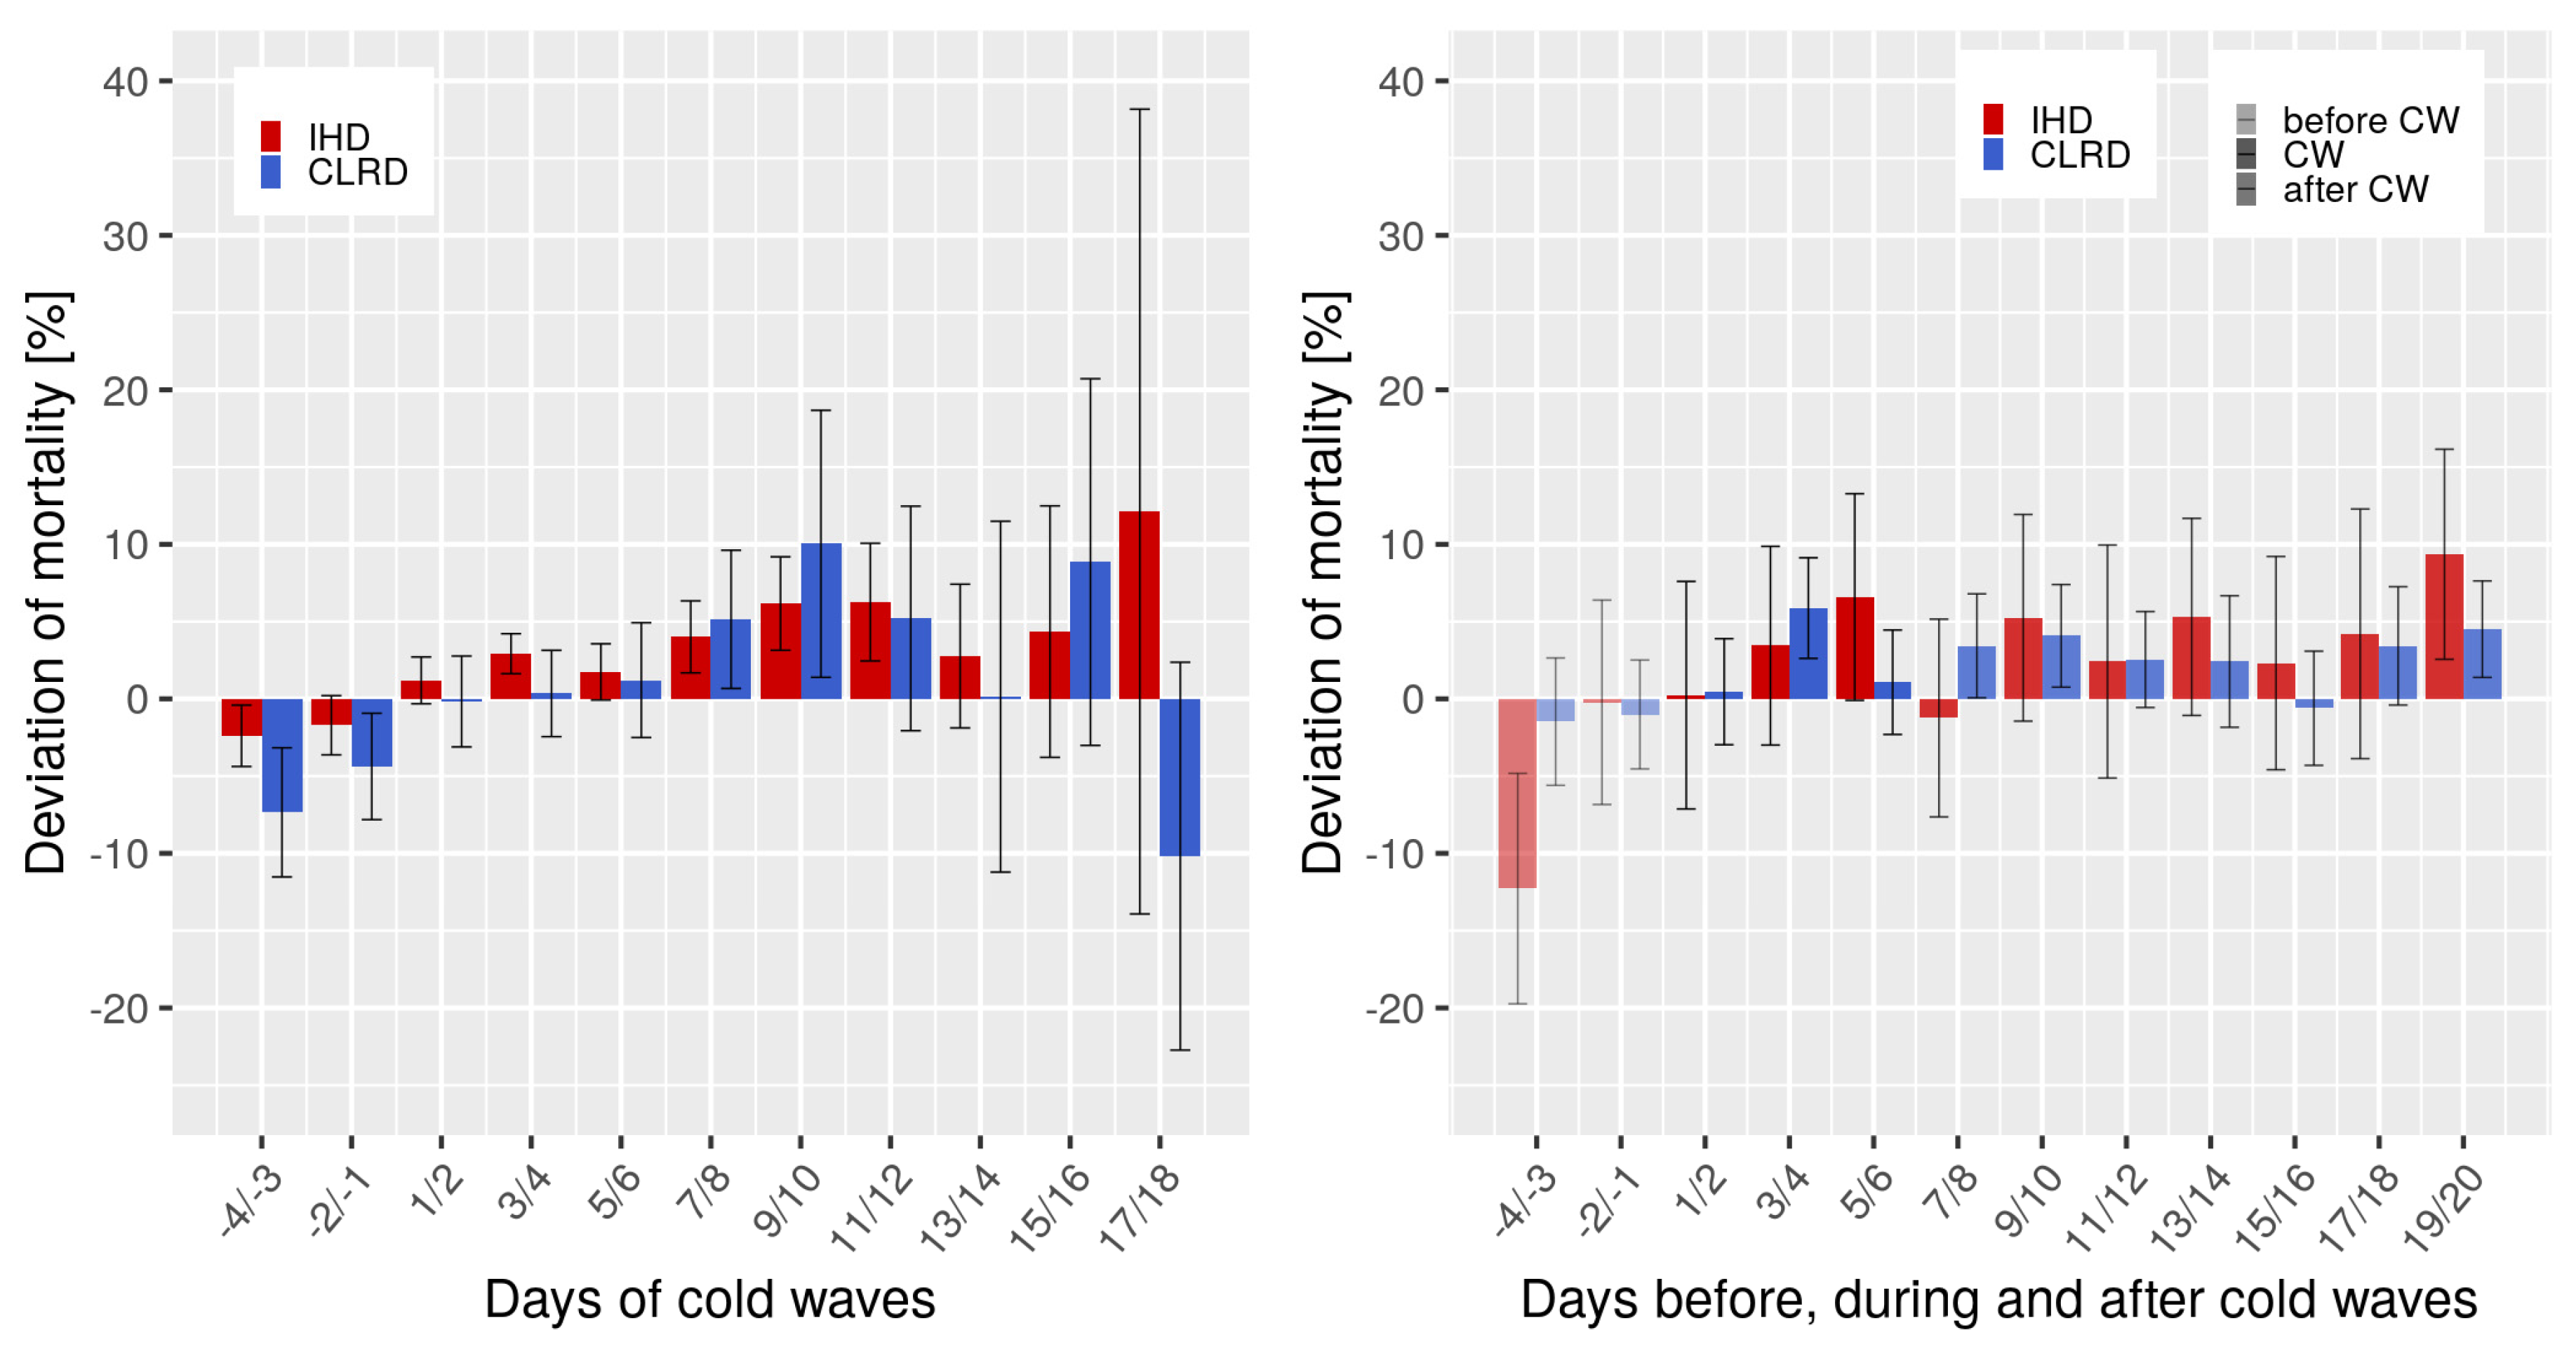
3.3. Cold Waves
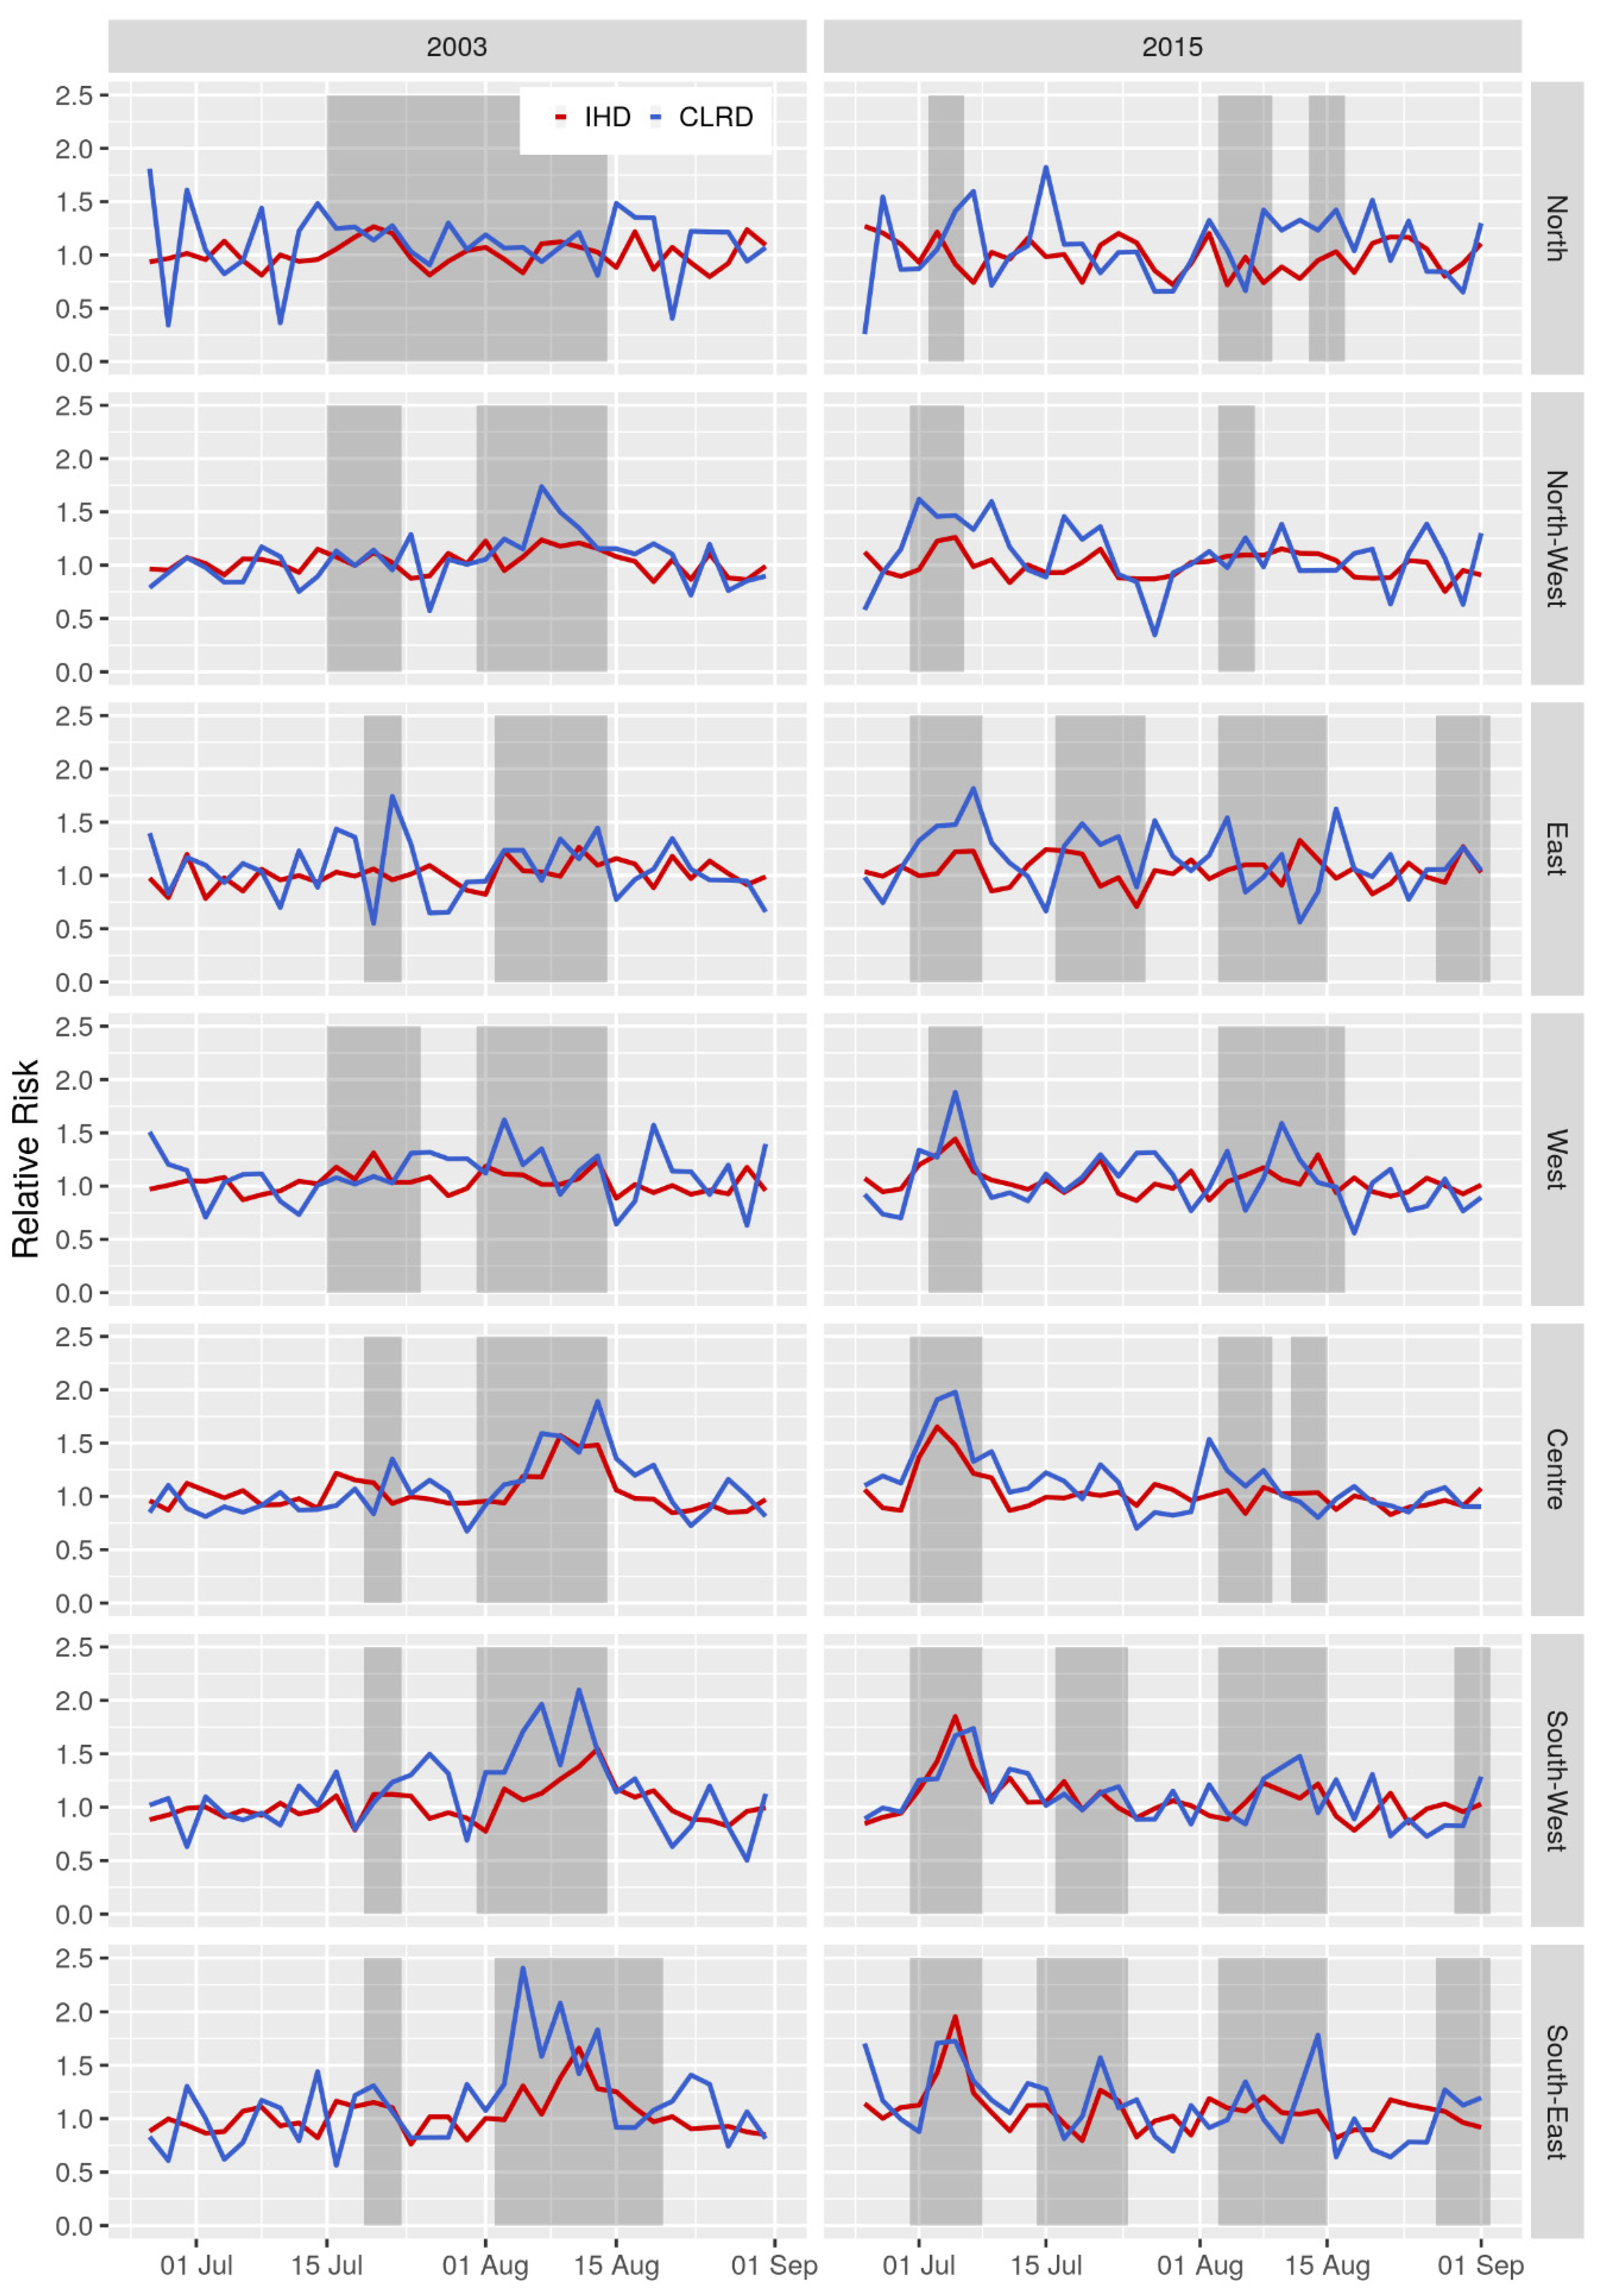
3.4. Comparing 2003 and 2015 Heat Waves
4. Discussion
5. Conclusions
Supplementary Materials
Author Contributions
Funding
Acknowledgments
Conflicts of Interest
References
- Steppuhn, H.; Buda, S.; Wienecke, A.; Kraywinkel, K.; Tolksdorf, K.; Haberland, J.; Laußmann, D.; Scheidt-Nave, C. Zeitliche Trends in der Inzidenz und Sterblichkeit respiratorischer Krankheiten von hoher Public-Health-Relevanz in Deutschland. J. Health Monit. 2017, 2, 33. [Google Scholar] [CrossRef]
- Destatis. Gesundheit—Todesursachen in Deutschland 2015; Statistisches Bundesamt: Wiesbaden, Germany, 2017; Volume Fachserie. [Google Scholar]
- Rabe, K.F.; Hurd, S.; Anzueto, A.; Barnes, P.J.; Buist, S.A.; Calverley, P.; Fukuchi, Y.; Jenkins, C.; Rodriguez-Roisin, R.; Van Weel, C. Global strategy for the diagnosis, management, and prevention of chronic obstructive pulmonary disease: GOLD executive summary. Am. J. Respir. Crit. Care Med. 2007, 176, 532–555. [Google Scholar] [CrossRef] [PubMed]
- Steppuhn, H.; Kuhnert, R.; Scheidt-Nave, C. 12-Monats-Prävalenz von Asthma bronchiale bei Erwachsenen in Deutschland. J. Health Monit. 2017, 2, 36–45. [Google Scholar] [CrossRef]
- Destatis. Gesundheitswesen—Todesursachen in Deutschland 2001; Statistisches Bundesamt: Wiesbaden, Germany, 2003; Volume Fachserie. [Google Scholar]
- Laaidi, M.; Laaidi, K.; Besancenot, J.P. Temperature-related mortality in France, a comparison between regions with different climates from the perspective of global warming. Int. J. Biometeorol. 2006, 51, 145–153. [Google Scholar] [CrossRef]
- Breitner, S.; Wolf, K.; Peters, A.; Schneider, A. Short-term effects of air temperature on cause-specific cardiovascular mortality in Bavaria, Germany. Heart 2014, 100, 1272–1280. [Google Scholar] [CrossRef]
- Muthers, S.; Laschewski, G.; Matzarakis, A. The summers 2003 and 2015 in south-west Germany: Heat waves and heat-related mortality in the context of climate change. Atmosphere 2017, 8, 224. [Google Scholar] [CrossRef]
- DWD. Deutscher Wetterdienst—Time Series and Trends. Available online: https://www.dwd.de/EN/ourservices/zeitreihen/zeitreihen.html (accessed on 7 July 2020).
- Hoffmann, B.; Hertel, S.; Boes, T.; Weiland, D.; Jockel, K.H. Increased cause-specific mortality associated with 2003 heat wave in Essen, Germany. J. Toxicol. Environ. Health. Part A 2008, 71, 759–765. [Google Scholar] [CrossRef] [PubMed]
- IPCC. Summary for policymakers. In Climate Change 2013: The Physical Science Basis, Contribution of Working Group I to the Fifth Assessment Report of the Intergovernmental Panel on Climate Change; Stocker, T., Qin, D., Plattner, G., Tignor, M., Allen, S., Boschung, J., Nauels, A., Xia, Y., Bex, V., Midgley, P., Eds.; Cambridge University Press: Cambridge UK; New York, NY, USA, 2013. [Google Scholar]
- Arbuthnott, K.G.; Hajat, S. The health effects of hotter summers and heat waves in the population of the United Kingdom: A review of the evidence. Environ. Health A Glob. Access Sci. Source 2017, 16, 119. [Google Scholar] [CrossRef]
- Bunker, A.; Wildenhain, J.; Vandenbergh, A.; Henschke, N.; Rocklöv, J.; Hajat, S.; Sauerborn, R. Effects of air temperature on climate-sensitive mortality and morbidity outcomes in the elderly; a systematic review and meta-analysis of epidemiological evidence. EBioMedicine 2016, 6, 258–268. [Google Scholar] [CrossRef] [PubMed]
- Phung, D.; Thai, P.K.; Guo, Y.; Morawska, L.; Rutherford, S.; Chu, C. Ambient temperature and risk of cardiovascular hospitalization: An updated systematic review and meta-analysis. Sci. Total Environ. 2016, 550, 1084–1102. [Google Scholar] [CrossRef] [PubMed]
- Song, X.; Wang, S.; Hu, Y.; Yue, M.; Zhang, T.; Liu, Y.; Tian, J.; Shang, K. Impact of ambient temperature on morbidity and mortality: An overview of reviews. Sci. Total Environ. 2017, 586, 241–254. [Google Scholar] [CrossRef] [PubMed]
- Sun, Z.; Chen, C.; Xu, D.; Li, T. Effects of ambient temperature on myocardial infarction: A systematic review and meta-analysis. Environ. Pollut. 2018, 241, 1106–1114. [Google Scholar] [CrossRef] [PubMed]
- Zacharias, S.; Koppe, C.; Mücke, H.-G. Climate Change Effects on Heat Waves and Future Heat Wave-Associated IHD Mortality in Germany. Climate 2015, 3, 100–117. [Google Scholar] [CrossRef]
- Zacharias, S.; Koppe, C.; Mücke, H.-G. Influence of heat waves on ischemic heart diseases in Germany. Climate 2014, 2, 133–152. [Google Scholar] [CrossRef]
- Chen, K.; Breitner, S.; Wolf, K.; Hampel, R.; Meisinger, C.; Heier, M.; von Scheidt, W.; Kuch, B.; Peters, A.; Schneider, A. Temporal variations in the triggering of myocardial infarction by air temperature in Augsburg, Germany, 1987–2014. Eur. Heart J. 2019, 40, 1600–1608. [Google Scholar] [CrossRef]
- Staiger, H.; Laschewski, G.; Grätz, A. The perceived temperature–a versatile index for the assessment of the human thermal environment. Part A: Scientific basics. Int. J. Biometeorol. 2012, 56, 165–176. [Google Scholar] [CrossRef]
- Staiger, H.; Laschewski, G.; Matzarakis, A. Selection of appropriate thermal indices for applications in human biometeorological studies. Atmosphere 2019, 10, 18. [Google Scholar] [CrossRef]
- Matzarakis, A.; Rutz, F.; Mayer, H. Modelling radiation fluxes in simple and complex environments: Basics of the RayMan model. Int. J. Biometeorol. 2010, 54, 131–139. [Google Scholar] [CrossRef]
- Koppe, C.; Jendritzky, G. Inclusion of short-term adaptation to thermal stresses in a heat load warning procedure. Meteorol. Z. 2005, 14, 271–278. [Google Scholar] [CrossRef]
- Laschewski, G.; Jendritzky, G. Effects of the thermal environment on human health: An investigation of 30 years of daily mortality data from SW Germany. Clim. Res. 2002, 21, 91–103. [Google Scholar] [CrossRef]
- Schönwiese, C.D. Praktische Statistik für Meteorologen und Geowissenschaftler (Practical Statistics for Meteorologists and Geoscientists), 3rd ed.; Gebrüder Bornträger Verlag: Berlin, Germany; Stuttgart, Germany, 2000; p. 298. [Google Scholar]
- Taubenheim, J. Statistische Auswertung geophysikalischer und meteorologischer Daten In Geographische Monographien; Akademische Verlagsgesellschaft Geest und Portig: Leipzig, Germany, 1969; Volume 5, pp. 311–345. [Google Scholar]
- Team, R.C. R: A Language and Environment for Statistical Computing; R Foundation for Statistical Computing: Vienna, Austria, 2019. [Google Scholar]
- Basu, R.; Malig, B. High ambient temperature and mortality in California: Exploring the roles of age, disease, and mortality displacement. Environ. Res. 2011, 111, 1286–1292. [Google Scholar] [CrossRef]
- Breitner, S.; Wolf, K.; Devlin, R.B.; Diaz-Sanchez, D.; Peters, A.; Schneider, A. Short-term effects of air temperature on mortality and effect modification by air pollution in three cities of Bavaria, Germany: A time-series analysis. Sci. Total Environ. 2014, 485–486, 49–61. [Google Scholar] [CrossRef] [PubMed]
- D’Ippoliti, D.; Michelozzi, P.; Marino, C.; de’Donato, F.; Menne, B.; Katsouyanni, K.; Kirchmayer, U.; Analitis, A.; Medina-Ramon, M.; Paldy, A.; et al. The impact of heat waves on mortality in 9 European cities: Results from the EuroHEAT project. Environ. Health 2010, 9, 37. [Google Scholar] [CrossRef]
- Gasparrini, A.; Armstrong, B.; Kovats, S.; Wilkinson, P. The effect of high temperatures on cause-specific mortality in England and Wales. Occup. Environ. Med. 2012, 69, 56–61. [Google Scholar] [CrossRef] [PubMed]
- Hajat, S.; Kovats, R.S.; Atkinson, R.W.; Haines, A. Impact of hot temperatures on death in London: A time series approach. J. Epidemiol. Community Health 2002, 56, 367–372. [Google Scholar] [CrossRef]
- Baccini, M.; Biggeri, A.; Accetta, G.; Kosatsky, T.; Katsouyanni, K.; Analitis, A.; Anderson, H.R.; Bisanti, L.; D’ippoliti, D.; Danova, J. Heat effects on mortality in 15 European cities. Epidemiology 2008, 19, 711–719. [Google Scholar] [CrossRef]
- Cheng, X.; Su, H. Effects of climatic temperature stress on cardiovascular diseases. Eur. J. Intern. Med. 2010, 21, 164–167. [Google Scholar] [CrossRef]
- Keatinge, W.R.; Coleshaw, S.R.; Easton, J.C.; Cotter, F.; Mattock, M.B.; Chelliah, R. Increased platelet and red cell counts, blood viscosity, and plasma cholesterol levels during heat stress, and mortality from coronary and cerebral thrombosis. Am. J. Med. 1986, 81, 795–800. [Google Scholar] [CrossRef]
- Anderson, G.B.; Dominici, F.; Wang, Y.; McCormack, M.C.; Bell, M.L.; Peng, R.D. Heat-related emergency hospitalizations for respiratory diseases in the Medicare population. Am. J. Respir. Crit. Care Med. 2013, 187, 1098–1103. [Google Scholar] [CrossRef]
- Mannino, D.; Watt, G.; Hole, D.; Gillis, C.; Hart, C.; McConnachie, A.; Smith, G.D.; Upton, M.; Hawthorne, V.; Sin, D. The natural history of chronic obstructive pulmonary disease. Eur. Respir. J. 2006, 27, 627–643. [Google Scholar] [CrossRef]
- Hayes, D., Jr.; Collins, P.B.; Khosravi, M.; Lin, R.-L.; Lee, L.-Y. Bronchoconstriction triggered by breathing hot humid air in patients with asthma: Role of cholinergic reflex. Am. J. Respir. Crit. Care Med. 2012, 185, 1190–1196. [Google Scholar] [CrossRef] [PubMed]
- Anderson, G.B.; Bell, M.L. Heat waves in the United States: Mortality risk during heat waves and effect modification by heat wave characteristics in 43 US communities. Environ. Health Perspect. 2011, 119, 210–218. [Google Scholar] [CrossRef] [PubMed]
- Analitis, A.; Katsouyanni, K.; Biggeri, A.; Baccini, M.; Forsberg, B.; Bisanti, L.; Kirchmayer, U.; Ballester, F.; Cadum, E.; Goodman, P. Effects of cold weather on mortality: Results from 15 European cities within the PHEWE project. Am. J. Epidemiol. 2008, 168, 1397–1408. [Google Scholar] [CrossRef] [PubMed]
- Carder, M.; McNamee, R.; Beverland, I.; Elton, R.; Cohen, G.R.; Boyd, J.; Agius, R.M. The lagged effect of cold temperature and wind chill on cardiorespiratory mortality in Scotland. Occup. Environ. Med. 2005, 62, 702–710. [Google Scholar] [CrossRef]
- Revich, B.; Shaposhnikov, D. Temperature-induced excess mortality in Moscow, Russia. Int. J. Biometeorol. 2008, 52, 367–374. [Google Scholar] [CrossRef]
- Monteiro, A.; Carvalho, V.; Oliveira, T.; Sousa, C. Excess mortality and morbidity during the July 2006 heat wave in Porto, Portugal. Int. J. Biometeorol. 2013, 57, 155–167. [Google Scholar] [CrossRef]
- Monteiro, A.; Velho, S. Health heat stress in the Porto Metropolitan Area—A matter of temperature or inadequate adaptation? Erde 2014, 145, 80–95. [Google Scholar]
- Burkart, K.; Canário, P.; Breitner, S.; Schneider, A.; Scherber, K.; Andrade, H.; Alcoforado, M.J.; Endlicher, W. Interactive short-term effects of equivalent temperature and air pollution on human mortality in Berlin and Lisbon. Environ. Pollut. 2013, 183, 54–63. [Google Scholar] [CrossRef]
- Buckley, J.P.; Samet, J.M.; Richardson, D.B. Commentary: Does air pollution confound studies of temperature? Epidemiology 2014, 25, 242–245. [Google Scholar] [CrossRef]
- Barnett, A.G.; Tong, S.; Clements, A.C. What measure of temperature is the best predictor of mortality? Environ. Res. 2010, 110, 604–611. [Google Scholar] [CrossRef]
- Vaneckova, P.; Neville, G.; Tippett, V.; Aitken, P.; FitzGerald, G.; Tong, S. Do biometeorological indices improve modeling outcomes of heat-related mortality? J. Appl. Meteorol. Climatol. 2011, 50, 1165–1176. [Google Scholar] [CrossRef]


| Region | Total Number of Deaths 2001–2015 | Two-Day Average | Deaths Per Two-Day and 100,000 Inhabitants (rate) | |||
|---|---|---|---|---|---|---|
| CLRD | IHD | CLRD | IHD | CLRD | IHD | |
| Germany | 419,589 | 2,102,169 | 153 | 767 | 0.19 | 0.93 |
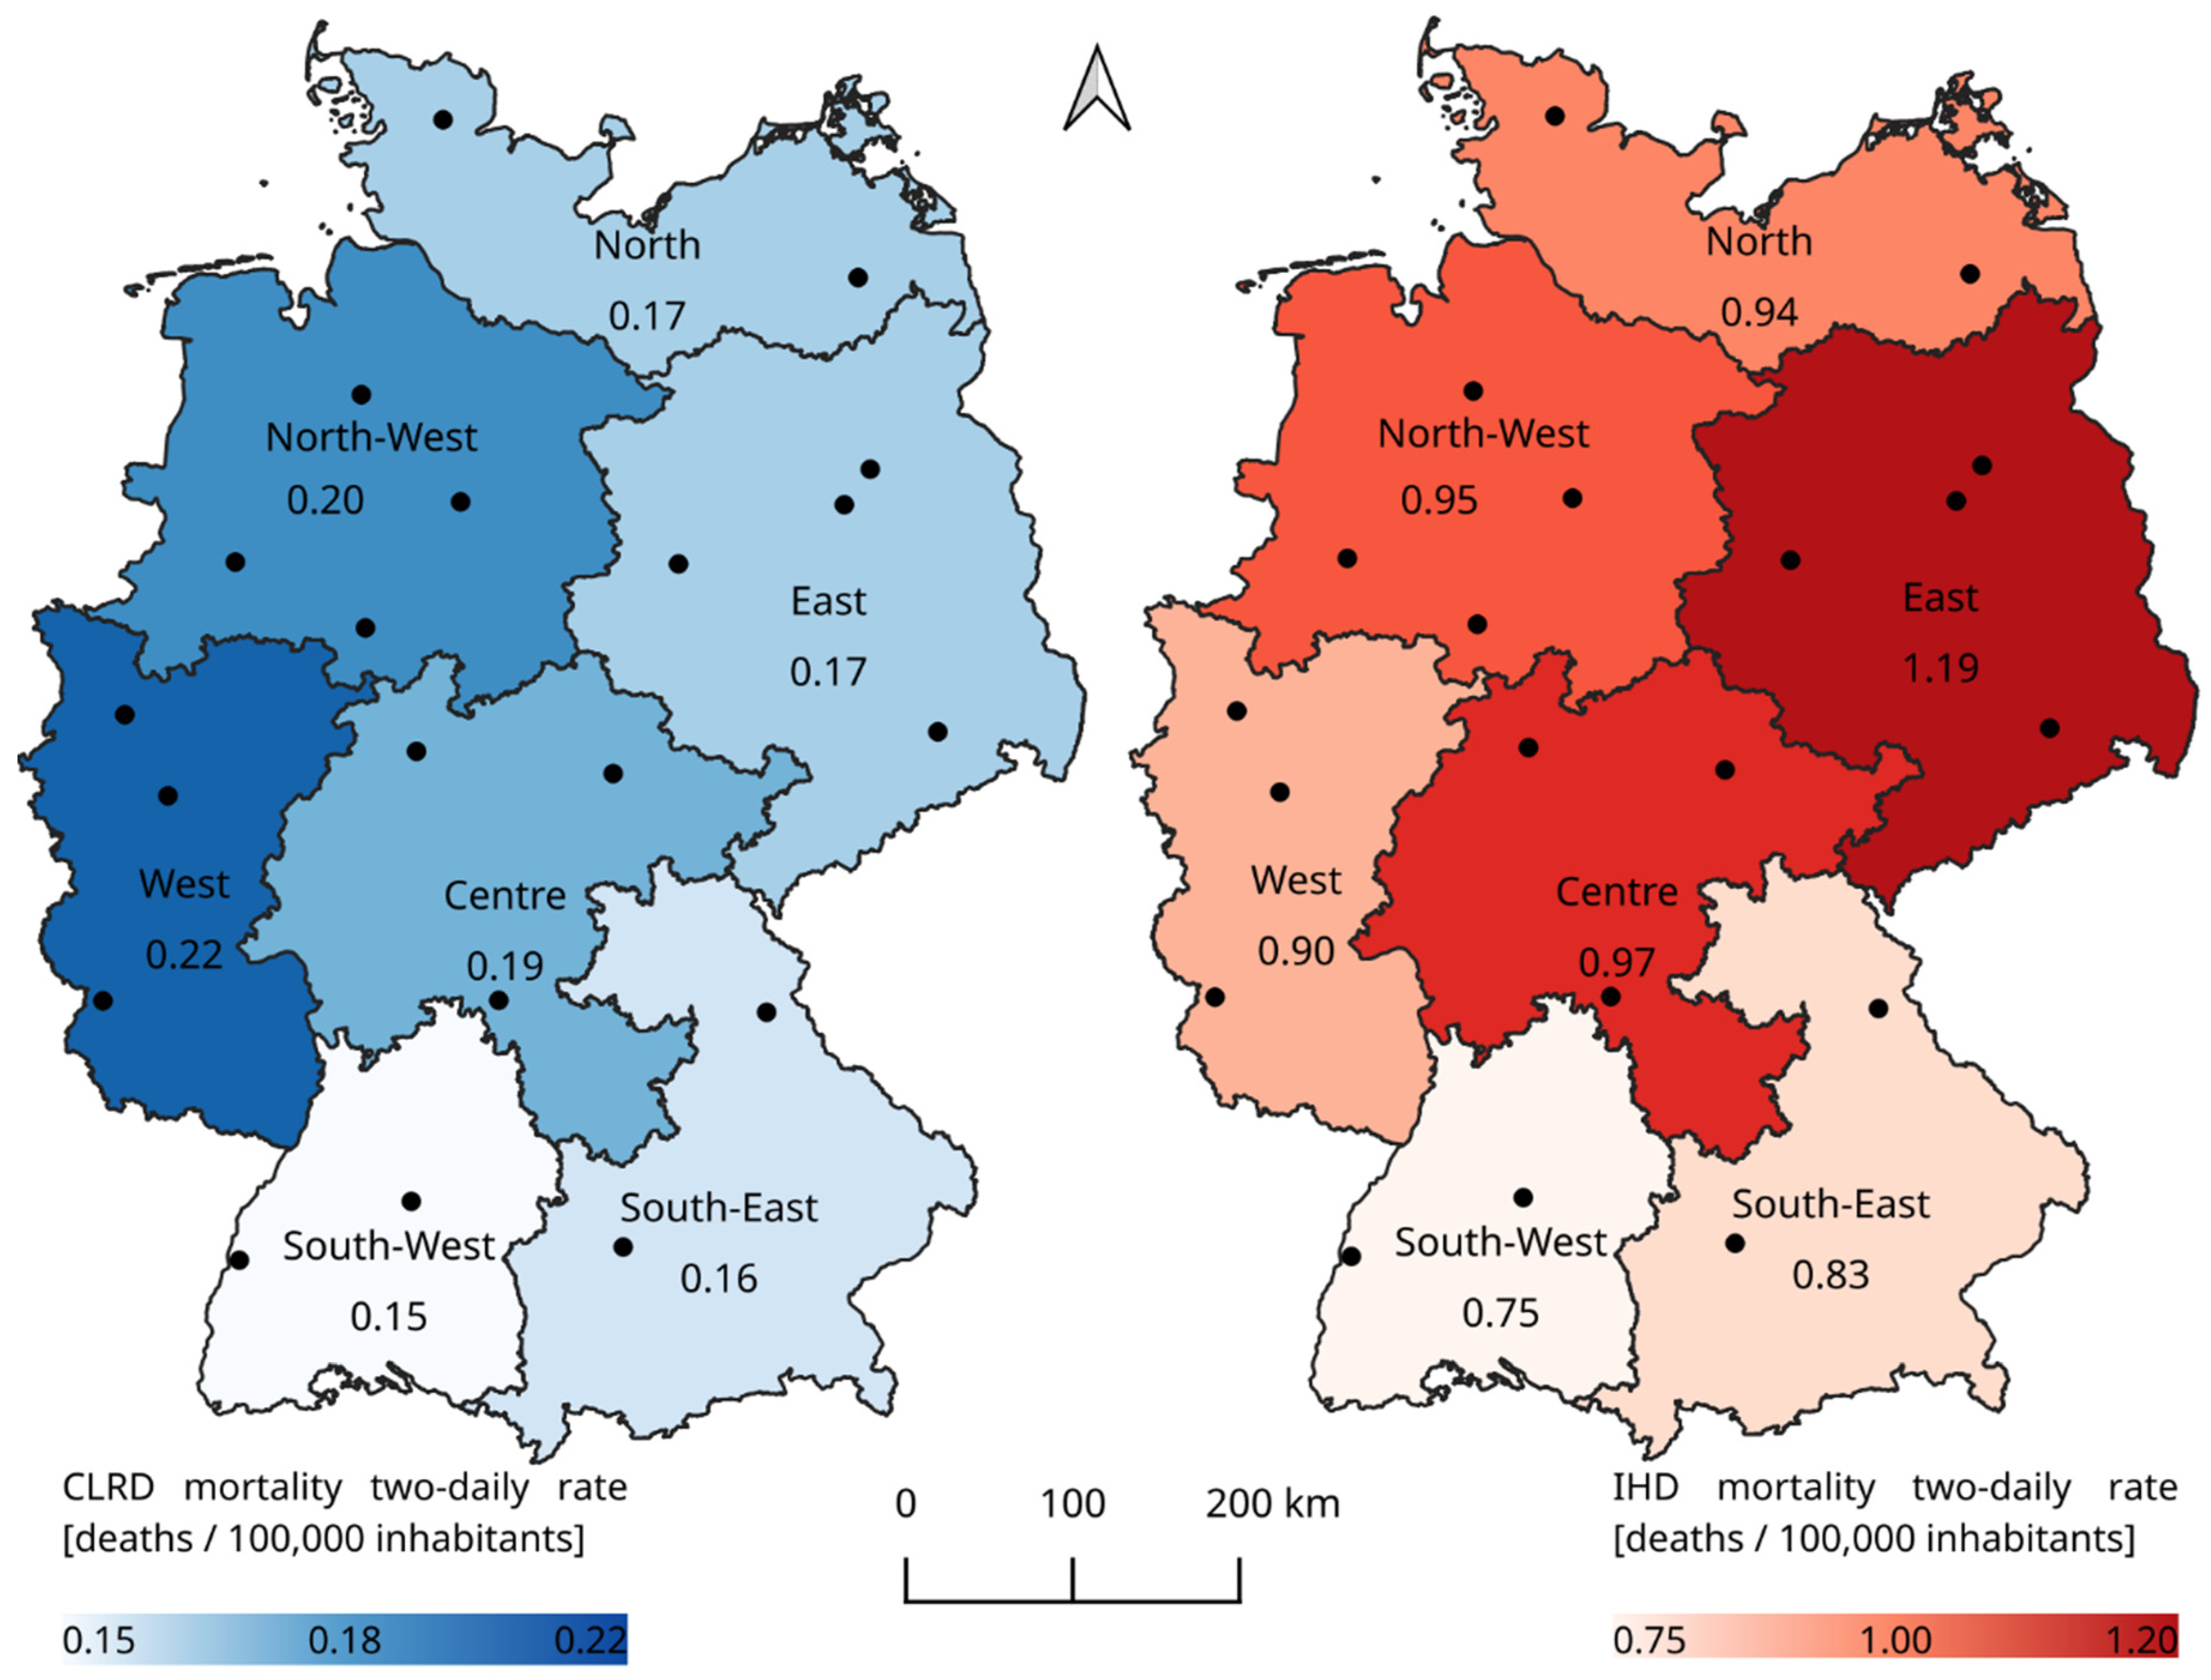
| North | 29,673 | 161,020 | 10 | 57 | 0.17 | 0.94 |
| North-West | 73,785 | 343,262 | 26 | 124 | 0.20 | 0.95 |
| East | 59,088 | 408,354 | 20 | 147 | 0.17 | 1.19 |
| West | 111,485 | 451,346 | 39 | 162 | 0.22 | 0.90 |
| Centre | 58,024 | 301,360 | 20 | 108 | 0.19 | 0.97 |
| South-West | 45,105 | 220,814 | 16 | 80 | 0.15 | 0.75 |
| South-East | 42,429 | 216,013 | 15 | 78 | 0.16 | 0.83 |
| Region | Ta Thresholds (°C) | Gradients of RR Below/Above TH (%/°C) (CI) | ||||||
|---|---|---|---|---|---|---|---|---|
| CLRD | IHD | CLRD | IHD | |||||
| THL | THU | THL | THU | <THL | >THU | <THL | >THU | |
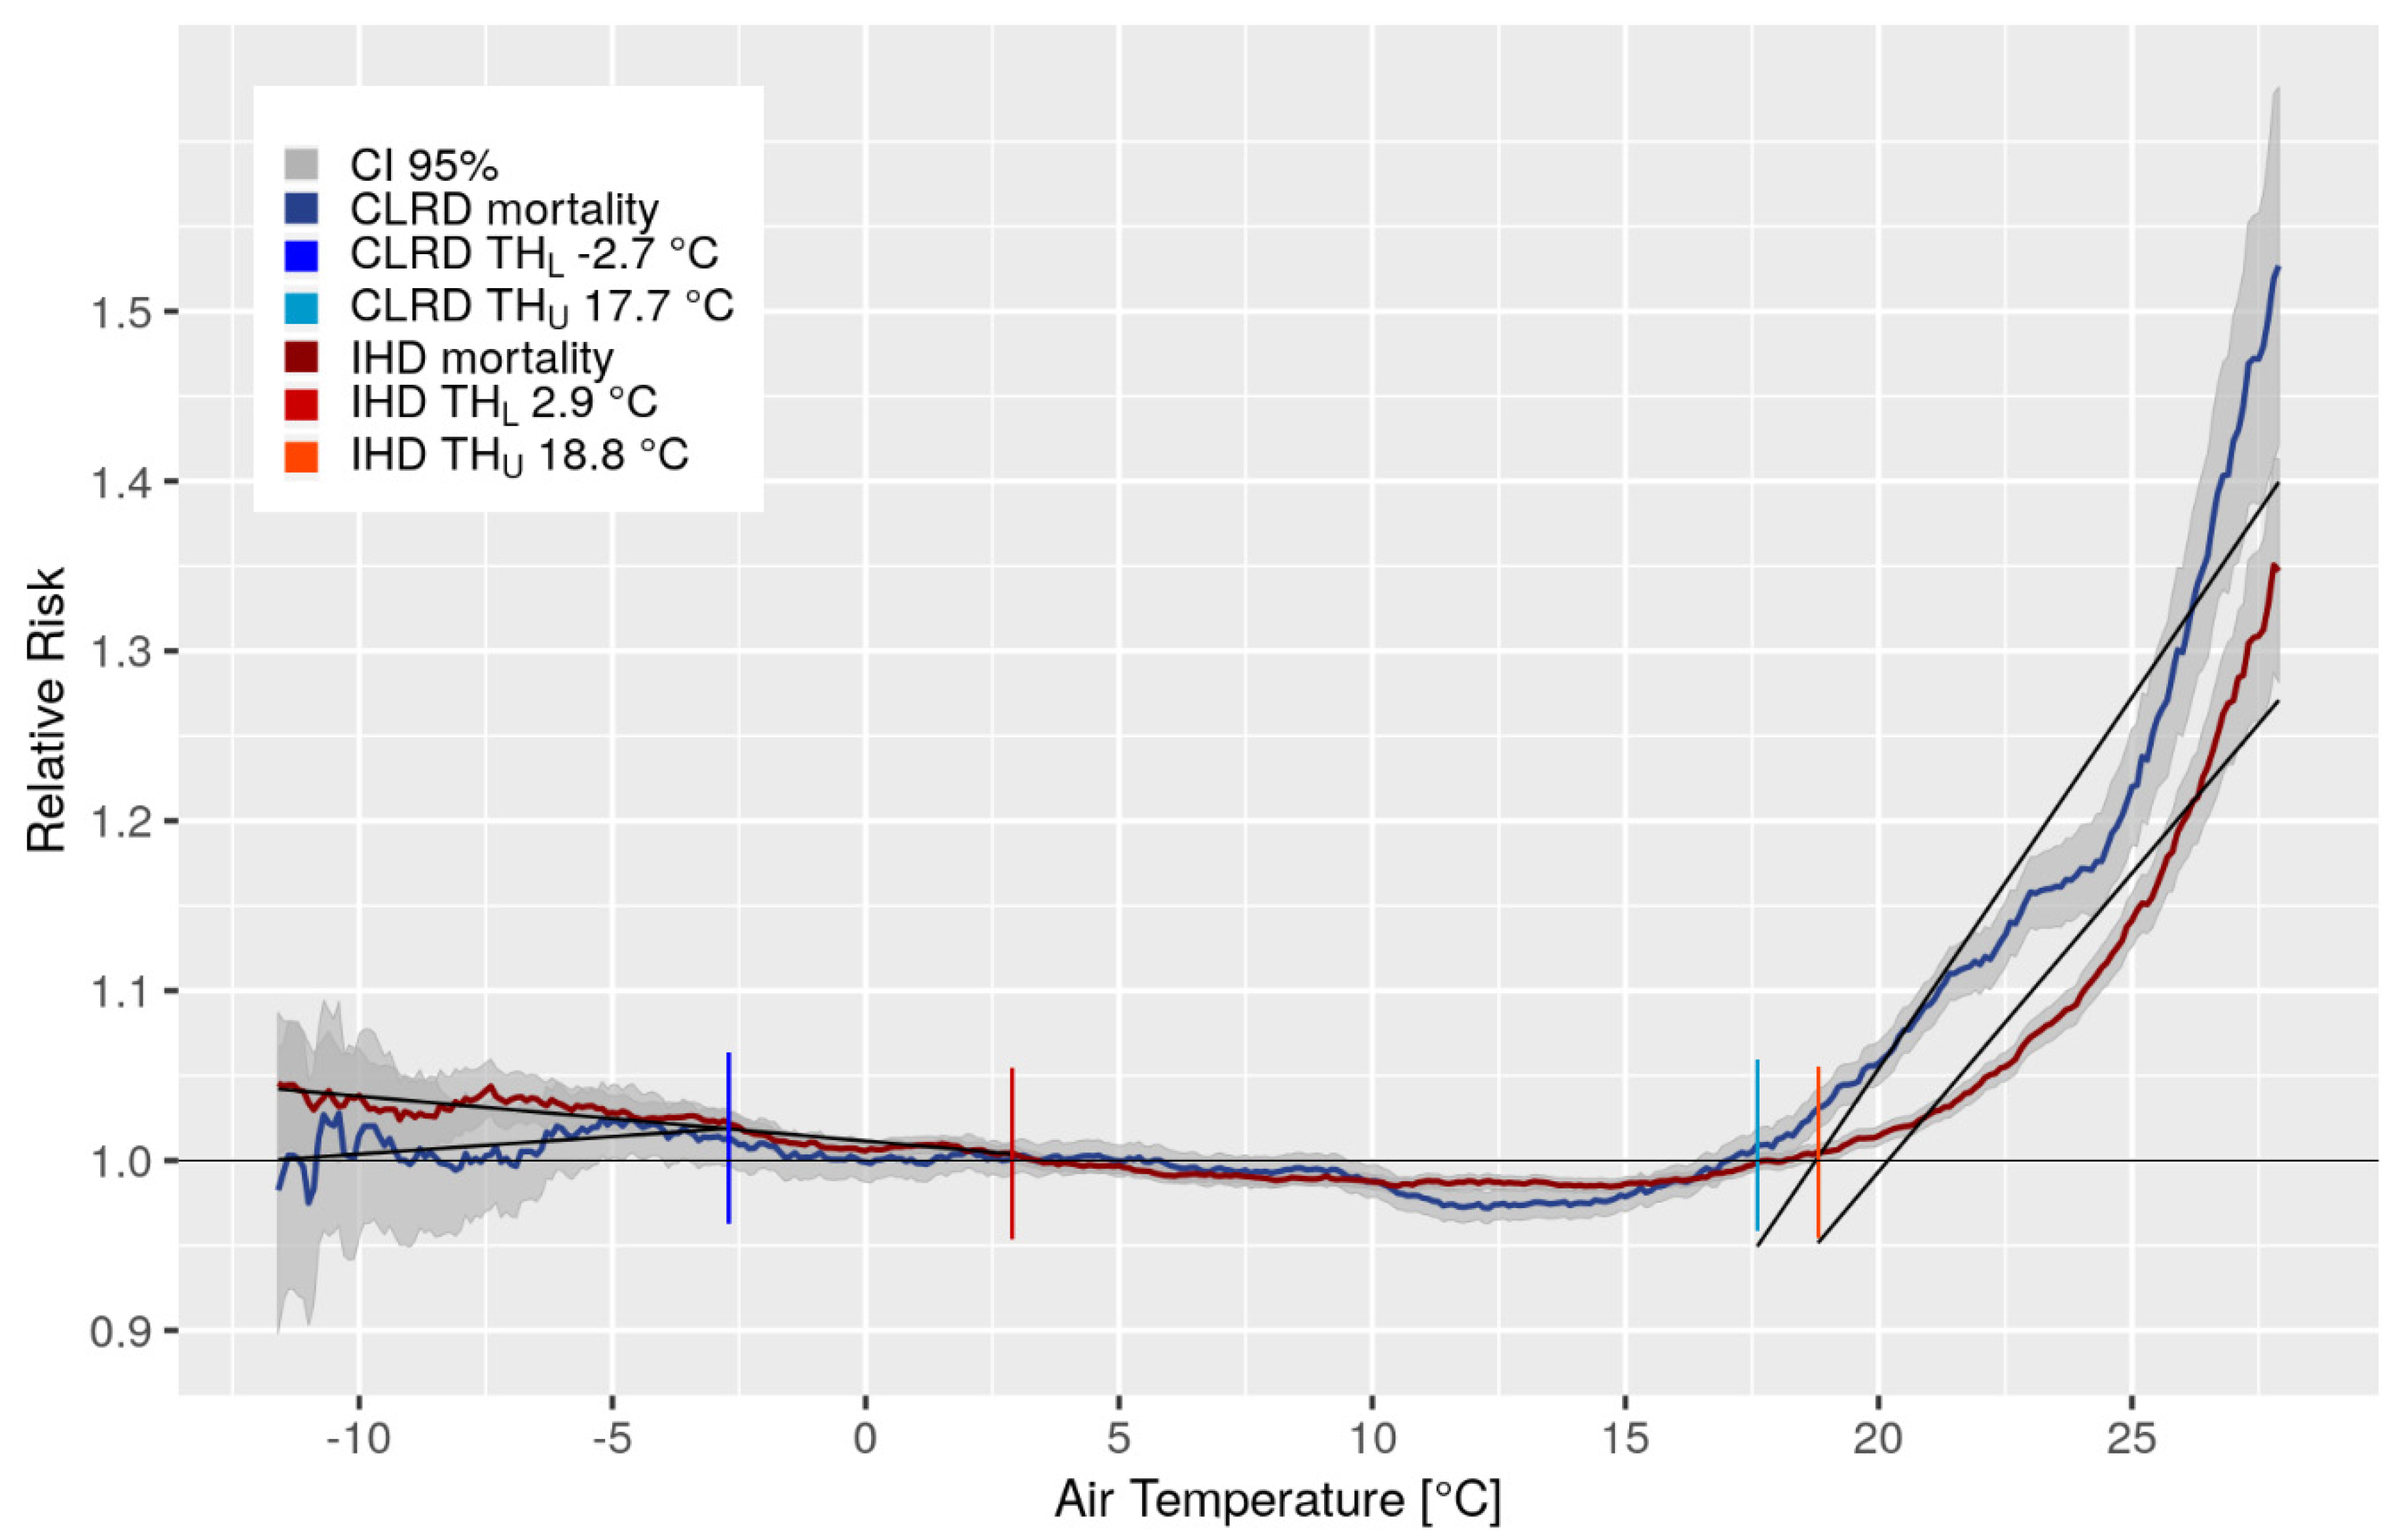
| Germany | −2.7 | 17.6 | 2.9 | 18.8 | 0.2 (±0.1) | 4.4 (±0.3) | −0.3 (±0.0) | 3.5 (±0.2) |
| North | - | 16.0 | −6.4 | 20.3 | - | 3.7 (±0.3) | - * | 2.6 (±0.3) |
| North-West | 1.7 | 18.0 | 2.4 | 18.3 | −0.1 (0.2) | 3.6 (±0.2) | −0.6 (±0.1) | 2.1 (±0.2) |
| East | −4.1 | 18.5 | 2.4 | 20.1 | 0.5 (±0.3) | 1.9 (±0.2) | 0.0 (±0.0) | 2.9 (±0.2) |
| West | - | 18.5 | 3.4 | 19.3 | - | 3.5 (±0.2) | −0.2 (±0.0) | 3.0 (±0.3) |
| Centre | - | 18.5 | 2.1 | 20.3 | - | 3.2 (±0.2) | −0.3 (±0.0) | 2.6 (±0.1) |
| South-West | 0.7 | 19.5 | −0.1 | 20.1 | 0.0 (±0.1) | 2.8 (±0.2) | −0.3 (±0.1) | 2.2 (±0.2) |
| South-East | −4.2 | 18.0 | −2.2 | 17.4 | −0.3 (±0.4) | 3.3 (±031) | −0.4 (±0.1) | 1.5 (±0.1) |
| CLRD | IHD | |||
|---|---|---|---|---|
| Region | 95th Percentileof Ta (°C) | Average Ta (°C) | Deviation of Mortality (%) | Deviation of Mortality (%) |
| Germany | 21.0 | 23.1 | 19.9 | 9.8 |
| North | 19.7 | 21.5 | 23.1 | 5.7 |
| North-West | 20.6 | 22.8 | 18.9 | 9.0 |
| East | 21.5 | 23.9 | 17.7 | 11.5 |
| West | 20.9 | 23.1 | 22.0 | 11.9 |
| Centre | 20.9 | 23.2 | 20.9 | 9.6 |
| South-West | 22.1 | 23.9 | 21.0 | 10.3 |
| South-East | 20.7 | 22.6 | 15.2 | 7.1 |
| CLRD | IHD | |||
|---|---|---|---|---|
| Region | 5th Percentile of Ta (°C) | Average Ta (°C) | Deviation of Mortality (%) | Deviation of Mortality (%) |
| Germany | −2.0 | −4.6 | 1.9 | 2.8 |
| North | −2.3 | −4.8 | 2.6 | 3.8 |
| North-West | −1.4 | −3.9 | 3.4 | 3.4 |
| East | −2.6 | −5.5 | 1.7 | 1.1 |
| West | −0.8 | −3.2 | 0.6 | 2.5 |
| Centre | −2.7 | −5.5 | 1.7 | 2.7 |
| South-West | −1.7 | −4.2 | 1.0 | 4.2 |
| South-East | −3.9 | −6.6 | 3.2 | 2.7 |
| Heat Wave August 2003 | First Heat Wave July 2015 | |||||
|---|---|---|---|---|---|---|
| Region | Ta | RR CLRD | RR IHD | Ta | RR CLRD | RR IHD |
| North | 21.9 | 1.1 (1.3) | 1.0 (1.2) | 23.7 | 1.2 (1.4) | 1.1 (1.2) |
| North-West | 24.4 | 1.3 (1.7) | 1.2 (1.2) | 24.2 | 1.5 (1.6) | 1.2 (1.3) |
| East | 24.2 | 1.2 (1.6) | 1.1 (1.2) | 25.4 | 1.5 (1.9) | 1.3 (1.4) |
| West | 25.5 | 1.4 (1.9) | 1.3 (1.6) | 24.9 | 1.7 (2.0) | 1.4 (1.7) |
| Centre | 25.7 | 1.6 (2.1) | 1.2 (1.6) | 24.6 | 1.5 (1.7) | 1.5 (1.9) |
| South-West | 26.3 | 1.7 (2.4) | 1.3 (1.7) | 26.3 | 1.4 (1.7) | 1.4 (2.0) |
| South-East | 24.8 | 1.2 (1.4) | 1.1 (1.3) | 24.2 | 1.5 (1.8) | 1.1 (1.2) |
© 2020 by the authors. Licensee MDPI, Basel, Switzerland. This article is an open access article distributed under the terms and conditions of the Creative Commons Attribution (CC BY) license (http://creativecommons.org/licenses/by/4.0/).
Share and Cite
Schlegel, I.; Muthers, S.; Mücke, H.-G.; Matzarakis, A. Comparison of Respiratory and Ischemic Heart Mortalities and their Relationship to the Thermal Environment. Atmosphere 2020, 11, 826. https://doi.org/10.3390/atmos11080826
Schlegel I, Muthers S, Mücke H-G, Matzarakis A. Comparison of Respiratory and Ischemic Heart Mortalities and their Relationship to the Thermal Environment. Atmosphere. 2020; 11(8):826. https://doi.org/10.3390/atmos11080826
Chicago/Turabian StyleSchlegel, Irmela, Stefan Muthers, Hans-Guido Mücke, and Andreas Matzarakis. 2020. "Comparison of Respiratory and Ischemic Heart Mortalities and their Relationship to the Thermal Environment" Atmosphere 11, no. 8: 826. https://doi.org/10.3390/atmos11080826
APA StyleSchlegel, I., Muthers, S., Mücke, H.-G., & Matzarakis, A. (2020). Comparison of Respiratory and Ischemic Heart Mortalities and their Relationship to the Thermal Environment. Atmosphere, 11(8), 826. https://doi.org/10.3390/atmos11080826