Article

Characterization, Pollution Sources, and Health Risk of Ionic and Elemental Constituents in PM2.5 of Wuhan, Central China

1
Graduate School of Science and Engineering, Saitama University, Saitama 338-8570, Japan
2
Center for Environmental Science in Saitama, 914 Kamitanadare, Kazo, Saitama 347-0115, Japan
3
School of Environmental and Chemical Engineering, Shanghai University, Shanghai 200444, China
*
Author to whom correspondence should be addressed.
Atmosphere 2020, 11(7), 760; https://doi.org/10.3390/atmos11070760
Submission received: 21 May 2020 / Revised: 1 July 2020 / Accepted: 14 July 2020 / Published: 17 July 2020
(This article belongs to the Section Air Quality and Human Health)

Abstract

:
Atmospheric PM2.5 samples from Wuhan, China were collected during a winter period of February and a summer period of August in 2018. The average PM2.5 mass concentration in winter reached 112 μg/m3—about two-fold higher than that found in summer. Eight ionic species constituted 1/3 of PM2.5, whereas more than 85% represented secondary ionic aerosols (NO3, SO42− and NH4+). Higher ratios of NO3/SO42− (0.95–2.62) occurred in winter and lower ratios (0.11–0.42) occurred in summer showing the different contribution for mobile and stationary sources. Seventeen elemental species constituted about 10% of PM2.5, with over 95% Na, Mg, Al, Ca, Fe, K and Zn. Higher K-concentration occurred in winter indicating greater contribution from biomass and firework-burning. Carcinogenic risks by Cr, As, Cd, Ni and Pb in PM2.5 indicated that about 6.94 children and 46.5 adults among per million may risk getting cancer via inhalation during surrounding winter atmospheric sampling, while about 5.41 children and 36.6 adults have the same risk during summer. Enrichment factors (EFs) and elemental ratios showed that these hazardous elements were mainly from anthropogenic sources like coal and oil combustion, gasoline and diesel vehicles.

1. Introduction

Crowned by domestic economists as “China’s economic and geographic center”, Wuhan City is the most populated megacity in Central China, with an area of 8494 km2 and a population of approximately 10.2 million. Situated at the junction of the Yangtze River and Hanjiang River, Wuhan covers a critical geographic location about 950 km north of Hong Kong, 700 km west of Shanghai, 1000 km south of Beijing and 980 km east of Chengdu [1,2]. Wuhan’s gross domestic product (GDP) was more than 1.1 trillion yuan in 2015 [1,2]. With growing energy consumption economic development and rapid urbanization, Wuhan has been suffering from serious atmospheric pollution [1,2,3,4]. PM2.5—defined as particulate matter with aerodynamic diameters below 2.5 μm—usually is an intuitive evaluation indicator of air quality [3,4]. According to the report from AQI (https://www.aqistudy.cn/historydata/), the annual PM2.5 in Wuhan was 88.0 μg/m3, 68.8 μg/m3, 57.1 μg/m3, 51.6 μg/m3, 44.7 μg/m3 and 45.4 μg/m3 from 2014 to 2019, respectively exceeding the Class 2 standard of 35 μg/m3. Hao et al. (2018) studied PM2.5 in Wuhan area between 2014 and 2015 and found that PM2.5 were highest in winter and lighter in summer period [5]. Lyu et al. (2016) measured PM2.5 of Wuhan in 2014 and showed that PM2.5 from October to November was greater than that collected from May to June [6]. It seems that PM2.5 in Wuhan is more severe in winter and lighter in summer [1,3,4]. Meteorological factors such as temperature, wind speed, direction and weather may affect the air quality [7]. PM2.5—formed via combustion or gas–particle conversions with larger surface area—can stay in the atmosphere for a long time and travel for a long-range transport. It has been reported that increased PM2.5 concentration can pose increased risks for human health [8]. The public health and air pollution in Asia (PAPA) reports that each 10-μg/m3 increase in PM10 in Wuhan may lead to an obvious increase in total non-accidental, stroke, cardiovascular and cardiopulmonary mortalities [9]. Yang et al. (2010) suggested that PM2.5 exposure may cause inflammatory responses and induce oxidative stress [10]. PM2.5 as complex mixture contains a series of substances such as water-soluble ions, elements, elemental carbon, organic carbon, organic compounds and moisture [3,9,11]. Water-soluble ions usually account for about 30% in PM2.5 of China [3]. Secondary ionic aerosols (NH4+, NO3, and SO42−) are the main ionic constituents that can affect atmospheric visibility and acidity [1,6,12]. About 40 elemental species have been reported in PM2.5, such as crustal elements (Mg, Al, K, Ca and Fe) to be important factors leading to reduced visibility [1,13,14]. Poisonous heavy metals (Cr, Zn, Cu, Cd and Pb) are an important component of trace elements [1,15,16]. Trace elements in PM2.5 could be used as an indicator for specific sources of PM2.5 [15] and could easily to enter the human body though inhalation [15]. There are few studies on sources analysis and health risks of trace elements in PM2.5 in Wuhan.
In this article, PM2.5 samples were collected in one center area of Wuhan in February (winter sampling period) and August (summer sampling period) in 2018. The main purpose of this article is to study the behavior and characteristics of main inorganic components in PM2.5 of Wuhan during two different periods. Investigations performed were mainly aimed to: (1) analyze variation of PM2.5 particles, water-soluble ions and elements during winter and summer sampling periods; (2) analyze the characteristics of water-soluble ions—especially for secondary ionic aerosols; (3) evaluate the possible sources of ions and trace elements in PM2.5; (4), speculate the similarities and differences of PM2.5 contents collected in two short periods during the winter and summer of 2018.

2. Experiments

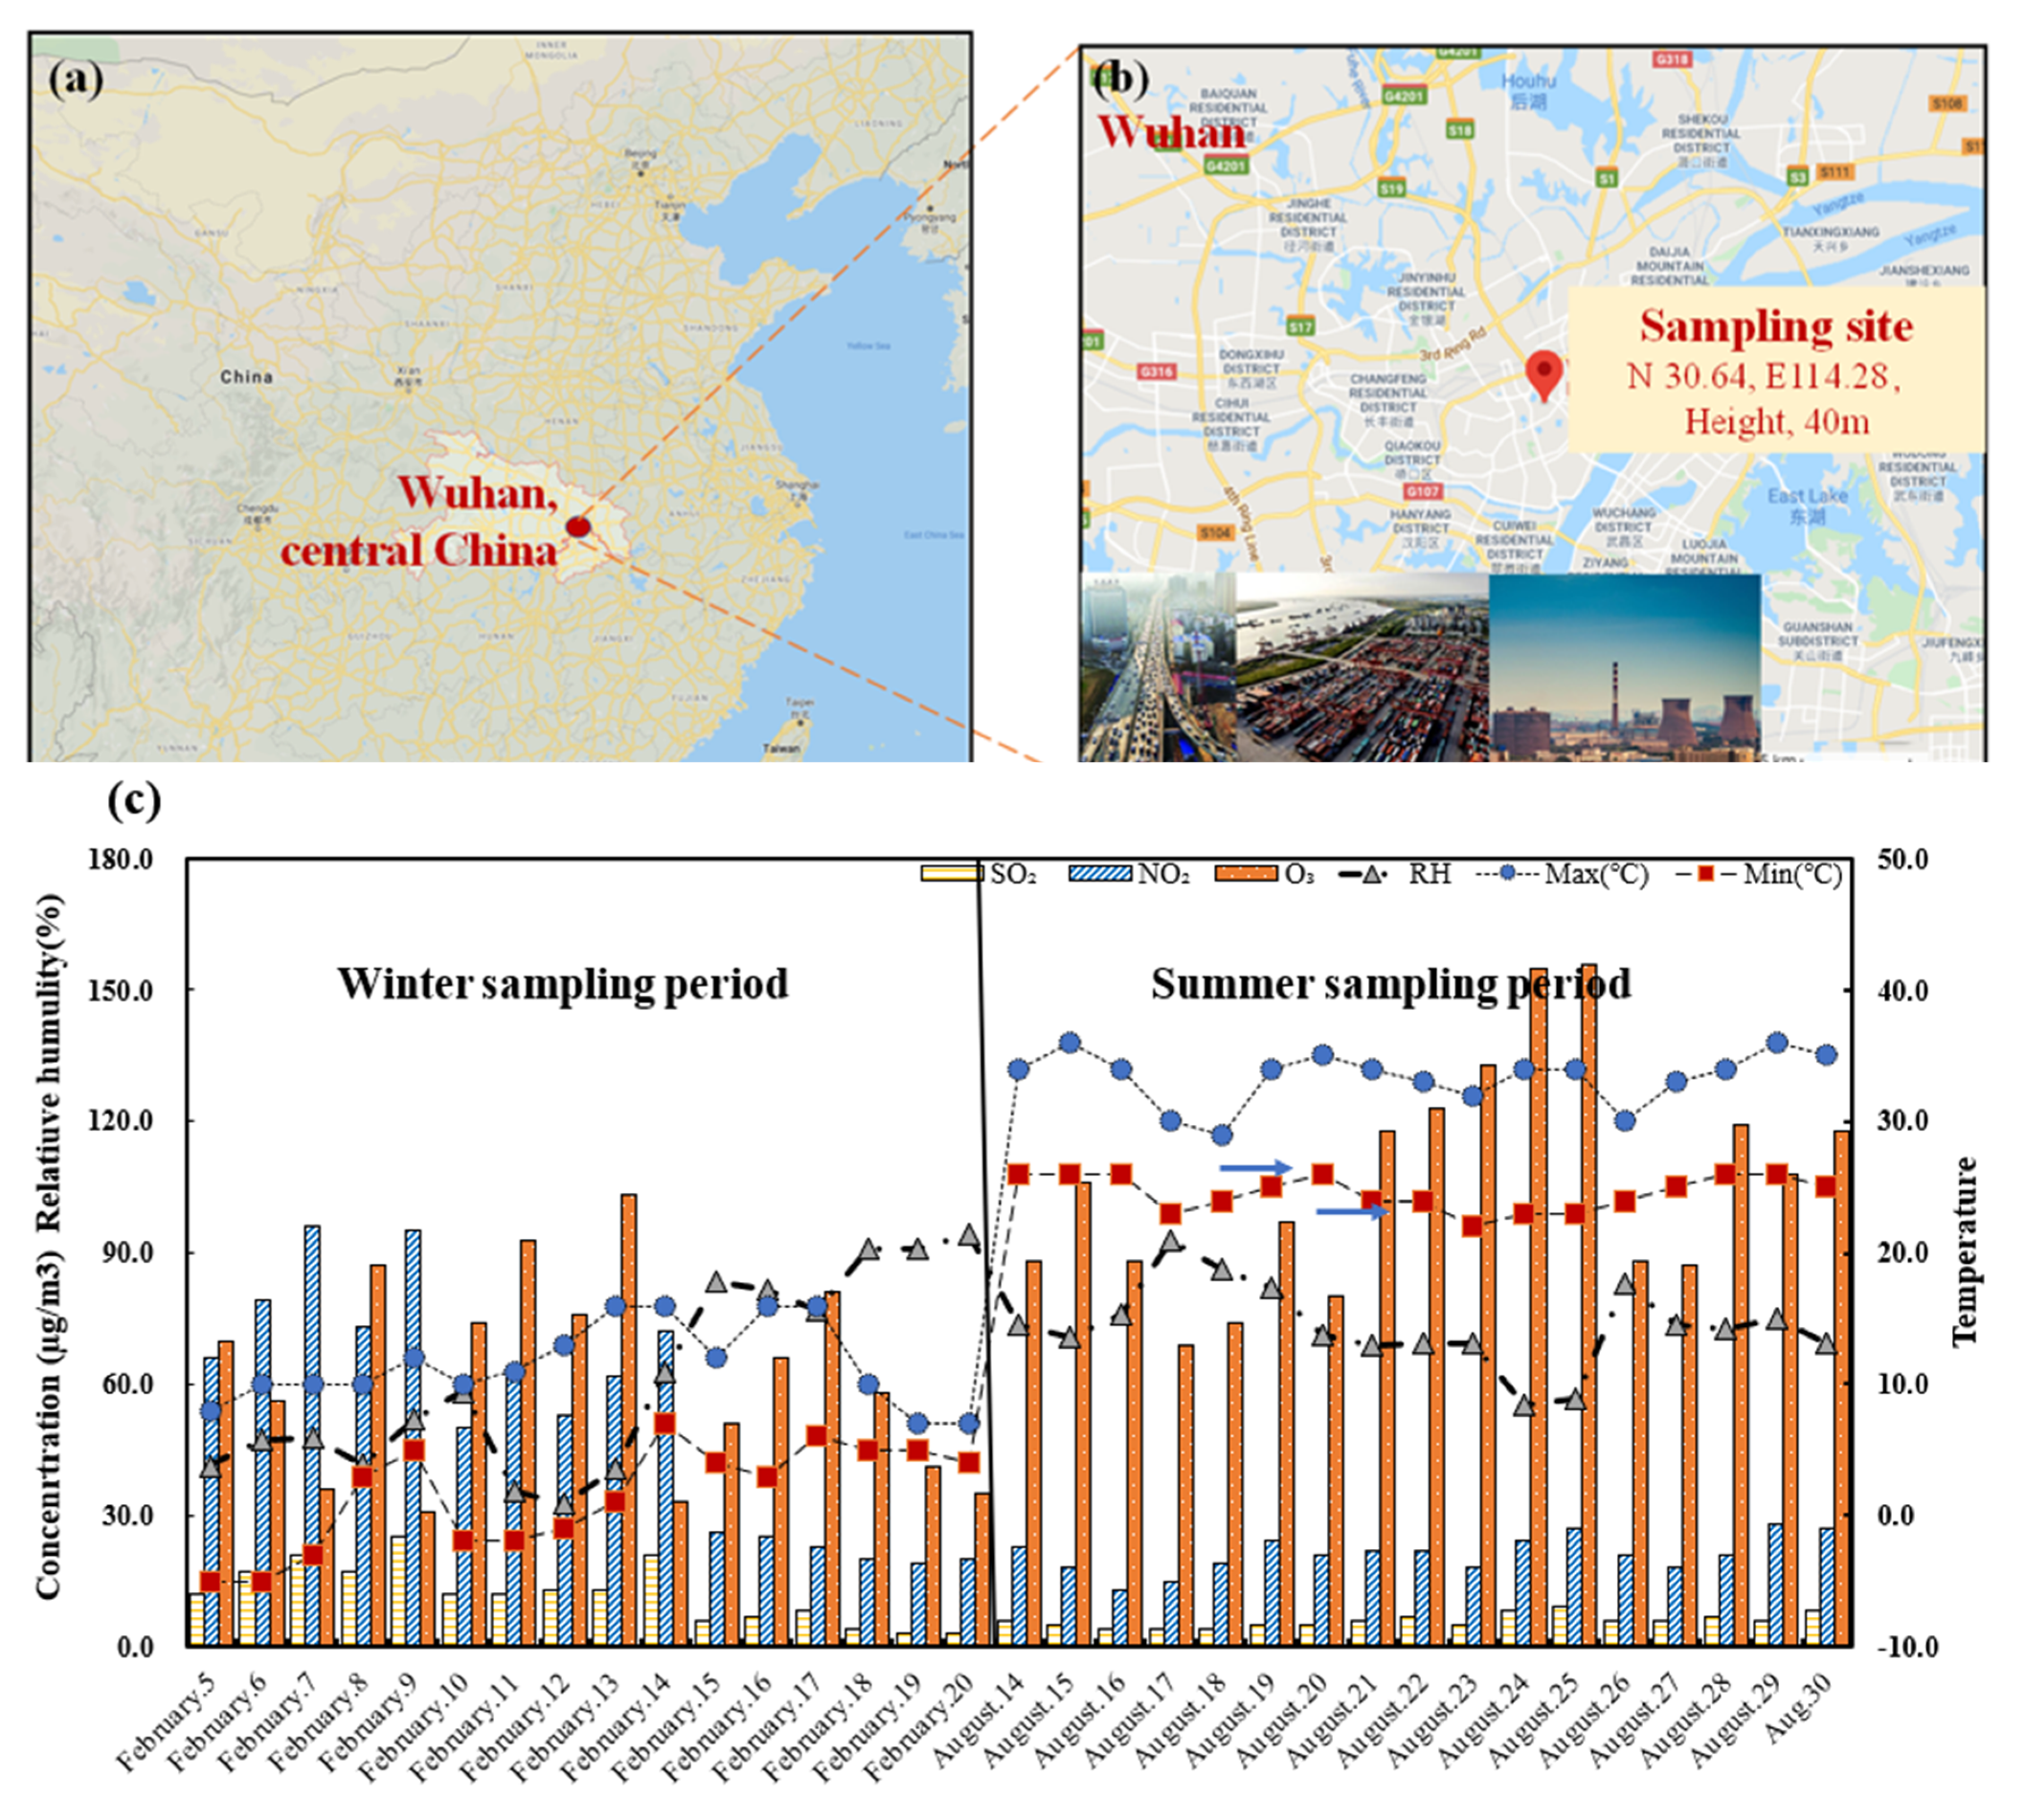
2.1. Description of Sampling Site and PM2.5 Collection Method

The PM2.5-sampling site in Wuhan (N30.60, E114.28) as shown in Figure 1 was on the roof of one of the buildings of the Wuhan Environmental Protection Science Research Institute which near the interaction of two parkways named Xiangjiang Road and Changjiangribao Road. This is also near to the second ring line in Wuhan. The height of sampling site was about 40 m. The PM2.5 particles were collected by a middle-volume air sampler (TH-150A, Wuhan Tianhong Instrument, China) and a PM2.5 sampler cutoff device (QXY118, Wuhan Tianhong Instrument, China). Each case operated 23 h (10:00 am–the following 9:00 am) with a flow rate of 0.10 m3 min−1. There were two relative sampling periods, namely, winter and summer. The winter sampling period was from 5 to 20 February 2018, divided into 16 sampling cases. The summer sampling period was from August 14 to 30 2018 with 17 sampling cases during 2018. Quartz tissue filters (Type 2500QAF-UP, Pallflex product Corp., Port Washington, NY, USA) were put in a forced convection drying oven (SOFW−450, As One) at 25 °C for 48 h and weighed before and after sampling. After collections, the sampling filters were stored at −40 °C. Meanwhile, meteorological factors and atmospheric pollutants were collected from the official website (http://tianqi.2345.com, https://www.aqistudy.cn/historydata) during the all sampling periods, as shown in Table S1 and Figure 1c.

2.2. Determination of 8 Species of Ionic Contents and 17 Species of Elemental Content in PM2.5

The concentration of eight water-soluble ionic species (Cl, NO3, SO42−, Na+, NH4+, K+, Mg2+, Ca2+) in PM2.5 samples were measured based on ion chromatography method reported from Ministry of the Environment, Japan (https://www.env.go.jp/air/osen/pm/ca/manual.html). Each sample was analyzed three times by liquid chromatograph (ICS1600, Dionex Aquion, Thermo Fisher Scientific CO, Waltham, MA, USA). The concentration of 17 elemental species (Na, Mg, Al, K, Ca, V, Cr, Mn, Fe, Ni, Cu, Zn, As, Se, Cd, Pb and Sb) in PM2.5 were based on acid decomposition/ICP-MS method reported by the Ministry of the Environment, Japan (https://www.env.go.jp/air/osen/pm/ca/manual.html). They were then analyzed by an inductively coupled plasma mass spectrometer (Agilent 7700, Agilent Technologies, Inc., Santa Clara, CA, USA). The detailed extraction and analysis methods followed those reported in our previous articles [17]. All statistical analyses of related data were completed using Microsoft Excel 365 software [17,18].

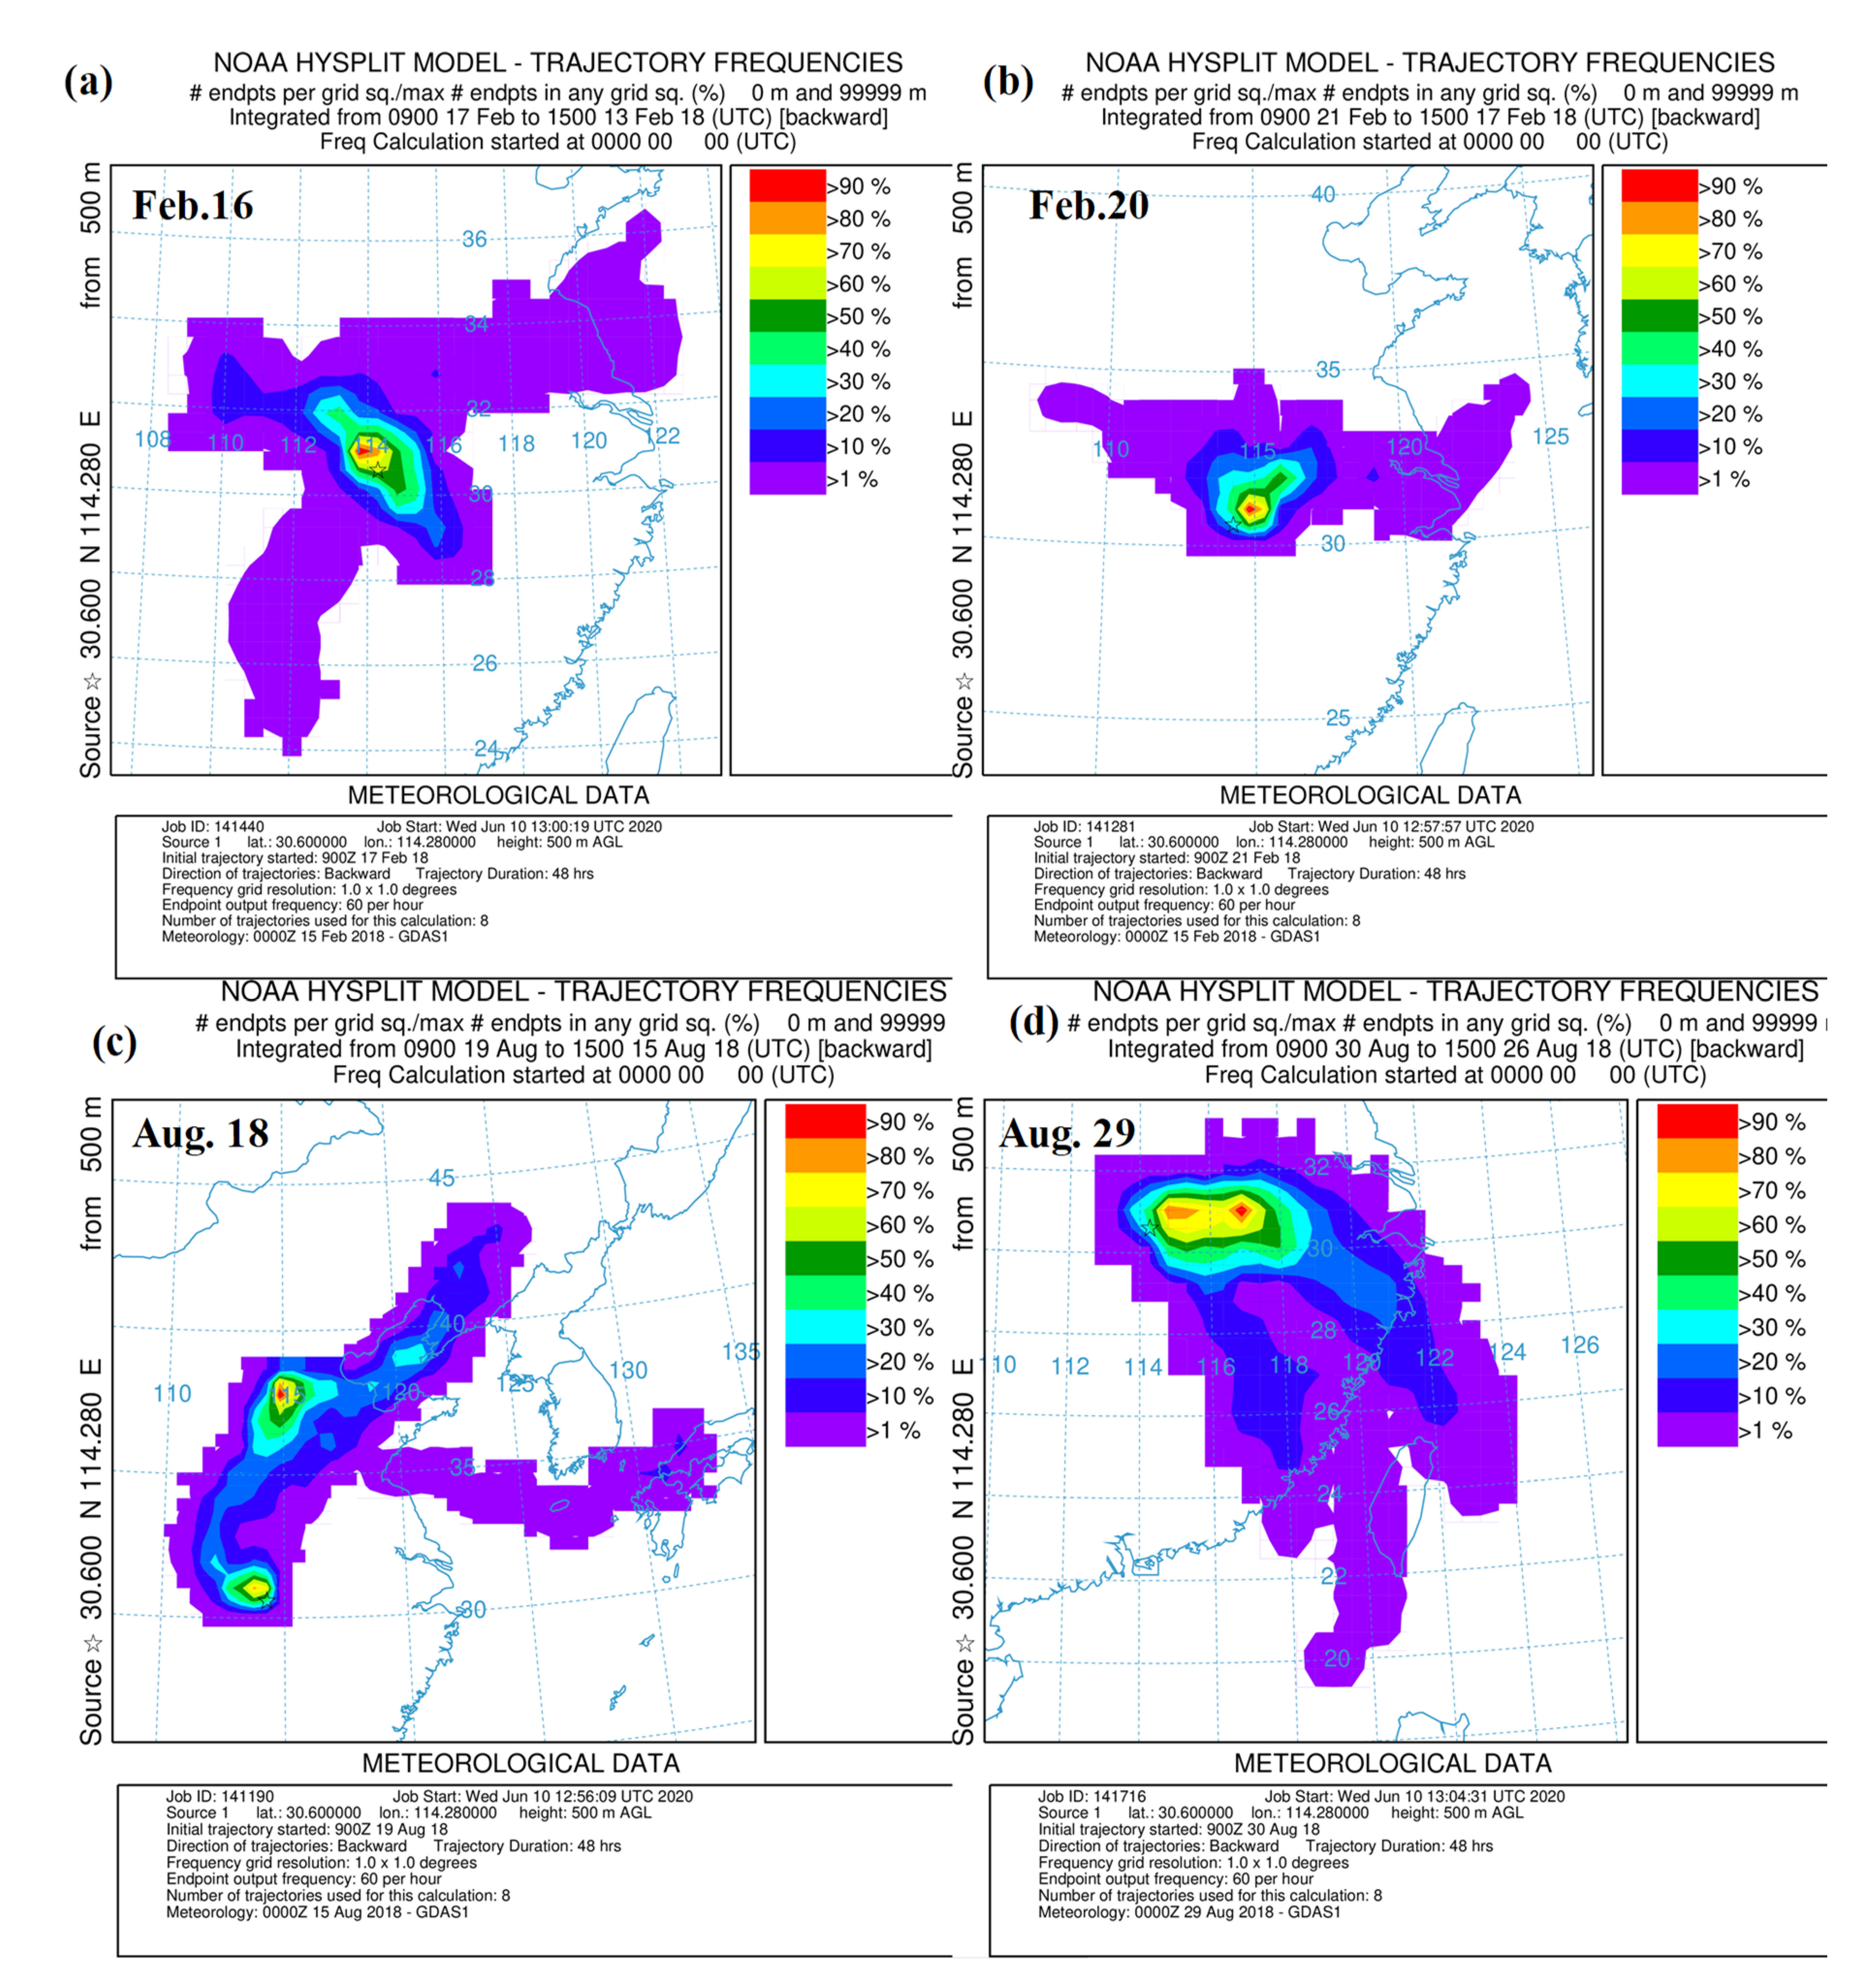
2.3. Backward Air Mass Trajectory Analysis

Backward air mass trajectory analysis is often used to get more information about the effects of transport patterns of air masses, and can be used to evaluate the impacts to air quality. In this study, each backward air mass trajectory was calculated by HYSPLIT model on the National Oceanic and Atmospheric Administration (NOAA) website (https://ready.arl.noaa.gov/hypub-bin/trajtype.pl?runtype=archive), with 6 h intervals from 48 h in the past. The starting site was at 500 m altitude at the Wuhan sampling site.

3. Results

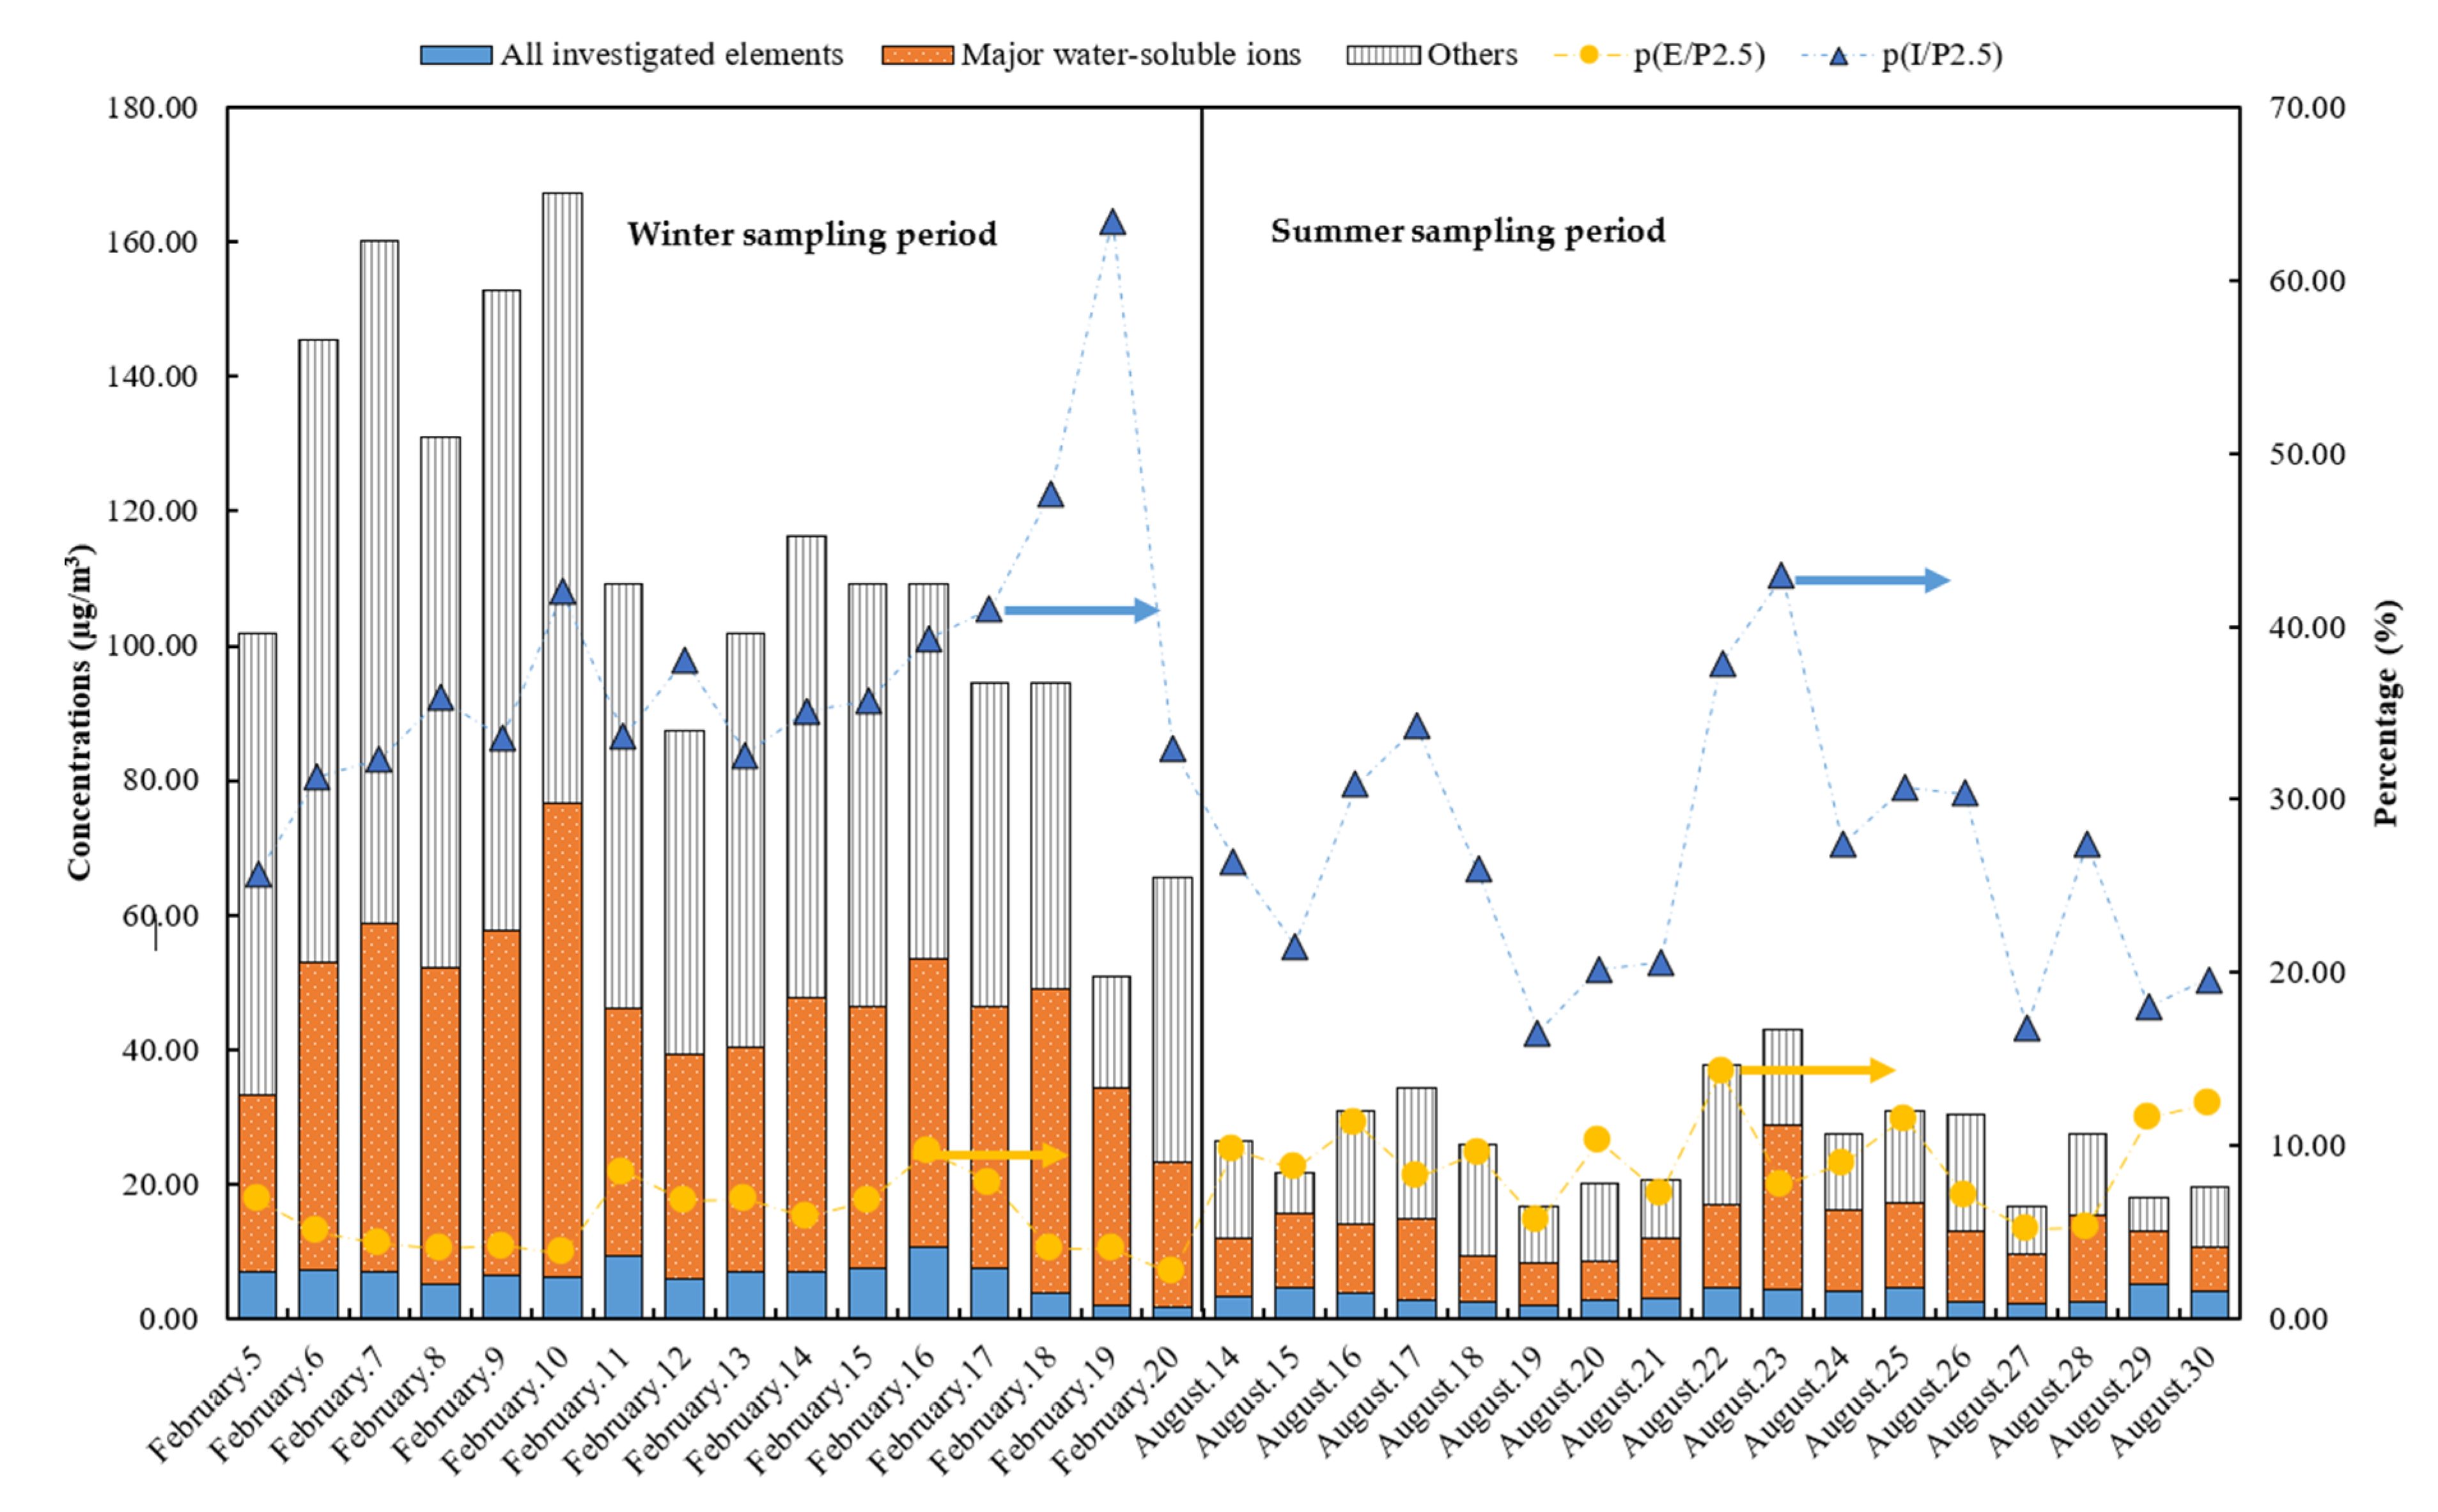
3.1. Seasonal and Variation of Major Water-Soluble Ions and 17 Investigated Elements in PM2.5

Mass concentrations of all investigated chemical constituents, major water-soluble ions and PM2.5 in each sampling case during winter and summer sampling periods in 2018 are shown in Figure 2. The concentration of each elemental is shown in Table S1 and ionic content is shown in Table S2. The average mass concentration of PM2.5 was 112.4 μg/m3 during the winter sampling period, while the highest of 167.4 μg/m3 occurred on 10 February. The lightest of 51.0 μg/m3 occurred on 21 February. During the summer sampling period, the average mass concentrations of PM2.5 was 39.0 μg/m3, with the highest 56.8 μg/m3 (23 August case) and the lowest 27.6 μg/m3 (20 August case), respectively. It was found that average PM2.5 in winter was about 2.88-fold higher than that in summer. There are also several studies that show similar PM2.5 concentration of Wuhan in winter and summer. For example, Xiong et al. (2017) surveyed that PM2.5 concentration of Wuhan was 172.3 μg/m3 in winter and 88.1 μg/m3 in summer during 2011 and 2012 [19]. Zhang et al. (2015) measured PM2.5 in Wuhan during 2012–2013 and showed that about 140 μg/m3 in winter and 40 μg/m3 in summer [1]. Hao et al. (2018) showed that PM2.5 in Wuhan during 2014 to 2015 was 103.7 μg/m3 in winter and 51.4 μg/m3 in summer [5]. Simultaneously, the ratio of PM2.5/PM10 was always selected to analyze the particle origin, possible health effects and formation process [2]. The values of PM2.5/PM10 shown in Table S3 were 0.71 (0.45–0.96) in winter and 0.61 (0.50–0.71) in summer, which was slightly higher than the mean ratios (0.56) of 190 cities in China [2,20]. This indicates that a relatively serious degree of fine particle pollution occurred in Wuhan. Pearson product–moment correlation coefficient analysis shown in Table S4 also shows that the mass PM2.5 concentrations showed a strong correlation with atmospheric pollutants (winter, SO2, r = 0.74, CO, r = 0.69, p < 0.01; summer, O3, r = 0.55, p < 0.01).
Figure 2 shows that ionic contents formed a large proportion of the PM2.5. The average proportion was 37.5% (25.8%–63.5%) in winter and 26.3% (16.6%–42.9%) in summer, indicating that water-soluble ions form a very important content of PM2.5. This seems very consistent with that reported from the previous articles: Zhang et al. (2011) found that the average ratio of water-soluble ions to PM2.5 in Xi’an China from March 2014 to March 2015 was about 38.9% [21]. Lai et al. (2016) also found this ratio in PM2.5 of Guangzhou from March 2012 to February 2013 was as high as 44.8% [22]. The Pearson product–moment correlation coefficient shown in Table S4 shows that mass PM2.5 concentrations had a strong correlation with ionic contents (winter, r = 0.832, p < 0.01; summer, r = 0.657, p < 0.01). For seventeen determined elemental contents, the average was 6.32 μg/m3 in winter and 3.50 μg/m3 in summer. It appears that elemental contents were in a relative light concentration (2.65%−14.2%) of PM2.5 during both sampling periods. The elemental ratio of PM2.5 was consistent with about 10% referred from several relevant articles [1,13,23]. The following section presents more important information about ions and elements.
Investigated elements—Na, Mg, Al, K, Ca, V, Cr, Mn, Fe, Ni, Cu, Zn, As, Se, Cd, Pb, and Sb;
Water-soluble ions—Cl, NO3, SO42−, Na+, NH4+, K+, Mg2+, and Ca2+;
PM2.5—Investigated elements + Water-soluble ions + others;
P(E/P2.5)—mass proportion of all investigated elements to PM2.5;
P(I/P2.5)—mass proportion of all water-soluble ions to PM2.5.

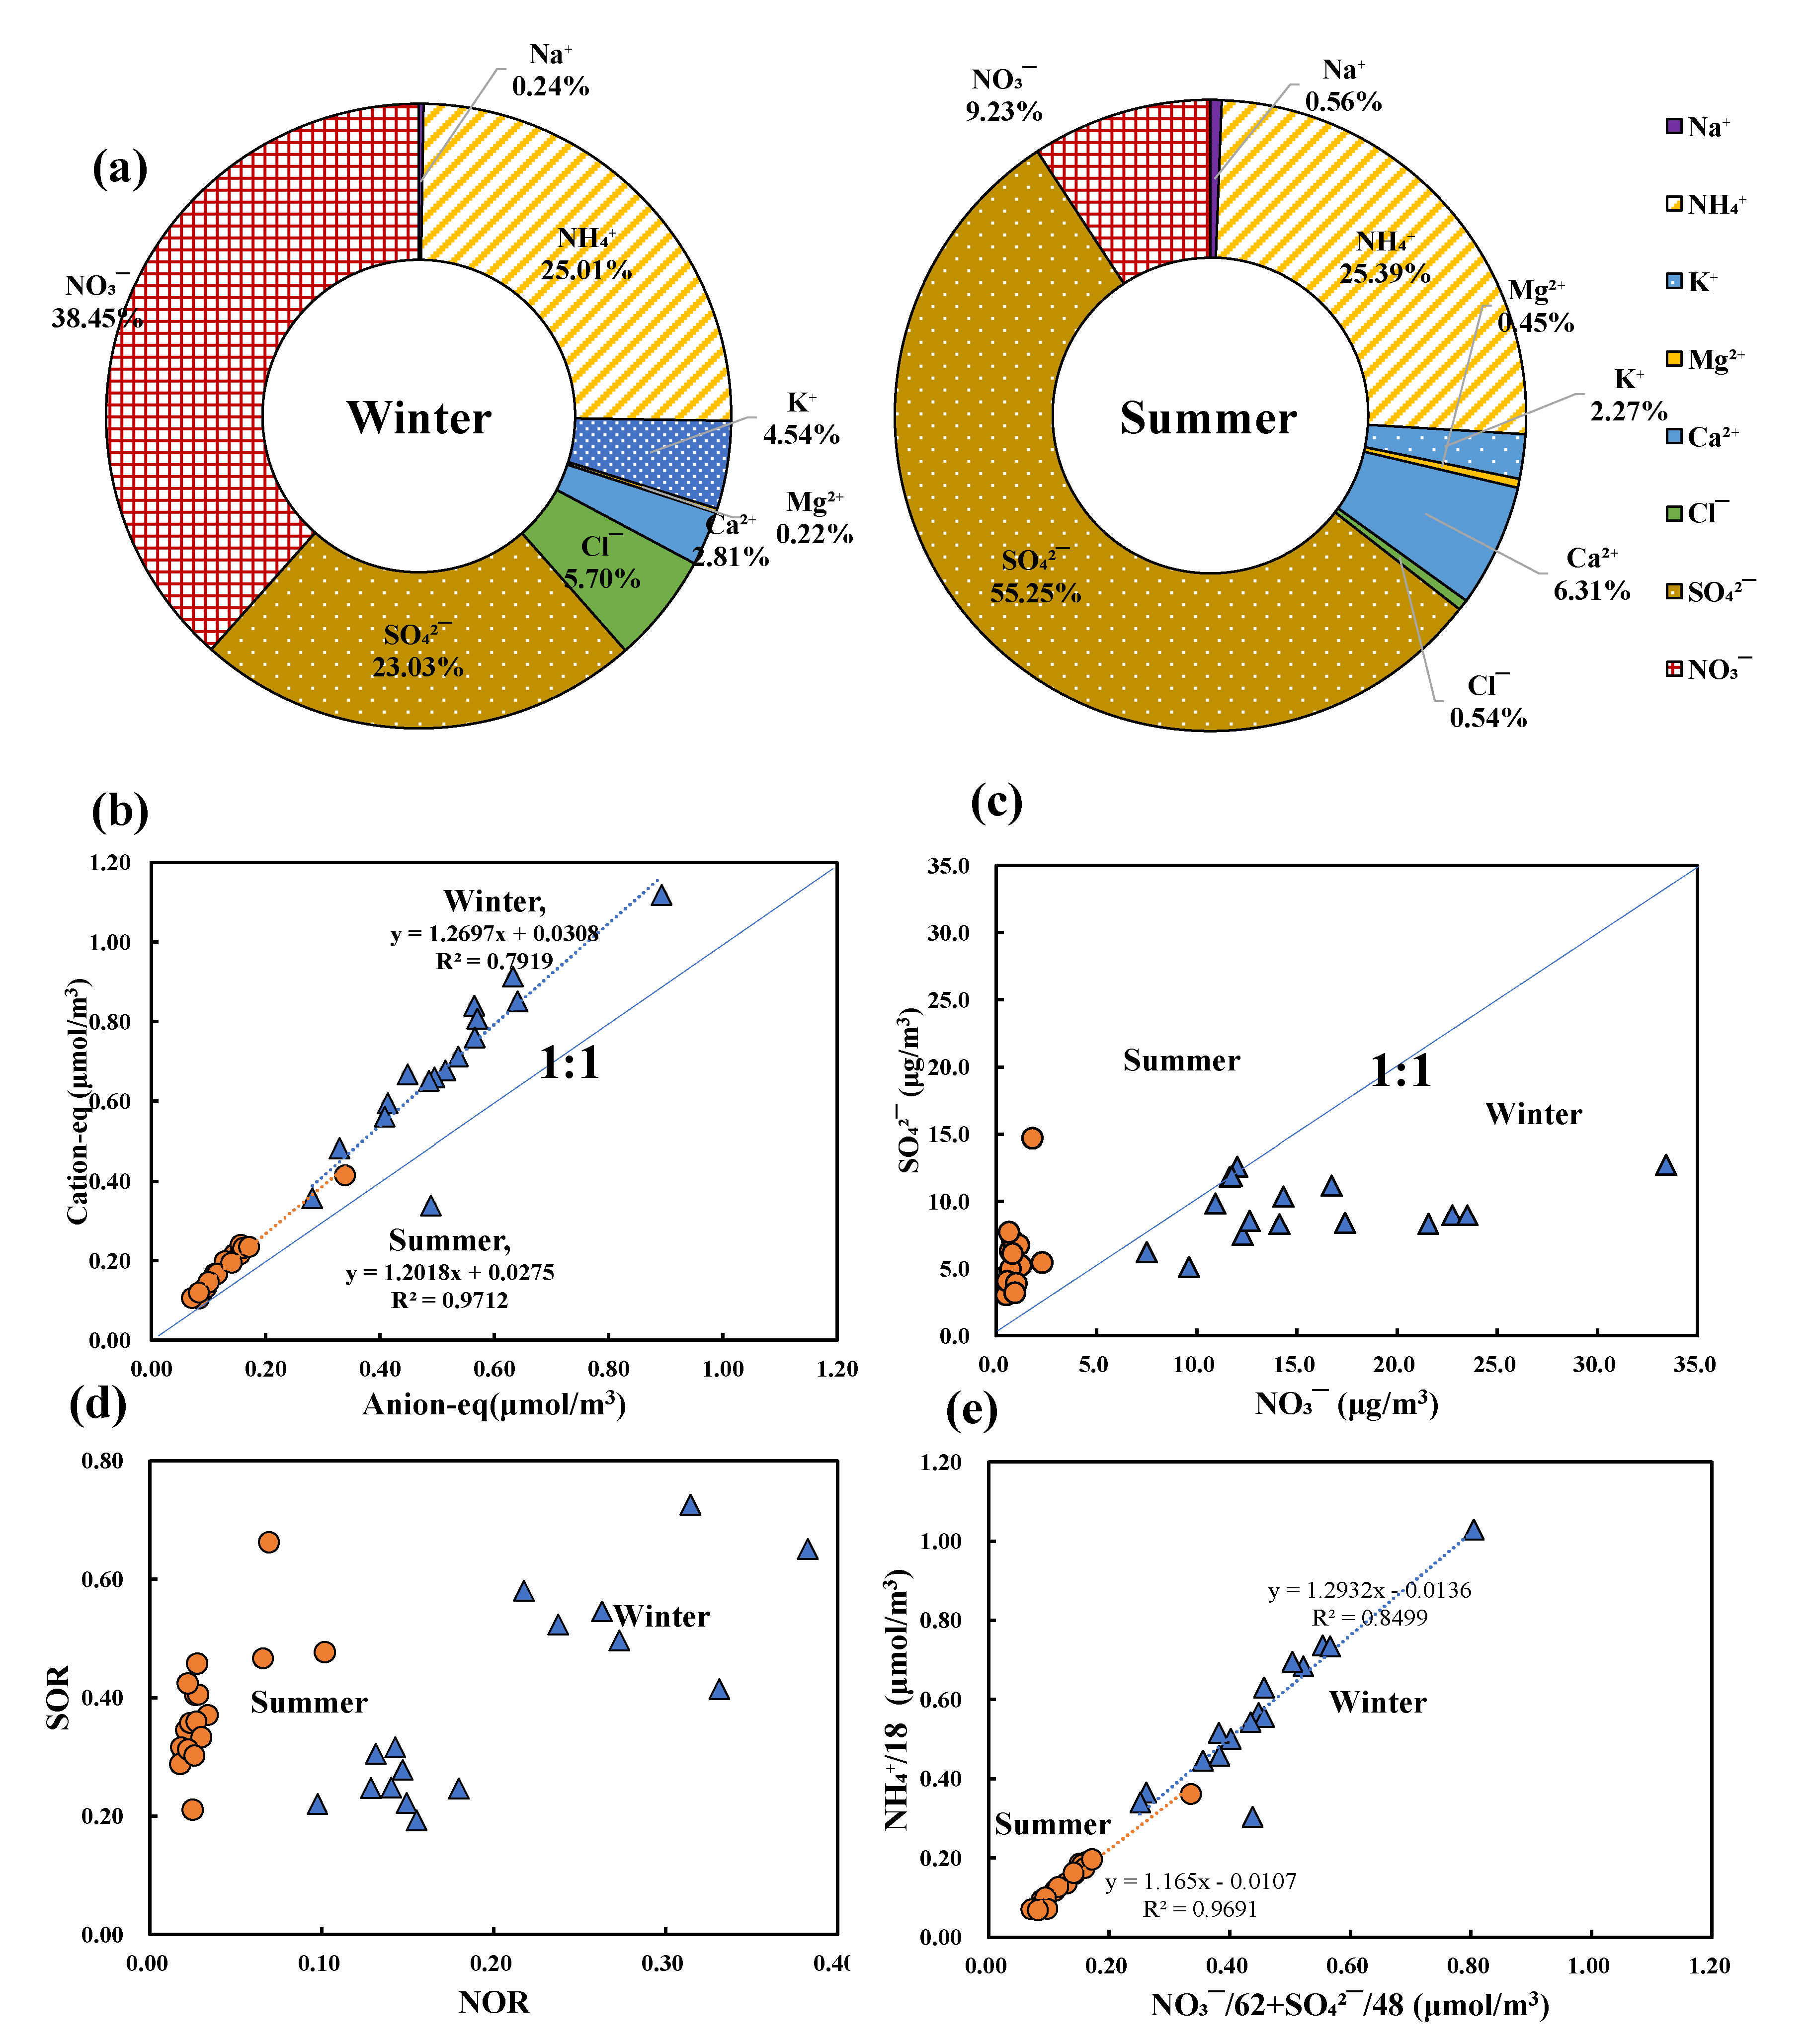
3.2. Chemical Characteristics of Major Water-Soluble Ionic Species

Average of 8 species water-soluble ionic species concentrations in PM2.5 shown in Figure 3 was 41.0 μg/m3 during the winter sampling period and 10.4 μg/m3 during the summer sampling period which indicated that these in winter was about 4-fold higher than that in summer. Ionic contents were in a widely range from 21.6 μg/m3 (20 February) to 70.2 μg/m3 (10 February) during the winter sampling period and from 5.57 μg/m3 (20 August) to 24.4 μg/m3 (23 August) in summer. During the winter sampling period, Figure 3a shows that SO42−, NO3 and NH4+ called secondary ionic aerosols were the absolutely dominant component with proportion of 23.03%, 38.45% and 25.01%, the others were in order of Cl(5.70%) > K+(4.54%) > Ca2+(2.81%) > Na+(0.24%) > Mg2+ (0.22%). During the summer sampling period, ionic species shown in Figure 3b were in order of SO42−(55.3%) > NH4+(25.4%) > NO3 (9.23%) > Ca2+(6.31%) > K+(2.27%) > Na+(0.56%) > Cl (0.54%) > Mg2+ (0.45%). The proportion of secondary ionic aerosols to total ions was 86.5% in winter and 89.9% in summer. These values appear very consistent with previous articles. All indicate that secondary ionic aerosols also play a very important role in PM2.5 in Wuhan during winter and summer of 2018. Zhang (2015) reported these ratios was over 85% in Wuhan [1]; Yao (2002) showed these ratios were about 85% in Beijing and 80% in Shanghai [24]. The Pearson product–moment correlation coefficient shown in Table S4 show that the mass ionic contents had strong correlation with secondary ionic aerosols (winter, NH4+, r = 0.97 (p < 0.01), NO3, r = 0.94(p < 0.05); SO42−, r = 0.56(p < 0.01); summer, NH4 +, r = 0.99(p < 0.01), NO3, r = 0.58(p < 0.01); SO42−, r = 0.99(p < 0.05)). The K+ ion in PM2.5 was usually considered as a diagnostic tracer for biomass burning and vegetation [3,17,24]. It also had another important source from fireworks containing KNO3, KClO3 and KClO4 as oxidizers [25,26]. This may explain why ratios of K+ ions in winter were as high as 4.54%, and the mean K+ concentration was 1.86 μg/m3—about 7.75-fold higher than in summer, especially from 15 February to 18 February. The Na+ ion—always considered common from sea-salt—was in a lower concentration in both winter and summer [13,24,27,28,29].
Ionic balance can be used as an indicator for revealing the acidity balance of species ions in ambient particles by the ionic equivalent ratio of anions to cations. If the value is close to 1.00, it suggests that the ionic content is in a neutralized stage; in acidic stage with a value over 1.00 and in alkaline with a value below 1.00 [13,30,31,32,33]. Figure 3b shows that ratios of anions-eq to cation-eq were in range of 0.67 to 0.80 in winter except a 1.44 occurrence on 19 February, and also about 0.65 to 0.82 in summer. The deviation of 1.00 may be caused by the lack measurement of CO32−, PO43−, F, NO2 and other anions. Another factor may because of the great K+ enrichment. The slope of linear fitting lines was up to 1.27 (R2 = 0.79) in winter and 1.20 (R2 = 0.97) in summer indicating the complicated ionic contents and serious air pollutions [4].
Considering the absolute majority contents (>85%) of secondary ionic aerosols, Figure 3c shows the content of NO3 ion showed a big difference between the two sampling seasons which the average NO3 ion in winter was up to 15.8 μg/m3 with wide range of 7.51 (20 February) to 33.4 μg/m3 (10 February) while was below to 0.95 μg/m3 with range of 0.51(20 August) to 2.30 μg/m3 (26 August) in summer. It may be caused by multifaceted meteorological factors and atmospheric pollutants such as temperature (min)(r = −0.86, p < 0.05), SO2(r = 0.69, p < 0.01), NO2(r = 0.74, p < 0.01), O3 (r = −0.59, p < 0.01), CO (r = 0.74, p < 0.01), PM2.5(r = 0.95, p < 0.01), NH4+ (r = 0.97, p < 0.01), Cl(r = 0.84, p < 0.01) and SO42−(r = 0.62, p < 0.01) [24]. The average SO42− ion in winter was about 9.45 μg/m3 with a wide range of 5.11 (February 5) to 12.74 (10 February) μg/m3. In summer it was 5.72 μg/m3, with a range of 3.03 (20 August) to 14.72 μg/m3 (23 August). It was clear that NO3 ion in winter was over 16.6-fold higher than that in summer, and that SO42− ion in winter was only 1.65-fold. The mass ratio of NO3/ SO42− is often used as a significant indicator of mobile (vehicle) source and stationary source (coal combustion) for the nitrogen and sulfur in atmosphere [4,13,34,35]. It is well known that NO3 is mostly generated from the vehicle emissions in metropolis such as Wuhan and SO42− was main related to kinds of fossil fuel combustion [17,33]. The average NO3/SO42− in winter were 1.70 (0.95–2.62) which showed that ionic contents received more effects from mobile sources compared with the stationary source, the average ratio in summer were 0.18 (0.11–0.42) which showed that main source may be from stationary sources. It could be considered that the possible sources of atmospheric pollutants may be very different in these two seasons. Huang (2016) studied the NO3/ SO42− of PM2.5 in Wuhan during 2014 was 0.32 in summer and 0.83 in winter [4] while Wu (2019) found that this ratio was 0.48 in summer and 1.39 in winter of Wuhan [3]. This seasonal variation was also found in Shanghai [24]. Higher ratio and higher NO3 concentration in this article could be explained by the fast-developing transportation and the relevant emissions in Wuhan. Lower ratio and lower NO3 concentration could be explained by generated via the conversion of gaseous precursors. SO2 and NOx in atmosphere could be got directly affects from kinds of meteorological factors and emission sources [3].
Sulfur oxidation ratio (SOR) and nitrogen oxidation ratio (NOR) were selected as indicator to know more process about the conversion of gaseous precursors. Sulfur oxidation ratio (SOR = [SOR]/([SOR] + [SO2])) is defined as the molar ratio of sulfur in SO42− to the total sulfur in SO42− and SO2, NOR (NOR = [NOR]/([NOR] + [NO2])) is the molar ratio of nitrogen in NO3 to the total nitrogen in NO3 and NO2 [36,37]. It has already been confirmed that the photochemical oxidation of SO2 would occur when the SOR over 0.10 [3,38]. Figure 3d shows that SOR in both winter and summer was over 0.20, which indicated gas–particle conversion in the atmosphere occurred in each period, and NOR was about 0.21(0.10–0.38) in winter and 0.03(0.02−0.10) in summer. Higher values of NOR and SOR in winter indicated that more NO2 and SO2 may have oxidized to the nitrate and sulfate in atmosphere, especially in winter. Meanwhile, higher SOR and lower NOR in summer could be explained by the ammonium sulfate formation was more favored in summer with high temperature and sulfate competed with nitrate for ammonium [3]. Figure 3e shows that the slopes of regression fit between (NO3 + SO42−)-equivalent and NH4+-equivalent was 1.29 in winter and 1.17 in summer, which indicates that the main forms of these species were chiefly NH4NO3 and (NH4)2SO4 in both winter and summer [3,4,38]. With several ionic analyses, it was found that the PM2.5 in Wuhan suffered the serious effects from coal combustion and vehicle emissions. It is very important to get more information about the inorganic contents and their health risk assessment.

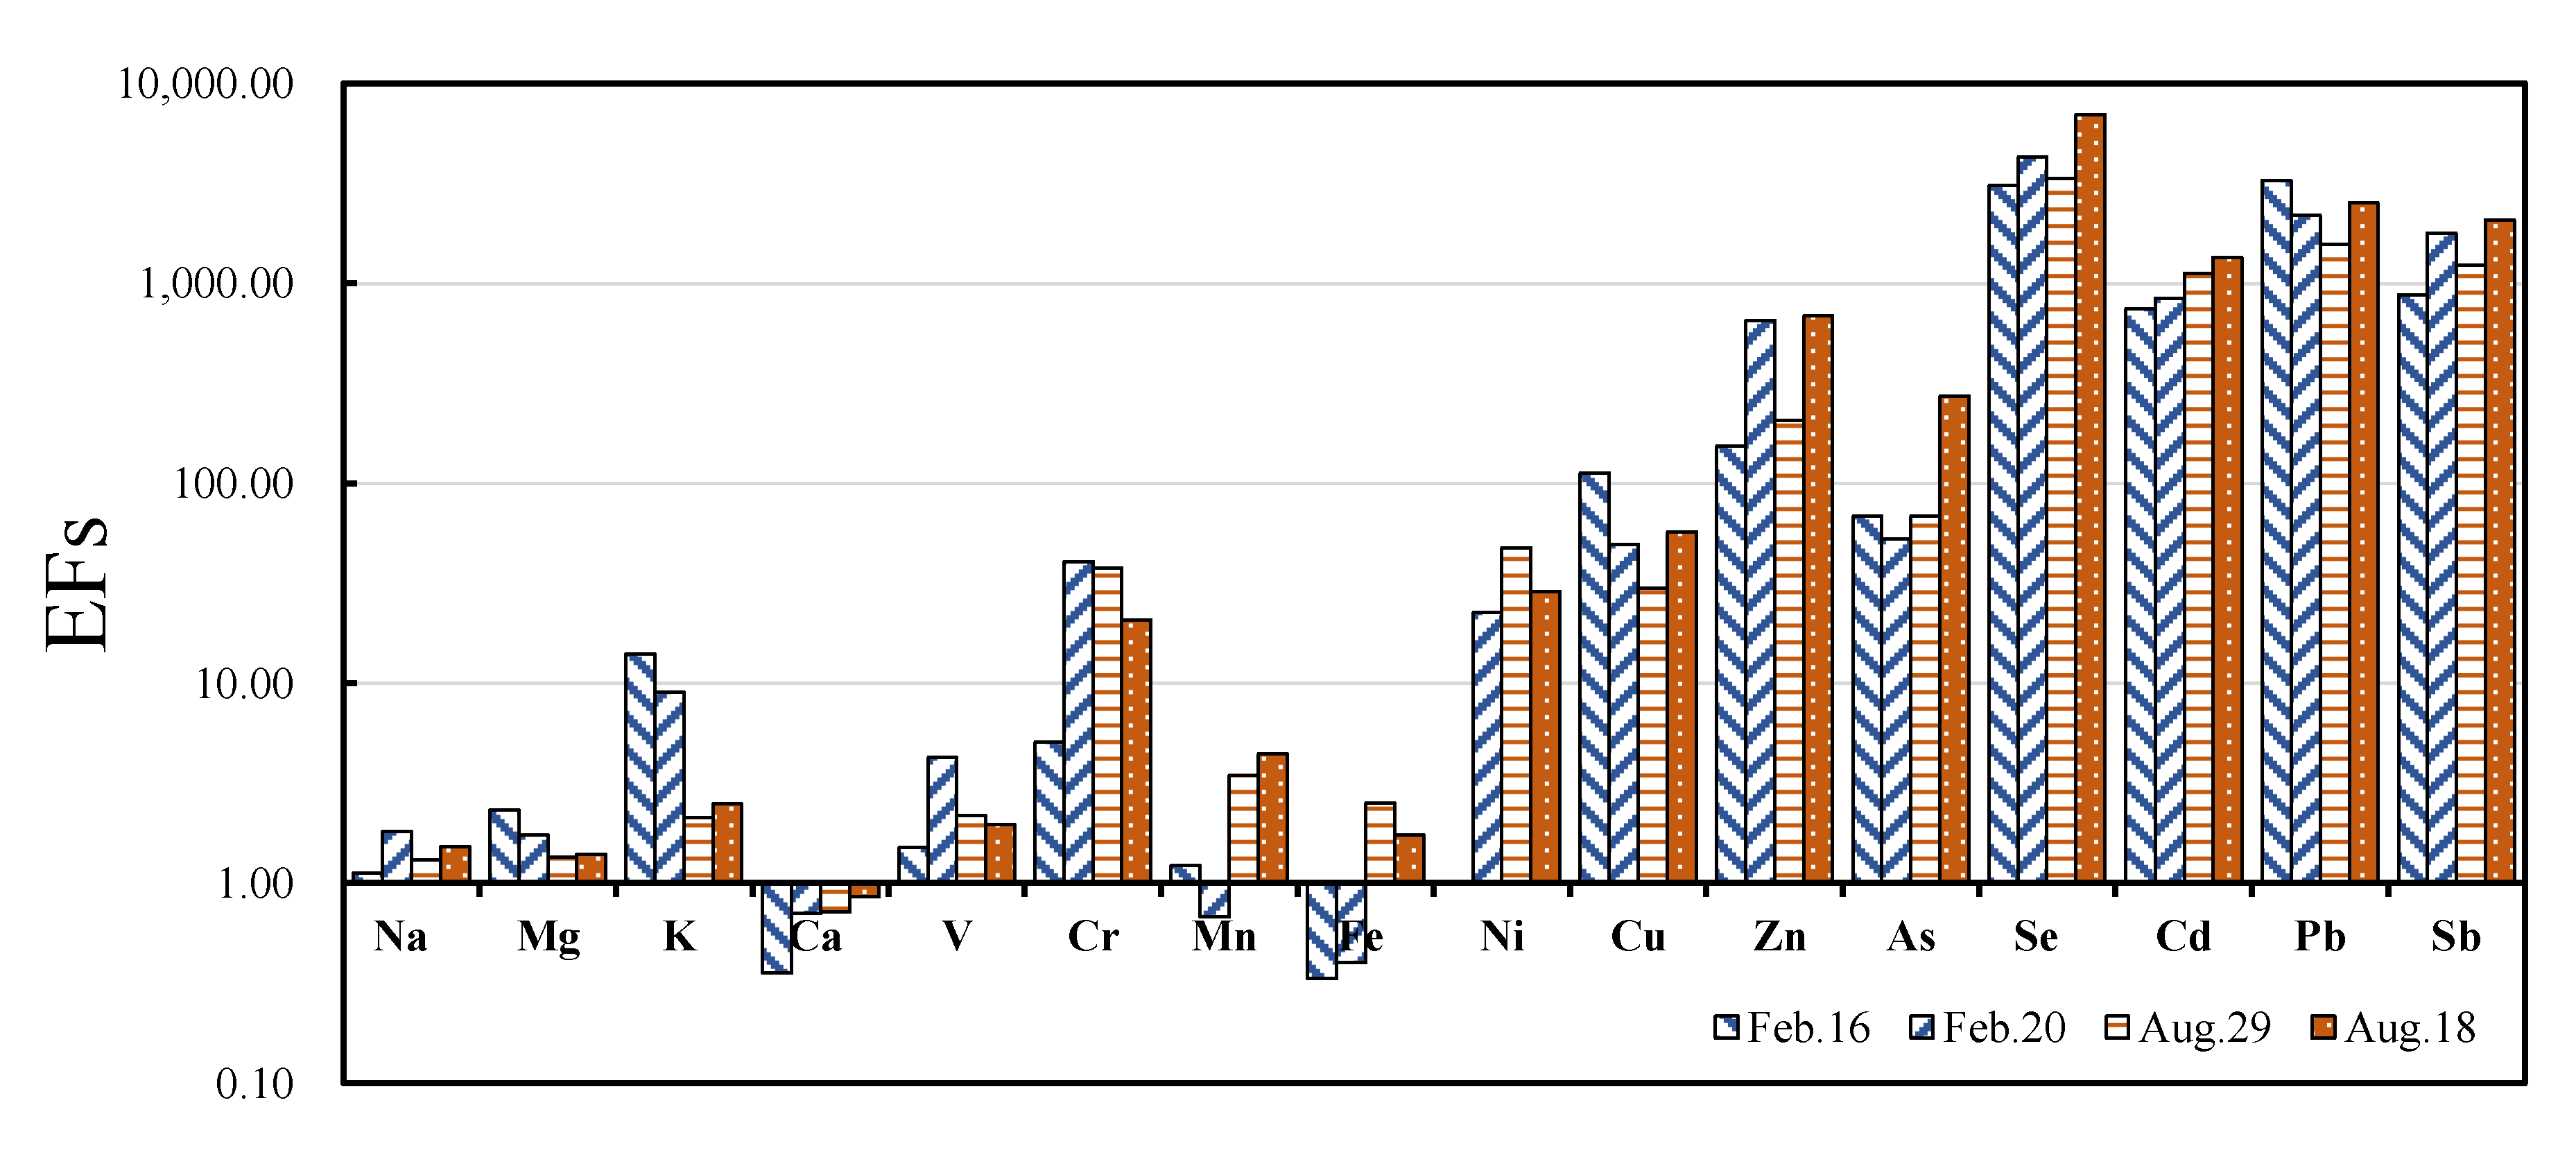
3.3. Variation of Concentrations, Possible Sources of Elemental Species

Here, seventeen kinds of elements were selected to analyze composition changes, possible sources and possible health risk assessment in both sampling periods. Table 1 and Table S2 show that the average mass concentration of all seventeen elemental species was 6324.1 (1734–10,545) ng/m3 during the winter sampling period, while it was 3460 (2080–5070) ng/m3 during the summer sampling period. Th elements Na, Mg, Al, Ca, Fe, K, Zn were in a relative higher average concentration of over 100 ng/m3 in both winter and spring sampling periods. The mass proportion of these elements to total elements in each sampling case were over 95%. The mass concentrations were in the order of K >200 ng/m3 > Al > 1000 ng/m3 > Fe> Na > Mg> Ca > Zn in winter and Al > Fe> K > 500 ng/m3 > Na > Zn > Mg > Ca in summer. Generally, Mg, Al, Ca, Fe and K elements are considered as crustal elements mainly from natural soil and construction dust [1,39]. It is noteworthy that the K element in PM2.5 from 13 February to 18 February was over 2000 ng/m3. The K element even exceeded 6000 ng/m3 on 16 February, which could be explained by the burning of not only biomass but also large amounts of fireworks during 2018 Chinese New Year period [25]. The average sum of other 10 elemental species defined as trace elements was 208 ng/m3 (45.9–347 ng/m3) in winter, with the order of Pb > 80 ng/m3 > Mn > Cu > Cr > 20 ng/m3 > Ni > As > Se >Sb > V> Cd. The average concentration in summer was 122.8 ng/m3 (72.2–211 ng/m3) with the order of Pb > Mn > 25 ng/m3 > Cr > Ni > 10 ng/m3 > Cu > As > Se > Sb > V> Cd.
Heavy metal elements in PM2.5 showed the serious health risks and they are considered too main from kinds of anthropogenic sources [1,2,13,40], including the represent industries, biomass burning, coal combustion and the vehicle emissions [13,14,15]. Enrichment factors (EFs) was widely selected as an indicator to distinguish the possible sources of elements and evaluate the anthropogenic effects on the relative elements [1,13,41]. Here, the Al element was selected as the crustal typical to calculate EFs of each element. The detailed calculation method may be found in the previous article [1,13]. The EFs was calculated as following:
EFs = ((C/Al)PM2.5)/((C/Al)crust)
where C is the element concentration.
The EFs of each element in PM2.5 are shown in Table S5. According to the elemental contents, four pollution cases were selected as the typical to analyze the possible sources: The 16 February case with greatest concentrations; the 20 February case with the lightest concentrations during the winter sampling period; the 25 August case with greatest concentrations and the 27 August case with the lightest concentrations during the summer sampling period. When EFs are greater than 1.00, the element is mainly generated by kinds of anthropogenic sources, such as coal combustion and vehicle emission. When EFs fall between 1.00 to 10.00, the element is mainly from both anthropogenic sources and natural sources (soil source). When EFs are close to 1.00, it means that the elements are from a crustal origin.
Figure 4 clearly shows that EFs of Sb, Pb, Cd, Se and Zn were over 100 in all 4 pollution cases, which indicated they were generated by anthropogenic sources. The EFs of Cu and As were also over 10 indicating their anthropogenic sources. The EFs of Cr and Ni were over 10 on 20 February, 29 August and the 18 August case. The EFs of K on 16 February and 20 February were greater than that occurred on 25 August and 27 August showed that K element in winter received more anthropogenic sources (such as biomass burning and fireworks burning). The EFs of Mn on 16 February and 20 February cases were lower than that in other cases which indicated that Mn element in winter may be got more natural sources (such as soil and dust). The EFs of V were between 1.00 to 10.0 and the values in relative lighter sampling were a little greater which indicated more anthropogenic sources in these sampling cases.
The elemental ratio method is often selected as a tool to evaluate the profiles sources, origin of air masses [42,43]. The values of several ratios (As/V, V/Ni, Zn/Pb and Zn/ Cd) are shown in Table S2. Generally, Zn, Cu, Pb and Cd elements are considered as traffic traces, while Cu and Zn are main from oil combustion and Cd may be from the transportation activities such as the brake and tire wear [44]. V, Cr, Mn, Ni and Cd elements may be got the effects form the stack emissions [15], Pb element may be emitted from the smelting and coal combustion [15,41]. The Se element is considered as an important coal combustion tracer [42,43]. In 16 February case, ratio of As/V was 2.24 indicating the great contribution of gasoline and diesel combustion sources [43,45]; ratio of Zn/Pb was 1.85 and Zn/ Cd was 153.7 indicated the main sources may be form gasoline vehicles; In 20 February case, As/V(0.61) indicated the main sources may be form gasoline vehicles, V/Ni(0.39) indicated the important source of oil burning, Zn/Pb(11.73) and Zn/ Cd (577.4) indicated the diesel vehicles and metal scrap incineration sources [43,45]. In the 18 August case, As/V(5.15) indicated the sources of coal combustion, V/Ni (0.49) indicated the oil burning source, Zn/Pb(6.75) indicated the diesel vehicles effects and Zn/Cd (252.3) indicated oil burning sources. Refs. [43,45]. In the 29 August case, As/V(1.55) indicated the sources from gasoline vehicles and gasoline combustion, V/Ni (0.09) indicated the main gasoline and diesel vehicles source, Zn/Pb (5.24) indicated the effects from diesel vehicles, Zn/ Cd (137.2) indicated oil burning sources [43,45]. With these elemental ratios, elemental concentrations and NO3/SO42− in these four pollution cases, it could be considered that diesel and gasoline combustion and vehicles may be the most important source on 16 February. The PM2.5 on 20 February were likely kinds of anthropogenic source, while vehicle emission may be the main source due to the greater Cu and Zn mass concentrations. Coal, oil and diesel combustion may be the main source for the 18 August case while gasoline and diesel vehicle may be main source on 29 August. All of them were suffered the effects from anthropogenic sources. Backward trajectory of air masses in these 4 pollution cases were calculated by NOAA HYSPLIT model to analyze the possible effects from hyperactive air mass and shown in Figure 5.
Figure 5a shows that air masses on 16 February may be mainly from northeast and southeast. Figure 5b shows that air masses on 20 February were main from the middle–lower Yangtze River District. The other vital impact factors may be continuous raining. Figure 5c shows that air masses on 18 August were transported form the Northeast China, including Shandong, Henan, Hebei, Anhui and Jiangsu Area. Figure 5d shows the air masses on 29 August received some long-range transport effects from East China and South China. Figure 6 shows that sampling area received the effects from local and long-range transport air masses. Meanwhile, various meteorological factors are also important effective factors. It is necessary to do more work to get more details about air pollution of Wuhan in our further research.

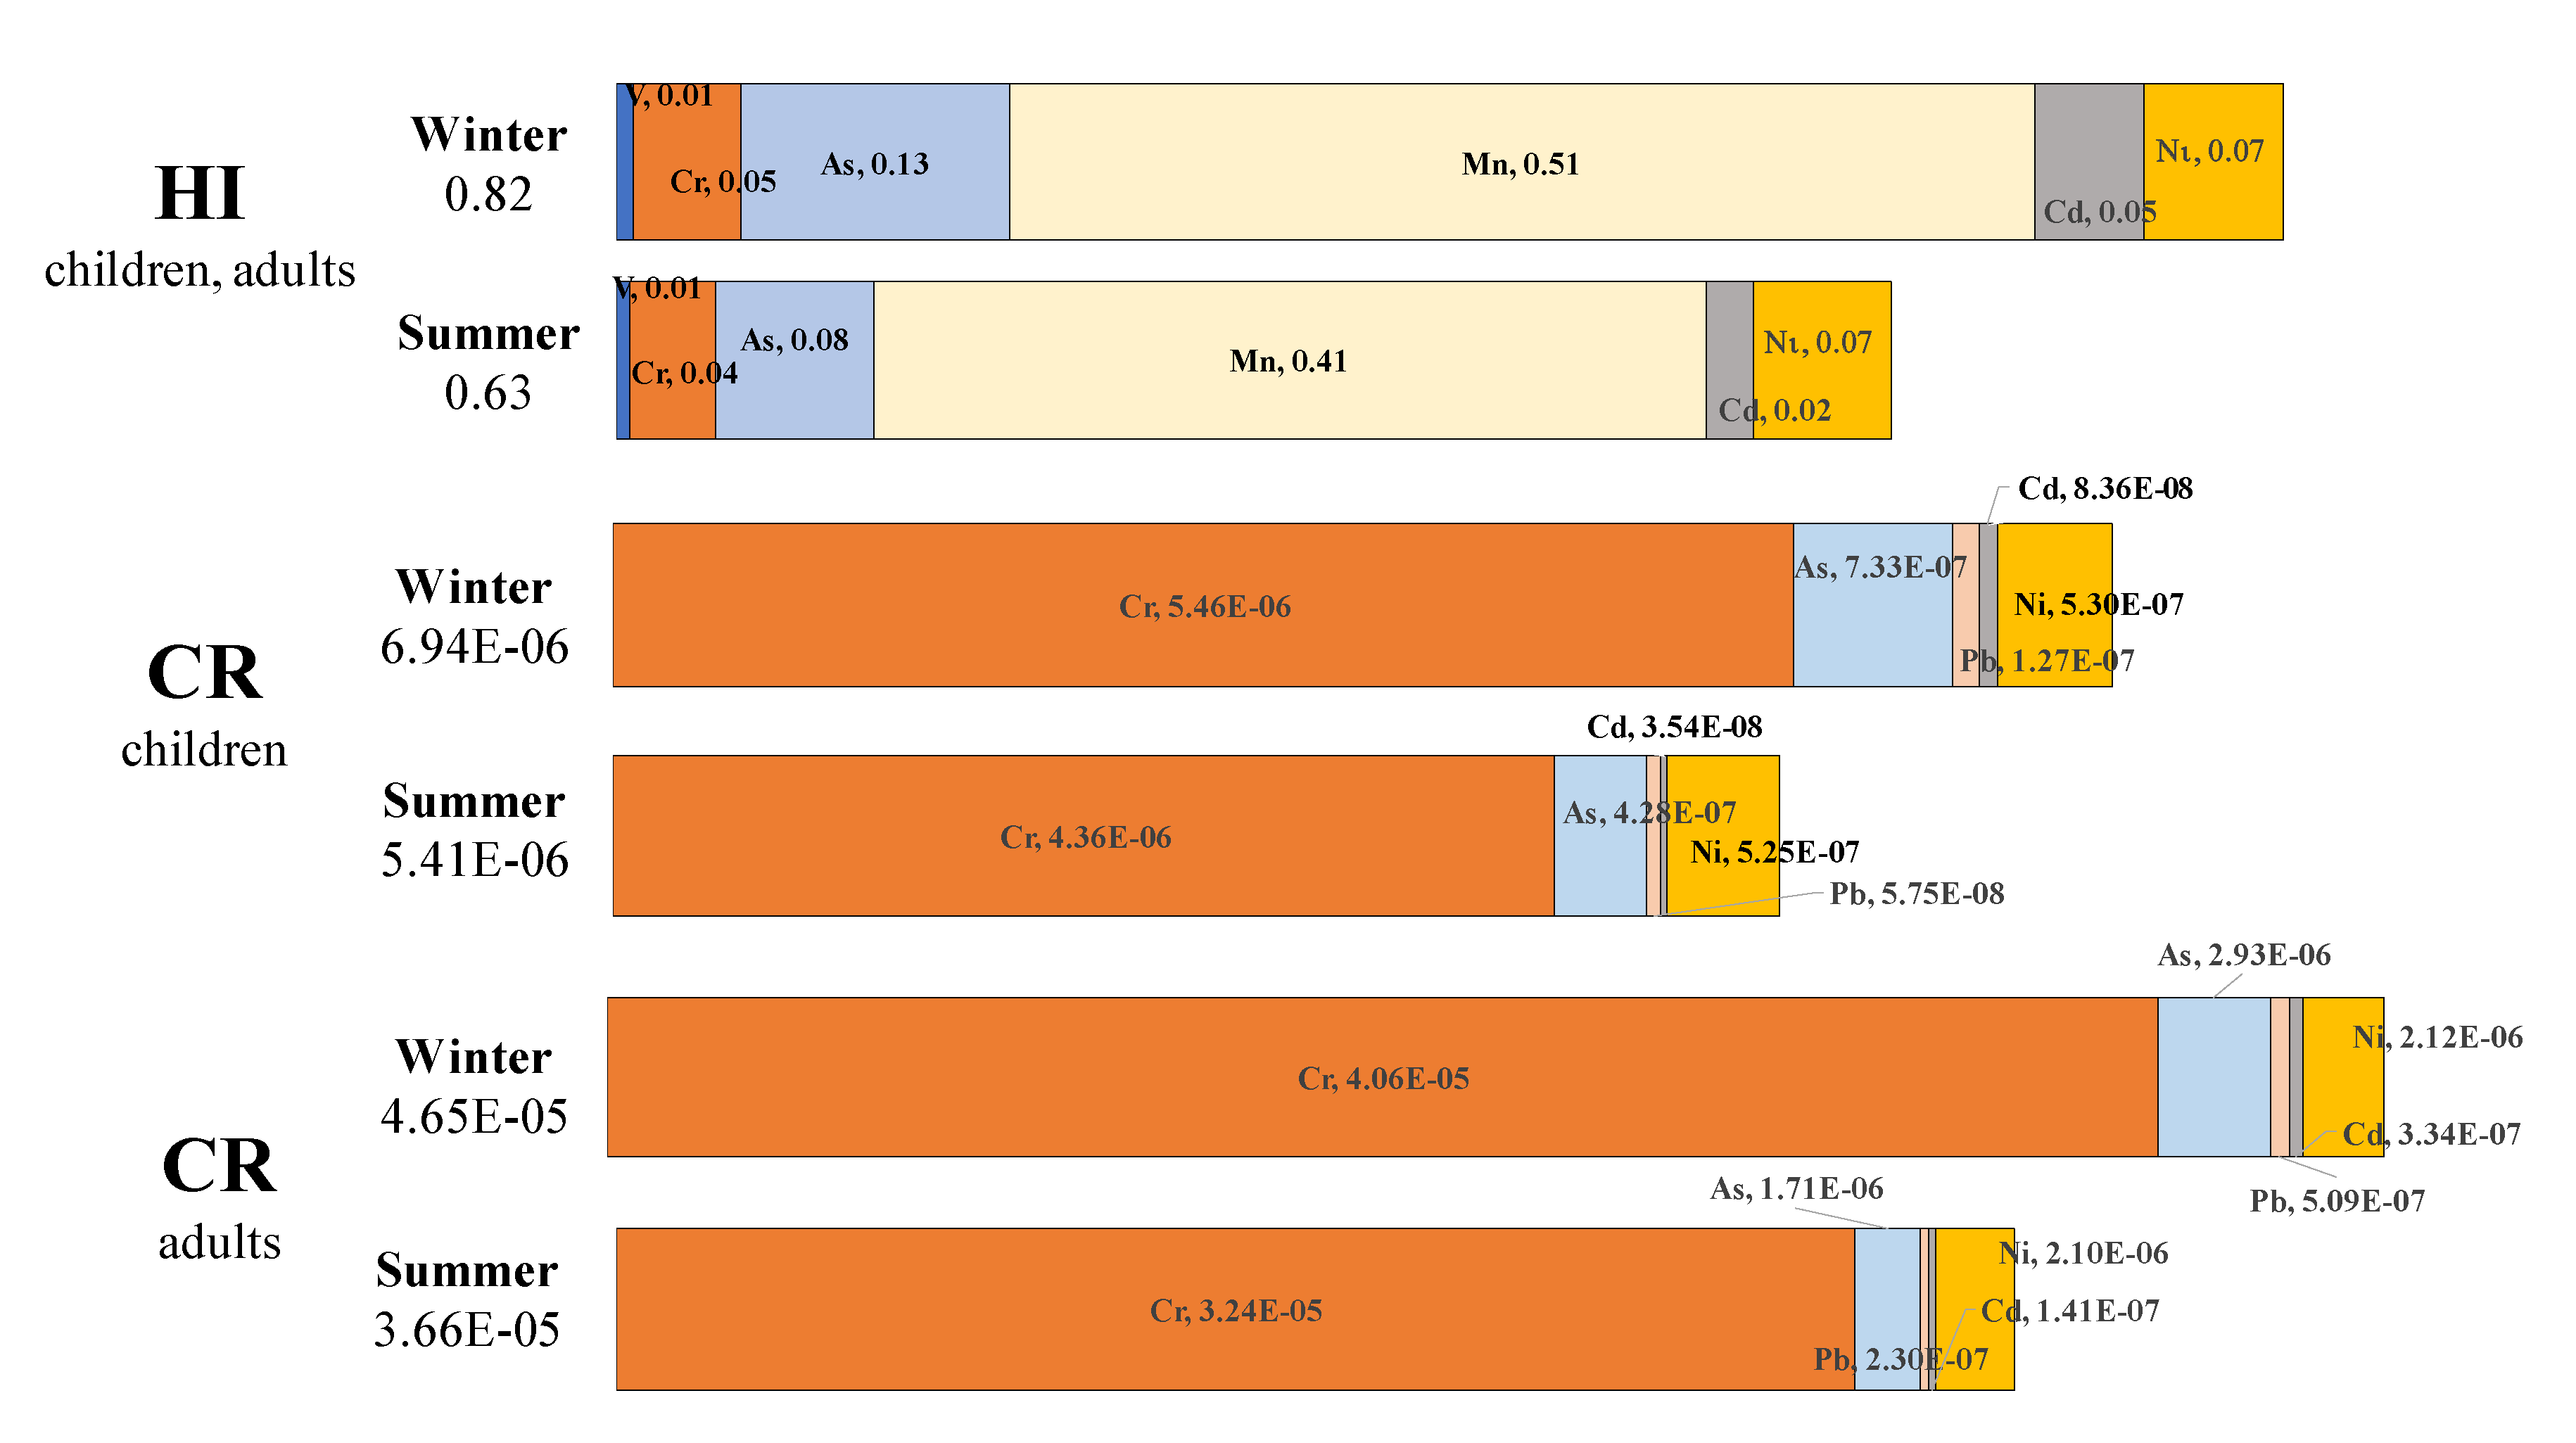
3.4. Health Risk Assessment Risk by Heavy Metal Elements in PM2.5

It has already reported that kinds of trace elements in PM2.5 pose relative human health risks. It could lead to human dysfunction and various illness because PM2.5 could be inhaled via nose and mouth everywhere [13,15,46]. According to the risk assessment guidance from USEPA [47] and some reported articles [13,15,46], health risk assessment could be divided into 2 groups: non-carcinogenic risk (by V, Cr, As, Mn, Cd, Ni) and carcinogenic risk (by Cr, As, Pb, Cd, Ni). Health risk assessment posed by heavy metals in PM2.5 referred from USEPA are shown as the following [13,15,46]:
EC = (C × ET × EF × ED)/AT
HQ = EC/(RfCi × 1000 µg/m3)
HI = ΣHQi
CR = IUR × EC
TCR = ΣCRi
The exposure concentration (EC) is the concentration which is based on the ‘reasonable maximum exposure ’(C, the upper bound of the 95% confidence internal for the average metal concentration); exposure time (ET, 6 h/day), exposure frequency (EF, 350 days/year); exposure duration(ED, children: 6 years, adults: 24 years); average time (AT, for noncarcinogens, AT = ED × 365 days × 24 h/day; for carcinogens, AT = 70 years × 365 days/year × 24 h/day). The hazard quotient (HQ) is the noncancer risk of a single contaminant by means of exposure. RfCi is the inhalation reference concentration (mg/m3) below which adverse noncancer effects are unlikely to occur (RfCi: V, 0.0001 mg/m3; Cr, 0.0001 mg/m3; As, 0.000015 mg/m3; Mn, 0.00005 mg/m3; Cd, 0.00001 mg/m3 and Ni, 0.00005 mg/m3). The hazard index (HI) is equal to sum of HQ of each heavy metal to assess the overall potential of noncarcinogenic effects posed by various heavy elements. When the HQ (HI) > 1.00, there may be an adverse health effect which needs to be paid more attention. If the HQ (HI) < 1.00, the noncancer health effect is believed to be not significant and may be neglected at certain times [13,15,46]. ICR is the inhalation unit risk posed by each heavy metal element (ICR, Cr, 0.012 m3/ µg; As, 0.0043 m3/ µg; Cd, 0.0018 m3/ µg; Pb, 0.00008 m3/ µg and Ni, 0.00024 m3/ µg) while ICR and RfCi of each heavy metal element was cited from regional screening level in resident air supporting tables (http://www.epa.gov/region9/superfund/prg/). The carcinogenic risk (CR) represents the individual cancer number among a certain number of people posed by a single contaminant (1 × 10⁻⁶, 1 in million) [48]. According to the USEPA’s management, acceptable or tolerable CR risk links are between 1 × 10⁻⁶ and 1 × 10⁻⁴, while CR over 1 × 10⁻⁴ are considered as unacceptable. A CR below 1 × 10⁻⁶ is considered not to pose any significant health effects [16].
Moreover, the non-carcinogenic and carcinogenic risks from trace element in PM2.5 at each sampling case are summarized in Table S6. Figure 4 shows average hazard quotient (HQ) values for children and adults of V, Cr, As, Mn, Cd and Ni element, and HI values in winter and summer sampling periods. It was found that HI values for children and adults showed major effects from Mn element in PM2.5. The hazard index values were 0.82 in winter and 0.63 in summer. Both were under 1.00, which indicated that there were not serious non-carcinogenic risks in the sampling area during the sampling periods. Higher HQ values of Mn in PM2.5 was also reported in Zhengzhou, Luoyang and Pingdingshan in Henan area [12] and Baotou [43] of China. The TCR values for children via inhalation of Cr, As, Pb, Cd and Ni elements were 6.94E-06 (2.94E-06–2.21E-05) in winter which indicated that there among 1 million children living in this atmospheric environment, about 6.94 children may be get cancer via inhalation. The TCR values for children in summer were 5.41E-06 (1.91E-06–1.58E-05) indicating that there are about 5.41 children per million facing the health challenge by these elements. The CR for children of Cr in PM2.5 during both winter and summer period exceeded 1.00E-06, indicating that the Cr element made major contribution to TCR values. As and Ni elements also played very an important role in TCR values. Given prolonged exposure, the CR for adults was greater than that for children in both sampling periods. The TCR values for adults were 4.65E-05 (1.95E-05–1.55E-04) in winter, which indicated that among one million people living in this atmospheric environment, about 46.5 adults may get cancer via inhalation. The TCR values for adults in summer were about 3.66E-05 (8.46E-06–1.11E-04), indicating that there are about 36.6 adults per million facing carcinogenic risks.
In both winter and summer sampling periods, the CR for adults by Cr and Ni showed that Cr, Ni and As elements in PM2.5 may pose great health risks to the residents in this area. The TCR values of these elements showed that—per million—about 6.94 children and 46.5 adults may risk getting cancer via the inhalation system under this winter atmospheric surroundings, while about 5.41 children and 36.6 adults may be at risk of cancer via the inhalation system under summer atmospheric surroundings. These quantities were greater than those reported in Nanjing, China (Children, 1.32, adults, 5.29) [17] and lower than that in Zhengzhou [12]. Moreover, Wang (2020) studied health risks by heavy metal element in atmosphere of Shanghai and found that they were distributed in finer particles such as PM1.1 [11]. Compared with kinds of crustal elements, these heavy metal elements were only a few tens of nanograms or even less in PM2.5 (µg), but it can cause non-negligible health risks.

4. Conclusions

In this article, eight water-soluble ionic species and 17 elemental species in PM2.5 collected in central area of Wuhan in February and August of 2018 were measured to analyze the variation of concentrations, possible source and health risk assessment. PM2.5 in winter was about twice that of the summer levels; this result was consistent with the previous studies. Eight water-soluble ionic species were about 1/3 of the PM2.5, with secondary ionic aerosols the dominant content (>85%) during both of the two sampling periods. The ionic balance (<1.00) indicated that there may be some unmeasured ionic contents, such as of CO32−, HCO3, PO43− and other anions. Higher ratios of NO3/SO42− occurred in winter, indicating that vehicle emissions were an important anthropogenic source. Sulfur oxidation ratio (SOR), NOR and the equivalent ratios of (NO3 + SO42−) to NH4+ showed the different chemical changes of secondary aerosol behaviors between two different periods. Higher concentration of K element and EFs of K during the winter sampling periods indicated the more human activities such as biomass burning and fireworks in winter. The EFs and elemental ratios showed that coal combustion and vehicle emissions were the main anthropogenic sources of PM2.5 in both winter and summer. Backward trajectories of air masses indicated that air mass would get the long-range transport effects from various regions. Carcinogenic risk evaluated by several heavy metal elements in PM2.5 showed that these elements with light concentration also played a great role to health risk. Heavy metal elemental contents were relatively stable in winter and summer. The CR, As, Ni, Cd, Mn generated from anthropogenic sources are considering as the significant harmful metal elements in PM2.5 in Wuhan area. Even with a good air quality during the summer sampling period in Wuhan, heavy metal elements also played serious carcinogenic risks to the residents. Otherwise, PAHs, dioxin and complex bioaerosol are the important contents in PM2.5 [18]. All of them prompted us to pay more attention to air quality, especially for its various components, interaction and possible hazards. Moreover, the toxicity and health effects of other critical contents in atmospheric particle research is one of our main works in the future.

Supplementary Materials

The following are available online at https://www.mdpi.com/2073-4433/11/7/760/s1. Table S1: Environmental information and contents urban area of Wuhan during winter and summer sampling periods. Table S2: Separate elemental content in each sampling case during winter and summer sampling periods. Table S3: Separate ionic content in each sampling case during winter and summer sampling periods. Table S4: Pearson’s correlation matrix between ions, PMs, meteorological factors and other pollutants. Table S5: Enrichment factors (EFs) of each element in each sampling case. Table S6: Health risk by kinds of element in each sampling case.

Author Contributions

Conceptualization, W.W., S.L. and Q.W.; methodology, W.Z., S.D., S.Y.; software, W.W., Q.W.; validation, W.W., W.Z.; formal analysis, W.W., S.D.; investigation, W.Z.; resources contribution, Q.W.; data curation, W.W., W.Z.; writing—original draft preparation, W.W.; writing—review and editing, W.W., S.L. and Q.W.; visualization, W.Z.; supervision, W.W., Q.W.; project administration, Q.W.; funding acquisition, Q.W. All authors have read and agreed to the published version of the manuscript.

Funding

Some works of this study were supported by the Special Funds for Innovative Area Research (No. 20120015, FY 2008-FY2012) and Basic Research (B) (No. 24310005, FY2012-FY2014; No.18H03384, FY2017~FY2020) of Grant-in-Aid for Scientific Research of Japanese Ministry of Education, Culture, Sports, Science and Technology (MEXT) and; the Steel Foundation for Environmental Protection Technology of Japan (No. C-33, FY 2015- FY 2017).

Conflicts of Interest

The authors declare no conflicts of interest.

Abbreviations

(NH4)2SO4 ammonium sulfate
AQI air quality index
ATn an averaging time
CESS left for environmental science in Saitama
EC inhalation exposure concentration
ED exposure duration
EFcs crustal enrichment factors
ET exposure time
GDAS global data assimilation system
GDP gross domestic product
HI hazard index
HQ hazard quotient
HYSPLIT hybrid single particle Lagrangian integrated trajectory
ICP-MS inductively coupled plasma mass spectrometry
IUR inhalation unit risk
NH4HSO4ammonium hydrogen nitrate
NH4NO3ammonium nitrate
NOAA National Oceanic and Atmospheric Administration
NOR nitrogen oxidation ratio
NSAAQS national secondary ambient air quality standards
PAPA public health and air pollution in Asia
PM10particulate matter with aerodynamic diameters below 10 μm
PM2.5particulate matter with aerodynamic diameters below 2.5 μm
RfC inhalation reference concentration
SEMC Shanghai environmental monitoring left
SOR sulfur oxidation ratio
TCR carcinogenic risk
TEF exposure frequency
UCL confidence interval
USEPA United States Environmental Protection Agency

References

  1. Zhang, F.; Wang, Z.W.; Cheng, H.R.; Lv, X.P.; Gong, W.; Wang, X.M.; Zhang, G. Seasonal variations and chemical characteristics of PM2.5 in Wuhan, central China. Sci. Total Environ. 2015, 518–519, 97–105. [Google Scholar] [CrossRef] [PubMed]
  2. Xu, G.; Jiao, L.; Zhang, B.; Zhao, S.; Yuan, M.; Gu, Y.; Liu, J.; Tang, X. Spatial and temporal variability of the PM2.5/PM10 ratio in Wuhan, Central China. Aerosol Air Qual. Res. 2017, 17, 741–751. [Google Scholar] [CrossRef] [Green Version]
  3. Guang, W.; Li, L.J.; Xiang, R.B. PM2.5 and its ionic components at a roadside site in Wuhan, China. Atmos. Pollut. Res. 2019, 10, 162–167. [Google Scholar] [CrossRef]
  4. Huang, T.; Chen, J.; Zhao, W.; Cheng, J.; Cheng, S. Seasonal variations and correlation analysis of water-soluble inorganic ions in PM2.5 in Wuhan, 2013. Atmosphere (Basel) 2016, 7, 4. [Google Scholar] [CrossRef] [Green Version]
  5. Hao, H.; Guo, Q. Spatial and temporal characteristics of PM2.5 and source apportionment in Wuhan. Conf. Ser. Earth Environ. Sci. 2018, 121, 3. [Google Scholar] [CrossRef]
  6. Lyu, X.; Chen, N.; Guo, H.; Zeng, L.; Zhang, W.; Shen, F.; Quan, J.; Wang, N. Chemical characteristics and causes of airborne particulate pollution in warm seasons in Wuhan, central China. Atmos. Chem. Phys. 2016, 16, 10671–10687. [Google Scholar] [CrossRef] [Green Version]
  7. Acciai, C.; Zhang, Z.; Wang, F.; Zhong, Z.; Lonati, G. Characteristics and source analysis of trace elements in PM2.5 in the urban atmosphere of Wuhan in spring. Aerosol Air Qual. Res. 2017, 17, 2224–2234. [Google Scholar] [CrossRef]
  8. You, M. Addition of PM2.5 into the national ambient air quality standards of china and the contribution to air pollution control: The case study of wuhan, China. Sci. World J. 2014, 2014, 1–10. [Google Scholar] [CrossRef]
  9. Kan, H.; Chen, R.; Tong, S. Ambient air pollution, climate change, and population health in China. Environ. Int. 2012, 42, 10–19. [Google Scholar] [CrossRef]
  10. Yang, B.; Guo, J.; Xiao, C. Effect of PM2.5 environmental pollution on rat lung. Environ. Sci. Pollut. Res. 2018, 25, 36136–36146. [Google Scholar] [CrossRef]
  11. Curtis, L.; Rea, W.; Smith-Willis, P.; Fenyves, E.; Pan, Y. Adverse health effects of outdoor air pollutants. Environ. Int. 2006, 32, 815–830. [Google Scholar] [CrossRef] [PubMed]
  12. Koch, M. Airborne fine particulates in the environment: A review of health effect studies, monitoring data and emission inventories. Int. Inst. Appl. Syst. Anal. 2000, 47. [Google Scholar]
  13. Wang, Q.; Wang, W. Size characteristics and health risks of inorganic species in PM1.1 and PM2.0 of Shanghai, China, in spring, 2017. Environ. Sci. Pollut. Res. 2020, 27, 14690–14701. [Google Scholar] [CrossRef]
  14. Kozáková, J.; Leoni, C.; Klán, M.; Hovorka, J.; Racek, M.; Koštejn, M.; Ondráček, J.; Moravec, P.; Schwarz, J. Chemical characterization of pm1–2.5 and its associations with pm1, pm2.5–10 and meteorology in urban and suburban environments. Aerosol Air Qual. Res. 2018, 18, 1684–1697. [Google Scholar] [CrossRef] [Green Version]
  15. Jiang, N.; Guo, Y.; Wang, Q.; Kang, P.; Zhang, R.X.T. Research chemical composition characteristics of PM2.5 in three cities in Henan, central China. Aerosol Air Qual. Res. 2017, 17, 2367–2380. [Google Scholar] [CrossRef] [Green Version]
  16. Balasubramanian, R.; Qian, W.B.; Decesari, S.; Facchini, M.C.; Fuzzi, S. Comprehensive characterization of PM2.5 aerosols in Singapore. J. Geophys. Res. D Atmos. 2003, 108, 16. [Google Scholar] [CrossRef]
  17. Wang, W.; Wang, Q. Chemical characteristics of water-soluble ions and metal elements in ambient particles of Saitama, Japan during the spring Asian dust event, 2017. Int. J. Environ. Impacts 2019, 2, 336–345. [Google Scholar] [CrossRef]
  18. Wang, Q. Studies on size distribution and health risk of 37 species of polycyclic aromatic hydrocarbons associated with fine particulate matter collected in the atmosphere of a suburban area of Shanghai city, China. Environ. Pollut. 2016, 214, 149–160. [Google Scholar] [CrossRef]
  19. Xiong, Y.; Zhou, J.; Schauer, J.J.; Yu, W.; Hu, Y. Seasonal and spatial differences in source contributions to PM2.5 in Wuhan, China. Sci. Total Environ. 2017, 577, 155–165. [Google Scholar] [CrossRef]
  20. Zhang, Y.L.; Cao, F. Fine particulate matter (PM 2.5) in China at a city level. Sci. Rep. 2015, 5, 14884. [Google Scholar] [CrossRef] [Green Version]
  21. Zhang, T.; Cao, J.J.; Tie, X.X.; Shen, Z.X.; Liu, S.X.; Ding, H.; Han, Y.M.; Wang, G.H.; Ho, K.F.; Qiang, J.; et al. Water-soluble ions in atmospheric aerosols measured in Xi’an, China: Seasonal variations and sources. Atmos. Res. 2011, 102, 110–119. [Google Scholar] [CrossRef]
  22. Lai, S.; Zhao, Y.; Ding, A.; Zhang, Y.; Song, T.; Zheng, J.; Ho, K.F.; Lee, S.C.; Zhong, L. Characterization of PM2.5 and the major chemical components during a 1-year campaign in rural Guangzhou, Southern China. Atmos. Res. 2016, 167, 208–215. [Google Scholar] [CrossRef]
  23. Tao, Y.; Yin, Z.; Ye, X.; Ma, Z.; Chen, J. Size distribution of water-soluble inorganic ions in urban aerosols in Shanghai. Atmos. Pollut. Res. 2014, 5, 639–647. [Google Scholar] [CrossRef] [Green Version]
  24. Yao, X.; Chan, C.K.; Fang, M.; Cadle, S.; Chan, T.; Mulawa, P.; He, K.; Ye, B. The water-soluble ionic composition of PM2.5 in Shanghai and Beijing, China. Atmos. Environ. 2002, 36, 4223–4234. [Google Scholar] [CrossRef]
  25. Zhang, Y.; Wei, J.; Tang, A.; Zheng, A.; Shao, Z.; Liu, X. Chemical characteristics of PM2.5 during 2015 spring festival in Beijing, China. Aerosol Air Qual. Res. 2017, 17, 1169–1180. [Google Scholar] [CrossRef] [Green Version]
  26. Feng, J.; Yu, H.; Su, X.; Liu, S.; Li, Y.; Pan, Y.; Sun, J.H. Chemical composition and source apportionment of PM2.5 during Chinese Spring Festival at Xinxiang, a heavily polluted city in North China: Fireworks and health risks. Atmos. Res. 2016, 182, 176–188. [Google Scholar] [CrossRef]
  27. Zhao, J.; Zhang, F.; Xu, Y.; Chen, J. Characterization of water-soluble inorganic ions in size-segregated aerosols in coastal city, Xiamen. Atmos. Res. 2011, 99, 546–562. [Google Scholar] [CrossRef]
  28. Kumar, A.; Sarin, M.M.; Sudheer, A.K. Mineral and anthropogenic aerosols in Arabian Sea-atmospheric boundary layer: Sources and spatial variability. Atmos. Environ. 2008, 42, 5169–5181. [Google Scholar] [CrossRef]
  29. Quinn, P.K.; Coffman, D.J.; Bates, T.S.; Welton, E.J.; Covert, D.S.; Miller, T.L.; Johnson, J.E.; Maria, S.; Russell, L.; Arimoto, R.; et al. Aerosol optical properties measured on board the Ronald H. Brown during ACE-Asia as a function of aerosol chemical composition and source region. J. Geophys. Res. D Atmos. 2004, 109, 1–28. [Google Scholar] [CrossRef]
  30. Shahid, I.; Kistler, M.; Mukhtar, A.; Ghauri, B.M.; Ramirez-Santa Cruz, C.; Bauer, H.; Puxbaum, H. Chemical characterization and mass closure of PM10 and PM2.5 at an urban site in Karachi-Pakistan. Atmos. Environ. 2016, 128, 114–123. [Google Scholar] [CrossRef]
  31. Shen, Z.; Sun, J.; Cao, J.; Zhang, L.; Zhang, Q.; Lei, Y.; Gao, J.; Huang, R.J.; Liu, S.; Huang, Y.; et al. Chemical profiles of urban fugitive dust PM2.5 samples in Northern Chinese cities. Sci. Total Environ. 2016, 569–570, 619–626. [Google Scholar] [CrossRef]
  32. Lonati, G.; Giugliano, M.; Butelli, P.; Romele, L.; Tardivo, R. Major chemical components of PM2.5 in Milan (Italy). Atmos. Environ. 2005, 39, 1925–1934. [Google Scholar] [CrossRef]
  33. Zhao, M.; Huang, Z.; Qiao, T.; Zhang, Y.; Xiu, G.; Yu, J. Chemical characterization, the transport pathways and potential sources of PM2.5 in Shanghai: Seasonal variations. Atmos. Res. 2015, 158–159, 66–78. [Google Scholar] [CrossRef]
  34. Arimoto, R.; Duce, R.A.; Savoie, D.L.; Prospero, J.M.; Talbot, R.; Cullen, J.D.; Tomza, U.; Lewis, N.F.; Ray, B.J. Relationships among aerosol constituents from Asia and the North Pacific during PEM-West a. J. Geophys. Res. Atmos. 1996, 101, 2011–2023. [Google Scholar] [CrossRef]
  35. Shen, Z.; Cao, J.; Arimoto, R.; Han, Z.; Zhang, R.; Han, Y.; Liu, S.; Okuda, T.; Nakao, S.; Tanaka, S. Ionic composition of TSP and PM 2.5 during dust storms and air pollution episodes at Xi’an, China. Atmos. Environ. 2009, 43, 2911–2918. [Google Scholar] [CrossRef]
  36. Huang, X.; Liu, Z.; Zhang, J.; Wen, T.; Ji, D.; Wang, Y. Seasonal variation and secondary formation of size-segregated aerosol water-soluble inorganic ions during pollution episodes in Beijing. Atmos. Res. 2016, 168, 70–79. [Google Scholar] [CrossRef]
  37. Chan, C.K.; Yao, X. Air pollution in mega cities in China. Atmos. Environ. 2008, 42, 1–42. [Google Scholar] [CrossRef]
  38. Ohta, S.; Okita, T. A chemical characterization of atmospheric aerosol in Sapporo. Atmos. Environ. Part A Gen. Top. 1990, 24, 815–822. [Google Scholar] [CrossRef]
  39. Song, S.; Wu, Y.; Jiang, J.; Yang, L.; Cheng, Y.; Hao, J. Chemical characteristics of size-resolved PM 2.5 at a roadside environment in Beijing, China. Environ. Pollut. 2012, 161, 215–221. [Google Scholar] [CrossRef]
  40. Wang, J.; Geng, N.B.; Xu, Y.F.; Zhang, W.D.; Tang, X.Y.; Zhang, R.Q. PAHs in PM2.5 in Zhengzhou: Concentration, carcinogenic risk analysis, and source apportionment. Environ. Monit. Assess. 2014, 186, 7461–7473. [Google Scholar] [CrossRef]
  41. Li, H.; Wu, H.; Wang, Q.; Yang, M.; Li, F.; Sun, Y.; Qian, X.; Wang, J.; Wang, C. Chemical partitioning of fine particle-bound metals on haze–fog and non-haze–fog days in Nanjing, China and its contribution to human health risks. Atmos. Res. 2017, 183, 142–150. [Google Scholar] [CrossRef]
  42. Watson, J.G.; Chow, J.C. Source characterization of major emission sources in the Imperial and Mexicali Valleys along the US/Mexico border. Sci. Total Environ. 2001, 276, 33–47. [Google Scholar] [CrossRef]
  43. Arditsoglou, A.; Samara, C. Levels of total suspended particulate matter and major trace elements in Kosovo: A source identification and apportionment study. Chemosphere 2005, 59, 669–678. [Google Scholar] [CrossRef]
  44. Alves, C.A.; Vicente, A.M.; Custódio, D.; Cerqueira, M.; Nunes, T.; Pio, C.; Lucarelli, F.; Calzolai, G.; Nava, S.; Diapouli, E.; et al. Polycyclic aromatic hydrocarbons and their derivatives ( nitro-PAHs, oxygenated PAHs, and azaarenes) in PM2.5 from Southern European cities. Sci. Total Environ. 2017, 595, 494–504. [Google Scholar] [CrossRef] [PubMed]
  45. Samara, C.; Kouimtzis, T.; Tsitouridou, R.; Kanias, G.; Simeonov, V. Chemical mass balance source apportionment of PM10 in an industrialized urban area of Northern Greece. Atmos. Environ. 2003, 37, 41–54. [Google Scholar] [CrossRef]
  46. Li, Y.; Zhang, Z.; Liu, H.; Zhou, H.; Fan, Z.; Lin, M.; Wu, D.; Xia, B. Characteristics, sources and health risk assessment of toxic heavy metals in PM2.5 at a megacity of southwest China. Environ. Geochem. Health 2016, 38, 353–362. [Google Scholar] [CrossRef]
  47. USEPA. 2006. Available online: https://www3.epa.gov/pmdesignations/2012standards/docs/pm2.5_chemical_composition.pdf (accessed on 21 May 2020).
  48. Huang, X.; Cheng, J.; Bo, D.; Betha, R.; Balasubramanian, R. Bioaccessibility of airborne particulate-bound trace elements in Shanghai and health risk assessment. Front. Environ. Sci. 2016, 4. [Google Scholar] [CrossRef] [Green Version]
Figure 1. Location of sampling site. (a) Location of Wuhan, the central region of China; (b) sampling site in Wuhan City (N30.64, E 114.28); (c) meteorological factors and atmospheric pollutants in each sampling period (5–20 February; 14–30 August).
Atmosphere 11 00760 g001
Figure 2. Mass concentrations of seventeen determined elemental species, major water-soluble ions and PM2.5 in each sampling case: winter sampling period (5–20 February 2018), summer sampling period (14–30 August 2018).
Atmosphere 11 00760 g002
Figure 3. Chemical characteristics of species water-soluble ionic contents during winter and summer sampling periods. (a) Average proportion of each ion to total ions; (b) anion equivalent and cation equivalent; (c) NO3 and SO42− concentrations; (d) SOR and NOR; (e) equivalent of NO3, SO42− and NH4+.
Atmosphere 11 00760 g003
Figure 4. Enrichment factor (EF) values of each element in Fine particulate matter (PM 2.5) in four typical pollution cases.
Atmosphere 11 00760 g004
Figure 5. Air mass trajectory frequencies in four typical sampling case. (a) the 16 February case; (b) the 20 February case; (c) the 25 August case; (d) the 25 August case.
Atmosphere 11 00760 g005
Figure 6. Hazard index (HI) and carcinogenic risk (CR) values for children and adults during winter and summer sampling periods.
Atmosphere 11 00760 g006
Table 1. The average, max, min. median and standard deviation (SD) of each elemental content during winter and summer sampling periods.
WinterSummer
AverageMaxMinMedianSDAverageMaxMinMedianSD
ng/m3ng/m3ng/m3ng/m3 ng/m3ng/m3ng/m3ng/m3
Na9.80E + 029.80E + 021.69E + 026.11E + 022.23E + 023.27E + 024.93E + 022.10E + 023.22E + 027.68E + 01
Mg4.77E + 029.27E + 029.70E + 015.22E + 022.10E + 022.19E + 023.36E + 021.42E + 022.26E + 026.45E + 01
Al1.35E + 032.87E + 033.14E + 021.40E + 036.10E + 029.14E + 021.68E + 034.19E + 029.02E + 026.45E + 01
K2.27E + 036.69E + 036.74E + 021.72E + 031.66E + 036.29E + 021.12E + 034.12E + 025.88E + 022.04E + 02
Ca2.98E + 025.59E + 027.01E + 012.84E + 021.64E + 022.11E + 023.40E + 021.08E + 022.13E + 027.18E + 01
V3.29E + 005.16E + 001.57E + 003.04E + 001.03E + 002.75E + 006.07E + 001.15E + 002.66E + 001.24E + 00
Cr2.33E + 018.35E + 017.61E + 001.60E + 012.14E + 011.86E + 015.95E + 013.16E + 001.36E + 011.64E + 01
Mn3.33E + 016.00E + 012.03E + 003.37E + 012.07E + 012.71E + 014.14E + 011.82E + 012.45E + 018.61E + 00
Fe8.89E + 021.93E + 036.02E + 019.84E + 026.50E + 028.05E + 021.54E + 033.53E + 027.50E + 023.79E + 02
Ni1.51E + 011.05E + 020.00E + 005.21E + 002.80E + 011.49E + 013.85E + 010.00E + 001.06E + 011.23E + 01
Cu3.07E + 016.53E + 014.35E + 002.81E + 011.76E + 018.31E + 001.70E + 012.23E + 007.88E + 004.73E + 00
Zn2.82E + 024.67E + 021.69E + 022.69E + 027.24E + 012.31E + 023.36E + 021.12E + 022.17E + 026.23E + 01
As8.74E + 002.12E + 018.97E − 017.31E + 005.68E + 005.10E + 001.29E + 011.58E + 004.38E + 003.07E + 00
Se5.92E + 001.19E + 011.49E + 006.08E + 003.00E + 004.60E + 008.97E + 002.13E + 004.52E + 001.58E + 00
Cd2.38E + 005.60E + 002.92E − 012.06E + 001.52E + 001.01E + 001.76E + 005.31E − 018.71E − 014.13E − 01
Pb8.14E + 011.33E + 021.27E + 019.27E + 013.65E + 013.68E + 018.43E + 011.44E + 012.89E + 011.86E + 01
Sb4.22E + 006.77E + 001.25E + 004.10E + 001.73E + 003.55E + 006.29E + 001.28E + 003.84E + 001.16E + 00
17 elements6.32E + 031.05E + 041.73E + 036.87E + 032.28E + 003.46E + 035.07E + 032.08E + 033.19E + 039.84E − 01

