Effects of Treated Manure Conditions on Ammonia and Hydrogen Sulfide Emissions from a Swine Finishing Barn Equipped with Semicontinuous Pit Recharge System in Summer

 , , ,
, , ,  and
and
Abstract
1. Introduction
2. Experiments
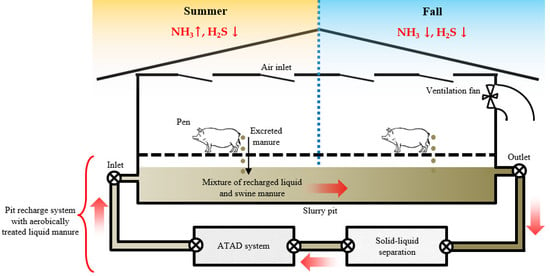
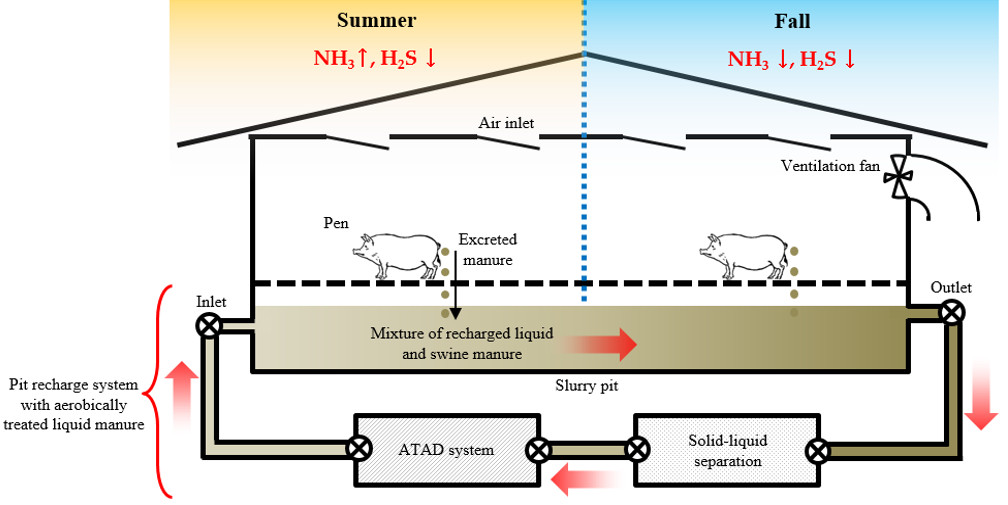
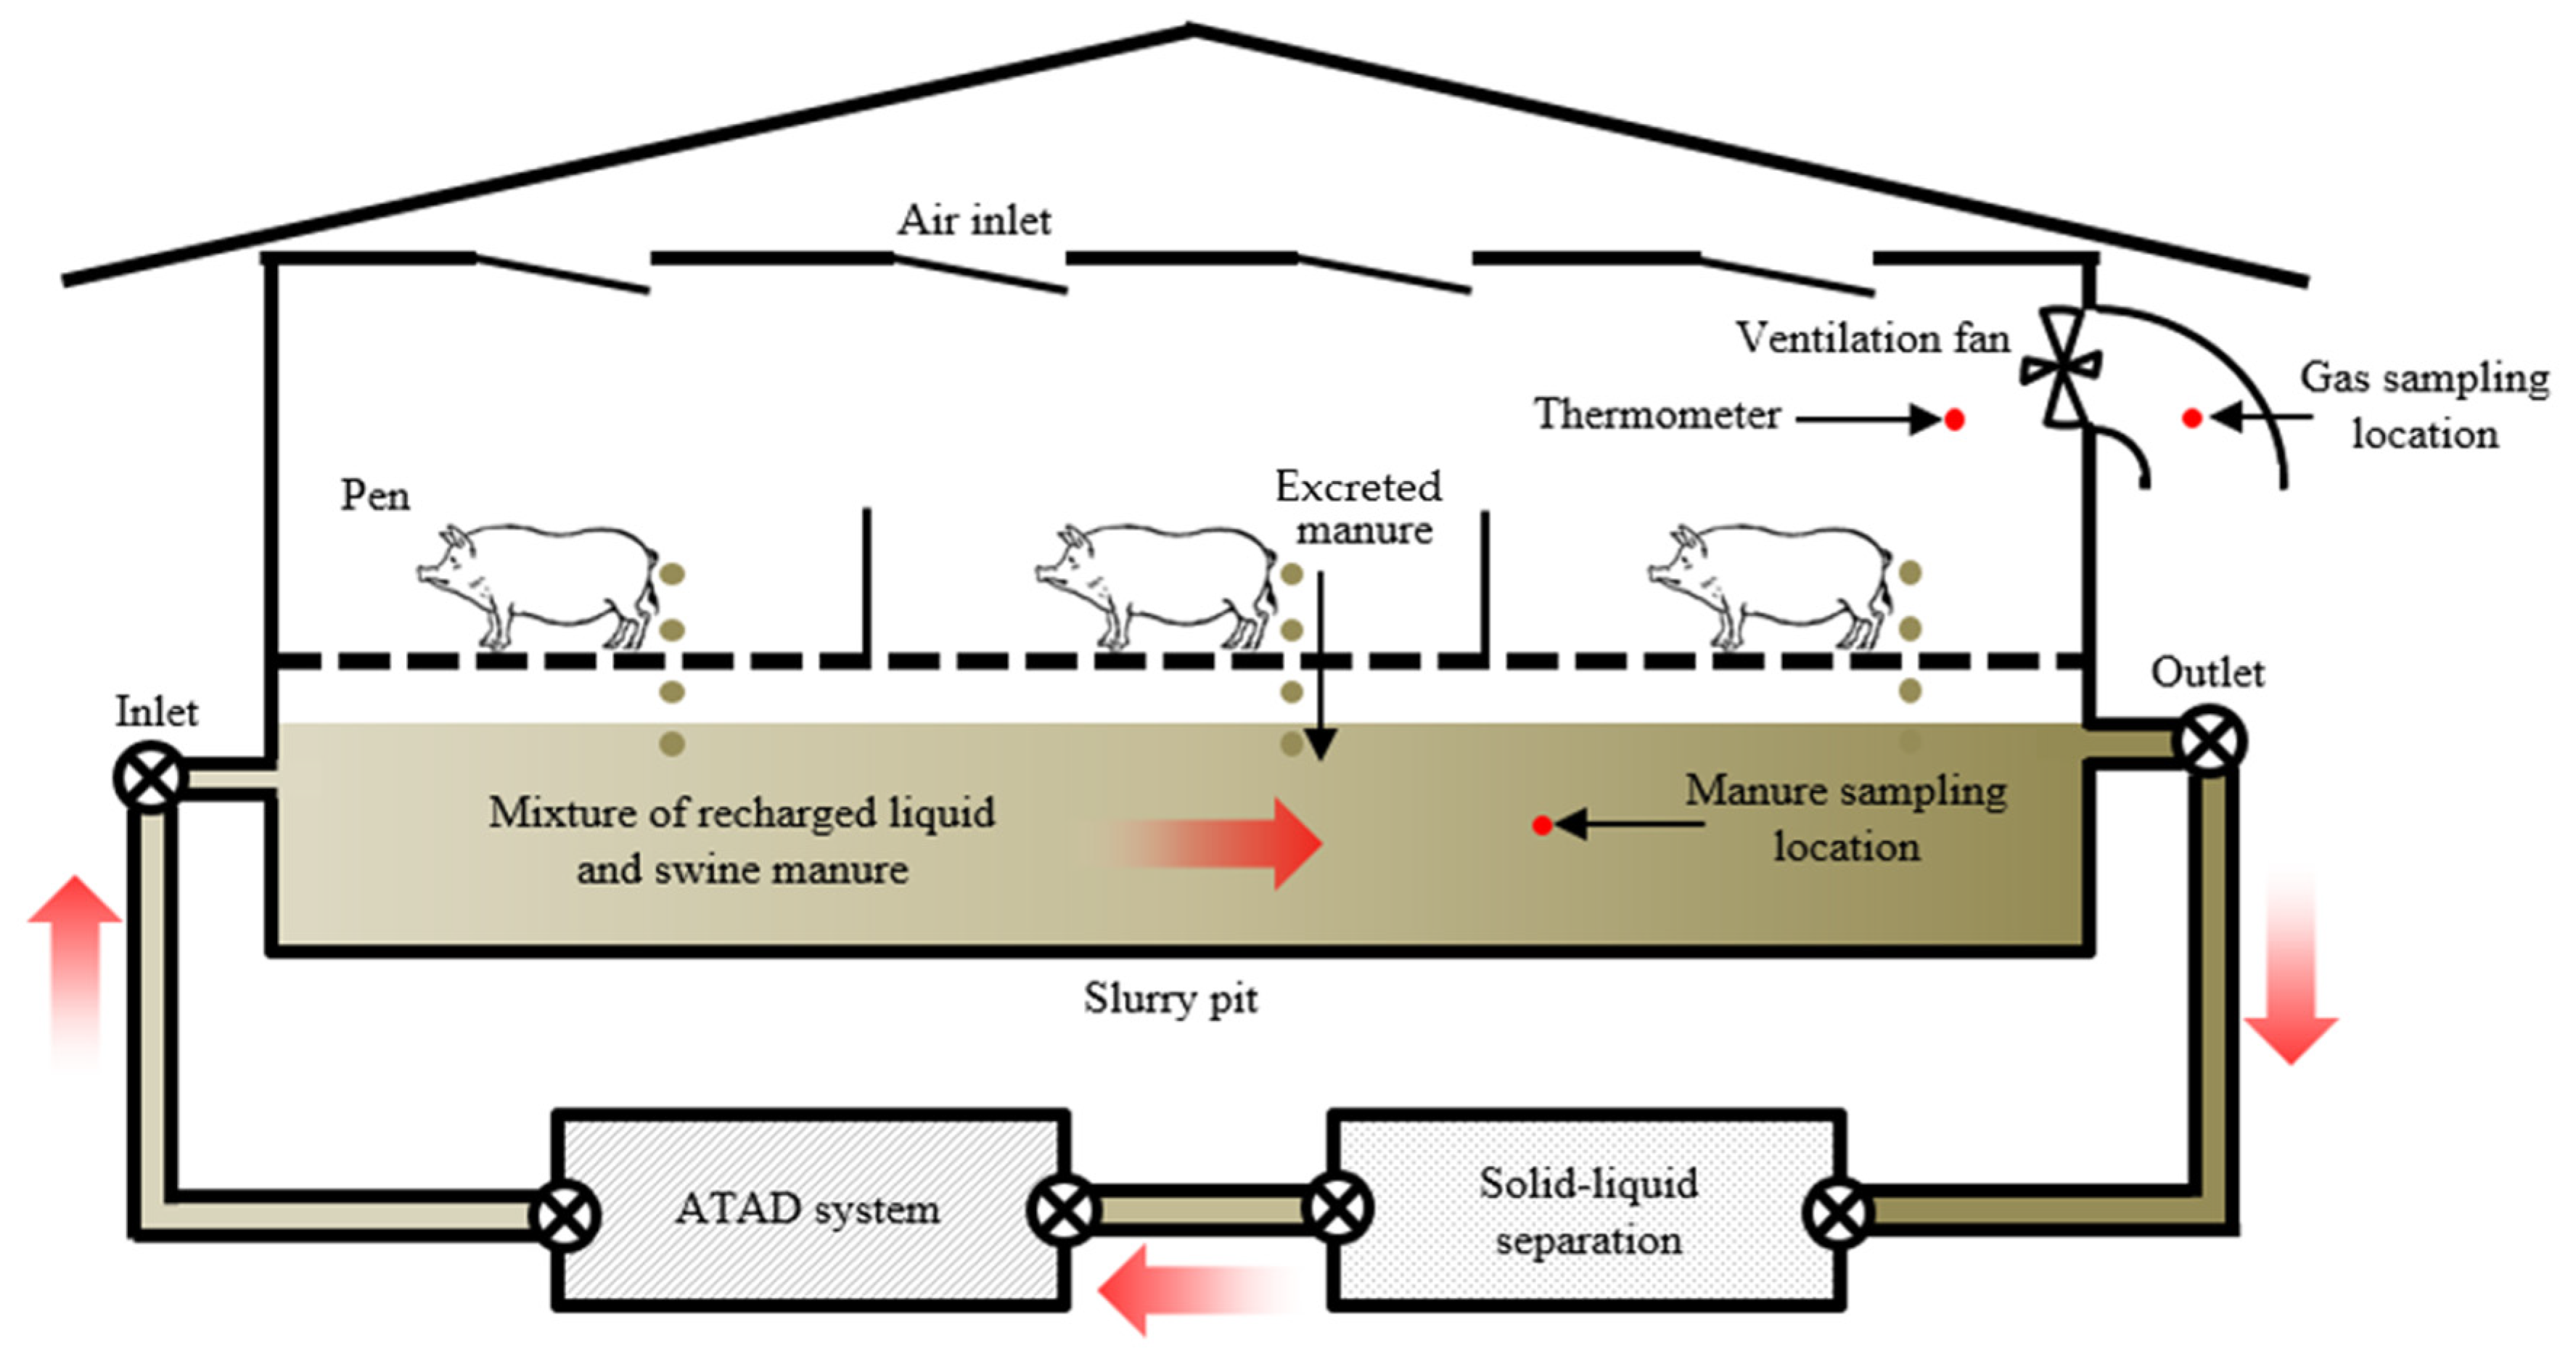
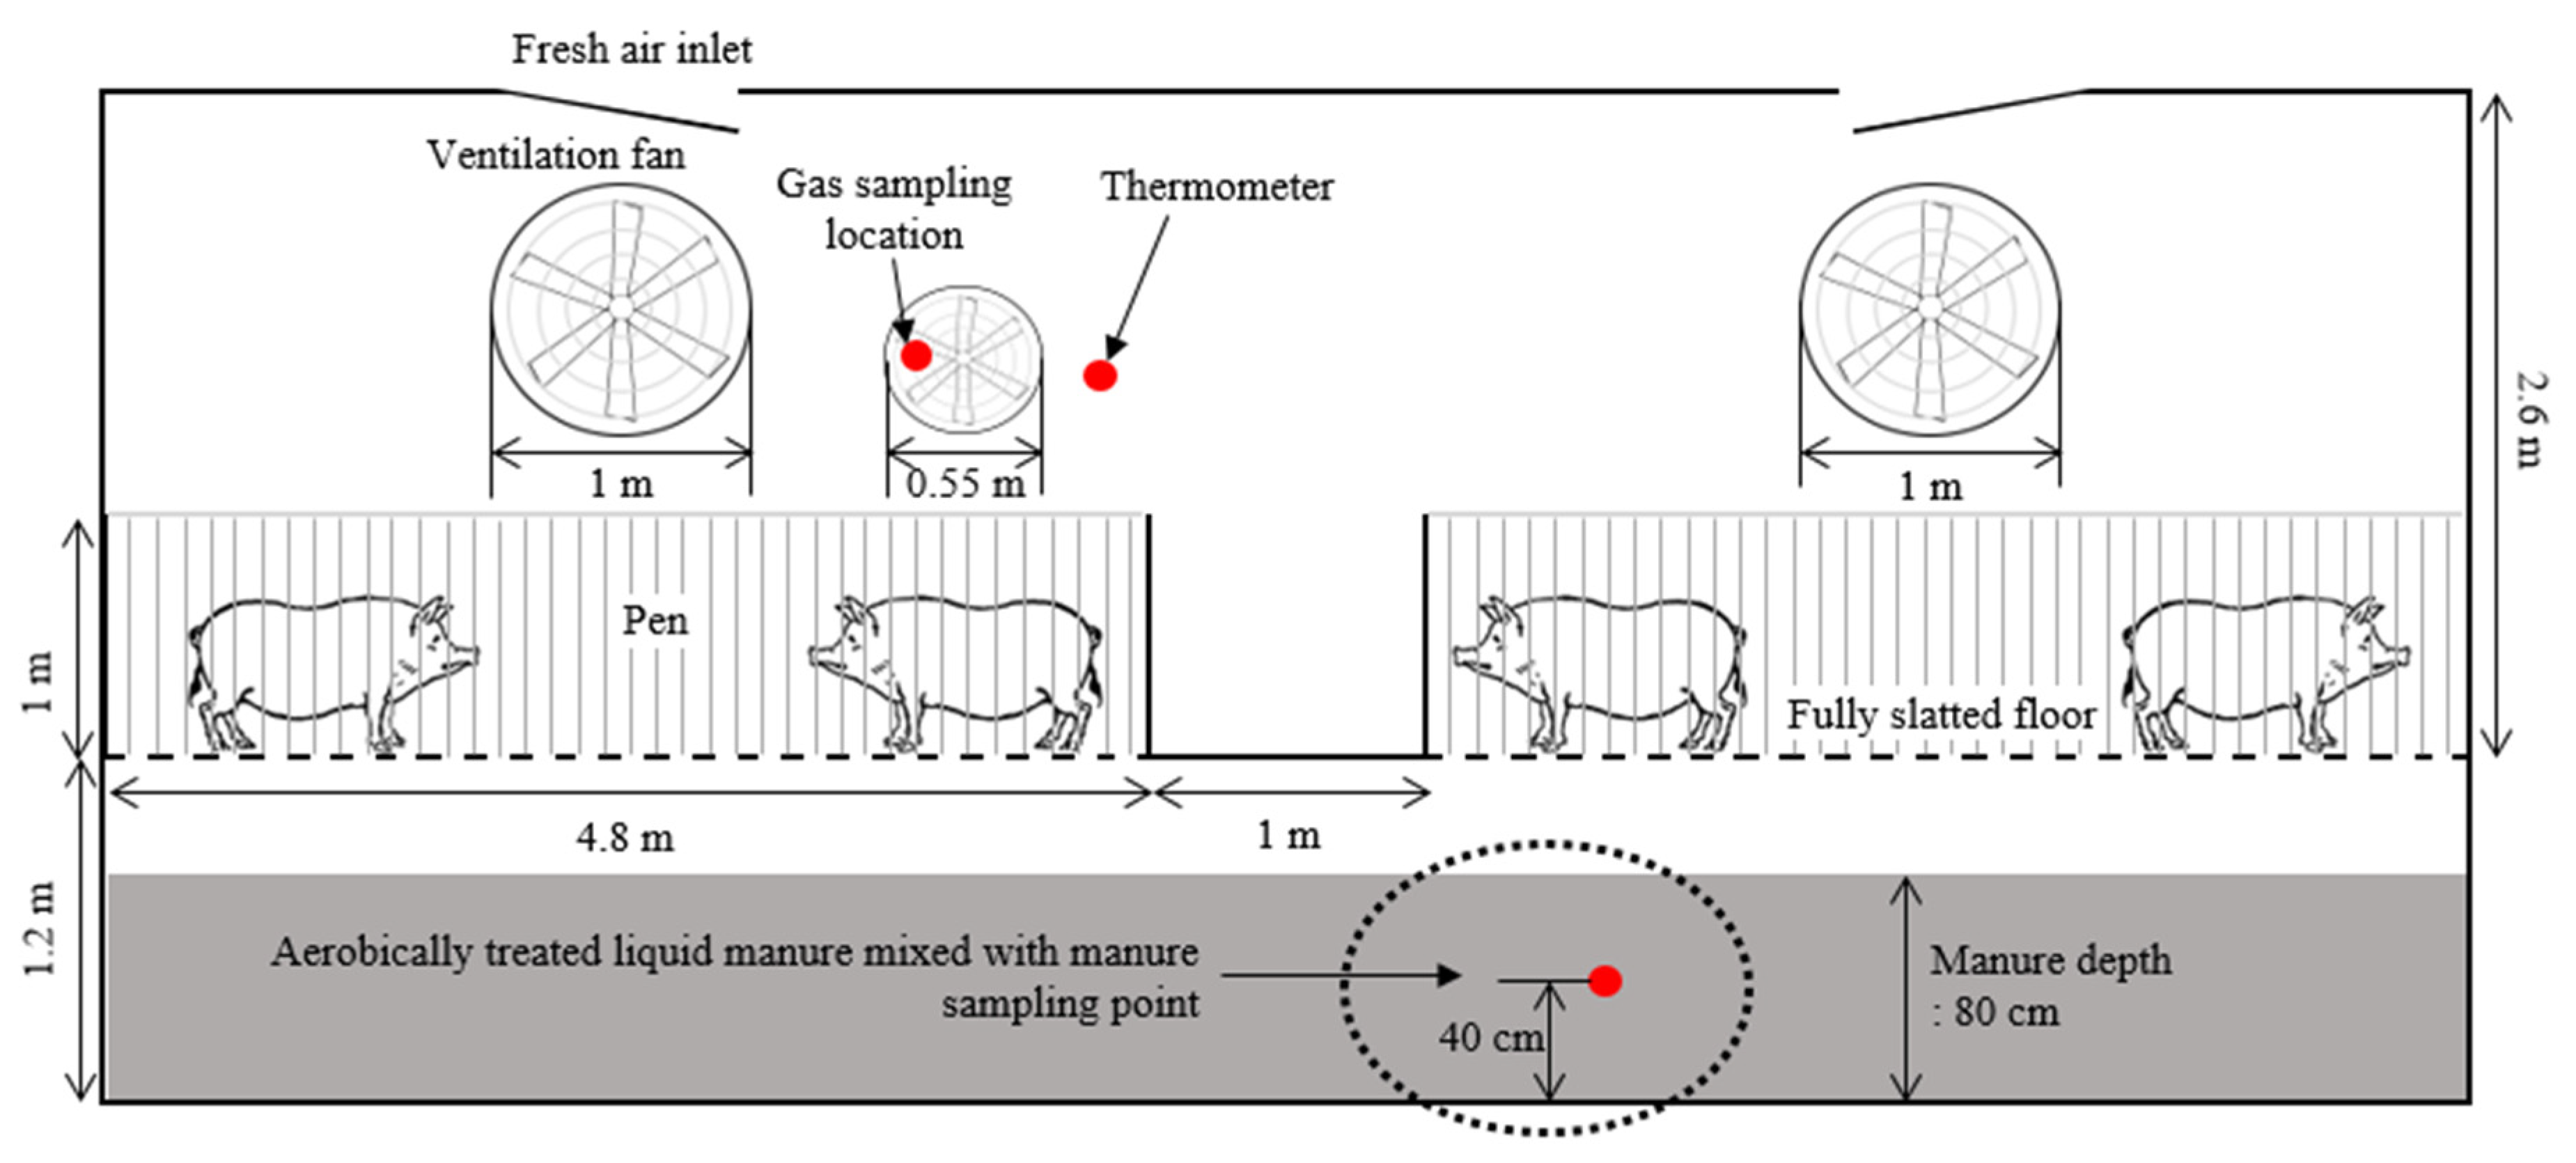
2.1. Farm Description and Experimental Design
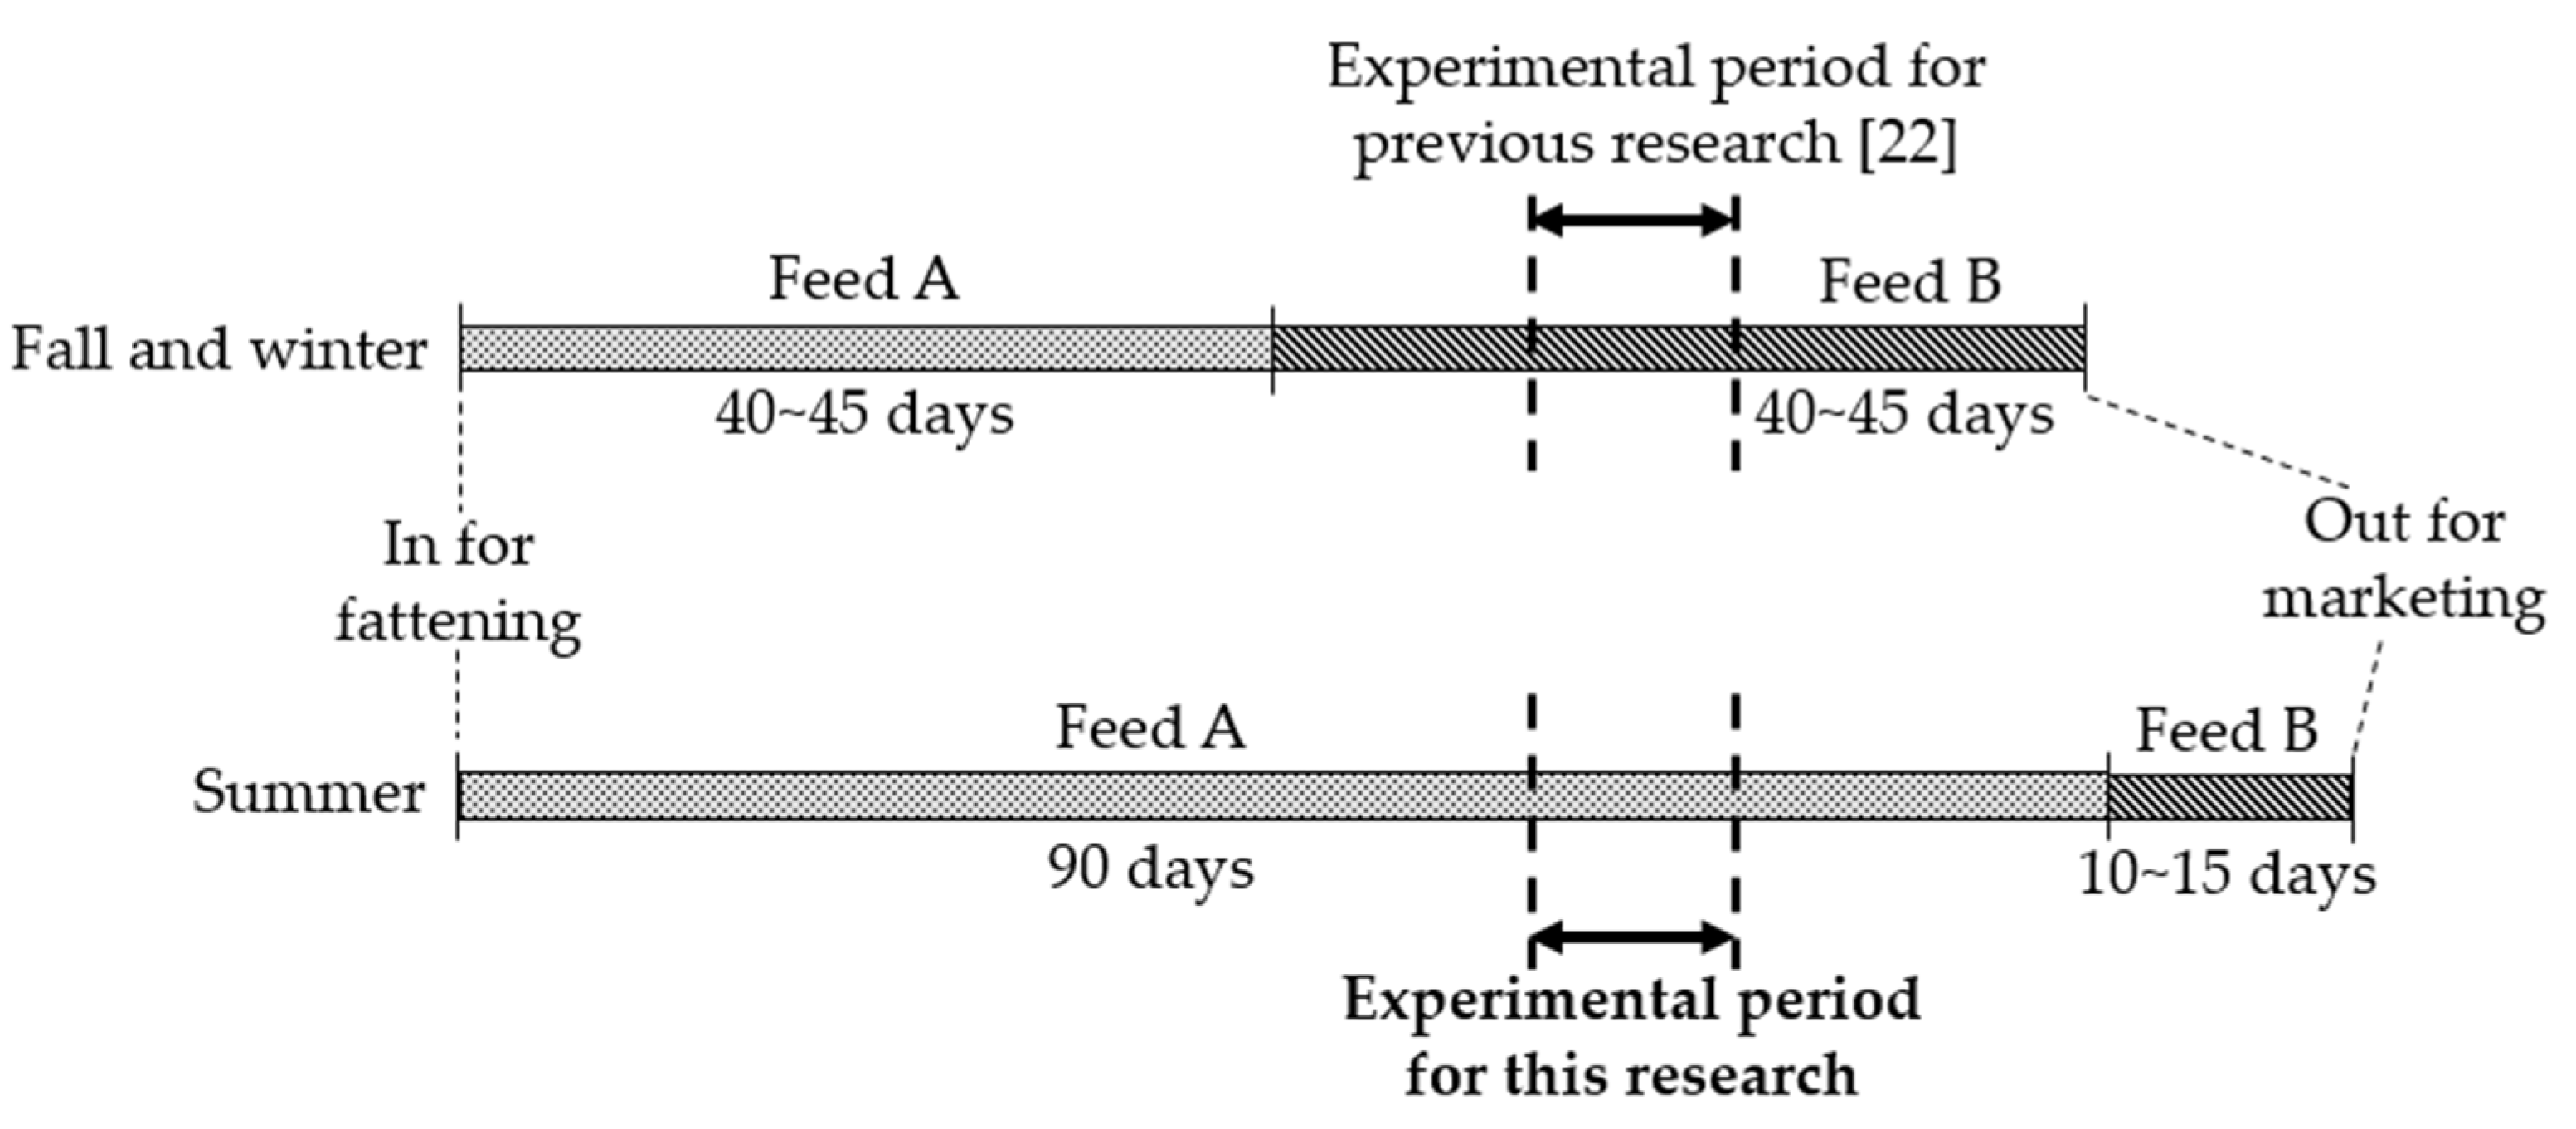
2.2. Animal Lifecycle and Feeding Program
2.3. NH3 and H2S
2.4. Manure and Feed Analysis
2.5. Statistical Analysis
3. Results
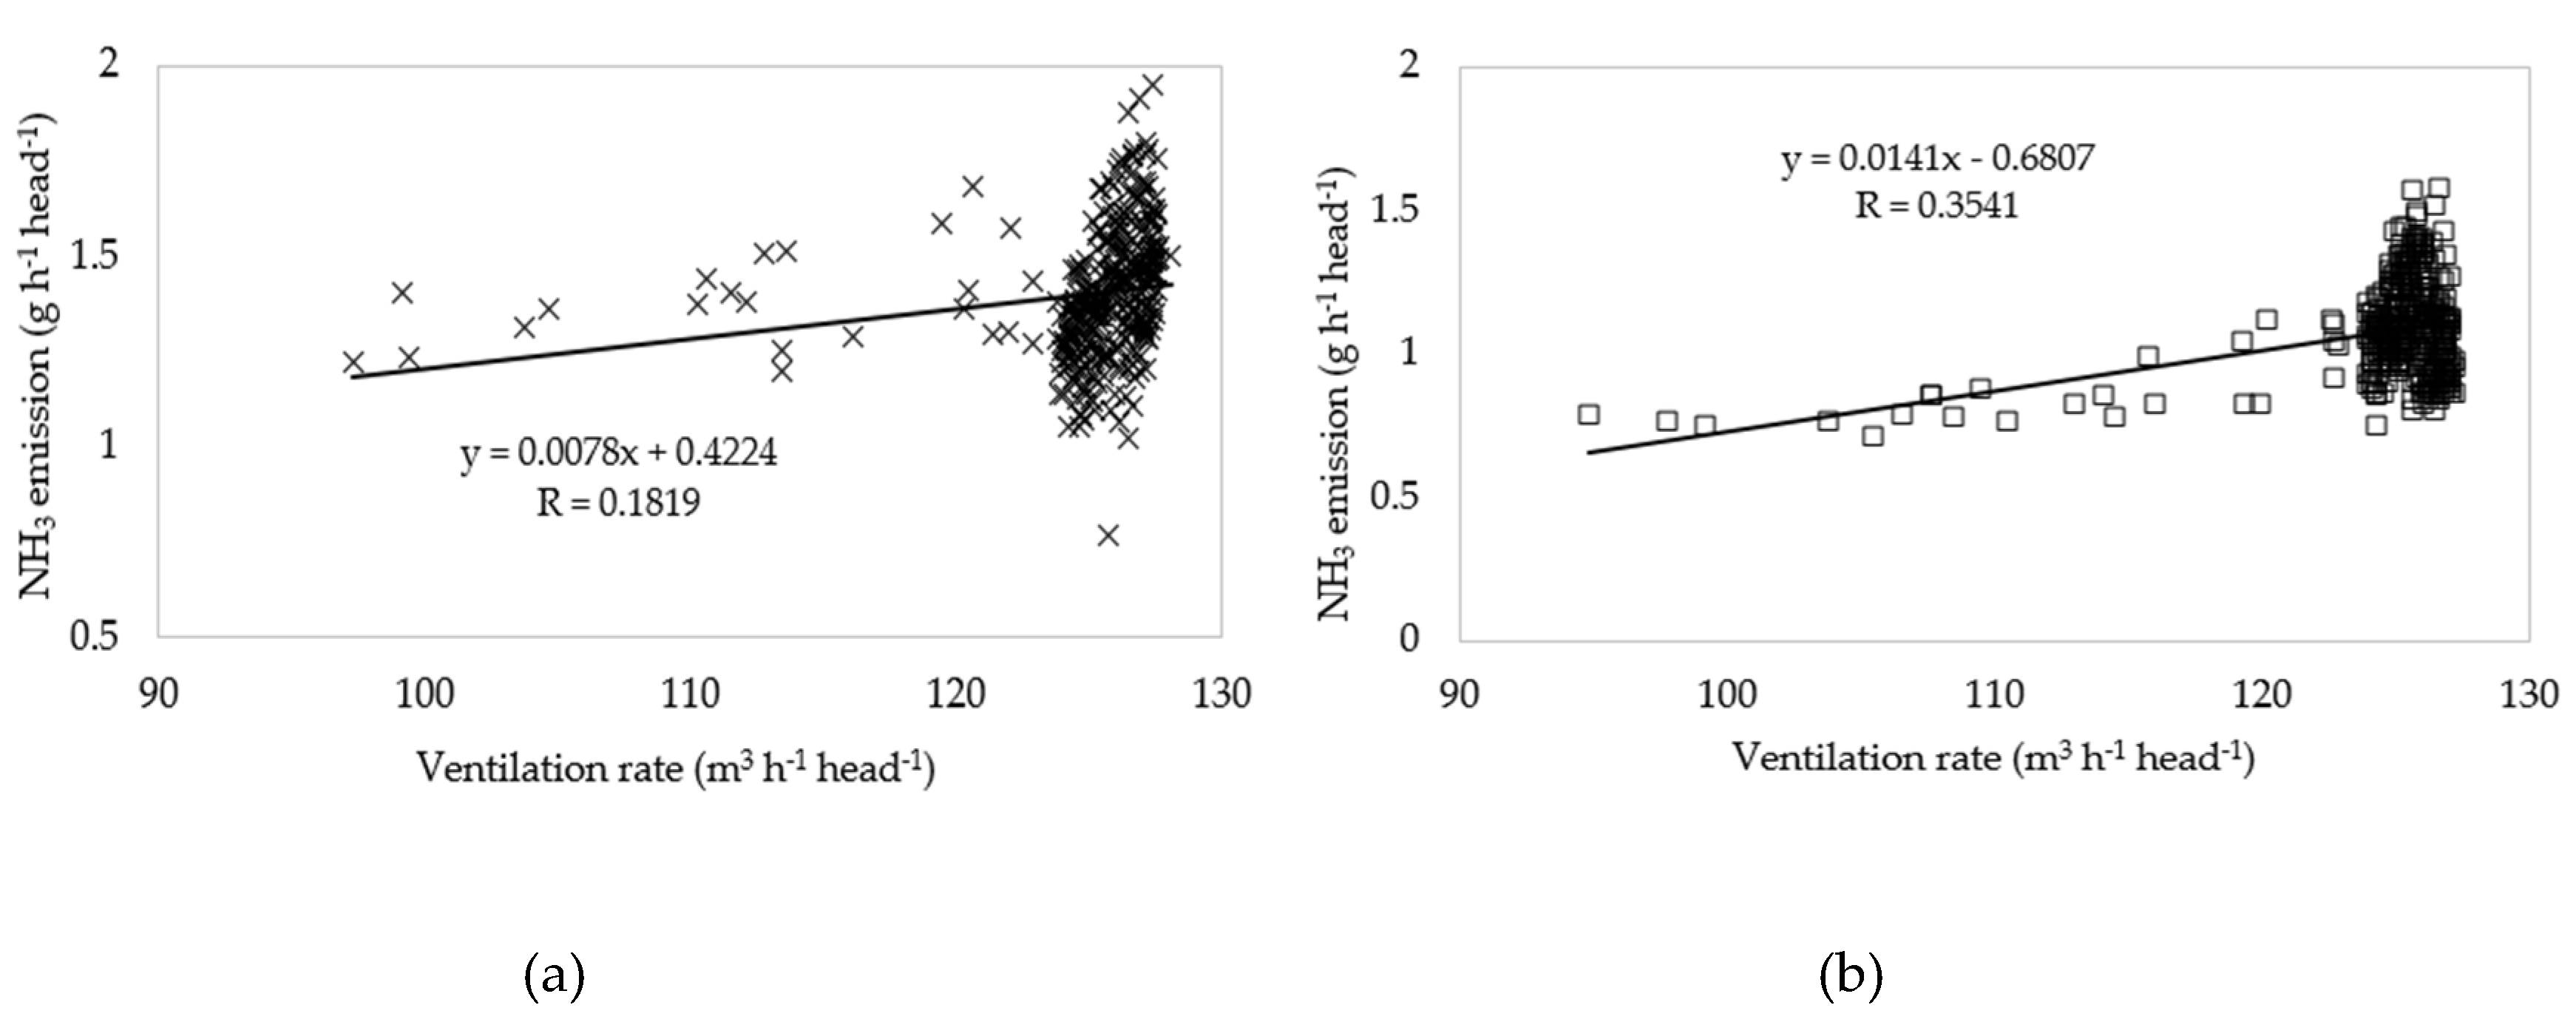
3.1. NH3 Emissions
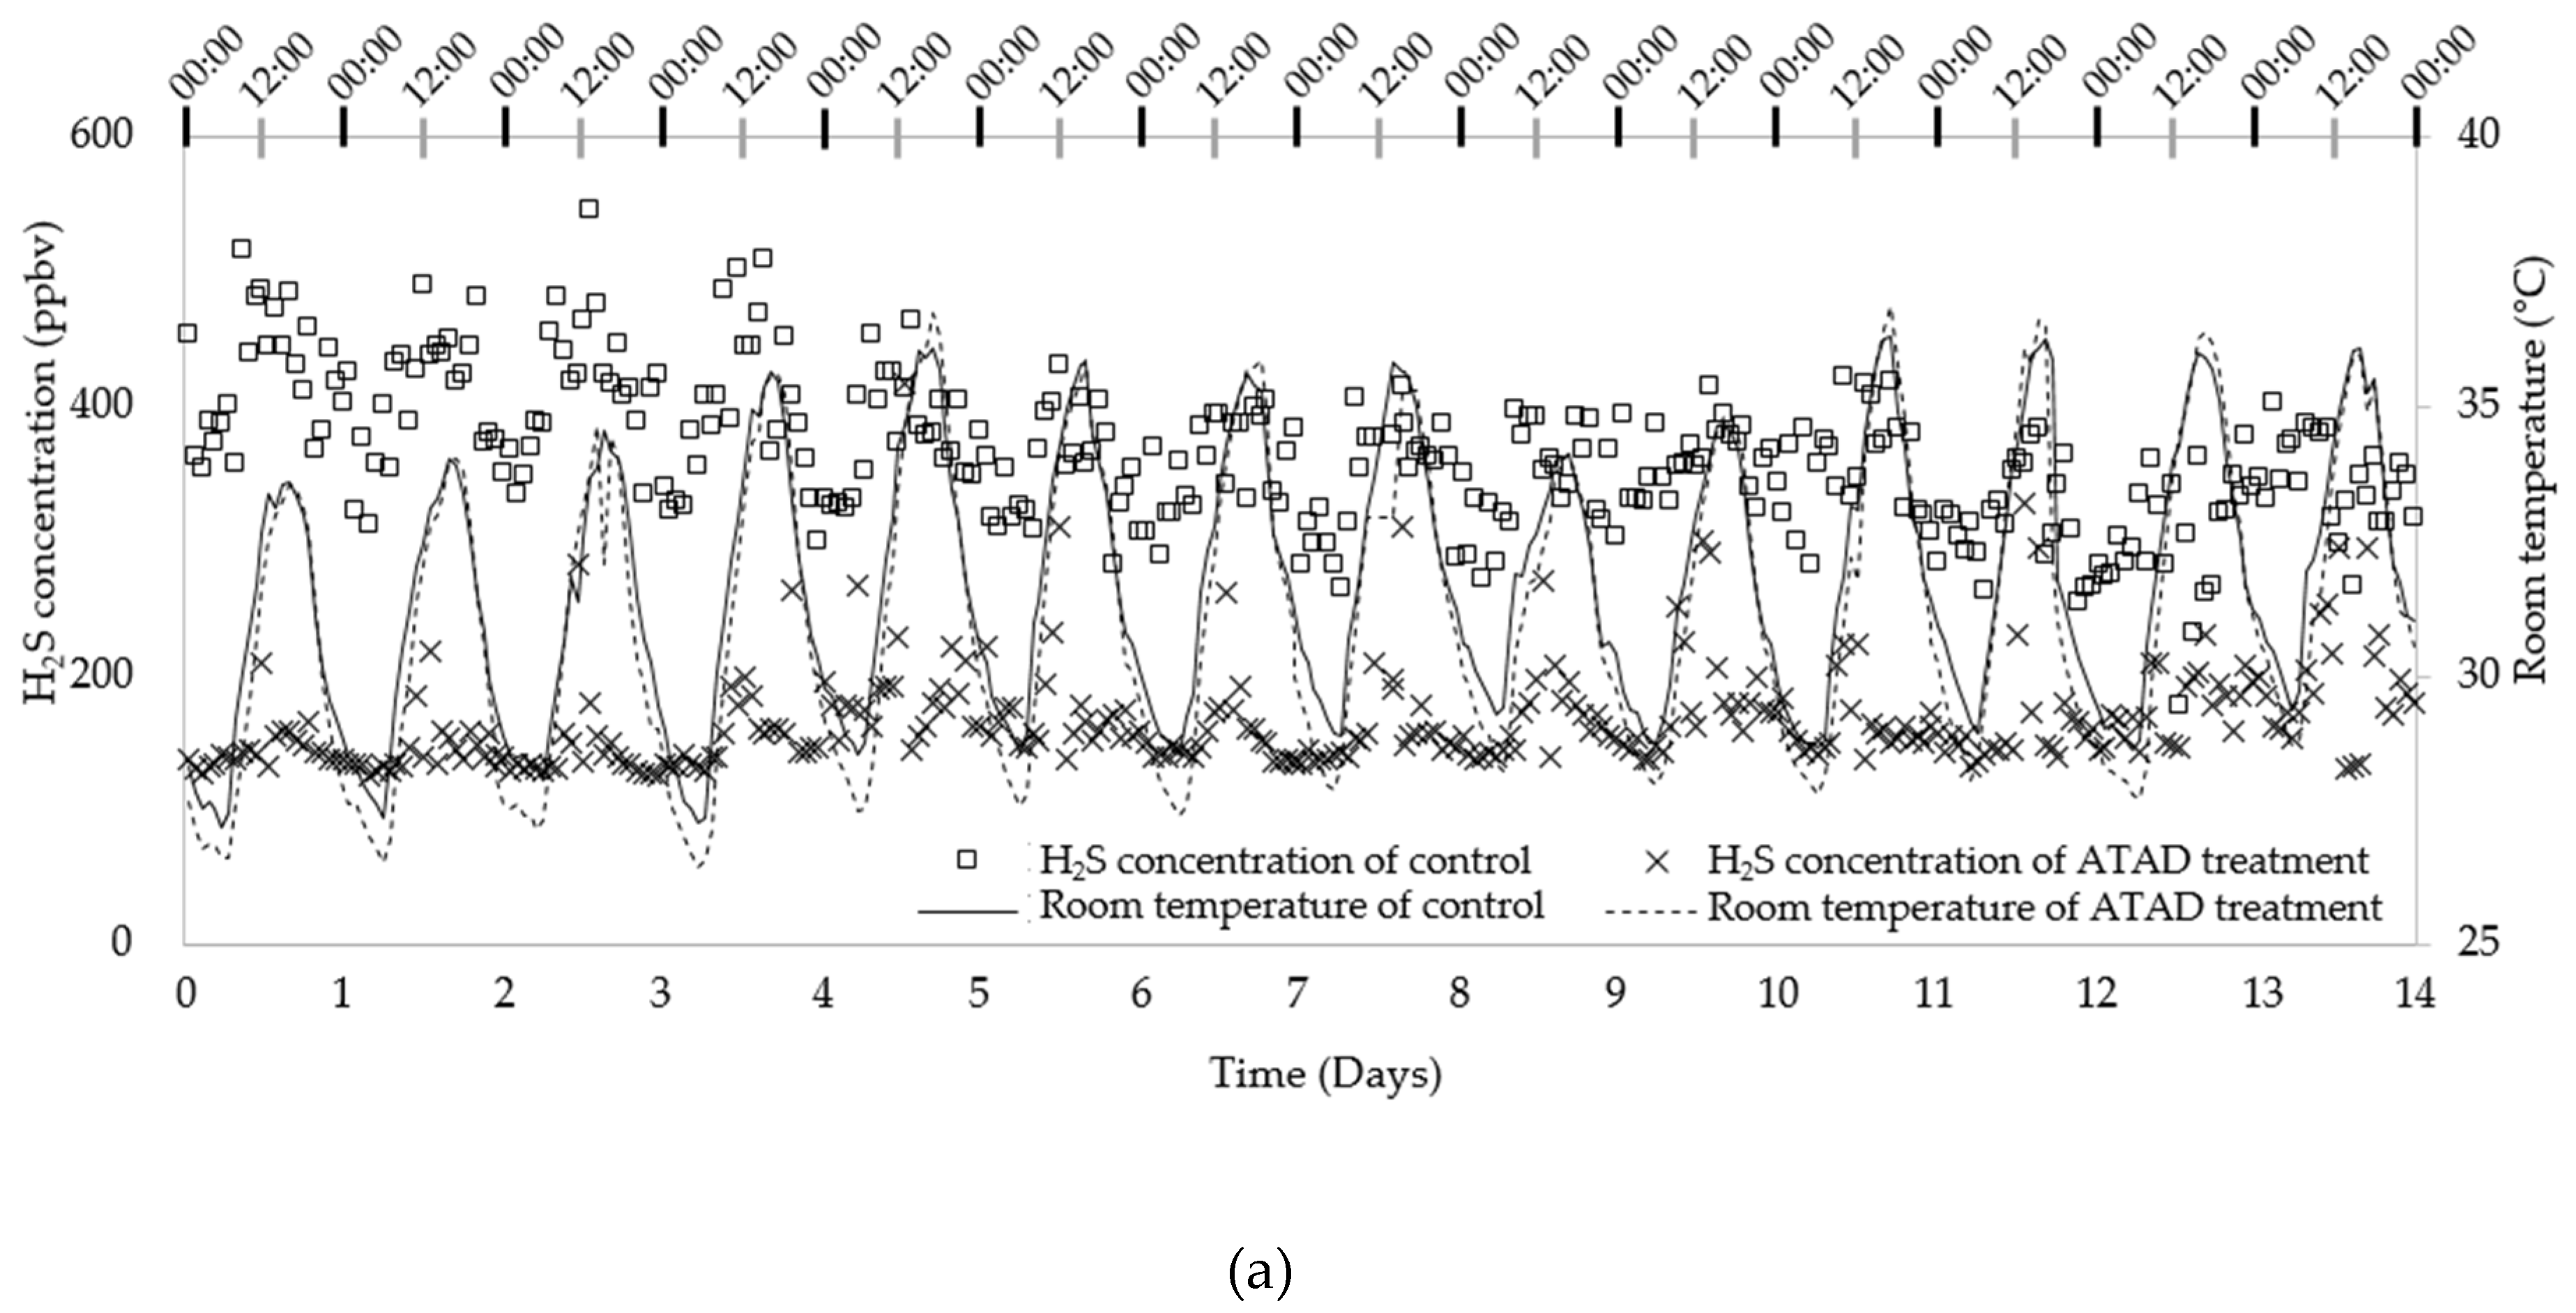
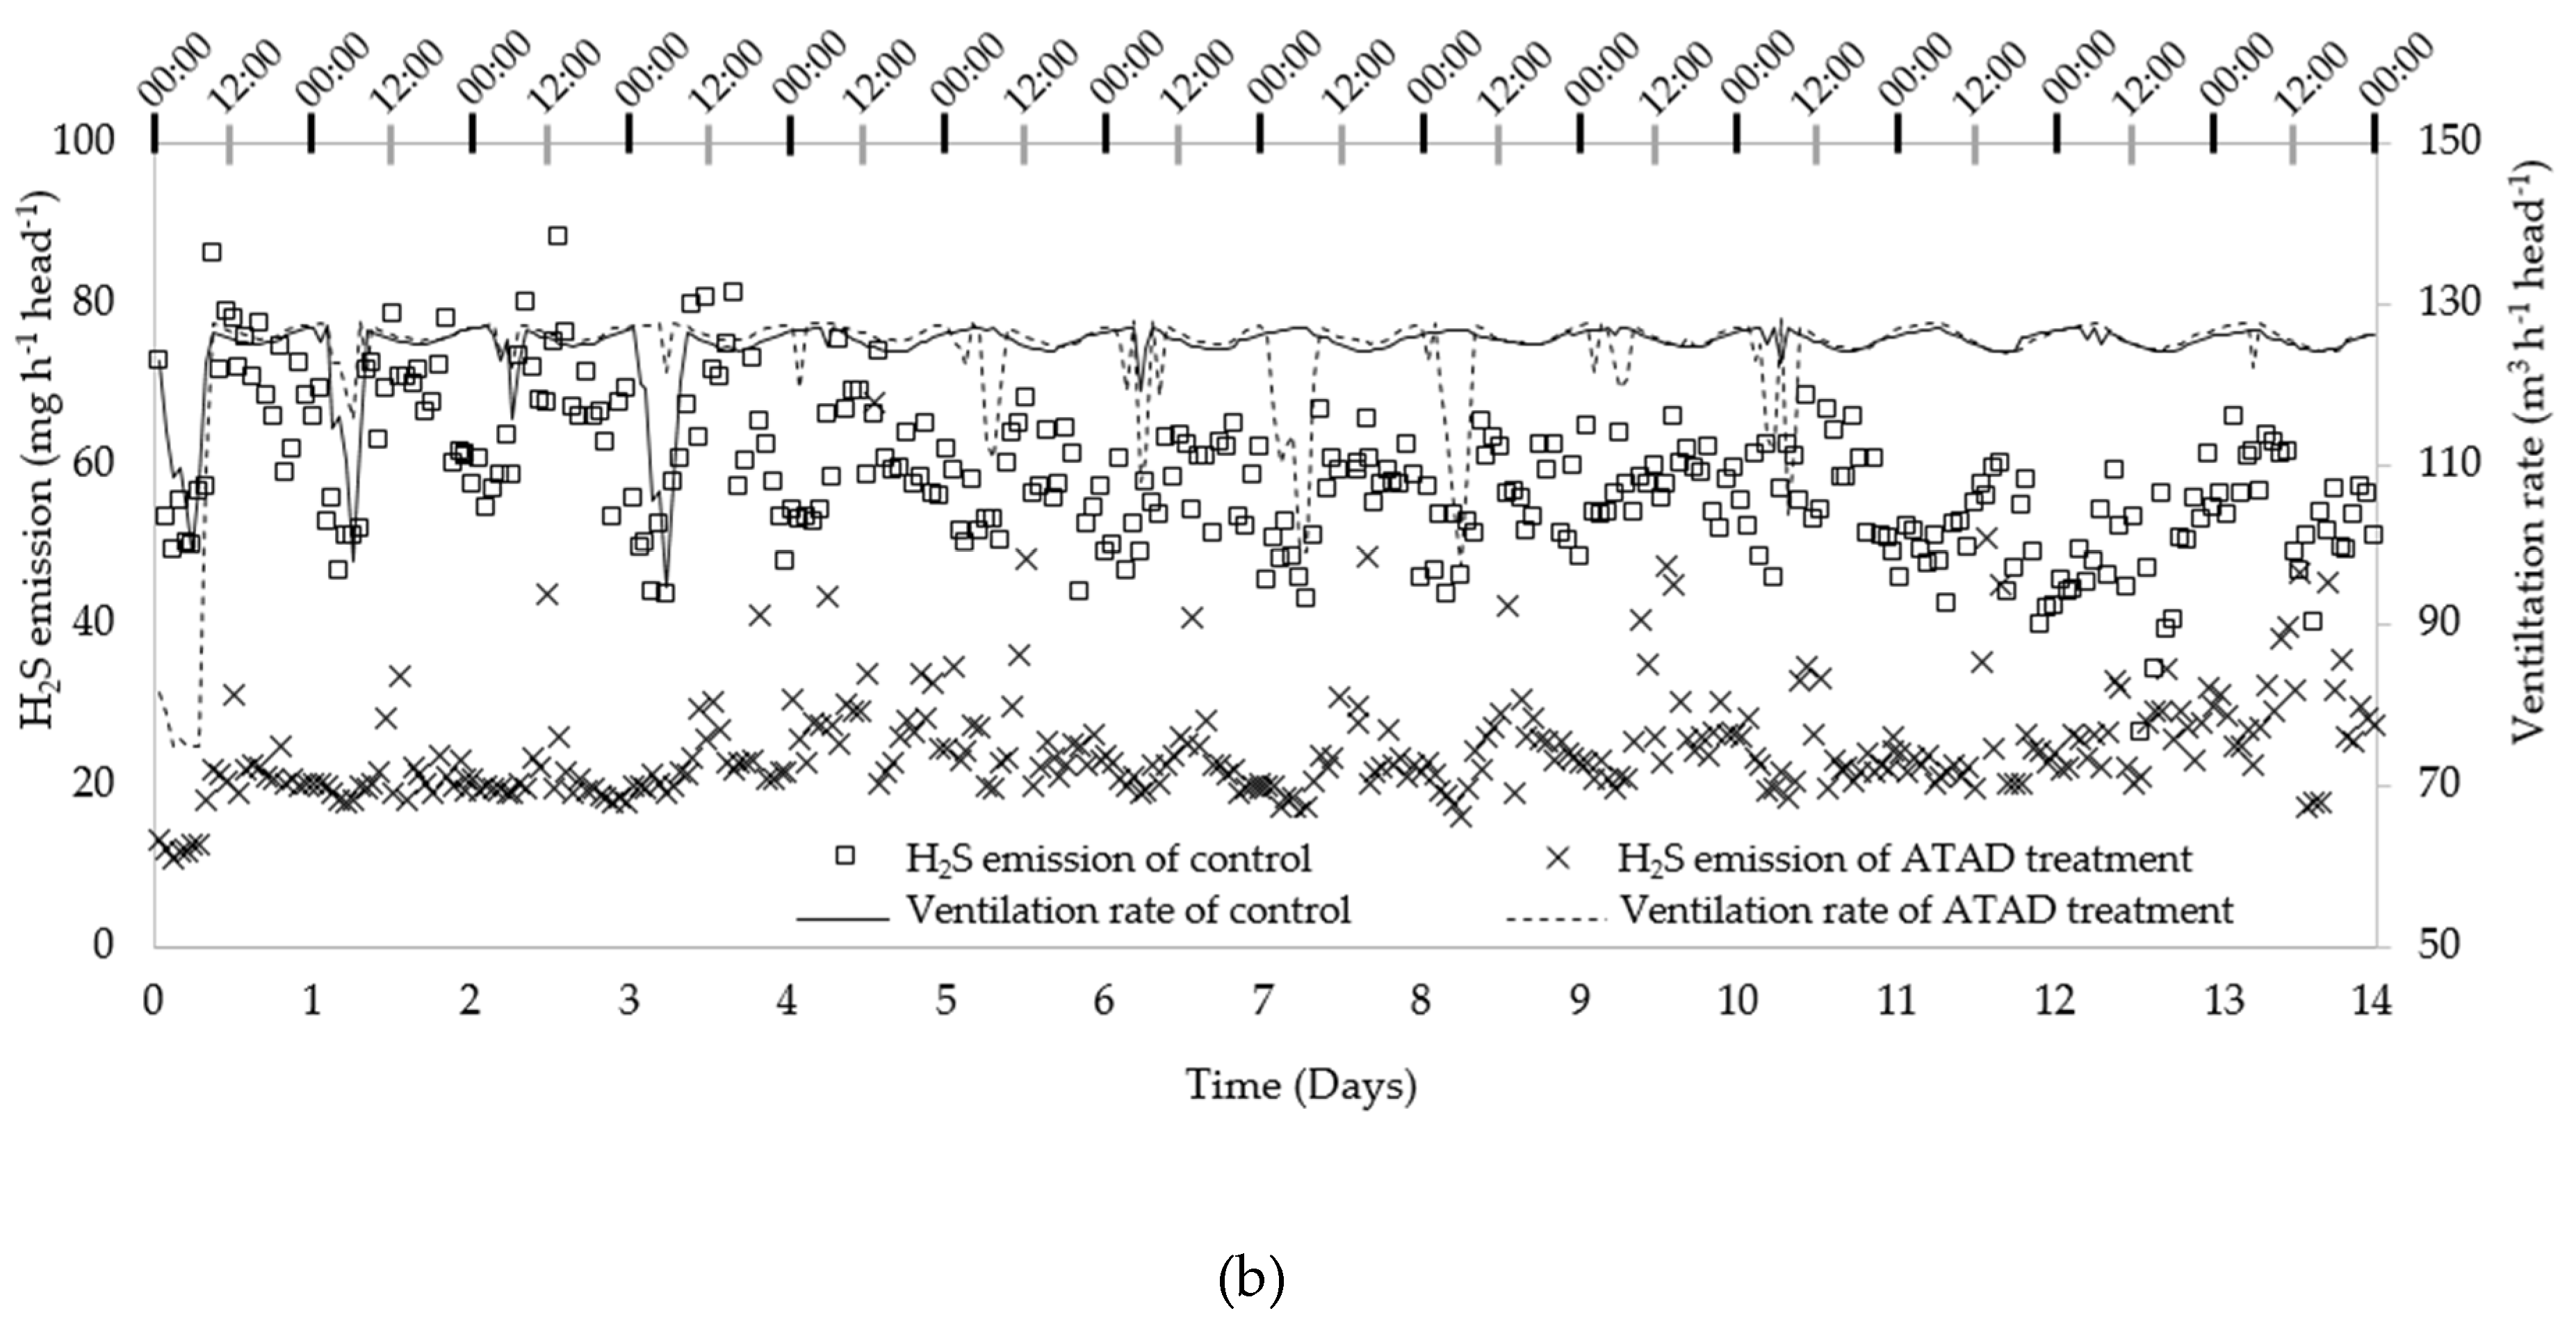
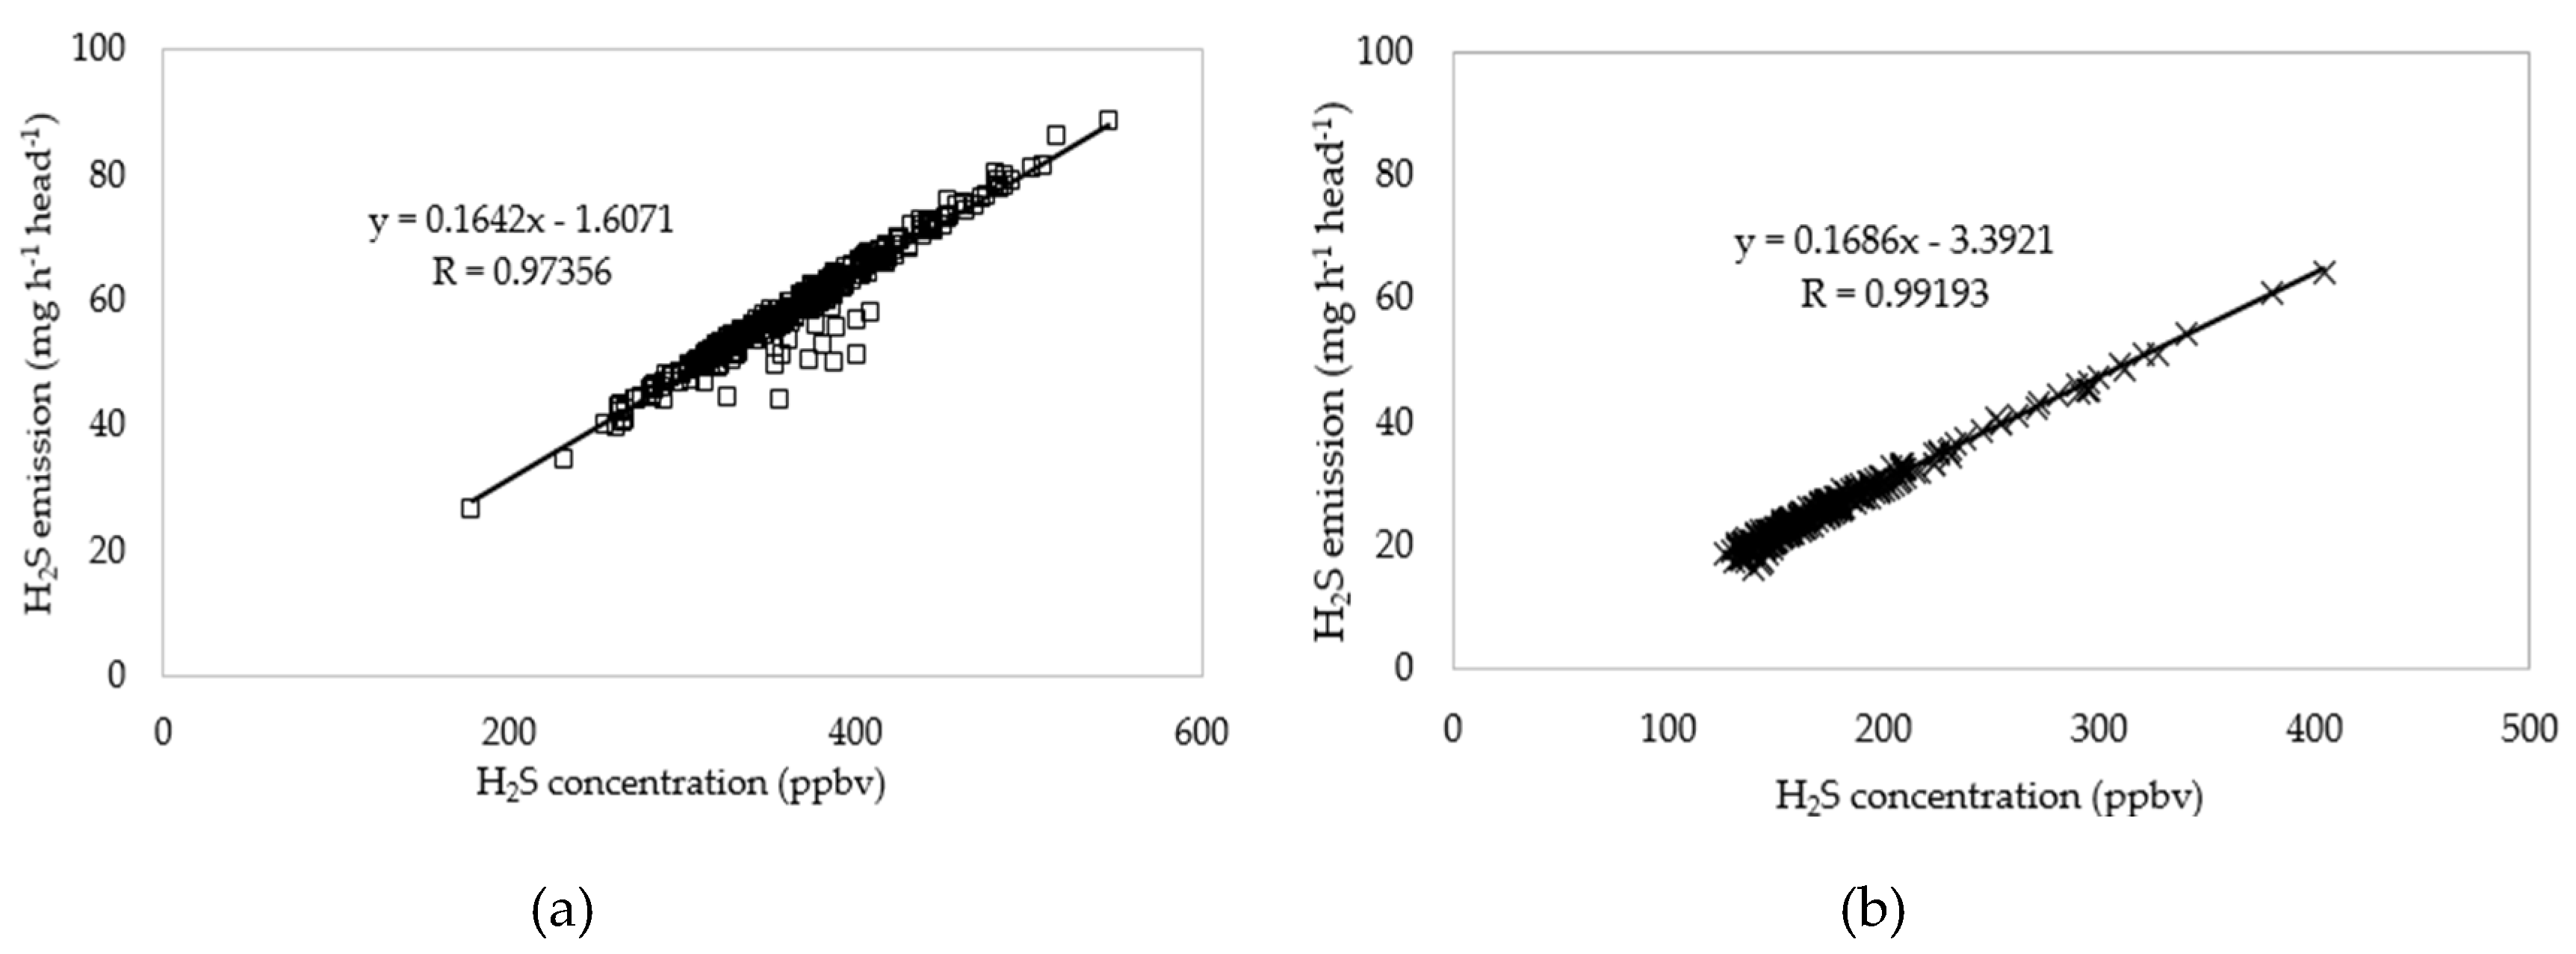
3.2. H2S Emissions
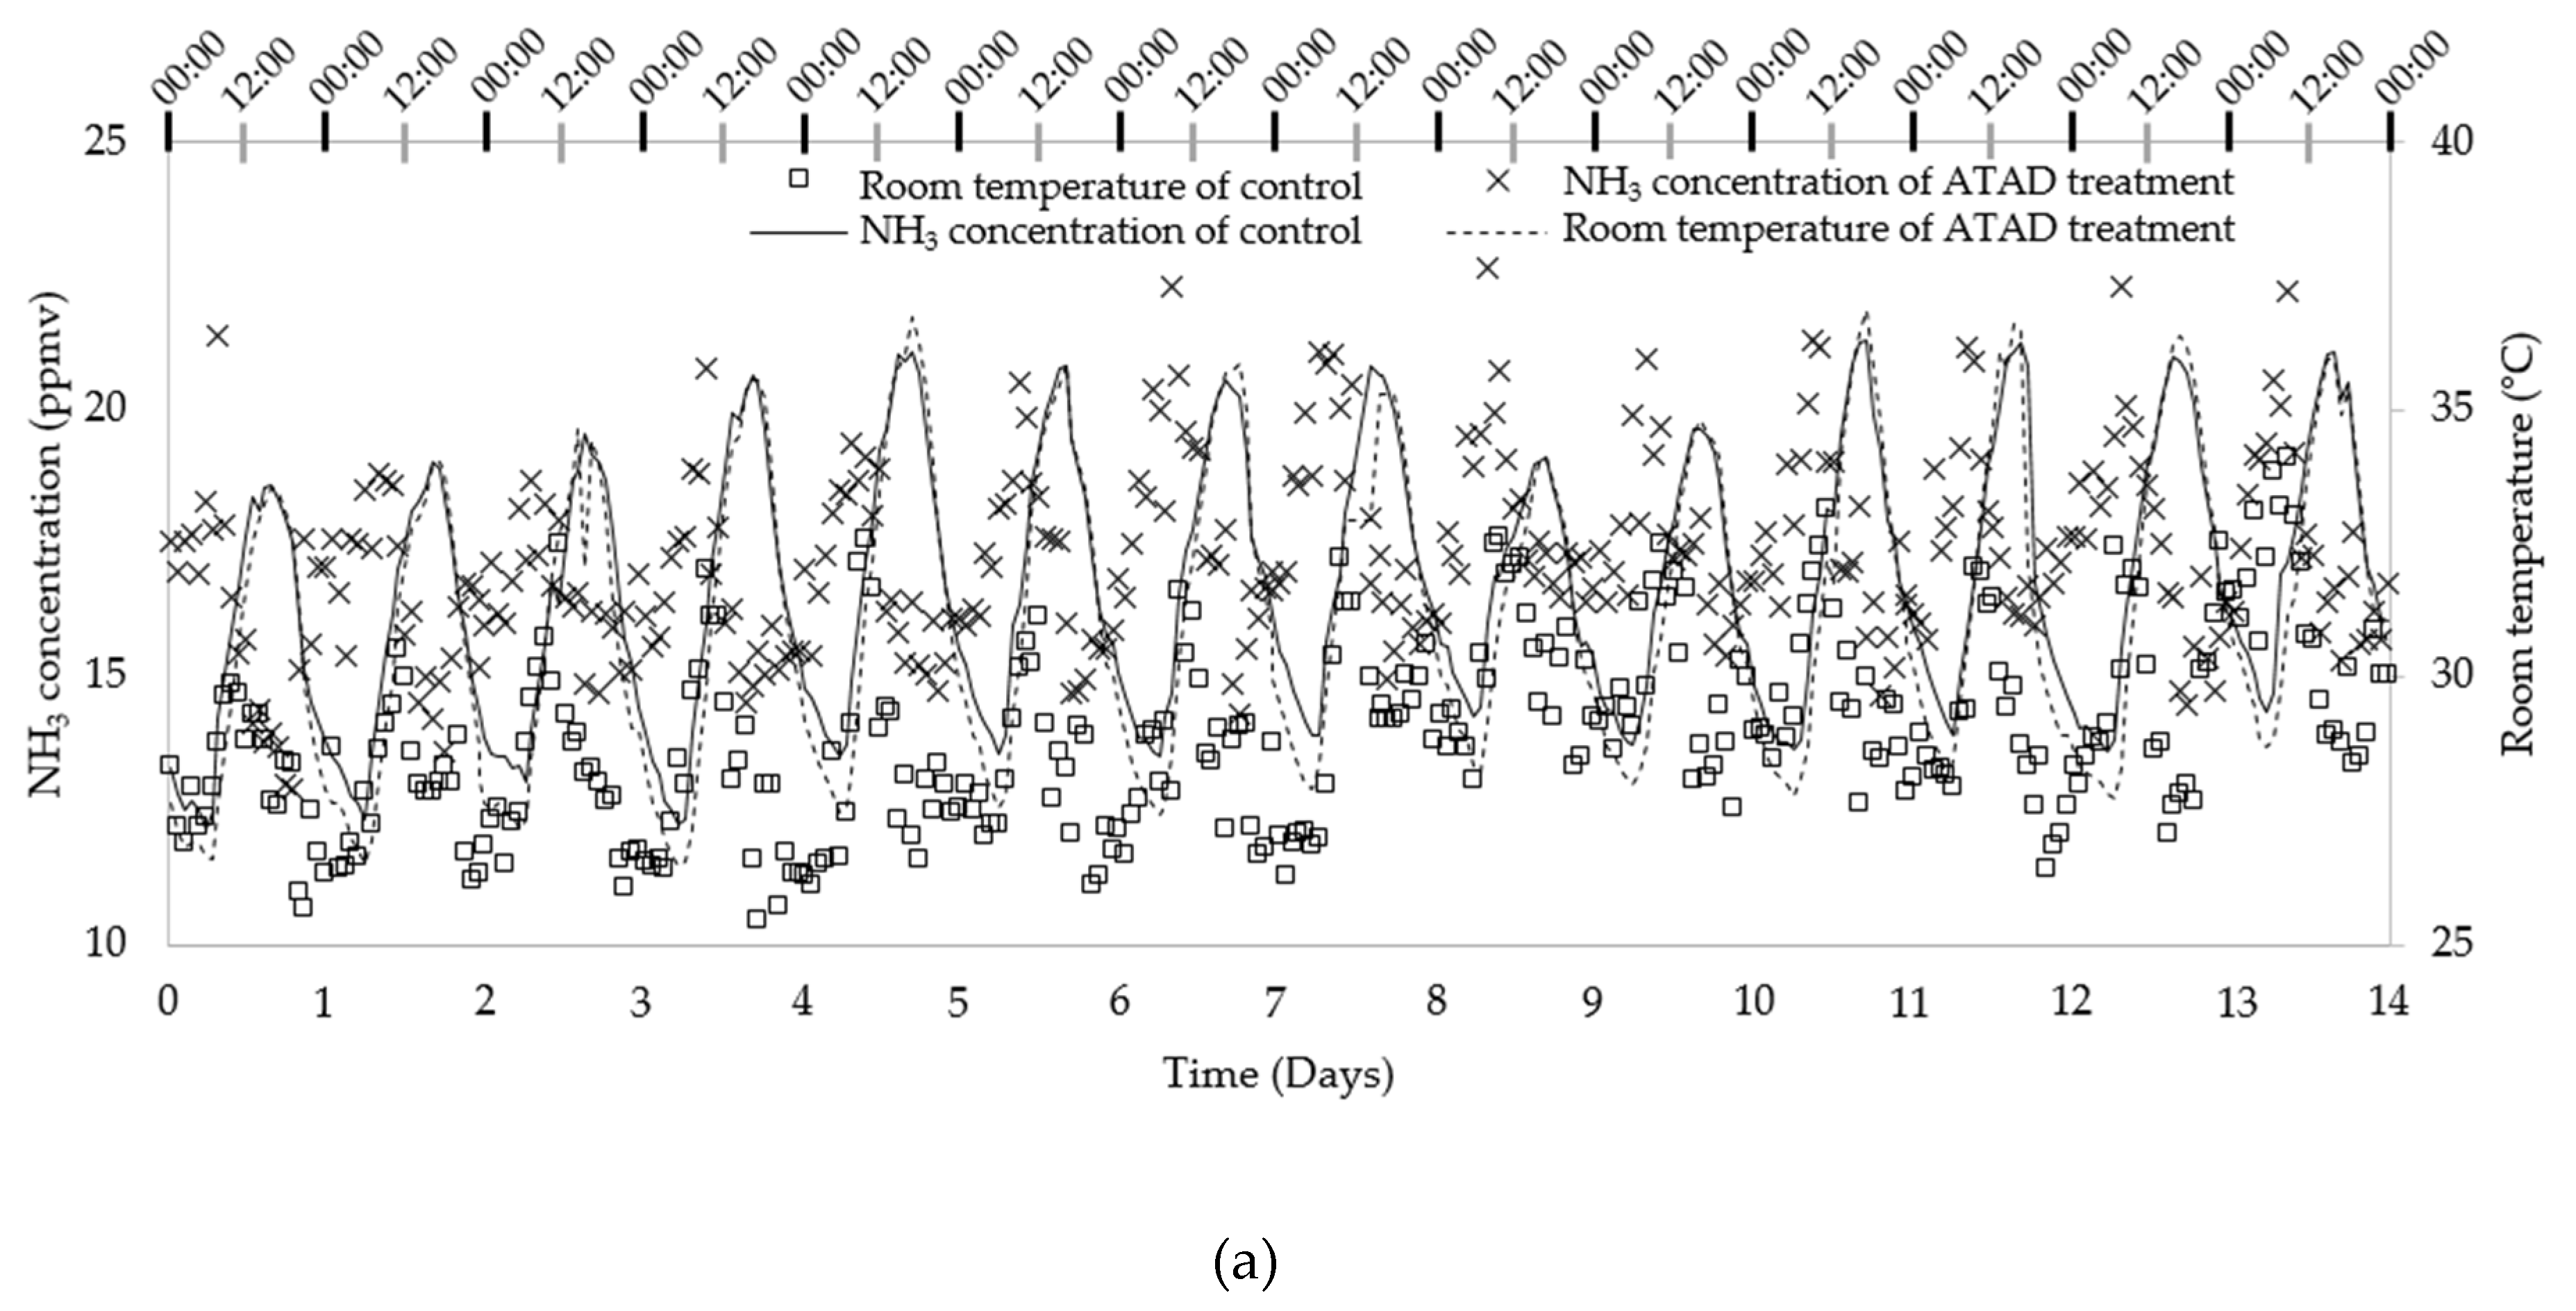
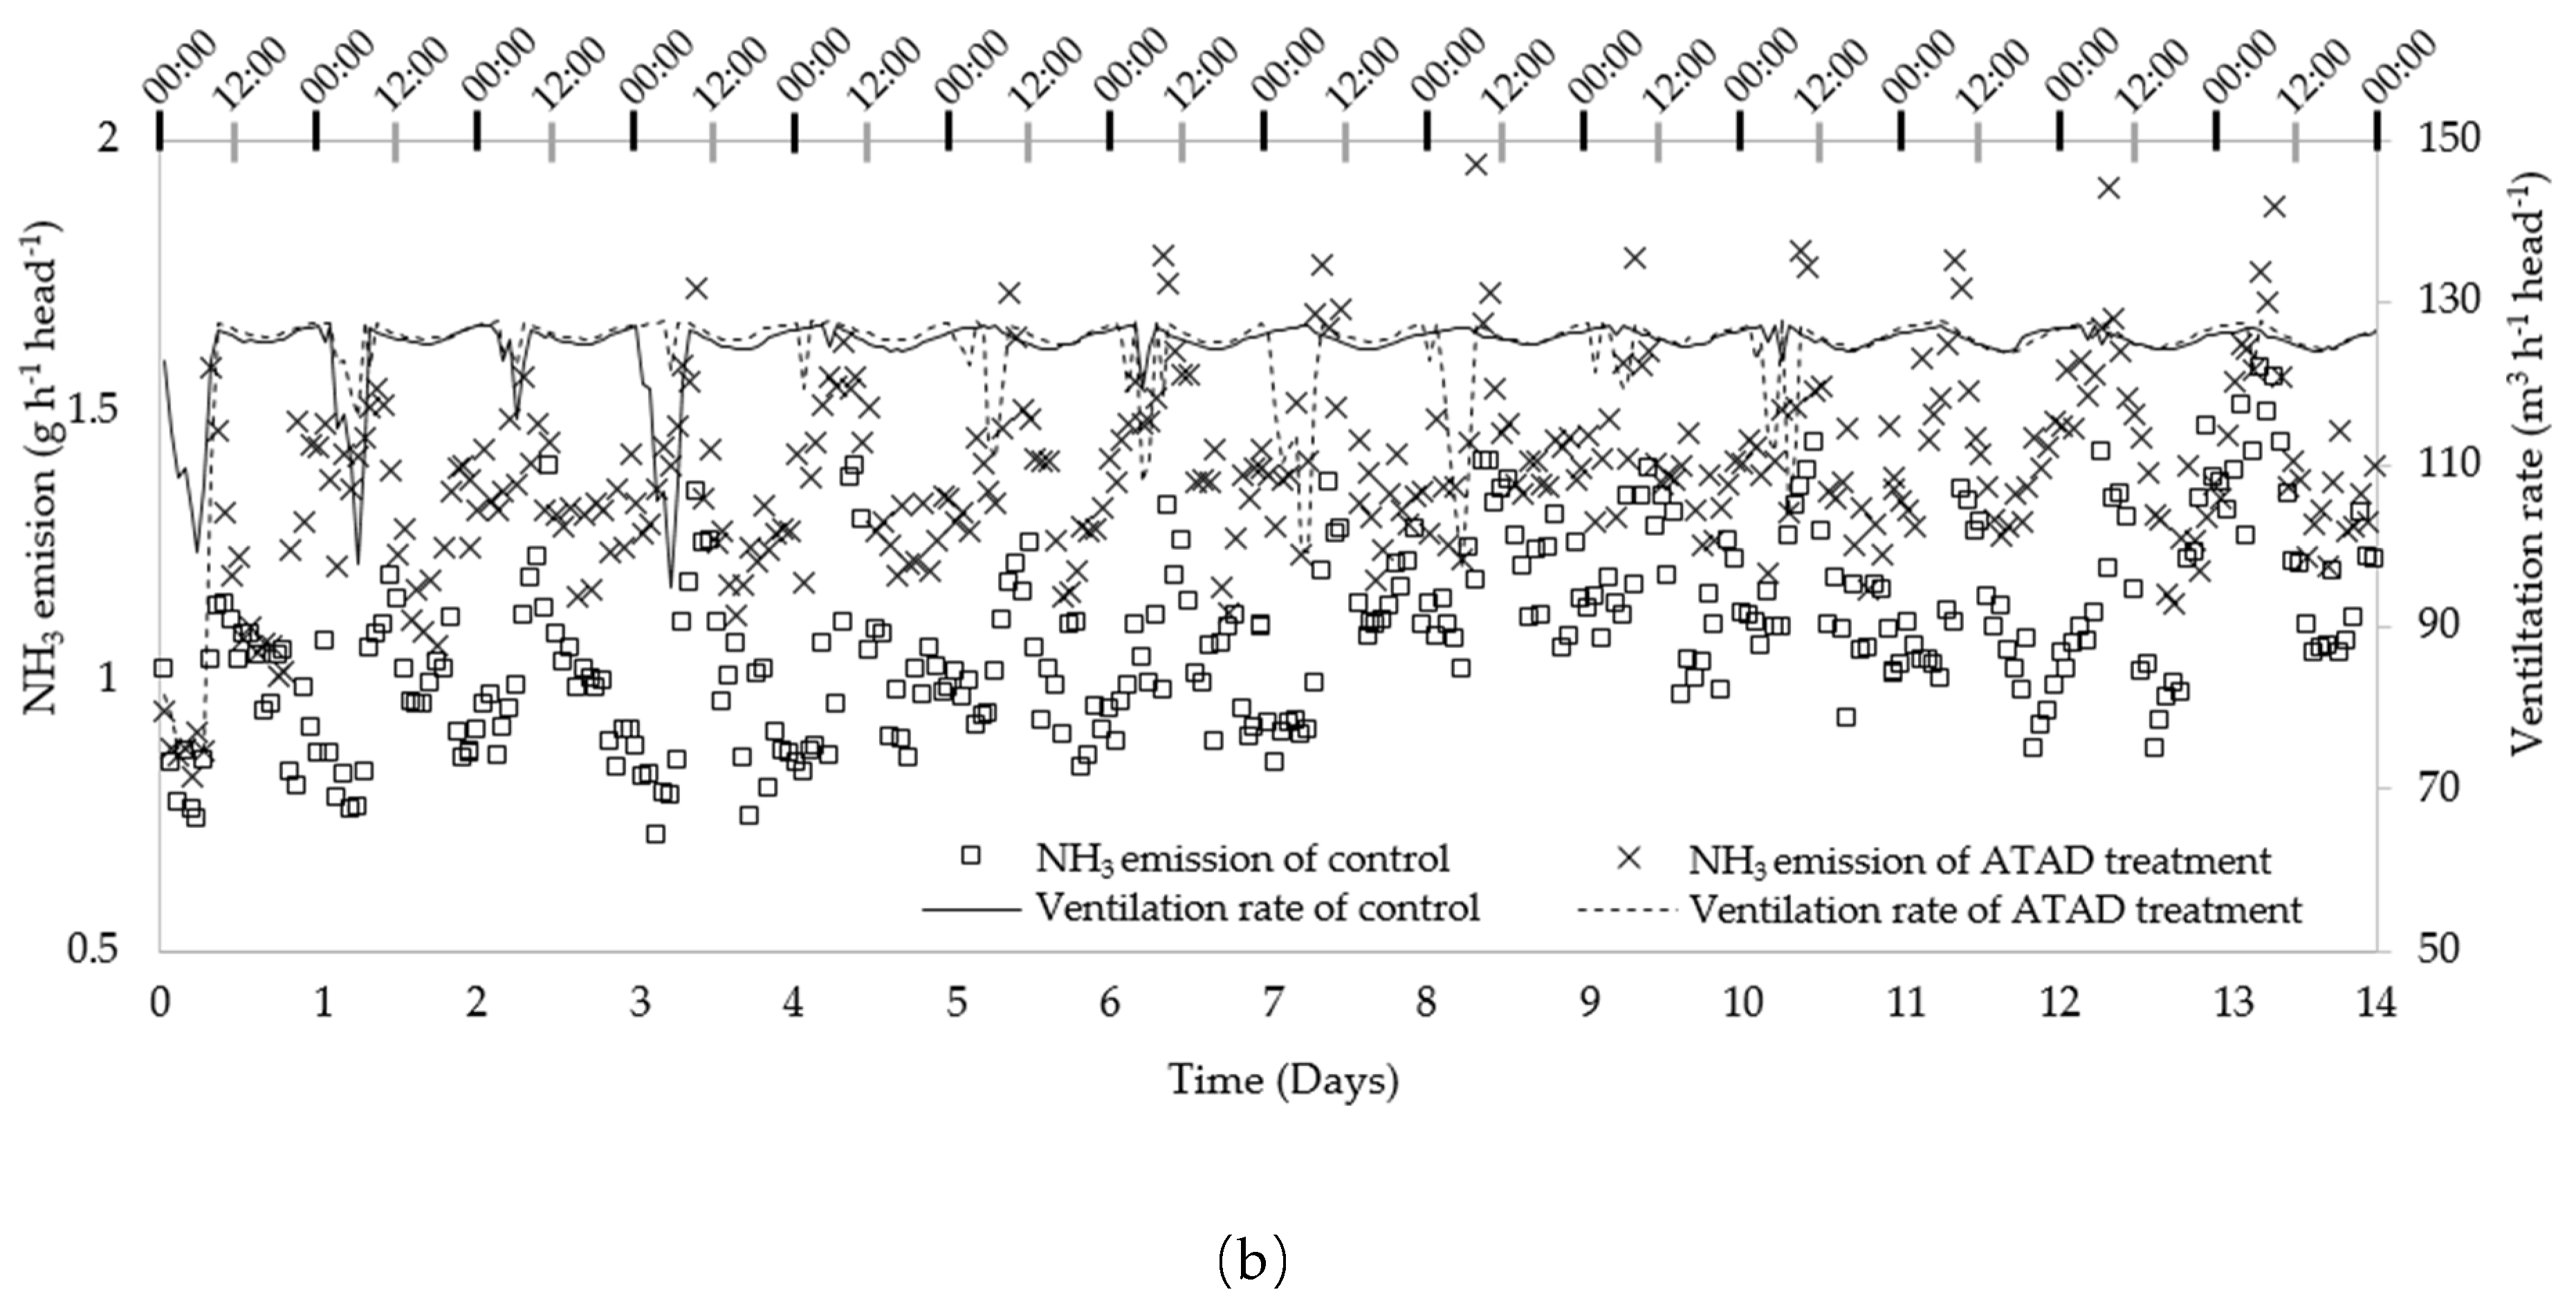
3.3. Daily Gas Concentrations and Emissions
3.4. Characteristics of Recharging Liquid and Manure
4. Discussion
4.1. NH3 and H2S Concentrations and Emission Rates in Summer Compared with Fall
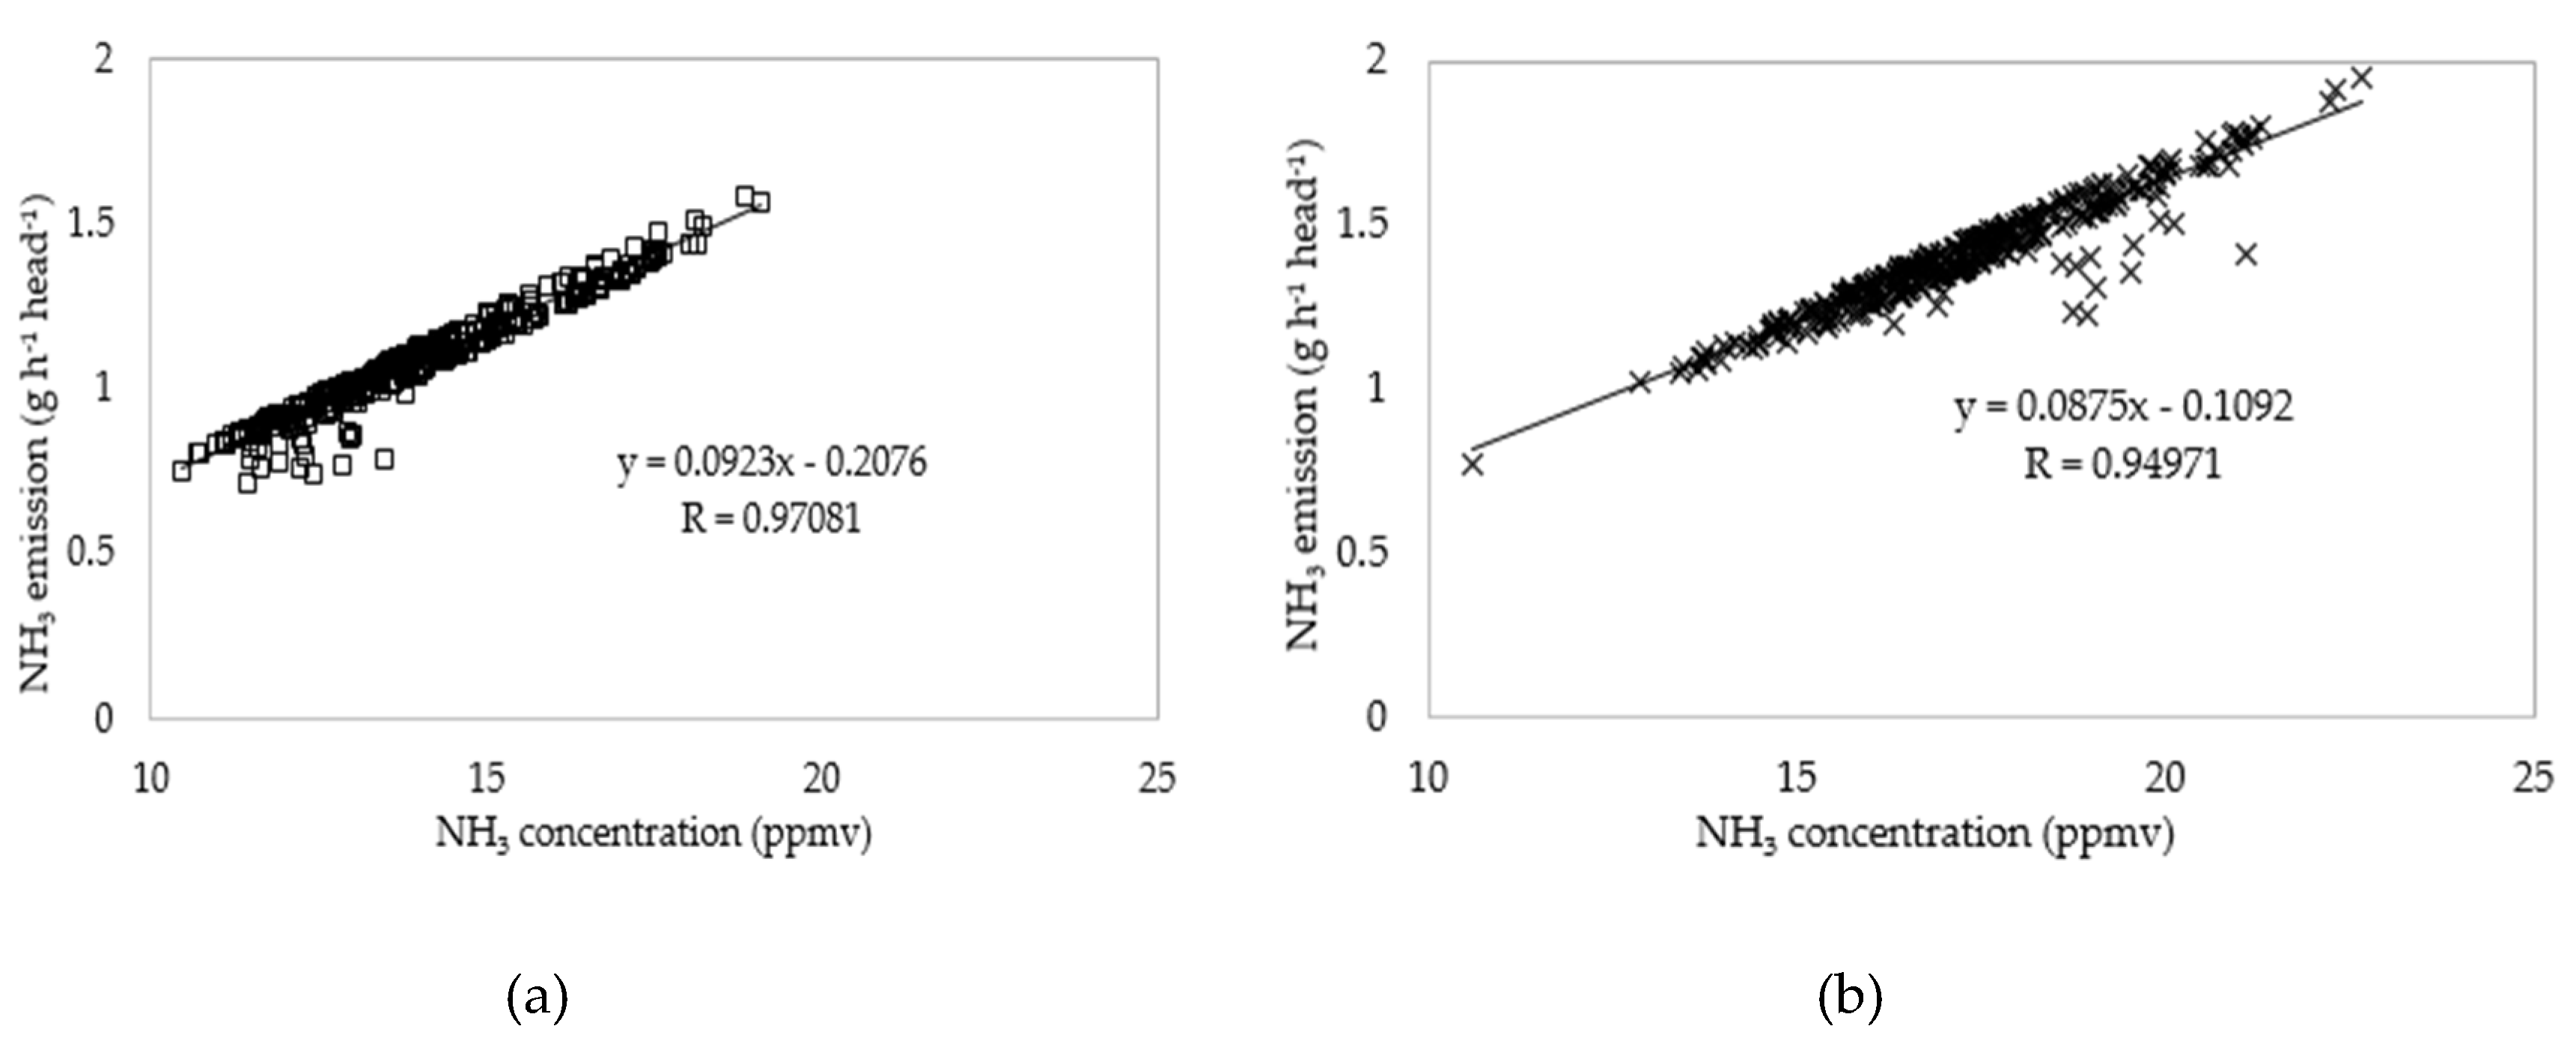
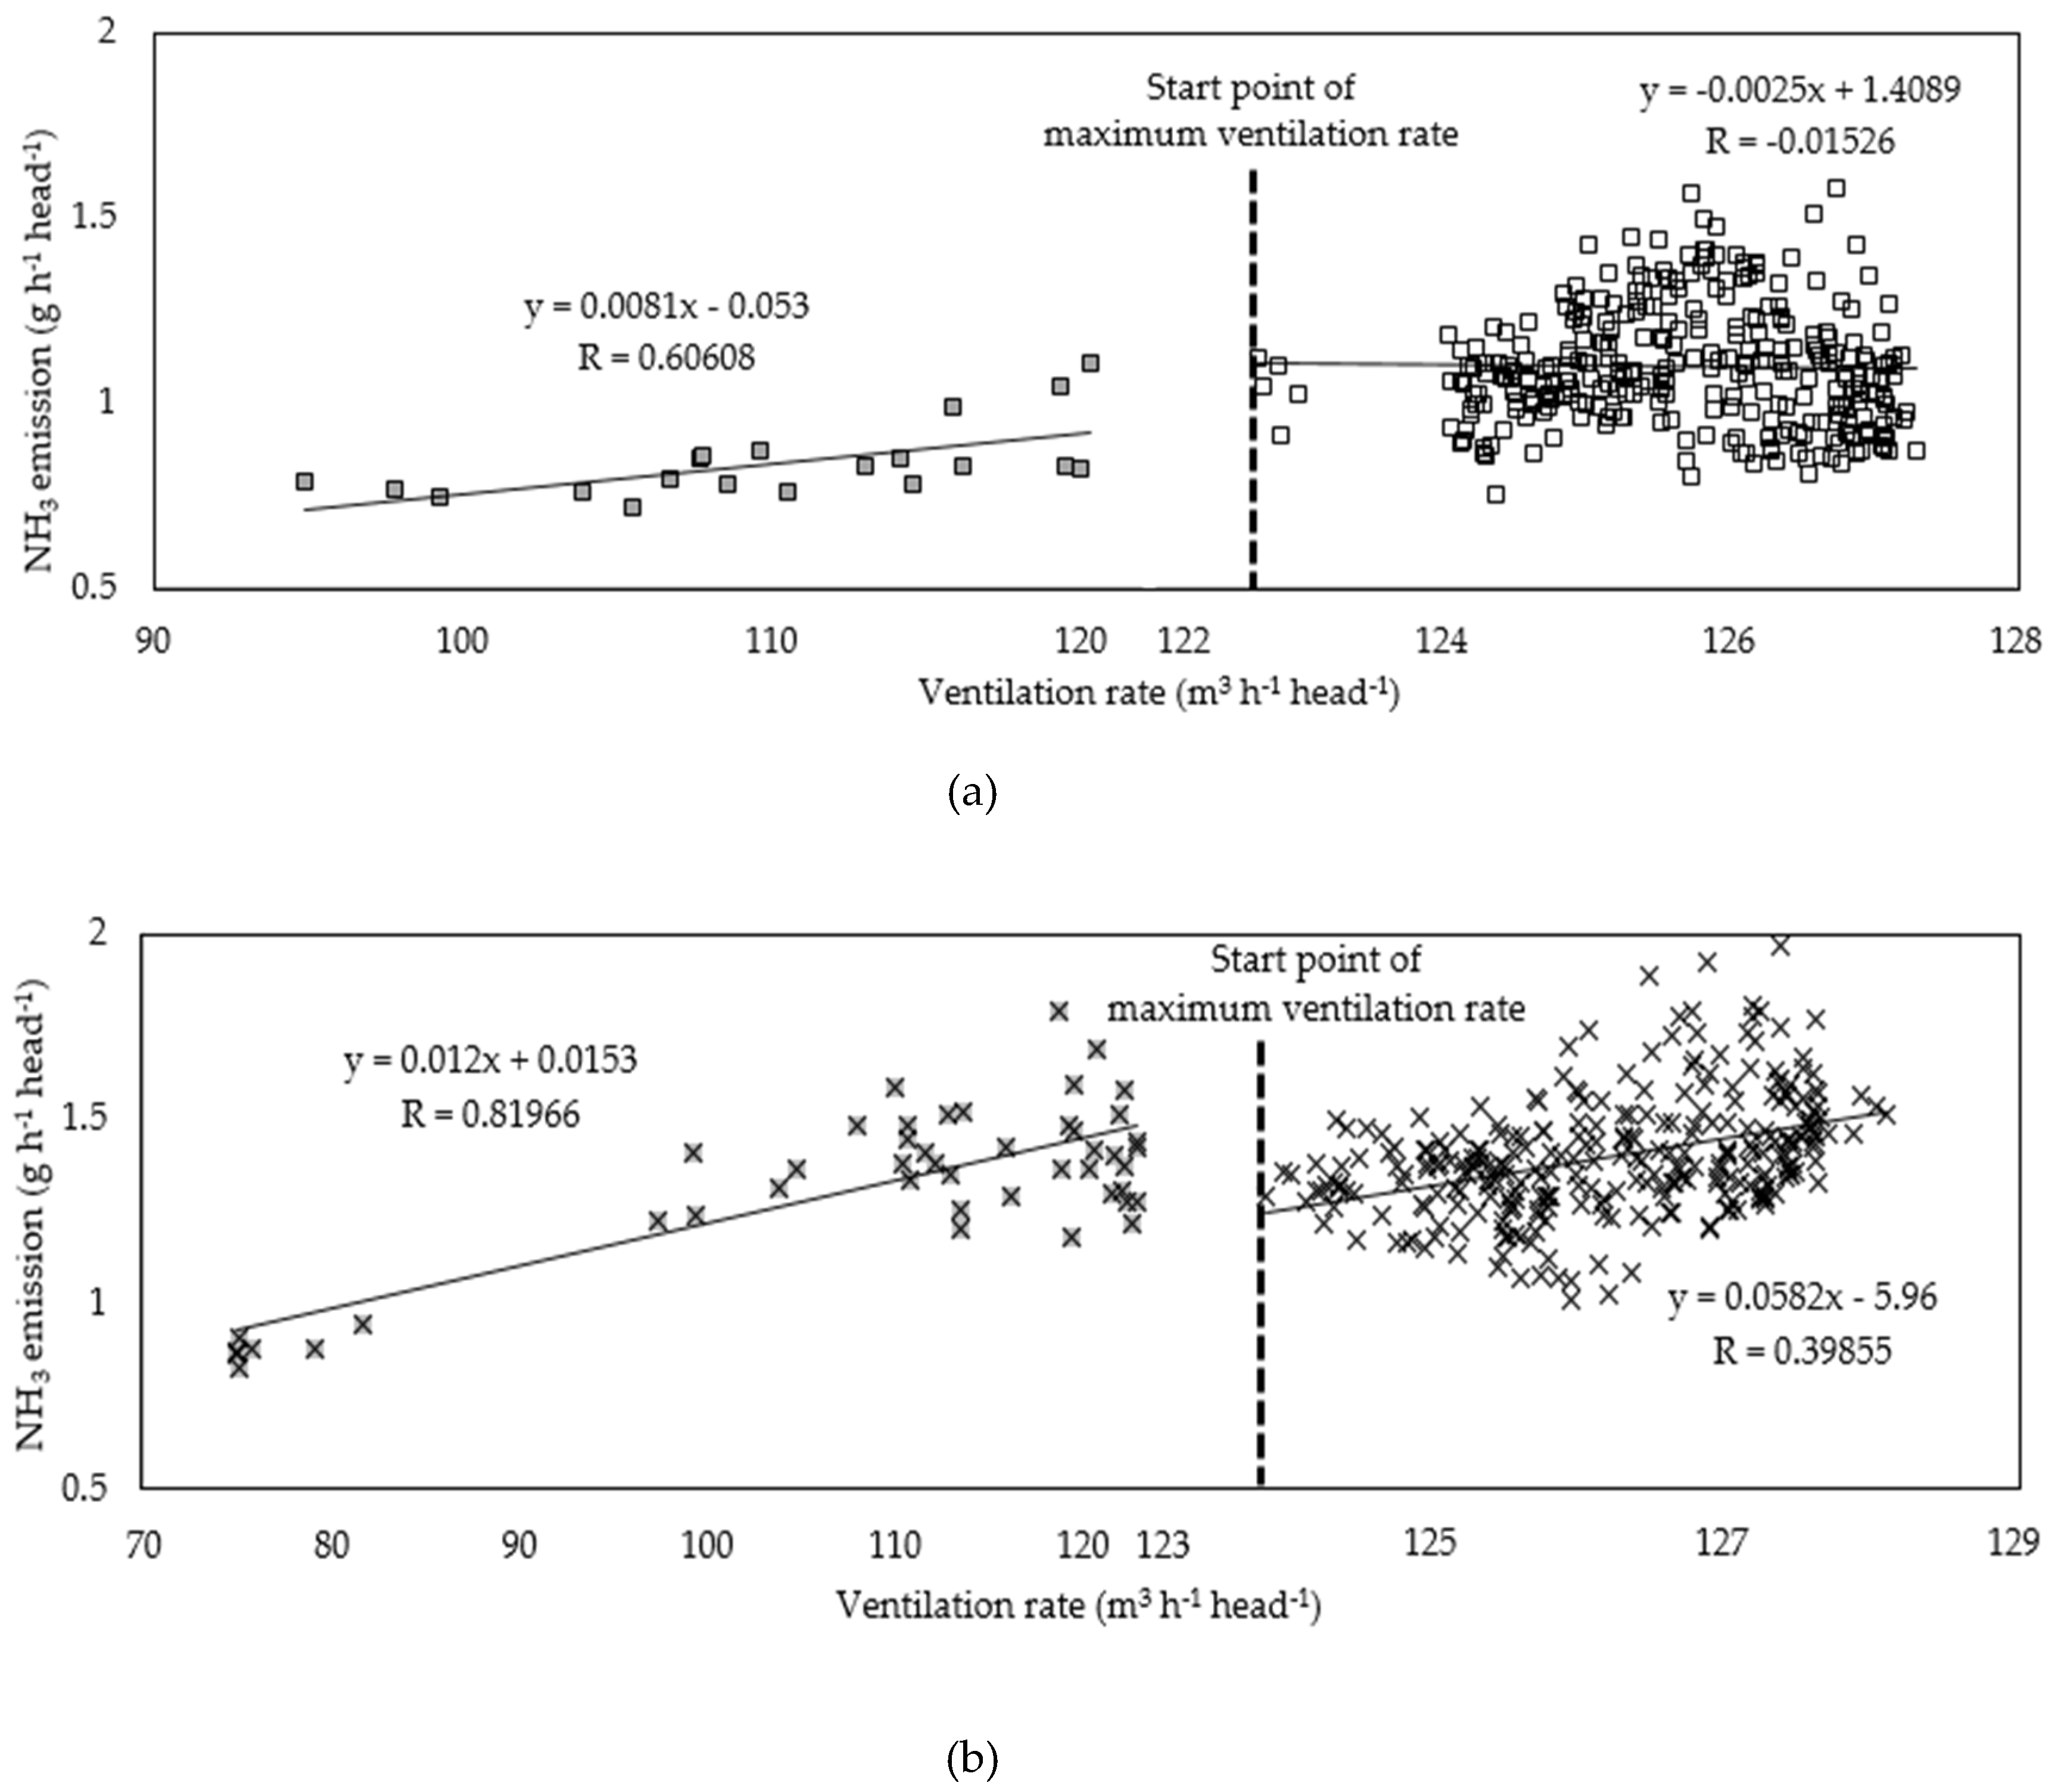
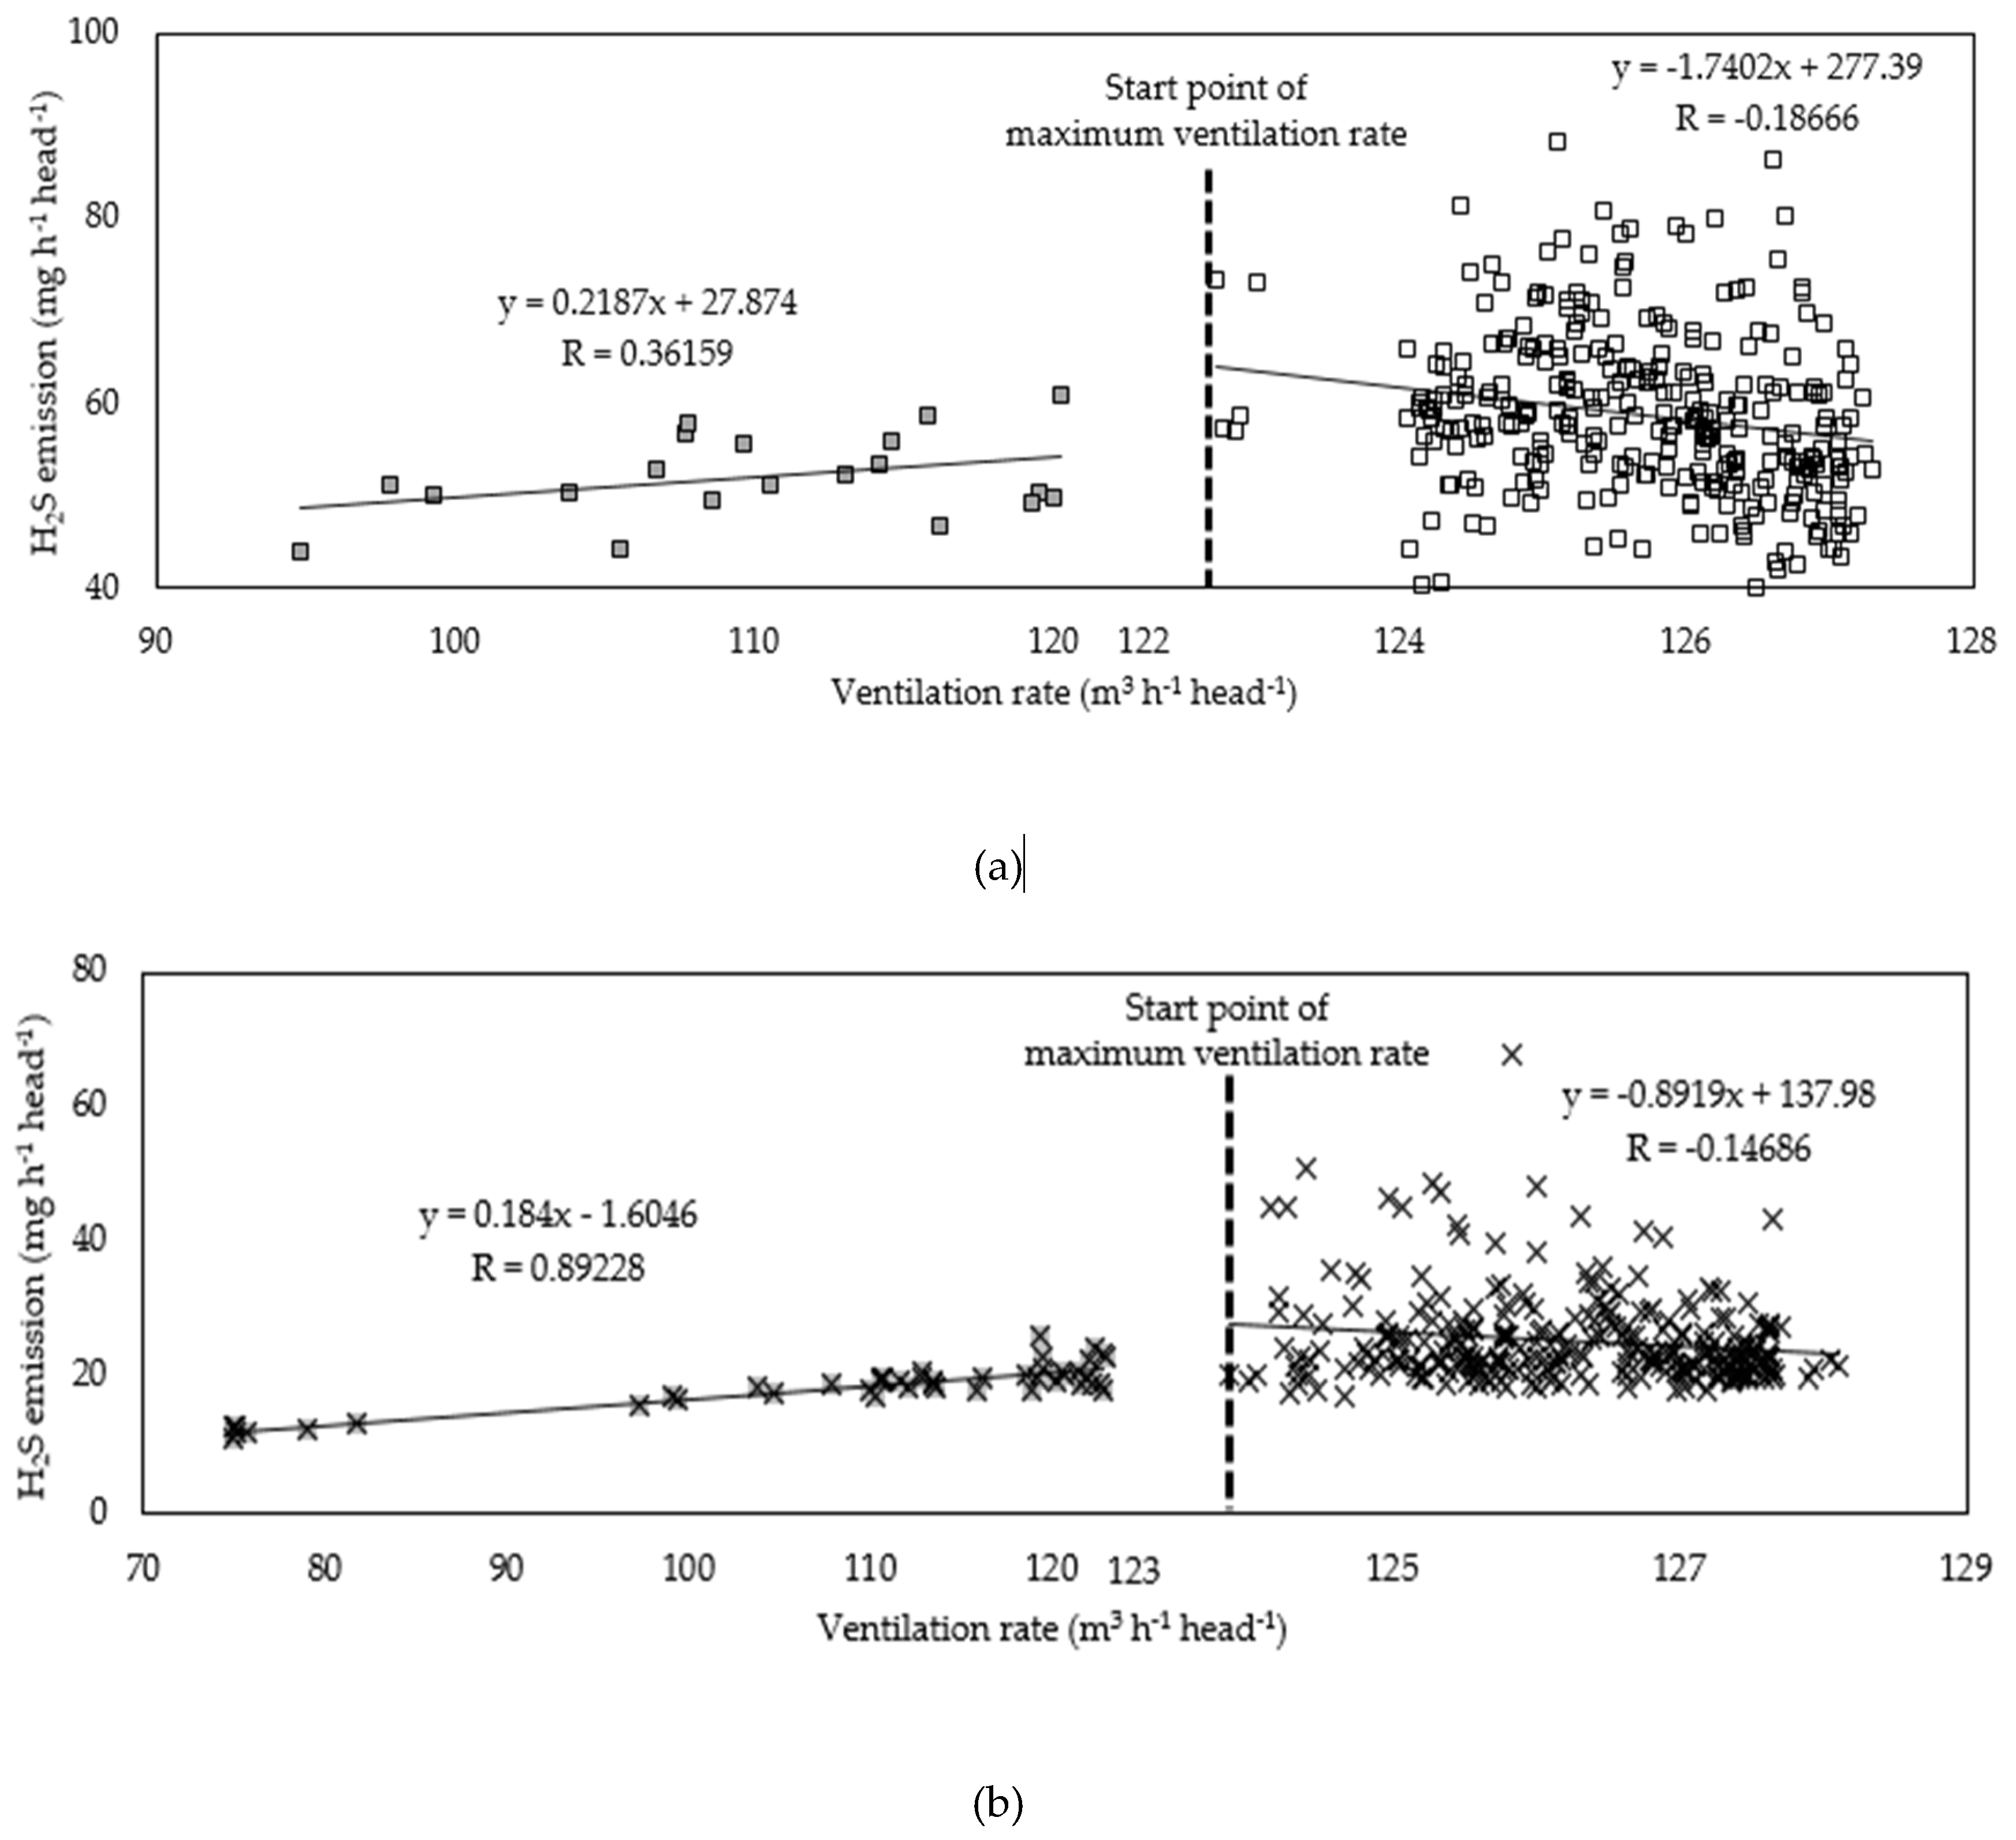
4.2. Correlation between Ventilation Rates and Gas Emissions
4.3. Seasonal Effect on Characteristics of Recharging Liquid and Manure
5. Conclusions
Author Contributions
Funding
Acknowledgments
Conflicts of Interest
Appendix A


| Low Ventilation Level | Maximum Ventilation Level | |||
|---|---|---|---|---|
| Ventilation Range (m3·h−1·head−1) | Room Temperature (°C) | Ventilation Range (m3·h−1·head−1) | Room Temperature (°C) | |
| Control | 94.9 ~ 120.3 | 27.8 ± 0.5 | 122.7 ~ 127.3 | 31.9 ± 2.3 |
| Treatment | 75.0 ~ 122.8 | 28.0 ± 0.9 | 123.9 ~ 128.1 | 31.6 ± 2.7 |

References
- Ni, J.-Q.; Heber, A.J.; Lim, T.-T. Ammonia and hydrogen sulfide in swine production. In Air Quality and Livestock Farming; CRC Press: Boca Raton, FL, USA, 2018; pp. 69–88. [Google Scholar]
- Bini, C.; Bresolin, F. Soil acidification by acid rain in forest ecosystems: A case study in northern Italy. Sci. Total Environ. 1998, 222, 1–15. [Google Scholar] [CrossRef]
- Oenema, O.; Velthof, G.; Klimont, Z.; Winiwarter, W. Emissions from Agriculture and Their Control Potentials; European Commission: Brussels, Belgium, 2012. [Google Scholar]
- Van Breemen, N.; Burrough, P.; Velthorst, E.V.; Van Dobben, H.; de Wit, T.; Ridder, T.D.; Reijnders, H. Soil acidification from atmospheric ammonium sulphate in forest canopy throughfall. Nature 1982, 299, 548. [Google Scholar] [CrossRef]
- Van der Heyden, C.; Demeyer, P.; Volcke, E.I. Mitigating emissions from pig and poultry housing facilities through air scrubbers and biofilters: State-of-the-art and perspectives. Biosyst. Eng. 2015, 134, 74–93. [Google Scholar] [CrossRef]
- Arogo, J.; Westerman, P.; Heber, A. A review of ammonia emissions from confined swine feeding operations. Trans. ASAE 2003, 46, 805. [Google Scholar] [CrossRef]
- Donham, K.J.; Reynolds, S.J.; Whitten, P.; Merchant, J.A.; Burmeister, L.; Popendorf, W.J. Respiratory dysfunction in swine production facility workers: Dose-response relationships of environmental exposures and pulmonary function. Am. J. Ind. Med. 1995, 27, 405–418. [Google Scholar] [CrossRef]
- Hristov, A. Contribution of ammonia emitted from livestock to atmospheric fine particulate matter (PM25) in the United States. J. Dairy Sci. 2011, 94, 3130–3136. [Google Scholar] [CrossRef]
- Urbain, B.; Gustin, P.; Prouvost, J.; Ansay, M. Quantitative assessment of aerial ammonia toxicity to the nasal mucosa by use of the nasal lavage method in pigs. Am. J. Vet. Res. 1994, 55, 1335–1340. [Google Scholar]
- Smith, J.; Wathes, C.; Baldwin, B. The preference of pigs for fresh air over ammoniated air. Appl. Anim. Behav. Sci. 1996, 49, 417–424. [Google Scholar] [CrossRef]
- Gustin, P.; Urbain, B.; Prouvost, J.-F.; Ansay, M. Effects of atmospheric ammonia on pulmonary hemodynamics and vascular permeability in pigs: Interaction with endotoxins. Toxicol. Appl. Pharmacol. 1994, 125, 17–26. [Google Scholar] [CrossRef]
- Oesterhelweg, L.; Püschel, K. Death may come on like a stroke of lightning. Int. J. Leg. Med. 2008, 122, 101–107. [Google Scholar] [CrossRef]
- Riedel, S.M.; Field, W.E. Summation of the frequency, severity, and primary causative factors associated with injuries and fatalities involving confined spaces in agriculture. J. Agric. Saf. Health 2013, 19, 83–100. [Google Scholar]
- Gay, S.; Schmidt, D.R.; Clanton, C.; Janni, K.A.; Jacobson, L.; Weisberg, S. Odor, total reduced sulfur, and ammonia emissions from animal housing facilities and manure storage units in Minnesota. Appl. Eng. Agric. 2003, 19, 347. [Google Scholar]
- Faulkner, W.; Shaw, B. Review of ammonia emission factors for United States animal agriculture. Atmos. Environ. 2008, 42, 6567–6574. [Google Scholar] [CrossRef]
- Harper, L.A.; Sharpe, R.R.; Simmons, J.D. Ammonia emissions from swine houses in the southeastern United States. J. Environ. Qual. 2004, 33, 449–457. [Google Scholar] [CrossRef]
- Zhang, S.; Koziel, J.A.; Cai, L.; Hoff, S.J.; Heathcote, K.Y.; Chen, L.; Jacobson, L.D.; Akdeniz, N.; Hetchler, B.P.; Parker, D.B. Odor and odorous chemical emissions from animal buildings: Part 5. Simultaneous chemical and sensory analysis with gas chromatography-mass spectrometry-olfactometry. Trans. ASABE 2015, 58, 1349–1359. [Google Scholar]
- Ahn, H.K.; Choi, H.L. Piggery slurry composting using batch operating autothermal thermophilic aerobic digestion system. Asian-Australas. J. Anim. Sci. 2005, 19, 273–279. [Google Scholar] [CrossRef]
- Kai, P.; Kaspers, B.; Van Kempen, T. Modeling sources of gaseous emissions in a pig house with recharge pit. Trans. ASABE 2006, 49, 1479–1485. [Google Scholar] [CrossRef]
- Blunden, J.; Aneja, V.P.; Westerman, P.W. Measurement and analysis of ammonia and hydrogen sulfide emissions from a mechanically ventilated swine confinement building in North Carolina. Atmos. Environ. 2008, 42, 3315–3331. [Google Scholar] [CrossRef]
- Lim, T.-T.; Heber, A.J.; Ni, J.-Q.; Kendall, D.C.; Richert, B.R. Effects of manure removal strategies on odor and gas emission from swine finishing. In Proceedings of the 2002 ASAE Annual Meeting, Chicago, IL, USA, 28–31 July 2002; p. 1. [Google Scholar]
- Wi, J.; Lee, S.; Kim, E.; Lee, M.; Koziel, J.A.; Ahn, H. Evaluation of Semi-Continuous Pit Manure Recharge System Performance on Mitigation of Ammonia and Hydrogen Sulfide Emissions from a Swine Finishing Barn. Atmosphere 2019, 10, 170. [Google Scholar] [CrossRef]
- Koziel, J.A.; Frana, T.S.; Ahn, H.; Glanville, T.D.; Nguyen, L.T.; van Leeuwen, J.H. Efficacy of NH3 as a secondary barrier treatment for inactivation of Salmonella Typhimuriu mand methicillin-resistant Staphylococcus aureus in digestate of animal carcasses: Proof-of-concept. PLoS ONE 2017, 12, e0176825. [Google Scholar] [CrossRef]
- Canh, T.; Aarnink, A.; Schutte, J.; Sutton, A.; Langhout, D.; Verstegen, M. Dietary protein affects nitrogen excretion and ammonia emission from slurry of growing–finishing pigs. Livest. Prod. Sci. 1998, 56, 181–191. [Google Scholar] [CrossRef]
- Powers, W.; Zamzow, S.; Kerr, B. Reduced crude protein effects on aerial emissions from swine. Appl. Eng. Agric. 2007, 23, 539–546. [Google Scholar] [CrossRef]
- Hsia, L.; Lu, G. The effect of high environmental temperature and nutrient density on pig performance, conformation and carcass characteristics under restricted feeding system. Asian-Australas. J. Anim. Sci. 2004, 17, 250–258. [Google Scholar] [CrossRef]
- Kerr, B.; Yen, J.T.; Nienaber, J.; Easter, R. Influences of dietary protein level, amino acid supplementation and environmental temperature on performance, body composition, organ weights and total heat production of growing pigs. J. Anim. Sci. 2003, 81, 1998–2007. [Google Scholar] [CrossRef]
- Greenberg, A.; Clesceri, L.; Eaton, A. Standard Methods for the Examination of Water and Wastewater; American Public Health Association (APHA): Washington, DC, USA, 1992. [Google Scholar]
- Ndegwa, P.M.; Wang, L.; Vaddella, V.K. Potential strategies for process control and monitoring of stabilization of dairy wastewaters in batch aerobic treatment systems. Process Biochem. 2007, 42, 1272–1278. [Google Scholar] [CrossRef]
- Koziel, J.A.; Corsi, R.L.; Lawler, D.F. Gas-liquid mass transfer along small sewer reaches. J. Environ. Eng. 2001, 127, 430–437. [Google Scholar] [CrossRef]
- Racz, G.; Fitzgerald, M. Nutrient and heavy metal contents of hog manure: Effect on soil quality and productivity. In Proceedings of the Int. Conference on the Livestock Options for the Future, Winnipeg, MB, Canada, 25–27 June 2001. [Google Scholar]
- Le, P.D.; Aarnink, A.J.A.; Jongbloed, A.W.; van der Peet-Schwering, C.M.C.; Ogink, N.W.M.; Verstegen, M.W.A. Interactive effects of dietary crude protein and fermentable carbohydrate levels on odour from pig manure. Livest. Sci. 2008, 114, 48–61. [Google Scholar] [CrossRef]


| Item | Feed A (This Research) | Feed B (Previous Research, [22]) |
|---|---|---|
| Crude protein (%, d. b 1) | 18.36 | 17.48 |
| Fat (%, d. b. ) | 2.69 | 2.91 |
| Crude fiber (%, d. b.) | 5.16 | 5.75 |
| NH3 | H2S | |
|---|---|---|
| Model | NH3/CR-200 | H2S/C-50 |
| Detecting range | 0–100 ppm | 0–50 ppm |
| Resolution | 0.1 ppm | 50 ppb |
| Linearity (R2) | 0.99 | 0.99 |
| Control 1 | ATAD Treatment 2 | p-Value | Reduction Rate (%) | |
|---|---|---|---|---|
| n | 14 | 14 | - | - |
| Room temperature (°C) | 31.7 ± 0.6 a | 31.2 ± 0.7 b | 0.0495 | - |
| Ventilation rate (m3·h−1·head−1) | 125 ± 1.8 a | 125 ± 1.5 a | 0.5820 | - |
| Gas concentration | ||||
| NH3 (ppmv) | 14.0 ± 0.9 a | 17.3 ± 0.7 b | <0.0001 | −24.4 ± 11.2 |
| H2S (ppbv) | 365 ± 35 a | 167 ± 17 b | <0.0001 | 53.7 ± 7.7 |
| Gas emission rate | ||||
| NH3 (g·d−1·head−1) | 25.9 ± 2.4 a | 33.7 ± 1.4 b | <0.0001 | −31.0 ± 14.4 |
| H2S (mg·d−1·head−1) | 1400 ± 132 a | 628 ± 47 b | <0.0001 | 54.6 ± 6.3 |
| Aerobically Treated Liquid Manure at Day 7 | Manure Sample from the Pits at Day 7 | ||
|---|---|---|---|
| Control 1 | ATAD Treatment 2 | ||
| Moisture contents (%, w. b.3) | 97.9 | 92.5 | 93.4 |
| Volatile solids (%, d. b.4) | 47.1 | 62.5 | 56.3 |
| pH | 8.6 | 7.8 | 7.9 |
| EC5 (μS·cm−1) | 21.9 | 28.6 | 23.8 |
| Total N (mg·L−1) | 3580 | 7170 | 5630 |
| NH4-N (mg·L−1) | 1860 | 4140 | 2720 |
| Seasons | Ambient Temperature (°C) | Room Temperature (°C) | Items | NH3 | H2S | ||||
|---|---|---|---|---|---|---|---|---|---|
| Control 1 | ATAD Treatment 2 | Reduction Rate (%) | Control 1 | ATAD Treatment 2 | Reduction Rate (%) | ||||
| Summer (This study) July | 29.0 | 31.5 | Concentration (ppmv) | 14.0 | 17.3 | −24.4 a | 0.4 | 0.2 | 53.7 a |
| Emission (g·d−1·AU−1) 3 | 162 | 211 | −31.0 a | 8.7 | 3.9 | 54.6 a | |||
| Ventilation rates (m3·h−1·head−1) | 125 | 125 | - | - | - | - | |||
| Fall (previous study [22]) October | 17.3 | 25.0 | Concentration (ppmv) | 14.9 | 10.3 | 32.6 b | 1.1 | 0.2 | 78.3 b |
| Emission (g·d−1·AU−1) 3 | 86.3 | 41.5 | 53.3 b | 13.4 | 2.1 | 83.7 b | |||
| Ventilation rates (m3·h−1·head−1) | 62.0 | 47.0 | - | - | - | - | |||
| Summer (This Study) | Fall [22] | |||
|---|---|---|---|---|
| Aerobically Treated Liquid Manure 1 | Manure Sample from ATAD Treatment 2 | Aerobically Treated Liquid Manure 1 | Manure Sample from ATAD Treatment 2 | |
| Moisture contents (%, w.b.3) | 97.9 | 93.4 | 98.7 | 98.3 |
| Volatile solids (%, d. b.4) | 47.1 | 56.3 | 40.1 | 45.7 |
| pH | 8.6 | 7.9 | 8.4 | 8.2 |
| EC 5 (μS·cm−1) | 21.9 | 23.8 | 12.9 | 12.7 |
| Total N (mg∙L−1) | 3580 | 5630 | 1190 | 1130 |
| NH4-N (mg∙L−1) | 1860 | 2720 | 567 | 633 |
© 2020 by the authors. Licensee MDPI, Basel, Switzerland. This article is an open access article distributed under the terms and conditions of the Creative Commons Attribution (CC BY) license (http://creativecommons.org/licenses/by/4.0/).
Share and Cite
Wi, J.; Lee, S.; Kim, E.; Lee, M.; Koziel, J.A.; Ahn, H. Effects of Treated Manure Conditions on Ammonia and Hydrogen Sulfide Emissions from a Swine Finishing Barn Equipped with Semicontinuous Pit Recharge System in Summer. Atmosphere 2020, 11, 713. https://doi.org/10.3390/atmos11070713
Wi J, Lee S, Kim E, Lee M, Koziel JA, Ahn H. Effects of Treated Manure Conditions on Ammonia and Hydrogen Sulfide Emissions from a Swine Finishing Barn Equipped with Semicontinuous Pit Recharge System in Summer. Atmosphere. 2020; 11(7):713. https://doi.org/10.3390/atmos11070713
Chicago/Turabian StyleWi, Jisoo, Seunghun Lee, Eunjong Kim, Myeongseong Lee, Jacek A. Koziel, and Heekwon Ahn. 2020. "Effects of Treated Manure Conditions on Ammonia and Hydrogen Sulfide Emissions from a Swine Finishing Barn Equipped with Semicontinuous Pit Recharge System in Summer" Atmosphere 11, no. 7: 713. https://doi.org/10.3390/atmos11070713
APA StyleWi, J., Lee, S., Kim, E., Lee, M., Koziel, J. A., & Ahn, H. (2020). Effects of Treated Manure Conditions on Ammonia and Hydrogen Sulfide Emissions from a Swine Finishing Barn Equipped with Semicontinuous Pit Recharge System in Summer. Atmosphere, 11(7), 713. https://doi.org/10.3390/atmos11070713