Agricultural Water Vulnerability under Climate Change in Cyprus

 , , ,
, , ,  and
and
Abstract
1. Introduction
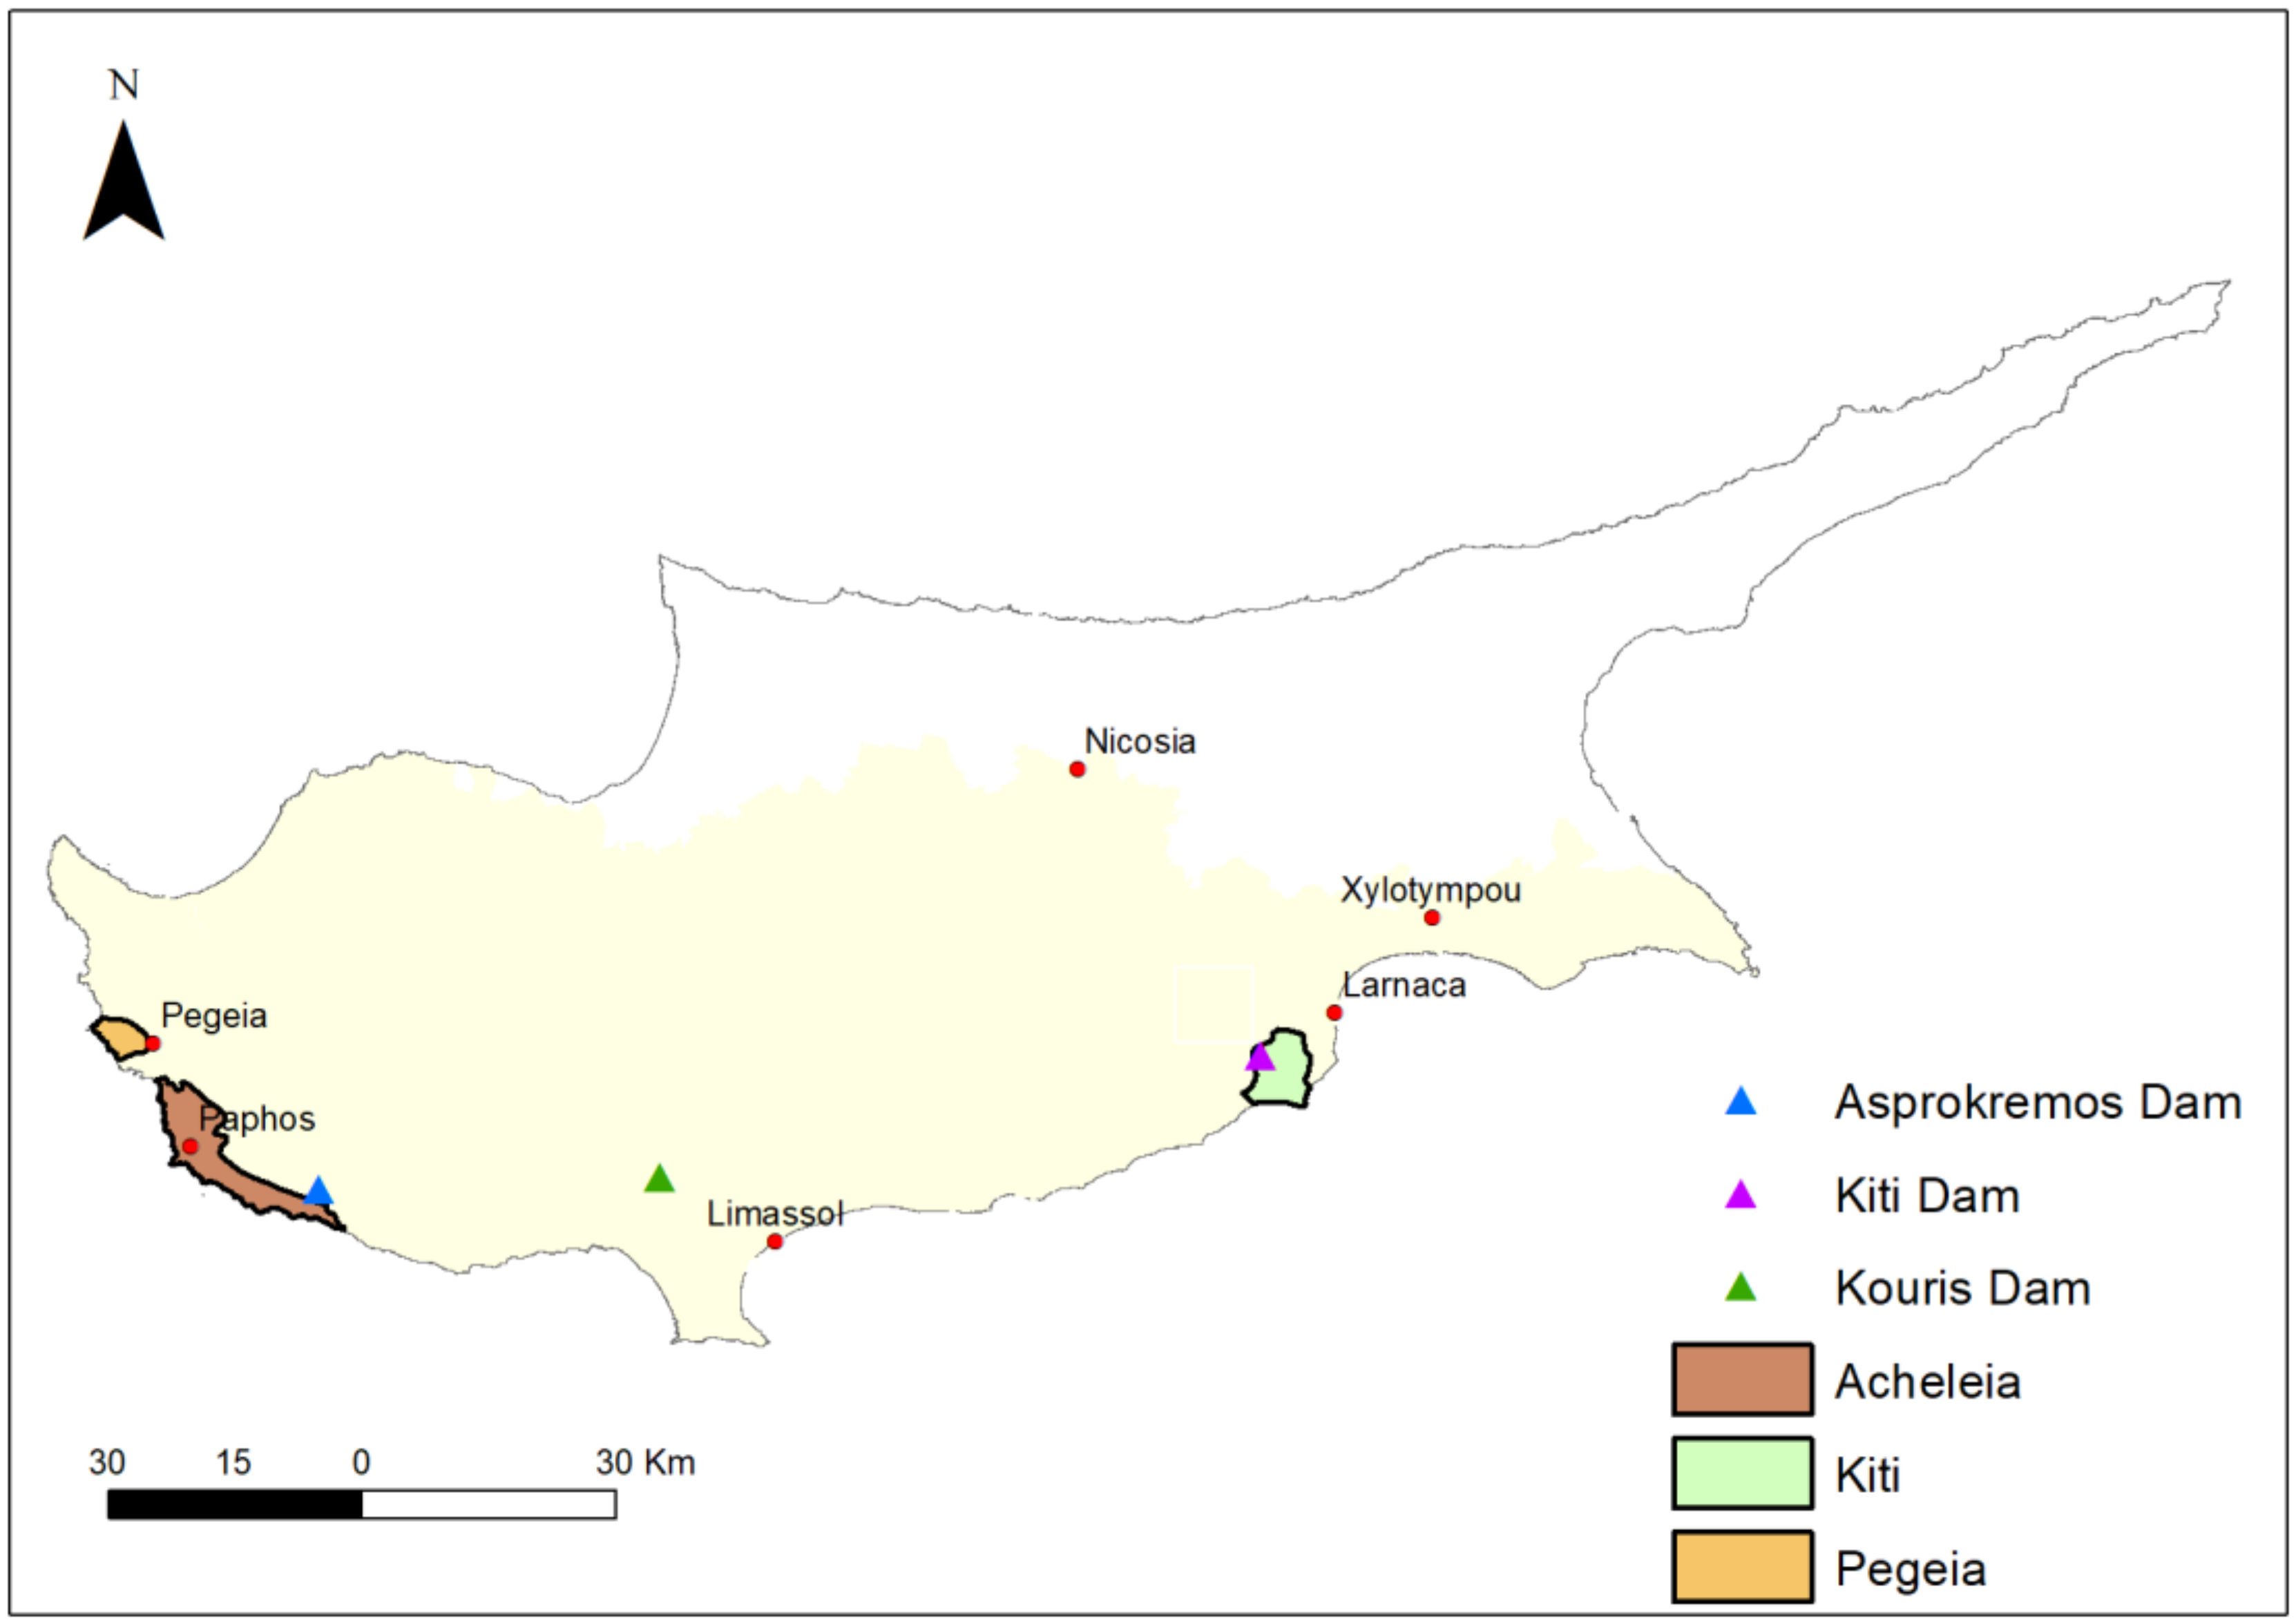
2. Cyprus Island
2.1. Aquifers of Interest
2.2. SPEI Estimation Locations
3. Methodology
3.1. Climatic Data
3.2. Εstimation of Future Groundwater Resources Availability under Climate Change Conditions
3.3. Εstimation of SPEI Evolution in Cyprus under Climate Change Conditions
4. Results
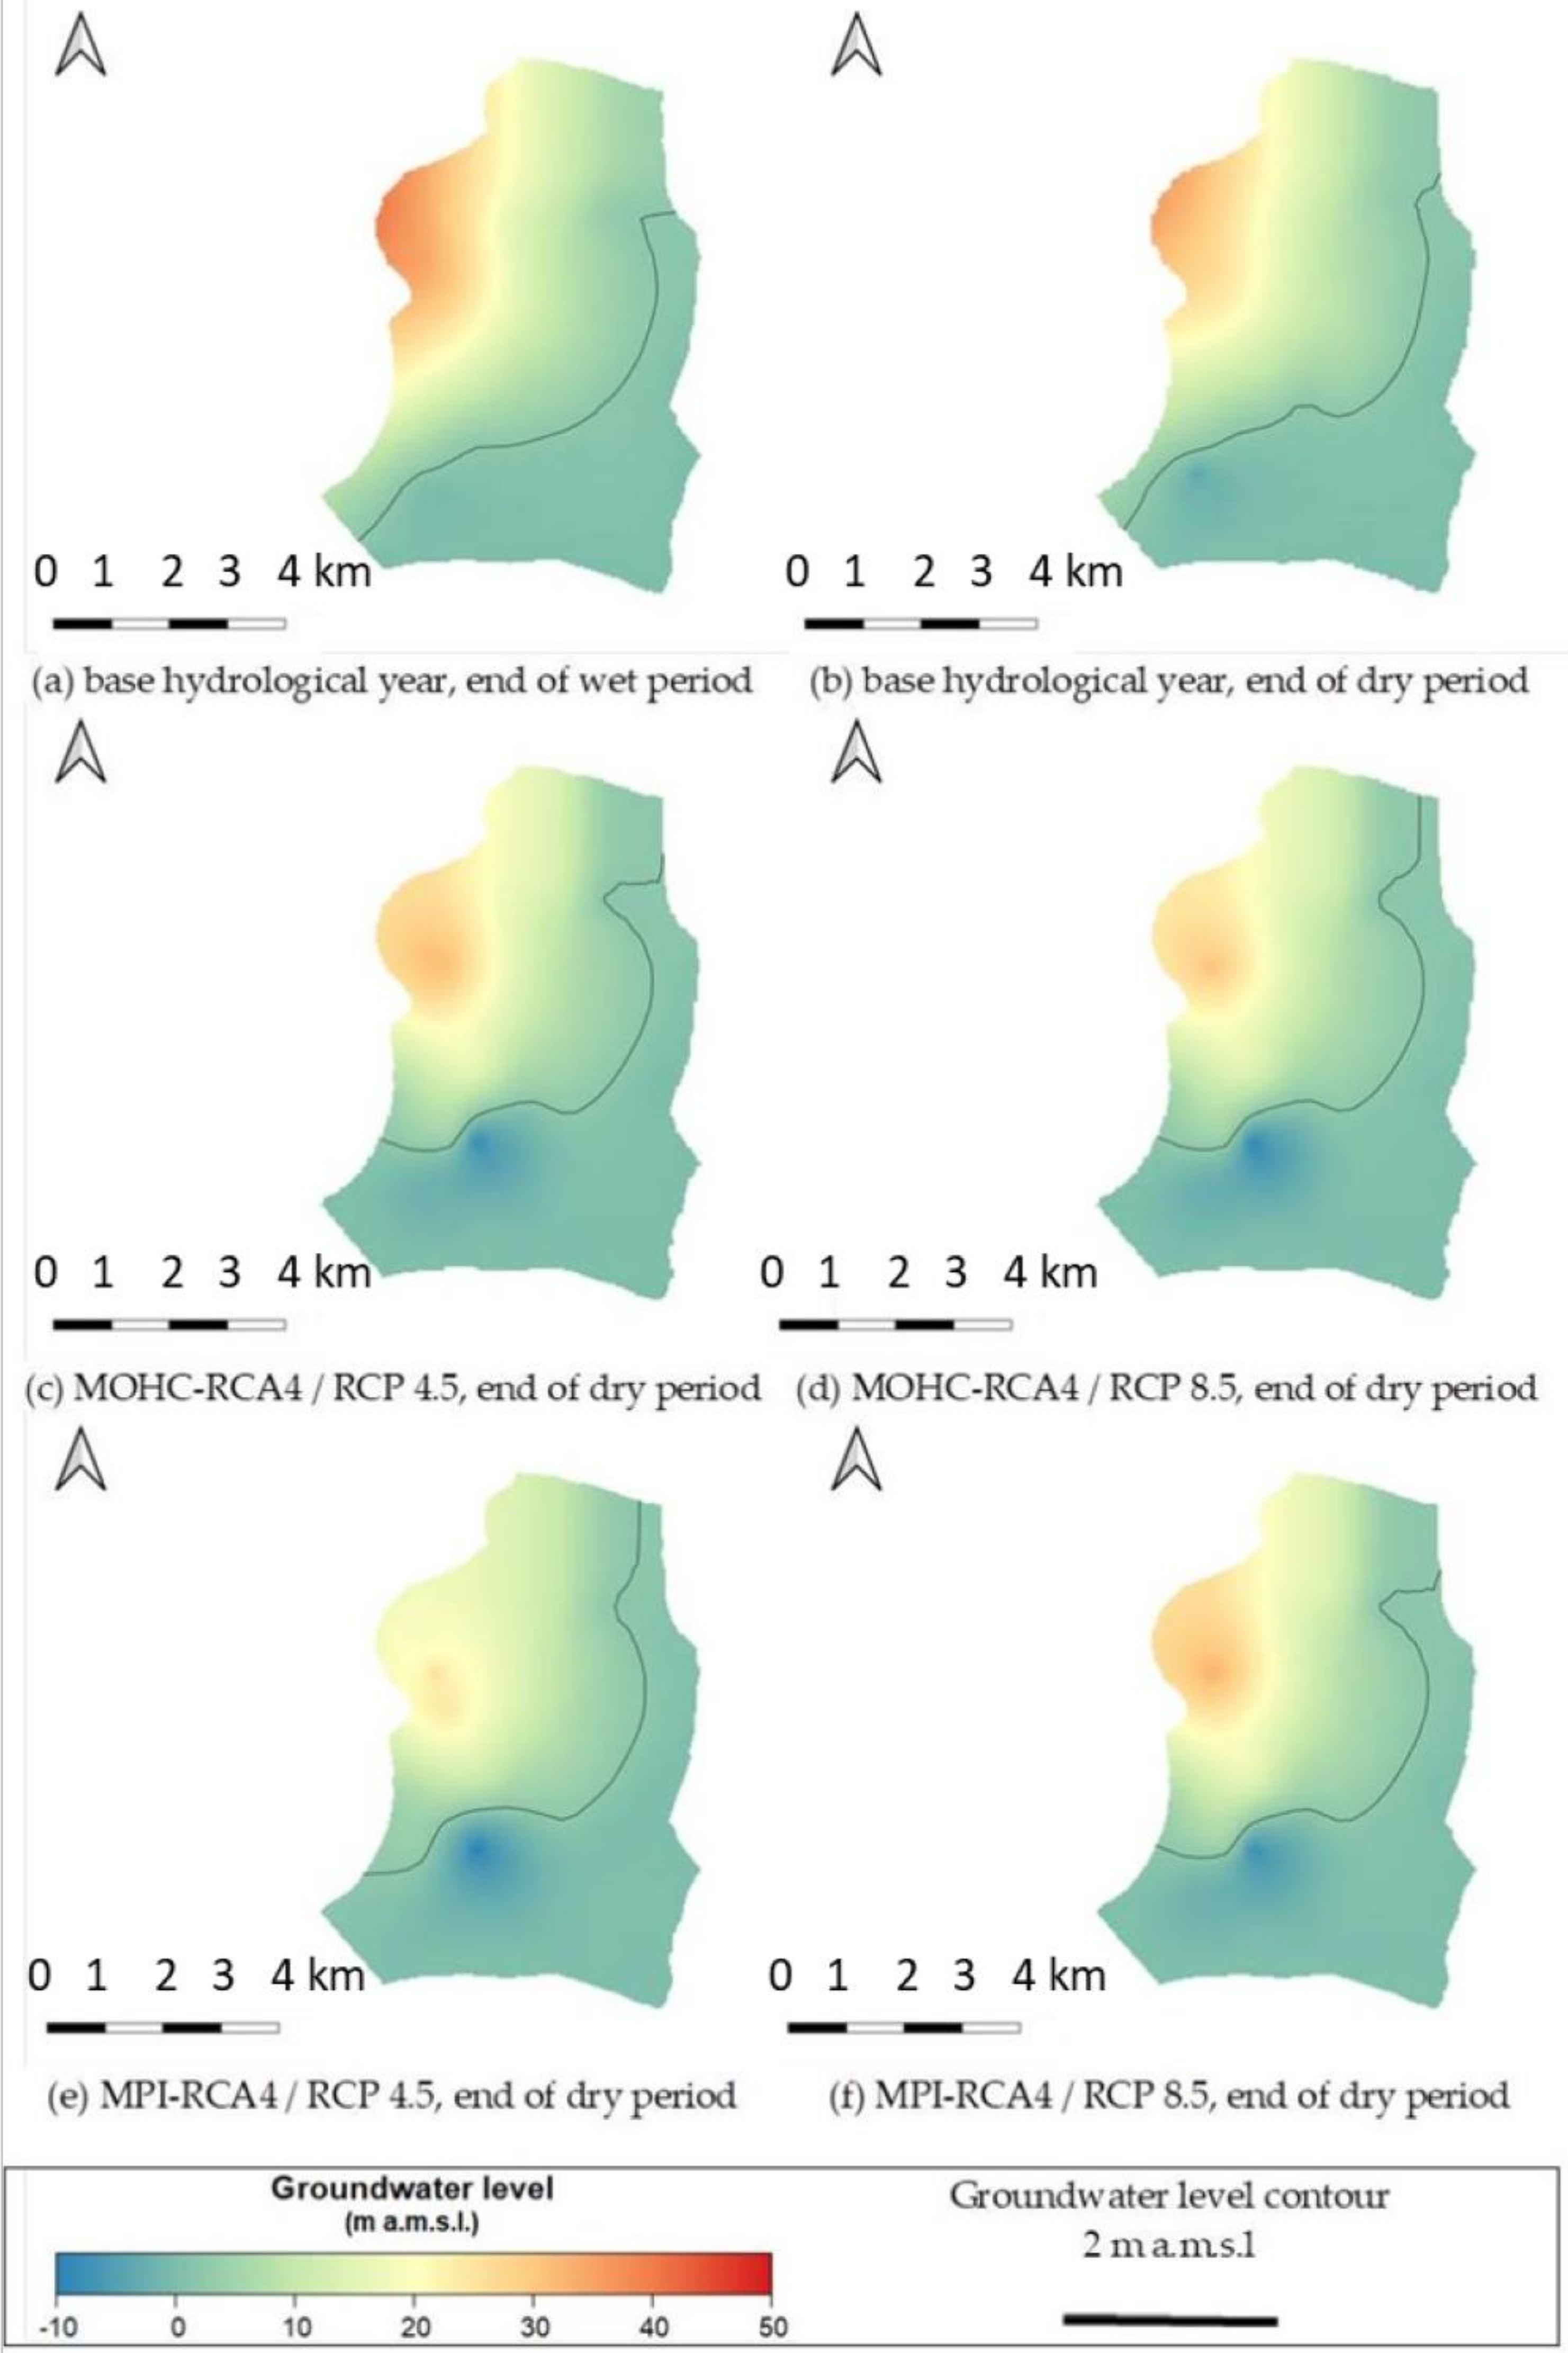
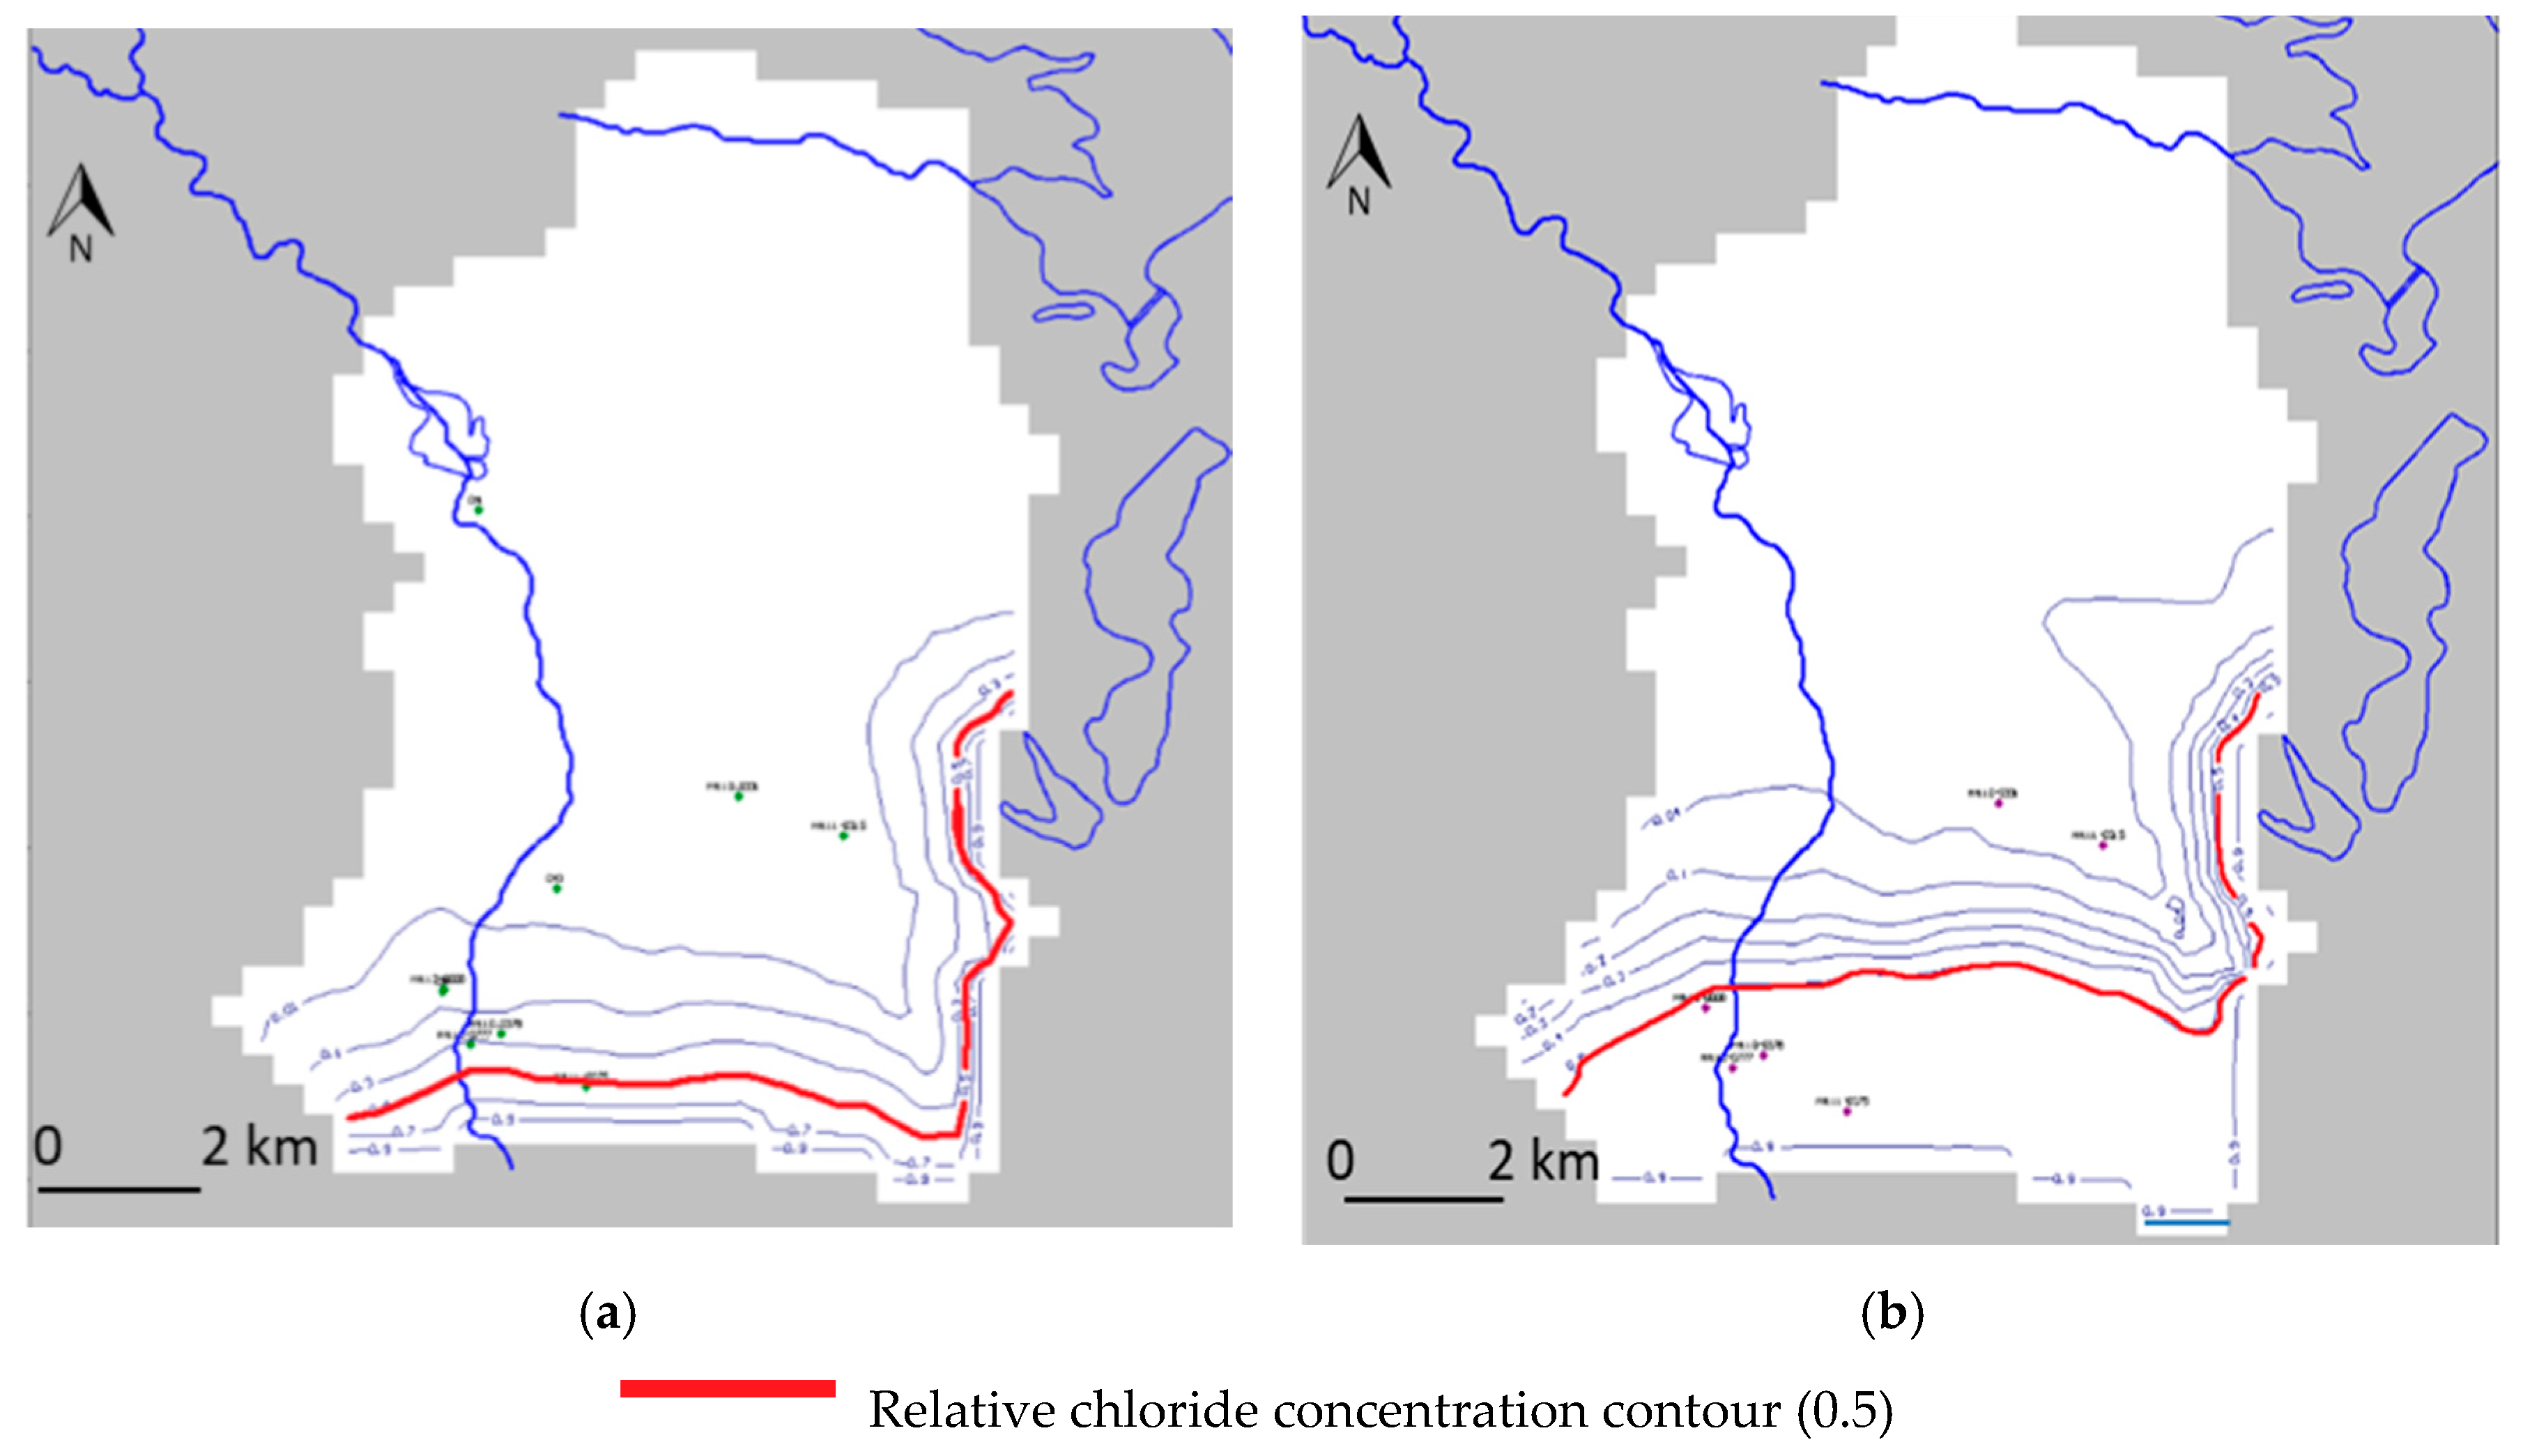
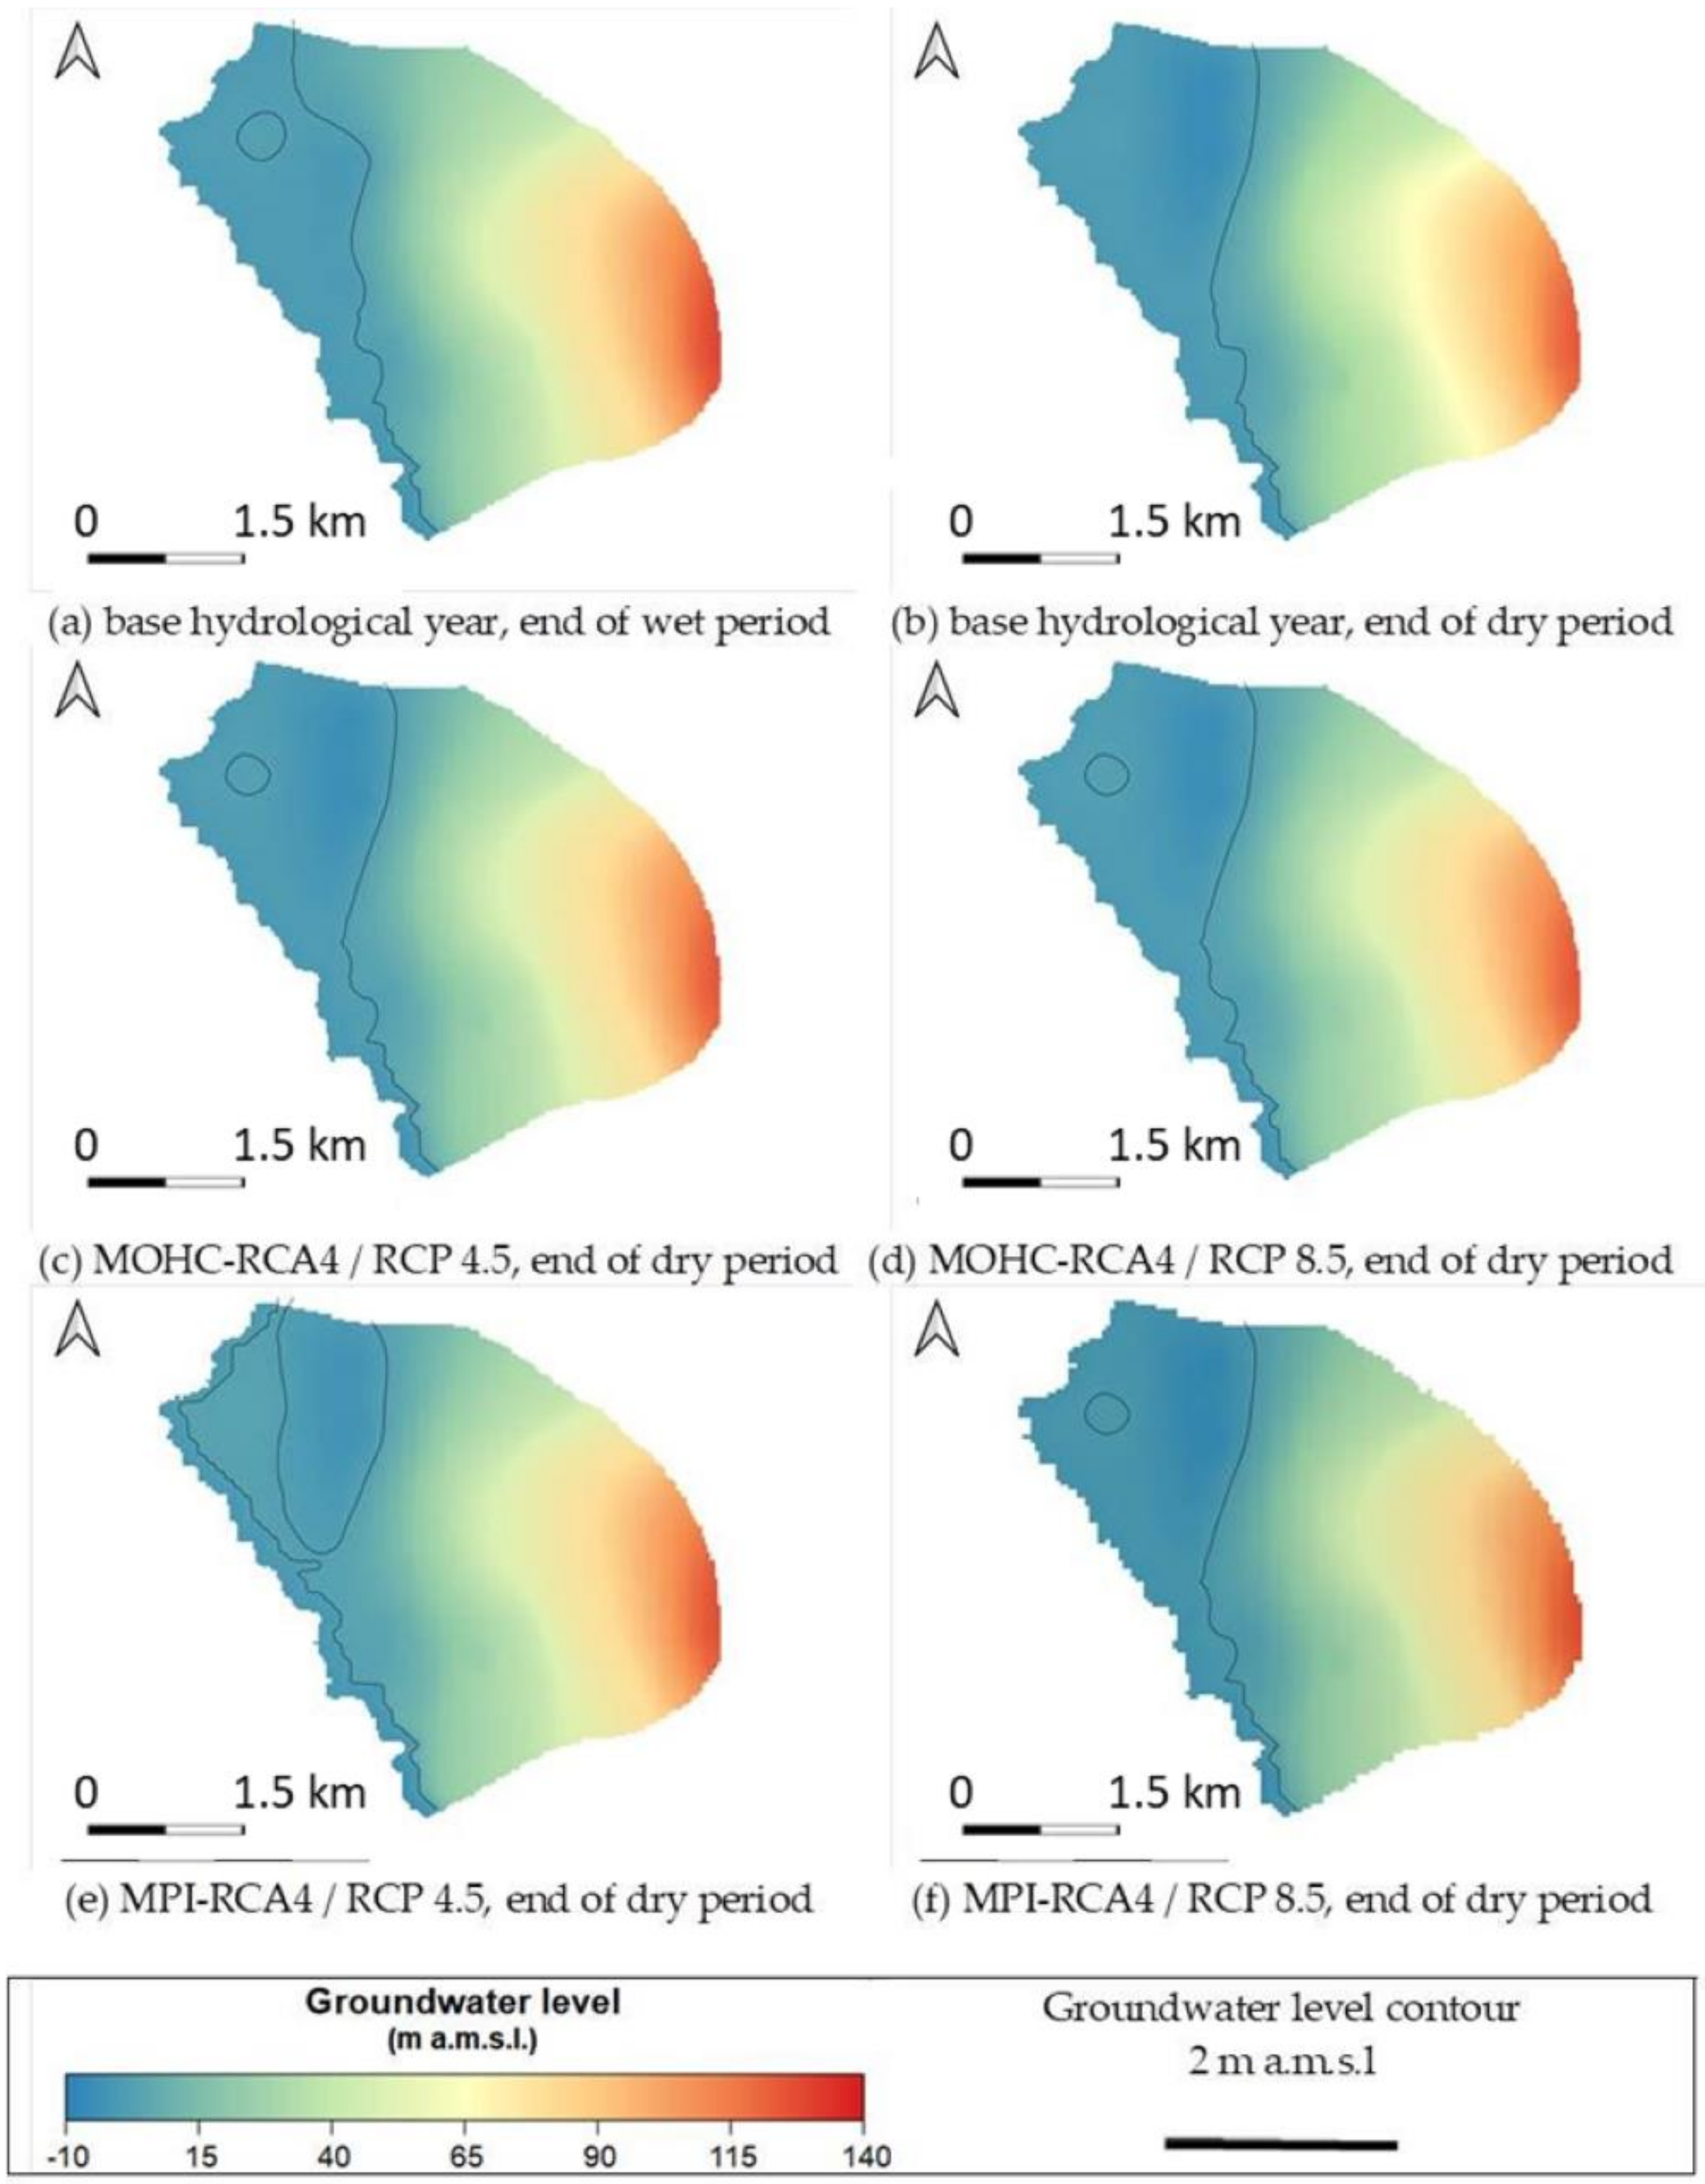
4.1. Assessment of Climate Change Impacts on Groundwater Resources in Cyprus
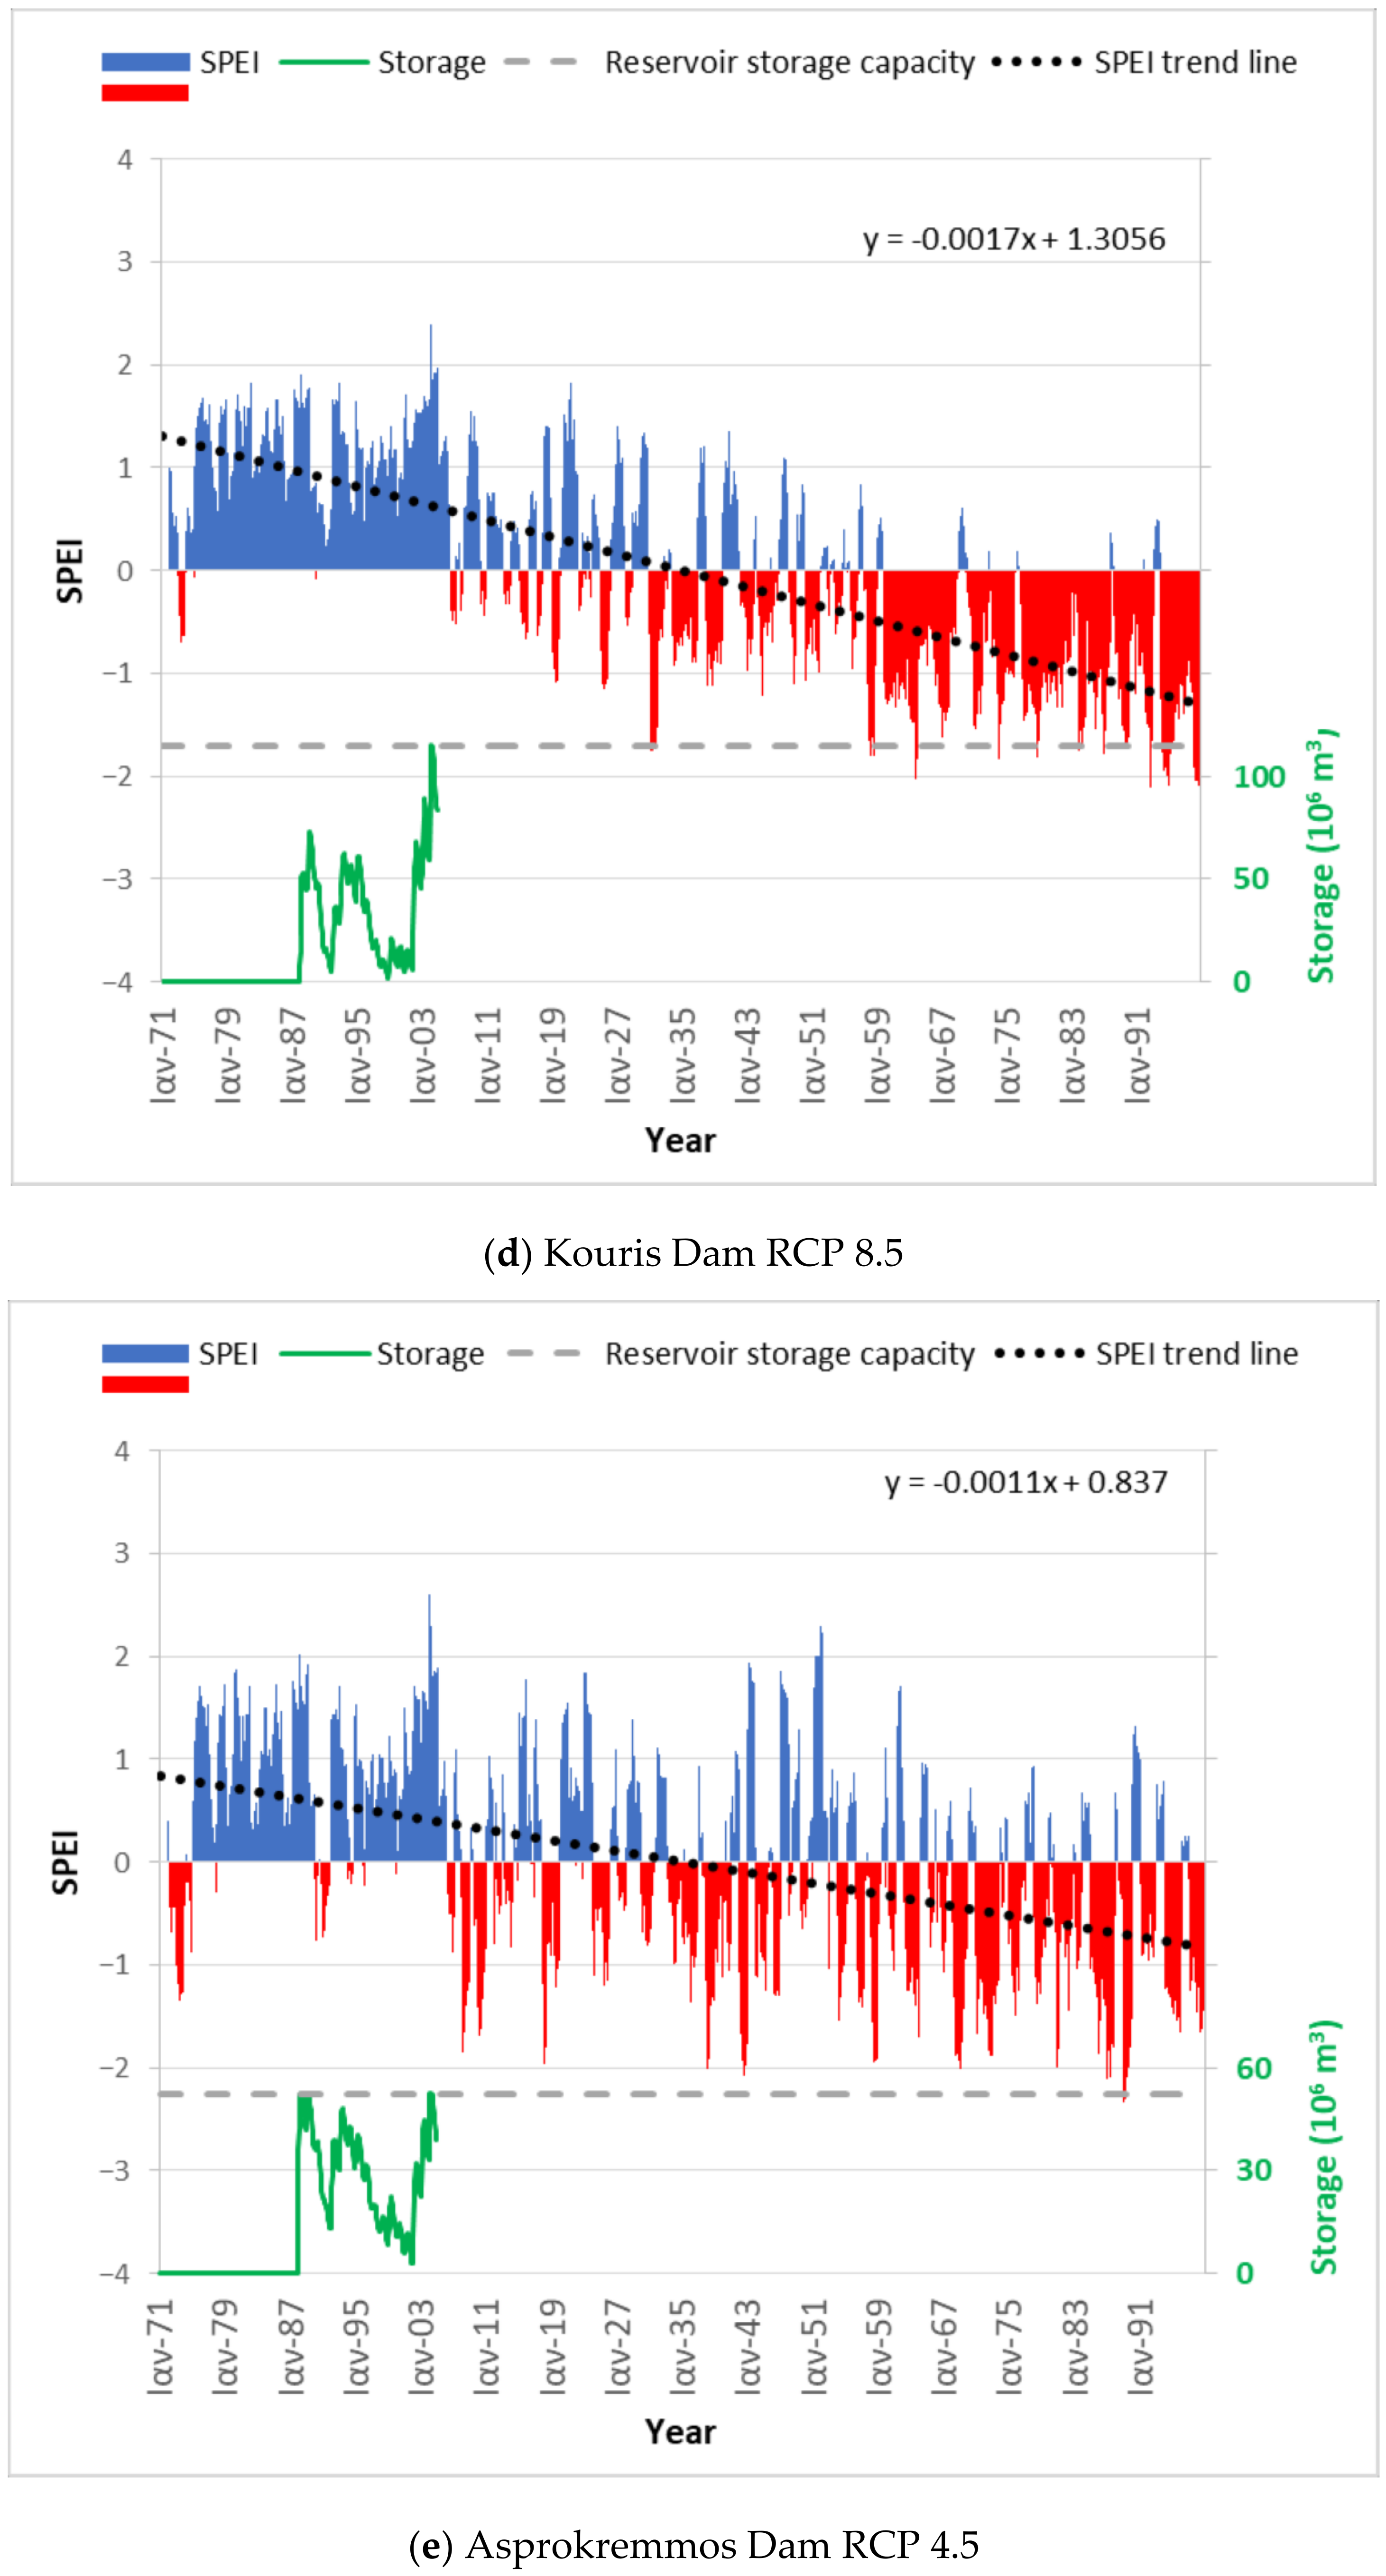
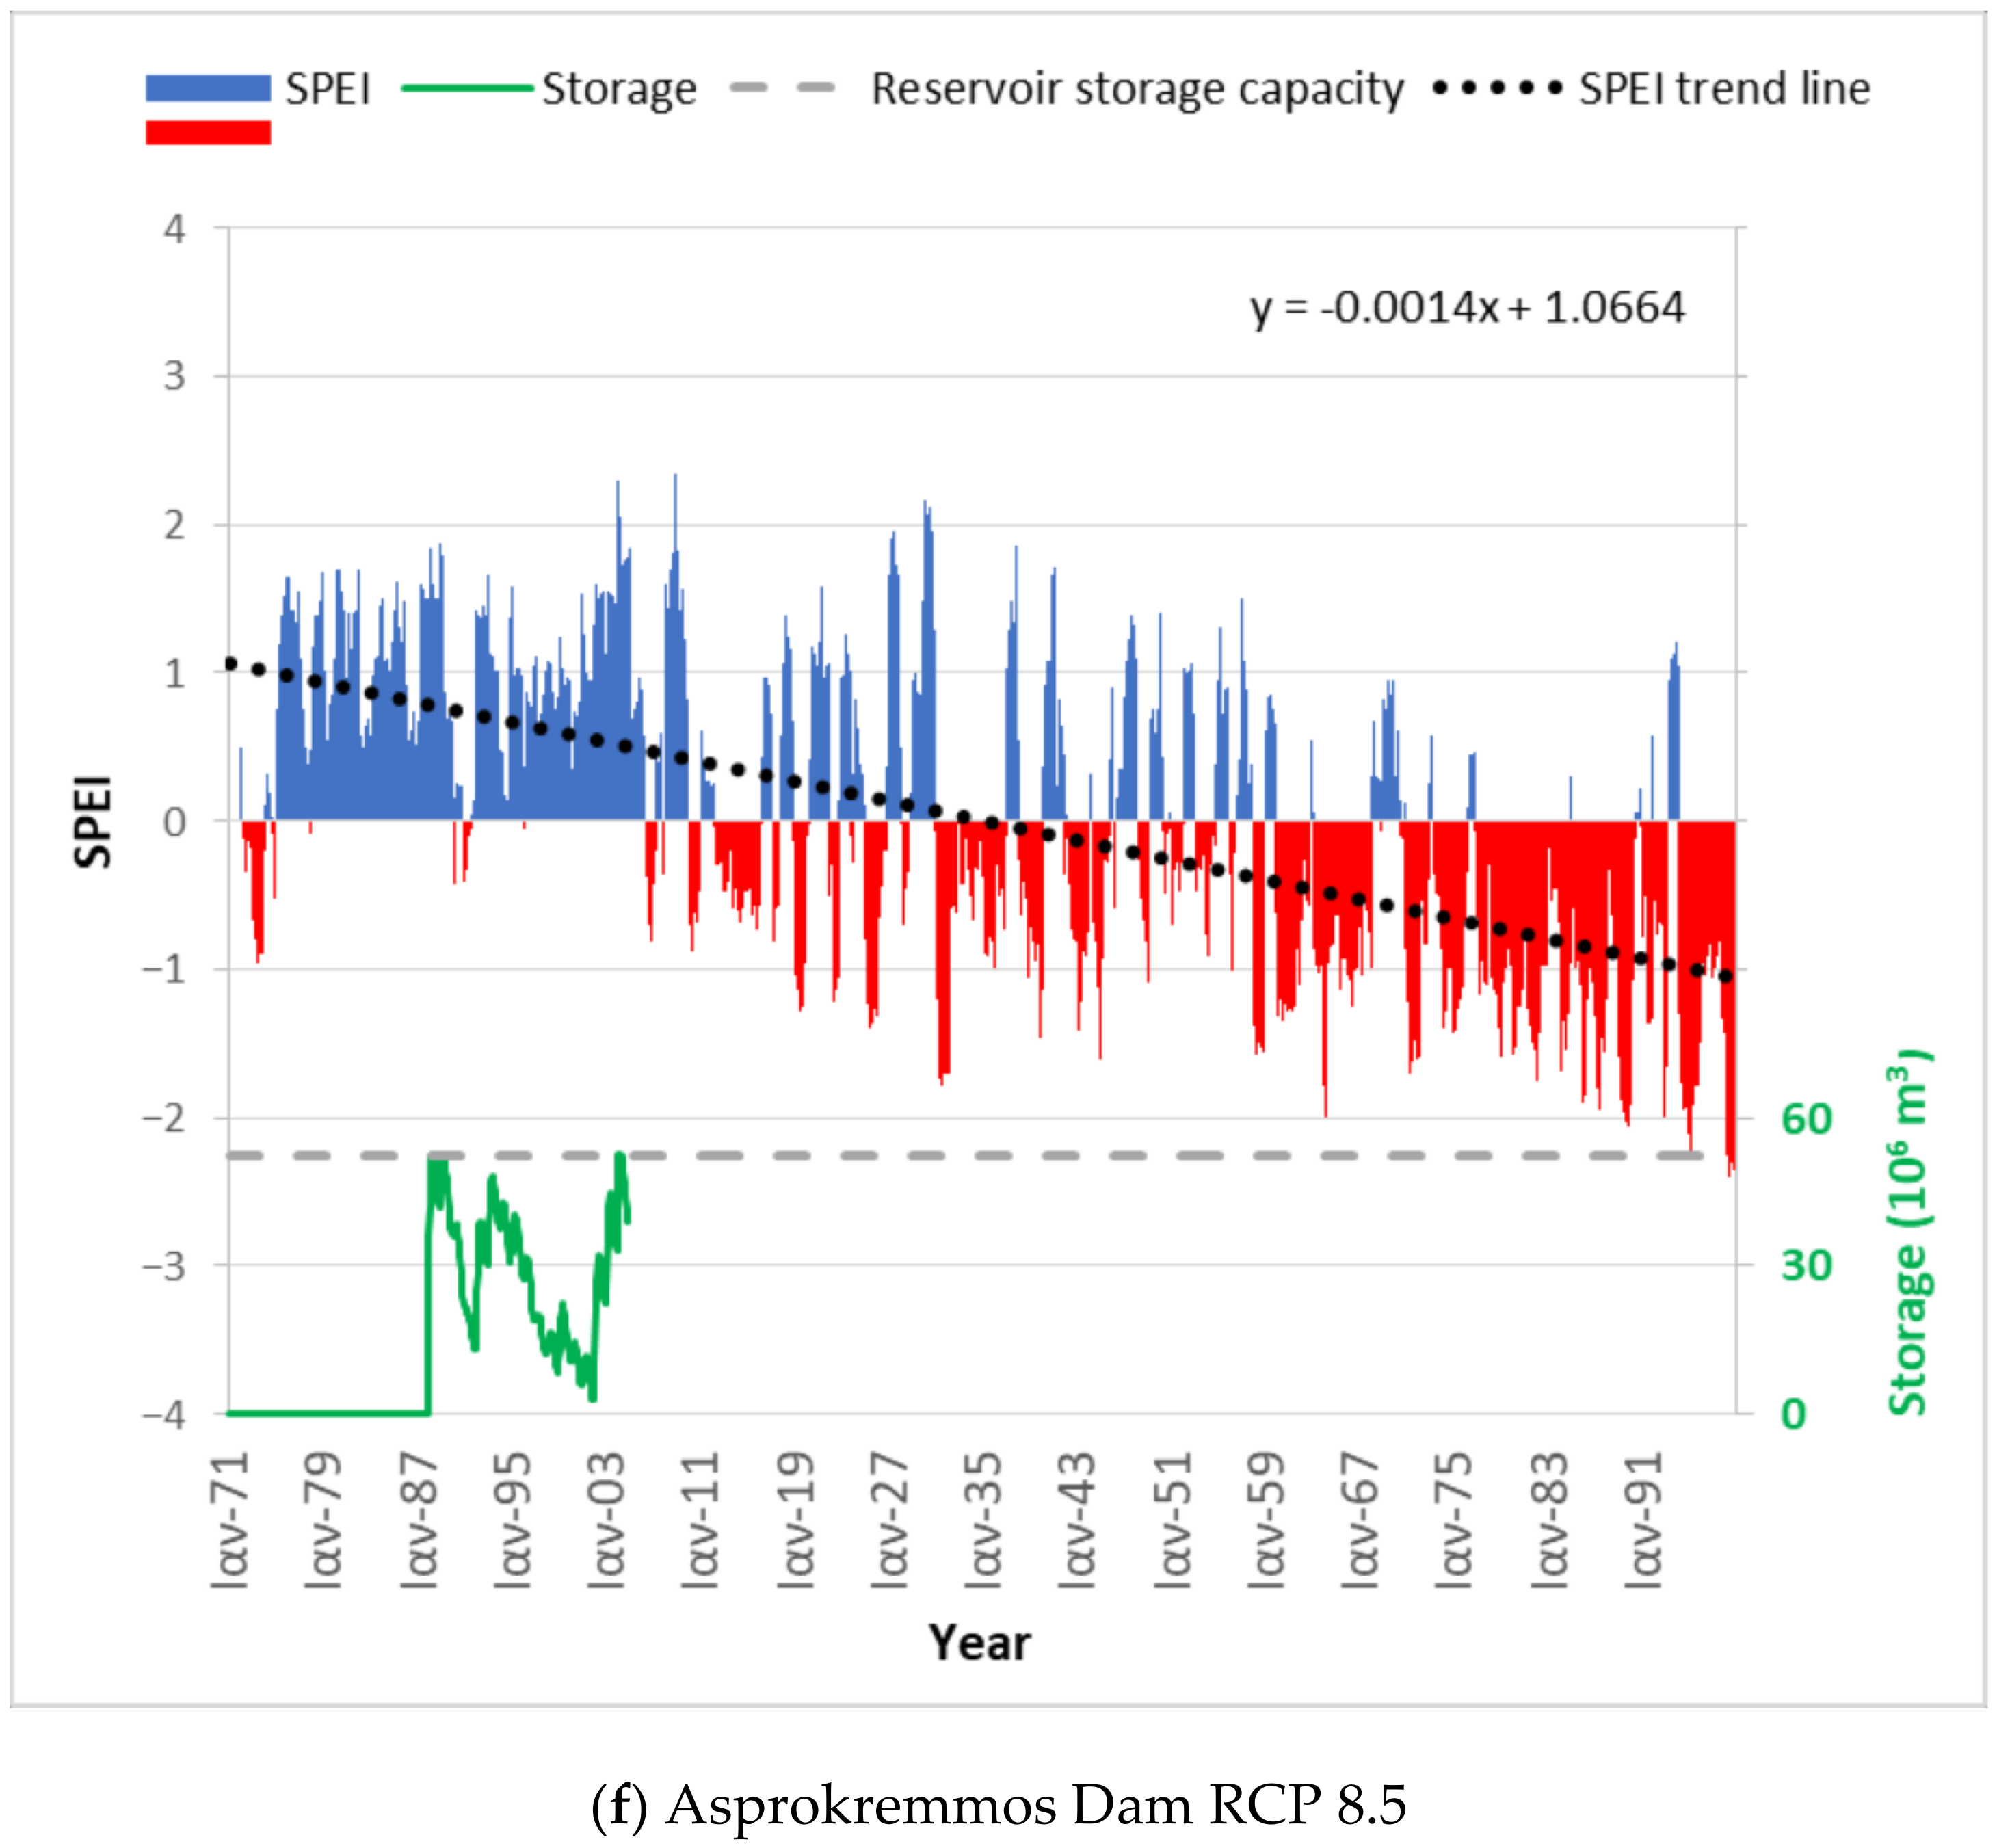
4.2. Assessment of Climate Change Impacts on SPEI Evolution and Water Reservoirs Storage
5. Discussion
6. Conclusions
Author Contributions
Funding
Acknowledgments
Conflicts of Interest
References
- IPCC. Climate Change 2014: Synthesis Report. Contribution of Working Groups I, II and III to the Fifth Assessment Report of the Intergovernmental Panel on Climate Change; Core Writing Team, Pachauri, R.K., Meyer, L.A., Eds.; IPCC: Geneva, Switzerland, 2014; p. 151. [Google Scholar]
- Handmer, J.; Honda, Y.; Kundzewicz, Z.W.; Arnell, N.; Benito, G.; Hatfield, J.; Mohamed, I.F.; Peduzzi, P.; Wu, S.; Sherstyukov, B.; et al. Changes in impacts of climate extremes: Human systems and ecosystems. In Managing the Risks of Extreme Events and Disasters to Advance Climate Change Adaptation; Field, C.B., Barros, V., Stocker, T.F., Qin, D., Dokken, D.J., Ebi, K.L., Mastrandrea, M.D., Mach, K.J., Plattner, G.-K., Allen, S.K., et al., Eds.; A Special Report of Working Groups I and II of the Intergovernmental Panel on Climate Change (IPCC): Geneva, Switzerland; Cambridge University Press: Cambridge, UK; New York, NY, USA, 2012; pp. 231–290. [Google Scholar]
- Calzadilla, A.; Zhu, T.; Rehdanz, K.; Tol, R.S.J.; Ringler, C. Climate change and agriculture: Impacts and adaptation options in South Africa. Water Resour. Econ. 2014, 5, 24–48. [Google Scholar] [CrossRef]
- FAO. Agriculture and Climate Change–Challenges and Opportunities at the Global and Local Level–Collaboration on Climate-Smart Agriculture; Licence: CC BY-NC-SA 3.0 IGO; FAO: Rome, Italy, 2011; p. 52. [Google Scholar]
- Zachariadis, T. Climate Change in Cyprus: Impacts and Adaptation Policies. Cyprus Econom. Policy Rev. 2012, 37, 21–37. [Google Scholar]
- LDK Consultants Engineers & Planners S.A.; ECOS Consulting S.A. Revision of the Drought Management Plan, WDD 10/2014. 2016. Available online: http://www.moa.gov.cy/moa/WDD/wfd.nsf/E59310DC9F385F1BC22583C50045545D/$file/Revision%20of%20the%20Drought%20Management%20Plan%20(Oct%202016).pdf (accessed on 2 February 2020).
- World Bank Open Data. Available online: https://data.worldbank.org/ (accessed on 10 February 2020).
- Water Development Department. Available online: http://www.moa.gov.cy/moa/wdd/Wdd.nsf/index_en/index_en?opendocument (accessed on 20 January 2020).
- Cleridou, N.; Benas, N.; Matsoukas, C.; Croke, B.; Vardavas, I. Water resources of Cyprus under changing climatic conditions: Modelling approach, validation and limitations. Environ. Model. Softw. 2014, 60, 202–218. [Google Scholar] [CrossRef]
- Klaas, D.K.S.Y.; Imteaz, M.A.; Sudiayem, I.; Klaas, E.M.E.; Klaas, E.C.M. Assessing climate changes impacts on tropical karst catchment: Implications on groundwater resource sustainability and management strategies. J. Hydrol. 2020, 582. [Google Scholar] [CrossRef]
- Taheri Tizro, A.; Fryar, A.E.M.; Pour, K.; Voudouris, K.S.; Javad Mashhadian, M. Groundwater conditions related to climate change in the semi-arid area of western Iran. Groundw. Sustain. Dev. 2019, 9. [Google Scholar] [CrossRef]
- Pholkern, K.; Saraphirom, P.; Srisuk, K. Potential impact of climate change on groundwater resources in the Central Huai Luang Basin, Northeast Thailand. Sci. Total Environ. 2018, 633, 1518–1535. [Google Scholar] [CrossRef] [PubMed]
- Green, T.R.; Taniguchi, M.; Kooi, H.; Gurdak, J.J.; Allen, D.M.; Hiscock, K.M.; Treidel, H.; Aureli, A. Beneath the surface of global change: Impacts of climate change on groundwater. J. Hydrol. 2011, 405, 532–560. [Google Scholar] [CrossRef]
- Lorenzo-Lacruz, J.; Vicente-Serrano, S.M.; López-Moreno, J.I.; Beguería, S.; García-Ruiz, J.M.; Cuadrat, J.M. The impact of droughts and water management on various hydrological systems in the headwaters of the Tagus River (central Spain). J. Hydrol. 2010, 386, 13–26. [Google Scholar] [CrossRef]
- Vicente-Serrano, S.M.; Beguería, S.; López-Moreno, J.I. A Multi-scalar drought index sensitive to global warming: The Standardized Precipitation Evapotranspiration Index–SPEI. J. Clim. 2010, 23, 1696–1718. [Google Scholar] [CrossRef]
- Gao, X.; Zhao, Q.; Zhao, X.; Wu, P.; Pan, W.; Gao, X.; Sun, M. Temporal and spatial evolution of the standardized precipitation evapotranspiration index (SPEI) in the Loess Plateau under climate change from 2001 to 2050. Sci. Total Environ. 2017, 595, 191–200. [Google Scholar] [CrossRef]
- Marcos-Garcia, P.; Lopez-Nicolas, A.; Pulido-Velazquez, M. Combined use of relative drought indices to analyze climate change impact on meteorological and hydrological droughts in a Mediterranean basin. J. Hydrol. 2017, 554, 292–305. [Google Scholar] [CrossRef]
- Spinoni, J.; Barbosa, P.; De Jager, A.; McCormick, N.; Naumann, G.; Vogt, J.V.; Magni, D.; Masante, D.; Mazzeschi, M. A new global database of meteorological drought events from 1951 to 2016. J. Hydrol. Reg. Stud. 2019, 22. [Google Scholar] [CrossRef] [PubMed]
- Vicente-Serrano, S.M.; National Center for Atmospheric Research Staff (Eds.) The Climate Data Guide: Standardized Precipitation Evapotranspiration Index (SPEI). Available online: https://climatedataguide.ucar.edu/climate-data/standardized-precipitation-evapotranspiration-index-spei (accessed on 2 February 2020).
- Zittis, G.; Bruggeman, A.; Camera, C.; Hadjinicolaou, P.; Lelieveld, J. The added value of convection permitting simulations of extreme precipitation events over the eastern Mediterranean. Atmos. Res. 2017, 191, 20–33. [Google Scholar] [CrossRef]
- Price, C.; Michaelides, S.; Pashiardis, S.; Alperta, P. Long term changes in diurnal temperature range in Cyprus. Atmos. Res. 1999, 51, 85–98. [Google Scholar] [CrossRef]
- Pashiardis, S.; Michaelides, S. Implementation of the standardized precipitation index (SPI) and the reconnaissance drought index (RDI) for regional drought assessment: A case study for Cyprus. Eur. Water 2008, 23, 57–65. [Google Scholar]
- Kostopoulou, E.; Jones, P.D. Assessment of Climate Extremes in the Eastern Mediterranean. Meteorol. Atmos. Phys. 2005, 89, 69–85. [Google Scholar] [CrossRef]
- Goubanova, K.; Li, L. Extremes in Temperature and Precipitation around the Mediterranean Basin in an Ensemble of Future Climate Scenario Simulations. Glob. Planet. Chang. 2007, 57, 27–42. [Google Scholar] [CrossRef]
- Philandras, C.M.; Nastos, P.T.; Kapsomenakis, J.; Douvis, K.C.; Tselioudis, G.; Zerefos, C.S. Long Term Precipitation Trends and Variability within the Mediterranean Region. Nat. Hazards Earth Syst. Sci. 2011, 11, 3235–3250. [Google Scholar] [CrossRef]
- Zittis, G. Observed Rainfall Trends and Precipitation Uncertainty in the Vicinity of the Mediterranean, Middle East and North Africa. Theor. Appl. Climatol. 2018, 134, 1207–1230. [Google Scholar] [CrossRef]
- Wulf, K. Reassessment of the Islands Water Resources and Demand. In Synthesis Report FAO/WDD TCP/CYP/2801; Ministry of Agriculture, Natural Resources and Environment of the Republic of Cyprus: Nicosia, Cyprus, 2002; p. 31. [Google Scholar]
- Sofroniou, A.; Bishop, S. Water Scarcity in Cyprus: A Review and Call for Integrated Policy. Water 2014, 6, 2898–2928. [Google Scholar] [CrossRef]
- WDD and FAO. Reassessment of the Island’s Water Resources and Demand-Objective 1–Output 1.4.2-Assessment of Groundwater Resources of Cyprus; WDD and FAO: Lefkosia, Cyprus, 2002; p. 234. [Google Scholar]
- Milnes, E.; Renard, P. Assessment of Seawater Intrusion versus Mass Return Flow from Irrigation in the Kiti Coastal Pilot area System (Southern Cyprus) Based on Field Investigations and Three-Dimensional Finite Element Simulations. In Proceedings of the 17th Salt Water Intrusion Meeting, Delft, The Netherlands, 6–10 May 2002. [Google Scholar]
- Statistical Service. Census of Agriculture 2010; Agricultural Statistics, Series I, Report No 8; Statistical Service: Accra, Ghana, 2014; p. 335. [Google Scholar]
- LIFE ADAPT2CLIMA. Deliverable C4.1: Report on the Estimation of Future Climate Change Impacts on the Water Resources of Cyprus, Crete and Sicily. Project ADAPT2CLIMA LIFE14 CCA/GR/000928. 2017. Available online: http://adapt2clima.eu/uploads/2017/adapt2clima_Deliverable_C4.1_20180531.pdf (accessed on 10 February 2020).
- Ministry of Agriculture, Natural Resources and Environment Report on the Implementation of Council Directive 91/676/EEC Concerning the Protection of Waters against Pollution Caused by Nitrates from Agricultural Sources, Article 10; Cyprus National Report 2012–2015; Ministry of Agriculture, Natural Resources and Environment: Nicosia, Cyprus, 2015.
- Haylock, M.R.; Hofstra, N.; Tank, A.M.G.K.; Klok, E.J.; Jones, P.D.; New, M. A European Daily High-Resolution Gridded Data Set of Surface Temperature and Precipitation for 1950–2006. J. Geophys. Res. Atmos. 2008, 113. [Google Scholar] [CrossRef]
- Klok, E.J.; Klein Tank, A.M.G. Updated and Extended European Dataset of Daily Climate Observations. Int. J. Climatol. 2009, 29, 1182–1191. [Google Scholar] [CrossRef]
- Retalis, A.; Katsanos, D.; Michaelides, S. Precipitation climatology over the Mediterranean Basin Validation over Cyprus. Atmos. Res. 2016, 169, 449–458. [Google Scholar]
- Strandberg, G.; Bärring, A.; Hansson, U.; Jansson, C.; Jones, C.; Kjellström, E. CORDEX Scenarios for Europe from the Rossby Centre Regional Climate Model RCA4; Report Meteorology and Climatology; SE-60176 Norrköping, Sverige; SMHI: Norrköping, Sweden, 2014; p. 84.
- Collins, W.J.; Bellouin, N.; Doutriaux-Boucher, M.; Gedney, N.; Halloran, P.; Hinton, T.; Woodward, S. Development and evaluation of an Earth-System model–HadGEM2. Geosci. Model Dev. 2011, 4, 1051–1075. [Google Scholar] [CrossRef]
- Martin, G.M.; Milton, S.F.; Senior, C.A.; Brooks, M.E.; Ineson, S.; Reichler, T.; Kim, J. Analysis and Reduction of Systematic Errors through a Seamless Approach to Modeling Weather and Climate. J. Clim. 2011, 23, 5933–5957. [Google Scholar] [CrossRef]
- Popke, D.; Stevens, B.; Voigt, A. Climate and climate change in a radiative-convective equilibrium version of ECHAM6. J. Adv. Model. Earth Syst. 2013, 5, 1–14. [Google Scholar] [CrossRef]
- Hutchinson, M.F. Interpolation of Rainfall Data with Thin Plate Smoothing Splines-Part II: Analysis of Topographic Dependence. J. Geogr. Inf. Decis. Anal. 1998, 2, 152–167. [Google Scholar]
- LIFE ADAPT2CLIMA. Deliverable C3: Future Projections on Climatic Indices with Particular Relevance to Agriculture for the Three Islands (Coarse Resolution) and for Each Agricultural Pilot Area (Fine Resolution) Project ADAPT2CLIMA LIFE14 CCA/GR/000928. 2017. Available online: http://adapt2clima.eu/uploads/2017/ADAPT2CLIMA_DEL_C.3_Final_3.pdf (accessed on 1 April 2020).
- Waterloo Hydrogeologic. Visual MODFLOW Flex 4.1 Integrated Conceptual & Numerical Groundwater Modeling; Waterloo Hydrogeologic: Waterloo, ON, Canada, 2017; p. 869. [Google Scholar]
- Harbaugh, A.W.; Banta, E.R.; Hill, M.C.; McDonald, M.G. MODFLOW-2000, the U.S. Geological Survey Modular Ground-Water Model-User Guide to Modularization Concepts and the Ground-Water Flow Process, U.S. Geological Survey Open-File Report 00-92. 2000; p. 121. Available online: https://water.usgs.gov/nrp/gwsoftware/modflow2000/ofr00-92.pdf (accessed on 3 June 2020).
- Zheng, C.; Wang, K. MT3DMS-A Modular Three Dimensional Multispecies Transport Model for Simulation of Advection, Dispersion and Chemical Reactions of Contaminants in Groundwater Systems. Contract Report SERD99-1, U.S. Army Corps of Engineers. 1999. Available online: https://hydro.geo.ua.edu/mt3d/mt3dmanual.pdf (accessed on 3 June 2020).
- Langevin, C.D.; Thorne, D.T., Jr.; Dausman, A.M.; Sukop, M.C.; Guo, W. SEAWAT Version 4: A Computer Program for Simulation of Multi-Species Solute and Heat Transport; U.S. Geological Survey Techniques and Methods Book 6; United States Geological Survey: Reston, VA, USA, 2007; Chapter A22; p. 39.
- Charchousi, D.; Papadopoulou, M.P.; Spanoudaki, K.; Alexakis, D.; Giannakopoulos, C.; Karali, A. Assessing the vulnerability of agriculture to climate change: The case of Cyprus. Eur. Water 2017, 59, 351–356. [Google Scholar]
- Ministry of Agriculture, Rural Development and Environment, Water Development Department. Assessment Report of the Chemical Status of Underground Water in 2016; Ministry of Agriculture, Rural Development and Environment, Water Development Department: Nicosia, Cyprus, 2017; p. 44.
- SPEI. Available online: http://spei.csic.es/home.html (accessed on 15 December 2019).
- Abramowitz, M.; Stegun, I.A. Handbook of Mathematical Functions, with Formulas, Graphs, and Mathematical Tables; Dover Publications: Mineola, NY, USA, 1965; p. 1046. [Google Scholar]
- Edwards, C.D.C.; McKee, T.B.; Doesken, N.J.; Kleist, J. Historical analysis of drought in the United States. In Proceedings of the 7th Conference on Climate Variations, 77th AMS Annual Meeting, Long Beach, CA, USA, 2–7 February 1997. [Google Scholar]
- SPEI: Calculation of the Standardised Precipitation-Evapotranspiration Index. Available online: https://CRAN.R-project.org/package=SPEI (accessed on 1 March 2019).
- Hargreaves, G.H. Defining and using reference evapotranspiration. J. Irrig. Drain Eng. 1994, 120, 1132–1139. [Google Scholar] [CrossRef]
- Allen, R.G.; Pereira, L.S.; Raes, D.; Smith, M. Crop Evapotranspiration: Guidelines for Computing Crop Water Requirements; FAO irrigation and drainage paper 56; FAO: Rome, Italy, 1998. [Google Scholar]
- Official Gazette of the Republic of Cyprus, Νο 4418. 18 February 2011. Available online: http://www.moa.gov.cy/moa/WDD/wdd.nsf/All/CB9C4C6D4AFE5156C225820C002ECE23/$file/3_Adia_Ydrolipsias.pdf?OpenElement (accessed on 10 June 2020). (In Greek)
- Michaelides, S.; Pashiardis, S. Monitoring Drought in Cyprus during the 2007–2008 Hydrometeorological Year by using the Standardized Precipitation Index (SPI). Eur. Water 2008, 23, 123–131. [Google Scholar]


| Kiti Aquifer | |
| Area | ~40 km2 |
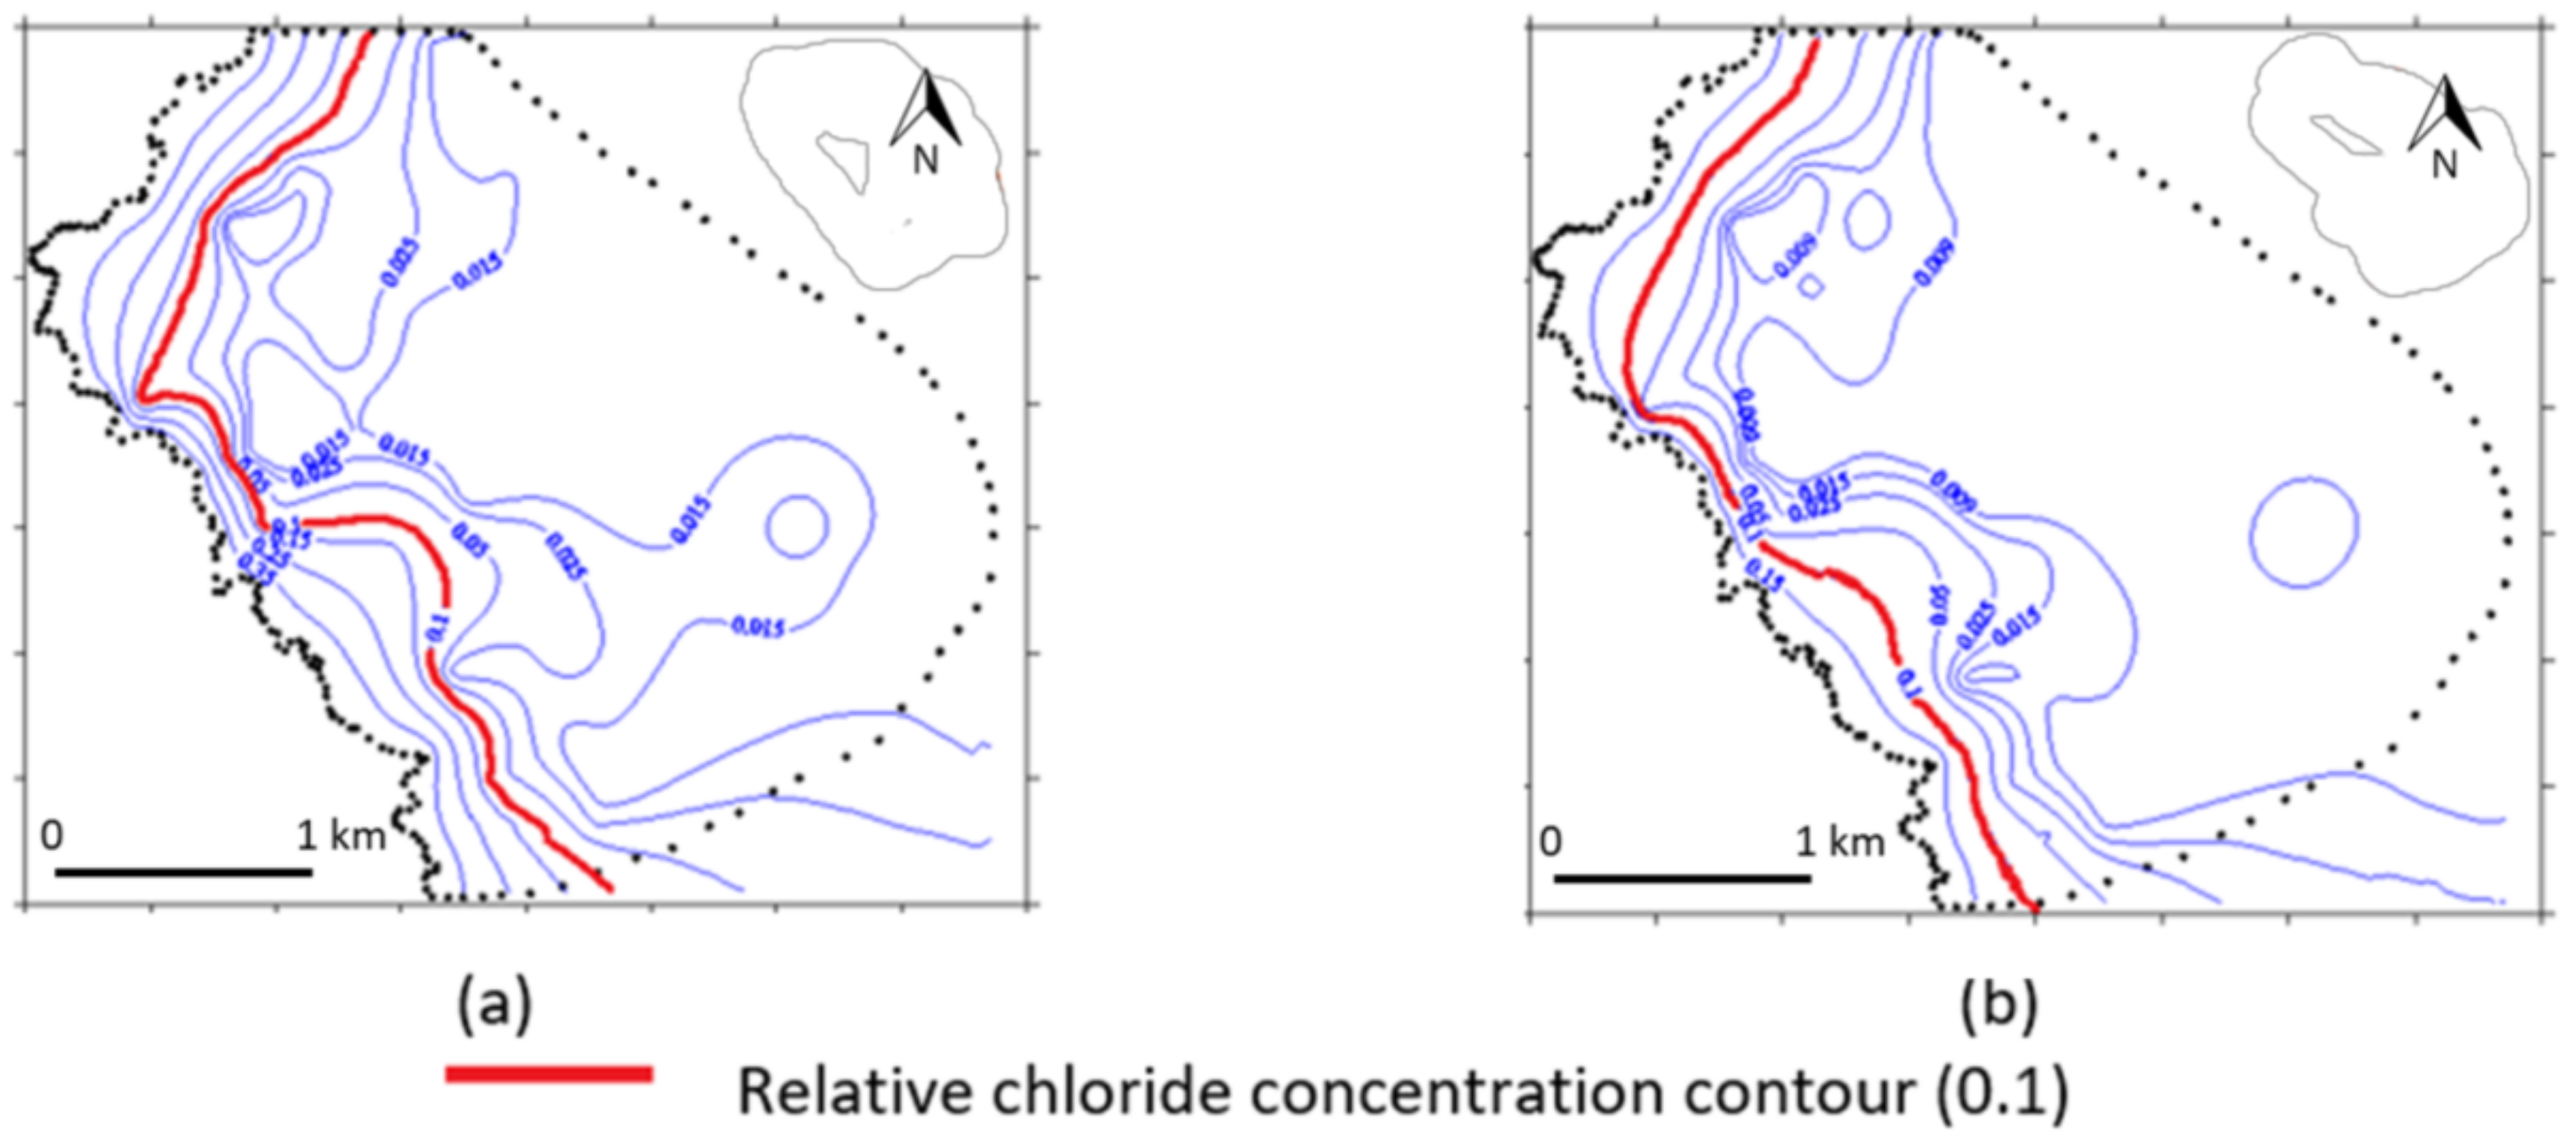
| Observations used for model calibration/validation | Groundwater level Chloride concentration |
| Key hydrogeological parameter used for model calibration | K = 0.5–10 m/day |
| Percentage variation of annual precipitation between the base hydrological year and the predicted extreme dry year (averaged over the selected RCMs and RCPs) | ΔP = −45.9% |
| Pegeia Aquifer | |
| Area | ~17 km2 |
| Observations used for model calibration/validation | Groundwater level Chloride concentration |
| Key hydrogeological parameter used for model calibration | K = 0.03–4 m/day |
| Percentage variation of annual precipitation between the base hydrological year and the predicted extreme dry year (averaged over the selected RCMs and RCPs) | ΔP = +33.7% |
| Acheleia Aquifer | |
| Area | ~85 km2 |
| Observations used for model calibration/validation | Groundwater level |
| Key hydrogeological parameter used for model calibration | K = 0.5–25 m/day |
| Percentage variation of annual precipitation between the base hydrological year and the predicted extreme dry year (averaged over the selected RCMs and RCPs) | ΔP = −1.3% |
| Class | SPEI |
|---|---|
| Extremely wet | SPEI ≥ 2 |
| Severely wet | 1.5 ≤ SPEI < 2 |
| Moderately wet | 1 ≤ SPEI < 1.5 |
| Normal | −1 ≤ SPEI < 1 |
| Moderately dry | −1.5 < SPEI ≤ −1 |
| Severely dry | −2 < SPEI ≤ −1.5 |
| Extremely dry | SPEI ≤ −2 |
| Aquifer of Interest | Calibration Period/Validation Period | Statistical Measures | |
|---|---|---|---|
| Groundwater Level | Relative Chloride Concentrations | ||
| Kiti | 2008–2010/2006–2017 | Mean error: −0.74 m | Mean error: 0.02 |
| Mean absolute error: 0.93 m | Mean absolute error: 0.025 | ||
| Root mean square error: 1.58 m | Root mean square error: 0.028 | ||
| Pegeia | 2003–2008/2008–2017 | Mean error: +1.29 m | Mean error: −0.012 |
| Mean absolute error: 1.38 m | Mean absolute error: 0.018 | ||
| Root mean square error: 1.84 m | Root mean square error: 0.021 | ||
| Acheleia | 2008–2010/2010–2017 | Mean error: −1.7 m | |
| Mean absolute error: 2.3 m | |||
| Root mean square error: 3.8 m | |||
| Area | Scenario | 1972–2000 | 2031–2060 | ||
|---|---|---|---|---|---|
| PET (mm/Month) | SPEI | PET (mm/Month) | SPEI | ||
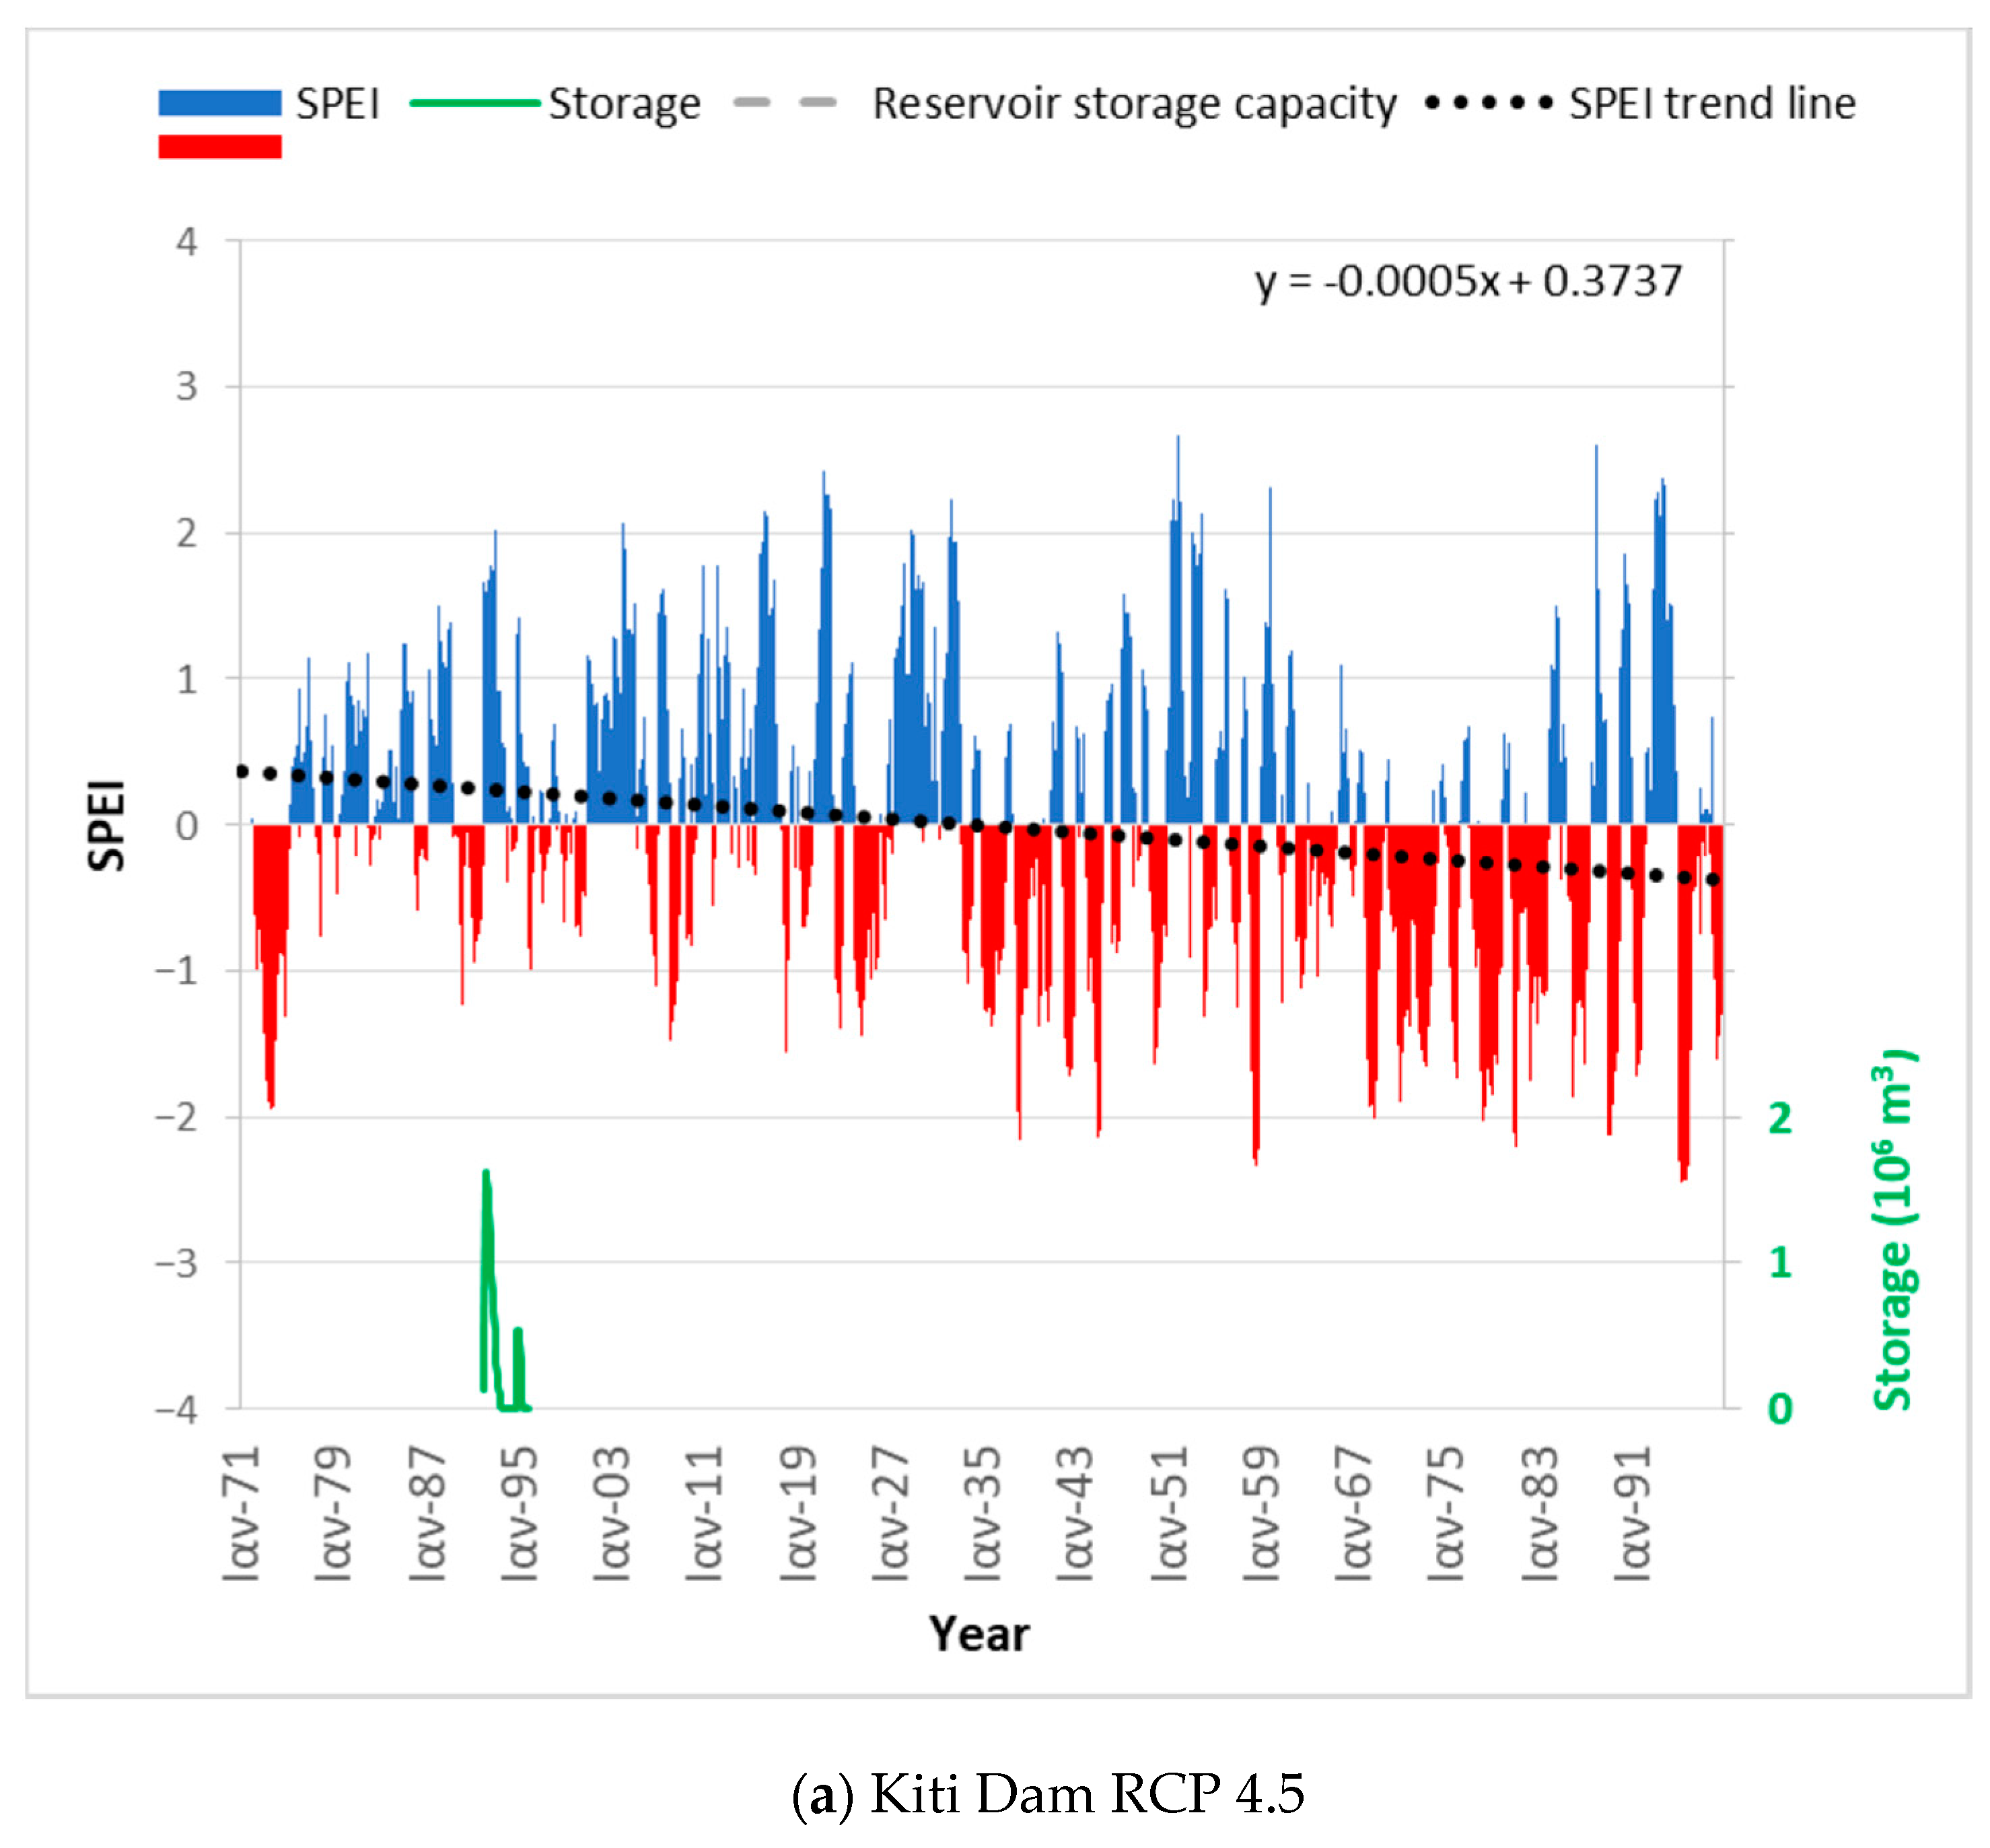
| Kiti Dam | 4.5 | 110 | 0.12 | 125 | −0.04 |
| Kiti Dam | 8.5 | 110 | 0.33 | 127 | −0.10 |
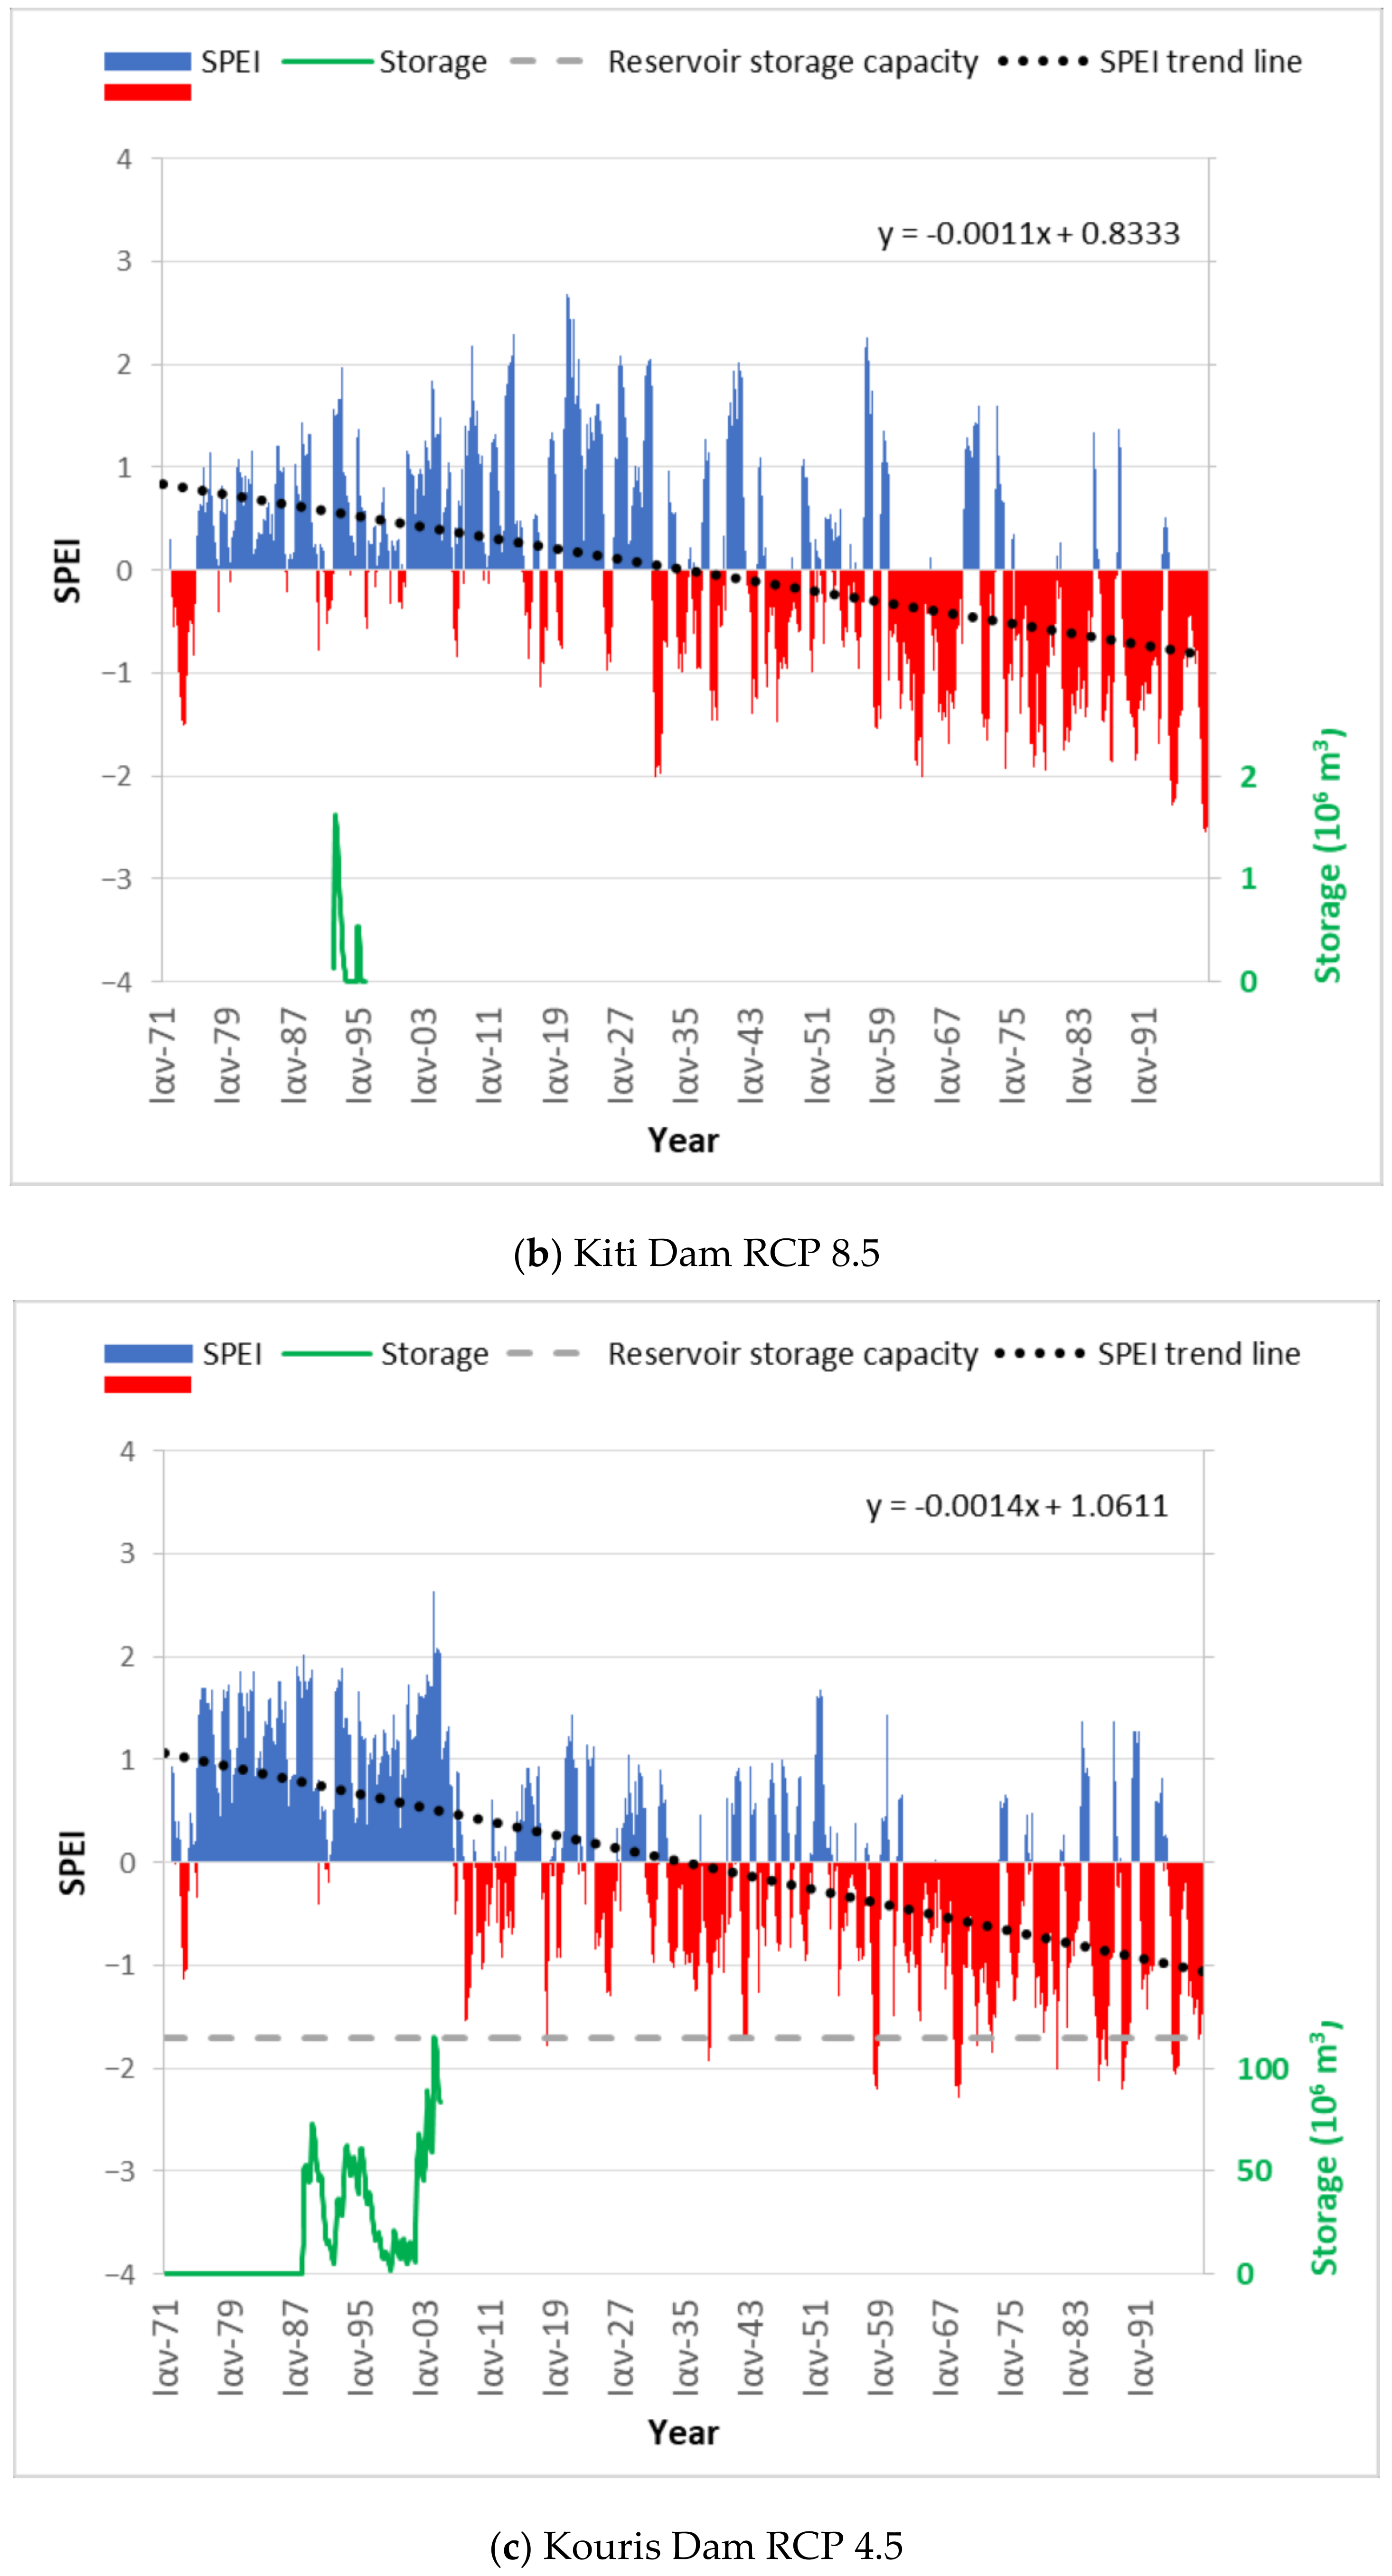
| Kouris Dam | 4.5 | 101 | 0.98 | 117 | −0.27 |
| Kouris Dam | 8.5 | 101 | 1.02 | 120 | −0.29 |
| Asprokremos Dam | 4.5 | 101 | 0.70 | 118 | −0.14 |
| Asprokremos Dam | 8.5 | 101 | 0.80 | 120 | −0.13 |
© 2020 by the authors. Licensee MDPI, Basel, Switzerland. This article is an open access article distributed under the terms and conditions of the Creative Commons Attribution (CC BY) license (http://creativecommons.org/licenses/by/4.0/).
Share and Cite
Papadopoulou, M.P.; Charchousi, D.; Spanoudaki, K.; Karali, A.; Varotsos, K.V.; Giannakopoulos, C.; Markou, M.; Loizidou, M. Agricultural Water Vulnerability under Climate Change in Cyprus. Atmosphere 2020, 11, 648. https://doi.org/10.3390/atmos11060648
Papadopoulou MP, Charchousi D, Spanoudaki K, Karali A, Varotsos KV, Giannakopoulos C, Markou M, Loizidou M. Agricultural Water Vulnerability under Climate Change in Cyprus. Atmosphere. 2020; 11(6):648. https://doi.org/10.3390/atmos11060648
Chicago/Turabian StylePapadopoulou, Maria P., Despoina Charchousi, Katerina Spanoudaki, Anna Karali, Konstantinos V. Varotsos, Christos Giannakopoulos, Marinos Markou, and Maria Loizidou. 2020. "Agricultural Water Vulnerability under Climate Change in Cyprus" Atmosphere 11, no. 6: 648. https://doi.org/10.3390/atmos11060648
APA StylePapadopoulou, M. P., Charchousi, D., Spanoudaki, K., Karali, A., Varotsos, K. V., Giannakopoulos, C., Markou, M., & Loizidou, M. (2020). Agricultural Water Vulnerability under Climate Change in Cyprus. Atmosphere, 11(6), 648. https://doi.org/10.3390/atmos11060648