Abstract
This study focuses on the quantification of climate change (CC) effects on agricultural water availability in Cyprus. Projections of climatic variables, based on Regional Climate Models (RCMs) forced by the Representative Concentration Pathways (RCPs) 4.5 and 8.5, were used as CC driving forces affecting water availability. Groundwater flow models were developed for specific high-interest agricultural areas in Larnaca and Paphos to assess the CC impacts on these groundwater systems, while the Standardized Precipitation–Evapotranspiration Index (SPEI) analysis was also adopted, for the first time in Cyprus, to assess future trends of water reservoir storage under the projected climatic conditions. Considering the current cultivation and irrigation practices, a decrease in groundwater level close to 1 m and further inland seawater intrusion in Larnaca aquifers are expected, while in Paphos’ aquifers, the predicted water table fluctuations are not significant. Additionally, SPEI values at the Asprokemos and Kouris dams are correlated with water storage measurements, showing that a SPEI downward trend observed in these reservoirs could set off an alarm to the water authorities with respect to water availability as more severe drought events are expected in the future. The expected pressure on surface waters imposes the need for an improved water management plan that will not depend on the further exploitation of groundwater.
1. Introduction
Recent anthropogenic greenhouse gas (GHG) emissions, mainly driven by population growth, economic activity, lifestyle, energy and land use patterns, are the highest in current history, leading to climate changes that affect human and natural systems [1]. The agricultural sector is threatened by climate change due to changing precipitation and temperature patterns and especially due to the foreseen increase in the frequency and the severity of extreme weather events, such as droughts and floods [2]. The impacts of climate change on agriculture are an additional pressure on top of the world’s increasing population, which is expected to modify agricultural productivity, resulting in substantial threats to food security [3,4]. In 2015, the United Nations Member States, having recognized the potential threats imposed by climate change on food security, included in the 2030 Agenda for Sustainable Development, Goal 2: “End hunger, achieve food security and improved nutrition and promote sustainable agriculture”. This issue further affects the sustainability and happiness of people in areas suffering from water scarcity and drought. Eastern Mediterranean countries and especially Cyprus are among the most vulnerable to climate change as it is expected to face intense impacts on agricultural production [5]. Cyprus has already faced periods of drought that have affected water availability and drought indices, such as the Standardized Precipitation Index (SPI), have been adopted to monitor drought events [6].
Even though the agricultural sector does not play a main role in the economy of Cyprus, as it contributes approximately 2% of country’s GDP and only 2% of the total employment [7], agriculture still remains the most water-intensive sector of Cyprus, exceeding more than 60% of the total annual freshwater demand [8]. Considering the fact that water resources in Cyprus are already under stress, due to frequent and extended periods of drought, overexploitation and seawater intrusion, the predicted additional pressure imposed by climate change requires immediate action towards the sustainable management of agricultural water [9].
Several studies have dealt with the assessment of climate change impacts on fresh water resources and, in particular, groundwater resources. A widely applied methodology to assess groundwater vulnerability focuses on using climatic downscaled variables as inputs to groundwater flow numerical models. Climate change effects on aquifer water conditions are case-oriented, depending on numerous parameters, such as the climatic variables, hydrogeology, land uses, adopted water management practices and agricultural infrastructure. Klaas et al. [10] recently assessed the sustainability of Oemau spring in Rote Island, Indonesia for the period 2020–2090 based on four downscaled climatic variables (minimum/average/maximum temperature and precipitation), used as inputs to a MODFLOW model showing that a reduction in recharge and spring discharge up to 24.57% and 22.80%, respectively, is expected under the various climatic scenarios. A similar methodology was also followed in Toyserkan basin, Iran, showing a water table rise from 2015 to 2025, which is heightened by increasing irrigation efficiency [11]. The SEAWAT algorithm has also been used to estimate climate change impacts on groundwater systems of the Central Huai Luang Basin in Northeastern Thailand. Six future climate scenarios obtained from the SEACAM (Southeast Asia Climate Analyses & Modeling) and CanESM2 (Canadian Earth System Model) models were downscaled to investigate the potential climate change impacts in the basin. For all future climate conditions studied, groundwater availability is expected to face an additional stress due to the predicted drawdown of the groundwater table and increasing salinity [12].
Surface water bodies’ vulnerabilities to climate change are considered to be more obvious and direct than groundwater resources [13]. Drought events impact water supply and especially surface water availability in reservoirs. The Standardized Precipitation–Evapotranspiration Index (SPEI) has been reported to correlate climate variation with storage reservoir [14]. The SPEI is a drought index that is an extension of the widely used SPI, capturing not only precipitation but also temperature fluctuations embedded into potential evapotranspiration (PET) [15]. The SPEI has been lately used in order to assess drought evolution under climate change pressures. Gao et al. [16] assessed climate change impacts on drought events at the Loess Plateau (China) by estimating SPEI evolution under Representative Concentration Pathways (RCP), 2.6 (very low greenhouse gas emissions pathway) and 8.5 (high greenhouse gas emissions pathway). Based on their analysis, the local agricultural and ecological systems will benefit, due to the shift to wetter climate conditions in the future. However, the uncertainties associated with the applied downscaling method pointed out the need for higher resolution in the downscaling process. Marcos-Garcia et al. [17] developed a framework to assess climate change impacts on drought through the combination of multiple drought indices. The framework was applied and assessed in a Mediterranean basin. The SPEI was compared with SPI and identified more intense drought events than SPI. Although the SPEI can be used as a tool for drought and surface water availability monitoring, uncertainties may arise due to the PET estimation method applied or the climatic projections’ downscaling methods [16,17].
The present study assesses climate change impacts on agricultural water availability in Cyprus. More specifically, projections of climatic variables, based on Regional Climate Models (RCMs) forced by the RCP 4.5 and RCP 8.5, were used as climate change driving forces affecting water availability. Groundwater flow models were developed for specific areas of high agricultural interest in Cyprus that suffer from groundwater availability and/or salinization problems (e.g., Kiti aquifer) in order to assess climate change impacts on groundwater resources, while SPEI analysis was adopted, for the first time in Cyprus, to assess the future trend of water reservoirs’ storage under the projected climate change conditions. In this analysis, the use of SPEI was preferred instead of the widely used SPI in order to capture both temperature and precipitation variability effects on drought events [18,19].
The paper is organized as follows: in Section 2, a detailed description of the implementation areas is presented, followed by the climate change assessment methodology in Section 3 and the assessment results on agricultural water availability in Section 4. Finally, a comparable analysis and discussion are provided in Section 5, followed by the final conclusions in Section 6.
2. Cyprus Island
According to Zittis [20], Cyprus is characterized, following the Köppen–Geiger climate classification, by a warm temperate climate with hot and dry summers, typical for the Mediterranean region, while part of the island is classified as hot and arid. The wet season extends from November to March, with most of the rain (approximately 60%) falling between December and February. The mean annual precipitation increases up the south windward slopes to the top of the Troodos, ranging from 450 mm to 1100 mm, while on the downwind slopes precipitation decreases steadily to the north and east to approximately 300–350 mm in the central plain and the flat southeastern parts of the island [21,22]. Several studies on observed climatic changes focused on the Mediterranean region have revealed that, during the last several decades, the entire island of Cyprus tends to experience a warmer climate with a decreasing trend in annual precipitation, while drier conditions are identified mainly in the eastern and southern parts of the island [22,23,24,25,26]. According to Pashiardis and Michaelides [22], the mean annual rainfall in the period 1931–1960 was 524 mm, while for the periods 1961–1990 and 1971–2000 it was about 500 mm and 460 mm, respectively.
For almost four years at the beginning of the millennium, Cyprus faced a period of low precipitation that set off an alarm with respect to its fresh water availability, especially for aquifers that are traditionally the major water source for irrigation. The island’s surface water bodies have also been under pressure as the lowest water storage volumes were recorded in 2008. During that year of water crisis, water was shipped in from Greece using tankers and the Cypriot government was forced to apply emergency measures [8]. Groundwater resources in Cyprus are overexploited by about 40% of the sustainable extraction [27]. As a result, lowering water tables are observed in 66 aquifers, while coastal aquifers also suffer from seawater intrusion [8].
In order to cope with the increasing irrigation and domestic water demand, the prolonged periods of drought and water shortage, the Cypriot Government has proceeded in the construction and operation of important water infrastructure, including water reservoirs and networks to increase the water storage capacity and water supply network coverage [8]. Nowadays, in Cyprus there are more than 100 water reservoirs across almost all of the rivers of the country [28]. The frequent droughts have affected groundwater resource sustainability and also, the construction of dams has reduced the recharge rates of connected aquifers in the downstream areas. Therefore, aquifers in Cyprus are characterized as being under severe water stress. In order to meet water demand and prevent further deterioration in the quantity and quality of the existing fresh water resources, two non-conventional sources of water have been added into the water supply network of Cyprus: the desalinated and the recycled/treated water. The latter is used for the irrigation of agricultural crops and green areas, while desalinated water is used for drinking purposes [8].
2.1. Aquifers of Interest
In order to evaluate climate change impacts on Cyprus’ groundwater systems, an aquifer assessment was performed in three representative agricultural aquifers, Kiti, Pegeia and Acheleia, which suffer from groundwater quantity and/or quality deterioration problems, as shown in Figure 1.
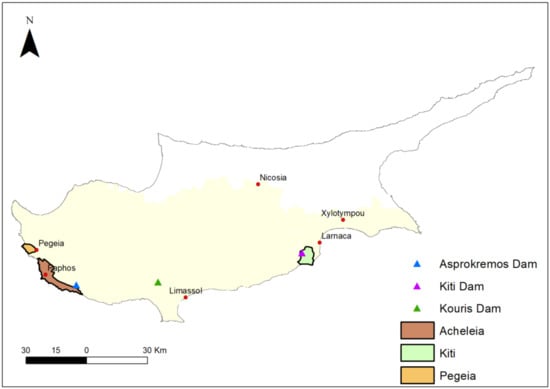
Figure 1.
Aquifers of interest and SPEI implementation locations.
The Kiti aquifer, known as the CY-3 groundwater system [8], is located in South Cyprus, in the Larnaca district, it is crossed by the Tremithios River and it is adjacent to the Larnaca salt lakes. The impervious base of the aquifer consists mainly of Pliocene marls and the sediments consist of Pleistocene marine terrace deposits, such as silts, gravel and sands, whereas the aquifer sediments along the Tremithios riverbed consist of alluvial river deposits [29,30]. The area is mostly covered by agricultural land, although tourist facilities are also developed along the coast [29]. In 2010, annual crops (e.g., barley, wheat, potatoes, tomatoes) were cultivated in the great majority of the Kiti agricultural area (around 90% of the total cultivated area) followed by a small region of perennial crops (e.g., grapes and olives) [31]. The Kiti irrigation scheme, part of the Southern Conveyor Project (SCP), was put into operation in early 2000s. As a result, a significant part of irrigation water demand in Kiti (~1200 ha of irrigation land) is covered by the SCP, which collects and stores surplus water flowing to the sea in order to cover domestic water supply and irrigation [8]. However, the over-exploitation of groundwater resources in the area during the past decades has led to the salinization of the coastal aquifer. This is the reason that groundwater abstraction, mainly for irrigation, has shown a downward trend, ranging from an average of 3 × 10⁶ m3/year in the 1980s to 1.8 × 10⁶ m3/year by mid-1990s [30] and to 1.3–1.5 × 10⁶ m3/year in recent years [32].
The Pegeia aquifer, known as the CY-13 groundwater system, is a limestone aquifer in the western part of Cyprus. The agricultural area of the Pegeia Municipality is almost equally covered by annual (e.g., barley) and perennial crops (e.g., banana trees, citrus and grapes) [31] and it is mostly irrigated by the Paphos Irrigation Project (PIP), that covers irrigation needs at the Pegeia and Acheleia agricultural areas (~5000 ha). The Pegeia aquifer is a semiconfined coastal groundwater system developed in a karstified limestone reef. The aquifer outcrops in its middle part, and its western part is confined between impermeable marls; however, there is also a characteristic case of a local seawater intrusion phenomenon due to over-pumping [29]. Aquifer thickness ranges from 20 m in the south and up to 300 m towards the northwest. The impervious base of the aquifer consists mainly of Palaeogene (Lefkara formation) marls, chalks and chalky marls. The ceiling of the confined part of the aquifer along the coastal zone consists of Plio/Pleistocene marls and sandy marls of the Athalassa formation [29]. Along the coastline, the piezometric heads fluctuate around the mean sea level. Due to the small transmissivities observed from bore logs in this area, a piezometric dome with hydraulic heads well above sea level develops during the wet season of wet hydrologic years. Such a piezometric dome, located between the sea and the main agricultural area, acts as a natural hydraulic barrier to seawater intrusion. However, this piezometric dome is only present during wet years when the threat of seawater intrusion is reduced.
The Acheleia aquifer, widely known as the Paphos Coastal aquifer, is located at the western coastline of Cyprus. Almost half of the agricultural land is covered by annual crops and the rest by trees, grapes and fallow land and it is irrigated by PIP [31]. This aquifer is characterized as satisfactory in terms of water quality and quantity, even though its northwestern part belongs to a highly nitrate-vulnerable zone [33]. However, over-pumping during drought periods, local salinization phenomena and the potential for nitrate pollution problems point out the need for an improved water management plan under the pressure of climate change. The aquifer is mainly developed in the calcarenites of the Pleistocene Athalassa formation, altering with marls of the same formation. In the southeastern part of the area, the alluvial deltas of the Diarizos, Xeropotamos and Ezousa rivers are developed [29].
2.2. SPEI Estimation Locations
In the current analysis, the SPEI is estimated at three important dams of Cyprus: the Asprokremmos, Kouris and Kiti dams, as shown in Figure 1. The Kiti dam (Tremithos), located at the northern part of the Kiti aquifer in the Larnaca District, is an earth-fill dam, constructed in 1964 with a 1.614 × 10⁶ m3 water capacity that covers part of the irrigation demand of the surrounding area [8]. the Kouris dam was constructed in 1988 and is located in the Limassol District as part of the SCP, with a water storage capacity of 115 × 106 m3. The actual storage of the dam has ranged from 0.5 to 115 × 106 m3 [8]. The water behind the Kouris dam covers part of the irrigation demand at the Kiti aquifer. The Asprokremmos dam is also an earth-fill dam, located 16 km east of the city of Paphos, constructed in 1982 across the Xeros river [8]. It has a water storage capacity of 52.375 × 10⁶ m3 and is used for irrigation purposes in Pegeia and Acheleia crop fields as it is part of PIP. The reservoir rarely reaches its storage capacity limits (in 1988, 1989, 2004, 2012, 2013, 2019 and 2020), while the lowest storage volumes have been recorded in 2001 and 2008 (~2.5 × 10⁶ m3) (personal communication with local water authorities).
3. Methodology
3.1. Climatic Data
The climatic variables which were used as inputs to simulate current climate conditions were obtained by the ΕU project ENSEMBLES gridded observations dataset, namely E-OBS [34], which was derived through an interpolation procedure [34] from the European Climate Assessment & Dataset (ECA&D) station data series [35]. In the present study, temperature and precipitation data at a daily time-step and spatial resolution of 0.25° were used. The E-OBS dataset was selected based on its spatial (the entire island of Cyprus was covered) and temporal (1950–2014) coverage, which makes it ideal for an approximate evaluation of RCM-simulated temperature and precipitation characteristics over Cyprus. In addition, Retalis et al. [36] compared E-OBS precipitation against rain gauge data over Cyprus and found that E-OBS precipitation estimates were well fitted, although they were influenced by the variation of elevation. Climate change impacts on Cyprus’ water resources were assessed using future climate projection scenarios, including precipitation and potential evapotranspiration under RCP 4.5, which assumes the imposition of emissions mitigation policies and RCP 8.5, which assumes the highest greenhouse gas emissions. In this analysis, the daily air temperature, precipitation and potential evapotranspiration outputs of two GCM/RCM pairs, developed within the frame of the European Coordinated Regional Climate Downscaling Experiment initiative (EURO-CORDEX) at a spatial resolution of about 12 km, were used. These pairs constituted the RCA4 regional climate model of the Swedish Meteorological and Hydrological Institute (SMHI) [37], driven by two different global climate models: (a) the Hadley Centre Global Environmental Model, version 2 Earth System called HadGEM-ES (HadGEM) [38,39] of the Met Office Hadley Centre (MOHC), hereafter MOHC-RCA4; (b) the Max Planck Institute for Meteorology model MPI-ESM-LR [40], hereafter MPI-RCA4. These data were further downscaled to provide high-resolution forcing for the areas of interest from the 12 km into a 2 km grid, using the thin plate spline-3D interpolation technique [41]. Present day simulations cover the period 1971–2000 were used here as references for comparison purposes with future projections for the period 2031–2060 under RCP 4.5 and RCP 8.5. It should be noted that, for the selection of these models, an extensive evaluation of four GCM/RCM pairs against the gridded observational dataset of E-OBS (v17) for the period 1971–2000 was performed, and only the MPI-RCA4 and MOHC-RCA4 were found to adequately reproduce the climatic conditions for the study areas [42].
Based on the aforementioned climate change impact analysis on the climate variables for the period 2031–2060, the annual maximum temperature is expected to increase by about 1.6 °C and 2.1 °C in relation to the simulated period 1971–2000 under RCP 4.5 and 8.5, respectively. Projected changes in annual precipitation are less pronounced, with reductions of less than 16–20% under both scenarios. The results of this analysis have been used as the driving forces to assess future water resources conditions, mainly water availability in Cyprus.
3.2. Εstimation of Future Groundwater Resources Availability under Climate Change Conditions
In order to evaluate the climate change impacts on the three representative agricultural aquifers in Cyprus, groundwater flow and contaminant transport simulation models were developed using Visual MODFLOW Flex as a processor for the MODFLOW and SEAWAT groundwater simulation algorithms [43]. SEAWAT, a coupled version of MODFLOW 2000 [44] and MT3DMS [45], is used to simulate the variable density effects on transient groundwater flow [46]. The required hydrologic data and hydrogeological characteristics were derived from the literature data or obtained by contacting the local authorities (e.g., Water Development Department, Agricultural Research Institute), whereas historic meteorological data were derived from the E-OBS gridded dataset [32,47].
The estimation of aquifer recharge by means of infiltration and precipitation also considered evapotranspiration, surface runoff processes and the permeability of geological formations in the aquifers of interest. Irrigation return flow, mainly during the irrigation season, was estimated and included into the model as additional recharge. Pumping rates were estimated based on previous reports and data obtained from the local farmers [32]. The developed models were calibrated for specific hydrogeological variables (e.g., hydraulic conductivity, storage coefficient, etc.) in transient conditions, based on historic data series of hydraulic head measurements and for the cases of Pegeia and Kiti aquifers on chloride concentrations as well, as shown in Table 1. The models’ validation was based on the additional available historic data and on data derived from field campaigns performed in the frame of the LIFE ADAPT2CLIMA “Adaptation to Climate Change Impacts on the Mediterranean Islands’ Agriculture” project during June 2016 and September 2017 to obtain groundwater level and quality measurements from selected boreholes [32].

Table 1.
Models’ key characteristics.
After model calibration and validation, a characteristic mean hydrological (October to September) year was identified for each aquifer, which was a moderate hydrological year in terms of precipitation rate, approximating its current state regarding groundwater level and seawater intrusion front. This characteristic hydrological year is hereafter called the base hydrological year. Finally, a series of simulation runs for a predicted extreme dry hydrological year, based on the selected RCMs and RCPs (4.5 and 8.5) was performed in order to assess climate change impacts on the three representative groundwater systems under study. An extreme dry hydrological year is defined as the hydrological year with the lowest total precipitation as projected for the future period 2031–2060 for each model and scenario.
As the coastal part of the Kiti aquifer suffers from seawater intrusion [32,48], the SEAWAT algorithm was employed to simulate variable–density groundwater flow. Historic groundwater level and chloride concentrations were available from the Water Development Department at various boreholes in the area for the period 1982–2015, while groundwater level and water quality measurements at selected boreholes were obtained during two field campaigns performed in the frame of the LIFE ADAPT2CLIMA project during June 2016 and September 2017. In order to simulate recharge from upstream carbonates, a lateral flux boundary condition was imposed (Neuman boundary). Neuman boundary conditions were also imposed along the coastline to simulate sea level heads and potential seawater intrusion. All other model boundaries were defined as no flow boundaries. Chloride concentrations are expressed relative to the seawater chloride concentration. Therefore, the relative chloride concentration of 1 is equal to 22 g/L and expresses seawater chloride concentration [32]. The developed groundwater model was calibrated for the hydrological years 2008–2009 and 2009–2010. The observed hydraulic head measurements and chloride concentrations for the period up to 2017 were used for model validation.
As with the Kiti aquifer, in order to assess climate change impacts on the Pegeia aquifer, the SEAWAT algorithm was employed to simulate seawater intrusion effects. Along the coastline boundary, to simulate sea level heads and potential seawater intrusion, Neuman boundary conditions were imposed. Additionally, as chloride concentrations are expressed relative to seawater (i.e., 22 g/L), the relative chloride concentration along the coastline was set equal to 1. In order to simulate the Pakhna formation protective boundary “lid” near the coast, which prevents sea water intrusion, zones of low hydraulic conductivity were defined. Along the northeastern boundary, a lateral flux boundary was imposed corresponding to recharge from water bearing upstream of the Lefkara (pelagic marls and chalks) formation. All of the other model boundaries were defined as no flow boundaries [32]. The model calibration and validation were based on historical hydraulic head and chloride concentration data series, available from the Water Development Department, and data on groundwater level and chloride concentration, obtained during the LIFE ADAPT2CLIMA field campaigns. Specifically, the model calibration under transient conditions was performed for the hydrological years 2003–2004 to 2007–2008, while data for the period 2008–2017 were used for model validation [32].
In the Acheleia (Paphos) aquifer, the groundwater flow was simulated using the MODFLOW model, as the impervious base of the coastal aquifer is generally above the mean sea level and the coastal area faces only local salinization phenomena to a very limited extent. At the western part of the aquifer, the shoreline consists of a model’s boundary condition. Apart from direct infiltration, return flows from irrigation were considered as additional inflow to the groundwater system. The calibration of the developed model under transient conditions was based on historical hydraulic head measurements available from the Water Development Department for the hydrological years 2008–2009 and 2011–2012 [32]. The validation of the model was performed up to 2017, also using the groundwater level measurements obtained during the ADAPT2CLIMA field campaigns.
3.3. Εstimation of SPEI Evolution in Cyprus under Climate Change Conditions
The SPEI uses a simple water balance concept based on the precipitation (P) and PET for each month i, as shown in Equation (1), in order to identify if there is a water surplus or deficit at the corresponding month [14]. Consequently, SPEI values lower than zero indicate dry periods [15]. A more detailed categorization of the SPEI values is provided in Table 2.
Di = Pi − PETi,

Table 2.
Classification of SPEI values [51].
The calculated Di values are aggregated at different time scales ranging from 1 to 48 months. Medium time scales can lead to SPEI correlation with reservoir storages and discharge [49]. Therefore, in this analysis, the 12 month time scale was selected. According to Vicente-Serrano et al. [15], the most suitable statistical distribution to model the D series is the Log-logistic distribution. The probability distribution function of D, according to the Log-logistic distribution, is the following, Equation (2):
where α, β and γ are scale, shape and origin parameters, respectively for γ > D < ∞.
SPEI can be obtained as the standardized values of F(x) following the approximation of Abramowitz et al. [50]:
where,
and P, being the probability of exceeding a determined D value, is given as P = 1 − F(x), while the constants are C0 = 2.515517, C1 = 0.802853, C2 = 0.010328, d1 = 1.432788, d2 = 0.189269, d3 = 0.001308. The average value of SPEI is 0 and the standard deviation is 1.
In this analysis, SPEI was estimated for the period 1972–2098 using the SPEI R Package [52]. For the reference period 1972–2004, the SPEI estimation was based on climatic variables (minimum and maximum temperature and precipitation data) obtained from the EOB-S dataset [34]. Specifically, minimum and maximum temperature data are used to estimate PET based on the Hargreaves method [53]. For the period 2005–2098, climatic data (precipitation and PET) were produced by the RCM MOHC-RCA4, forced by the RCP 4.5 and 8.5 to the SPEI at the selected highly important locations in Cyprus. It is noted that the RCM PET estimations were based on the PET method proposed by FAO [54]. The RCM MOHC-RCA4 was selected as it has been proven to more adequately represent the evolution of salinization phenomenon, a major threat in most of the coastal aquifers of Cyprus.
Additionally, in order to ensure that the SPEI can be correlated with reservoir storages [49], also in the case of Cyprus, the cross correlation function was used to determine whether there is a relationship between the estimated SPEI values and the measured water volumes stored in the dams of interest. As adequate water volume measurements were available only for the Asprokremmos and Kouris dams, the correlation was explored only for the cases of these two dams, for the period 1988–2004. To determine whether a significant relationship exists between the two data series (SPEI and storage), the absolute correlation value should be greater than where n is the number of observations and k is the time lag.
4. Results
4.1. Assessment of Climate Change Impacts on Groundwater Resources in Cyprus
The model developed to simulate groundwater flow in the Kiti aquifer successfully simulated groundwater levels and the extent of seawater intrusion, as shown in Table 3 [32,47]. Based on the results obtained from the different simulation runs, performed for the assessment of climate change impact on the groundwater resources, an additional decline of the water table close to 1 m was observed during the dry period of a predicted dry year for both the RCPs and RCMs, as shown in Figure 2. Concerning climate change impacts on salinization, the indicative results are presented in Figure 3. Specifically, the spatial distributions of chloride concentrations for (a) the base hydrological year (at the end of dry season) and (b) for the predicted extreme dry hydrological year, as foreseen based on MPI-RCA4 model and RCP 4.5, are presented for comparisons reasons. As shown in Figure 3a,b, additional saltwater intrusion is predicted, in agreement with the estimated groundwater level fluctuations.

Table 3.
Validation metrics of simulated groundwater levels and chloride concentrations at monitoring boreholes.
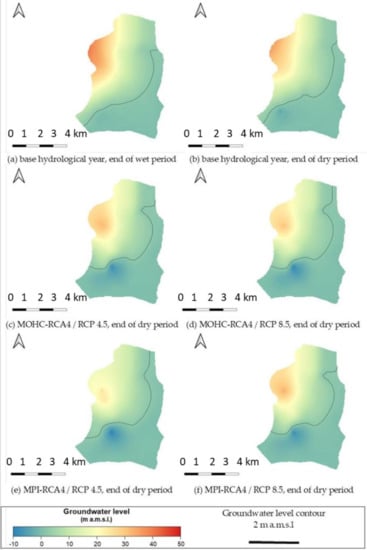
Figure 2.
Groundwater level in Kiti aquifer—Results of numerical simulations.
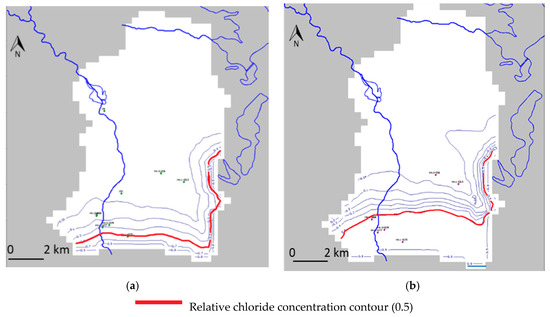
Figure 3.
Results of numerical simulations for Kiti pilot area: Relative chloride concentrations (a) for the base hydrological year (end of dry period), and (b) for extreme dry hydrological year, based on the MPI- RCA4 model under the RCP 4.5 scenario (end of dry period). Relative chloride concentration of 1 expresses the seawater chloride concentration (22 g/L). [32].
Figure 4 presents the results of the simulation runs at the end of the dry period (end of September) for the base hydrological year and the future year under both RCPs for the case of the Pegeia aquifer. Based on the analysis of extreme dry climatic projections, produced by the MPI-RCA4 and the MOHC-RCA4 models, no additional pressure in groundwater availability is foreseen for both RCP 4.5 and 8.5. Climatic projections for meteorological variables, produced by the MPI-RCA4 and the MOHC- RCA4 models, show an increase in precipitation, even for an extreme dry hydrologic year, compared to that of an average historic hydrological year. Therefore, an average increase in the groundwater levels of 0.6–2.3 m, is predicted for the dry season of a predicted extreme dry hydrologic year (compared to an average hydrological year). The largest increase in groundwater levels (2.3 m) is predicted for the RCP 4.5 scenario under the MPI-RCA4 model. For this case, a piezometric depression of ~−2.5 m is predicted for the central part of the agricultural zone. Concerning climate change impacts on salinization, the indicative results are presented in Figure 5. Specifically, the spatial distribution of chloride concentrations for (a) the base hydrological year (at the end of dry season), and (b) for the predicted extreme dry hydrological year, based on the MPI-RCA4 model and RCP 4.5, are presented for comparisons reasons. As it can be concluded from Figure 4, it is predicted that seawater intrusion is slightly reduced under the RCP 4.5 scenario, in agreement with the estimated groundwater level spatial distribution, while predicted future chloride concentrations show an approximate 2-fold decrease.
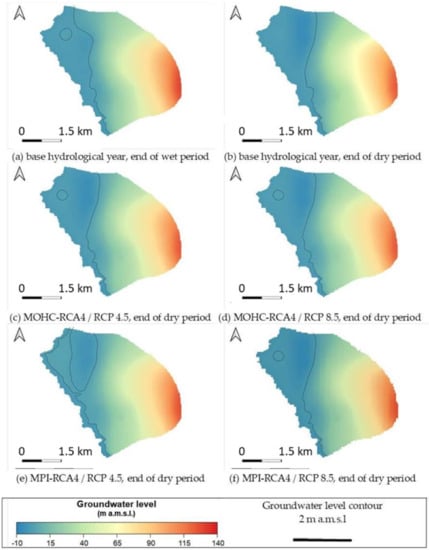
Figure 4.
Groundwater level in Pegeia aquifer—Results of numerical simulations.
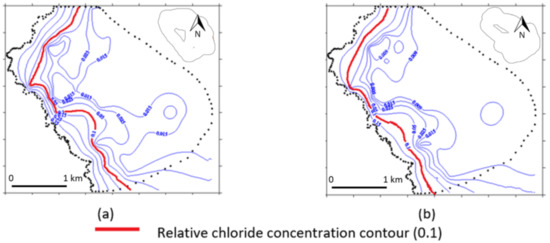
Figure 5.
Results of numerical simulations for Pegeia pilot area: Relative chloride concentrations (a) for the base hydrological year (end of dry period), and (b) for extreme dry hydrological year, based on the MPI-RCA4 model under the RCP 4.5 scenario (end of dry period). Relative chloride concentration of 1 expresses the seawater chloride concentration (22 g/L).
The simulation results of groundwater flow in the Acheleia aquifer are presented in Figure 6. As for the case of Pegeia, groundwater level variation is not significant during a future dry year both for RCP 4.5 and RCP 8.5, with respect to the base hydrological year. In particular, the mean water table fluctuation at the end of the dry period of the future extreme dry year ranges from −0.5 m to 0.2 m in comparison to the mean water table at the end of the dry period of the base year.
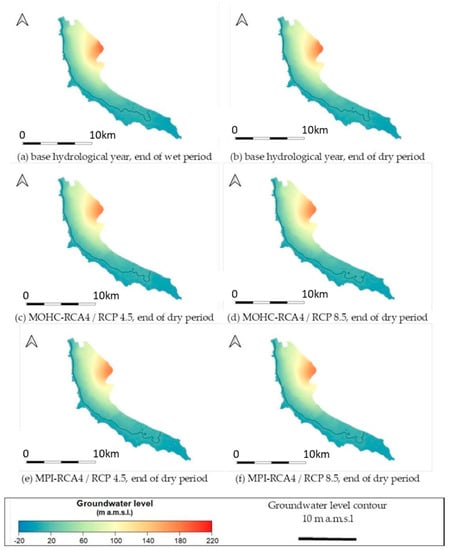
Figure 6.
Groundwater level in Acheleia aquifer—Results of numerical simulations at the end of dry period.
4.2. Assessment of Climate Change Impacts on SPEI Evolution and Water Reservoirs Storage
In Table 4, the mean PET and SPEI values for the 1972–2000 and the future period 2031–2060 are presented for the three areas of interest: the Kiti, Kouris and Asprokremmos dams. Statistically significant downward SPEI trends (at the 5% significance level, Mann–Kendal trend test) were found for all areas of interest, while the most significant downward trend was found in the Kouris dam under the RCP 8.5. The SPEI evolution in the Kiti area shows a downward trend for both RCP 4.5 and RCP 8.5 scenarios, as shown in Figure 7a,b, and the downward trend under the RCP 8.5 scenario is almost double. Similarly, in Figure 7c,d, SPEI evolution at the Kouris dam for the period 1972–2098 is presented, forced by the RCP 4.5 and RCP 8.5 climatic scenarios, respectively. Under both RCPs, a downward trend of SPEI was observed. In particular, for the case of RCP 4.5, the average SPEI value for the period 1972–2000 was 0.98, whereas for the period 2031–2060, the average SPEI was −0.27. Concerning RPC 8.5, the corresponding values were 1.02 for the period 1972–2000 and −0.29 for the period 2031–2060.

Table 4.
Average PET and SPEI values in Cyprus.
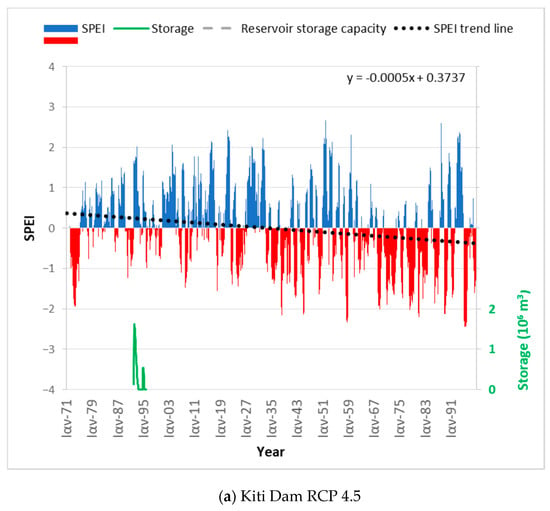
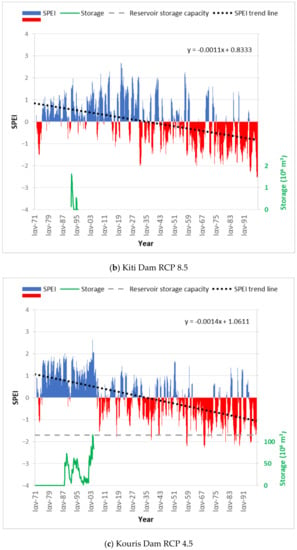
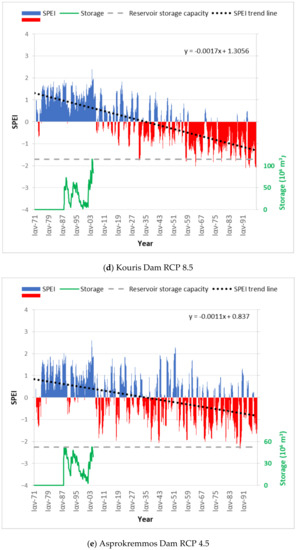
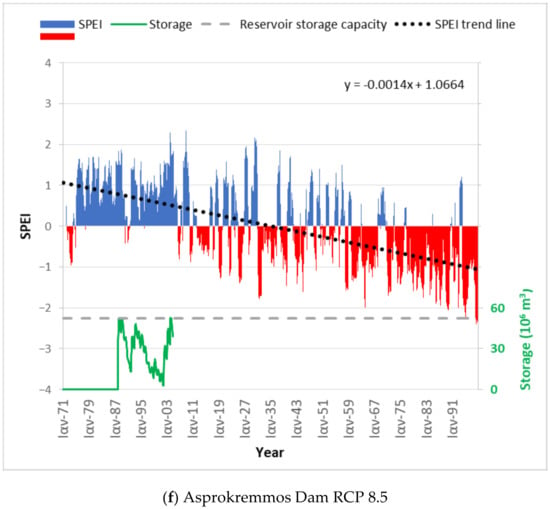
Figure 7.
SPEI evolution at locations near the Kiti (a,b), Kouris (c,d) and Asprokremmos (e,f) dam areas under RCP 4.5 and RCP 8.5.
Figure 7e,f presents the SPEI evolution at the Aspokremmos dam for the period 1972–2098, forced by the RCP 4.5 and RCP 8.5 scenarios, showing a significant downward trend. In more detail, while the average SPEI values for the period 1972–2000 were 0.70 and 0.80 for RCP 4.5 and RCP 8.5, respectively, the corresponding average values of SPEI for the period 2031–2060 were −0.14 and −0.13.
The cross correlation analysis implemented for the cases of the Kouris and Asprokremmos dams indicates that the SPEI is correlated with water storage. For the Kouris reservoir, the SPEI had the strongest correlation with a lag of 2–3 months, which suggests that SPEI can be used to forecast the pressure on surface water storage in the reservoir, as shown in Figure 8. In parallel, the results of the cross correlation analysis in the Asprokremmos reservoir indicated a correlation between the SPEI and water stored in the reservoir. However, the correlation is not such a strong correlation (CCF = 0.32 in the case of time lag equal to 3).
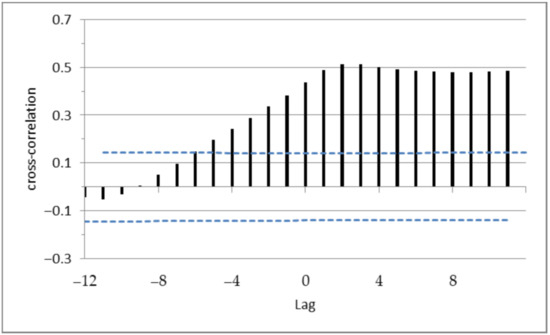
Figure 8.
Results for cross correlation between SPEI values and reservoir storage water volumes in Kouris reservoir.
The significant downward trend of SPEI for all three locations, examined in the analysis, shows that Cyprus may experience a significant upward trend of drought under the projected future climatic conditions. As the cross correlation analysis in the Kouris and Asprokremos dams showed that SPEI is correlated with water reservoir storage measurements, this can be an indication to competent authorities that alternative water management plans should be explored and activated if needed. The watersheds of the Kouris and Asprokremmos dams show the most significant downward trends of SPEI values for both RCPs, indicating that the corresponding reservoirs are more vulnerable to future climate change impacts.
5. Discussion
The results of the present analysis indicate that, among the aquifers of interest, Kiti is expected to face greater water table depletion under the pressure of future extreme dry hydrological years. These results are obtained based on the assumption that the current irrigation practices will continue to be applied in the future. However, the high chloride concentrations already observed in the Kiti aquifer, the local salinization phenomena in the Pegeia and Acheleia aquifers and the increasing frequency of dry hydrological years in the future (based on the SPEI assessment) highlight the need to reschedule the applied irrigation practices and pumping schemes.
In the present analysis for Cyprus, the assessment of climate change impacts on drought, based on SPEI evolution under the RCP 4.5 and RCP 8.5 at locations close to water reservoirs used for irrigation purposes, indicate that the future period (2031–2060) will be drier than the reference one (1972–2000). The downward trend of SPEI at these locations indicates not only that existing freshwater volumes in reservoirs will be under stress, but also that an additional pressure on groundwater resources should be expected as an alternative source of fresh water to be used. However, as groundwater systems in Cyprus have already faced pressure due to extended periods of droughts, overexploitation and seawater intrusion [9], the Water Development Department of Cyprus promotes the sustainable use of groundwater resources by setting a maximum volume of water that can be abstracted by each well and by engaging users in monitoring the abstracted volume through water meters [55]. Therefore, based on this present analysis, surface water is expected to become more vulnerable and less reliable to cover water demand in the near future; however, from a water authority point of view, the further increase in groundwater use is not considered as a sustainable solution to the water shortage problem in Cyprus.
Besides the uncertainties associated with SPEI estimation related to the selected RCM and/or the PET method used, the results of the analysis are considered to be reliable as, in all of the locations near the three representative water reservoirs, (a) the historic drought events are depicted in the SPEI graphs (e.g., droughts on the early 1970s) and (b) the water reservoir storage can be correlated with the SPEI values. As time-series of climatic variables produced by RCM do not depict the actual chronological order, the SPEI should be used as an alarm indicator to identify future trends of water volume variability in the specific reservoirs, rather than be used as a method to predict the exact time of a water shortage in the examined reservoirs.
In Figure 7, the high SPEI values are consistent with water reservoir overflows during the historic years (e.g., in 1988 for the case of the Asprokremmos dam), while during a downward trend period of SPEI, the water reservoir storage is low. Therefore, the SPEI trend can be used as an indicator for the reservoir storage future trends. Although SPEI evolution shows a downward trend in all three locations under both RCPs considered and, therefore, more dry events are expected in future, the mean SPEI values for the future period (i.e., 2031–2060) range from −0.5 to 0, classifying the future period in a normal class, based on Table 2. However, it is important to note that there is significant increase in the frequency of extreme events (SPEI lower than −1.5).
Cleridou et al. [9] have adopted a modeling approach to capture the changes in water flux and in Kouris catchment under the pressure of climate change. Based on the simulation results forced by the RCP 8.5 [9], the mean discharge into the Kouris dam from the relative catchment is predicted to be decreased from 21.5 Mm3 (present period) to 14 Mm3 at the period 2030/31 to 2049/50 and 6.9 Mm3 at the period 2080/81 to 2099/100. Along the same line, our SPEI analysis indicates that, while a SPEI downward trend is observed for the future period 2031–2060, with respect to the present period, significant drought events and, therefore, stress on future water storage is expected in future climate conditions, in the absence of any mitigation measures (RCP 8.5).
6. Conclusions
Cyprus has already faced water scarcity due to anthropogenic activities, such as over-pumping and climate change conditions as, during the last few decades, an increasing number of low precipitation and drought years has been observed [9]. Since agriculture is highly dependent on water availability, the agricultural sector in Cyprus has been under pressure during the historic extreme dry hydrological years. In the hydrological year 2007–2008, the severe drought led to limited water availability and in almost empty water reservoirs. During this period, as a result of the extended drought events, decreased crop yields, in respect to normal seasons, were observed [56]. Climate change is expected to affect the already vulnerable agricultural sector in Cyprus due to limited freshwater availability.
The present study focuses on the assessment of the additional pressure that climate change will impose to agricultural water in the future. Specifically, an assessment of climate change impacts on three important groundwater systems of Cyprus was conducted, while the drought index SPEI was adopted, for the first time in Cyprus, in order to identify climate change impacts on droughts and, at the same time, explore the use of the SPEI as an indicator to predict surface water responses to climate conditions. Our assessment of climate change impacts on the selected groundwater systems has shown a decline of the water table close to 1 m in the Kiti aquifer that causes seawater intrusion to advance further inland. However, in the two groundwater systems in Paphos, the predicted water table fluctuations are lower and, especially in the Pegeia aquifer, no additional pressure in terms of seawater intrusion is expected. The main findings of this analysis indicate that the predicted hydrological drought events will be more frequent. Therefore, effective water management practices focusing on optimal groundwater resource management, water saving measures and the further use of alternative water sources are inevitable.
Author Contributions
Conceptualization, M.P.P., M.M. and C.G.; methodology, M.P.P., C.G. and K.S.; software, K.S., D.C., A.K. and K.V.V.; validation, K.S., D.C., A.K. and K.V.V.; formal analysis, D.C., K.S. and A.K.; investigation, K.S., K.V.V., A.K. and D.C.; resources, C.G. and M.M.; data curation, M.M., K.S., K.V.V., A.K. and D.C.; writing—original draft preparation, D.C., A.K., K.S. and M.P.P.; writing—review and editing, M.M., M.P.P. and K.S.; visualization, D.C.; supervision, M.P.P. and M.L.; project administration, M.P.P., M.L. and C.G.; funding acquisition, M.P.P., M.L., M.M. and C.G. All authors have read and agreed to the published version of the manuscript.
Funding
This research was funded by the LIFE programme for the Environment and Climate Action (2014–2020) in the framework of the project LIFE ADAPT2CLIMA “Adaptation to Climate Change Impacts on the Mediterranean Islands’ Agriculture” (LIFE14 CCA/GR/000928).
Acknowledgments
The authors would like to acknowledge the European financial instrument for the Environment, LIFE, for the financial support in the framework of the ADAPT2CLIMA project LIFE14 CCA/GR/000928. The authors also would like to express their gratitude to the two anonymous reviewers whose valuable comments considerably improved the manuscript.
Conflicts of Interest
The authors declare no conflict of interest.
References
- IPCC. Climate Change 2014: Synthesis Report. Contribution of Working Groups I, II and III to the Fifth Assessment Report of the Intergovernmental Panel on Climate Change; Core Writing Team, Pachauri, R.K., Meyer, L.A., Eds.; IPCC: Geneva, Switzerland, 2014; p. 151. [Google Scholar]
- Handmer, J.; Honda, Y.; Kundzewicz, Z.W.; Arnell, N.; Benito, G.; Hatfield, J.; Mohamed, I.F.; Peduzzi, P.; Wu, S.; Sherstyukov, B.; et al. Changes in impacts of climate extremes: Human systems and ecosystems. In Managing the Risks of Extreme Events and Disasters to Advance Climate Change Adaptation; Field, C.B., Barros, V., Stocker, T.F., Qin, D., Dokken, D.J., Ebi, K.L., Mastrandrea, M.D., Mach, K.J., Plattner, G.-K., Allen, S.K., et al., Eds.; A Special Report of Working Groups I and II of the Intergovernmental Panel on Climate Change (IPCC): Geneva, Switzerland; Cambridge University Press: Cambridge, UK; New York, NY, USA, 2012; pp. 231–290. [Google Scholar]
- Calzadilla, A.; Zhu, T.; Rehdanz, K.; Tol, R.S.J.; Ringler, C. Climate change and agriculture: Impacts and adaptation options in South Africa. Water Resour. Econ. 2014, 5, 24–48. [Google Scholar] [CrossRef]
- FAO. Agriculture and Climate Change–Challenges and Opportunities at the Global and Local Level–Collaboration on Climate-Smart Agriculture; Licence: CC BY-NC-SA 3.0 IGO; FAO: Rome, Italy, 2011; p. 52. [Google Scholar]
- Zachariadis, T. Climate Change in Cyprus: Impacts and Adaptation Policies. Cyprus Econom. Policy Rev. 2012, 37, 21–37. [Google Scholar]
- LDK Consultants Engineers & Planners S.A.; ECOS Consulting S.A. Revision of the Drought Management Plan, WDD 10/2014. 2016. Available online: http://www.moa.gov.cy/moa/WDD/wfd.nsf/E59310DC9F385F1BC22583C50045545D/$file/Revision%20of%20the%20Drought%20Management%20Plan%20(Oct%202016).pdf (accessed on 2 February 2020).
- World Bank Open Data. Available online: https://data.worldbank.org/ (accessed on 10 February 2020).
- Water Development Department. Available online: http://www.moa.gov.cy/moa/wdd/Wdd.nsf/index_en/index_en?opendocument (accessed on 20 January 2020).
- Cleridou, N.; Benas, N.; Matsoukas, C.; Croke, B.; Vardavas, I. Water resources of Cyprus under changing climatic conditions: Modelling approach, validation and limitations. Environ. Model. Softw. 2014, 60, 202–218. [Google Scholar] [CrossRef]
- Klaas, D.K.S.Y.; Imteaz, M.A.; Sudiayem, I.; Klaas, E.M.E.; Klaas, E.C.M. Assessing climate changes impacts on tropical karst catchment: Implications on groundwater resource sustainability and management strategies. J. Hydrol. 2020, 582. [Google Scholar] [CrossRef]
- Taheri Tizro, A.; Fryar, A.E.M.; Pour, K.; Voudouris, K.S.; Javad Mashhadian, M. Groundwater conditions related to climate change in the semi-arid area of western Iran. Groundw. Sustain. Dev. 2019, 9. [Google Scholar] [CrossRef]
- Pholkern, K.; Saraphirom, P.; Srisuk, K. Potential impact of climate change on groundwater resources in the Central Huai Luang Basin, Northeast Thailand. Sci. Total Environ. 2018, 633, 1518–1535. [Google Scholar] [CrossRef] [PubMed]
- Green, T.R.; Taniguchi, M.; Kooi, H.; Gurdak, J.J.; Allen, D.M.; Hiscock, K.M.; Treidel, H.; Aureli, A. Beneath the surface of global change: Impacts of climate change on groundwater. J. Hydrol. 2011, 405, 532–560. [Google Scholar] [CrossRef]
- Lorenzo-Lacruz, J.; Vicente-Serrano, S.M.; López-Moreno, J.I.; Beguería, S.; García-Ruiz, J.M.; Cuadrat, J.M. The impact of droughts and water management on various hydrological systems in the headwaters of the Tagus River (central Spain). J. Hydrol. 2010, 386, 13–26. [Google Scholar] [CrossRef]
- Vicente-Serrano, S.M.; Beguería, S.; López-Moreno, J.I. A Multi-scalar drought index sensitive to global warming: The Standardized Precipitation Evapotranspiration Index–SPEI. J. Clim. 2010, 23, 1696–1718. [Google Scholar] [CrossRef]
- Gao, X.; Zhao, Q.; Zhao, X.; Wu, P.; Pan, W.; Gao, X.; Sun, M. Temporal and spatial evolution of the standardized precipitation evapotranspiration index (SPEI) in the Loess Plateau under climate change from 2001 to 2050. Sci. Total Environ. 2017, 595, 191–200. [Google Scholar] [CrossRef]
- Marcos-Garcia, P.; Lopez-Nicolas, A.; Pulido-Velazquez, M. Combined use of relative drought indices to analyze climate change impact on meteorological and hydrological droughts in a Mediterranean basin. J. Hydrol. 2017, 554, 292–305. [Google Scholar] [CrossRef]
- Spinoni, J.; Barbosa, P.; De Jager, A.; McCormick, N.; Naumann, G.; Vogt, J.V.; Magni, D.; Masante, D.; Mazzeschi, M. A new global database of meteorological drought events from 1951 to 2016. J. Hydrol. Reg. Stud. 2019, 22. [Google Scholar] [CrossRef] [PubMed]
- Vicente-Serrano, S.M.; National Center for Atmospheric Research Staff (Eds.) The Climate Data Guide: Standardized Precipitation Evapotranspiration Index (SPEI). Available online: https://climatedataguide.ucar.edu/climate-data/standardized-precipitation-evapotranspiration-index-spei (accessed on 2 February 2020).
- Zittis, G.; Bruggeman, A.; Camera, C.; Hadjinicolaou, P.; Lelieveld, J. The added value of convection permitting simulations of extreme precipitation events over the eastern Mediterranean. Atmos. Res. 2017, 191, 20–33. [Google Scholar] [CrossRef]
- Price, C.; Michaelides, S.; Pashiardis, S.; Alperta, P. Long term changes in diurnal temperature range in Cyprus. Atmos. Res. 1999, 51, 85–98. [Google Scholar] [CrossRef]
- Pashiardis, S.; Michaelides, S. Implementation of the standardized precipitation index (SPI) and the reconnaissance drought index (RDI) for regional drought assessment: A case study for Cyprus. Eur. Water 2008, 23, 57–65. [Google Scholar]
- Kostopoulou, E.; Jones, P.D. Assessment of Climate Extremes in the Eastern Mediterranean. Meteorol. Atmos. Phys. 2005, 89, 69–85. [Google Scholar] [CrossRef]
- Goubanova, K.; Li, L. Extremes in Temperature and Precipitation around the Mediterranean Basin in an Ensemble of Future Climate Scenario Simulations. Glob. Planet. Chang. 2007, 57, 27–42. [Google Scholar] [CrossRef]
- Philandras, C.M.; Nastos, P.T.; Kapsomenakis, J.; Douvis, K.C.; Tselioudis, G.; Zerefos, C.S. Long Term Precipitation Trends and Variability within the Mediterranean Region. Nat. Hazards Earth Syst. Sci. 2011, 11, 3235–3250. [Google Scholar] [CrossRef]
- Zittis, G. Observed Rainfall Trends and Precipitation Uncertainty in the Vicinity of the Mediterranean, Middle East and North Africa. Theor. Appl. Climatol. 2018, 134, 1207–1230. [Google Scholar] [CrossRef]
- Wulf, K. Reassessment of the Islands Water Resources and Demand. In Synthesis Report FAO/WDD TCP/CYP/2801; Ministry of Agriculture, Natural Resources and Environment of the Republic of Cyprus: Nicosia, Cyprus, 2002; p. 31. [Google Scholar]
- Sofroniou, A.; Bishop, S. Water Scarcity in Cyprus: A Review and Call for Integrated Policy. Water 2014, 6, 2898–2928. [Google Scholar] [CrossRef]
- WDD and FAO. Reassessment of the Island’s Water Resources and Demand-Objective 1–Output 1.4.2-Assessment of Groundwater Resources of Cyprus; WDD and FAO: Lefkosia, Cyprus, 2002; p. 234. [Google Scholar]
- Milnes, E.; Renard, P. Assessment of Seawater Intrusion versus Mass Return Flow from Irrigation in the Kiti Coastal Pilot area System (Southern Cyprus) Based on Field Investigations and Three-Dimensional Finite Element Simulations. In Proceedings of the 17th Salt Water Intrusion Meeting, Delft, The Netherlands, 6–10 May 2002. [Google Scholar]
- Statistical Service. Census of Agriculture 2010; Agricultural Statistics, Series I, Report No 8; Statistical Service: Accra, Ghana, 2014; p. 335. [Google Scholar]
- LIFE ADAPT2CLIMA. Deliverable C4.1: Report on the Estimation of Future Climate Change Impacts on the Water Resources of Cyprus, Crete and Sicily. Project ADAPT2CLIMA LIFE14 CCA/GR/000928. 2017. Available online: http://adapt2clima.eu/uploads/2017/adapt2clima_Deliverable_C4.1_20180531.pdf (accessed on 10 February 2020).
- Ministry of Agriculture, Natural Resources and Environment Report on the Implementation of Council Directive 91/676/EEC Concerning the Protection of Waters against Pollution Caused by Nitrates from Agricultural Sources, Article 10; Cyprus National Report 2012–2015; Ministry of Agriculture, Natural Resources and Environment: Nicosia, Cyprus, 2015.
- Haylock, M.R.; Hofstra, N.; Tank, A.M.G.K.; Klok, E.J.; Jones, P.D.; New, M. A European Daily High-Resolution Gridded Data Set of Surface Temperature and Precipitation for 1950–2006. J. Geophys. Res. Atmos. 2008, 113. [Google Scholar] [CrossRef]
- Klok, E.J.; Klein Tank, A.M.G. Updated and Extended European Dataset of Daily Climate Observations. Int. J. Climatol. 2009, 29, 1182–1191. [Google Scholar] [CrossRef]
- Retalis, A.; Katsanos, D.; Michaelides, S. Precipitation climatology over the Mediterranean Basin Validation over Cyprus. Atmos. Res. 2016, 169, 449–458. [Google Scholar]
- Strandberg, G.; Bärring, A.; Hansson, U.; Jansson, C.; Jones, C.; Kjellström, E. CORDEX Scenarios for Europe from the Rossby Centre Regional Climate Model RCA4; Report Meteorology and Climatology; SE-60176 Norrköping, Sverige; SMHI: Norrköping, Sweden, 2014; p. 84.
- Collins, W.J.; Bellouin, N.; Doutriaux-Boucher, M.; Gedney, N.; Halloran, P.; Hinton, T.; Woodward, S. Development and evaluation of an Earth-System model–HadGEM2. Geosci. Model Dev. 2011, 4, 1051–1075. [Google Scholar] [CrossRef]
- Martin, G.M.; Milton, S.F.; Senior, C.A.; Brooks, M.E.; Ineson, S.; Reichler, T.; Kim, J. Analysis and Reduction of Systematic Errors through a Seamless Approach to Modeling Weather and Climate. J. Clim. 2011, 23, 5933–5957. [Google Scholar] [CrossRef]
- Popke, D.; Stevens, B.; Voigt, A. Climate and climate change in a radiative-convective equilibrium version of ECHAM6. J. Adv. Model. Earth Syst. 2013, 5, 1–14. [Google Scholar] [CrossRef]
- Hutchinson, M.F. Interpolation of Rainfall Data with Thin Plate Smoothing Splines-Part II: Analysis of Topographic Dependence. J. Geogr. Inf. Decis. Anal. 1998, 2, 152–167. [Google Scholar]
- LIFE ADAPT2CLIMA. Deliverable C3: Future Projections on Climatic Indices with Particular Relevance to Agriculture for the Three Islands (Coarse Resolution) and for Each Agricultural Pilot Area (Fine Resolution) Project ADAPT2CLIMA LIFE14 CCA/GR/000928. 2017. Available online: http://adapt2clima.eu/uploads/2017/ADAPT2CLIMA_DEL_C.3_Final_3.pdf (accessed on 1 April 2020).
- Waterloo Hydrogeologic. Visual MODFLOW Flex 4.1 Integrated Conceptual & Numerical Groundwater Modeling; Waterloo Hydrogeologic: Waterloo, ON, Canada, 2017; p. 869. [Google Scholar]
- Harbaugh, A.W.; Banta, E.R.; Hill, M.C.; McDonald, M.G. MODFLOW-2000, the U.S. Geological Survey Modular Ground-Water Model-User Guide to Modularization Concepts and the Ground-Water Flow Process, U.S. Geological Survey Open-File Report 00-92. 2000; p. 121. Available online: https://water.usgs.gov/nrp/gwsoftware/modflow2000/ofr00-92.pdf (accessed on 3 June 2020).
- Zheng, C.; Wang, K. MT3DMS-A Modular Three Dimensional Multispecies Transport Model for Simulation of Advection, Dispersion and Chemical Reactions of Contaminants in Groundwater Systems. Contract Report SERD99-1, U.S. Army Corps of Engineers. 1999. Available online: https://hydro.geo.ua.edu/mt3d/mt3dmanual.pdf (accessed on 3 June 2020).
- Langevin, C.D.; Thorne, D.T., Jr.; Dausman, A.M.; Sukop, M.C.; Guo, W. SEAWAT Version 4: A Computer Program for Simulation of Multi-Species Solute and Heat Transport; U.S. Geological Survey Techniques and Methods Book 6; United States Geological Survey: Reston, VA, USA, 2007; Chapter A22; p. 39.
- Charchousi, D.; Papadopoulou, M.P.; Spanoudaki, K.; Alexakis, D.; Giannakopoulos, C.; Karali, A. Assessing the vulnerability of agriculture to climate change: The case of Cyprus. Eur. Water 2017, 59, 351–356. [Google Scholar]
- Ministry of Agriculture, Rural Development and Environment, Water Development Department. Assessment Report of the Chemical Status of Underground Water in 2016; Ministry of Agriculture, Rural Development and Environment, Water Development Department: Nicosia, Cyprus, 2017; p. 44.
- SPEI. Available online: http://spei.csic.es/home.html (accessed on 15 December 2019).
- Abramowitz, M.; Stegun, I.A. Handbook of Mathematical Functions, with Formulas, Graphs, and Mathematical Tables; Dover Publications: Mineola, NY, USA, 1965; p. 1046. [Google Scholar]
- Edwards, C.D.C.; McKee, T.B.; Doesken, N.J.; Kleist, J. Historical analysis of drought in the United States. In Proceedings of the 7th Conference on Climate Variations, 77th AMS Annual Meeting, Long Beach, CA, USA, 2–7 February 1997. [Google Scholar]
- SPEI: Calculation of the Standardised Precipitation-Evapotranspiration Index. Available online: https://CRAN.R-project.org/package=SPEI (accessed on 1 March 2019).
- Hargreaves, G.H. Defining and using reference evapotranspiration. J. Irrig. Drain Eng. 1994, 120, 1132–1139. [Google Scholar] [CrossRef]
- Allen, R.G.; Pereira, L.S.; Raes, D.; Smith, M. Crop Evapotranspiration: Guidelines for Computing Crop Water Requirements; FAO irrigation and drainage paper 56; FAO: Rome, Italy, 1998. [Google Scholar]
- Official Gazette of the Republic of Cyprus, Νο 4418. 18 February 2011. Available online: http://www.moa.gov.cy/moa/WDD/wdd.nsf/All/CB9C4C6D4AFE5156C225820C002ECE23/$file/3_Adia_Ydrolipsias.pdf?OpenElement (accessed on 10 June 2020). (In Greek)
- Michaelides, S.; Pashiardis, S. Monitoring Drought in Cyprus during the 2007–2008 Hydrometeorological Year by using the Standardized Precipitation Index (SPI). Eur. Water 2008, 23, 123–131. [Google Scholar]
© 2020 by the authors. Licensee MDPI, Basel, Switzerland. This article is an open access article distributed under the terms and conditions of the Creative Commons Attribution (CC BY) license (http://creativecommons.org/licenses/by/4.0/).