Article

Connection between Antarctic Ozone and Climate: Interannual Precipitation Changes in the Southern Hemisphere

1
Center for Environmental Remote Sensing, Chiba University, Chiba 263-8522, Japan
2
Department of Physics, Santiago University, Santiago 9170022, Chile
3
Helmholtz Centre for Polar and Marine Research, Alfred Wegener Institute, 27515 Bremerhaven, Germany
4
School of Earth, Energy and Environmental Sciences, Stanford University, Stanford, CA 94305, USA
5
Department of Geophysics, Universidad de Chile, Santiago 6511227, Chile
6
Department, Japan Agency for Marine-Earth Science and Technology, Yokohama 236-0001, Japan
*
Authors to whom correspondence should be addressed.
Atmosphere 2020, 11(6), 579; https://doi.org/10.3390/atmos11060579
Submission received: 5 April 2020 / Revised: 24 May 2020 / Accepted: 28 May 2020 / Published: 1 June 2020
(This article belongs to the Section Meteorology)

Abstract

:
In this study, we explored the connection between anomalies in springtime Antarctic ozone and all-year precipitation in the Southern Hemisphere by using observations from 1960–2018 and coupled simulations for 1960–2050. The observations showed that this correlation was enhanced during the last several decades, when a simultaneously increased coupling between ozone and Southern Annular Mode (SAM) anomalies became broader, covering most of the following summer and part of the previous winter. For eastern Australia, the ozone–precipitation connection shows a greater persistence toward the following summer than for other regions. On the other hand, for South America, the ozone–precipitation correlation seems more robust, especially in the early summer. There, the correlation also covers part of the previous winter, suggesting that winter planetary waves could affect both parameters. Further, we estimated the sensitivity of precipitation to changes in Antarctic ozone. In both observations and simulations, we found comparable sensitivity values during the spring–summer period. Overall, our results indicate that ozone anomalies can be understood as a tracer of stratospheric circulation. However, simulations indicate that stratospheric ozone chemistry still contributes to strengthening the interannual relationship between ozone and surface climate. Because simulations reproduced most of the observed connections, we suggest that including ozone variability in seasonal forecasting systems can potentially improve predictions.

1. Introduction

Although mean global precipitation is likely to increase in subsequent decades, as a response to global warming, the geographical patterns of this change are expected to be diverse [1]. In addition to anthropogenic greenhouse gases (GHG), the Antarctic ozone (O3) hole [2] is also thought to have driven the evolution of surface climate in the Southern Hemisphere (SH) during the last several decades [3,4]. Indeed, the ozone hole contributes to the temperature decrease in the Antarctic lower stratosphere [5] and, although ozone depletion occurs during the austral spring, the associated reduction in shortwave heating lasts long into the summer, accelerates the stratospheric zonal winds, and causes negative geopotential height anomalies at high southern latitudes. Then, such changes propagate from the stratosphere to the troposphere, where they can modify patterns of wind, pressure, and temperature. Consequently, the ozone hole promotes a positive state of the Southern Annular Mode (SAM) [4,6], which is a key driver of trends of the storm track and precipitation in both subtropical and temperate regions [7,8,9,10,11]. However, because the ozone hole is predicted to recover by around the midpoint of this century [12], its forcing is projected to reverse, and the intensity of its forcing will depend on the future climate scenario.
Under the positive phase of the SAM, a decrease in precipitation at around 35–45° S has been observed [13] and also reproduced by climate models [14]. This has been shown to be associated with reduced cloudiness, increased geopotential height, and southward shift of the storm track. In contrast, a general increase of precipitation at latitudes equatorward of about 35° S is explained by anomalous easterly winds enhancing the advection of moisture from the ocean to land.
On the global scale, orographic rainfall is influenced by the strength of cross-mountain mid- and low-level winds. In particular, precipitation along the Pacific coast of southern South America is supplied from mid-latitude storms within the westerly wind belt and is enhanced by the orographic effects of the Andes [15]. Orographic rainfall is also expected to be strongly affected by SAM-induced changes in South America as well as in other regions, e.g., the east coasts of Australia and South Africa.
In recent years, many regions of the SH have suffered droughts. Since 2010, the Pacific coastline of southern South America has faced an intense drought, the most prolonged continuous dry spell in the last 100 years [16]. A further severe drought has also occurred in South Africa, and Cape Town suffered the risk of a “Day Zero” drought [17]. Finally, following an unusual (for the SH) sudden stratospheric warming (SSW) that occurred in September 2019, an unprecedented number of wildfires developed in eastern Australia coupled with high temperature and rainfall below average [18]. In light of these recent events, there is an increasing need for reliable seasonal forecasting [19], which allows counteractive measures to be taken in advance.
Various studies have suggested that enhanced tropospheric predictability can be achieved with knowledge of stratospheric anomalies [20,21]. In particular, stratosphere–troposphere coupling in the Antarctic polar vortex provides predictability of the SAM and surface climate. For the Northern Hemisphere, such anomalies have been shown to be better predictors of the Northern Annular Mode (NAM) than the NAM itself [22]. By analyzing zonal mean zonal winds around Antarctica, it has been shown that changes in the tropospheric circulation in late spring and summer are noticeably related to changes in the extratropical jet in winter [23].
In addition to its influence on the long-term trends, the ozone hole can potentially affect climate at an interannual timescale due to its significant springtime variability [24]. On the other hand, ozone anomalies can be considered a proxy for variability in stratospheric circulation and polar vortex strength [25,26]. Within this framework, Bandoro et al. [24] found that high (low) wave activity and ozone levels are usually coupled with a weaker (stronger) polar vortex in spring and a low (high) SAM in summer [27]. This is a widely accepted relationship which has been confirmed by other studies [28].
A few recent studies have explored tropospheric predictability by exploiting anomalies in Antarctic total ozone. Fogt et al. [26] found that springtime total ozone recorded at the South Pole station is related to the SAM up to four months later. Furthermore, Son et al. [25] found that Antarctic total ozone in September is strongly correlated to the SAM and to SH surface climate in October. Bandoro et al. [24] demonstrated a relationship between springtime ozone at Halley station and summer surface temperature in eastern Australia. Then, Gillett et al. [29] further confirmed that the correlation between ozone and Australian climate can be reproduced by chemistry-climate models.
Building on these previous efforts, we investigated the interannual connection between ozone and precipitation anomalies, focusing on the Pacific coastline of southern South America (hereinafter Chile) as well as other regions, such as Australia and South Africa, where ozone forcing has been shown to drive the trend of surface climate during the last decades [9,11,18,30]. Although the main objective of this study was exploring the possible use of springtime Antarctic ozone as a predictor of summertime precipitation, we further analyzed this connection for the other seasons.
The advantage of using ozone observations rather than other atmospheric dynamics proxies from reanalysis [18] is the longer extension of the ozone series compared to reanalysis products, which are mostly constrained by the duration of satellite observations. This longer time series allowed us to explore the relationship between ozone and surface climate even before the development of the ozone hole. On the other hand, the effect of ozone on tropospheric weather is thought to occur largely through stratospheric dynamics changes. Therefore, the use of stratospheric dynamics is valuable if the focus is on the impact of the stratospheric changes on tropospheric dynamics. From this perspective, the ozone time series at only one location would present some limitations if compared with the 3D fields in meteorological analyses.

2. Data and Methods

2.1. Precipitation

Changes in precipitation were investigated with the Global Precipitation Climatology Centre (GPCC) Full Data Reanalysis V7 monthly precipitation dataset [31], which is based on quality-controlled data from 67,200 stations. To generate this dataset, precipitation anomalies recorded at the stations were interpolated and then superimposed on the GPCC climatology [31]. The spatial resolution of the selected product is 1° × 1° latitude by longitude. The data were analyzed for the period 1960–2018.

2.2. Total Column Ozone

Reliable and continuous satellite observations of the total column ozone (hereinafter total ozone) over Antarctica have been conducted since about 1979. Therefore, we exploited ground-based total ozone observations recorded in Antarctica to estimate the evolution of the ozone hole. Total ozone observations in Antarctica roughly started with The Third International Polar Year (1957–1958) and the longer ozone series are available from Faraday (65°14′45″ S, 64°15′28″ W), Syowa (69°00′16″ S, 39°34′54″ E), Halley (75°35′ S, 26°34′ W) and South Pole (90°00′ S, 139°16′ W) stations. However, ozone records from stations located well inside the continent (e.g., Syowa, Halley, and the South Pole) are more representative of the ozone hole evolution than others located in the peninsula (e.g., Faraday). Previous studies showed that shifts in the location of the polar vortex could bias observations of air masses recorded at stations near the vortex edge [32]. Therefore, according to their latitude, Faraday and Syowa stations are more affected by this shift than Halley and the South Pole. Although Halley is usually inside the polar vortex, here we focused on the South Pole because, potentially, it is the station more within the deep vortex core. In particular, we exploited total ozone observations recorded at the South Pole Station in November. Nevertheless, since the November time series of the South Pole and Halley are well correlated (e.g., R2 = 0.89), the main results of this study do not substantially change if Halley instead of South Pole data are used. Besides the fact that the South Pole time series has almost no data gaps in November, we selected this month for three additional reasons: (i) the ozone radiative forcing peaks in the lower stratosphere in November (e.g., [24] and reference therein); (ii) ozone anomalies in November are much larger and easier identifiable than anomalies in September or October; (iii) during the investigated period, November ozone anomalies are well correlated with the SAM index.
Moreover, the total ozone dataset from the multi-sensor reanalysis version 2 (MSR2, [33]) has been used to explore the dependence of the connection between ozone and surface climate with the location of the ozone series.

2.3. Simulations

Moreover, when possible, observations were compared with a mean ensemble of transient simulations from a coupled climate model with interactive atmospheric chemistry and ocean and sea-ice modules, namely the Earth System Model for Interdisciplinary Research on Climate comprehensive of interactive chemistry (MIROC-ESM-CHEM; hereinafter MIROC; [34]). It has a well-resolved stratosphere and an internally generated quasi-biennial oscillation. The upper boundary is in the middle mesosphere (at 0.01 hPa) and the spatial resolution is approximately 2.8° in latitude and longitude. Within the Coupled Model Intercomparison Project 5 (CMIP5) framework, Eyring et al. [12] evaluated MIROC ozone climatology, long-term changes, and their associated climate impacts against other models and observations and found a limited Antarctic ozone overestimation in spring. However, due to the inclusion of the interactive chemistry, the ozone response of the climate system in MIROC is fully consistent with the ozone forcing (i.e., the temporal evolution of the dynamics is coupled with the ozone–climate feedback). In contrast, the responses obtained from most of the CMIP5 models did not account for chemistry–climate feedbacks.
The MIROC simulations forced with all external drivers and labeled historical in CMIP5, covered the period 1960–2005, whereas the future projections following the Representative Concentration Pathway (RCP) 4.5, covered the period 2006–2050. Moreover, we ran additional MIROC simulations covering the same periods as above (i.e., 1960–2005 and 2006–2050) but forced with the same forcing values, except for the ozone-depleting substance (ODS) concentrations, which were kept at 1960 levels (i.e., ozone depletion could not develop during the following decades). An ensemble of nine transient historical simulations was used to compare with the observations, whereas the ensembles of fixed ODS and RCP 4.5 projections were based on three simulations.
Although ten of the CMIP5 models simulate atmospheric chemistry interactively, no fixed ODS simulations are freely available. We also revised the datasets of the Chemistry Climate Model Initiative (CCMI) [35] looking for comparable simulations performed with models including interactive atmospheric chemistry, fully interactive ocean, and multiple members available. However, as their future projections are based on RCP 6.0, we discarded their use in this study.
SAM indices from Marshall [36] were employed for the observational analysis, and the difference between the zonal mean sea level pressure at 40° S and 65° S [37] was used for the analysis of the simulations. On the other hand, the Niño 3.4 index was used for both datasets.
Observational and model-based datasets were investigated by correlation and composite analysis, and statistical significance was assessed by a two-sided Student’s t-test. For simulations, we analyzed each member independently and then averaged the results. Although this procedure tends to smooth the magnitude of the final product, the results should be considered more robust.

3. Results

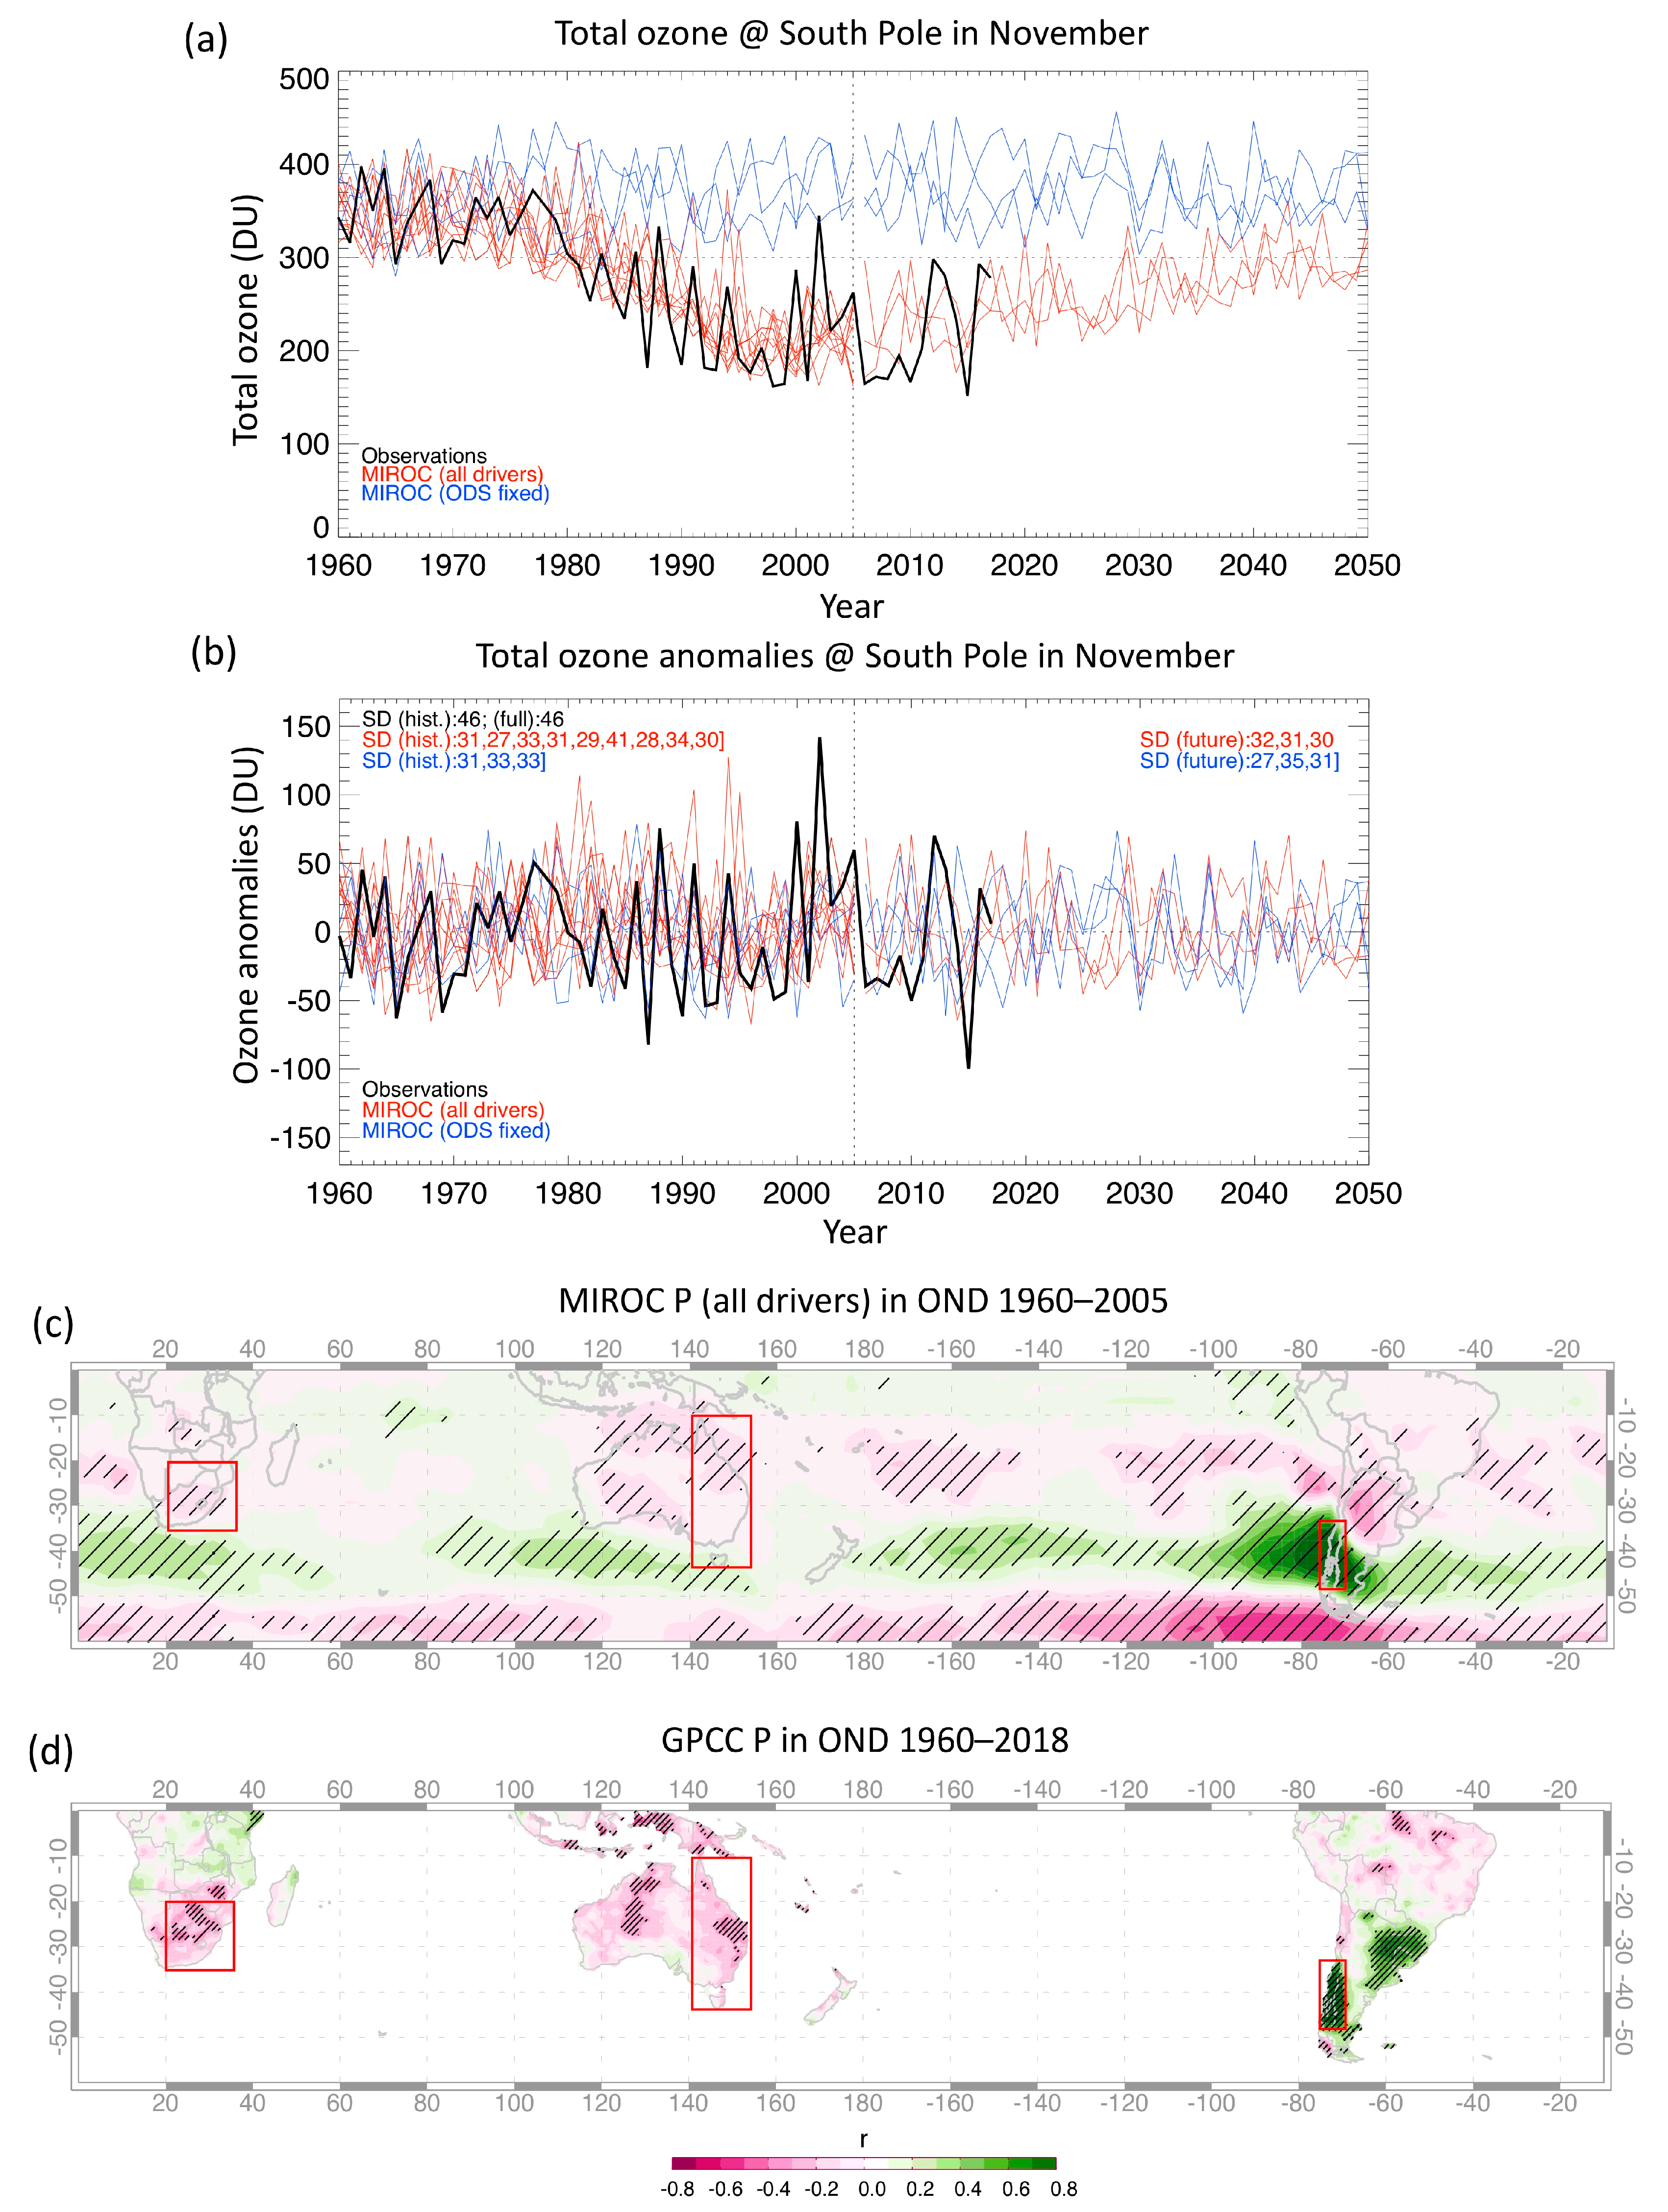
Figure 1a shows the temporal evolution of the total ozone at the South Pole in November as measured by ground-based observations (for 1960–2018) and reproduced by MIROC all drivers and MIROC fixed ODS simulations (for 1960–2050). The ozone depletion and the expected on-going recovery appear to be reproduced satisfactorily. Additionally, since about halfway through the 1970s, the ozone levels in MIROC all drivers are always well below the amounts of the fixed ODS simulations.
Aside from the evident ODS-induced decreasing trend in ozone levels, Figure 1a also highlights large year-to-year variability. Therefore, Figure 1b was constructed to present the anomalies (i.e., residuals) calculated with respect to a third-degree polynomial fitted to the time series of ozone values of Figure 1a (note that the following results remain virtually the same if a different polynomial is employed). In general, the simulated anomalies are somewhat smaller than the observed anomalies (see the respective standard deviations in the upper corners). We will use these anomalies to build the correlations and composites presented later in the paper.
The bottom panels of Figure 1 show the correlation maps between the average precipitation anomalies in central–southern Chile (red box highlighted by the red arrow) and the precipitation anomalies in the given grid point for GPCC and MIROC (all drivers) in the austral spring (October-November-December, OND) for 1960–2018 and 1960–2005, respectively. As our objective was assessing the ozone variations in November as a potential predictor of precipitation in summer, here and in the rest of this paper, OND is assumed to be the reference three-month period. By removing the trends, we also removed at least part of the potential influence of GHGs on precipitation. Therefore, we found it appropriate to compare a somewhat longer observational period (Figure 1d) with the simulations (Figure 1c) to achieve a more robust statistic (however, the standard deviation of the 59-year long series is identical to that of the 46-year long series; see Figure 1b; the observed correlation map for 1960–2005 is virtually equivalent to Figure 1d and shown in Figure A1 of the Appendix A). Overall, the model does a good job of reproducing the main observed pattern, which shows an obvious positive correlation in southern South America but also a negative correlation in both Australia and South Africa. This pattern confirms previous findings [13] and points to the dependence of SH precipitation on large scale modes, specifically the SAM.
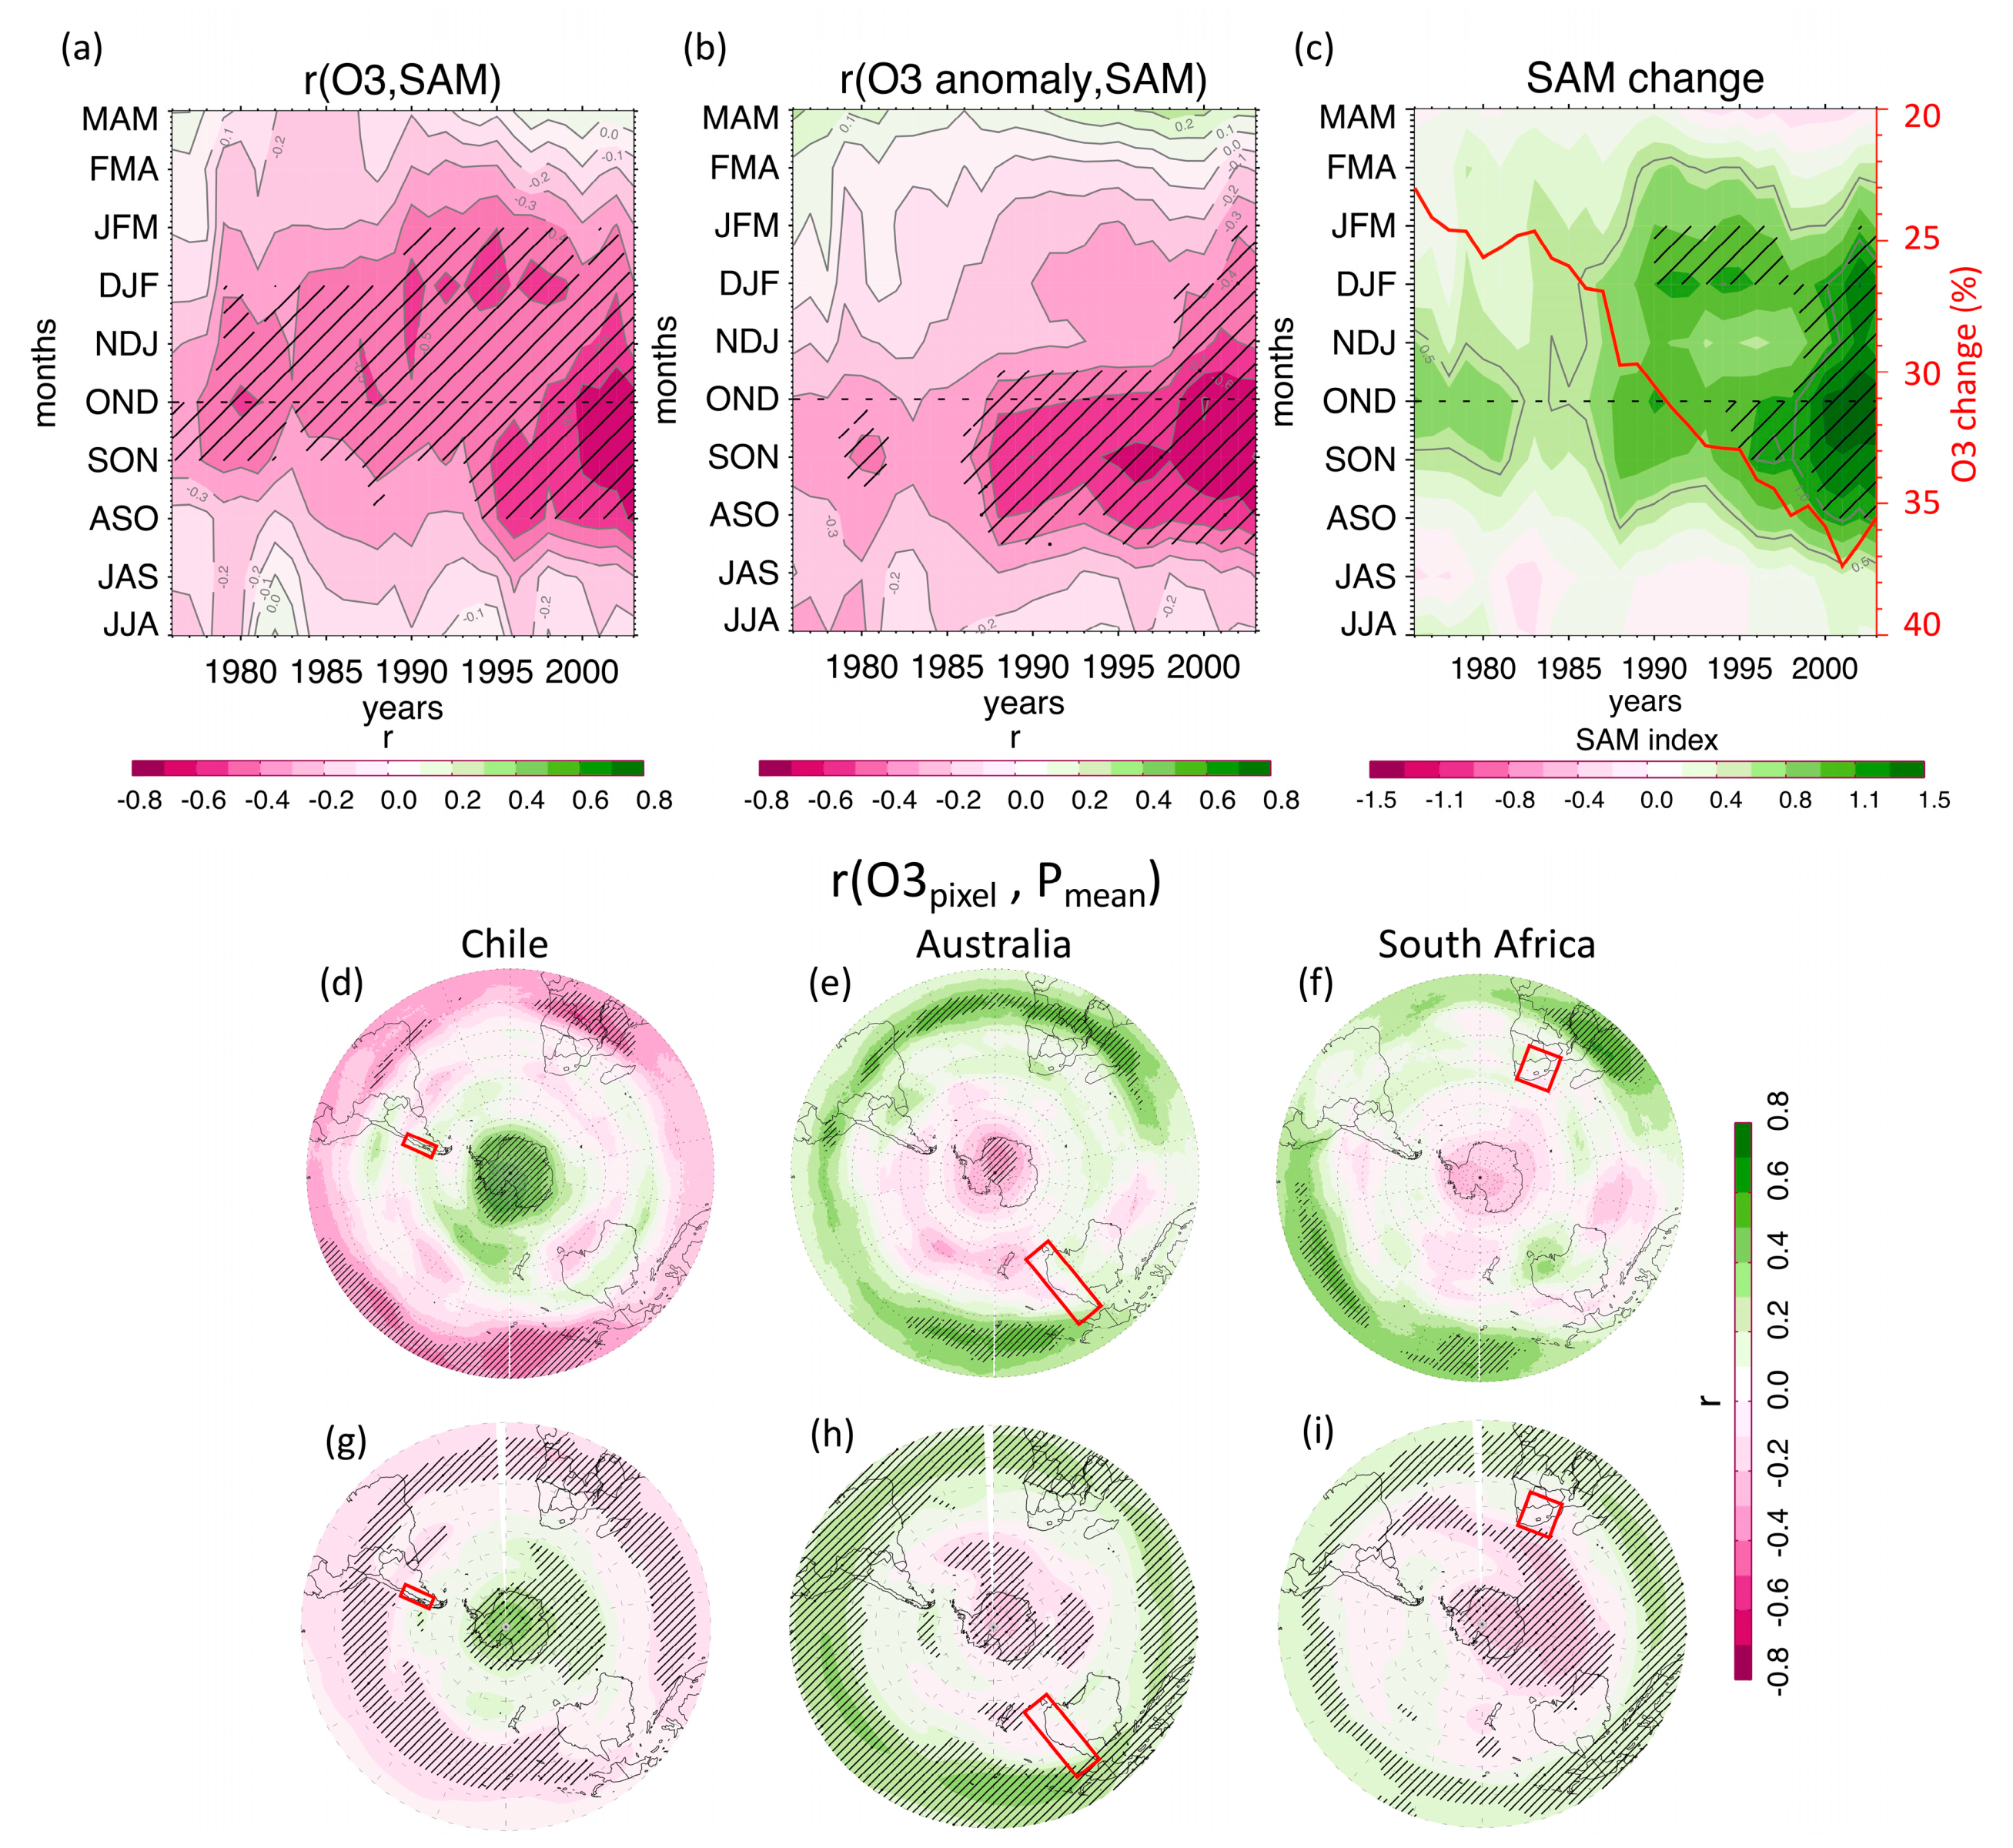
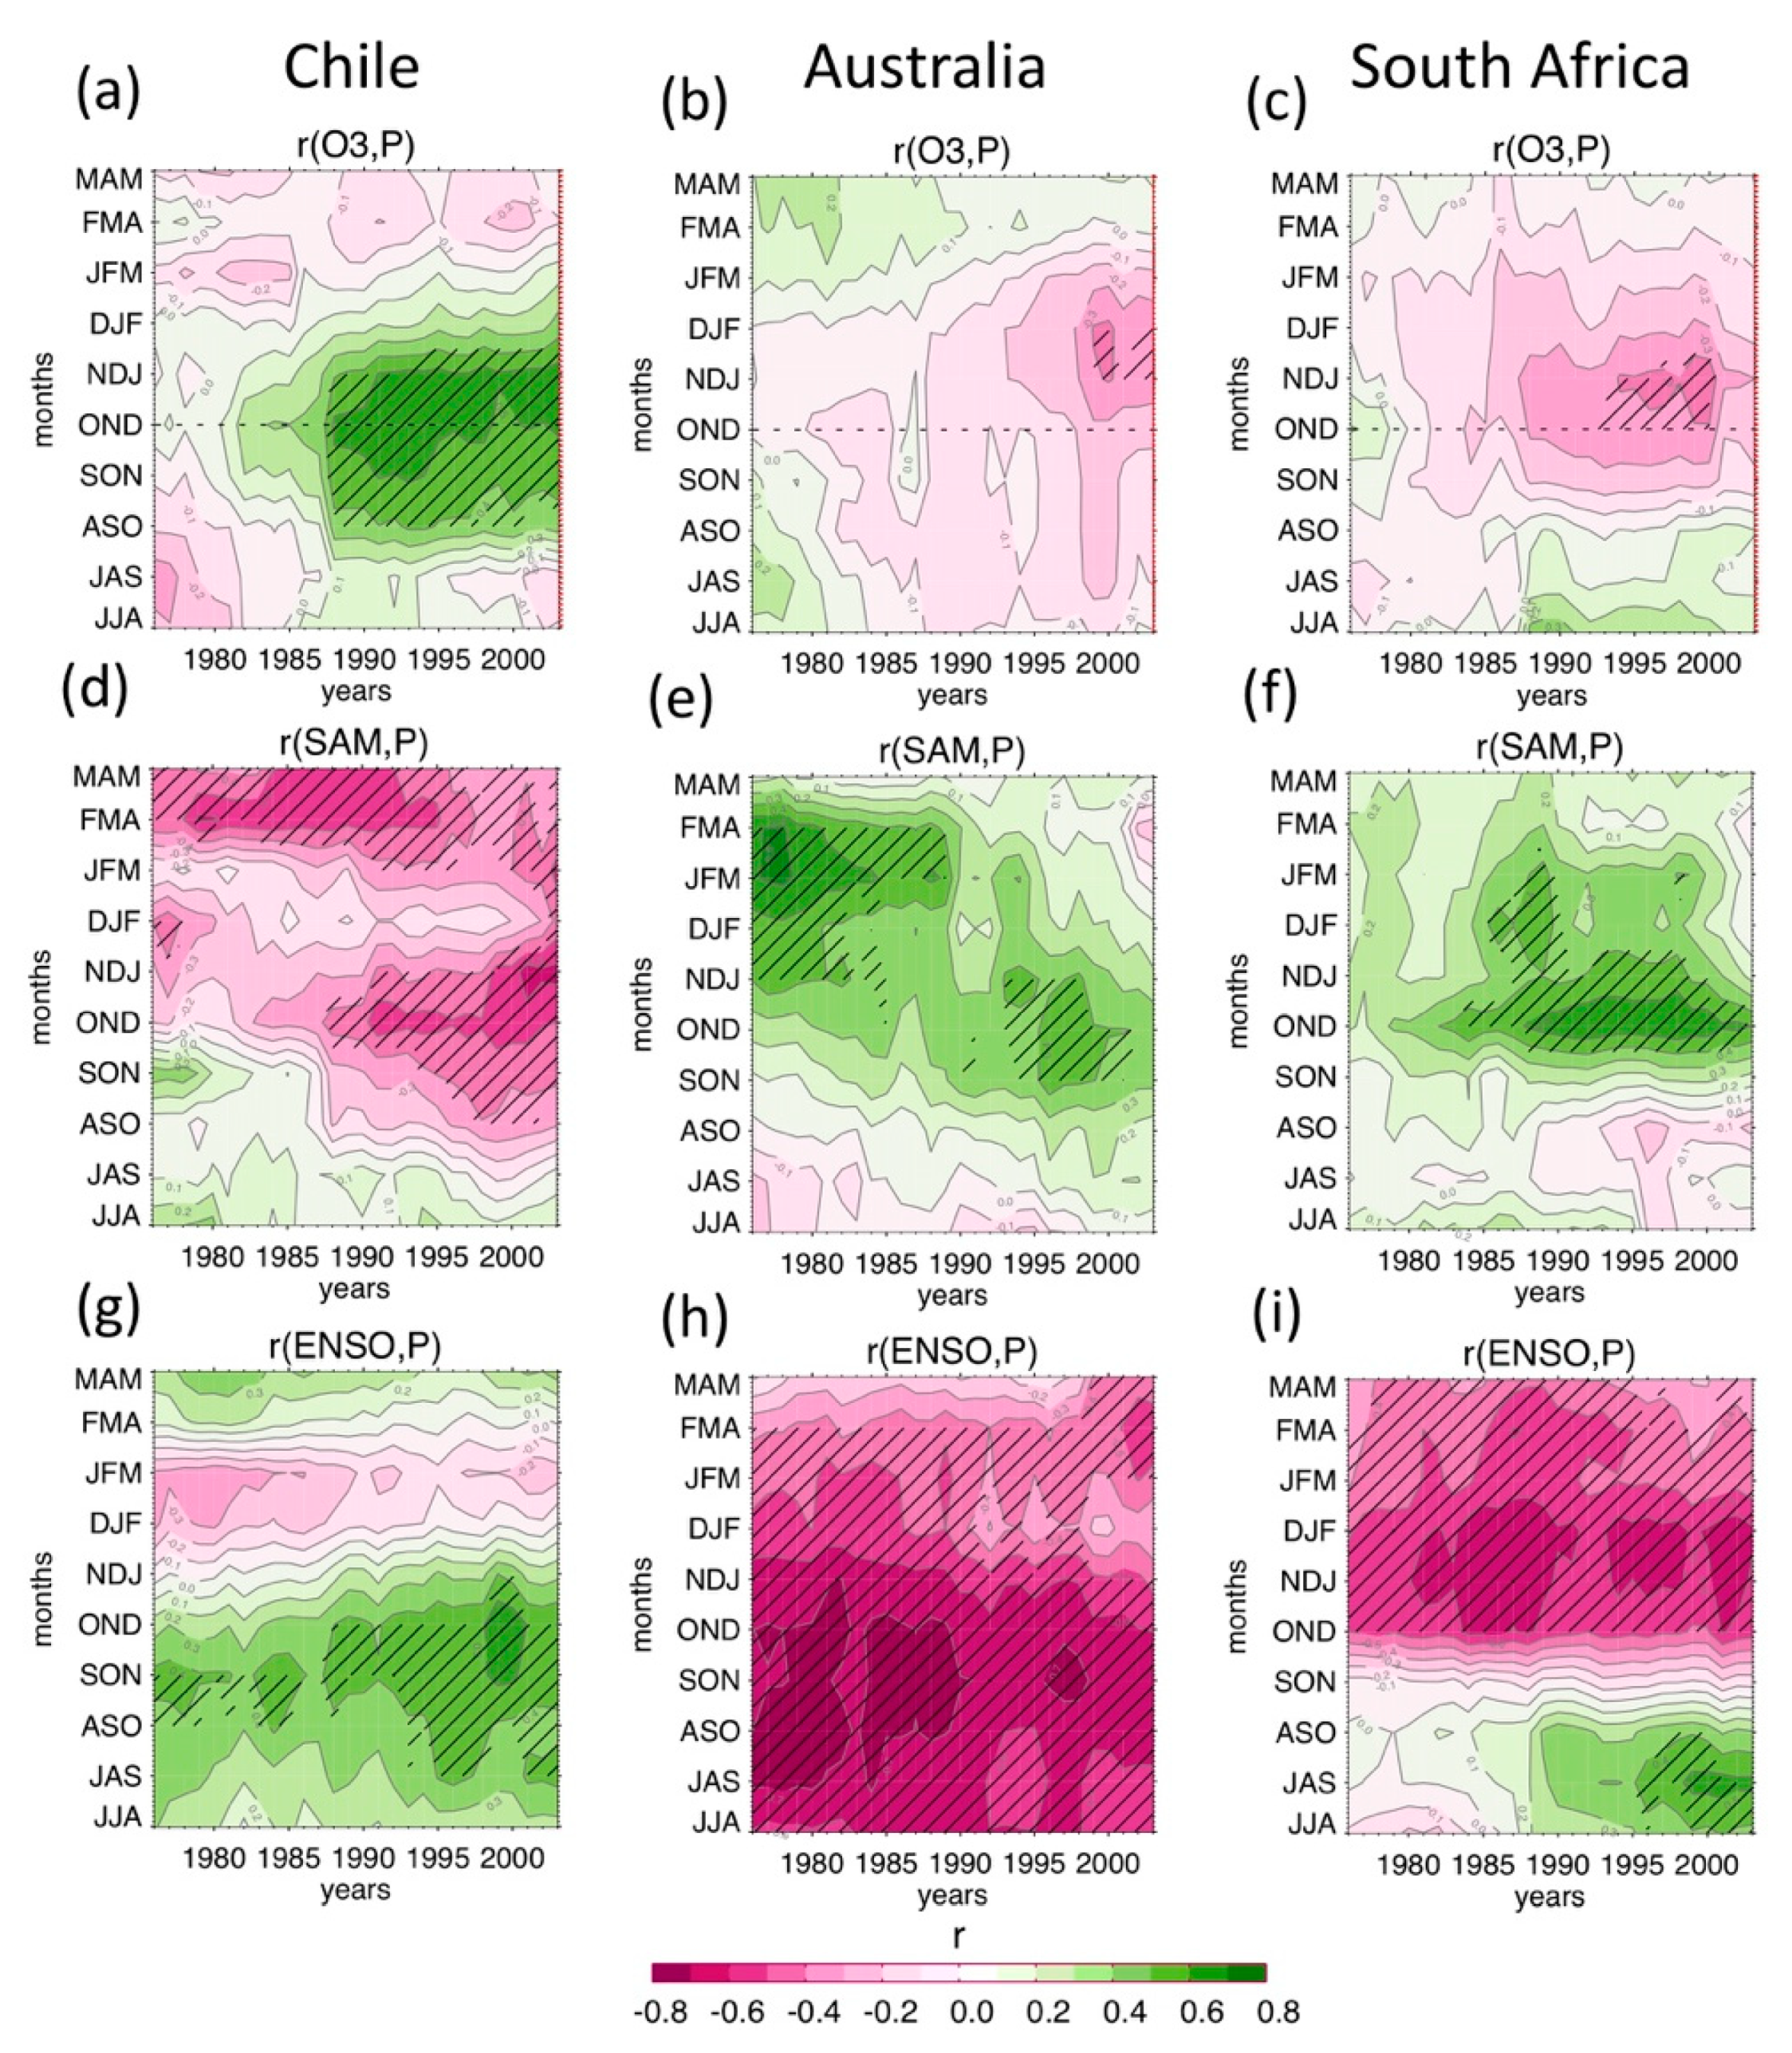
Because the decreasing springtime ozone trend has been associated with the positive drift of the SAM in summer, to highlight the temporal evolution of their connection, Figure 2a shows the 31-year running correlation (with correlation values assigned to the central year of each 31-year-long period) between November total ozone (as in Figure 1a) and the SAM index in the given month (each computed as a mean of three months). To shed additional light on this connection, we also extended the analysis to the previous winter. In this way, we explored the opposite situation, i.e., the SAM in winter leads the ozone in November, likely via changes in winter planetary waves affecting both of them [26]. Overall, a negative correlation, peaking in spring and extending from the next summer to the previous winter, appears to be stronger during the last decades, characterized by the development of the ozone hole, than during the period before.
Figure 2b is equivalent to Figure 2a, except for showing the correlations with ozone anomalies. Here, the discontinuity between the last decades (e.g., 31-year running correlation centered around 1987–2003) and the previous period (e.g., around 1976–1987) is even more evident, and the most recent correlations (e.g., 1998–2003) extend well into the next summer.
Figure 2c shows the running mean of the composite difference in the SAM index achieved by stratifying the data according to the ozone levels in November (i.e., low minus high O3 years). Moreover, the running mean of the spread between low and high ozone anomalies (hereafter, ozone change) is shown as a percentage with respect to the mean on the opposite axis. The resulting SAM difference is positive during the entire time range investigated, but it peaks during the last decades in correspondence with larger ozone changes (red line).
Previous studies have highlighted the influence of the ozone hole on climate by using ground-based ozone observations recorded at various Antarctic stations [5,24,26,29], or ozone data averaged over the polar cap [25], as a proxy of the ozone hole. To evaluate the dependence of the connection between Antarctic ozone and precipitation with the location of the ozone series employed, Figure 2d–f shows the spatial correlation between anomalies of MSR2 total ozone in November for a given pixel and anomalies of GPCC precipitation in NDJ averaged over Australia, South Africa, and Chile (red boxes). We focused on the period of 1988–2018 when the correlation between SAM and O3 anomaly was at the highest levels (Figure 2b); nevertheless, the results are virtually equivalent to the case of using the full MSR2 dataset (i.e., 1979–2018; not shown). For Australia, the correlation is negative and statistically significant at the 95% level only within a limited Antarctic region (i.e., southern of 70° S and roughly within the sector 40° W–40° E), but it is not even significant for South Africa. In contrast, a clear positive correlation extending over the whole of Antarctica is evident for Chile. Moreover, due to the influence of the Brewer–Dobson circulation on the ozone distribution, all regions show an evident correlation with ozone at tropical latitudes. The simulations (Figure 2g–i) reproduce both the spatial patterns and the sign of the observed correlations and also show a consistent correlation over the Indian Ocean that is not present in the observations. Overall, Figure 2d–i show that the precipitation averaged over the three investigated regions is always correlated with ozone over most of Antarctica. Nevertheless, it can be noted that, usually, ozone pixels at higher latitudes present greater correlation than pixels in other locations for both observations and simulations. This fact adds confidence in using the total ozone observations recorded at the South Pole station against other possible ground-based datasets when a single dataset has to be used as a proxy of the precipitation variability for the whole southern hemisphere. On the other hand, the availably of 3D ozone fields would allow using a proxy based on Antarctic zonal means averaged over high latitudes (e.g., greater than 65–70° S) which is expected to be more representative of the ozone hole variability. Therefore, future studies focusing on precipitation prediction capabilities are likely to be further strengthened by incorporating observed or simulated 3D ozone fields.
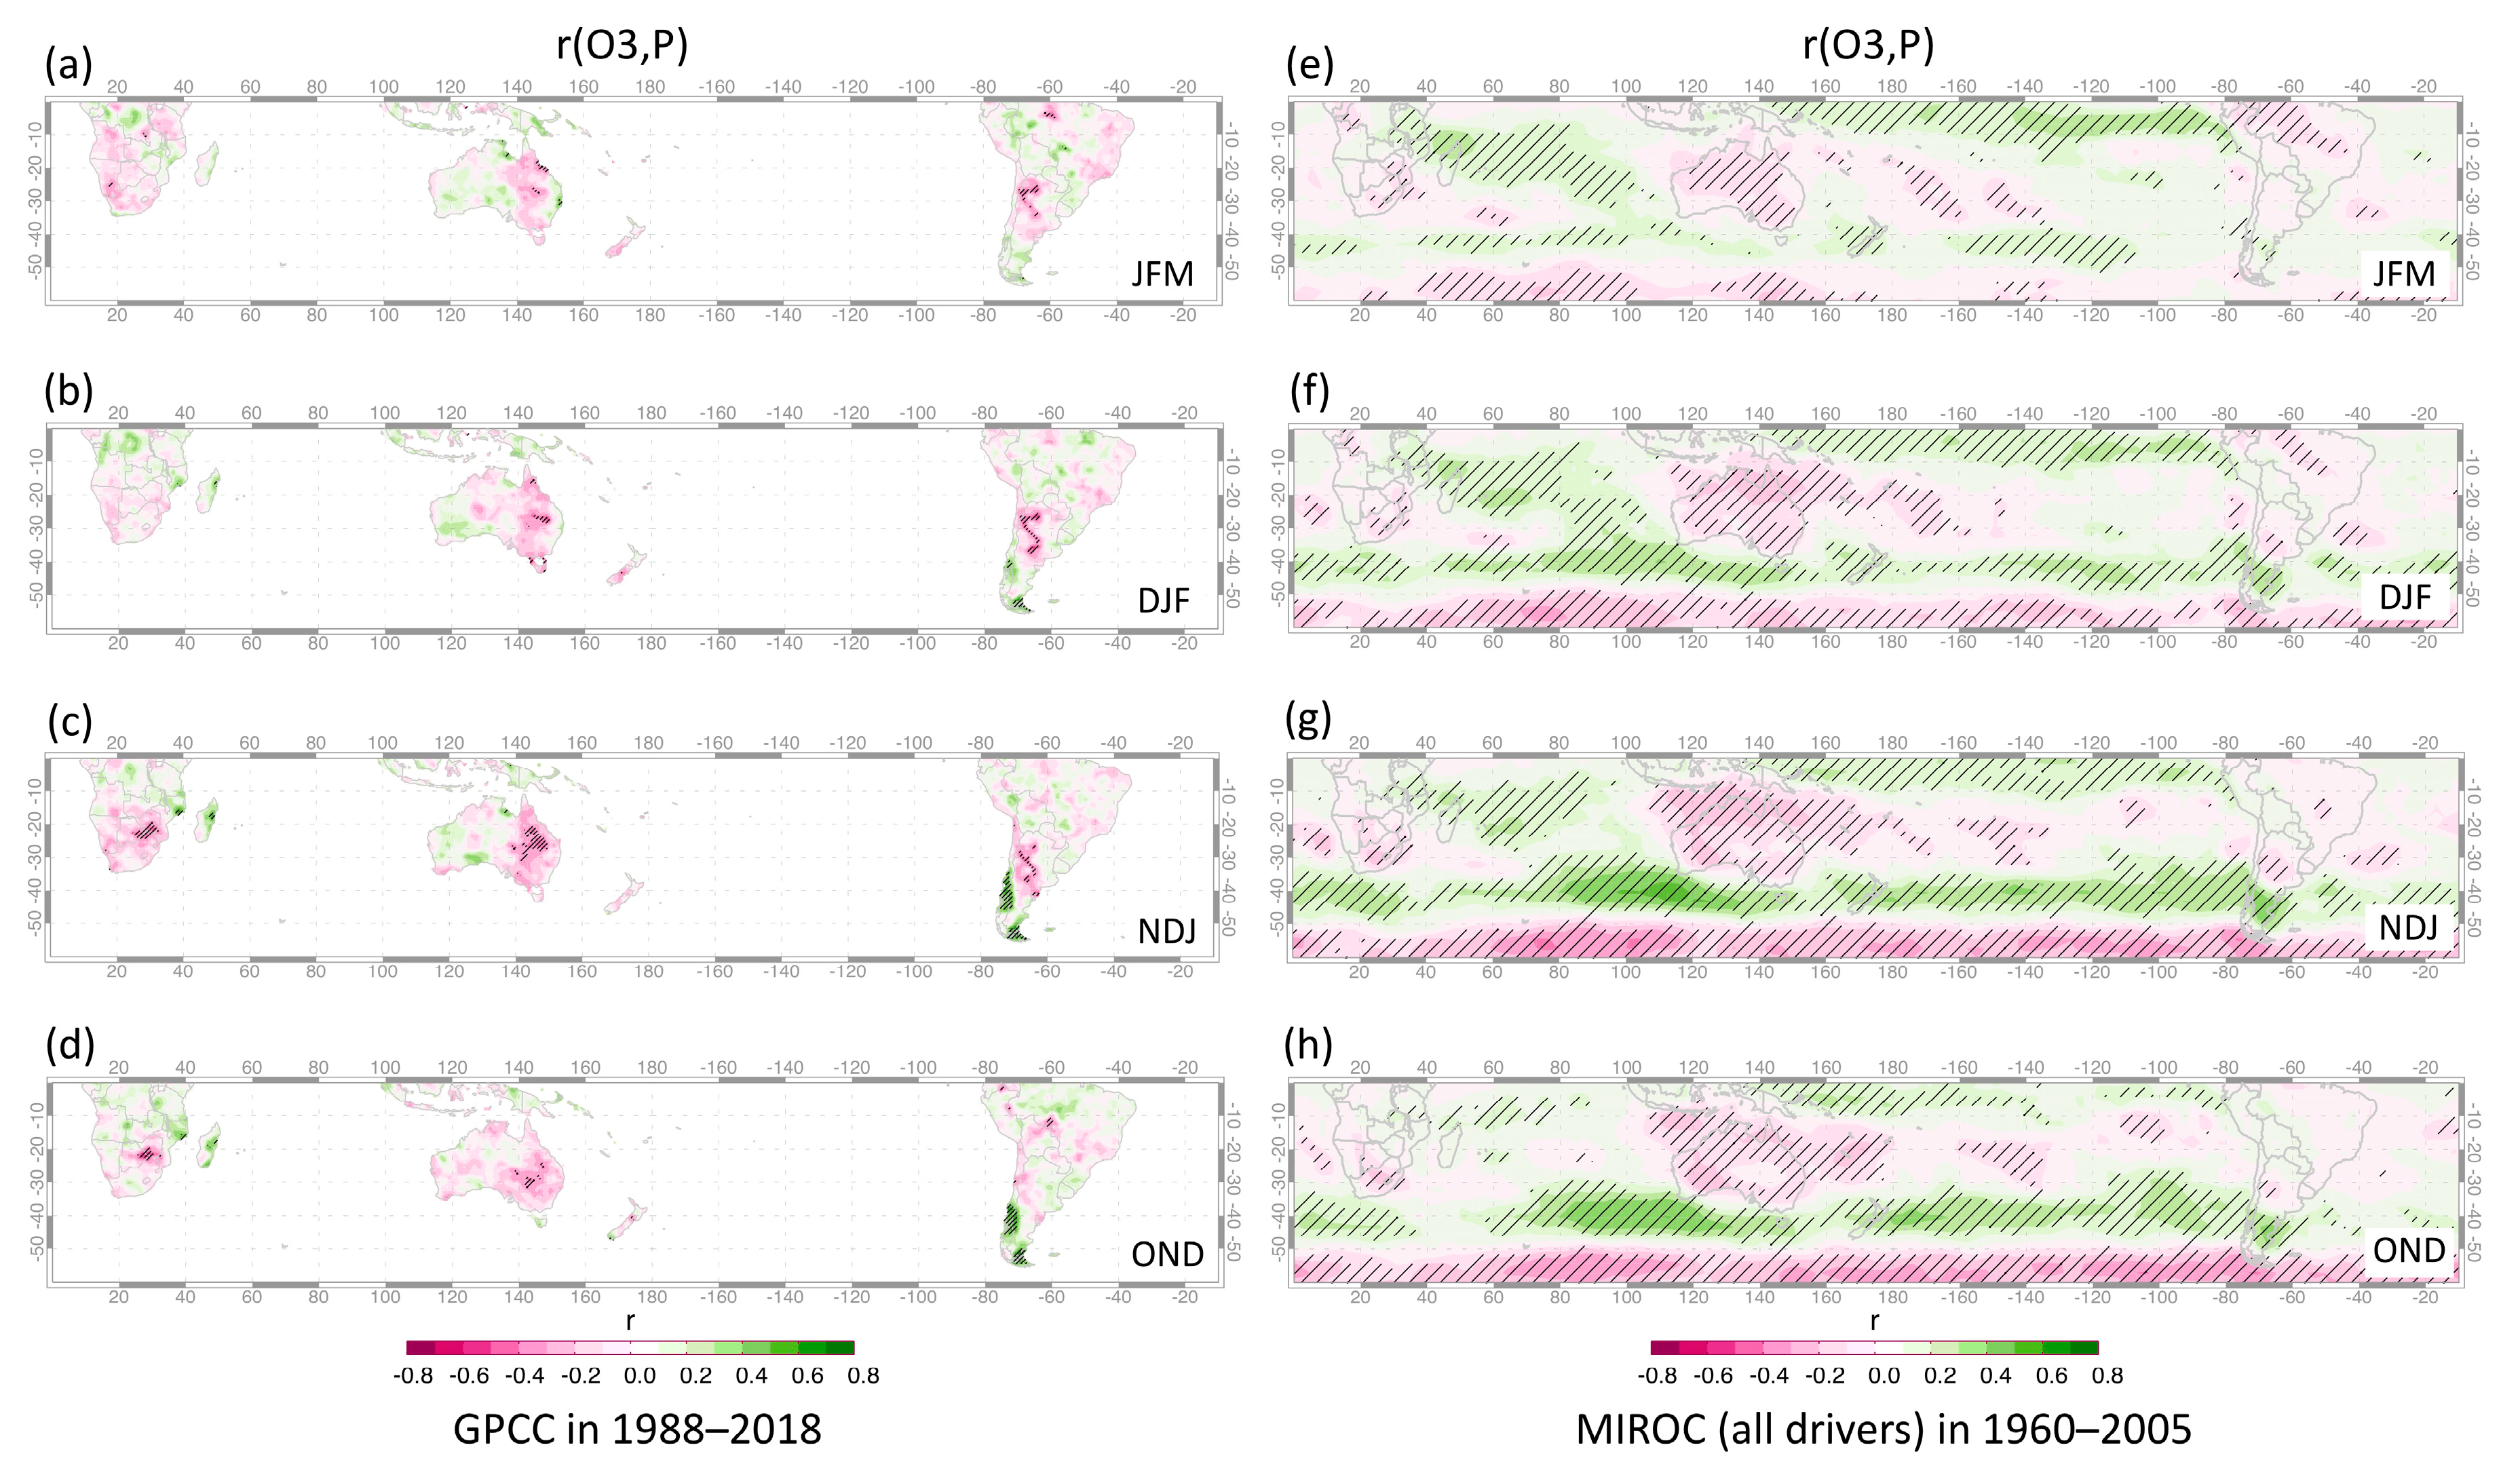
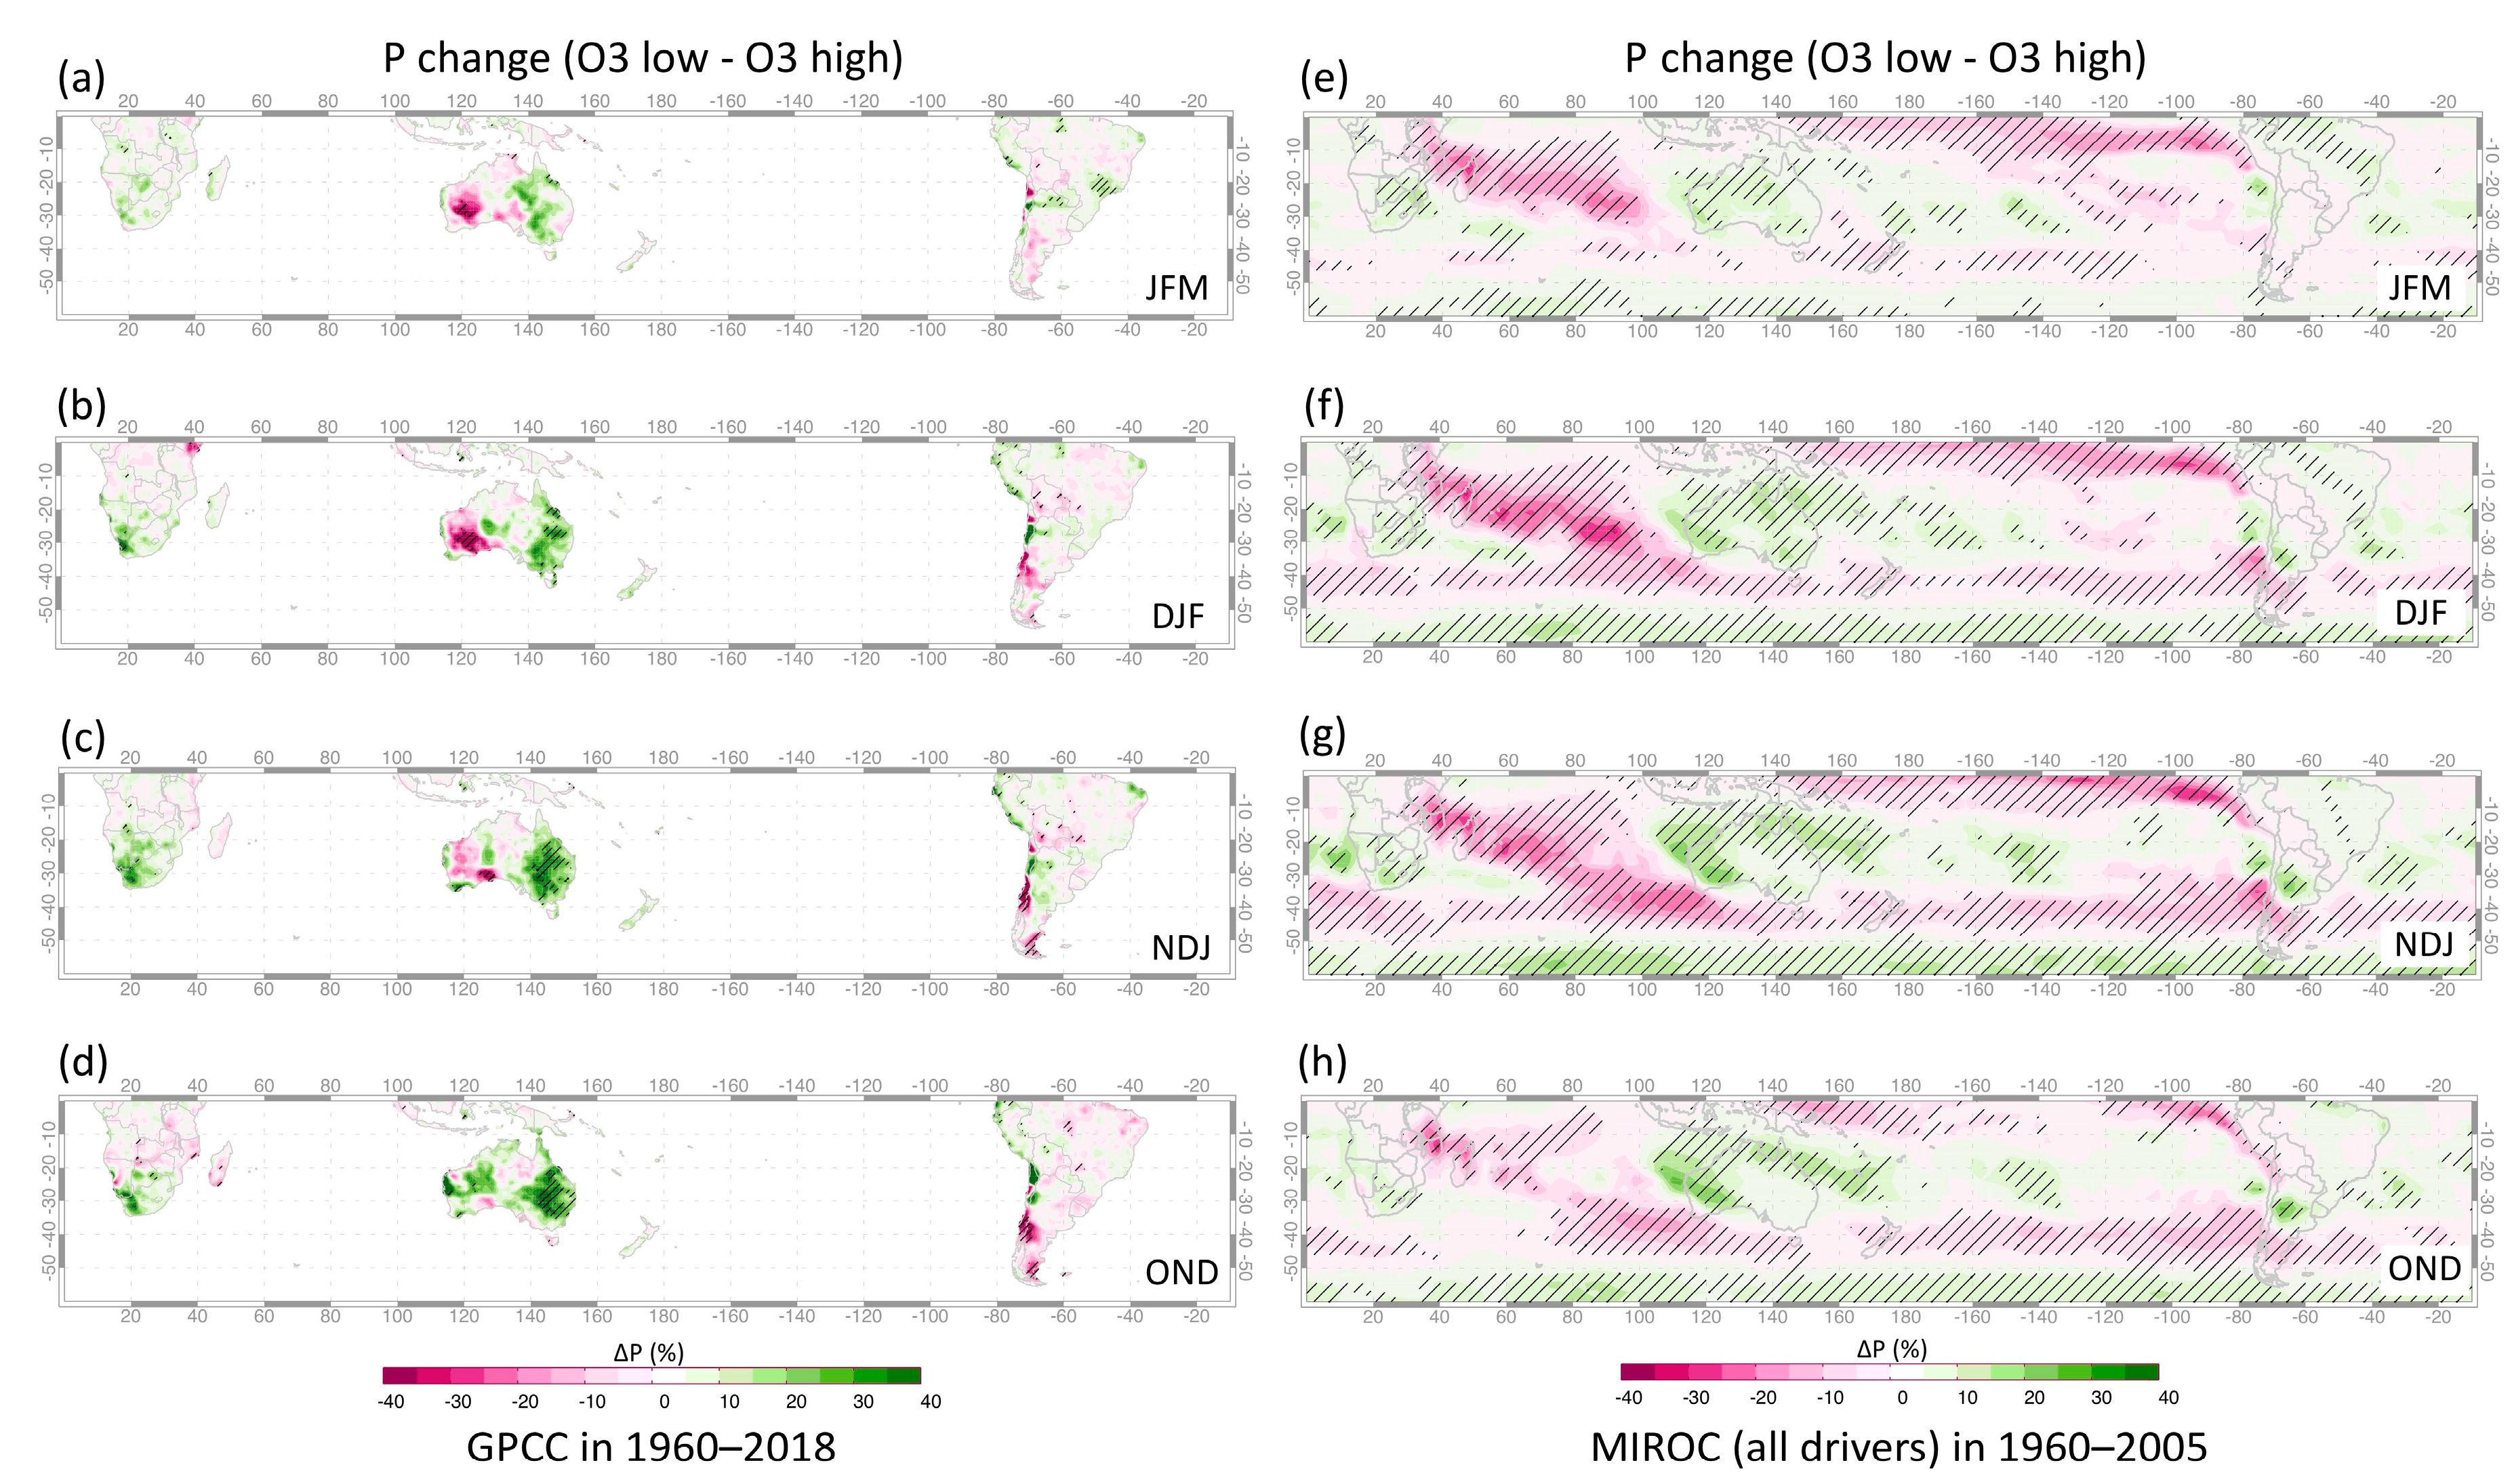
To provide evidence of the possible use of the O3 variability as a predictor of precipitation, the left column of Figure 3 shows the correlation maps between O3 anomalies in November at the South Pole and the observed GPCC precipitation anomalies in (top to bottom) January-February-March (JFM), December-January-February (DJF), November-December-January (NDJ), and OND for 1988–2018 (i.e., during the period characterized by the highest correlation between SAM and O3 anomalies). Overall, the positive correlations along the Pacific coastline of South America and the negative correlations in South Africa and eastern Australia are evident. Over South America, correlations are stronger in spring/early summer (i.e., OND-NDJ), but they tend to persist longer over Australia. In the right column, we show the patterns simulated by MIROC for 1960–2005. Despite the expected influence of El Niño–Southern Oscillation (ENSO) on precipitation, MIROC confirms the main features of the left panels with a somewhat stronger persistence in summer.
Figure 4 shows the 31-year running correlations between O3 anomalies in November at the South Pole (top panels), as well as the SAM (central panels) and ENSO (bottom panels) anomalies in their given months, and the observed GPCC precipitation anomalies averaged over the three regions highlighted above. As a reference, the red vertical dotted lines (top panels) highlight the ozone–precipitation correlation for the most recent 31-year-long period shown in Figure 3a–d. For Chile (left column), the correlation between the SAM and the precipitation is negative, especially during the last decades. The correlation attains its maximum in the late spring/early summer, is reduced in late summer, and then increases again during autumn. Except for autumn, a similar pattern, but with the opposite sign, emerges in the correlation between O3 and precipitation (Figure 4a), while a significant (positive) correlation between ENSO and precipitation (Figure 4g) is evident only in early spring.
The correlations of O3 and SAM with precipitation also have the opposite sign for Australia (central column), although they show a different temporal evolution. Indeed, the relationship between SAM (O3) and precipitation maximizes in summer, mostly during the pre-ozone hole (ozone hole) period. Nevertheless, the O3–precipitation correlation persists longer toward summer than in the other regions.
The ozone variability in November also appears to be a potential predictor of precipitation for South Africa. However, it is worth noting that the impact of ENSO on precipitation maximizes in late spring/summer for both Australia and South Africa. It makes the interpretation of the results and their attribution more ambiguous for these regions.
The maps in Figure 5 present the composite difference (i.e., low minus high November O3 years) of precipitation in (top to bottom) JFM, DJF, NDJ, and OND, calculated using the GPCC dataset for 1960–2018 (left column) and MIROC simulations for 1960–2005 (right column), according to the November ozone anomalies greater than half the standard deviation (σ). The resulting patterns are very similar to the previous correlations shown in Figure 3 (note the inverted color scale) for both observations and simulations. Especially in the observations, positive differences in the late spring are larger than those in summer and maximize around the Pacific coastline of South America and eastern Australia (note that the negative change over western Australia in late summer is not associated with any significant correlation in Figure 3a–b). Although statistically significant changes in MIROC are more widespread, their magnitude is usually smaller due to averaging.
An issue in adopting composite difference analysis is the choice of a correct threshold, which should result in an optimal representation of the investigated phenomenon. For example, in Figure 5, we used a somewhat conservative ozone threshold (i.e., σ/2), so the magnitude and pattern could potentially be different with higher thresholds.
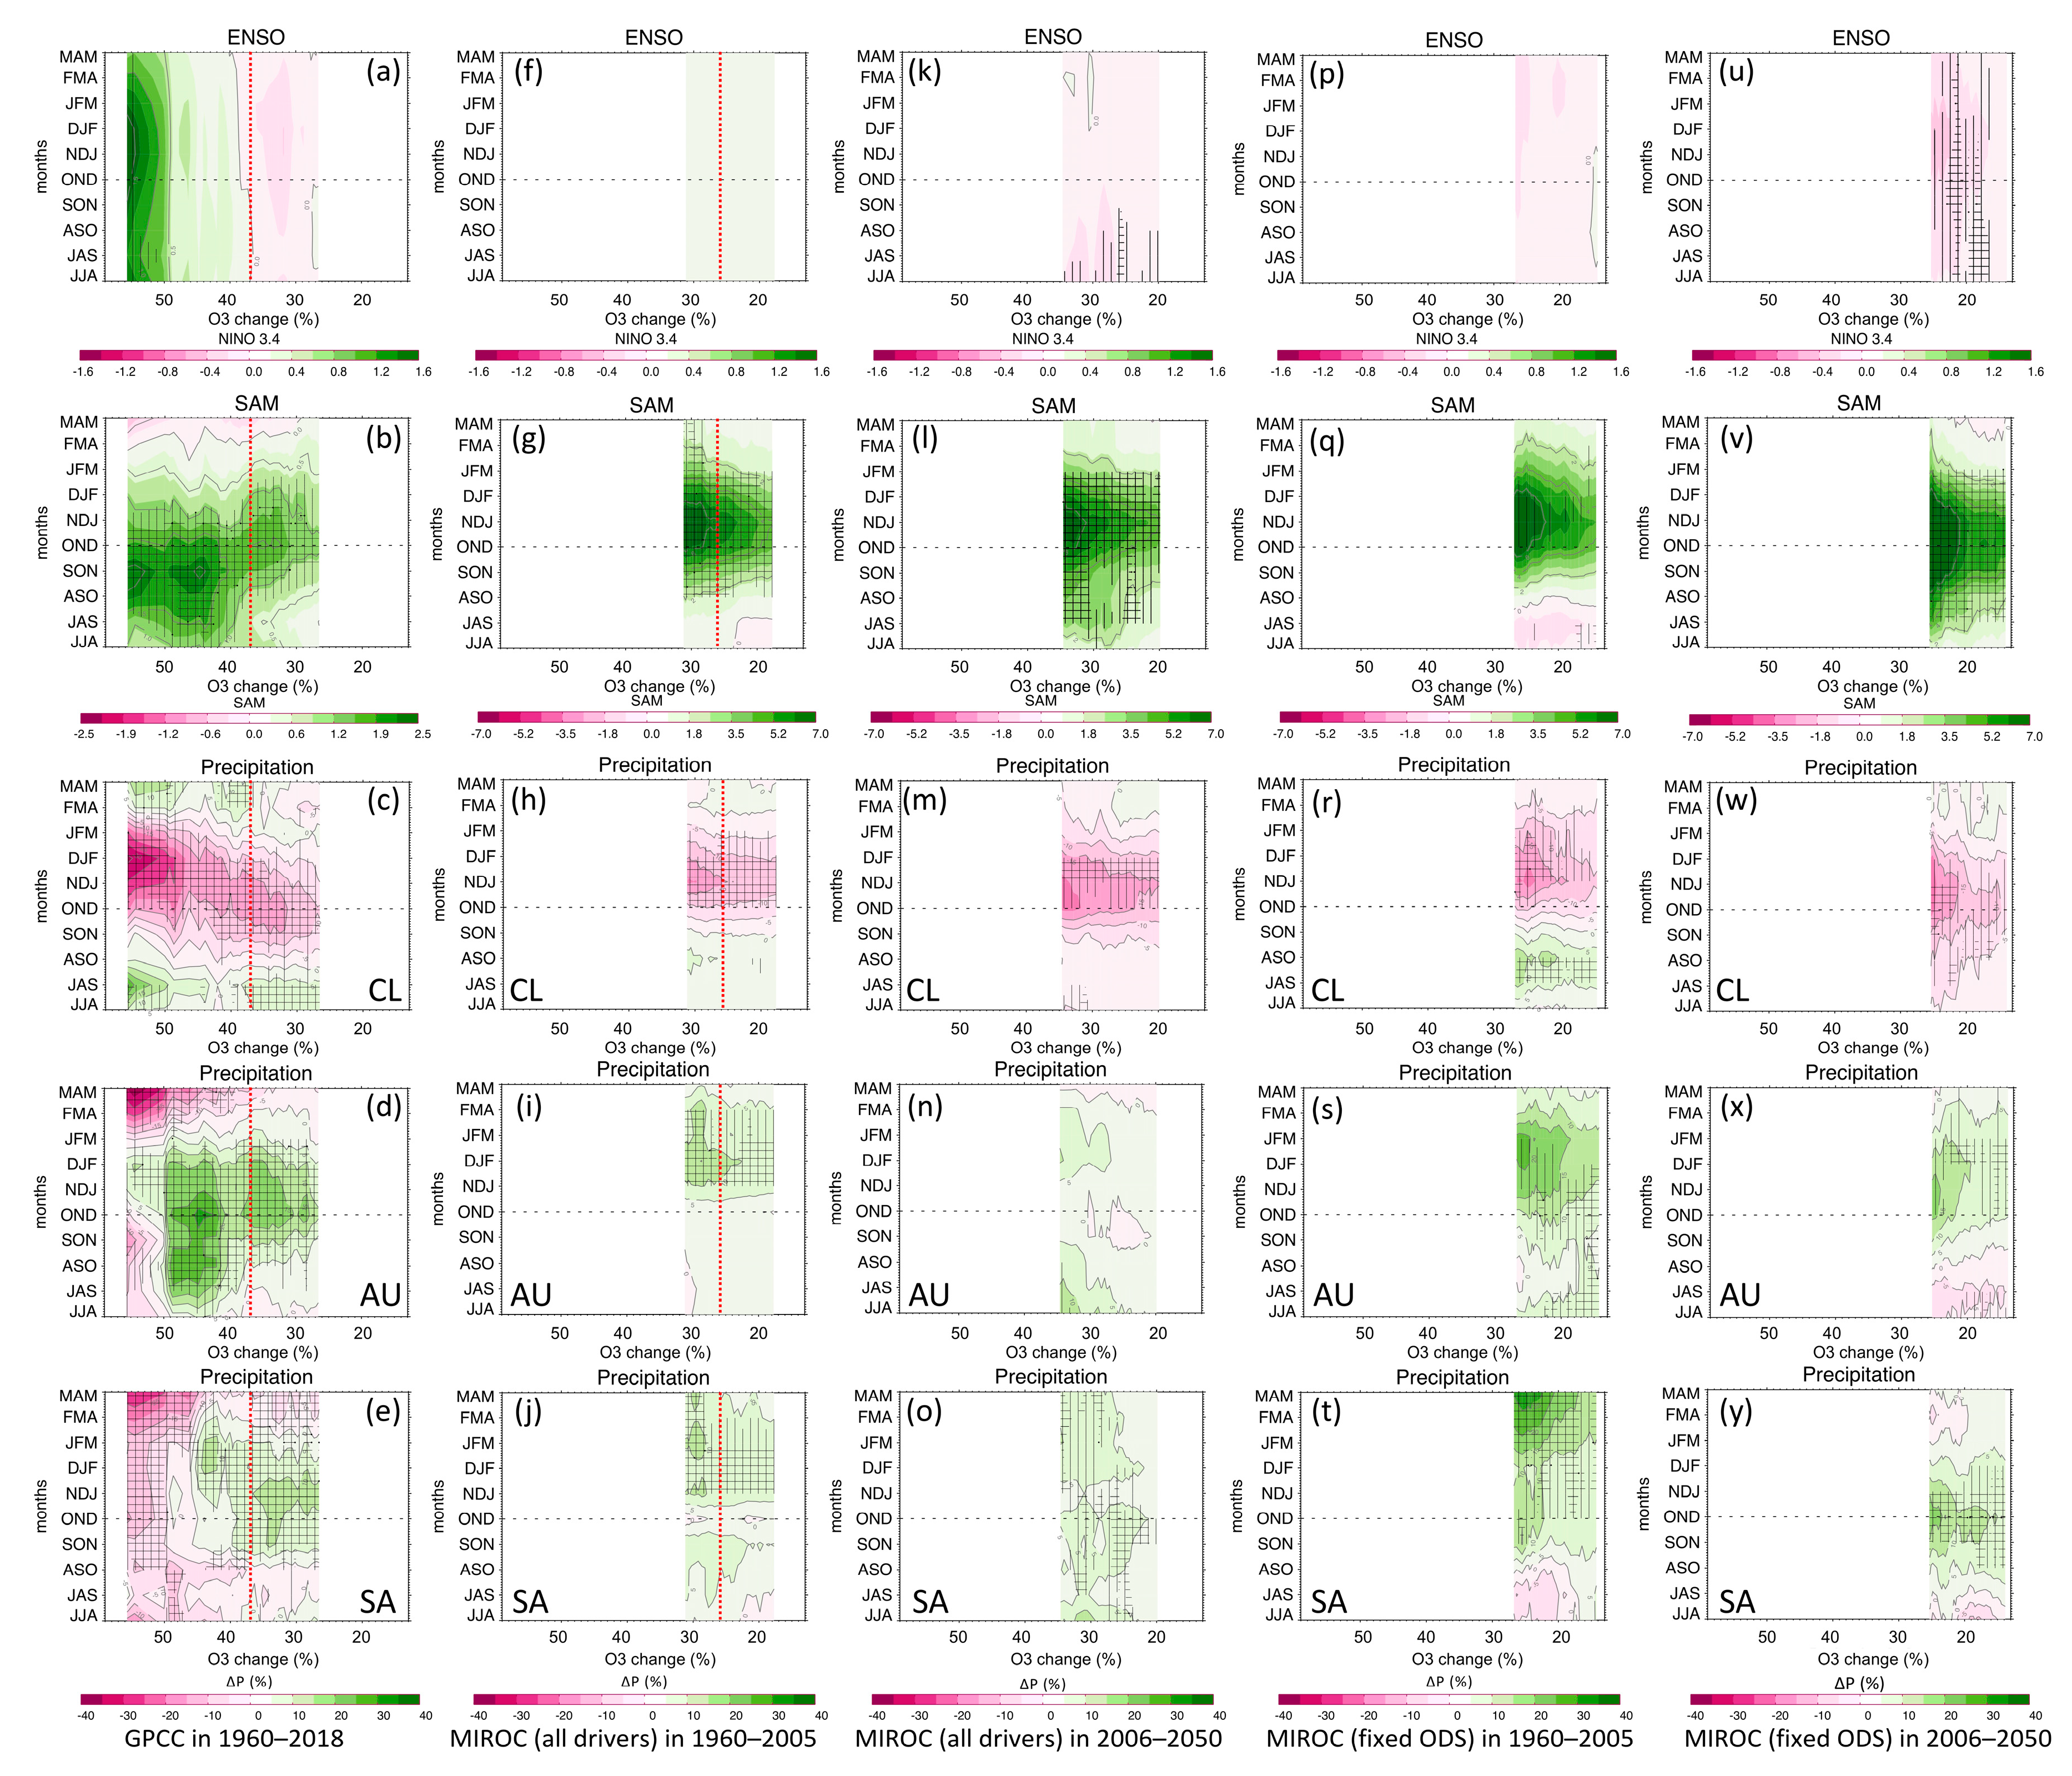
To assess this aspect, Figure 6 shows the composites (low minus high O3), similar to Figure 5, but for distinct seasons and computed by stratifying the time series of the SAM, Niño 3.4, and mean precipitation (averaged within the three investigated regions) as a function of the ozone change (i.e., the mean spread between high and low O3 anomalies resulting from an increasing O3 threshold with steps of 1 DU; the lowest value shows differences for the zero threshold, and the highest value shows differences for the threshold resultant from five samples in both high and low anomalies). As a reference, the red dotted lines highlight the composite difference for σ/2 shown in Figure 5. Overall, the composite difference of the observed SAM is positive and depicts a general increasing difference in SAM along with increasing ozone change (Figure 6b). Such differences have the same sign as the trends of the last decades and roughly span from the previous winter to the following summer.
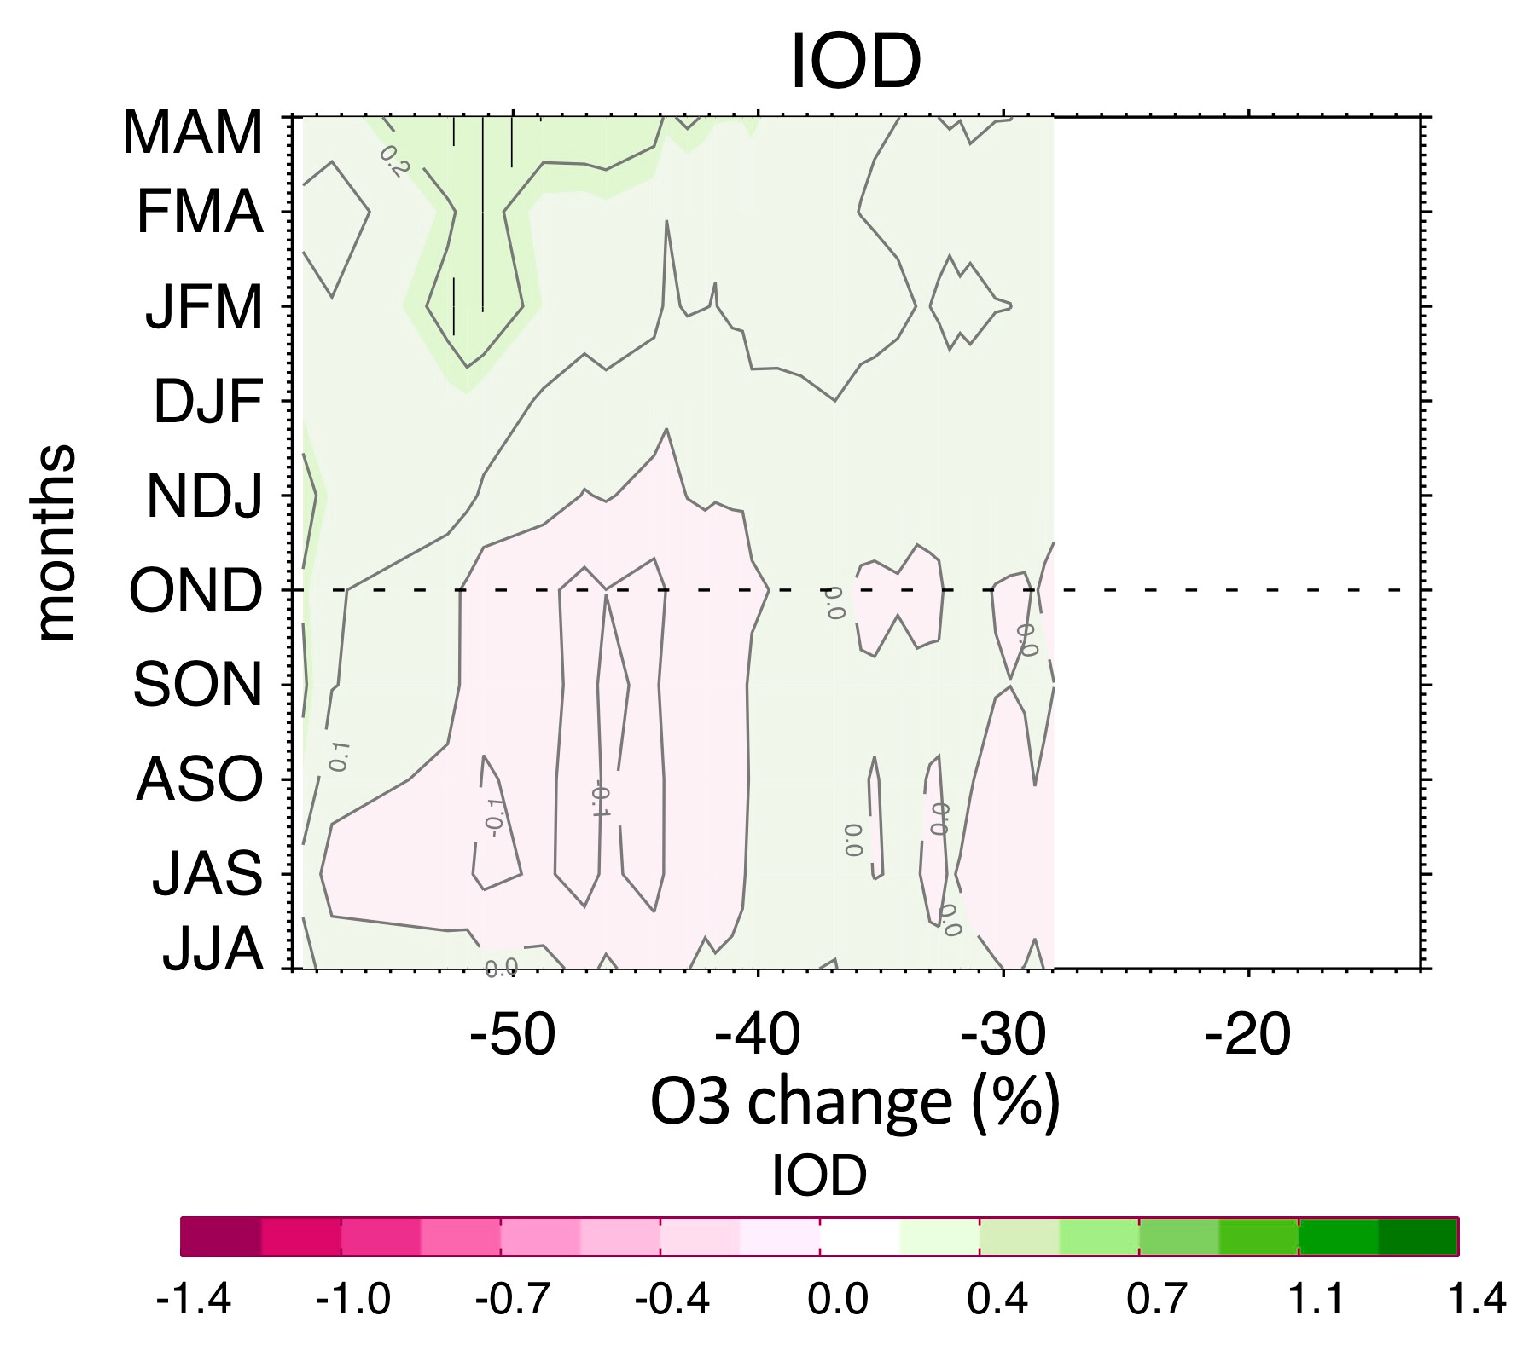
Figure 6c–e shows the difference in precipitation within the various regions. While we observe a tendency toward increasing drying along with increasing ozone change for Chile (Figure 6c), Australia, and South Africa show the opposite trend (Figure 6d,e; however, for South Africa, the sign reverts for high ozone). For Chile and Australia, and for South Africa to a lesser extent, this difference in precipitation, which develops under a positive SAM, is characterized by a well-defined pattern that extends to the following summer. Nonetheless, the composites show some discontinuities. Precipitation differences associated with smaller ozone changes (i.e., O3 < 40%) usually extend toward the following summer and match the simulations better (Figure 6h–j). In contrast, for Australia, the observed composite difference associated with larger changes also covers the previous winter. Finally, differences in precipitation associated with the highest ozone changes (i.e., O3 > 50%) are coupled with a moderate positive difference in the Niño 3.4 index (Figure 6a), which is already developed in the previous winter and peaks in the following summer. For South Africa, this discontinuity reverses the sign of the precipitation difference; however, for Australia, it is associated with a sudden decrease in these differences. Further composite analysis of other modes of variability did not present any significant change (e.g., Figure A2 shows the composite differences for the Indian Ocean Dipole index [38] which is supposedly affecting Australian precipitation). Note that correlations between ENSO and precipitation for both regions are negative in summer (Figure 4h,i), and are likely to explain the change of pattern. Although the correlation between ENSO and precipitation is mostly low and not significant for Chile, ENSO tends to reinforce the already negative difference.
Overall, MIROC (all drivers) historical simulations (Figure 6f–j) reproduced the observed patterns but with some differences. First, different from the observations, in MIROC, the peak in the SAM composite (Figure 6g), which occurs in NDJ, is mostly associated with the largest precipitation difference. In addition, in agreement with previous studies [26], simulated SAM differences persist well into the summer, more so than in the observations. Furthermore, although the largest change in the SAM occurs one month before the reference period (which is in OND) in the observations (Figure 6b), in the simulations (Figure 6g,l,q,v), it occurs one month later (i.e., SON for observations and NDJ for simulations). Finally, the observations show an increased positive SAM in winter, which is largely absent in the historical MIROC (all drivers) simulations.
MIROC (all drivers) does not show any evident difference in the ENSO composite (Figure 6f). Moreover, statistically significant changes in precipitation do not occur in winter; however, under comparable ozone change, the observed intensity of the precipitation difference is somewhat well reproduced for spring–summer, although MIROC precipitation peaks a month later (NDJ) than in the GPCC data.
In general, the future projections (Figure 6k–o and Figure 6u–y, the latter with ODS fixed at 1960 levels) present less significant precipitation changes, and this is particularly evident for Australia (Figure 6n). Moreover, SAM differences extend more toward the previous winter (Figure 6l,v) than in the case of the respective historical simulations (Figure 6g,q). Nevertheless, although they are small, we note statistically significant negative differences in the ENSO composites (Figure 6k,u). Finally, simulations with ODS fixed at 1960 levels (Figure 6p–y) generally show composite differences characterized by patterns analogous to those of the corresponding historical simulations, although with lower significance (e.g., Figure 6q).
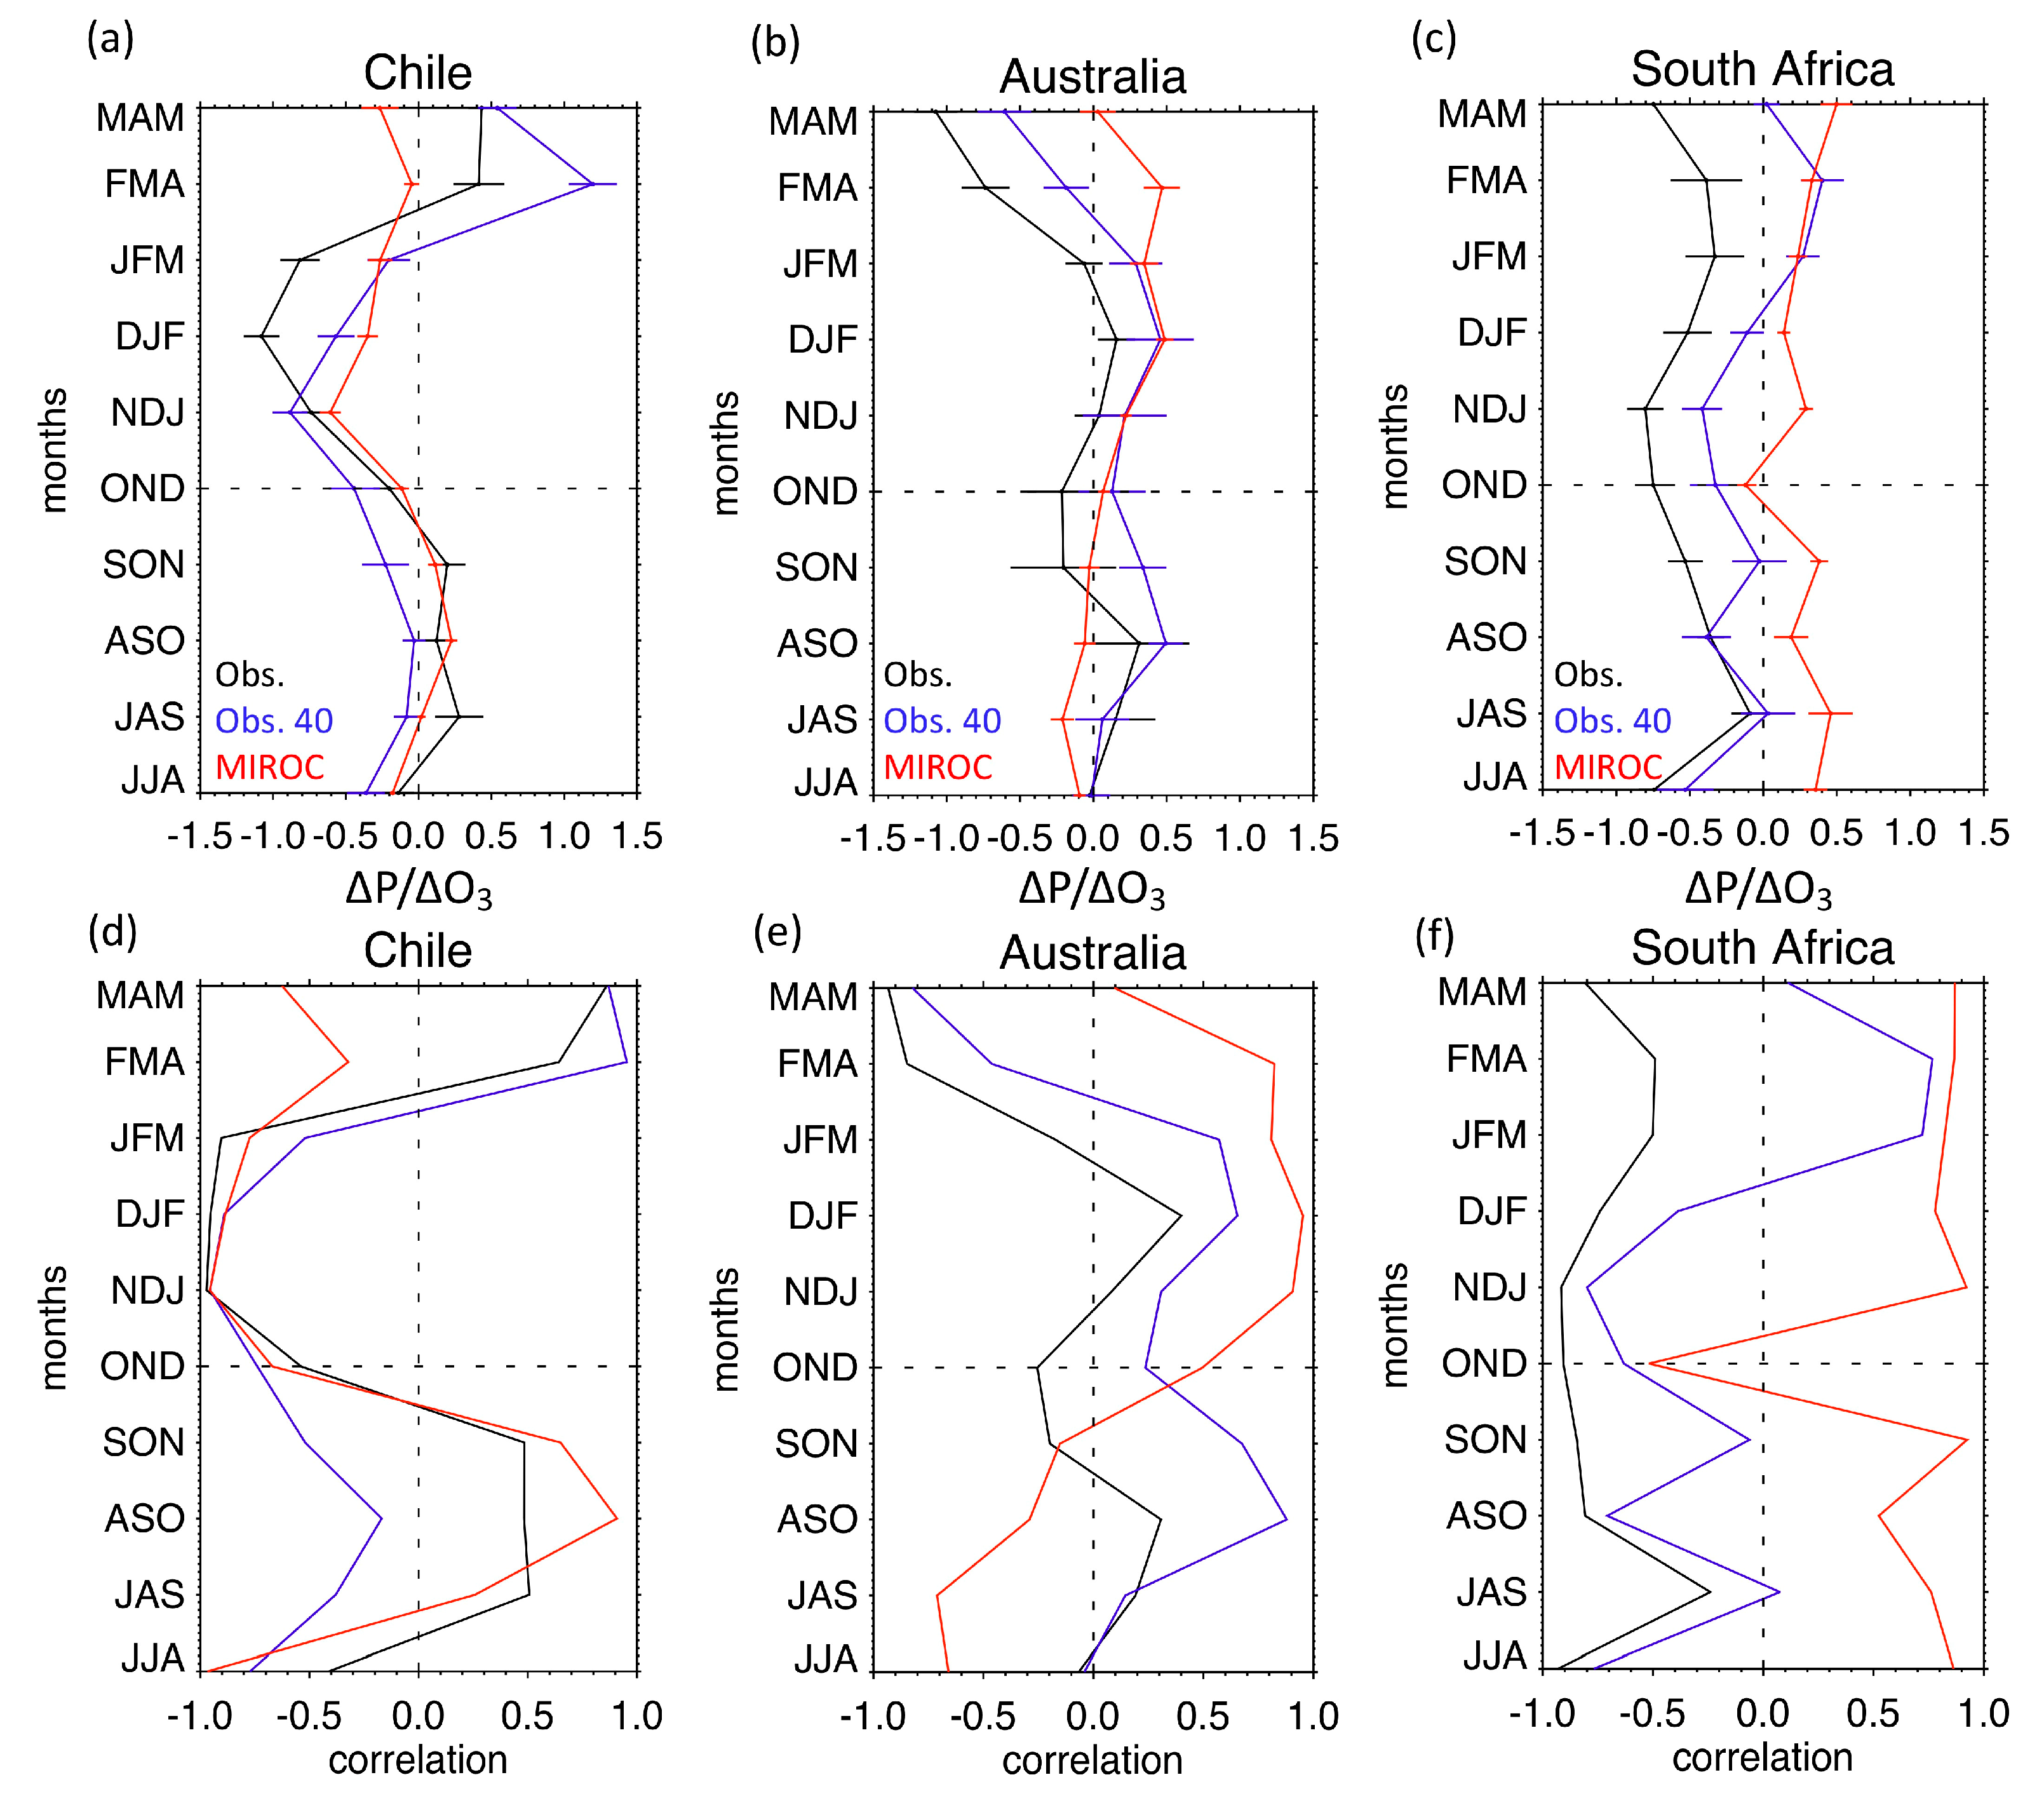
Figure 7 shows the slope of the linear regression line and the Pearson correlation between the precipitation differences and the corresponding ozone changes shown in Figure 6. Here, the slope depicts the sensitivity of the composite difference in precipitation to the ozone change (i.e., ΔP/ΔO3). Because precipitation differences and ozone changes are usually scarcely correlated in winter (Figure 7d–f) and values are not statistically significant (except for observations in Australia in ASO; see Figure 7b), we focus the following discussion on the spring–summer period, although we also show the values for winter, for completeness. For Chile, the simulated (red lines) and observed (black lines) correlations are negative and peak at approximately −0.9 in both NDJ and DJF, with somewhat smaller values in JFM (Figure 7d). In NDJ, ΔP/ΔO3 is around −0.7 for both observations (black lines) and simulations (red lines; see Figure 7a); however, in DJF and JFM, the sensitivity of the observations becomes slightly greater than the sensitivity of the simulations. Nevertheless, limiting the observational dataset to ozone changes comparable to the simulations (e.g., O3 < 40%, which corresponds to the discontinuity discussed above; see blue lines) makes its sensitivity much closer to the simulations in summer. The same occurs for Australia, with both the observed and simulated sensitivities peaking at around 0.4 in DJF. Here, it is worth noting that sensitivity change persists longer into the summer (FMA) for the simulations than for the observations (see [29]). Finally, no definitive conclusions can be drawn for South Africa, where the composite differences appear to be less robust than for the other regions. Indeed, Figure 7c does not show clear peaks in sensitivity and the correlation values show a large spread between the observations and simulations.

4. Discussion and Conclusions

In this study, we analyzed the interannual relationship between Antarctic ozone and precipitation in the SH with special care given to some regions where previous studies showed an ozone hole-induced influence on the trends of the surface climate. Although the main goal was evaluating late springtime (i.e., November) ozone anomalies as a predictor of summer precipitation, we also extended the investigation to other seasons.
First, we found that the correlation between O3 anomalies in November and SAM anomalies in late spring/summer was higher (lower) and more (less) persistent during the most recent (oldest) decades (Figure 2b). The increased correlation between O3 and SAM during the latter decades (Figure 2a) has been ascribed to an overall ozone-induced strengthening of the vortex along with a consequent postponed final warming and deeper and long-lasting stratosphere–troposphere coupling, ultimately resulting in a more frequent positive phase of the SAM [39]. This mechanism also potentially worked at the interannual time scale.
However, the 31 years running correlation between November ozone and spring-summer SAM anomalies for MIROC (all drivers) simulations showed a robust correlation also in the earlier decades, e.g., during 1965–1995 (see Figure A3a; correlations values were assigned to the central years, i.e., 1980 for 1965–1995). Although observations showed less evident changes in this period (Figure 2b), we still note a corresponding peak in spring (SON) with a tendency for the signal to extend into the summer. Furthermore, the correlations between the observed ENSO and SAM anomalies (Figure A4a) indicate that they are not fully independent and that the sign of the correlation changes depending on the season [40]. It has been suggested that this connection can occur because larger sea surface temperature anomalies in the tropical Pacific during El Niño years force Rossby wavetrains, resulting in positive pressure anomalies at higher latitudes (i.e., Amundsen-Bellingshausen Sea) [41] and, therefore, in negative correlation. Since about 1999, the spatial structure of ENSO has moved from an eastern Pacific to a central Pacific type [42]. It has been suggested that this variation is also coupled with a change in the SAM [43]. Finally, although we did not find an evident correlation between November O3 and ENSO anomalies (Figure A4b), previous studies have suggested that more frequent vortex disturbances and positive ozone anomalies are associated with El Niño [44].
Stratifying the observed SAM index according to springtime O3 levels (low minus high O3 years) allowed the highlighting of positive SAM differences (see Figure 2c and Figure 6b). This outcome occurred toward the next summer, when November O3 was the driver of SAM changes in summer, as well as toward the previous winter, with late winter/spring SAM being the driver of the O3 changes. The latter implies that both O3 and SAM could be influenced by the winter planetary waves without a direct relationship between them. Overall, it appears that the largest changes in the SAM are actually associated with planetary wave disturbances.
We also found that the correlation between the observed O3 and precipitation tended to be at a maximum during the last decades for all investigated regions (Figure 4a–c). Overall, Australia was the region with the longest persistence of correlation between O3 and precipitation (Figure 3), although a generally more robust connection between precipitation and Antarctic ozone has been highlighted for Chile (Figure 2d and Figure 4a).
A pronounced drying tendency in Chile with an increase of ozone change contrasts with the moistening tendency found in Australia and, to a lesser extent, South Africa. The magnitude and sign of the observed precipitation difference in spring–summer is similar to those of the simulations for comparable ozone change (e.g., <40%; see Figure 6). On the other hand, for more substantial ozone change, the observed precipitation differences become larger and cover the prior winter in Australia, and have the sign changed from positive to negative in South Africa, and keep increasing without a clear connection with the corresponding SAM difference in Chile (Figure 6). Because the simulated ozone anomalies were usually smaller than the observed anomalies, we did not attempt to compare the composites associated with the largest ozone changes with the simulations. However, it is worth noting that these largest ozone changes were associated with positive differences in the Niño composite. This is consistent with previous findings suggesting that more frequent vortex disturbances and positive O3 anomalies are associated with El Niño ([44], and references therein).
We also evaluated the sensitivity of precipitation to ozone change. Under comparable ozone change, ΔP/ΔO3 for both observations and simulations peaked at around −0.7 in NDJ for Chile and at +0.4 in DJF for Australia, whereas no clear conclusions could be drawn for South Africa.
Overall, our results suggest that springtime ozone anomalies in Antarctica can be used as a predictor of subsequent summer precipitation, at least for Chile and Australia. Because MIROC–ESM–CHEM coupled experiments reproduced most of the observed connections, incorporating ozone variability into seasonal forecasting systems could potentially improve seasonal predictions.
Although our simulations with ODS, held fixed at 1960 levels, showed a less significant linkage between ozone and surface climate, the patterns remained similar to those of the historical simulations. This implies that ozone anomalies can be mostly perceived as a tracer of stratospheric circulation, while stratospheric ozone chemistry contributes to strengthening the relationship between ozone and surface climate. Indeed, under the current high levels of halogen, the Antarctic ozone is more sensitive to dynamical changes. Ozone depletion causes a reduction in shortwave heating, leading to stratospheric cooling and to more stable and persistent polar vortex conditions, which facilitate the formation of polar stratospheric clouds and lead in turn to enhanced ozone depletion. Then, it is worth noting that the future simulations, under the RCP 4.5 scenario, showed a diminishment of the connection between ozone and precipitation, as well as more consistent SAM differences extending to the prior winter, as in the observations.
The simulation results of this study are based solely on a single model (i.e., MIROC-ESM-CHEM). Therefore, potentially, they could be partially biased by some specific issue of this model, such as rainfall [45] and jet climatology [46], sea ice extension [29], and spatial resolution. Nevertheless, the main conclusions appear to be robust and consistent with our preliminary analysis (not shown) based on a subset of chemistry–climate models (CCMs) showing patterns in the ozone-surface climate comparable to MIROC simulations and observations in particular for South America. Future investigations based on a larger suite of CCMs will allow confirmation of such features and investigation of the mechanisms behind such changes.

Author Contributions

Conceptualization, A.D., R.R.C. and P.J.L.; methodology, A.D., R.R.C. and J.P.B.; simulation, S.W.; analysis, A.D., P.J.L. and S.F.; writing—review and editing, A.D., R.R.C., P.J.L., S.F., J.P.B., R.R., R.G., H.I., S.W.; All authors have read and agreed to the published version of the manuscript.

Funding

This research was supported by the Environment Research and Technology Development Fund (2-1901) of the Environmental Restoration and Conservation Agency of Japan, JSPS KAKENHI (grant number JP19H04235), the JAXA 2nd research announcement on the Earth Observations (grant number 19RT000351), and JST CREST (grant number JPMJCR15K4). The MIROC simulations were performed using the Earth Simulator under the support of the SOUSEI program, MEXT, Japan. The support of the Chilean Antarctic Institute (INACH, Preis RT_32-15), Consejo Nacional de Ciencia y Tecnología (FONDECYT, Preis 1191932, 1171690, 1161460 and 3150229), CORFO (Preis 18BPE-93920, 17BPCR-89100 and 17BPE-73748) and the Universidad de Santiago de Chile (USACH, Preis USA1555) is gratefully acknowledged.

Acknowledgments

GPCC precipitation data was provided by the NOAA/OAR/ESRL PSD, Boulder, CO, USA, and was obtained from their web site at https://www.esrl.noaa.gov/psd/. We thank BAS, JMA, NOAA, the World Meteorological Organization-Global Atmosphere Watch Program (WMO-GAW)/World Ozone and Ultraviolet Radiation Data Centre (WOUDC) for collecting and making available the ground-based total ozone data used in this study.

Conflicts of Interest

The authors declare no conflict of interest. The funders had no role in the design of the study; in the collection, analyses, or interpretation of data; in the writing of the manuscript, or in the decision to publish the results.

Appendix A

Figure A1. Map of the Pearson correlation coefficient (r) between the average precipitation (P) anomalies in central-southern Chile and precipitation anomalies in the given grid point in the Southern Hemisphere for the GPCC dataset during the austral spring (OND) of 1960–2005 (c.f. Figure 1d).
Atmosphere 11 00579 g0a1
Figure A2. As in Figure 6a except for showing the composite difference (low minus high O3) for the observed Indian Ocean Dipole index (data from the Japan Agency for Marine-Earth Science and Technology).
Atmosphere 11 00579 g0a2
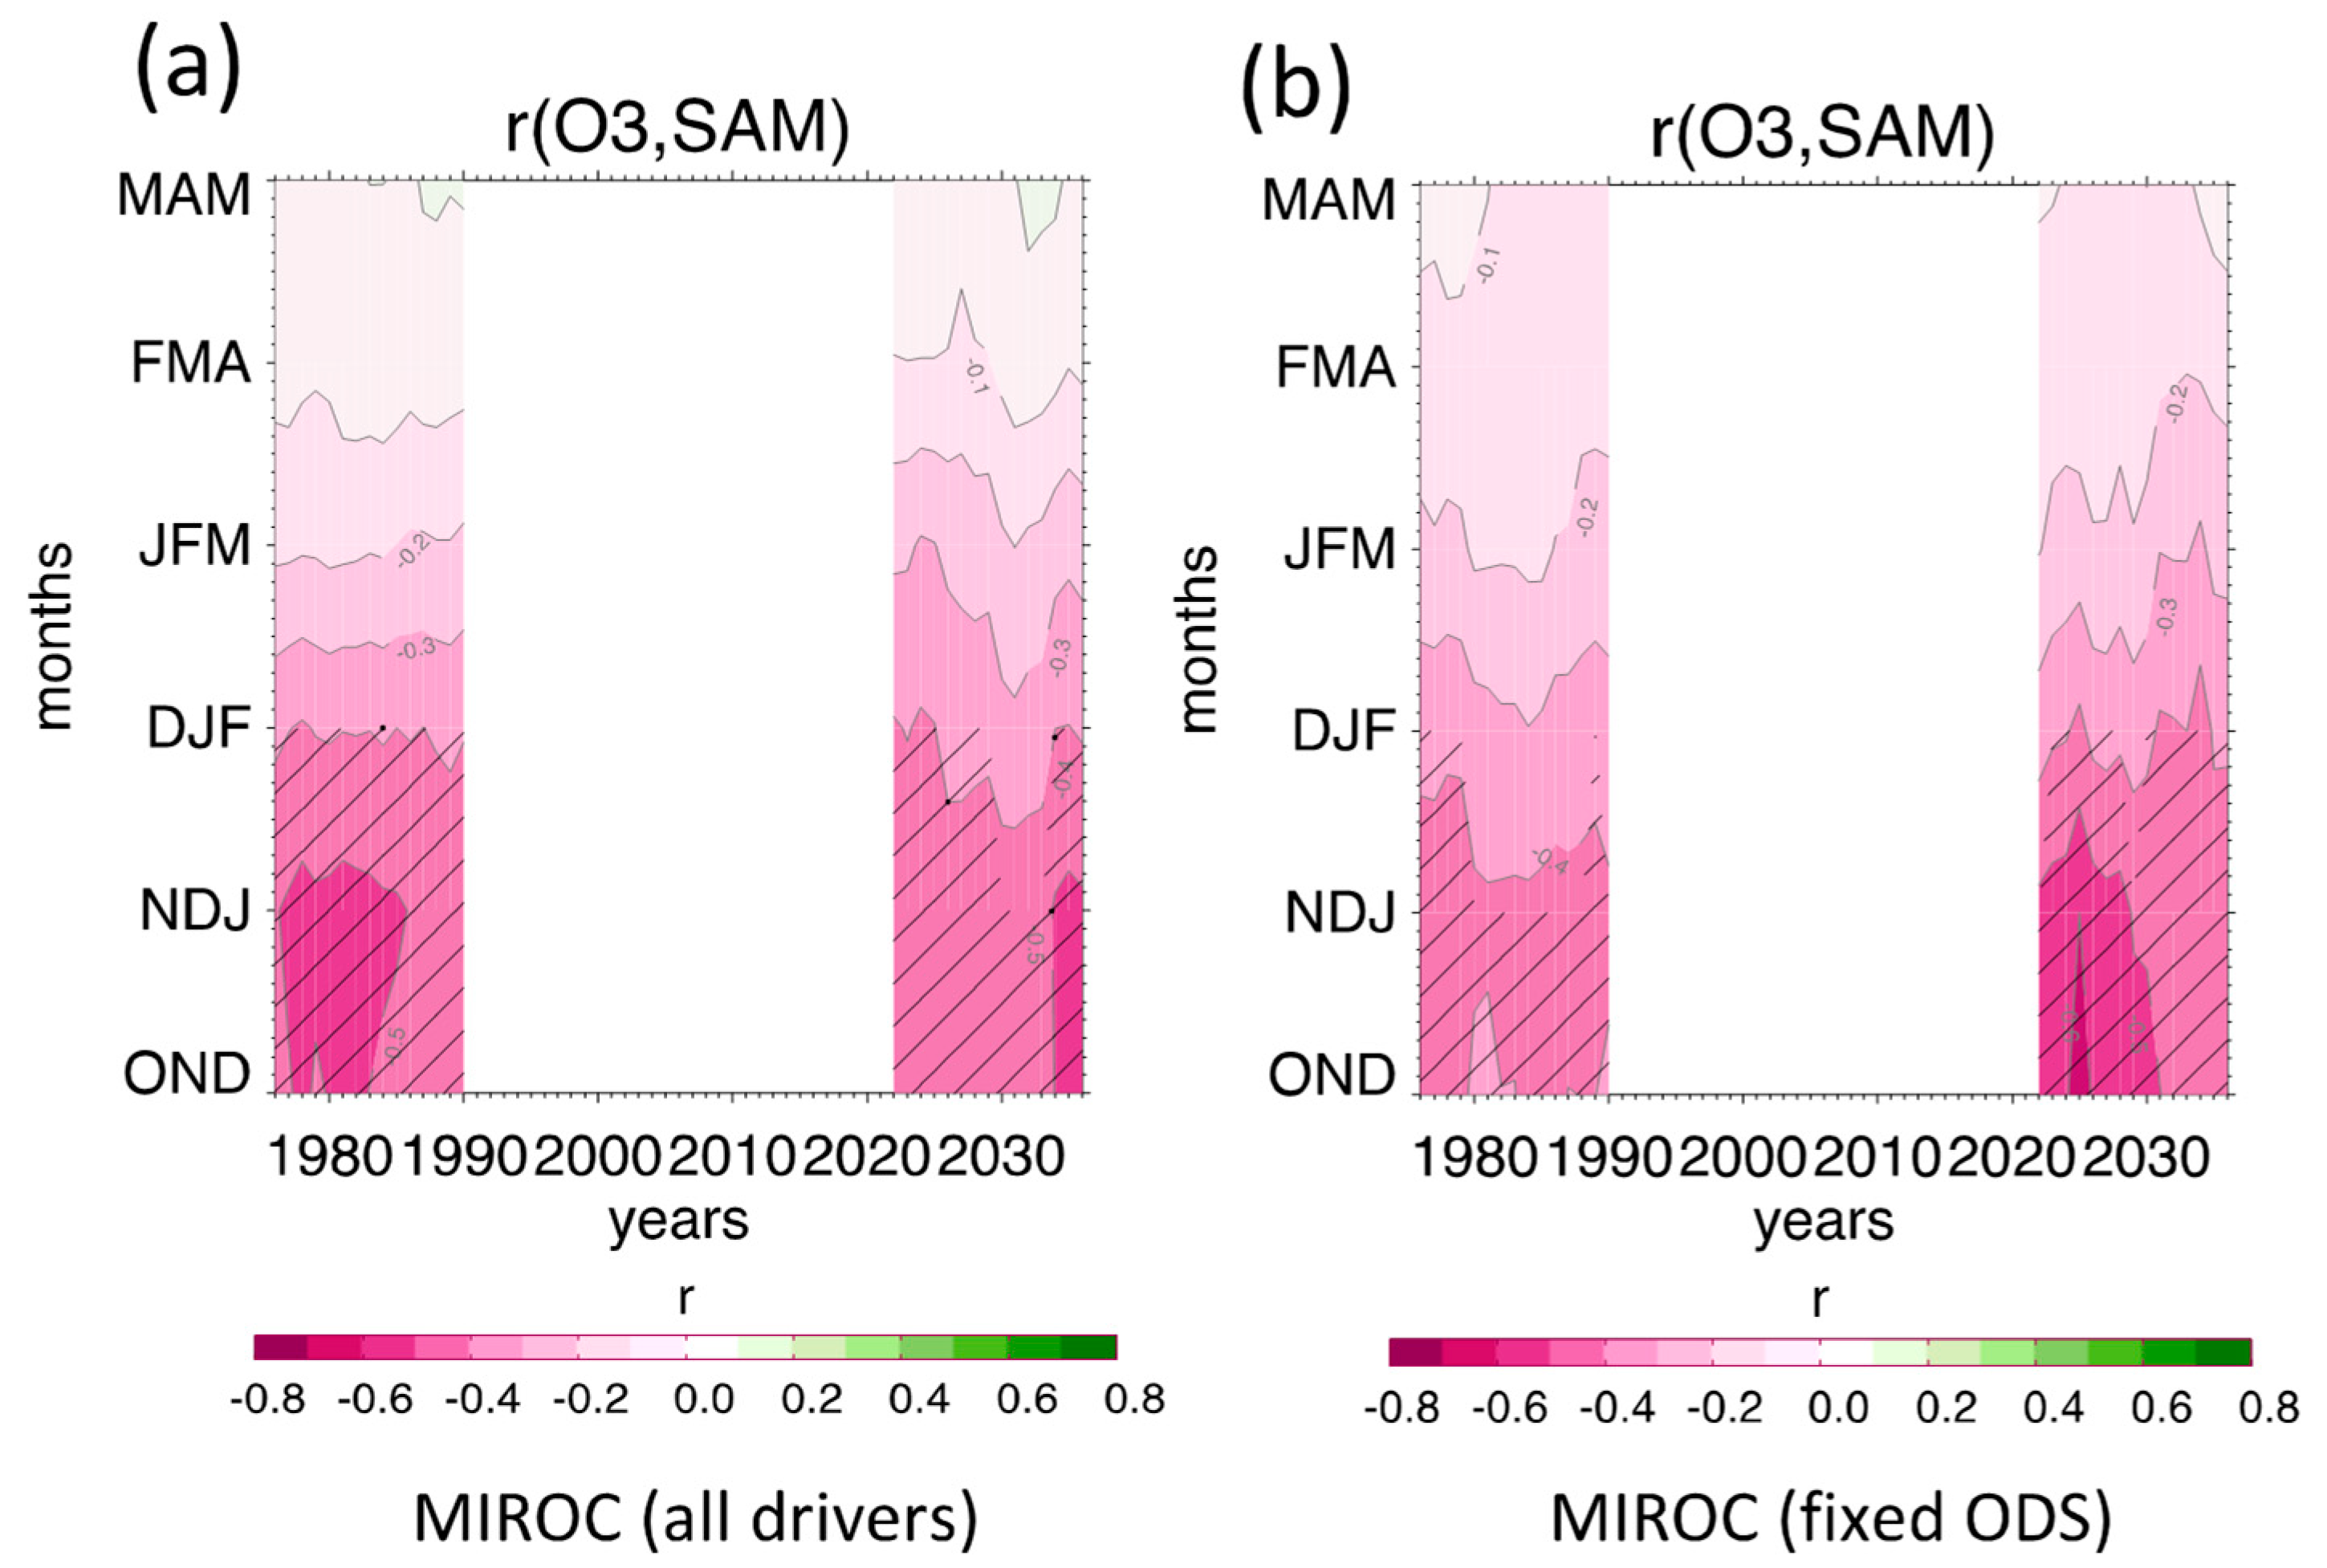
Figure A3. 31 years running correlation between the anomalies in November total ozone and SAM in the given month (each computed as the mean of three months; correlation values were assigned to the central year of each 31 years long period) in MIROC for historical (1960–2005) and future RCP4.5 (2006–2050) simulations with all drivers (a) and ODS fixed at 1960 levels (b). Note that simulations are not seamless, i.e., historical and future runs cannot be joined, and this results in a gap around present years. The shaded lines indicate where the change was significant at the 95% level based on a two-tailed t-test.
Atmosphere 11 00579 g0a3
Figure A4. As in Figure 2b except for showing the correlation between ENSO and SAM (a) and the correlation between November total ozone and ENSO (b) for given month. The shaded lines indicate where the change was significant at the 95% level based on a two-tailed t-test.
Atmosphere 11 00579 g0a4

References

  1. Fischer, E.M.; Knutti, R. Anthropogenic contribution to global occurrence of heavy-precipitation and high-temperature extremes. Nat. Clim. Chang. 2015, 5, 560–564. [Google Scholar] [CrossRef]
  2. Solomon, S. Stratospheric ozone depletion: A review of concepts and history. Rev. Geophys. 1999, 37, 275–316. [Google Scholar] [CrossRef]
  3. Son, S.-W.; Gerber, E.; Perlwitz, J.; Polvani, L.M.; Gillett, N.P.; Seo, K.-H.; Eyring, V.; Shepherd, T.G.; Waugh, D.; Akiyoshi, H.; et al. Impact of stratospheric ozone on Southern Hemisphere circulation change: A multimodel assessment. J. Geophys. Res. Space Phys. 2010, 115. [Google Scholar] [CrossRef] [Green Version]
  4. Thompson, D.W.J.; Solomon, S.; Kushner, P.J.; England, M.H.; Grise, K.; Karoly, D.J. Signatures of the Antarctic ozone hole in Southern Hemisphere surface climate change. Nat. Geosci. 2011, 4, 741–749. [Google Scholar] [CrossRef]
  5. Thompson, D.W.J. Interpretation of Recent Southern Hemisphere Climate Change. Science 2002, 296, 895–899. [Google Scholar] [CrossRef] [Green Version]
  6. Previdi, M.; Polvani, L.M. Climate system response to stratospheric ozone depletion and recovery. Q. J. R. Meteorol. Soc. 2014, 140, 2401–2419. [Google Scholar] [CrossRef]
  7. Kang, S.M.; Polvani, L.M.; Fyfe, J.C.; Sigmond, M. Impact of Polar Ozone Depletion on Subtropical Precipitation. Science 2011, 332, 951–954. [Google Scholar] [CrossRef] [Green Version]
  8. Purich, A.; Son, S.-W. Impact of Antarctic Ozone Depletion and Recovery on Southern Hemisphere Precipitation, Evaporation, and Extreme Changes. J. Clim. 2012, 25, 3145–3154. [Google Scholar] [CrossRef] [Green Version]
  9. Gonzalez, P.; Polvani, L.M.; Seager, R.; Correa, G.J.P. Stratospheric ozone depletion: A key driver of recent precipitation trends in South Eastern South America. Clim. Dyn. 2013, 42, 1775–1792. [Google Scholar] [CrossRef] [Green Version]
  10. Vera, C.S.; Díaz, L.B. Anthropogenic influence on summer precipitation trends over South America in CMIP5 models. Int. J. Clim. 2014, 35, 3172–3177. [Google Scholar] [CrossRef]
  11. Boisier, J.P.; Alvarez-Garretón, C.; Cordero, R.; Damiani, A.; Gallardo, L.; Garreaud, R.; Lambert, F.; Ramallo, C.; Rojas, M.; Rondanelli, R. Anthropogenic drying in central-southern Chile evidenced by long-term observations and climate model simulations. Elem. Sci. Anth. 2018, 6, 74. [Google Scholar] [CrossRef]
  12. Eyring, V.; Arblaster, J.M.; Cionni, I.; Sedlacek, J.; Perlwitz, J.; Young, P.J.; Bekki, S.; Bergmann, D.; Cameron-Smith, P.; Collins, W.J.; et al. Long-term ozone changes and associated climate impacts in CMIP5 simulations. J. Geophys. Res. Atmos. 2013, 118, 5029–5060. [Google Scholar] [CrossRef] [Green Version]
  13. Gillett, N.P.; Kell, T.D.; Jones, P.D. Regional climate impacts of the Southern Annular Mode. Geophys. Res. Lett. 2006, 33. [Google Scholar] [CrossRef]
  14. Gupta, A.S.; England, M.H. Coupled Ocean–Atmosphere–Ice Response to Variations in the Southern Annular Mode. J. Clim. 2006, 19, 4457–4486. [Google Scholar] [CrossRef]
  15. Garreaud, R. Precipitation and Circulation Covariability in the Extratropics. J. Clim. 2007, 20, 4789–4797. [Google Scholar] [CrossRef]
  16. Garreaud, R.; Alvarez-Garreton, C.; Barichivich, J.; Boisier, J.P.; Christie, D.; Galleguillos, M.; LeQuesne, C.; McPhee, J.; Zambrano-Bigiarini, M. The 2010–2015 megadrought in central Chile: Impacts on regional hydroclimate and vegetation. Hydrol. Earth Syst. Sci. 2017, 21, 6307–6327. [Google Scholar] [CrossRef] [Green Version]
  17. Burls, N.J.; Blamey, R.C.; Cash, B.A.; Swenson, E.T.; Al Fahad, A.; Bopape, M.-J.M.; Straus, D.M.; Reason, C.J.C. The Cape Town “Day Zero” drought and Hadley cell expansion. Npj Clim. Atmos. Sci. 2019, 2, 27. [Google Scholar] [CrossRef] [Green Version]
  18. Lim, E.; Hendon, H.H.; Boschat, G.; Hudson, D.; Thompson, D.W.J.; Dowdy, A.J.; Arblaster, J. Australian hot and dry extremes induced by weakenings of the stratospheric polar vortex. Nat. Geosci. 2019, 12, 896–901. [Google Scholar] [CrossRef]
  19. Hudson, D.; Marshall, A.G.; Alves, O.; Young, G.; Jones, D.; Watkins, A. Forewarned is Forearmed: Extended-Range Forecast Guidance of Recent Extreme Heat Events in Australia. Weather Forecast. 2016, 31, 697–711. [Google Scholar] [CrossRef]
  20. Thompson, D.W.J.; Baldwin, M.P.; Solomon, S. Stratosphere–Troposphere Coupling in the Southern Hemisphere. J. Atmos. Sci. 2005, 62, 708–715. [Google Scholar] [CrossRef]
  21. Seviour, W.J.M.; Hardiman, S.; Gray, L.J.; Butchart, N.; MacLachlan, C.; A Scaife, A. Skillful Seasonal Prediction of the Southern Annular Mode and Antarctic Ozone. J. Clim. 2014, 27, 7462–7474. [Google Scholar] [CrossRef] [Green Version]
  22. Baldwin, M.P.; Stephenson, D.B.; Thompson, D.W.J.; Dunkerton, T.J.; Charlton-Perez, A.J.; O’Neill, A. Stratospheric Memory and Skill of Extended-Range Weather Forecasts. Science 2003, 301, 636–640. [Google Scholar] [CrossRef] [PubMed]
  23. Lim, E.; Hendon, H.H.; Thompson, D.W.J. Seasonal Evolution of Stratosphere-Troposphere Coupling in the Southern Hemisphere and Implications for the Predictability of Surface Climate. J. Geophys. Res. Atmos. 2018, 123, 12002–12016. [Google Scholar] [CrossRef]
  24. Bandoro, J.; Solomon, S.; Donohoe, A.; Thompson, D.W.J.; Santer, B.D. Influences of the Antarctic Ozone Hole on Southern Hemispheric Summer Climate Change. J. Clim. 2014, 27, 6245–6264. [Google Scholar] [CrossRef] [Green Version]
  25. Son, S.; Purich, A.; Hendon, H.H.; Kim, B.-M.; Polvani, L.M. Improved seasonal forecast using ozone hole variability? Geophys. Res. Lett. 2013, 40, 6231–6235. [Google Scholar] [CrossRef]
  26. Fogt, R.L.; Perlwitz, J.; Pawson, S.; Olsen, M. Intra-annual relationships between polar ozone and the SAM. Geophys. Res. Lett. 2009, 36. [Google Scholar] [CrossRef]
  27. Thompson, D.W.J.; Wallace, J.M. Annular modes in the extratropical circulation. part i: Month-to-month variability. J. Clim. 1999, 13, 1000–1016. [Google Scholar] [CrossRef]
  28. World Meteorological Organization (WMO). Scientific Assessment of Ozone Depletion: 2018; Global Ozone Research and Monitoring Project-Report No. 58; World Meteorological Organization (WMO): Geneva, Switzerland, 2018. [Google Scholar]
  29. Gillett, Z.; Arblaster, J.M.; Dittus, A.; Deushi, M.; Jöckel, P.; Kinnison, D.E.; Morgenstern, O.; Plummer, D.A.; Revell, L.E.; Rozanov, E.; et al. Evaluating the Relationship between Interannual Variations in the Antarctic Ozone Hole and Southern Hemisphere Surface Climate in Chemistry–Climate Models. J. Clim. 2019, 32, 3131–3151. [Google Scholar] [CrossRef]
  30. Manatsa, D.; Morioka, Y.; Behera, S.K.; Yamagata, T.; Matarira, C.H. Link between Antarctic ozone depletion and summer warming over southern Africa. Nat. Geosci. 2013, 6, 934–939. [Google Scholar] [CrossRef]
  31. Schneider, U.; Finger, P.; Meyer-Christoffer, A.; Rustemeier, E.; Ziese, M.; Becker, A. Evaluating the Hydrological Cycle over Land Using the Newly-Corrected Precipitation Climatology from the Global Precipitation Climatology Centre (GPCC). Atmosphere 2017, 8, 52. [Google Scholar] [CrossRef] [Green Version]
  32. Hassler, B.; Bodeker, G.E.; Solomon, S.; Young, P.J. Changes in the polar vortex: Effects on Antarctic total ozone observations at various stations. Geophys. Res. Lett. 2011, 38. [Google Scholar] [CrossRef] [Green Version]
  33. Van Der A, R.J.; Allaart, M.A.F.; Eskes, H. Extended and refined multi sensor reanalysis of total ozone for the period 1970–2012. Atmospheric Meas. Tech. 2015, 8, 3021–3035. [Google Scholar] [CrossRef] [Green Version]
  34. Watanabe, S.; Hajima, T.; Sudo, K.; Nagashima, T.; Takemura, T.; Okajima, H.; Nozawa, T.; Kawase, H.; Abe, M.; Yokohata, T.; et al. MIROC-ESM 2010: Model description and basic results of CMIP5-20c3m experiments. Geosci. Model Dev. 2011, 4, 845–872. [Google Scholar] [CrossRef] [Green Version]
  35. Morgenstern, O.; Hegglin, M.I.; Rozanov, E.; O’connor, F.M.; Abraham, N.L.; Akiyoshi, H.; Archibald, A.T.; Bekki, S.; Butchart, N.; Chipperfield, M.P.; et al. Review of the global models used within phase 1 of the Chemistry–Climate Model Initiative (CCMI). Geosci. Model Dev. 2017, 10, 639–671. [Google Scholar] [CrossRef] [Green Version]
  36. Marshall, G.J. Trends in the Southern Annular Mode from observations and reanalyses. J. Clim. 2003, 16, 4134–4143. [Google Scholar] [CrossRef]
  37. Gong, D.; Wang, S. Definition of Antarctic Oscillation index. Geophys. Res. Lett. 1999, 26, 459–462. [Google Scholar] [CrossRef] [Green Version]
  38. Saji, N.H.; Goswami, B.N.; Vinayachandran, P.N.; Yamagata, T. A dipole mode in the tropical Indian Ocean. Nature 1999, 401, 360–363. [Google Scholar] [CrossRef]
  39. Shaw, T.A.; Perlwitz, J.; Harnik, N.; Newman, P.; Pawson, S. The Impact of Stratospheric Ozone Changes on Downward Wave Coupling in the Southern Hemisphere. J. Clim. 2011, 24, 4210–4229. [Google Scholar] [CrossRef] [Green Version]
  40. L’Heureux, M.L.; Thompson, D.W.J. Observed Relationships between the El Niño–Southern Oscillation and the Extratropical Zonal-Mean Circulation. J. Clim. 2006, 19, 276–287. [Google Scholar] [CrossRef]
  41. Mo, K.C.; Higgins, R.W. The Pacific-South America modes and tropical convection during the Southern Hemisphere winter. Mon. Weather. Rev. 1998, 126, 1581–1596. [Google Scholar] [CrossRef]
  42. Zheng, F.; Yu, J.-Y. Contrasting the skills and biases of deterministic predictions for the two types of El Niño. Adv. Atmospheric Sci. 2017, 34, 1395–1403. [Google Scholar] [CrossRef]
  43. Yeo, S.-R.; Kim, K.-Y. Decadal changes in the Southern Hemisphere sea surface temperature in association with El Niño–Southern Oscillation and Southern Annular Mode. Clim. Dyn. 2015, 45, 3227–3242. [Google Scholar] [CrossRef] [Green Version]
  44. Domeisen, D.I.V.; Garfinkel, C.I.; Butler, A.H. The Teleconnection of El Niño Southern Oscillation to the Stratosphere. Rev. Geophys. 2019, 57, 5–47. [Google Scholar] [CrossRef] [Green Version]
  45. Rivera, J.A.; Arnould, G. Evaluation of the ability of CMIP6 models to simulate precipitation over Southwestern South America: Climatic features and long-term trends (1901–2014). Atmos. Res. 2020, 241, 104953. [Google Scholar] [CrossRef]
  46. Simpson, I.R.; Polvani, L.M. Revisiting the relationship between jet position, forced response, and annular mode variability in the southern midlatitudes. Geophys. Res. Lett. 2016, 43, 2896–2903. [Google Scholar] [CrossRef] [Green Version]
Figure 1. (a) November total ozone series at the South Pole measured by ground-based observations (black line) and simulated by MIROC (Climate comprehensive of interactive chemistry, all drivers: red line; fixed ODS: blue line); all available simulation members are shown (see Section 2); (b) as in (a) except for using ozone anomalies (calculated with respect to a third-degree polynomial fitted to the time series of ozone values); the standard deviation of the anomalies for each time series (i.e., historical period: 1960–2005; future: 2006–2050; full observed dataset: 1960–2017) is reported in the upper left and right corners; the vertical dotted lines mark the limit between historical and RCP4.5 simulations; (c) map of the Pearson correlation coefficient (r) between the average precipitation (P) anomalies in central-southern Chile (red arrow) and precipitation anomalies in the given grid point in the Southern Hemisphere for MIROC (all drivers included) and (d) GPCC dataset during the austral spring (October-November-December, OND) of 1960–2005 and 1960–2018, respectively. The shaded lines indicate where the change was significant at the 95% level based on a two-tailed t-test. The red boxes define the regions investigated in this study, hereinafter Australia (10–44° S, 141–156° E), South Africa (20–35° S, 20–40° W), and Chile (33–48° S, 70–75° W). RCP: Representative Concentration Pathway, GPCC: Global Precipitation Climatology Centre.
Atmosphere 11 00579 g001
Figure 2. (a) 31 years running correlation between November total ozone measured at the South Pole station and the SAM index in the given month (each computed as the mean of three months; correlation values were assigned to the central year of each 31 years long period); (b) as in (a) except for using anomalies in both ozone and SAM; (c) running mean of the composite change in the SAM index (i.e., low minus high O3 years) according to the ozone levels in November; the running mean of the spread between the negative and positive November ozone anomalies (labeled ozone change) is shown in the opposite axis (red line); (df) Correlation (r) map between MSR2 total ozone in November at the given pixel and GPCC precipitation in NDJ (November-December-January) averaged within the respective red box (only over the lands) for 1988–2018; (gi) as in (df) except for MIROC (all drivers) for the 1960–2005 period.
Atmosphere 11 00579 g002
Figure 3. Maps of correlation between anomalies in November total ozone at the South Pole and precipitation in (top to bottom) JFM (January-February-March) (a,e), DJF (December-January-February) (b,f), NDJ (c,g), OND (d,h) for the GPCC dataset in 1988–2018 (left column) and MIROC (all drivers) historical simulations in 1960–2005 (right column). The shaded lines indicate where the change was significant at the 95% level based on a two-tailed t-test.
Atmosphere 11 00579 g003
Figure 4. (ac) 31 years running correlation between total ozone anomalies in November observed at the South Pole station and the GPCC precipitation averaged within the regions shown in Figure 1 (i.e., from left to right: Chile, Australia, and South Africa) in the given month (each computed as the mean of three months; correlation values assigned to the central year of each 31 years long period) for 1960–2018. The red dotted line highlights the correlation for the period 1988–2018 (see Figure 3a–d for OND-JFM); (df) as in (ac) except for the correlation between SAM index in the given month and GPCC precipitation in the given month; (gi) as in (df) except for the correlation between ENSO index and GPCC. The shaded lines indicate where the change was significant at the 95% level based on a two-tailed t-test.
Atmosphere 11 00579 g004
Figure 5. Maps of composite difference (low minus high O3 for years with ozone anomalies greater than σ/2; see Figure 1b) of precipitation in (top to bottom) JFM (a,e), DJF (b,f), NDJ (c,g), OND (d,h) according to ozone anomalies in November at the South Pole: GPCC in 1960–2018 (left column) and MIROC (all drivers) historical simulations in 1960–2005 (right column). The shaded lines indicate where the change was significant at the 95% level based on a two-tailed t-test.
Atmosphere 11 00579 g005
Figure 6. Composite difference (low minus high O3) for the observed and simulated Niño 3.4 index (a,f,k,p,u), SAM index (b,g,l,q,v) and precipitation averaged over Chile (c,h,m,r,w), Australia (d,i,n,s,x), and South Africa (e,j,o,t,y), according to ozone anomalies in November at the South Pole. Composite differences associated with increasing ozone anomalies are shown in the function of the ozone change (i.e., the mean spread between the high and low ozone anomalies; see also Figure 2c) for the given month. Observations cover the 1960–2018 period (ae); MIROC simulations with all drivers (fj and ko) and fixed ODS (pt and uy) are shown for the historical (1960–2005) and future RCP4.5 (2006–2050) periods. See the text for further details. The vertical (crossed) lines indicate where the change was significant at the 95 (99)% level. The red dotted line highlights composite difference for σ/2 ozone anomalies (see Figure 5 for OND-JFM). White spaces indicate no data. The acronyms of the three lower horizontal panels are as follows: CL: Chile, AU: Australia, SA: South Africa.
Atmosphere 11 00579 g006
Figure 7. Slope of the linear regression line (ac) and the Pearson correlation (df) between the composite difference in precipitation and the corresponding ozone change for observations in 1960–2018 (black line) and MIROC (all drivers) simulations in 1960–2005 (red line). For observations, the slope and the correlation are shown for all data (black line) as well as only for ozone changes smaller than 40% (blue line; for further details, see text and Figure 6). In the top panels, error bars show 2xσ.
Atmosphere 11 00579 g007