Abstract
Experimental data show that the peak currents of first and subsequent lightning return strokes in negative ground flashes increase with decreasing latitude. In this paper, the reason for this dependence of peak return stroke current on latitude is explained using the fact that the height of the charge centers increases with decreasing latitude. Results show that in tropical regions where the height to the negative charge center is about 8 km, the median values of the first and the subsequent return stroke peak currents are about 42 kA and 15 kA, respectively. If the height to the charge center is larger than 8 km, the peak currents will also become larger. For example, if the location of the charge center is increased to about 9 km, the median values of the first and subsequent return stroke peak currents will increase to about 45 kA and 16 kA respectively. The same reasoning shows that, even in the same geographical region, the peak return stroke current may decrease as the elevation of the ground where the lightning strikes take place increases. The results also indicate that the peak subsequent return stroke current in tower-initiated negative lightning flashes decreases as the height of the tower increases. These theoretical predictions are in general agreement with the available experimental data.
1. Introduction
The first study that clearly demonstrated the dependence of negative lightning return stroke peak current on latitude was conducted by Orville in the United States [1]. Based on the data recorded by thirty-six wideband magnetic direction finders located in the eastern United States, he investigated how the peak current of first return strokes varied as a function of latitude. Based on more than five million first return strokes, he observed that the peak current varied by almost a factor of two, from 25 kA in New England to 40–45 kA in northern Florida. Even though the derived peak current of the return stroke depends on the model used by the lightning location system to interpret the electromagnetic data, the results showed a clear indication that the return stroke peak current increased with decreasing latitude. Moreover, after reviewing the literature on the current measurements in different countries, Rakov and Dulzon [2,3] and Pinto et al. [4] argued that the peak first return stroke current tends to increase as the latitude decreases. This result was further strengthened when a comparison was made of the peak currents measured in negative lightning strikes to towers by Berger [5] in temperate Switzerland and Visacro et al. [6] in tropical Brazil. The median peak currents of the first and subsequent strokes measured by Berger [5] were 30 and 12 kA respectively, whereas the corresponding peak currents measured by Visacro et al. were 45 and 17.6 kA, respectively.
The results presented above provide clear evidence that the peak return stroke current of both first and subsequent strokes of negative lightning flashes increases as the latitude decreases. The main cloud parameter that will change according to latitude is the height to the negative charge center. This is the case because the height to the negative charge center increases with decreasing latitude [7]. The goal of the present paper is to give a possible explanation for the dependence of the peak negative return stroke current on latitude based on the variation of the height of the negative charge center with to latitude.
Another observation that bears some connection to the present investigation is the experimental data which seem to indicate that the peak current in subsequent return strokes in negative upward initiated lightning flashes decreases as the height of the tower increases [8]. Even though this observation does not have any direct connection to the latitude dependence of the return stroke current, the analysis to be conducted in this paper makes it possible to address this observation as well, and to discuss the possible reasons for the decrease in the peak subsequent return stroke current in relation to tower height in tower-initiated negative lightning flashes.
It is important to point out that the results to be presented here are valid for return strokes in downward negative ground flashes and subsequent return strokes in tower-initiated negative lightning flashes.
2. The Methodology
In a recent study, utilizing the return stroke current waveforms of downward negative lightning flashes measured by Berger [5], Cooray et al. [9] obtained the charge brought to the ground by the first 100 μs of the first return stroke and the first 50 μs of the subsequent return strokes. They found a strong correlation between the peak return stroke current and the transferred charge to the ground by return strokes. Combining this information with the bi-directional leader model [10] and a simplified cloud model as described in [9], they have investigated how this charge was distributed along the stepped and dart leader channels. Using the same dataset and following the same procedure utilized in [9], Cooray [11] estimated how the potential of the cloud with respect to the ground (or, more specifically, the potential at the region of the cloud from where the flash was initiated) was related to the first and subsequent return stroke peak currents. The results showed that the potential of the cloud was connected to the return stroke peak current by the following expression for the negative first return strokes:
For the negative subsequent return strokes, the obtained relationship is given by
In the above equations, Ipf and Ips are the peak currents (in kA) in the first and subsequent return strokes, respectively. In the studies conducted by Cooray et al. [9] and Cooray [11], it was assumed that the negative charge center of clouds pertinent to Berger’s study was located at a height of 4 km. This value is representative for the experiments conducted by Berger when one considers that the measurements were performed at a slightly high elevation (600 m) in a temperate region.
The observations show that the return stroke current peak occurs in a few microseconds from the initiation of the return stroke. During this time, the distance travelled by the return stroke front is no more than a few hundred meters. Thus, the peak current is determined by the flow of the charge caused by the neutralization of the charge located within the first hundred meters or so from the ground attachment point of the leader channel. One would expect, therefore, a strong correlation between this charge and the return stroke peak current. Of course, if the charge distribution of the leader channel did not differ significantly from one return stroke to another, one can extend this to a relationship between the total impulse charge transported by the return stroke and the return stroke peak current as observed by Cooray et al. [9].
Now, using the same dataset and the same procedure utilized by Cooray et al. [9], one can estimate the cloud potential as a function of the net charge located over the first hundred meters from the ground attachment point of the leader channel. The results obtained can be summarized by the following relationships. In the case of the first return strokes, the relationship obtained is:
For the subsequent return strokes, the relationship obtained is given by
In the above equations, and are the net charge located over the first hundred meters (from the ground attachment point) of the stepped leaders of the first return strokes and the dart leaders of the subsequent return strokes, respectively. By combining the above relationships, the charge over the first hundred meters as a function of the return stroke peak current could be obtained and the results obtained for the negative first return strokes is given by
In the case of negative subsequent return strokes, it is given by
Now, the question that we would like to provide an answer to is the following. Assume that a cloud that was located over the measuring station of the Berger’s study [5] caused a lightning strike and the resulting peak current was 30 kA. If the same cloud (i.e., a cloud with the same potential) is located in another geographical region, what would be the peak current of the resulting lightning strike? Note that in attempting to answer this question, we are assuming that the cloud potential is a measure of cloud’s ability to generate lightning flashes and that this ability is not influenced by the geographical region.
Let us now describe the procedure we have used to extract the dependence of return stroke peak current with latitude using the above methodology. Consider the cloud potential as a function of first return stroke and subsequent return stroke peak currents as given by Equations (1) and (2). Now consider a 30 kA first return stroke peak current. This corresponds to a potential of about 50 MV. In the next step, this cloud with the same potential is placed in a different geographical region, where the height to the charge center is different to the one assumed pertinent to Berger’s study, and the resulting charge distribution along the leader channel is estimated. Note that once the cloud potential is given, the distribution of the charge along a leader channel of any length can be estimated using the procedure given in [9]. From the derived charge distribution, the charge located over the first hundred meters is estimated. This charge is then converted to a return stroke peak current using Equation (5), pertinent to first return strokes. This derived current is a measure of how a 30-kA current, corresponding to the geographical region pertinent to Berger’s study, should be converted in the new geographical region. The same procedure is also used to convert the subsequent return stroke peak currents of Berger’s study to other latitudes with different charge heights.
3. Results
The results obtained following the above procedure for the first and subsequent return strokes are depicted in Figure 1. In this diagram, the peak return stroke currents that one would obtain in different geographical regions with different heights to the charge center are plotted against the peak return stroke currents measured in Berger’s study. It should be noted that the curves marked in red in these diagrams correspond to a 4 km height which is the same as the charge height assumed in Berger’s study. Observe that in the tropics the channel height could be about 7–9 km and a 30 kA median current in the temperate region would be transformed to a median current of about 42 kA for an 8 km charge center height. In the case of subsequent return strokes, a 12 kA median current would be transformed into a median current of about 15 kA. If the height to the charge center is larger, the peak currents will also become larger. For example, if the height to the negative charge center is increased to about 9 km, the median values of the first and subsequent return stroke peak currents will increase to about 45 kA and 16 kA respectively. The conversion factors necessary to transfer Berger’s current peaks to other latitudes with different charge heights for both the first and subsequent strokes are depicted in Figure 2.
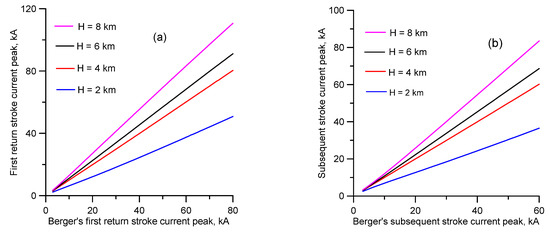
Figure 1.
The peak currents corresponding to the different charge heights against the peak currents measured by Berger (corresponding to a 4 km charge height). (a) First return strokes. (b) Subsequent return strokes.
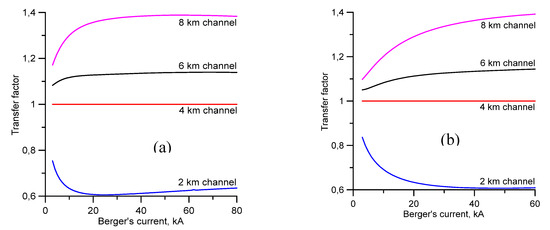
Figure 2.
The factor by which one has to multiply the peak currents measured by Berger (corresponding to a 4 km charge height) to obtain the corresponding currents at different latitudes with the different charge heights. (a) First strokes. (b) Subsequent strokes.
Another example that points to the reduction of the return stroke peak current with decreasing height to the charge center was provided by the studies conducted at the Säntis tower in Switzerland. The subsequent stroke peak current measured at the Säntis tower having a height of about 120 m was about 6.4 kA and this had to be contrasted with the 12 kA peak current measured by Berger [5]. The Säntis tower is located at 2.5 km above sea level and the decrease in the subsequent return stroke peak current in this case could be due to the shorter distance from the ground to the cloud height. For example, the height to the charge centers inside the clouds from the location of the Säntis tower could be about 1.5 km [12,13,14]. Figure 1 and Figure 2 show that, for 2 km height, the subsequent return stroke median current could decrease from 12 kA (at ground level) to 8 kA. This value could decrease further due to reasons to be presented later. Note that in this comparison, we assumed that the mechanism of the production of negative subsequent return strokes is the same in downward negative lightning flashes as in tower-initiated negative ground flashes.
4. Discussion
The results presented here provide a possible reason why the median current peaks of return strokes are higher in tropical regions than in the temperate regions. The theory also provides reasonable values for the median currents in the tropics given their values in temperate regions. The same reasoning shows that the peak return stroke current in a given geographical region may also depend on the elevation of the region under consideration. The reason for this is the fact that as the elevation increases, the height to the charge center decreases.
In deriving the theory necessary for this explanation, several assumptions were made and, for the benefit of the reader, these assumptions are listed here. (1) It was assumed that Berger’s data are representative of a cloud height of about 4 km located over the measuring station. This indeed is an assumption made previously by Cooray et al. [9] in their first analysis of Berger’s data and the results from that paper are being successfully applied in many different engineering applications. This is a reasonable assumption because the negative charge center in clouds in temperate regions is located at around 4–5 km height and Berger conducted his experiments at the top of Mount Lugano, which is about 600 m in height. (2) In the analysis, it was assumed that the peak return stroke current is decided by the charge in the first 100 m or so of the leader channel, irrespective of the height of the channel. This is not an unreasonable assumption given the fact that the height of the return stroke front is no more than a few hundred meters during the time in which the peak of the return stroke current is achieved. (3) In the analysis, it was assumed that the nature of thunderclouds is not different across geographical regions, except for the fact that the negative charge centers are located at different heights [7,15]. As mentioned previously, the height to the negative charge center increases with decreasing latitude. The reason for this is the following. The negative charge center is located between the altitudes where the temperature is −10 °C and −20 °C i.e., in the mixed phase region of the cloud [7,15]. The base of the negative charge center is located in the vicinity of the −10 °C isotherm. The heights to these isotherms increase with decreasing latitude [7,15] and that is the reason for the increase in the height of the negative charge center with decreasing latitude.
As mentioned in the introduction, there is some evidence that the subsequent return stroke current associated with the upward initiated negative lightning flashes by tall towers becomes smaller with increasing tower height [8]. For example, the medium subsequent return stroke current measured in lightning strikes to the CN tower in Canada, which is about 550 m tall, was about 5.1 kA [8]. Let us consider a cloud height of 4 km. Figure 3 shows how the charge distribution along the dart leader channel varied as a function of the height of the dart leader tip from the ground level. Observe that the charge density decreases as the height of the dart leader tip from ground level increases. Figure 4 shows how the charge along the last 100 m of the dart leader channel varies with cloud potential for the different locations of the tip height. This figure shows that the charge available over the first 100 m in a dart leader channel that terminates on a 550 m tower would be less than the amount of charge available for a dart leader that terminates on a shorter tower. This fact could indeed be partly responsible for the reduction in the subsequent return stroke current with tower height. For example, the peak return stroke currents that arise when dart leaders, originating from clouds of different potential, terminates on the ground against the corresponding currents that are generated when the same dart leaders terminate on towers of different heights, are depicted in Figure 5. Observe how the peak current is reduced with increasing tower height.
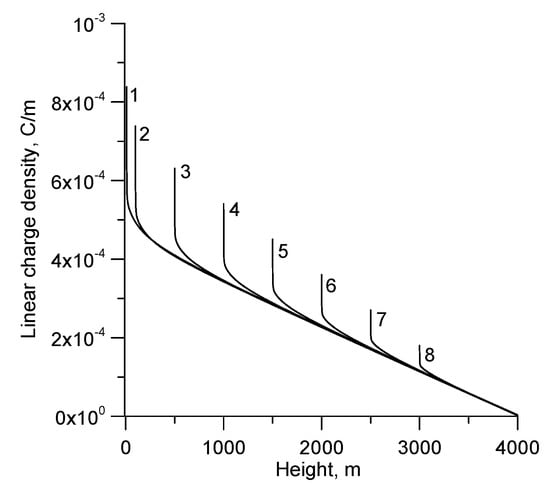
Figure 3.
The charge distribution along the downward dart leader channel with a 12 kA prospective return stroke current when its tip is at different distances from the ground. (1) 10 m, (2) 100 m, (3) 500 m, (4) 1000 m, (5) 1500 m, (6) 2000 m, (7) 2500 m and (8) 3000 m. Adapted from [9].
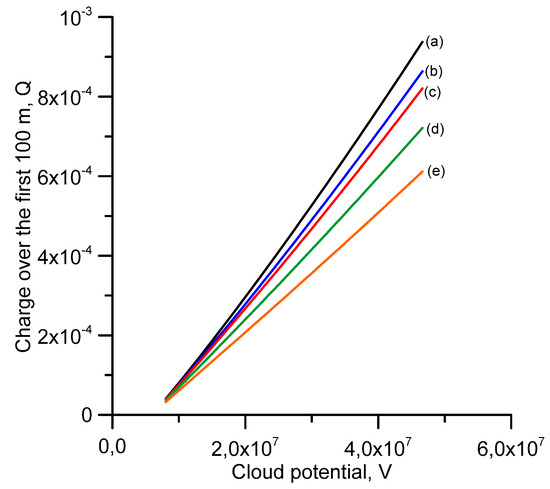
Figure 4.
The charge over the last 100 m of the dart leader channel as a function of the cloud potential for the leaders ending on towers of different heights. (a) Ground level, (b) 60 m, (c) 100 m, (d) 250 m, (e) 500 m.
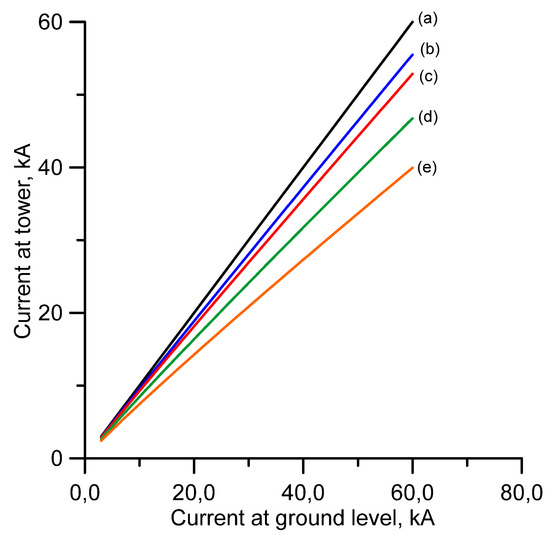
Figure 5.
The return stroke current peak generated by a dart leader terminating at ground level against the return stroke current peak generated by a dart leader ending on towers of different heights. (a) Ground level, (b) 60 m, (c) 100 m, (d) 250 m, (e) 500 m.
It is important to point out here that the whole analysis is based on the assumption that the cloud potential is a measure of the ability of the cloud to generate lightning flashes. This assumption is true as long as the structures at ground level do not influence that ability. However, in the case of upward lightning from tall towers, this assumption is clearly violated because the lightning is initiated not inside the cloud but at the tip of the tower. In other words, the tall towers can generate upward leaders which after entering into the clouds can force the clouds to generate lightning flashes at potentials which are lower than the values required for the spontaneous generation of downward lightning flashes. As the tower becomes taller, its ability to generate lightning flashes from clouds of lower and lower potentials increases. This is the case because as the towers become taller their ability to generate upward leaders from lower background electric fields increases. Thus, as the potential of the cloud at the time of lightning initiation is reduced, it will also reduce the subsequent stroke current peak. This could also be a factor contributing to the fact that the peak current decreases with increasing tower height.
It is important to point out again that the results presented in this paper are valid for negative return strokes. The theory in its present form cannot be applied to the case of positive return strokes.
5. Conclusions
The theory was developed to explain why the peak return stroke current in negative return strokes increased with decreasing latitude. It was shown that this latitude dependence arise due to the difference in the heights of the charge centers in the clouds pertinent to different geographical regions. For the same reason, depending on the ground elevation, the peak return stroke current may change from one location to another in the same geographical region. For example, the peak return stroke current could be smaller in the regions where the ground elevation is high and it could be larger in regions located at sea level. This is the case because the height to the charge center in a cloud decreases as the ground elevation increases.
Taking Berger’s measurements conducted over Mound San Salvatore as a reference, it is shown that in tropical regions where the height to the negative charge center is about 8 km, the median values of the first and the subsequent return stroke peak currents are about 42 kA and 15 kA, respectively. If the height to the charge center is larger, the peak currents will also become larger. For example, if the height to the negative charge center is increased to about 9 km, the median values of the first and subsequent return stroke peak currents will increase to about 45 kA and 16 kA, respectively. These estimates are in reasonable agreement with the available experimental data.
The results presented also show that the subsequent return stroke peak current in tower-initiated lightning decreases as the height of the tower increases.
Author Contributions
Conceptualization, V.C.; Formal analysis, V.C.; Writing – review & editing, M.R. and F.R. All authors have read and agreed to the published version of the manuscript.
Funding
This work was supported by Swedish Research Council grant VR-2015-05026 and partly by the fund from the B. John F. and Svea Andersson donation at Uppsala University.
Conflicts of Interest
The authors declare no conflict of interest.
References
- Orville, R. Peak-current variations of lightning return strokes as a function of latitude. Nature 1990, 343, 6254. [Google Scholar] [CrossRef]
- Rakov, V.; Dulzon, A.A. On latitudinal features of thunderstorm activity. Meteor. Gidrol. 1984, 1, 52–57. [Google Scholar]
- Rakov, V.; Dulzon, A.A. Lightning research in Western Siberia. In Proceedings of the 8th International Conference on Atmospheric Electricity, Uppsala, Sweden, 13–16 June 1988; pp. 766–769. [Google Scholar]
- Pinto, O., Jr.; Pinto, I.R.C.A.; Lacerda, M.; Carvalho, A.M.; Diniz, J.H.; Cherchiglia, L.C.L. Are equatorial negative lightning flashes more intense than those at higher latitudes. J. Atmos. Solar-Terr. Phys. 1997, 59, 1881–1883. [Google Scholar] [CrossRef]
- Berger, K. Novel observations of lightning discharges: Results of research on Mount San Salvatore. J. Franklin Inst. 1967, 283, 478–525. [Google Scholar] [CrossRef]
- Visacro, S.; Mesquita, C.R.; De Conti, A.; Silveira, F.H. Updated statistics of lightning currents measured at Morro do Cachimbo station. Atmos. Res. 2012, 117, 55–63. [Google Scholar] [CrossRef]
- Krehbiel, P.R. The electrical structure of thunderstorms. In The Earth’s Electrical Environment; Krider, E.P., Roble, R.G., Eds.; National Academy Press: Washington, DC, USA, 1986; pp. 90–113. [Google Scholar]
- Romero, C.; Rachidi, F.; Paolone, M.; Rubinstein, M. Statistical distribution of lightning currents associated with upward negative flashes based on data collected at Säntis (EMC) tower in 2010–2011. IEEE Trans. Power Deliv. 2013, 28, 1804–1812. [Google Scholar] [CrossRef]
- Cooray, V.; Rakov, V.; Theethayi, N. The lightning striking distance—Revisited. J. Electrost. 2007, 65, 296–306. [Google Scholar]
- Mazur, V.; Ruhnke, L.H. Determining the striking distance of lightning through its relationship to leader potential. J. Geophys. Res. 2003, 108, D14. [Google Scholar] [CrossRef]
- Cooray, V. Introduction to Lightning; Springer: Berlin/Heidelberg, Germany, 2015. [Google Scholar]
- Sunjerga, A.; Rubinstein, M.; Mostajabi, A.; Azadifar, M.; Pineda, N.; Romero, D.; Van der Velde, O.; Montanya, J.; Diendorfer, G.; Ventura, J.F.; et al. LMA Observation of Upward Bipolar Lightning Flash at the Säntis Tower. In XV International Symposium on Lightning Protection SIPDA; IEEE: Sao Paolo, Brazil, 2019. [Google Scholar]
- Pineda, N.; Figueras, I.; Ventura, J.; Romero, D.; Mostajabi, A.; Azadifar, M.; Sunjerga, A.; Rachidi, F.; Rubinstein, M.; Montanyà, J.; et al. On the Meteorological Regimes Related to Upward Lightning at the Säntis Tower (Switzerland). J. Geophys. Res. Atmos. 2019, 124, 14162–14183. [Google Scholar] [CrossRef]
- Sunjerga, A.; Rubinstein, M.; Pineda, N.; Mostajabi, A.; Azadifar, M.; Romero, D.; Van der Velde, O.; Montanya, J.; Ventura, J.F.; Besic, N. LMA observations of upward lightning flashes at the Säntis Tower initiated by nearby lightning activity. Electr. Power Syst. Res. 2020, 181, 106067. [Google Scholar] [CrossRef]
- Williams, E. Charge structure and geographical variation of thunderclouds. In The Lightning Flash; Cooray, V., Ed.; IEE publishers: London, UK, 2003. [Google Scholar]
© 2020 by the authors. Licensee MDPI, Basel, Switzerland. This article is an open access article distributed under the terms and conditions of the Creative Commons Attribution (CC BY) license (http://creativecommons.org/licenses/by/4.0/).