Aircraft Takeoff Performance in a Changing Climate for Canadian Airports

Abstract
1. Introduction
2. Model, Simulations and Observation Data
2.1. Model and Simulations
2.2. Observation Data
3. Methodology
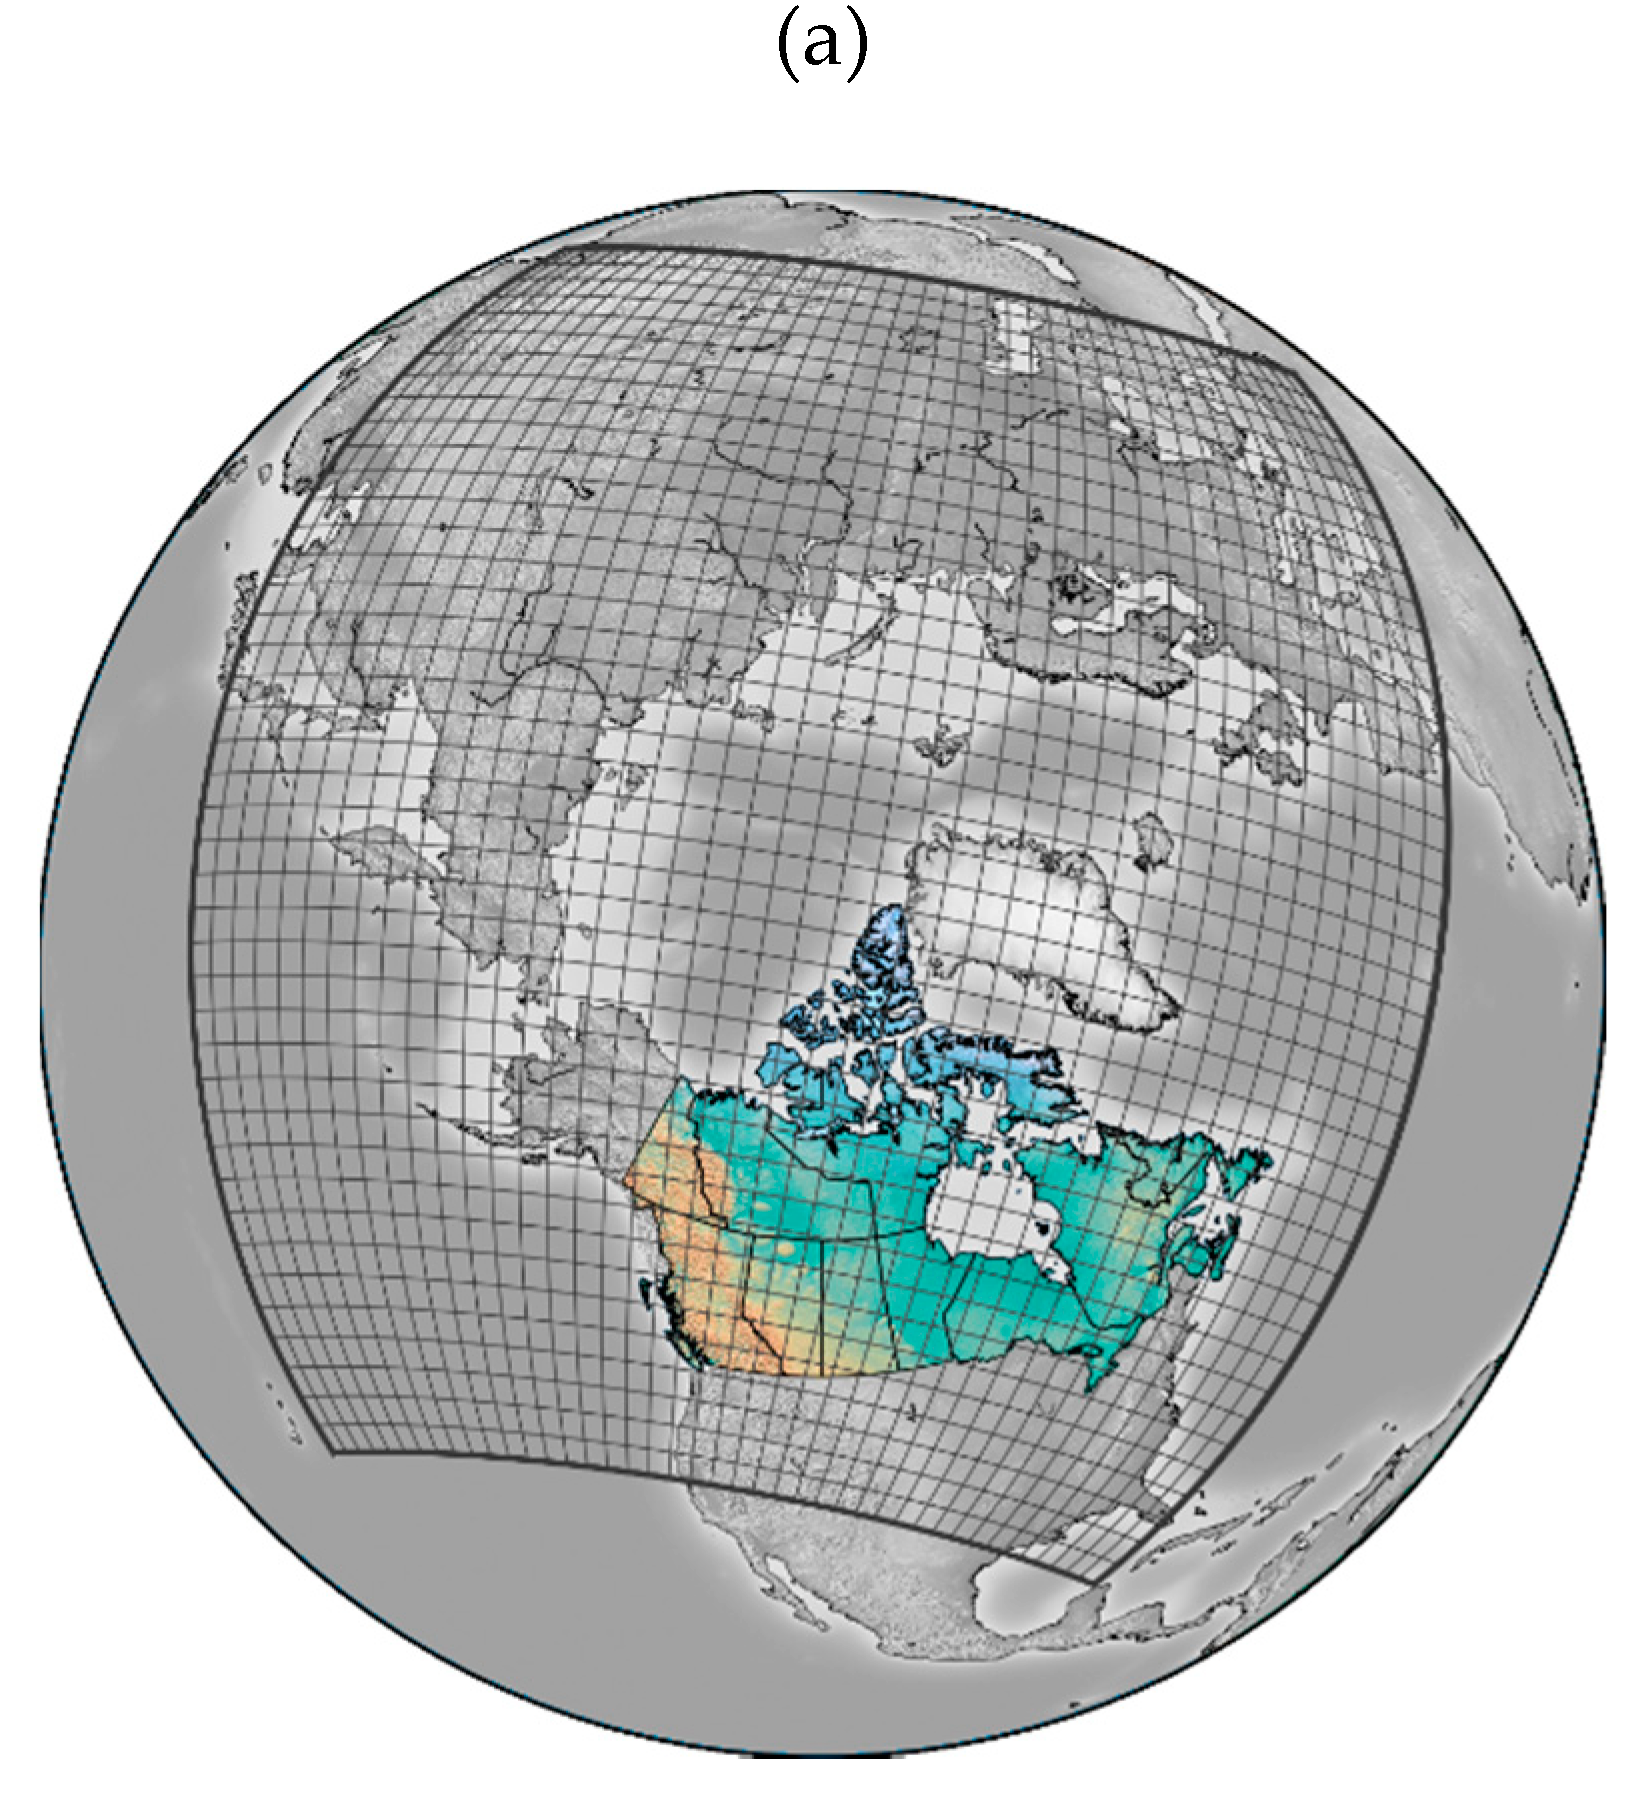
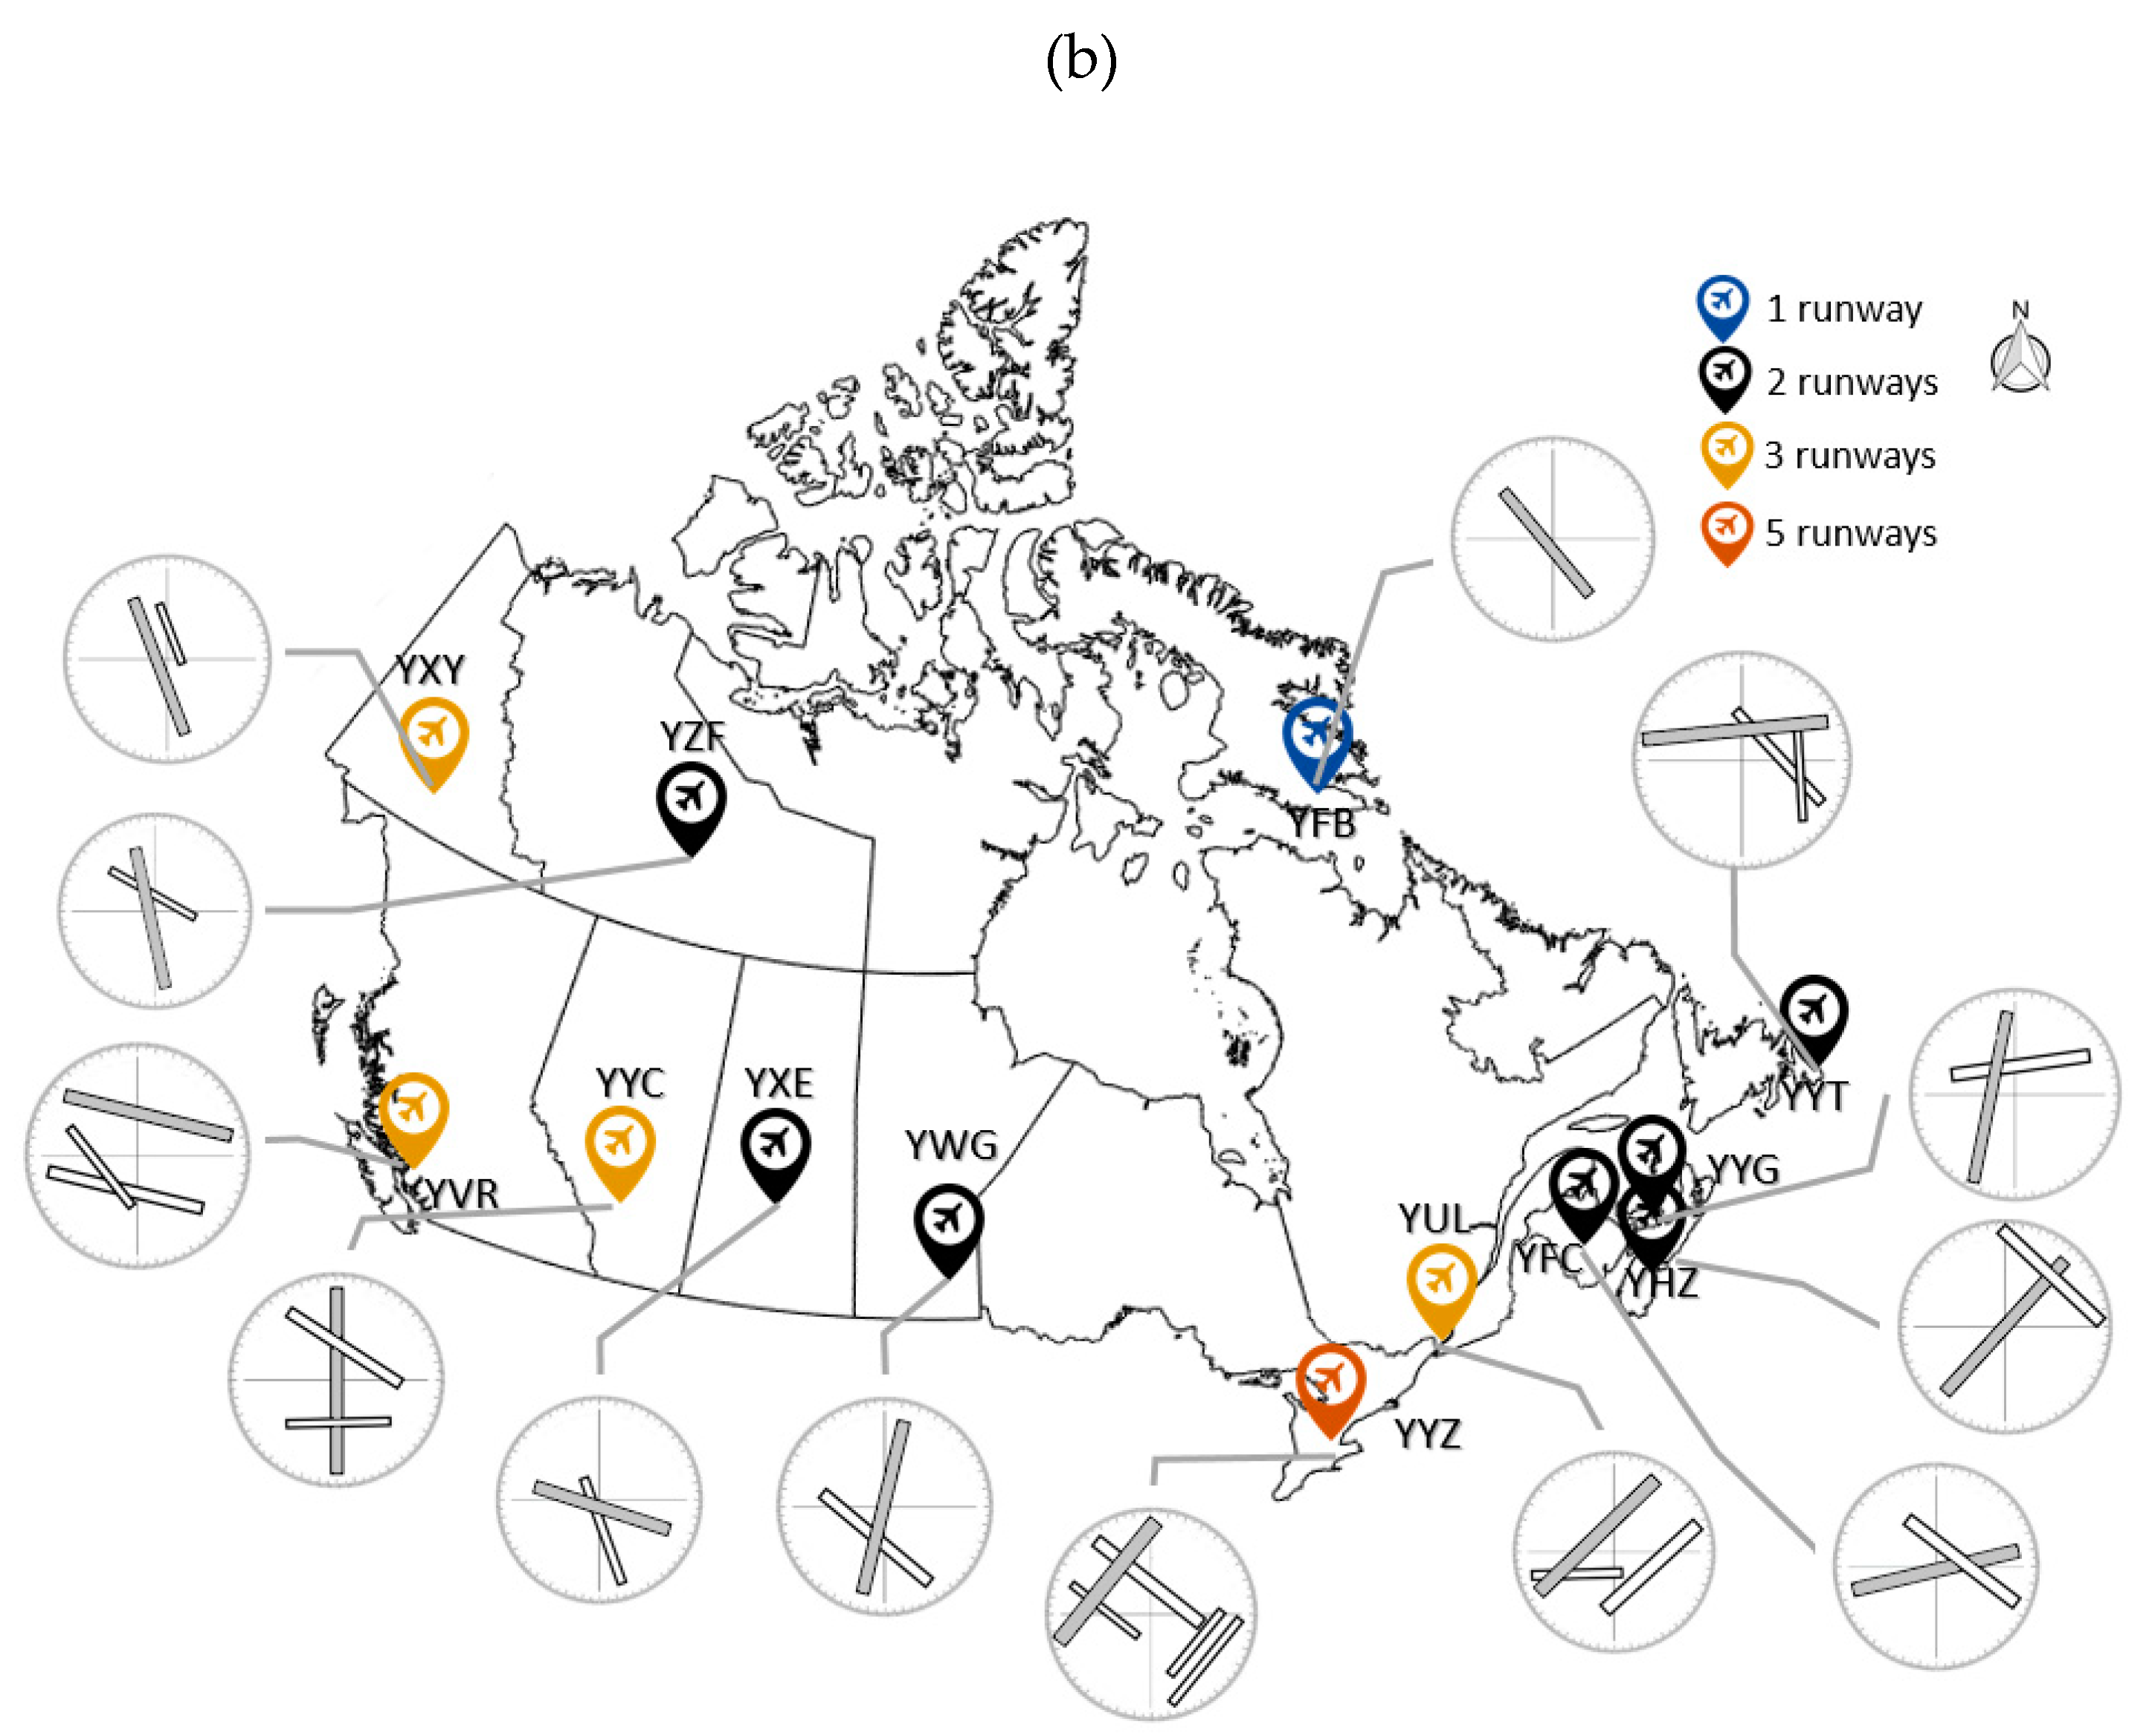
3.1. Definitions, Thresholds and Airfields
3.2. Approaches
4. Results
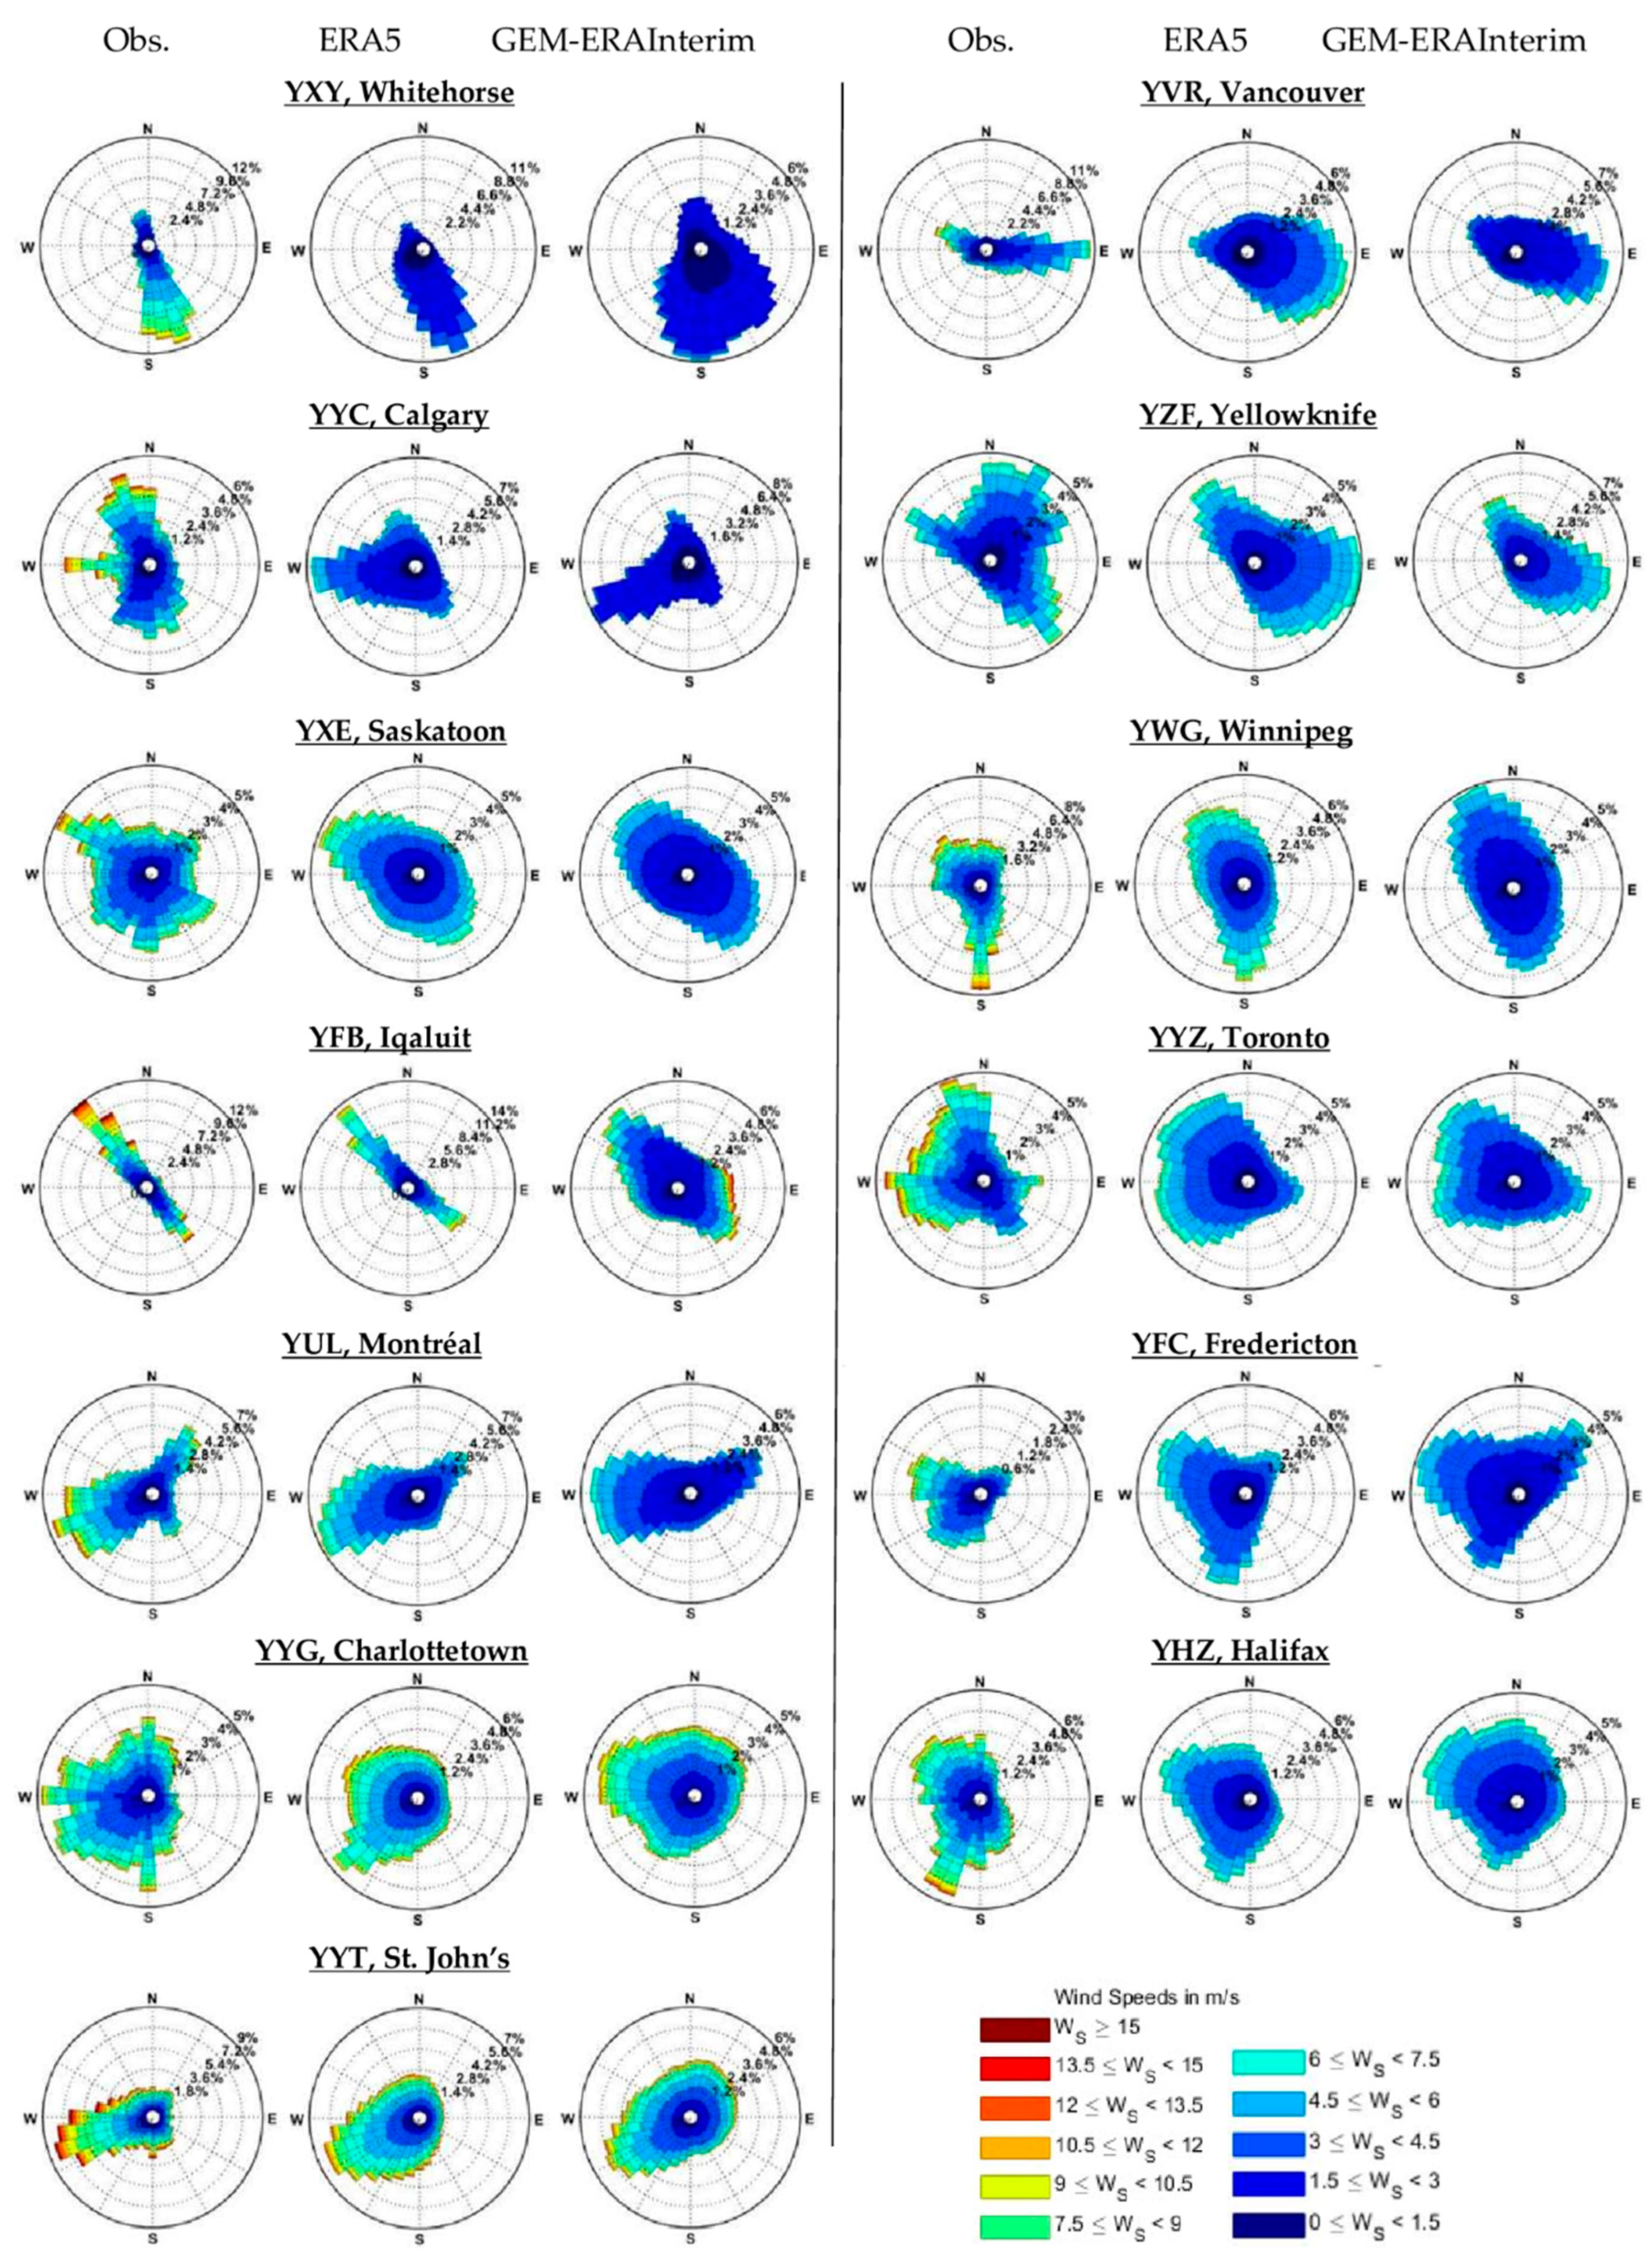
4.1. Validation
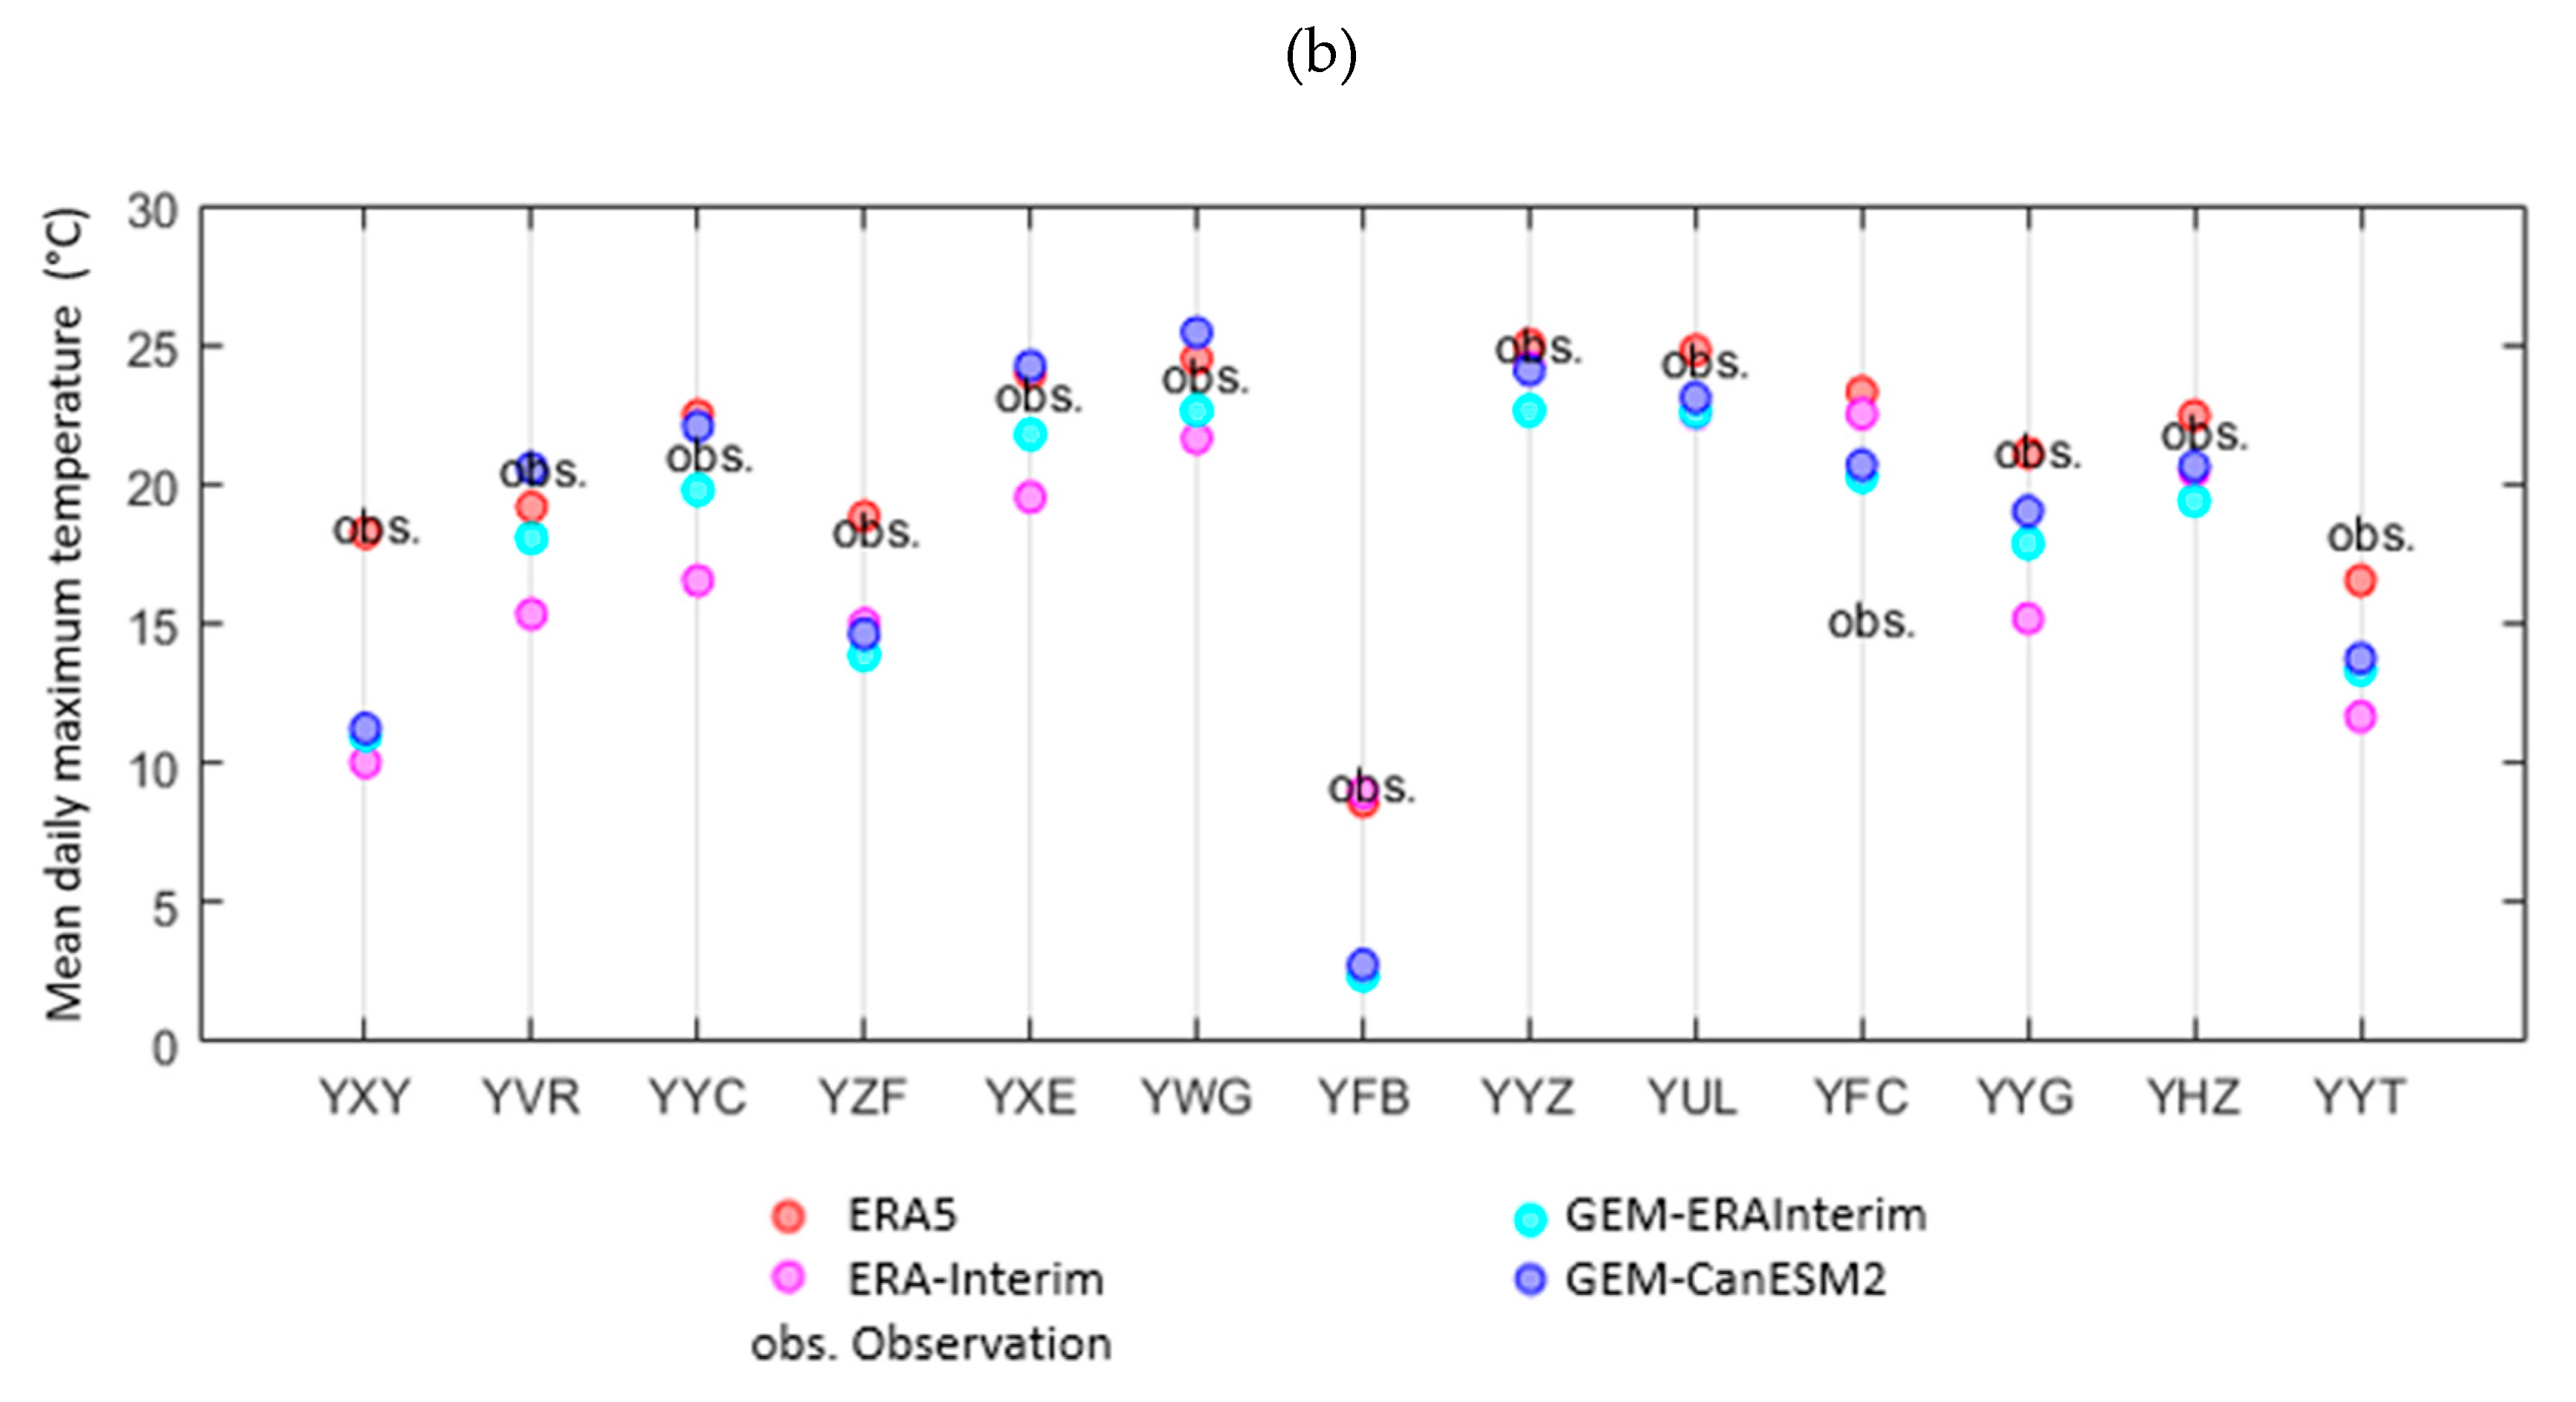
4.1.1. Daily Maximum Temperature
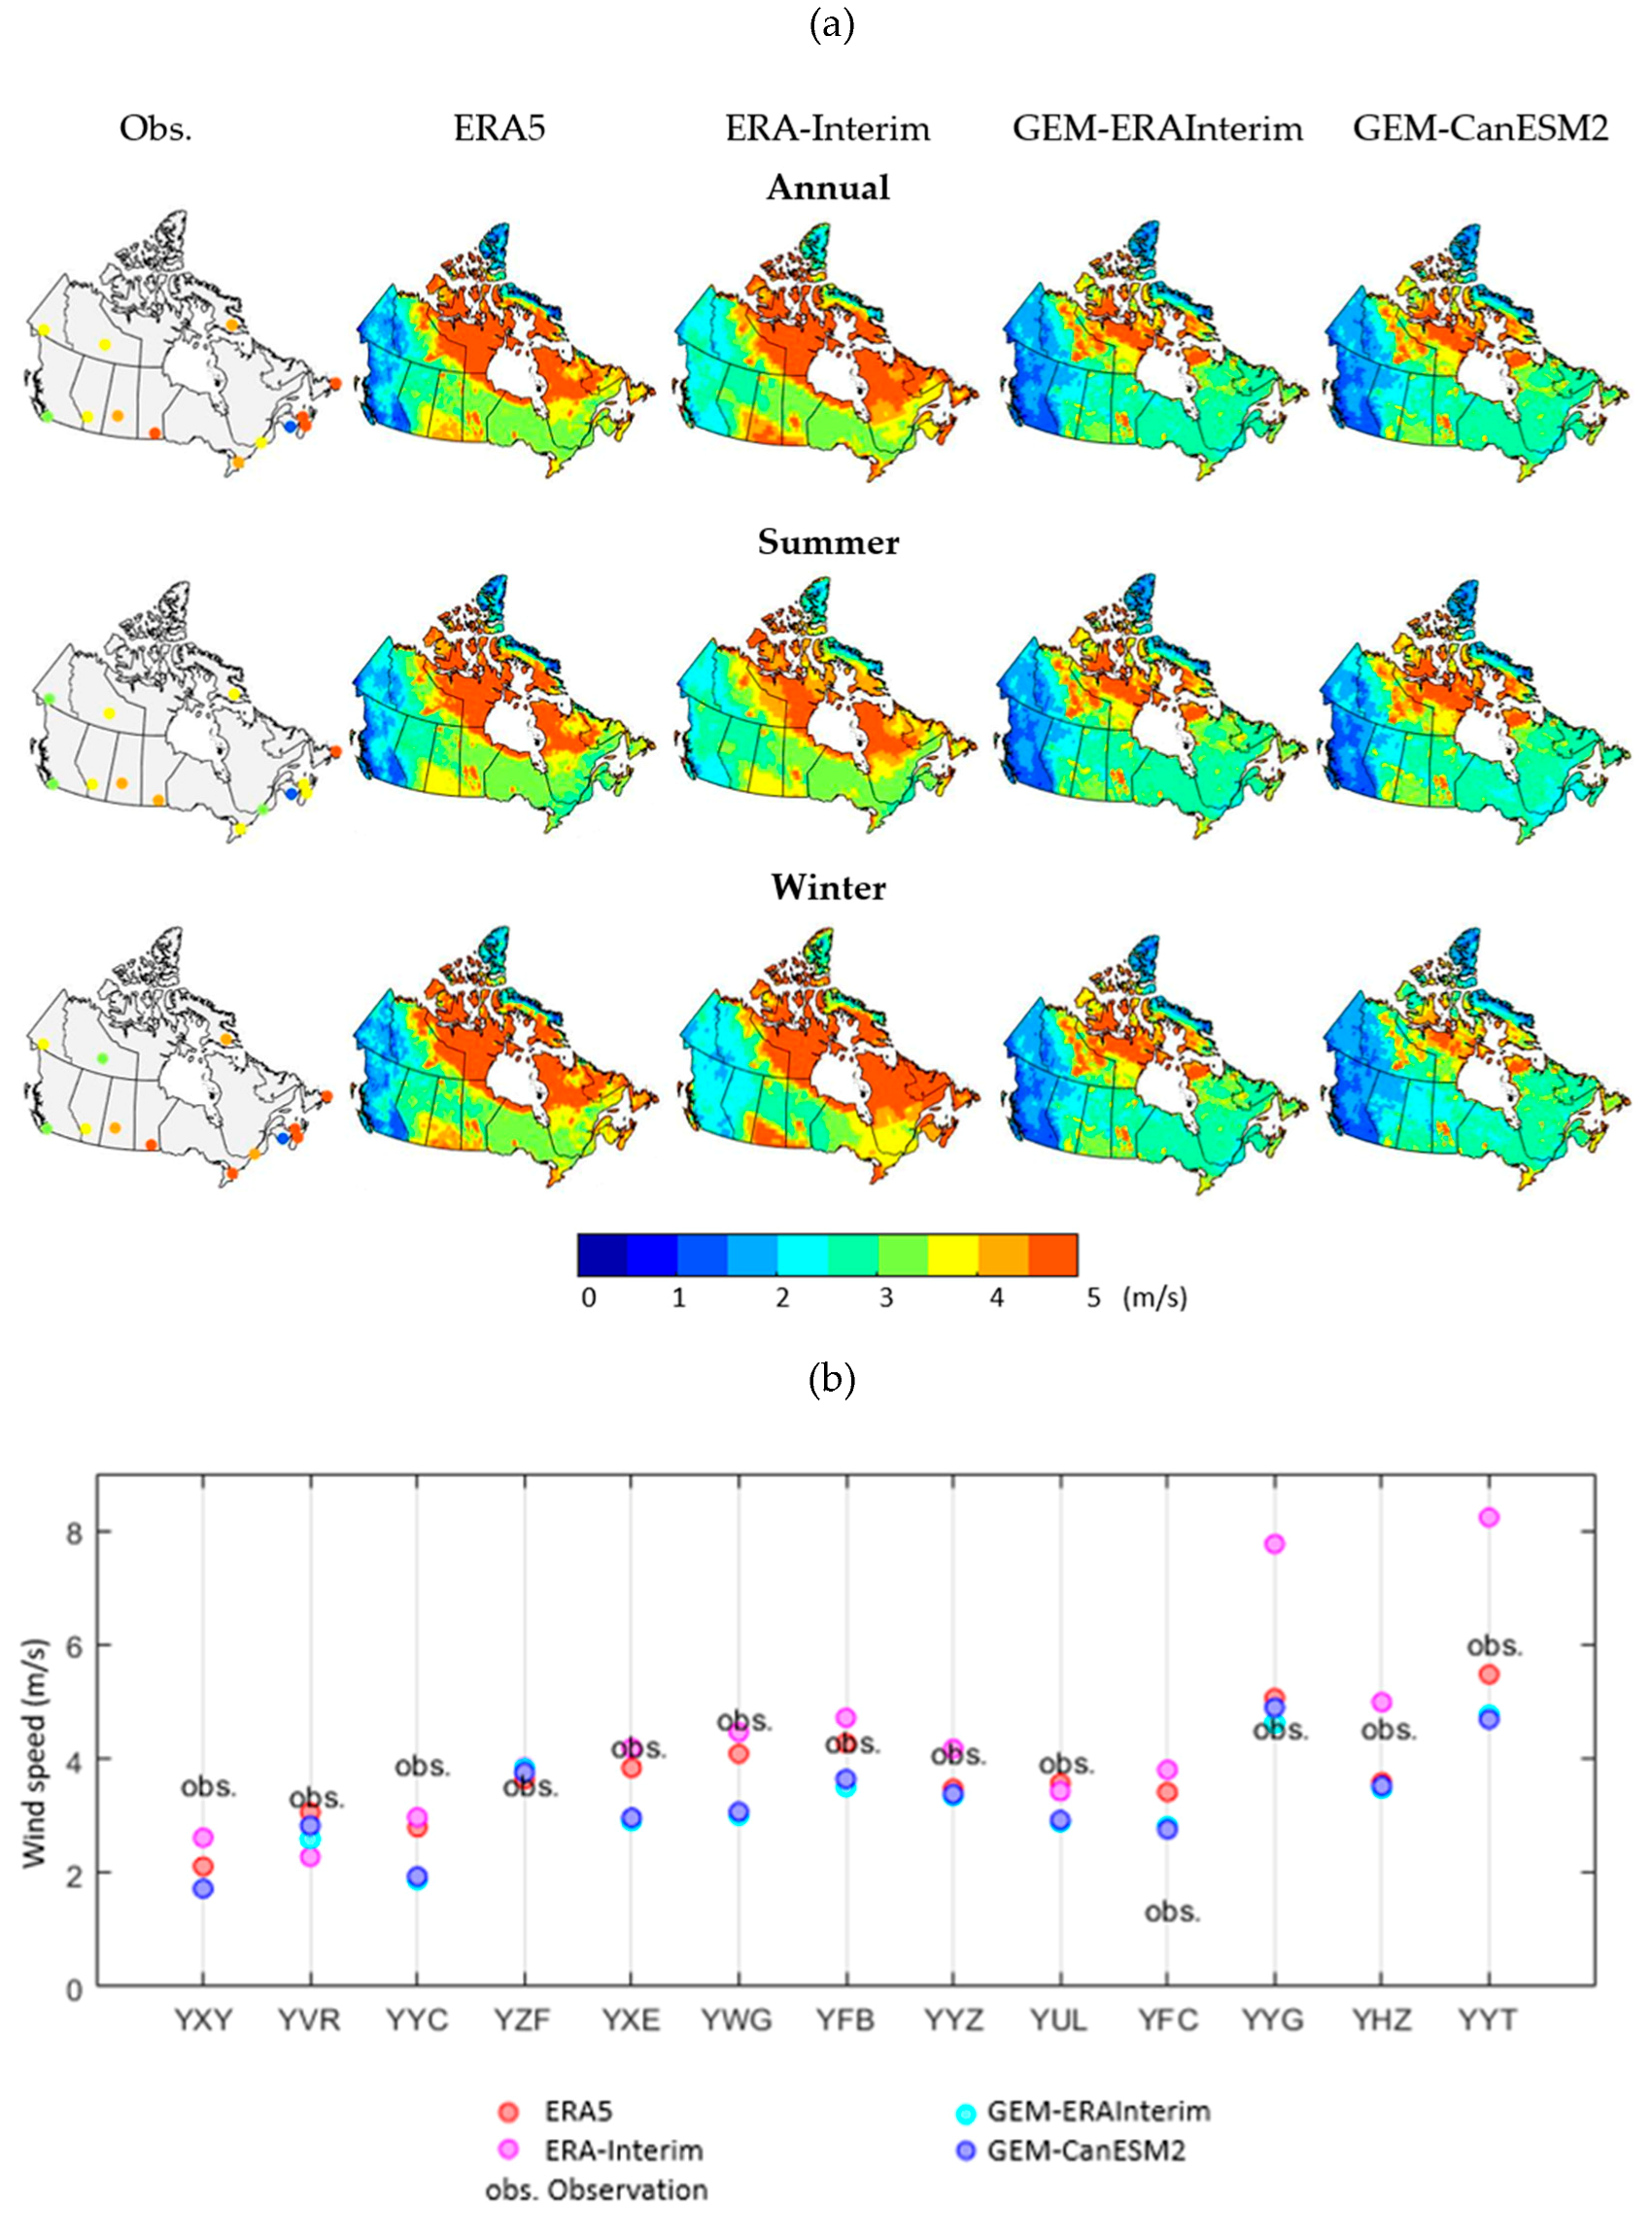
4.1.2. Wind
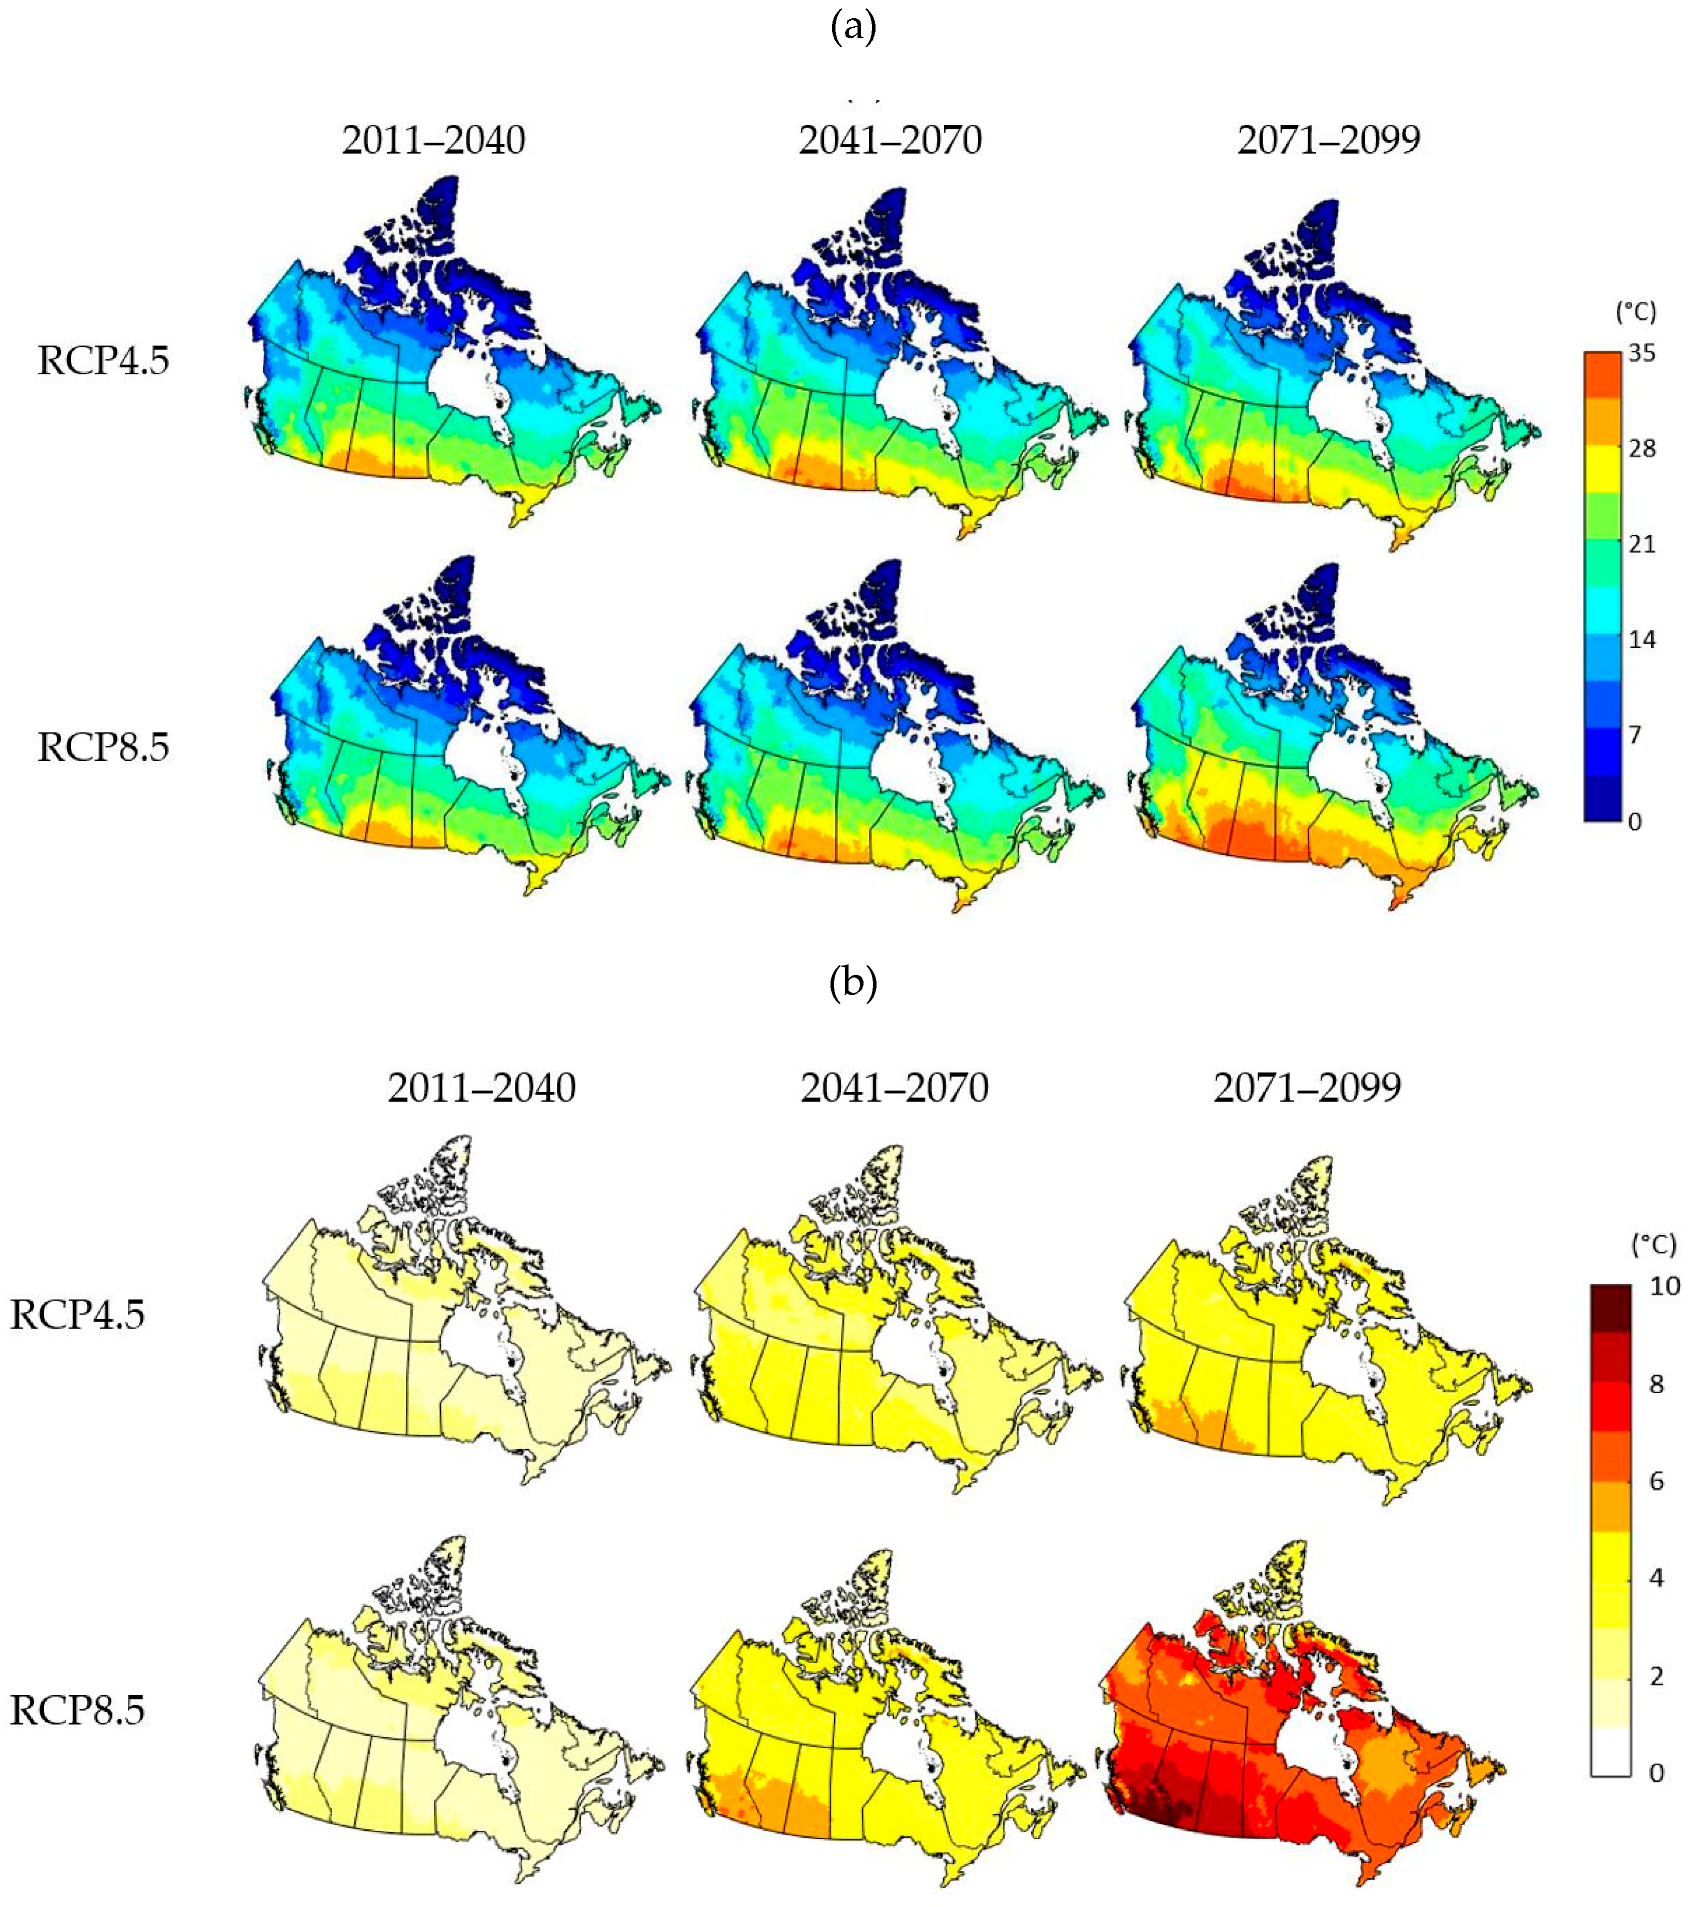
4.2. Projected Changes
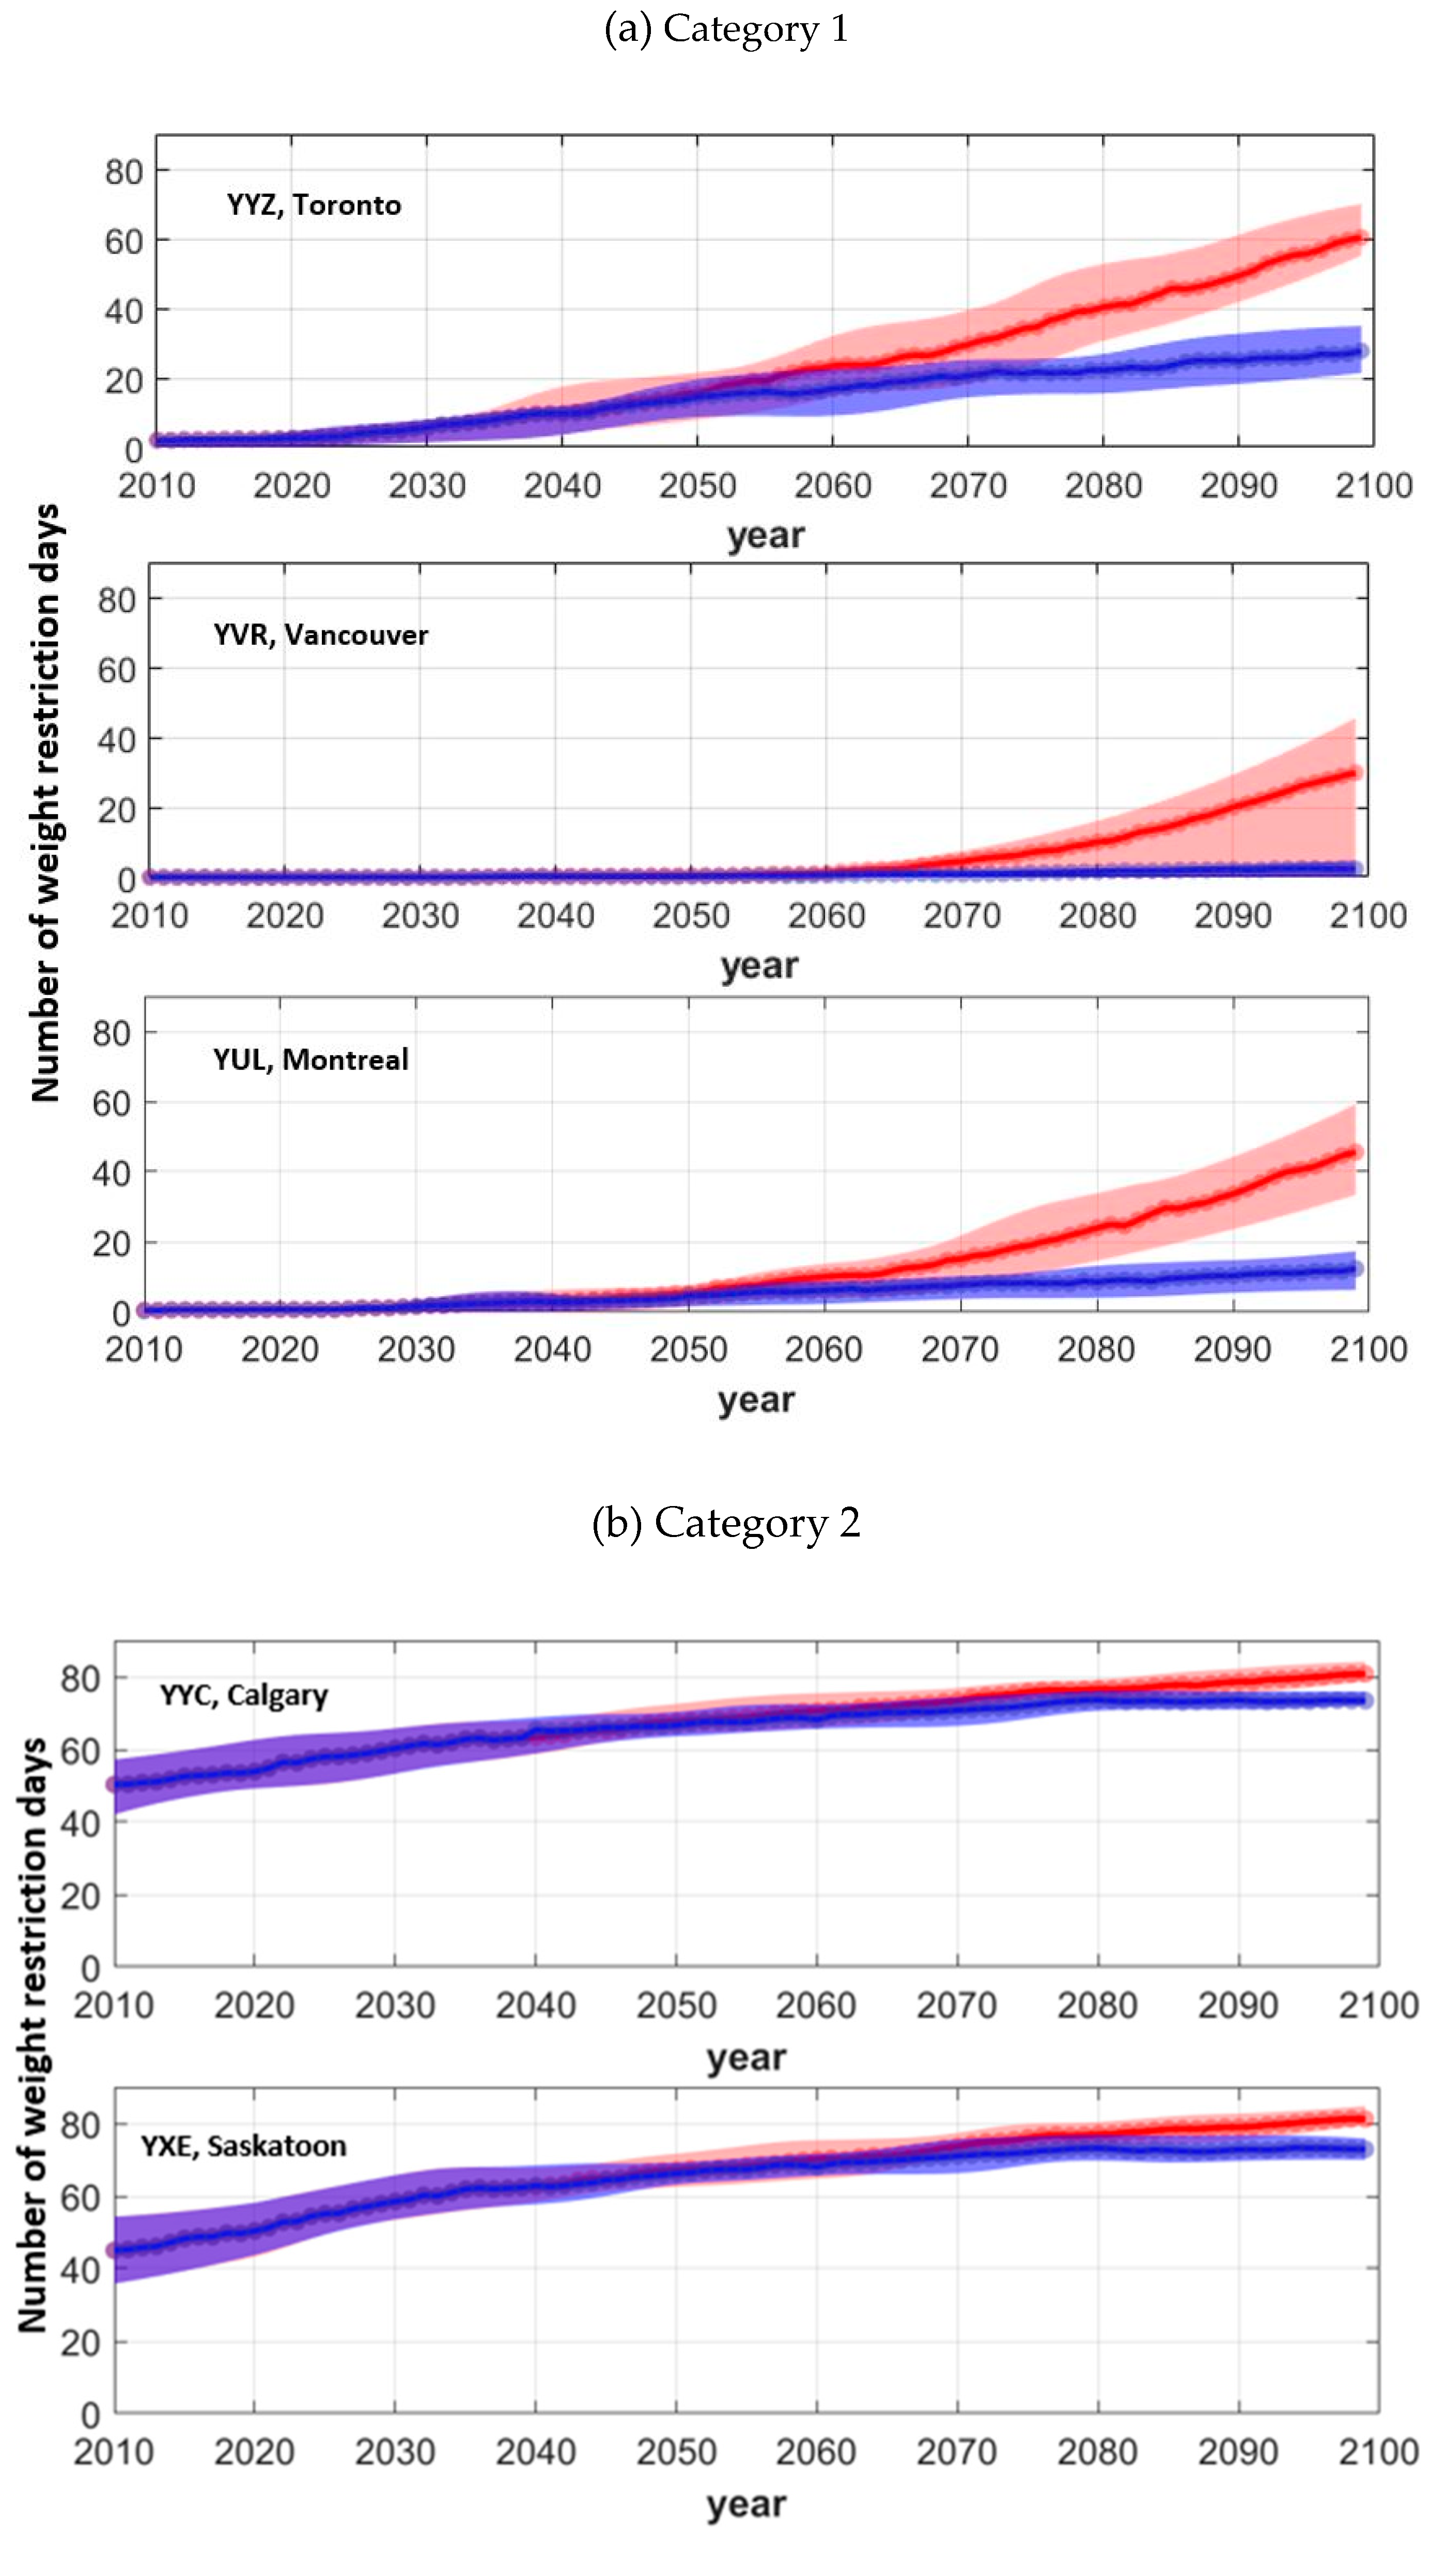
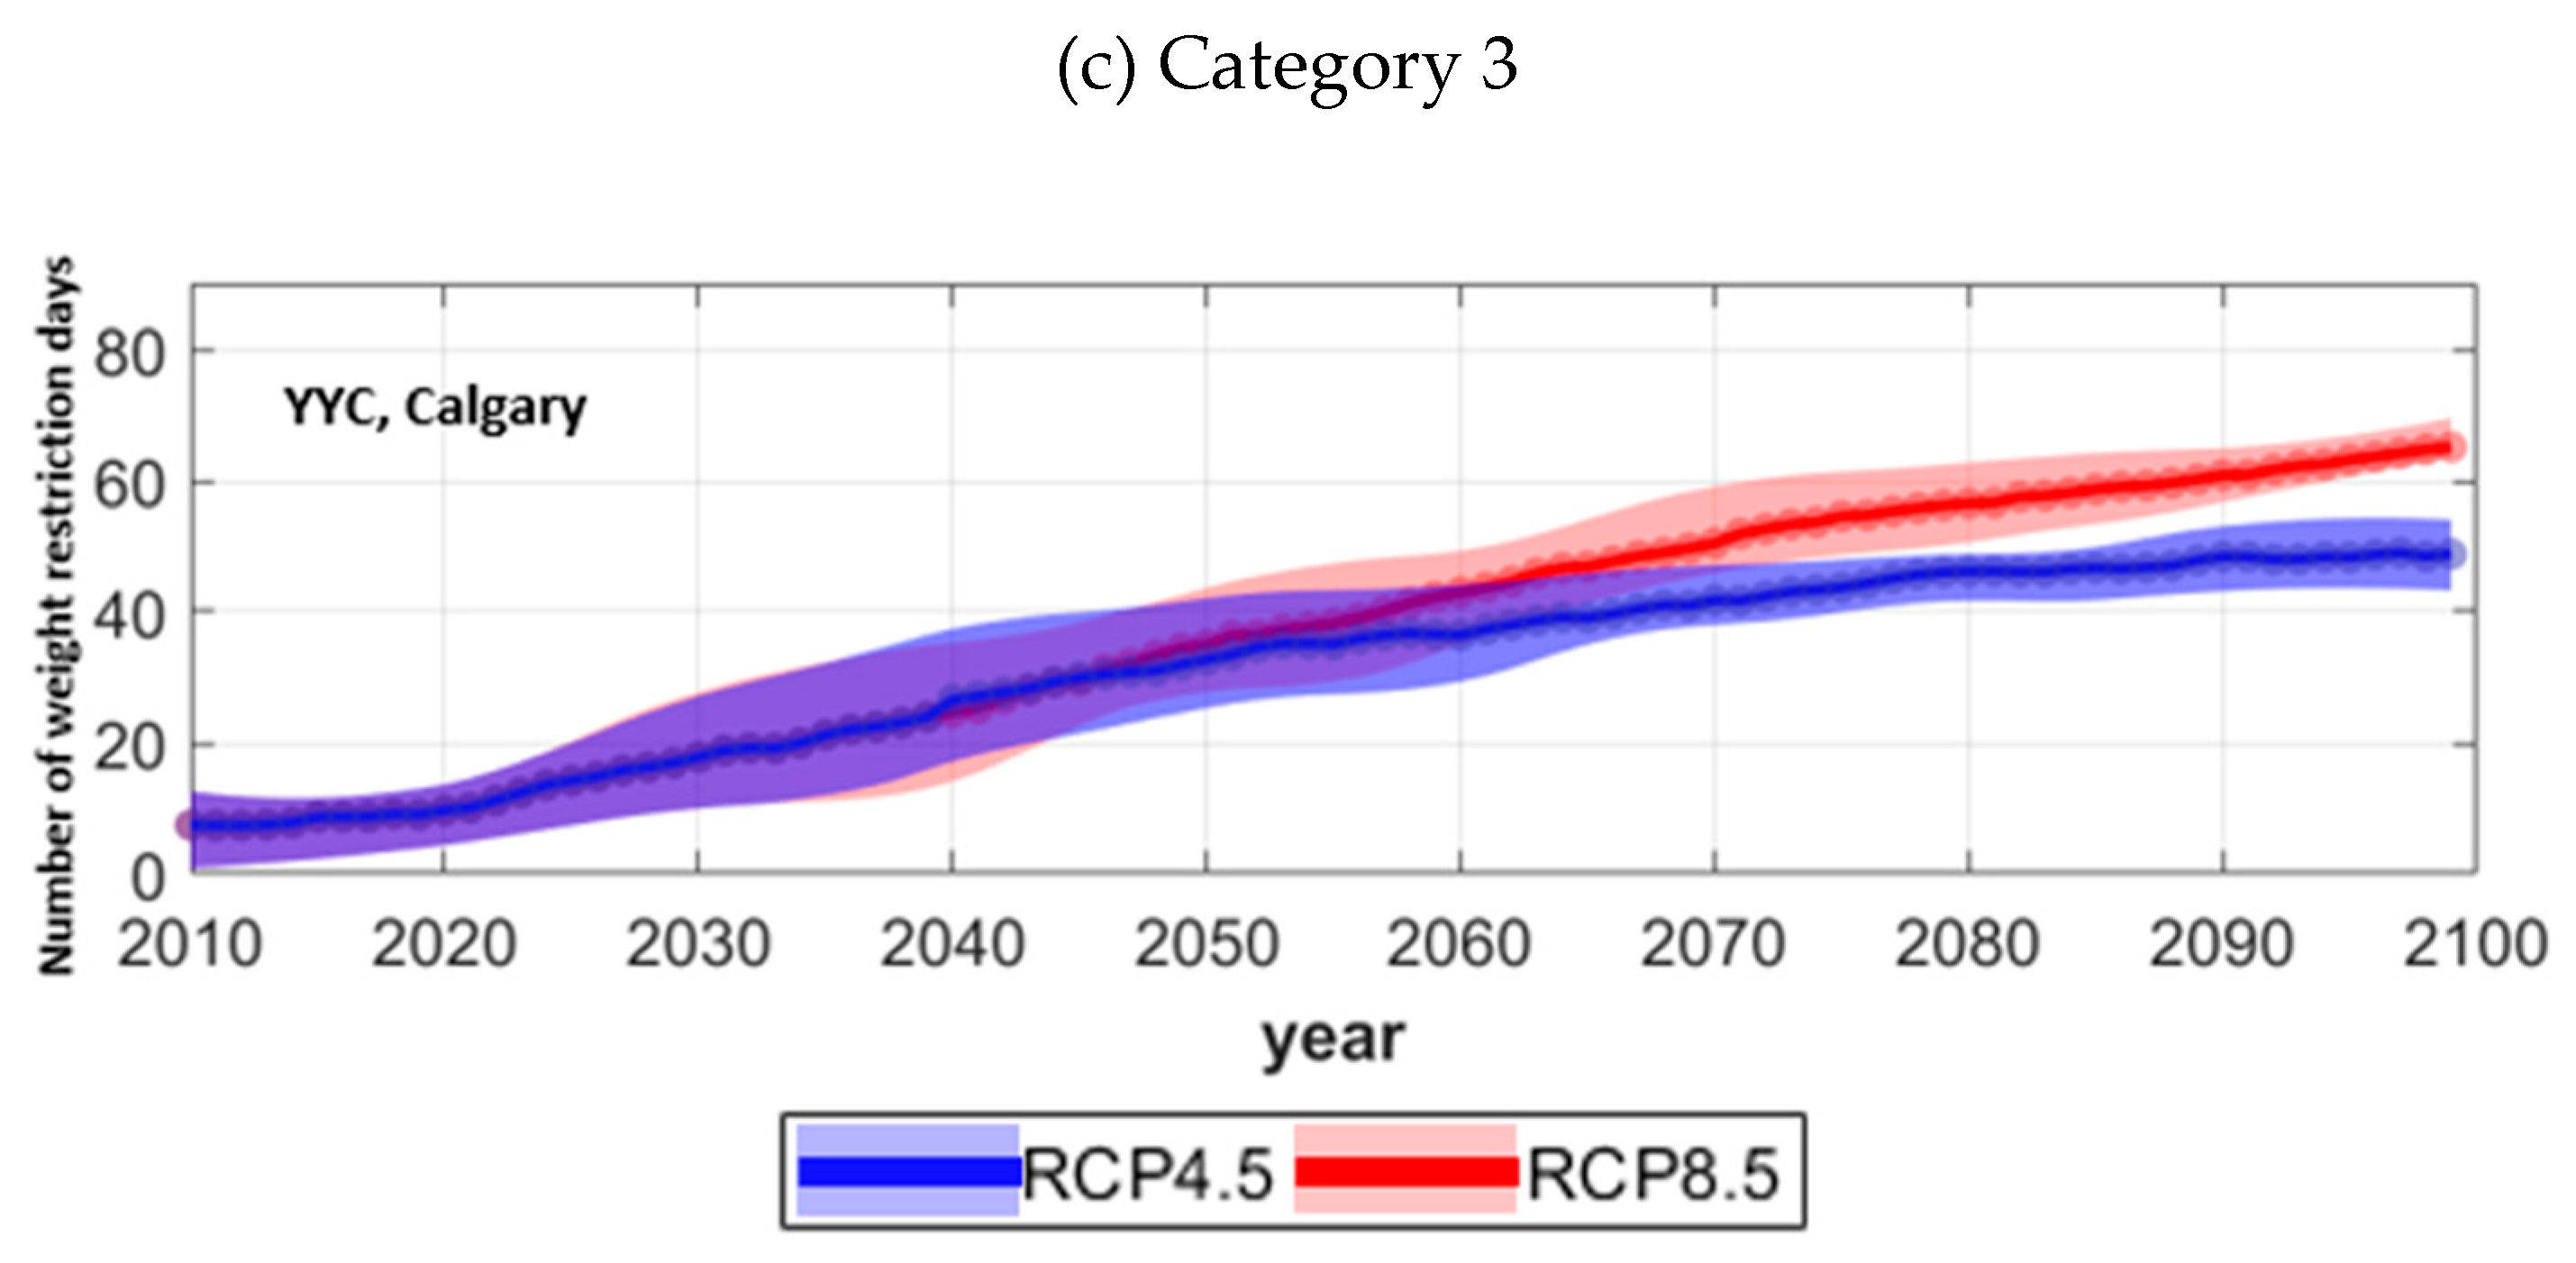
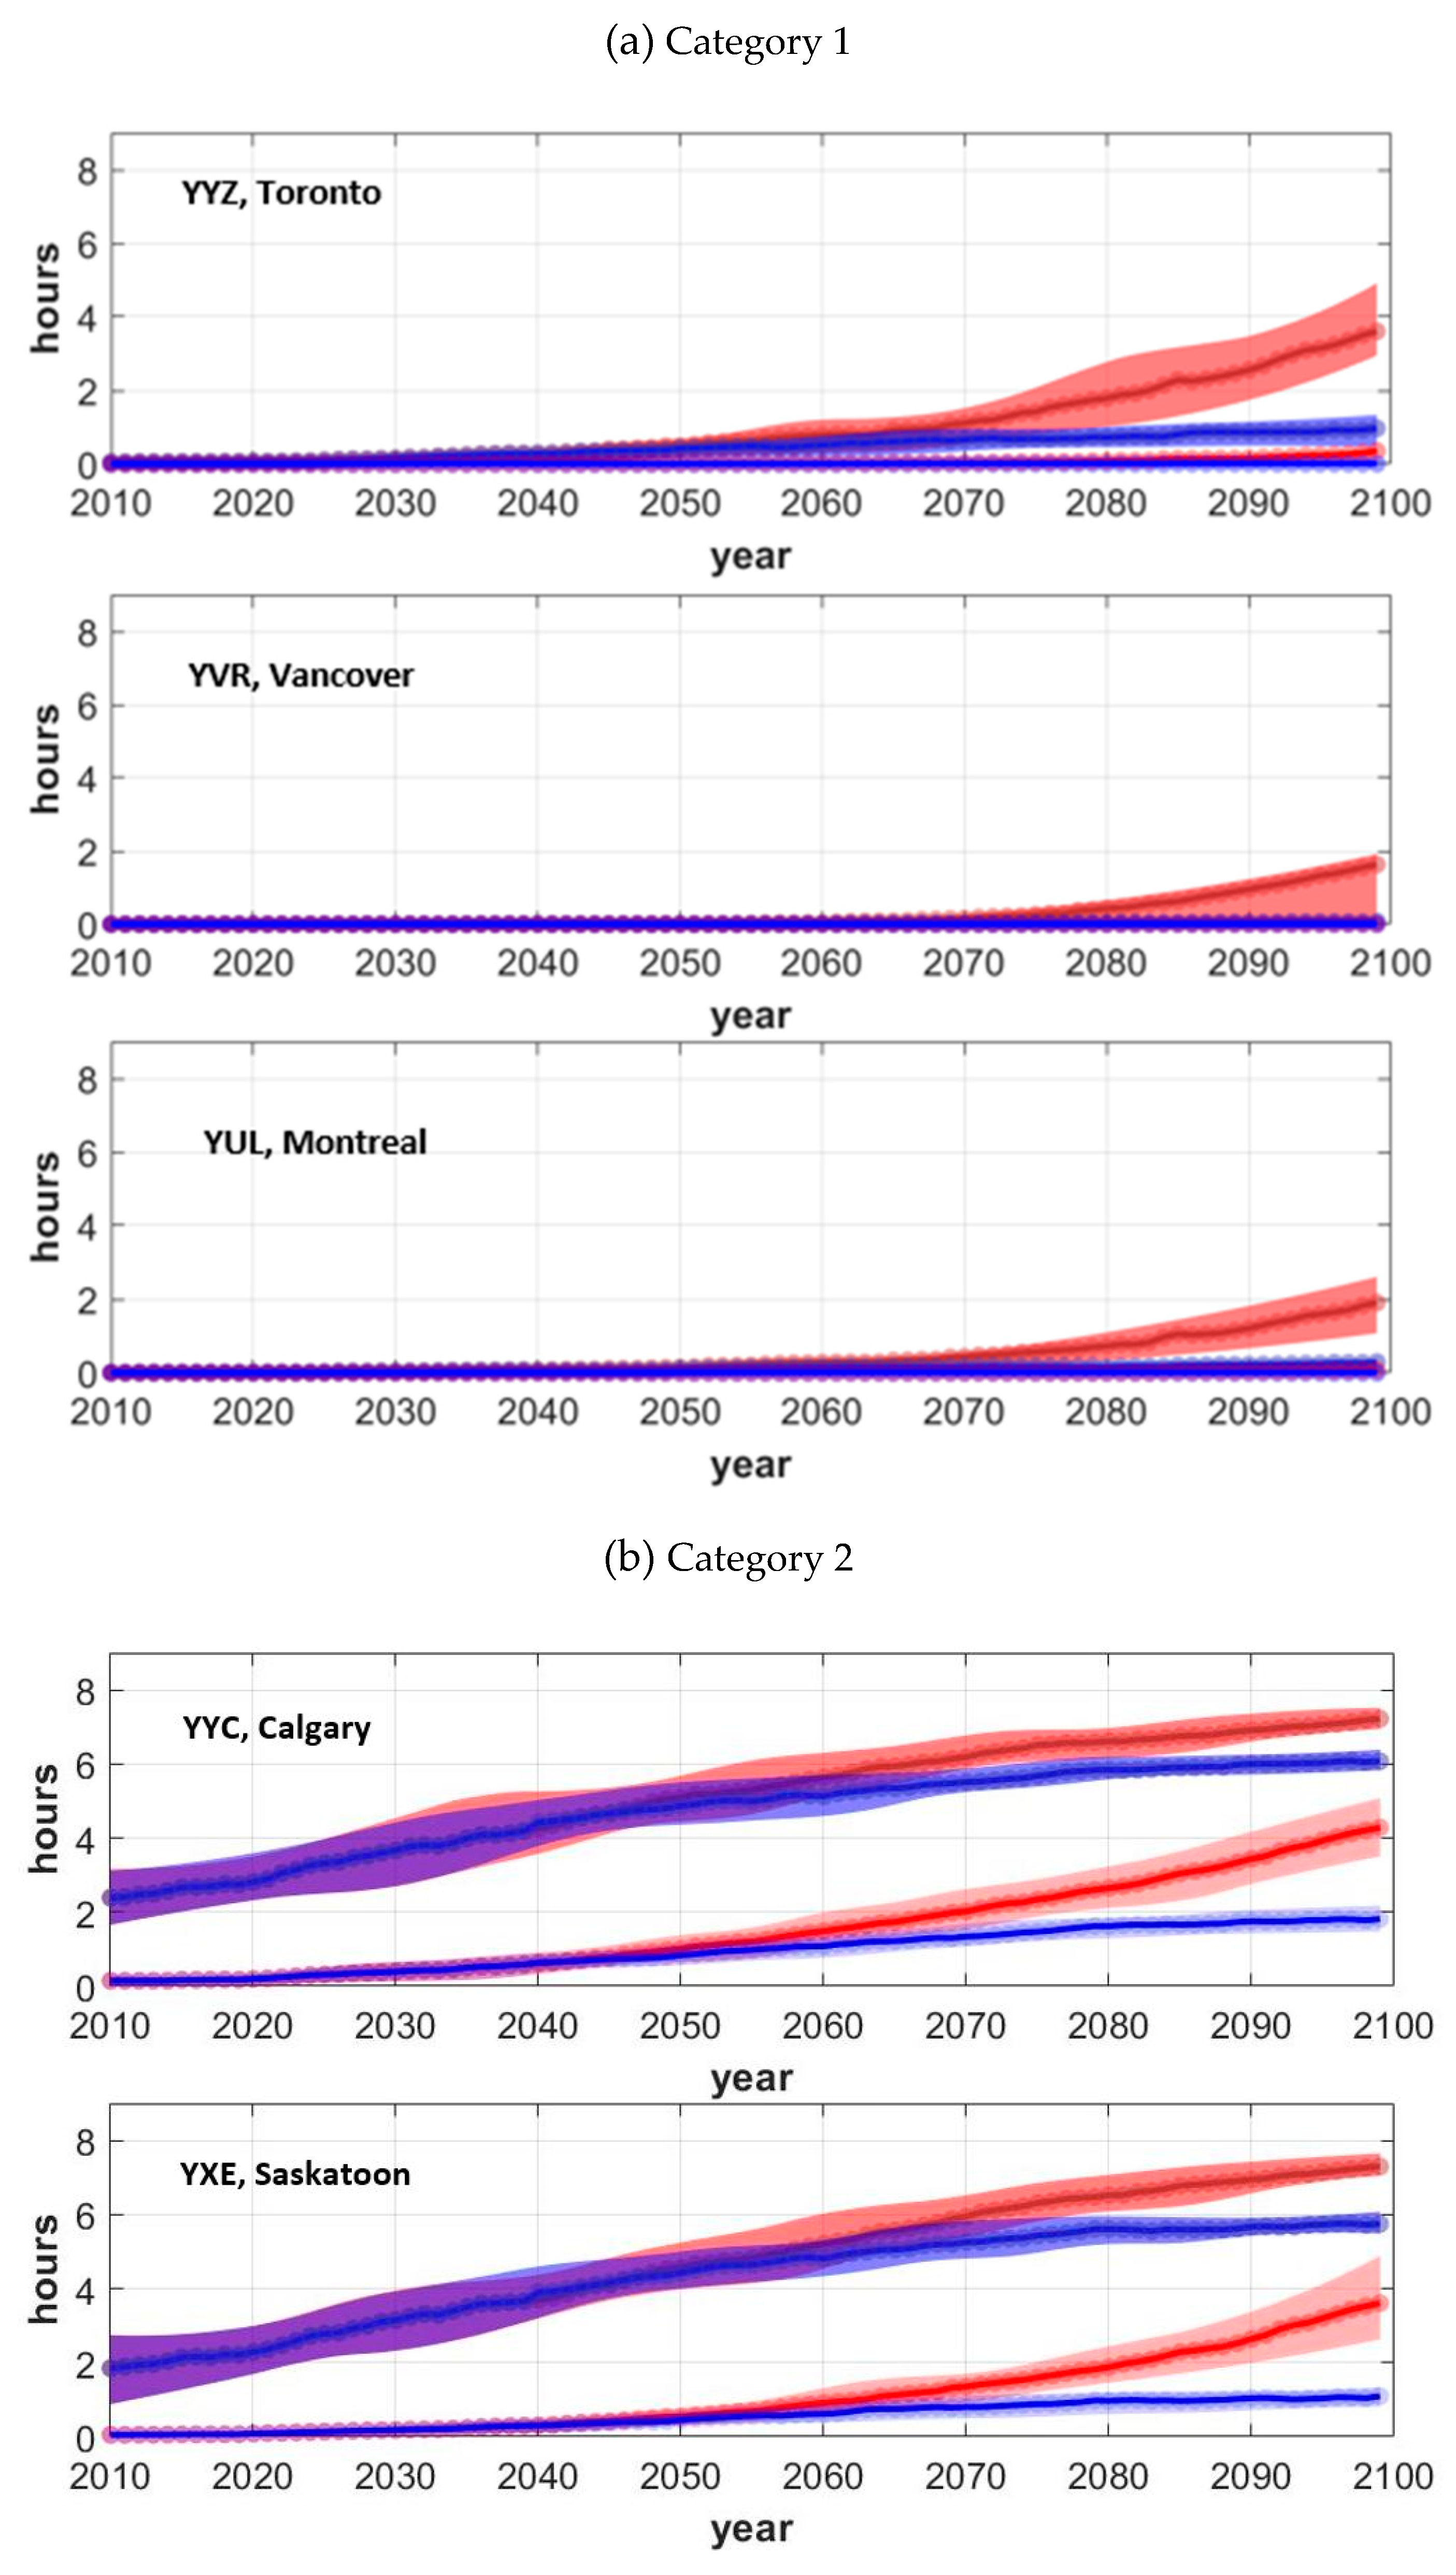
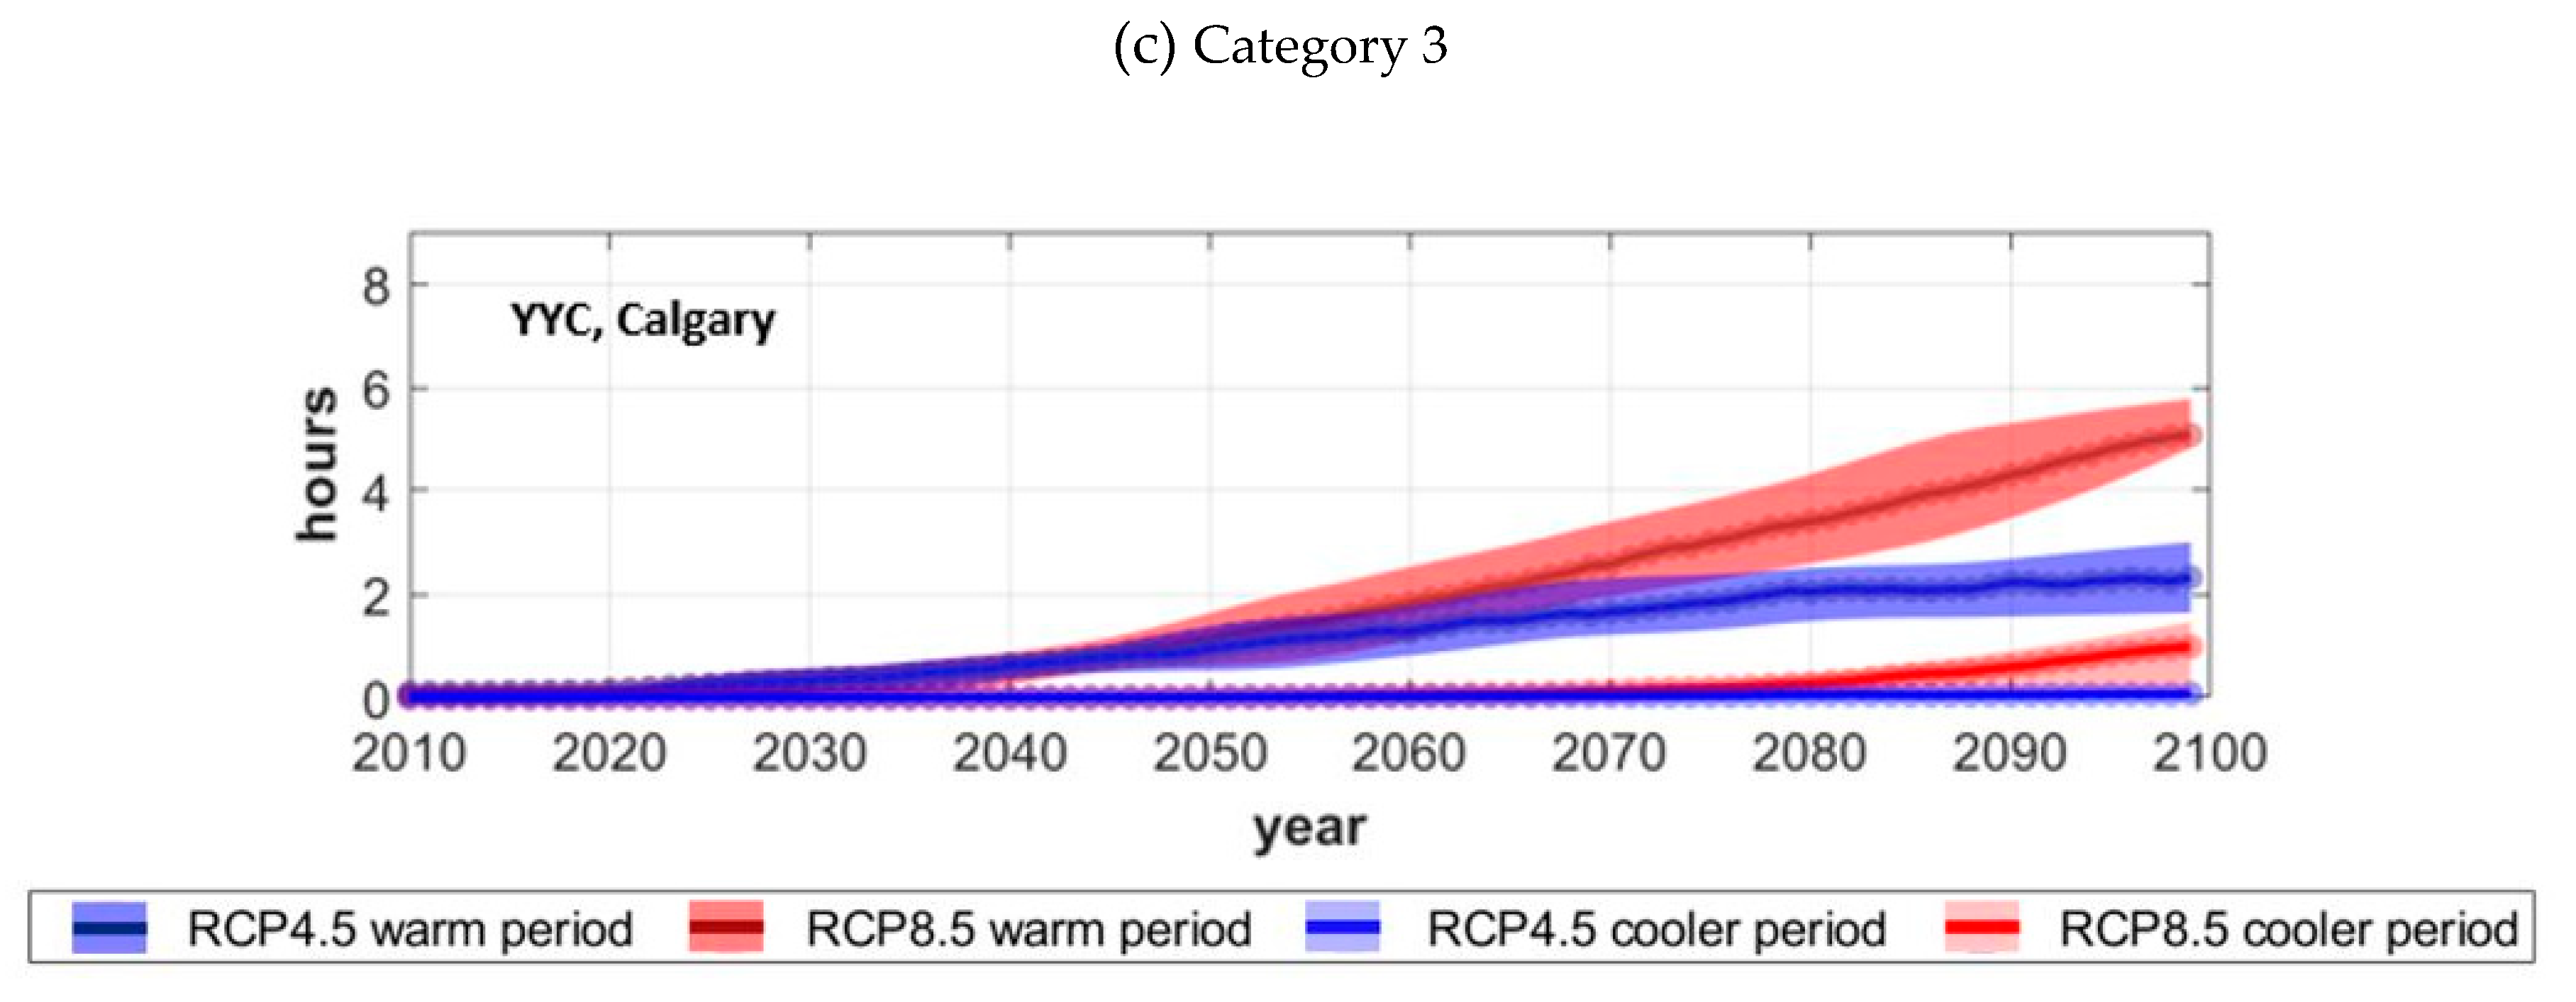
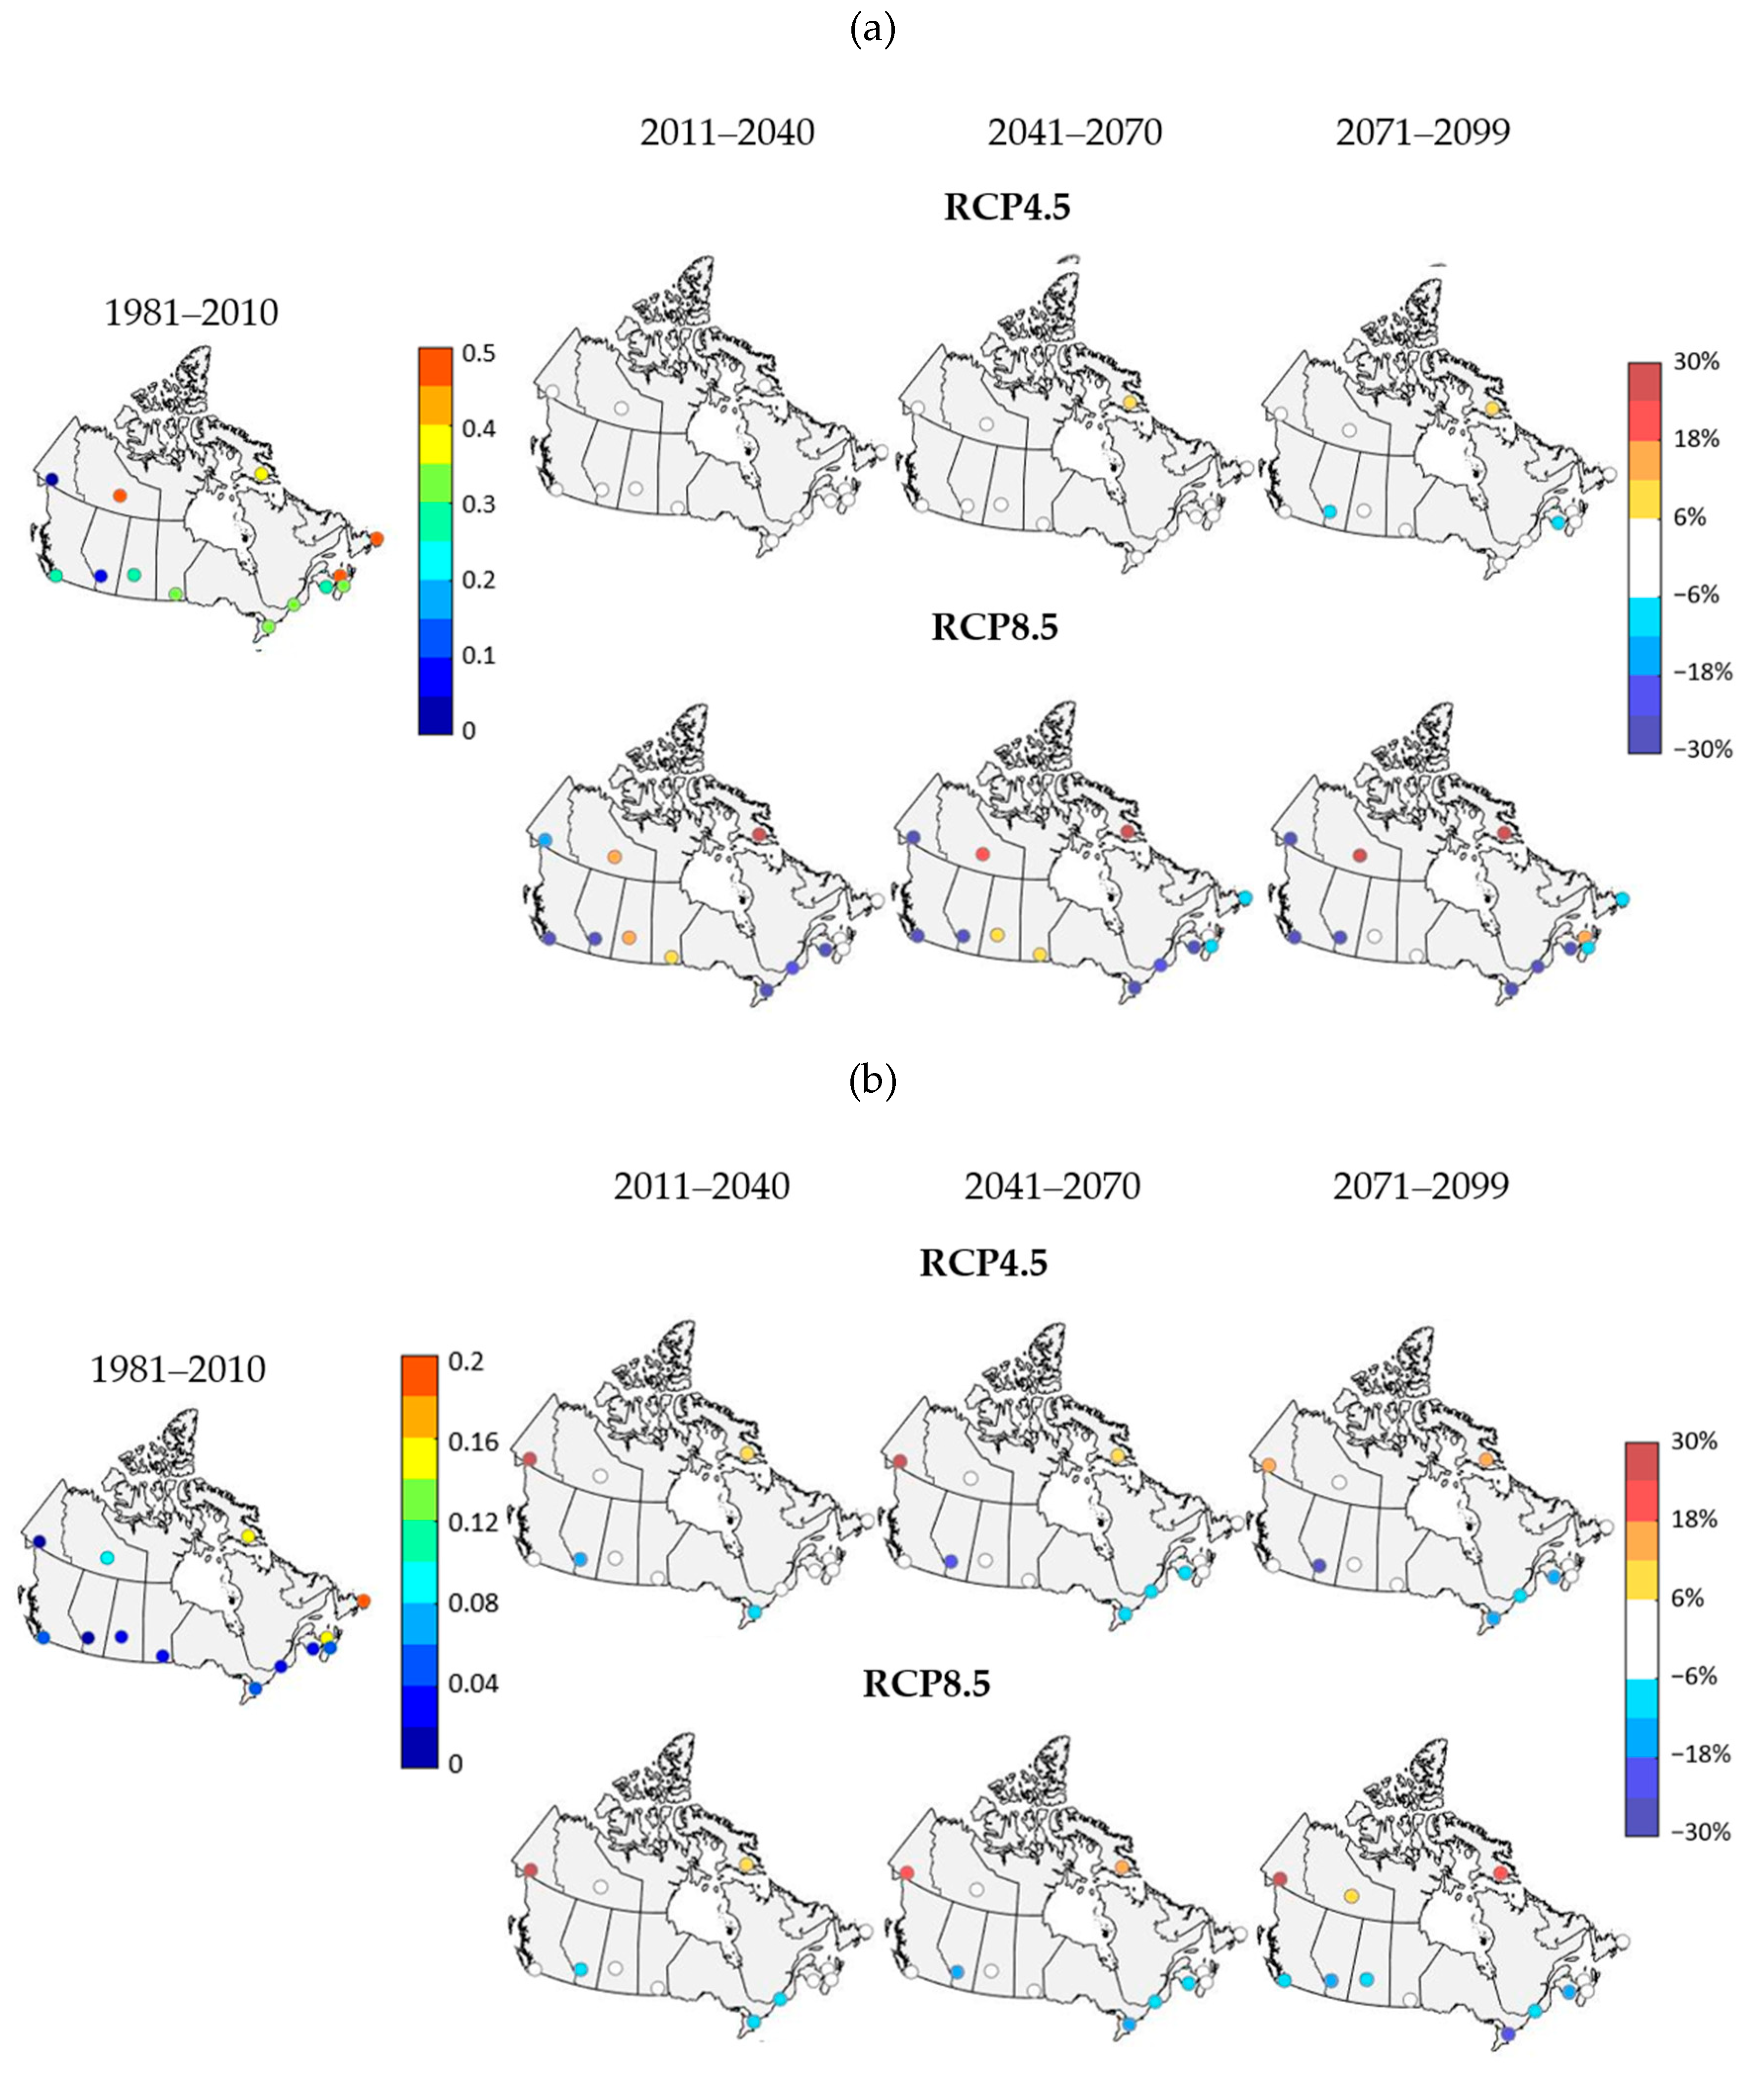
4.2.1. Daily Maximum Temperature and Weight Restriction Days/Hours
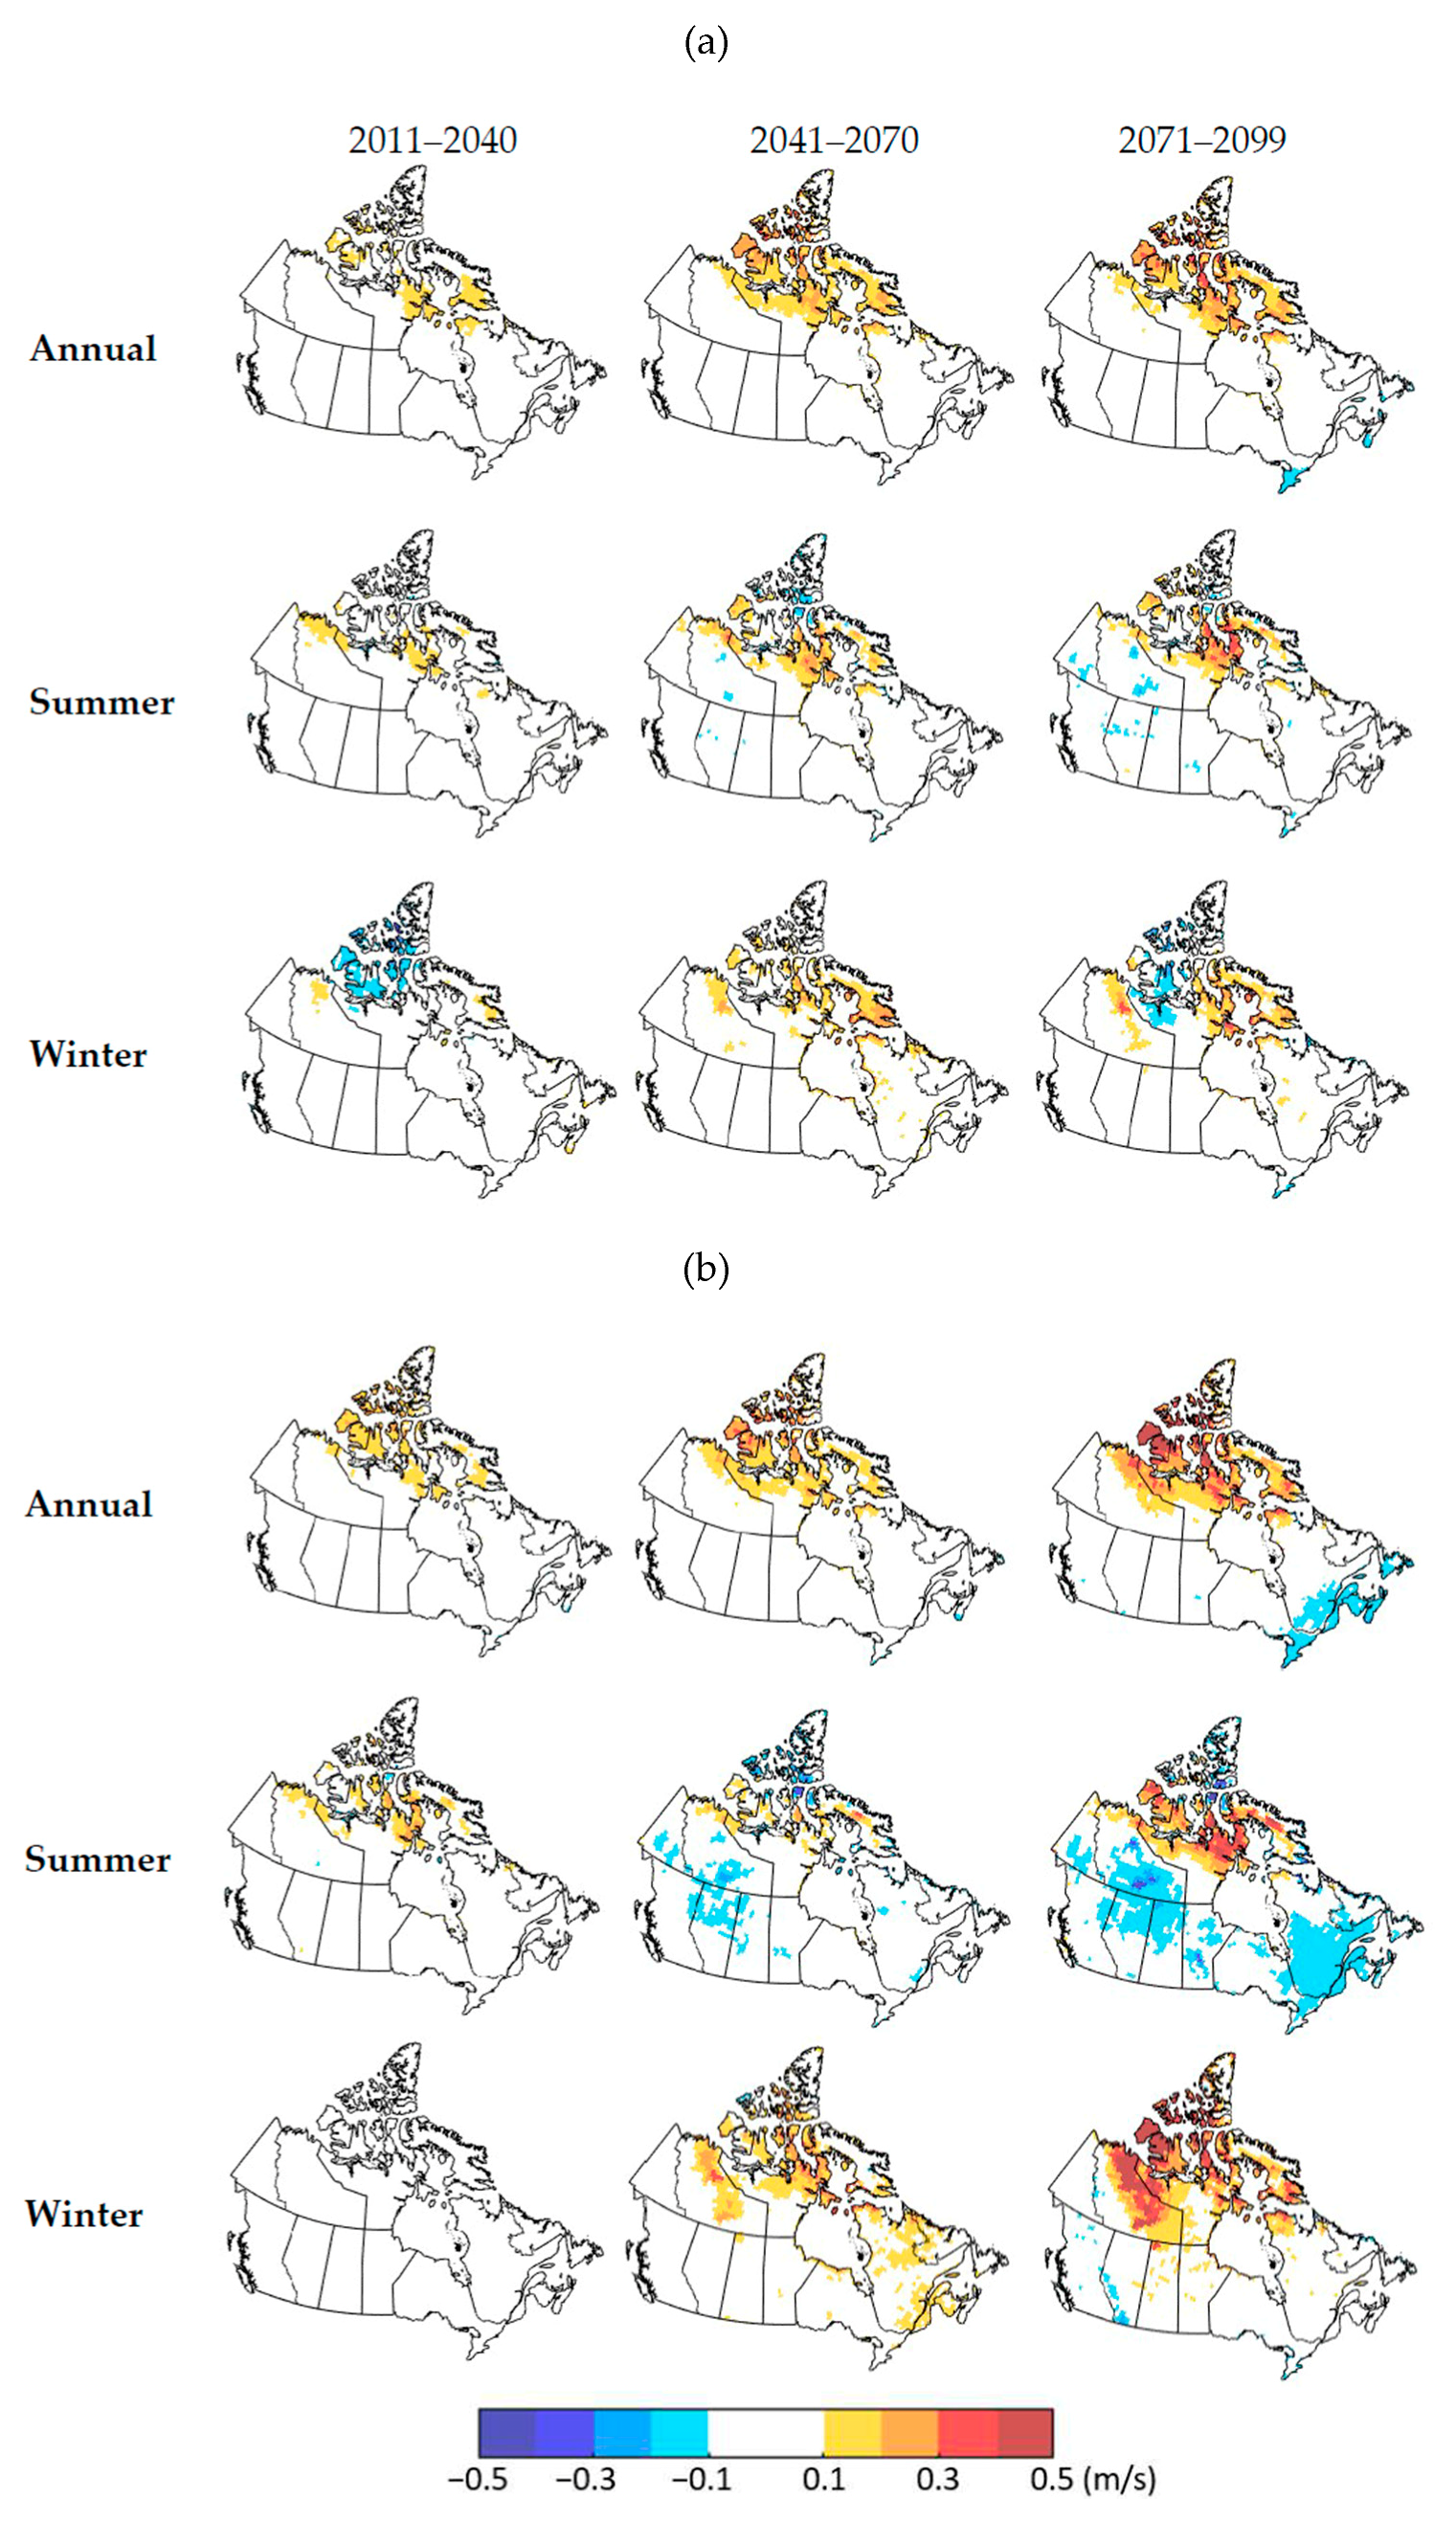
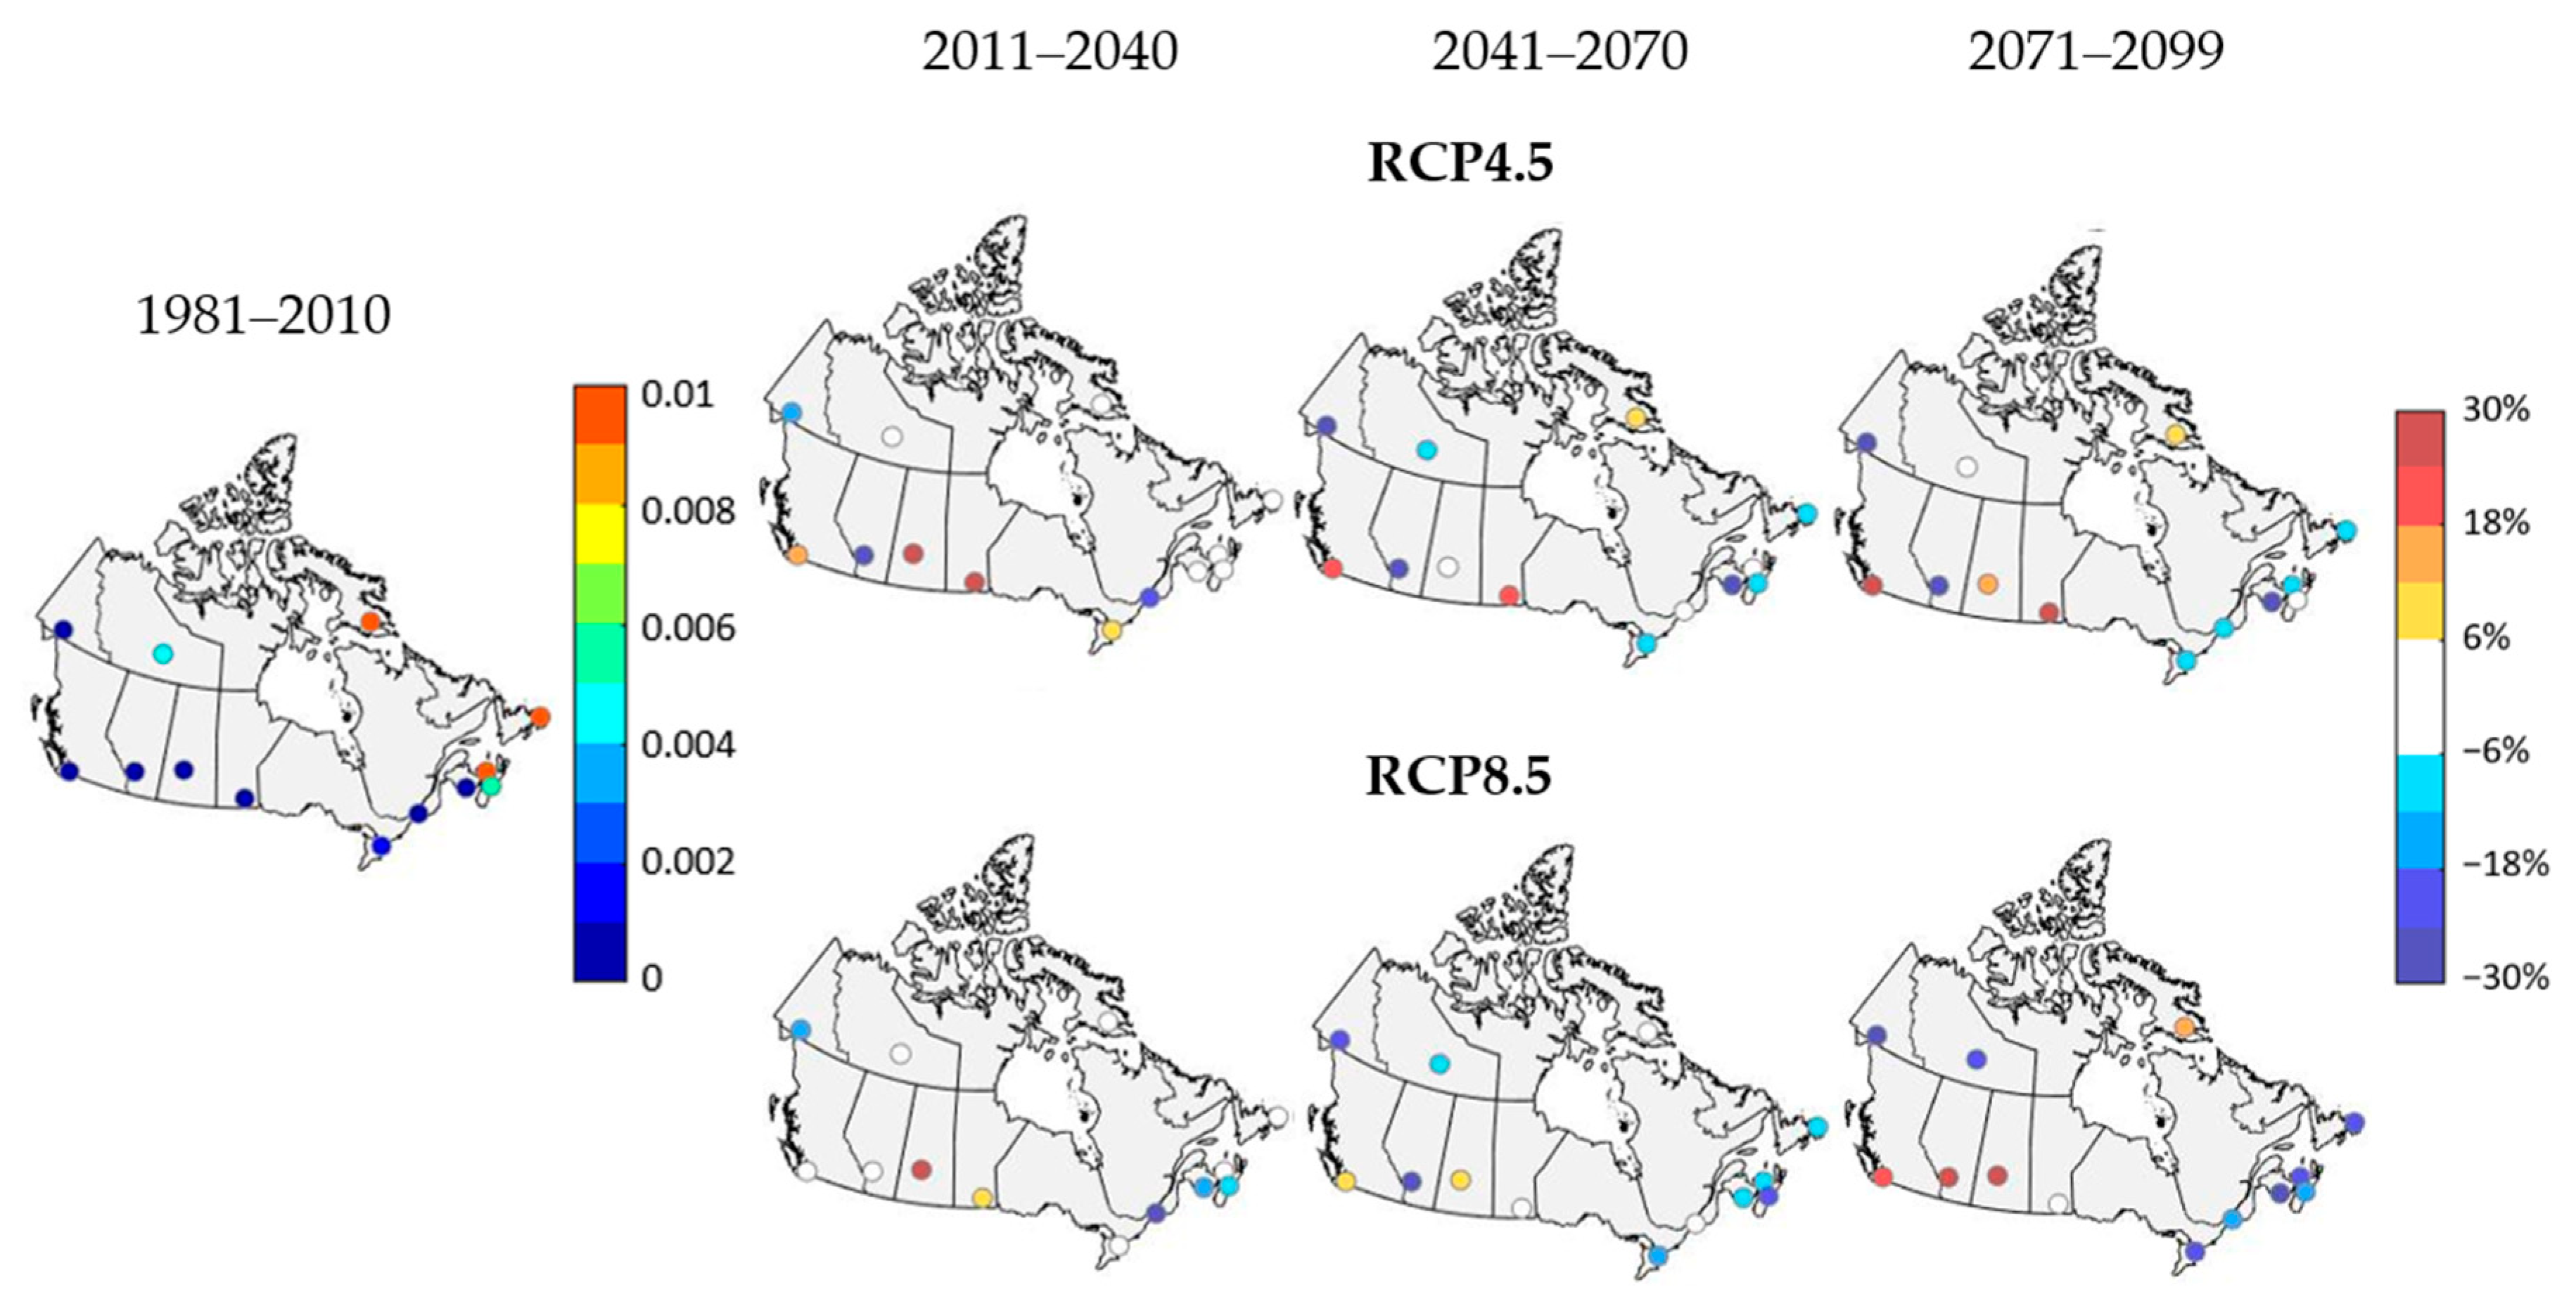
4.2.2. Crosswind and Tailwind
5. Discussion and Conclusions
Author Contributions
Funding
Acknowledgments
Conflicts of Interest
References
- Field, C.B.; Barros, V.; Stocker, T.F.; Qin, D.; Dokken, D.J.; Ebi, K.L.; Mastrandrea, M.D.; Mach, K.J.; Plattner, G.-K.; Allen, S.K.; et al. (Eds.) IPCC Managing the Risks of Extreme Events and Disasters to Advance Climate Change Adaptation: A Special Report of Working Groups I and II of the Intergovernmental Panel on Climate Change; Cambridge University Press: New York, NY, USA, 2012; p. 582. [Google Scholar]
- Oster, C.V.; Strong, J.S.; Zorn, K. Why Airplanes Crash: Causes of Accidents Worldwide. In Proceedings of the 51st Annual Transportation Research Forum, Arlington, VA, USA, 11–13 March 2010. [Google Scholar]
- Bureau of Transportation Statistics. Weather’s Share of Delay as Percent of Total Delay-Minutes, by Year; United States Department of Transportation: Washington, DC, USA, 2019.
- FAA. Pilot’s Handbook of Aeronautical Knowledge; U.S. Department of Transportation, Federal Aviation Administration: Washington, DC, USA, 2008; p. 471.
- Bellasio, R. Analysis of wind data for airport runway design. J. Airl. Airpt. Manag. 2014, 4. [Google Scholar] [CrossRef]
- Coffel, E.; Horton, R. Climate change and the impact of extreme temperatures on aviation. Weather Clim. Soc. 2014, 7, 94–102. [Google Scholar] [CrossRef]
- Coffel, E.D.; Thompson, T.R.; Horton, R.M. The impacts of rising temperatures on aircraft takeoff performance. Clim. Chang. 2017, 144, 381–388. [Google Scholar] [CrossRef]
- Zhou, Y.; Zhang, N.; Li, C.; Liu, Y.; Huang, P. Decreased takeoff performance of aircraft due to climate change. Clim. Chang. 2018, 151, 463–472. [Google Scholar] [CrossRef]
- Zhou, T.; Ren, L.; Liu, H.; Lu, J. Impact of 1.5 °C and 2.0 °C global warming on aircraft takeoff performance in China. Sci. Bull. 2018, 63, 700–707. [Google Scholar] [CrossRef]
- Gratton, G.; Padhra, A.; Rapsomanikis, S.; Williams, P.D. The impacts of climate change on Greek airports. Clim. Chang. 2020. [Google Scholar] [CrossRef]
- Williams, P.D. Transatlantic flight times and climate change. Environ. Res. Lett. 2016, 11, 024008. [Google Scholar] [CrossRef]
- Williams, P.D. Increased light, moderate, and severe clear-air turbulence in response to climate change. Adv. Atmos. Sci. 2017, 34, 576–586. [Google Scholar] [CrossRef]
- Lee, S.H.; Williams, P.D.; Frame, T.H.A. Increased shear in the North Atlantic upper-level jet stream over the past four decades. Nature 2019, 572, 639–642. [Google Scholar] [CrossRef]
- Williams, P.D.; Joshi, M.M. Intensification of winter transatlantic aviation turbulence in response to climate change. Nat. Clim. Chang. 2013, 3, 644. [Google Scholar] [CrossRef]
- Irvine, E.A.; Shine, K.P.; Stringer, M.A. What are the implications of climate change for trans-Atlantic aircraft routing and flight time? Transp. Res. Part D Transp. Environ. 2016, 47, 44–53. [Google Scholar] [CrossRef]
- Bush, E.; Lemmen, D.S. (Eds.) Canada’s Changing Climate Report; Government of Canada: Ottawa, ON, Canada, 2019; p. 444.
- Zhang, X.; Vincent, L.A.; Hogg, W.D.; Niitsoo, A. Temperature and precipitation trends in Canada during the 20th century. Atmos. Ocean 2000, 38, 395–429. [Google Scholar] [CrossRef]
- Jeong, D.I.; Sushama, L.; Diro, G.T.; Khaliq, M.N.; Beltrami, H.; Caya, D. Projected changes to high temperature events for Canada based on a regional climate model ensemble. Clim. Dyn. 2016, 46, 3163–3180. [Google Scholar] [CrossRef]
- Jeong, D.I.; Sushama, L. Projected changes to extreme wind and snow environmental loads for buildings and infrastructure across Canada. Sustain. Cities Soc. 2018, 36, 225–236. [Google Scholar] [CrossRef]
- Côté, J.; Desmarais, J.-G.; Gravel, S.; Méthot, A.; Patoine, A.; Roch, M.; Staniforth, A. The Operational CMC–MRB Global Environmental Multiscale (GEM) Model. Part II: Results. Mon. Weather Rev. 1998, 126, 1397–1418. [Google Scholar] [CrossRef]
- Yeh, K.-S.; Côté, J.; Gravel, S.; Méthot, A.; Patoine, A.; Roch, M.; Staniforth, A. The CMC–MRB Global Environmental Multiscale (GEM) Model. Part III: Nonhydrostatic Formulation. Mon. Weather Rev. 2002, 130, 339–356. [Google Scholar] [CrossRef]
- Laprise, R. The Euler Equations of Motion with Hydrostatic Pressure as an Independent Variable. Mon. Weather Rev. 1992, 120, 197–207. [Google Scholar] [CrossRef]
- Kain, J.S.; Fritsch, J.M. The role of the convective “trigger function” in numerical forecasts of mesoscale convective systems. Meteorol. Atmos. Phys. 1992, 49, 93–106. [Google Scholar] [CrossRef]
- Bélair, S.; Mailhot, J.; Girard, C.; Vaillancourt, P. Boundary Layer and Shallow Cumulus Clouds in a Medium-Range Forecast of a Large-Scale Weather System. Mon. Weather Rev. 2005, 133, 1938–1960. [Google Scholar] [CrossRef]
- Sundqvist, H.; Berge, E.; Kristjánsson, J.E. Condensation and Cloud Parameterization Studies with a Mesoscale Numerical Weather Prediction Model. Mon. Weather Rev. 1989, 117, 1641–1657. [Google Scholar] [CrossRef]
- Li, J.; Barker, H.W. A Radiation Algorithm with Correlated-k Distribution. Part I: Local Thermal Equilibrium. J. Atmos. Sci. 2005, 62, 286–309. [Google Scholar] [CrossRef]
- Benoit, R.; Côté, J.; Mailhot, J. Inclusion of a TKE Boundary Layer Parameterization in the Canadian Regional Finite-Element Model. Mon. Weather Rev. 1989, 117, 1726–1750. [Google Scholar] [CrossRef]
- Delage, Y. Parameterising sub-grid scale vertical transport in atmospheric models under statically stable conditions. Bound. Layer Meteorol. 1997, 82, 23–48. [Google Scholar] [CrossRef]
- Zadra, A.; McTaggart-Cowan, R.; Roch, M. Recent Changes to the Orographic Blocking; Seminar Presentation; RPN: Dorval, QC, Canada, 30 March 2012. [Google Scholar]
- Verseghy, D. CLASS–The Canadian Land Surface Scheme (Version 3.4), Technical Documentation (Version 1.1); Climate Research Division, Science and Technology Branch, Environment Canada: Downsview, ON, Canada, 2009; p. 180.
- Martynov, A.; Laprise, R.; Sushama, L.; Winger, K.; Šeparović, L.; Dugas, B. Reanalysis-driven climate simulation over CORDEX North America domain using the Canadian Regional Climate Model, version 5: Model performance evaluation. Clim. Dyn. 2013, 41, 2973–3005. [Google Scholar] [CrossRef]
- Diro, T.G.; Sushama, L. Simulating canadian arctic climate at convection-permitting resolution. Atmosphere 2019, 10, 430. [Google Scholar] [CrossRef]
- Dee, D.P.; Uppala, S.M.; Simmons, A.J.; Berrisford, P.; Poli, P.; Kobayashi, S.; Andrae, U.; Balmaseda, M.A.; Balsamo, G.; Bauer, P.; et al. The ERA-Interim reanalysis: Configuration and performance of the data assimilation system. Q. J. R. Meteorol. Soc. 2011, 137, 553–597. [Google Scholar] [CrossRef]
- Arora, V.K.; Scinocca, J.F.; Boer, G.J.; Christian, J.R.; Denman, K.L.; Flato, G.M.; Kharin, V.V.; Lee, W.G.; Merryfield, W.J. Carbon emission limits required to satisfy future representative concentration pathways of greenhouse gases. Geophys. Res. Lett. 2011, 38. [Google Scholar] [CrossRef]
- Mekis, E.; Donaldson, N.; Reid, J.; Zucconi, A.; Hoover, J.; Li, Q.; Nitu, R.; Melo, S. An Overview of Surface-Based Precipitation Observations at Environment and Climate Change Canada. Atmos. Ocean 2018, 56, 71–95. [Google Scholar] [CrossRef]
- Hersbach, H.; Dee, D. ERA5 reanalysis is in production. ECMWF Newsl. 2016, 147, 5–6. [Google Scholar]
- Wan, H.; Wang, X.L.; Swail, V.R. Homogenization and Trend Analysis of Canadian Near-Surface Wind Speeds. J. Clim. 2010, 23, 1209–1225. [Google Scholar] [CrossRef]
- Statistics Canada. Table 23-10-0023-01 Itinerant Movements, by Aircraft Maximum Take-Off Weight, Airports with NAV CANADA Towers, Annual; Statistics Canada: Ottawa, ON, Canada, 2020. [CrossRef]
- Boeing. 737 Airplane Characteristics for Airport Planning; Boeing Commercial Airplanes: Seattle, WA, USA, 2013; p. 682. [Google Scholar]
- Boeing. 787 Airplane Characteristics for Airport Planning; Boeing Commercial Airplanes: Seattle, WA, USA, 2018; p. 180. [Google Scholar]
- FAA. Runway Length Requirements for Airport Design (Advisory Circular 150/5325-4B); U.S. Department of Transportation, Federal Aviation Administration: Washington, DC, USA, 2005; p. 38.
- Es, G.W.H.V.; Karwal, A.K. Safety aspects of tailwind operations. In Proceedings of the Flight Safety Foundation Annual European Aviation Safety Seminar, Amsterdam, The Netherlands, 12–14 March 2001. [Google Scholar]
- ICAO. Annex 14 to the Convention on International Civil Aviation Aerodromes, 8th ed.; International Civil Aviation Organization: Montréal, QC, Canada, 2018; Volume Areodrome Design and Operations; p. 354. [Google Scholar]
- FAA. National Safety and Operational Criteria for Runway Use Programs Document Information; U.S. Department of Transportation, Federal Aviation Administration: Washington, DC, USA, 1981; p. 8.
- Teufel, B.; Sushama, L.; Huziy, O.; Diro, G.T.; Jeong, D.I.; Winger, K.; Garnaud, C.; de Elia, R.; Zwiers, F.W.; Matthews, H.D.; et al. Investigation of the mechanisms leading to the 2017 Montreal flood. Clim. Dyn. 2019, 52, 4193–4206. [Google Scholar] [CrossRef]
- Wieringa, J. Representativeness of Wind Observations at Airports. Bull. Am. Meteorol. Soc. 1980, 61, 962–971. [Google Scholar] [CrossRef]
- Azorin-Molina, C.; Asin, J.; McVicar, T.R.; Minola, L.; Lopez-Moreno, J.I.; Vicente-Serrano, S.M.; Chen, D. Evaluating anemometer drift: A statistical approach to correct biases in wind speed measurement. Atmos. Res. 2018, 203, 175–188. [Google Scholar] [CrossRef]


| IATA Code | Location | Elevation (ft) | Longest Runway (ft) | Crosswind Runway (ft) |
|---|---|---|---|---|
| YXY | Whitehorse | 2317 | 9500 | 1798 |
| YVR | Vancouver | 13 | 11,500 | 7300 |
| YYC | Calgary | 3606 | 14,000 | 8000 |
| YZF | Yellowknife | 675 | 7500 | 5000 |
| YXE | Saskatoon | 1654 | 8300 | 6200 |
| YWG | Winnipeg | 783 | 11,000 | 8700 |
| YFB | Iqaluit | 110 | 8605 | - |
| YYZ | Toronto | 569 | 11,050 | 10,775 |
| YUL | Montréal | 118 | 11,000 | 7000 |
| YFC | Fredericton | 67 | 8005 | 6000 |
| YYG | Charlottetown | 159 | 7000 | 5000 |
| YHZ | Halifax | 447 | 10,500 | 7700 |
| YYT | St. John’s | 46 | 8502 | 5028 |
| IATA | Maximum Takeoff Weight | |||||
|---|---|---|---|---|---|---|
| 18,000 kg and under | 18,001 to 90,000 kg | 90,001 kg and over | ||||
| Movements | Percentage | Movements | Percentage | Movements | Percentage | |
| YYZ | 59,521 | 13% | 334,764 | 74% | 61,047 | 13% |
| YVR | 107,623 | 33% | 181,317 | 56% | 35,263 | 11% |
| YUL | 42,303 | 19% | 162,062 | 71% | 22,967 | 10% |
| YYC | 54,523 | 23% | 174,879 | 72% | 11,975 | 5% |
| YWG | 47,535 | 43% | 56,711 | 51% | 6297 | 6% |
| YHZ | 24,839 | 32% | 50,277 | 64% | 3707 | 5% |
| YYT | 19,756 | 46% | 22,447 | 52% | 934 | 2% |
| YXE | 37,626 | 59% | 25,171 | 40% | 607 | 1% |
| YFC | 51,361 | 90% | 5780 | 10% | 22 | 0% |
| YZF | 24,460 | 55% | 19,704 | 45% | 14 | 0% |
| YXY | 14,466 | 73% | 5251 | 27% | 41 | 0% |
| IATA | Category 1 (°C) | Category 2 (°C) | Category 3 (°C) |
|---|---|---|---|
| YYZ | 30 | 45 | 43.3 |
| YVR | 30 | 45 | 43.3 |
| YUL | 30 | 45 | 43.3 |
| YYC | - | 23 | 29 |
| YHZ | - | 45 | 43.3 |
| YWG | - | 40 | 43.3 |
| YXE | - | 26 | 43.3 |
| YXY | - | 26 | 38 |
| YZF | - | 30 | 37.8 |
| YFB | - | 35 | 43.3 |
| YFC | - | 30 | 40.5 |
| YYT | - | 30 | 43.3 |
| YYG | - | N/A | 34.4 |
© 2020 by the authors. Licensee MDPI, Basel, Switzerland. This article is an open access article distributed under the terms and conditions of the Creative Commons Attribution (CC BY) license (http://creativecommons.org/licenses/by/4.0/).
Share and Cite
Zhao, Y.; Sushama, L. Aircraft Takeoff Performance in a Changing Climate for Canadian Airports. Atmosphere 2020, 11, 418. https://doi.org/10.3390/atmos11040418
Zhao Y, Sushama L. Aircraft Takeoff Performance in a Changing Climate for Canadian Airports. Atmosphere. 2020; 11(4):418. https://doi.org/10.3390/atmos11040418
Chicago/Turabian StyleZhao, Yijie, and Laxmi Sushama. 2020. "Aircraft Takeoff Performance in a Changing Climate for Canadian Airports" Atmosphere 11, no. 4: 418. https://doi.org/10.3390/atmos11040418
APA StyleZhao, Y., & Sushama, L. (2020). Aircraft Takeoff Performance in a Changing Climate for Canadian Airports. Atmosphere, 11(4), 418. https://doi.org/10.3390/atmos11040418