Abstract
Cheatgrass (Bromus Tectorum) is a highly invasive species in the Great Basin of the Western USA that is increasing the frequency and intensity of wildland fires. Though cheatgrass plays a significant role in the fire ecology of the Great Basin, very little is known about its combustion emissions. The fresh smoke from 16 open laboratory burns of cheatgrass was analyzed using real-time measurements and filter analysis. We presented measured intensive optical properties of the emitted smoke, including absorption Ångström exponent (AAE), scattering Ångström exponent (SAE), single scattering albedo (SSA), and other combustion properties, such as modified combustion efficiency (MCE) and fuel-based emission factors (EFs). In addition, we gave a detailed chemical analysis of polar organic species in cheatgrass combustion emissions. We presented EFs that showed a large variation between fuels and demonstrated that analysis of combustion emissions for specific fuels was important for studying and modeling the chemistry of biomass-burning emissions.
1. Introduction
Cheatgrass (Bromus Tectorum) is an invasive grass that has extensive ecological impacts [1] and is rapidly spreading through the sagebrush ecosystem of the Great Basin [1] that covers most of Nevada, much of Utah, and smaller portions of Oregon, California, Idaho, and Wyoming, USA. This invasion results in new uncertainties for wildland fire emissions in the Great Basin. Specifically, the emission factors (EFs) and the properties of aerosols emitted from sagebrush combustion have been characterized [2], but emissions from cheatgrass combustion have not. Furthermore, cheatgrass is increasing the frequency and magnitude of rangeland fires ten-fold [3] by creating higher fuel loads and higher vegetative coverage in areas where shrubs and desert grasses were once separated by open areas of soil. Regions, where spatial cheatgrass coverage reaches more than 15%, are more than twice as likely to experience a wildfire compared to regions where the cheatgrass coverage is minimal [1]. The increased fine fuel accumulation also increases the likelihood of the destruction of native plants during wildland fire events [4]. Cheatgrass is rapidly invading much of the Great Basin, causing additional carbon emissions [5] through increased fire frequency in rangelands [6].
Our study of cheatgrass combustion emissions was conducted with cheatgrass harvested from a site near Reno, Nevada, USA, that had most recently burned during the Hawken fire of June 2016. This fire burned through native vegetation, destroying most of the sagebrush and other chaparral plants, which allowed for increased cheatgrass growth in this area. On average, the Reno area (NV, USA) receives 300 days of sunshine and ~20 cm of precipitation per year and is considered a cold desert climate. The relatively low-altitude areas around Reno, NV are dominated by a sagebrush ecosystem, where cheatgrass is most invasive and persistent. Cheatgrass burns primarily in the flaming combustion phase, where a diffusion flame burns emitted volatiles, in the process, emitting large amounts of black carbon (BC) particles and trace gases into the atmosphere [2,7]. Flaming combustion is the most common combustion phase for biomass burning of low-fuel-moisture foliage and grasses. This combustion phase also emits most BC mass and thereby increases the light absorption of smoke [8]. Flaming combustion is generally followed by smoldering combustion, where low-temperature oxidation of solid fuels takes place, emitting large amounts of carbon monoxide (CO) and organic carbon (OC) [9]. Here, we measured the modified combustion efficiency (MCE) that is the molar ratio of CO2 to CO + CO2 emissions and is commonly used to determine whether a burn is dominated by flaming or smoldering combustion. Selimovic et al. [10] found that the ratio of brown carbon (BrC) absorption to black carbon (BC) absorption was highly dependent on the MCE. BrC is a class of OC that strongly absorbs light in the ultra-violet (UV) and shortwave visible wavelengths [11].
Particle optical properties are important for understanding their effects on regional direct radiative forcing [12]. Optical properties reported include single scattering albedo (SSA), an intensive aerosol property that equals the ratio of scattering to extinction coefficient and is essential for the determination of aerosol direct radiative forcing [13,14,15], absorption Ångström exponents (AAE), and scattering Ångström exponents (SAE), characterizing the wavelength dependence of aerosol absorption and scattering coefficients, respectively [16]. The Ångström exponent is greatly affected by the particle size distribution and is sensitive to the effective particle radius [17,18]. Ångström exponents depend on several other parameters, including wavelength [11,18], chemical composition, and structure of the particle [18]. The SSA is determined by the size distribution, morphology, and complex refractive index of the particles [19,20].
Wildland fires are known to impact human health through impacts on air quality [21,22] and contribute to haze episodes [22] and air pollution [23]. Fine particles are known to cause many negative health effects, including respiratory diseases [24,25,26], and are known to increase global mortality rates [27]. Combustion emissions of organic compounds, such as polycyclic aromatic hydrocarbons (PAHs) and their derivatives [28,29,30], can cause adverse health effects, such as lung cancer [31,32,33].
There are some obstacles that arise from a combustion experiment in a laboratory as opposed to sampling smoke from a wildland fire event. Atmospheric plumes of smoke undergo atmospheric oxidation that will not occur in a laboratory without aging in an oxidation flow reactor or smog chamber [34]. Combustion emissions are also greatly dependent on burn characteristics and will vary between burns in the chamber and in the field. In this study, we solely studied cheatgrass combustion emissions, thereby removing complications from interactions between fuel types [35].
A wide variety of emissions accompany cheatgrass combustion. Emissions of PAHs from the open combustion of cheatgrass have previously been reported by Samburova et al. [36], but otherwise, very little is known about cheatgrass combustion emissions.
We also measured the smoke’s optical properties and fuel-based emission factors (EFs) of particulate matter (PM), CO, CO2, and 82 organic species, which, to the best of our knowledge, have not been reported previously.
2. Experiments and Data Analysis
2.1. Setup and Instrumentation
Cheatgrass fuel samples were collected from 39°28’58” N, 119°51’57” W at 1517 m of elevation. This site is located in the southwestern foothills of the Reno, NV, USA valley inside the 2016 Hawken fire burn scar. Vegetation samples were collected using clean latex gloves and clean Zip-lock bags to reduce contamination. The laboratory biomass burning experiments took place in the biomass combustion facility of the Desert Research Institute (DRI). A detailed description of a close replicate of this chamber has been given by Tian et al. [37]. The facility consists of a sealable chamber (1.8 m × 1.8 m × 2.0 m) with aluminum walls that taper at the roof, funneling smoke into an exhaust pipe. Combustion exhaust is sampled from this pipe through copper tubes and is delivered to instrumentation for real-time and filter sampling. The chamber flow rate is controlled by a fan in the exhaust pipe and by a gate controlling the air inlet, located underneath the chamber.
For our combustion experiments, the chamber fan was turned off, and the gate was fully closed, allowing combustion emissions to accumulate within the chamber, similar to the methods used by McMeeking et al. [2]. Cheatgrass was piled on top of a continuously weighed ceramic disk in the chamber to monitor fuel mass loss during the burning period. The copper pipe connecting the chamber to the real-time sampling instruments was disconnected, and the fuel was ignited with a butane lighter. The chamber was allowed to fill with smoke for five minutes, resulting in a uniform aerosol distribution in the chamber. At the end of this five-minute time period, the chamber was reconnected to the sampling line. The real-time instruments characterized smoke from the chamber until smoke concentrations dropped to near-ambient levels.
The instruments used to characterize EFs and aerosol optical and physical properties included a CO (Thermo 48i carbon monoxide analyzer, Waltham, MA, USA) analyzer, a CO2 (Li-7000 CO2/H2O Analyzer, Lincoln, NE, USA) analyzer, a three-wavelength photoacoustic spectrometer (PASS-3, Droplet Measurement Technologies, Boulder, CO, USA), and a Scanning Mobility Particle Sizer 3080 classifier (SMPS, TSI, Shoreview, MN, USA).
The PASS-3 utilizes the photoacoustic method to measure aerosol light absorption coefficients (babs Mm−1) and integrated nephelometry to measure light scattering coefficients (bscat Mm−1) at the wavelengths of 405 nm, 532 nm, and 781 nm simultaneously [11,38,39]. Particle mass concentrations and size distributions were measured with a scanning mobility particle sizer (SMPS), which consisted of a TSI 3081 differential mobility analyzer (DMA) and TSI 3775-condensation particle counter (CPC). These real-time instruments sampled an input flow of 1 L per minute each, reporting results every second, except for the SMPS, which was operated at a 10:1 sheath to sample flow ratio, with a 0.3 L per minute sample flow rate. This SMPS setup measured particles with the size in the range of 8–580 nm. The CO2 and CO monitors were checked for accuracy prior to each burn, and calibration was performed, if needed.
2.2. Fuel Characteristics
Cheatgrass is a plant native to Eurasia that has aggressively invaded North America with an ability to produce over 10,000 plants per square mile [40]. Cheatgrass grows quickly in spring before native species develop and dies by early summer, thereby contributing large amounts of dry, fine fuels that are easily ignitable. The plant is recognizable by the drooping seed heads, as seen in Figure 1, and fine hairs covering the plant. The young plants are green, turning to purple, during further maturation, their color fades into a pale golden brown as the plant dies. The typical height of the plant is between 7.5 and 75 cm, and its seeds are covered with bristle-like hairs that allow for dispersion by wind and animal fur. Fuels and ashes from each cheatgrass burn were analyzed for total carbon, nitrogen, hydrogen, and oxygen mass content at DRI’s Environmental Analysis Facility (EAF) using a Thermo Scientific™ EA 1112 Series CHNS-O Analyzer (Waltham, MA, USA) for total carbon, nitrogen, hydrogen, and oxygen ratios [41,42].
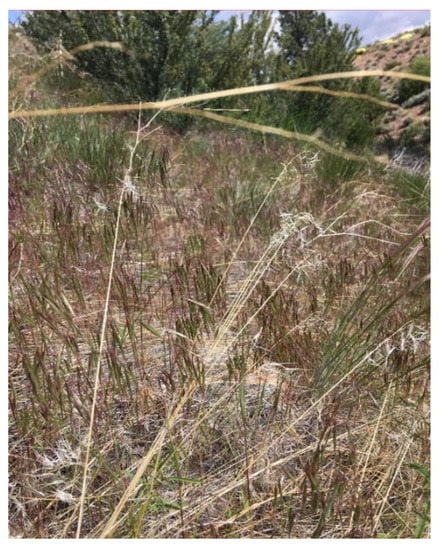
Figure 1.
Cheatgrass in Reno (NV, USA) is turning from green to purple as the plants mature.
2.3. Modified Combustion Efficiency
The modified combustion efficiency (MCE) approximates the fraction of emitted carbon that is in the form of CO2 and depends on the fuel and its combustion phase (e.g., flaming vs. smoldering). MCE is calculated as the ratio of molar CO2 and CO excess concentrations as
where ΔCO2 and ΔCO are the excess molar concentrations of CO2 and CO, respectively, with the background concentrations subtracted. Here, the subtracted background concentrations were the mean of the concentrations measured in the chamber over the 2 min prior to the burn’s ignition. The MCE is a qualitative indicator of the amount of flaming and smoldering combustion present since, in a typical burn, there is a mixture of both combustion phases. In flaming combustion, the reaction oxidizes C, N, H, and S and turns them into common greenhouse gases like CO2, H2O, NOx, and SO2 [43] with an MCE of about 0.99 for pure flaming combustion [44]. The MCE of smoldering combustion ranges from 0.65 to 0.85 [44]. MCE is also related to the amounts of OC and BC emitted; flaming combustion emits more BC, while smoldering combustion emits more OC and its light-absorbing component BrC.
2.4. Fuel-Based Emission Factors
The fuel-based emission factor (EFn) for a species, n, is the ratio of the mass of species n emitted ( to dry fuel mass burned ( as
where the ratio of masses emitted (i.e., Mn/MC) and Mfuel is determined as the ratio of total carbon mass emitted (MC) and the carbon mass fraction of the dry fuel (CMFfuel) as
where the total carbon mass emitted (MC) is well approximated by the sum of carbon mass in carbon dioxide () and carbon monoxide () as
In this equation, we neglected the ash carbon content, which is typically less than 5% of the fuel mass [7]. EFs for particulate matter (EFPM) were calculated from the SMPS particles per unit volume of air using a density value of 1.2 g/cc to determine the mass concentration. CO2 and CO mass concentrations were measured with the LiCor and Thermo analyzers. Background concentrations were subtracted, and the excess of CO2 and CO mass concentrations were used to calculate the EFs.
2.5. Intensive Optical Aerosol Properties
2.5.1. Single Scattering Albedo
Aerosol absorption (babs) and scattering (bsca) coefficients were measured with the PASS-3 and used to calculate the single scattering albedo (SSA). SSA is an intensive aerosol property that equals the ratio of scattering coefficient to total extinction coefficient as
where is the light-scattering coefficient (Mm−1), is the light-absorption coefficient (Mm−1), and is the wavelength of light [19,20]. The term , the extinction coefficient, is the sum of the scattering and absorption coefficients. The aerosol SSA is the most important intensive particle parameter, controlling aerosol direct radiative forcing [19,20], and it influences radiative fluxes and heating in the atmosphere. Mostly absorbing aerosols (SSA ≈ 0) have a heating effect, while mostly scattering ones (SSA ≈ 1) have a cooling effect [45,46].
2.5.2. Absorption Ångström Exponent
The absorption Ångström exponent (AAE) is an intensive aerosol optical property, describing the wavelength dependence of the aerosol absorption coefficient. AAE has also been used quantitatively to separate brown carbon (BrC) absorption from black carbon (BC) absorption. BC is highly absorbing in the visible and near-visible spectrum, while BrC is highly absorbing in the near-UV and blue-spectrum. AAE is the negative slope of the absorption coefficient as a function of wavelength on a log-log plot and can be written as
where is the wavelength-dependent absorption coefficient [18]. AAE is calculated from two coefficients measured by the PASS-3 at two different wavelengths. AAE values much larger than one are typical for aerosols emitted by smoldering biomass burning and are caused by BrC absorption. AAE values of about 1 typically indicate absorption from BC [46].
2.5.3. Scattering Ångström Exponent
The scattering Ångström exponent (SAE) characterizes the wavelength dependence of aerosol light scattering. SAE depends mostly on the dominant size mode of a mixture of aerosols, and, combined with the AAE, it can give insight into the nature of the aerosol [47]. The value of the SAE, which is the negative slope of the scattering coefficient as a function of wavelength on a log/log plot, is
where is the wavelength-dependent scattering coefficient.
2.6. Analysis of Organic Species
Sampling and analysis of organic emissions collected on XAD (gas-phase organic compounds) resin (Sigma-Aldrich, St. Louis, MO, USA) and filter samplers (particle-phase organic compounds) are described in detail by Sengupta et al. [48] and Samburova et al. [36]. Briefly, combustion emissions were collected on 100-mm diameter Teflon-impregnated glass fiber (TIGF) filters (Fiber Film T60A20, Pall Life Sciences, Ann Arbor, MI, USA), followed by a XAD-4 cartridge at a flow rate of 0.11 m3/min. Immediately after sampling, the samples were stored at –20 °C. Prior to extraction, collected filters and XAD cartridges were spiked with deuterated internal standards of polar organic compounds [48]. The samples were extracted with an accelerated solvent extractor (ASE) system (DIONEX, ASE-300, Salt Lake City, UT, USA) at the following conditions: temperature: 80 °C, solvents: dichloromethane (150 mL) followed by acetone (150 mL), extraction cell pressure: 10.3 MPa, extraction time: 15 min. After the extraction, the samples were pre-concentrated to 1 mL using a rotary evaporator at 35 °C and a gentle vacuum. The extracts were derivatized with N,O-Bis(trimethylsilyl)trifluoroacetamide (BSTFA) agent, as described elsewhere [49], and analyzed with gas chromatography-mass spectrometry (GC-MS) method [48] using Varian CP-3800 GC equipped with a CP-8400 autosampler and interfaced to a Varian 4000 Ion Trap Mass Spectrometer (Varian, Inc. Walnut Creek, CA, USA). Injections were performed into a 30 m length, 5% phenylmethylsilicone fused silica capillary column (DB-5MS, Agilent Technologies, Palo Alto, CA, USA) with an integrated deactivated guard column (length: 10 m).
3. Results and Discussion
3.1. Modified Combustion Efficiency
Once ignited, cheatgrass burned rapidly, and the flaming combustion phase dominated carbon emission. Cheatgrass MCE ranged from 0.93 to 0.98, confirming that cheatgrass combustion was dominated by flaming combustion, as is typical for dry, fine fuels. The MCEs reported for cheatgrass in Table 1 were the average emission ratios for the first 5 min of 12 burns. Cheatgrass ignited quickly, and initially, flaming-dominated combustion caused a rapid increase in CO2 concentrations, followed by an increase in CO concentrations, indicating a transition to more smoldering combustion. The MCE averaged over 12 burns was calculated to be 0.96 ± 0.03, with ±0.03 being the standard deviation for the 12 burns. This MCE measured for cheatgrass was in reasonable agreement with previously published MCE values for a prescribed grassland burn [50] for Dambo grass and Montana grass open laboratory combustion [7] and for savanna and grasslands fires [51,52], as shown in Table 1.

Table 1.
Cheatgrass modified combustion efficiency (MCE) is shown with previously reported MCE values for a prescribed grassland fire [50], open laboratory combustion of Dambo and Montana grass [7], and savanna and grasslands fires [51,52].
3.2. Single Scattering Albedo (SSA)
The SSA, shown in Figure 2, was the average ratio of the scattering coefficient to the extinction coefficient for the first 5 min of 12 burns. At the 405 nm wavelength, the SSA of cheatgrass combustion aerosols was the lowest (0.81–0.85); here, a significant part of the extinction (i.e., 15%–19%) was due to absorption. The SSA at 405 nm had the least variation between the burns; it was indicative of the absorption of BrC, which was highly absorbing in the UV. The SSA at the 532 nm and 781 nm wavelengths indicated some absorption from BC, which is highly absorbing in the visible spectrum [53]. Lewis et al. [11] reported the optical properties of rice straw, a fuel similar to cheatgrass. The SSA for the 405 nm wavelength for cheatgrass was reported here to be 0.83 ± (0.02), showing similar absorption as the rice straw with an SSA of 0.88 with an error of 5% reported by Lewis et al. [11].
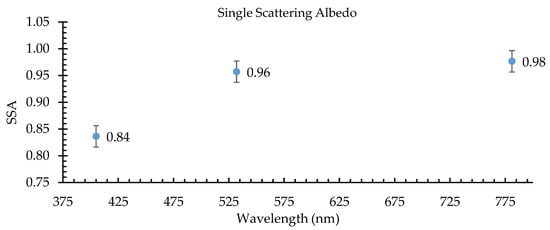
Figure 2.
SSA (single scattering albedo) of cheatgrass combustion aerosols at 405 nm, 532 nm, and 781 nm. Error bars represent the standard error.
3.3. Absorption and Scattering Ångström Exponents
The AAE is approximately one (~1) for BC but can be larger than two for a mix of BC and BrC [18]. The SAE can be as small as zero for very large particles in the geometric optics regime and as large as four for very small particles in the Rayleigh regime [54]. Here, Ångström exponents were calculated for pairs of 405/532 nm, 405/781 nm, and 532/781 nm wavelengths. The differences between 405/532 and 405/781 AAE were driven by BrC that absorbed mostly in the UV and blue and by BC absorption that was less dependent on wavelength (AAEBC ~ 1). SAE gives information on particle sizes, indicating coarse-mode particles for small values (i.e., <1.5) and fine-mode particles for larger SAE values (i.e., >1.5) [55]. The SAE values observed for cheatgrass (i.e., 0.5–3.5, Table 2) indicated a mixture of fine, medium, and coarse mode particles. The AAE values (405/781 nm) observed for cheatgrass (i.e., 2.04–6.91, Table 2) indicated moderate to strong dominance of BrC absorption.
Table 2.
The optical properties absorption Ångström exponent (AAE), the scattering Ångström exponent (SAE), and the single scattering albedo (SSA) of cheatgrass combustion emissions are listed, along with the optical properties (i.e., AAE, SAE, and SSA) of rice straw combustion emissions, as reported by Lewis et al. [11].
3.4. Comparison of Intensive Optical Aerosol Properties for Grass Combustion Emissions
While there has been little work on SSA, AAE, and SAE of aerosols emitted from the open combustion of grasses, Lewis et al. [11] reported SSA, AAE, and SAE values for aerosols emitted from the combustion of rice straw (Table 2). The AAE 405/781 nm range observed by us for cheatgrass emissions (2.0–6.9) for the wavelength pair of 405/870 included the AAE 405/870 nm value of 2.8 that was reported by Lewis et al. [11] for rice straw emissions. Their SAE (405/532 nm) values (1.7–2.2) measured for rice straw combustion emissions were also well within the wider range (0.5–3.5) observed by us for cheatgrass combustion emissions. SSA measured by them at 405 nm for rice straw combustion emissions was 0.88, while our result for 405 nm SSA of cheatgrass combustion emissions was quite similar (i.e., SSA = 0.083 ± 0.02). Figure 3 is a plot of the SAE 405/532 nm values found in this study along with rice straw SAE 405/532 nm derived from Figure 4 of Lewis et al. [11], showing that the rice straw SAE was generally higher, more variable, and without a monotonic decrease when compared to our measurements for cheatgrass, likely due to combustion conditions and fuel properties. At the beginning of our cheatgrass burn (see Figure 3), the SAE was quite high (i.e., 2.26), indicating the predominant emission of fine mode particles. As the burn evolved, the SAE of cheatgrass decreased, indicating an increase of particle sizes with a shift to a mixture of fine and medium mode particles.
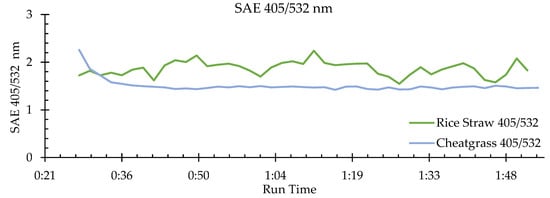
Figure 3.
This plot is a comparison of the scattering Ångström exponents (SAE) for the 405/532 nm wavelength pair between one individual burn from the present study’s cheatgrass results with one individual burn of rice straw results determined from Lewis et al. [11]. Cheatgrass combustion emissions have a SAE range of 1.4–2.3 and rice straw combustion emissions have a SAE range of 1.7–2.2.
3.5. Cheatgrass Emission Factors and Comparison to Previously Reported EFs for Grasses
Our averaged cheatgrass EFs are listed in Table 3, along with values that had previously been reported for similar types of fuel. This table includes previously reported EFs [50] for prescribed grassland burns and results from Chen et al. [7], who performed open-combustion in the laboratory similar to the methods used here. Results listed in Table 3 showed that our cheatgrass CO2 EFs were close (within 1%) to the average of the other CO2 EFs included and within 10% of the extremes of the other CO2 EFs included. As expected, CO emission factors reported had a much larger range (i.e., 20 to 69 g/kg) than those for CO2 with our cheatgrass CO EFs near (within ~6%) the average of the other CO EFs included. The larger range was likely due to different prevalence of flaming and smoldering combustion for the different fuels and burns. Our PM EFs for cheatgrass were significantly higher (i.e., 18 ± 4 g/kg) than the other PM EFs included that ranged from 2.2 ± 1.1 to 10 ± 1, indicating a cheatgrass PM EF about 2.5 times larger than the average of the other three PM EFs included in Table 3.
Table 3.
EFs (emission factors) for cheatgrass are listed with previously reported data from a prescribed grassland fire [51,52], open combustion of Dambo and Montana grass [7], and savanna and grassland fire [51,52]. Our reported cheatgrass EFs of CO and CO2 showed good agreement (within 1% and ~6%) with reported EFs of other fuels, while the cheatgrass particulate matter (PM) EFs were ~2.5 times larger than the average of the other three EFs.
3.6. EFs of Organic Species
Gas- and particle-phase organic compounds analyzed in cheatgrass combustion samples were assigned to nine groups based on their chemical structures (Table S1): alkanoic acids (20), alkenoic acids (5), benzoic acids and substituted benzoic acids (9), alkanedioic acids (15), aromatic dicarboxylic acids (2), anhydrous sugars (2), methoxyphenols (10), methoxy acids (9), and resin acids (7). The EFs are shown in Table 4, together with the EFs reported in previous studies [48,56,57]. For the particle phase, the highest EF among the identified compounds was for anhydrous sugars (98.3 ± 24.6 µg/g), followed by those for alkanedioic acids (26.2 ± 6.6 µg/g) and alkanoic acids (8.1 ± 2.0 µg/g). Like our study, Yatavelli [57] and Iinuma’s [56] studies showed that anhydrous sugars (sum of mannosan and levoglucosan) were the major contributors to the analyzed polar organic compound mass for ponderosa pine needle and savanna grass combustion emissions. In the gas phase, the highest EF was observed for methoxyphenols (51.7 ± 12.9 µg/g), which also dominated gas-phase EFs from ponderosa pine needles and eucalyptus combustion (Table 4). Overall, the total EFs for the gas- and particle-phase organic compounds were 25 and 18 times lower for cheatgrass than those for ponderosa pine needles, and they were 6 and 12 times higher in comparison with the eucalyptus’s gas and particle-phase EFs. We were not able to compare the total EFs for each group with those of Iinuma et al.’s [56] because the total number of analyzed polar organic compounds in each group was different from that in the present study and in Sengupta’s and Yatavelli’s research [48,57].
Table 4.
EFs for gas- and particle-phase organic compounds in combustion emissions from cheatgrass, ponderosa pine needles, and savanna grass (units: μg g−1 of consumed fuel); BDL—below detection limit; the standard deviations represent analytical uncertainty.
The EFs of 82 individual polar organic compounds in gas and particle-particle phases of cheatgrass combustion emissions are listed in Table S1. The most abundant compound among all the analyzed organic species in the particle-phase emissions was levoglucosan, with an EF of 95.0 ± 24.9 µg/g (Figure 4a). For savanna grass combustion [56], it was approximately five times higher (500 µg/g). Suberic and palmitic acids were the second and third largest contributors to the organic mass of the cheatgrass particle-phase emissions, with EFs of 22.9 ± 5.7 and 5.0 ± 1.2 µg/g, respectively. As expected, the top three contributors to the particle-phase organic emissions (Figure 4a) were different from those for the gas phase emissions (Figure 4b). The EFs for gas-phase guaiacol (17.6 ± 4.4 µg/g), syringol (14.8 ± 3.7 µg/g), and 4-methyl guaiacol (5.0 ± 1.2 µg/g) were highest among all the volatile and semi-volatile organic species collected on the XAD cartridges and analyzed by us (Table S1). Yatavelli et al. [57] and Sengupta et al. [48] also reported guaiacol and 4-methyl guaiacol as major contributors to the gas-phase organic emissions.
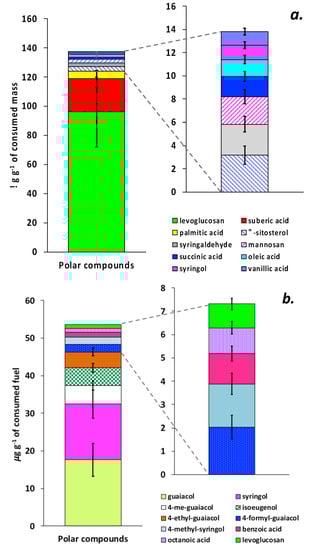
Figure 4.
EFs (emission factors) for the ten most abundant polar organic compounds detected (a) in particle-phase and (b) semi-volatile gas-phase (XAD resin) combustion emissions from cheatgrass. The standard deviations represent analytical uncertainty.
4. Conclusions
Ecosystems in the Great Basin of the Western USA are greatly affected by the invasion of cheatgrass. While cheatgrass has comparatively low available fuel mass for wildland fires compared to the fuel available to burn in conifer or boreal forests, wildland fires in the Great Basin will continue to become more frequent and intense, while cheatgrass continues to invade the Great Basin.
The open laboratory combustion of cheatgrass was observed to be mostly complete combustion with high MCE. Optical properties reported here (i.e., SAE, AAE, and SSA) for cheatgrass combustion emissions were similar to those previously reported for rice straw combustion emissions. Optical absorption by particulate emissions was dominated by BrC with only little absorption by BC. Comparison between our fuel-based emission factors (i.e., EFCO2, EFCO, and EFPM) and other previously reported EFs for grassland and savannah fires showed fuel-based mass emission factors for cheatgrass fires, compared with those for other grasses and grasslands, were comparable for CO2 (within 10%), with larger discrepancies (up to ~ 50%) for CO and even larger ones (up to a factor of 10) for PM EFs. While our cheatgrass CO2 and CO emission factors were near the average of those for comparable fuels included in this comparison, cheatgrass PM emission factors were significantly (~2.5 times) higher.
The EFs of 82 gas- and particle-phase organic compounds in the combustion emissions of cheatgrass were analyzed and compared with those of ponderosa pine needles, eucalyptus, and the savanna grass emissions. Levoglucosan was the largest contributor of all the analyzed organic species, which agreed with results for the analyses of combustion emissions from other wildland fuels. Compared with the EFs for ponderosa pine needles and eucalyptus, the total (sum of gas and particle-phase emissions) combustion EFs for cheatgrass were significantly lower (~23 times) than those for ponderosa pine needle, while they were approximately seven times higher than those for eucalyptus. This large variation of the total EFs for the organic species between fuels demonstrated that analysis of combustion emissions for specific fuels is very important, especially for studying and modeling the chemistry of biomass-burning emissions.
Supplementary Materials
The following are available online at https://www.mdpi.com/2073-4433/11/4/406/s1, Table S1: EFs of polar organic compounds in particle- (filter) and gas- (XAD) phase emissions from cheatgrass; units: µg/g of consumed fuel; the standard deviation was on average 25% and it represents analytical uncertainty.
Author Contributions
Conceptualization, M.R., V.S., and H.M.; methodology, M.R. and V.S.; writing—original draft preparation, M.R. and V.S.; writing—review and editing, all authors; supervision- H.M. and W.P.A.; project administration, H.M.; funding acquisition, M.R., H.M., V.S., and A.K. All authors have read and agreed to the published version of the manuscript.
Funding
This project was funded in part by NASA ROSES Grant Number NNX15AI48G and NSF Grant Number AGS-1544425 with additional support for M.R. from the UNR/DRI Atmospheric Sciences Graduate Program, the DRI Foundation Innovative Research Program, and a 2019 Student Scholarship from the International Association of Wildland Fire (IAWF). The research reported in this paper was also partly supported by the National Institute of Environmental Health Sciences of the National Institutes of Health under award number R01ES029528. The content is solely the responsibility of the authors and does not necessarily represent the official views of the National Institutes of Health.
Acknowledgments
Fuel analysis was performed by the Environmental Analysis Facility (EAF) of the Desert Research Institute. It is a pleasure to acknowledge Adam Watts for his advice and shared knowledge and J. Rennie for his assistance with field sample collection.
Conflicts of Interest
The authors declare no conflict of interest.
References
- Bradley, B.A.; Curtis, C.A.; Fusco, E.J.; Abatzoglou, J.T.; Balch, J.K.; Dadashi, S.; Tuanmu, M.N. Cheatgrass (Bromus tectorum) distribution in the intermountain Western United States and its relationship to fire frequency, seasonality, and ignitions. Biol. Invasions 2018, 20, 1493–1506. [Google Scholar] [CrossRef]
- McMeeking, G.R.; Kreidenweis, S.M.; Baker, S.; Carrico, C.M.; Chow, J.C.; Collett, J.L.; Hao, W.M.; Holden, A.S.; Kirchstetter, T.W.; Malm, W.C.; et al. Emissions of trace gases and aerosols during the open combustion of biomass in the laboratory. J. Geophys. Res. Atmos. 2009, 114, 20. [Google Scholar] [CrossRef]
- Bradley, B.A.; Houghtonw, R.A.; Mustard, J.F.; Hamburg, S.P. Invasive grass reduces aboveground carbon stocks in shrublands of the Western US. Glob. Chang. Biol. 2006, 12, 1815–1822. [Google Scholar] [CrossRef]
- Davies, K.W.; Nafus, A.M. Exotic annual grass invasion alters fuel amounts, continuity and moisture content. Int. J. Wildland Fire 2013, 22, 353–358. [Google Scholar] [CrossRef]
- Urbanski, S.P.; Reeves, M.C.; Corley, R.E.; Silverstein, R.P.; Hao, W.M. Contiguous United States wildland fire emission estimates during 2003–2015. Earth Syst. Sci. Data 2018, 10, 2241–2274. [Google Scholar] [CrossRef]
- Dantonio, C.M.; Vitousek, P.M. Biological Invasions by Exotic Grasses, the Grass Fire Cycle, and Global Change. Annu. Rev. Ecol. Syst. 1992, 23, 63–87. [Google Scholar] [CrossRef]
- Chen, L.W.A.; Moosmüller, H.; Arnott, W.P.; Chow, J.C.; Watson, J.G.; Susott, R.A.; Babbitt, R.E.; Wold, C.E.; Lincoln, E.N.; Hao, W.M. Emissions from laboratory combustion of wildland fuels: Emission factors and source profiles. Environ. Sci. Technol. 2007, 41, 4317–4325. [Google Scholar] [CrossRef]
- Satheesh, S.K.; Moorthy, K.K. Radiative effects of natural aerosols: A review. Atmos. Environ. 2005, 39, 2089–2110. [Google Scholar] [CrossRef]
- Rein, G.; Hurley, M.J. Smoldering Combustion. In SFPE Handbook of Fire Protection Engineering; Springer: New York, NY, USA, 2016; pp. 581–603. [Google Scholar]
- Selimovic, V.; Yokelson, R.J.; Warneke, C.; Roberts, J.M.; de Gouw, J.; Reardon, J.; Griffith, D.W.T. Aerosol optical properties and trace gas emissions by PAX and OP-FTIR for laboratory-simulated western US wildfires during FIREX. Atmos. Chem. Phys. 2018, 18, 2929–2948. [Google Scholar] [CrossRef]
- Lewis, K.; Arnott, W.P.; Moosmüller, H.; Wold, C.E. Strong spectral variation of biomass smoke light absorption and single scattering albedo observed with a novel dual-wavelength photoacoustic instrument. J. Geophys. Res. Atmos. 2008, 113, 14. [Google Scholar] [CrossRef]
- Reid, J.S.; Eck, T.F.; Christopher, S.A.; Koppmann, R.; Dubovik, O.; Eleuterio, D.P.; Holben, B.N.; Reid, E.A.; Zhang, J. A review of biomass burning emissions part III: Intensive optical properties of biomass burning particles. Atmos. Chem. Phys. 2005, 5, 827–849. [Google Scholar] [CrossRef]
- Chylek, P.; Wong, J. Effect of Absorbing Aerosols on Global Radiation Budget. Geophys. Res. Lett. 1995, 22, 929–931. [Google Scholar] [CrossRef]
- Hassan, T.; Moosmüller, H.; Chung, C.E. Coefficients of an analytical aerosol forcing equation determined with a Monte-Carlo radiation model. J. Quant. Spectrosc. Radiat. 2015, 164, 129–136. [Google Scholar] [CrossRef]
- Moosmüller, H.; Ogren, J.A. Parameterization of the Aerosol Upscatter Fraction as Function of the Backscatter Fraction and Their Relationships to the Asymmetry Parameter for Radiative Transfer Calculations. Atmosphere 2017, 8, 12. [Google Scholar] [CrossRef]
- Moosmüller, H.; Chakrabarty, R.K. Technical Note: Simple analytical relationships between Angstrom coefficients of aerosol extinction, scattering, absorption, and single scattering albedo. Atmos. Chem. Phys. 2011, 11, 10677–10680. [Google Scholar] [CrossRef]
- Schuster, G.L.; Dubovik, O.; Holben, B.N. Angstrom exponent and bimodal aerosol size distributions. J. Geophys. Res. Atmos. 2006, 111, 14. [Google Scholar] [CrossRef]
- Moosmüller, H.; Chakrabarty, R.K.; Ehlers, K.M.; Arnott, W.P. Absorption Angstrom coefficient, brown carbon, and aerosols: Basic concepts, bulk matter, and spherical particles. Atmos. Chem. Phys. 2011, 11, 1217–1225. [Google Scholar] [CrossRef]
- Moosmüller, H.; Sorensen, C.M. Small and large particle limits of single scattering albedo for homogeneous, spherical particles. J. Quant. Spectrosc. Radiat. 2018, 204, 250–255. [Google Scholar] [CrossRef]
- Moosmüller, H.; Sorensen, C.M. Single scattering albedo of homogeneous, spherical particles in the transition regime. J. Quant. Spectrosc. Radiat. 2018, 219, 333–338. [Google Scholar] [CrossRef]
- Zhou, Y.; Xing, X.F.; Lang, J.L.; Chen, D.S.; Cheng, S.Y.; Wei, L.; Wei, X.; Liu, C. A comprehensive biomass burning emission inventory with high spatial and temporal resolution in China. Atmos. Chem. Phys. 2017, 17, 2839–2864. [Google Scholar] [CrossRef]
- Chen, J.M.; Li, C.L.; Ristovski, Z.; Milic, A.; Gu, Y.T.; Islam, M.S.; Wang, S.X.; Hao, J.M.; Zhang, H.F.; He, C.R.; et al. A review of biomass burning: Emissions and impacts on air quality, health and climate in China. Sci. Total. Environ. 2017, 579, 1000–1034. [Google Scholar] [CrossRef] [PubMed]
- Langmann, B.; Duncan, B.; Textor, C.; Trentmann, J.; van der Werf, G.R. Vegetation fire emissions and their impact on air pollution and climate. Atmos. Environ. 2009, 43, 107–116. [Google Scholar] [CrossRef]
- Reid, J.S.; Koppmann, R.; Eck, T.F.; Eleuterio, D.P. A review of biomass burning emissions part II: Intensive physical properties of biomass burning particles. Atmos. Chem. Phys. 2005, 5, 799–825. [Google Scholar] [CrossRef]
- Zhang, J.K.; Sun, Y.; Liu, Z.R.; Ji, D.S.; Hu, B.; Liu, Q.; Wang, Y.S. Characterization of submicron aerosols during a month of serious pollution in Beijing, 2013. Atmos. Chem. Phys. 2014, 14, 2887–2903. [Google Scholar] [CrossRef]
- Ma, Q.Y.; Huang, D.Y.; Zhang, H.J.; Wang, S.H.; Chen, X.F. Exposure to particulate matter 2.5 (PM2.5) induced macrophage-dependent inflammation, characterized by increased Th1/Th17 cytokine secretion and cytotoxicity. Int. Immunopharmacol. 2017, 50, 139–145. [Google Scholar] [CrossRef] [PubMed]
- Johnston, F.H.; Henderson, S.B.; Chen, Y.; Randerson, J.T.; Marlier, M.; DeFries, R.S.; Kinney, P.; Bowman, D.; Brauer, M. Estimated Global Mortality Attributable to Smoke from Landscape Fires. Environ. Health Persp. 2012, 120, 695–701. [Google Scholar] [CrossRef]
- Li, X.; Yang, Y.; Xu, X.; Xu, C.; Hong, J. Air pollution from polycyclic aromatic hydrocarbons generated by human activities and their health effects in China. J. Clean Prod. 2016, 112, 1360–1367. [Google Scholar] [CrossRef]
- Mandalakis, M.; Gustafsson, Ö.; Alsberg, T.; Egebäck, A.-L.; Reddy, C.M.; Xu, L.; Klanova, J.; Holoubek, I.; Stephanou, E.G. Contribution of biomass burning to atmospheric polycyclic aromatic hydrocarbons at three European background sites. Environ. Sci. Technol. 2005, 39, 2976–2982. [Google Scholar] [CrossRef]
- Galvao, M.F.D.; Alves, N.D.; Ferreira, P.A.; Caumo, S.; Vasconcellos, P.D.; Artaxo, P.; Hacon, S.D.; Roubicek, D.A.; de Medeiros, S.R.B. Biomass burning particles in the Brazilian Amazon region: Mutagenic effects of nitro and oxy-PAHs and assessment of health risks. Environ. Pollut. 2018, 233, 960–970. [Google Scholar] [CrossRef]
- Zhang, Y.; Tao, S.; Shen, H.; Ma, J. Inhalation exposure to ambient polycyclic aromatic hydrocarbons and lung cancer risk of Chinese population. Proc. Natl. Acad. Sci. USA 2009, 106, 21063–21067. [Google Scholar] [CrossRef]
- Wickramasinghe, A.P.; Karunaratne, D.; Sivakanesan, R. PM10-bound polycyclic aromatic hydrocarbons: Biological indicators, lung cancer risk of realistic receptors and ’source-exposure-effect relationship’ under different source scenarios. Chemosphere 2012, 87, 1381–1387. [Google Scholar] [CrossRef] [PubMed]
- Sarigiannis, D.A.; Karakitsios, S.P.; Zikopoulos, D.; Nikolaki, S.; Kermenidou, M. Lung cancer risk from PAHs emitted from biomass combustion. Environ. Res. 2015, 137, 147–156. [Google Scholar] [CrossRef] [PubMed]
- Bhattarai, C.; Samburova, V.; Sengupta, D.; Iaukea-Lum, M.; Watts, A.C.; Moosmuller, H.; Khlystov, A.Y. Physical and chemical characterization of aerosol in fresh and aged emissions from open combustion of biomass fuels. Aerosol. Sci. Technol. 2018, 52, 1266–1282. [Google Scholar] [CrossRef]
- Dhammapala, R.; Claiborn, C.; Simpson, C.; Jimenez, J. Emission factors from wheat and Kentucky bluegrass stubble burning: Comparison of field and simulated burn experiments. Atmos. Environ. 2007, 41, 1512–1520. [Google Scholar] [CrossRef]
- Samburova, V.; Connolly, J.; Gyawali, M.; Yatavelli, R.L.N.; Watts, A.C.; Chakrabarty, R.K.; Zielinska, B.; Moosmüller, H.; Khlystov, A. Polycyclic aromatic hydrocarbons in biomass-burning emissions and their contribution to light absorption and aerosol toxicity. Sci. Total Environ. 2016, 568, 391–401. [Google Scholar] [CrossRef]
- Tian, J.; Chow, J.C.; Cao, J.J.; Han, Y.; Ni, H.Y.; Chen, L.W.A.; Wang, X.L.; Huang, R.J.; Moosmüller, H.; Watson, J.G. A Biomass Combustion Chamber: Design, Evaluation, and a Case Study of Wheat Straw Combustion Emission Tests. Aerosol. Air Qual. Res. 2015, 15, 2104–2114. [Google Scholar] [CrossRef]
- Arnott, W.P.; Moosmüller, H.; Rogers, C.F.; Jin, T.F.; Bruch, R. Photoacoustic spectrometer for measuring light absorption by aerosol: Instrument description. Atmos. Environ. 1999, 33, 2845–2852. [Google Scholar] [CrossRef]
- Moosmüller, H.; Arnott, W.P.; Rogers, C.F. Methods for real-time, in situ measurement of aerosol light absorption. J. Air Waste Manag. 1997, 47, 157–166. [Google Scholar] [CrossRef]
- Beck, G. Cheatgrass and Wildfire. In Natural Resources Series, Fact Sheet No. 6.310; Colorado State Forest Service-Colorado State University: Fort Collins, CO, USA, 2012; p. 3. [Google Scholar]
- Watson, J.G.; Cao, J.J.; Chen, L.W.A.; Wang, Q.Y.; Tian, J.; Wang, X.L.; Gronstal, S.; Ho, S.S.H.; Watts, A.C.; Chow, J.C. Gaseous, PM2.5 mass, and speciated emission factors from laboratory chamber peat combustion. Atmos. Chem. Phys. 2019, 19, 14173–14193. [Google Scholar] [CrossRef]
- Patterson, R.K. Automated Pregl-Dumas technique for determining total carbon, hydrogen, and nitrogen in atmospheric aerosols. Anal. Chem. 1973, 45, 605–609. [Google Scholar] [CrossRef]
- Akagi, S.K.; Yokelson, R.J.; Wiedinmyer, C.; Alvarado, M.J.; Reid, J.S.; Karl, T.; Crounse, J.D.; Wennberg, P.O. Emission factors for open and domestic biomass burning for use in atmospheric models. Atmos. Chem. Phys. 2011, 11, 4039–4072. [Google Scholar] [CrossRef]
- Urbanski, S.P. Combustion efficiency and emission factors for wildfire-season fires in mixed conifer forests of the northern Rocky Mountains, US. Atmos. Chem. Phys. 2013, 13, 7241–7262. [Google Scholar] [CrossRef]
- Moosmüller, H.; Engelbrecht, J.P.; Skiba, M.; Frey, G.; Chakrabarty, R.K.; Arnott, W.P. Single scattering albedo of fine mineral dust aerosols controlled by iron concentration. J. Geophys. Res. Atmos. 2012, 117, 10. [Google Scholar] [CrossRef]
- Moosmüller, H.; Chakrabarty, R.K.; Arnott, W.P. Aerosol light absorption and its measurement: A review. J. Quant. Spectrosc. Radiat. 2009, 110, 844–878. [Google Scholar] [CrossRef]
- Pistone, K.; Redemann, J.; Doherty, S.; Zuidema, P.; Burton, S.; Cairns, B.; Cochrane, S.; Ferrare, R.; Flynn, C.; Freitag, S.; et al. Intercomparison of biomass burning aerosol optical properties from in situ and remote-sensing instruments in ORACLES-2016. Atmos. Chem. Phys. 2019, 19, 9181–9208. [Google Scholar] [CrossRef]
- Sengupta, D.; Samburova, V.; Bhattarai, C.; Watts, A.C.; Moosmüller, H.; Khlystov, A.Y. Polar semi-volatile organic compounds in biomass burning emissions and their chemical transformations during aging in an oxidation flow reactor, in review. Atmos. Chem. Phys. Discuss. 2020. [Google Scholar] [CrossRef]
- Rinehart, L.R.; Fujita, E.M.; Chow, J.C.; Magliano, K.; Zielinska, B. Spatial distribution of PM2.5 associated organic compounds in central California. Atmos. Environ. 2006, 40, 290–303. [Google Scholar] [CrossRef]
- Urbanski, S. Wildland fire emissions, carbon, and climate: Emission factors. Forest Ecol. Manag. 2014, 317, 51–60. [Google Scholar] [CrossRef]
- Andreae, M.O. Emission of trace gases and aerosols from biomass burning-an updated assessment. Atmos. Chem. Phys. 2019, 19, 8523–8546. [Google Scholar] [CrossRef]
- Christian, T.J.; Kleiss, B.; Yokelson, R.J.; Holzinger, R.; Crutzen, P.J.; Hao, W.M.; Saharjo, B.H.; Ward, D.E. Comprehensive laboratory measurements of biomass-burning emissions: 1. Emissions from Indonesian, African, and other fuels. J. Geophys. Res. Atmos. 2003, 108, 13. [Google Scholar] [CrossRef]
- Martinsson, J.; Eriksson, A.C.; Nielsen, I.E.; Malmborg, V.B.; Ahlberg, E.; Andersen, C.; Lindgren, R.; Nystrom, R.; Nordin, E.Z.; Brune, W.H.; et al. Impacts of Combustion Conditions and Photochemical Processing on the Light Absorption of Biomass Combustion Aerosol. Environ. Sci. Technol. 2015, 49, 14663–14671. [Google Scholar] [CrossRef] [PubMed]
- Bohren, C.F.; Huffman, D.R. Absorption and Scattering of Light by Small Particles; Wiley: New York, NY, USA, 1998; p. xiv, 530. [Google Scholar]
- Hopner, F.; Bender, F.A.M.; Ekman, A.M.L.; Andersson, A.; Gustafsson, O.; Leck, C. Investigation of Two Optical Methods for Aerosol-Type Classification Extended to a Northern Indian Ocean Site. J. Geophys. Res. Atmos. 2019, 124, 8743–8763. [Google Scholar] [CrossRef]
- Iinuma, Y.; Brueggemann, E.; Gnauk, T.; Mueller, K.; Andreae, M.O.; Helas, G.; Parmar, R.; Herrmann, H. Source characterization of biomass burning particles: The combustion of selected European conifers, African hardwood, savanna grass, and German and Indonesian peat. J. Geophys. Res. Atmos. 2007, 112. [Google Scholar] [CrossRef]
- Yatavelli, R.L.; Chen, L.-W.A.; Knue, J.; Samburova, V.; Gyawali, M.; Watts, A.C.; Chakrabarty, R.K.; Moosmüller, H.; Hodzic, A.; Wang, X. Emissions and Partitioning of Intermediate-Volatility and Semi-Volatile Polar Organic Compounds (I/SV-POCs) During Laboratory Combustion of Boreal and Sub-Tropical Peat. Aerosol. Sci. Eng. 2017, 1, 25–32. [Google Scholar] [CrossRef]
© 2020 by the authors. Licensee MDPI, Basel, Switzerland. This article is an open access article distributed under the terms and conditions of the Creative Commons Attribution (CC BY) license (http://creativecommons.org/licenses/by/4.0/).